Rexel SA · EURONEXT:RXL
Rexel SA — Q1 2014 Earnings Presentation
51 slides from Rexel SA's earnings presentation, Jul 17, 2014
Slide 1: Post-Q1 2014 Results Roadshow Presentation
POST-Q1 2014 RESULTS Roadshow presentation
Slide 2: Disclaimer
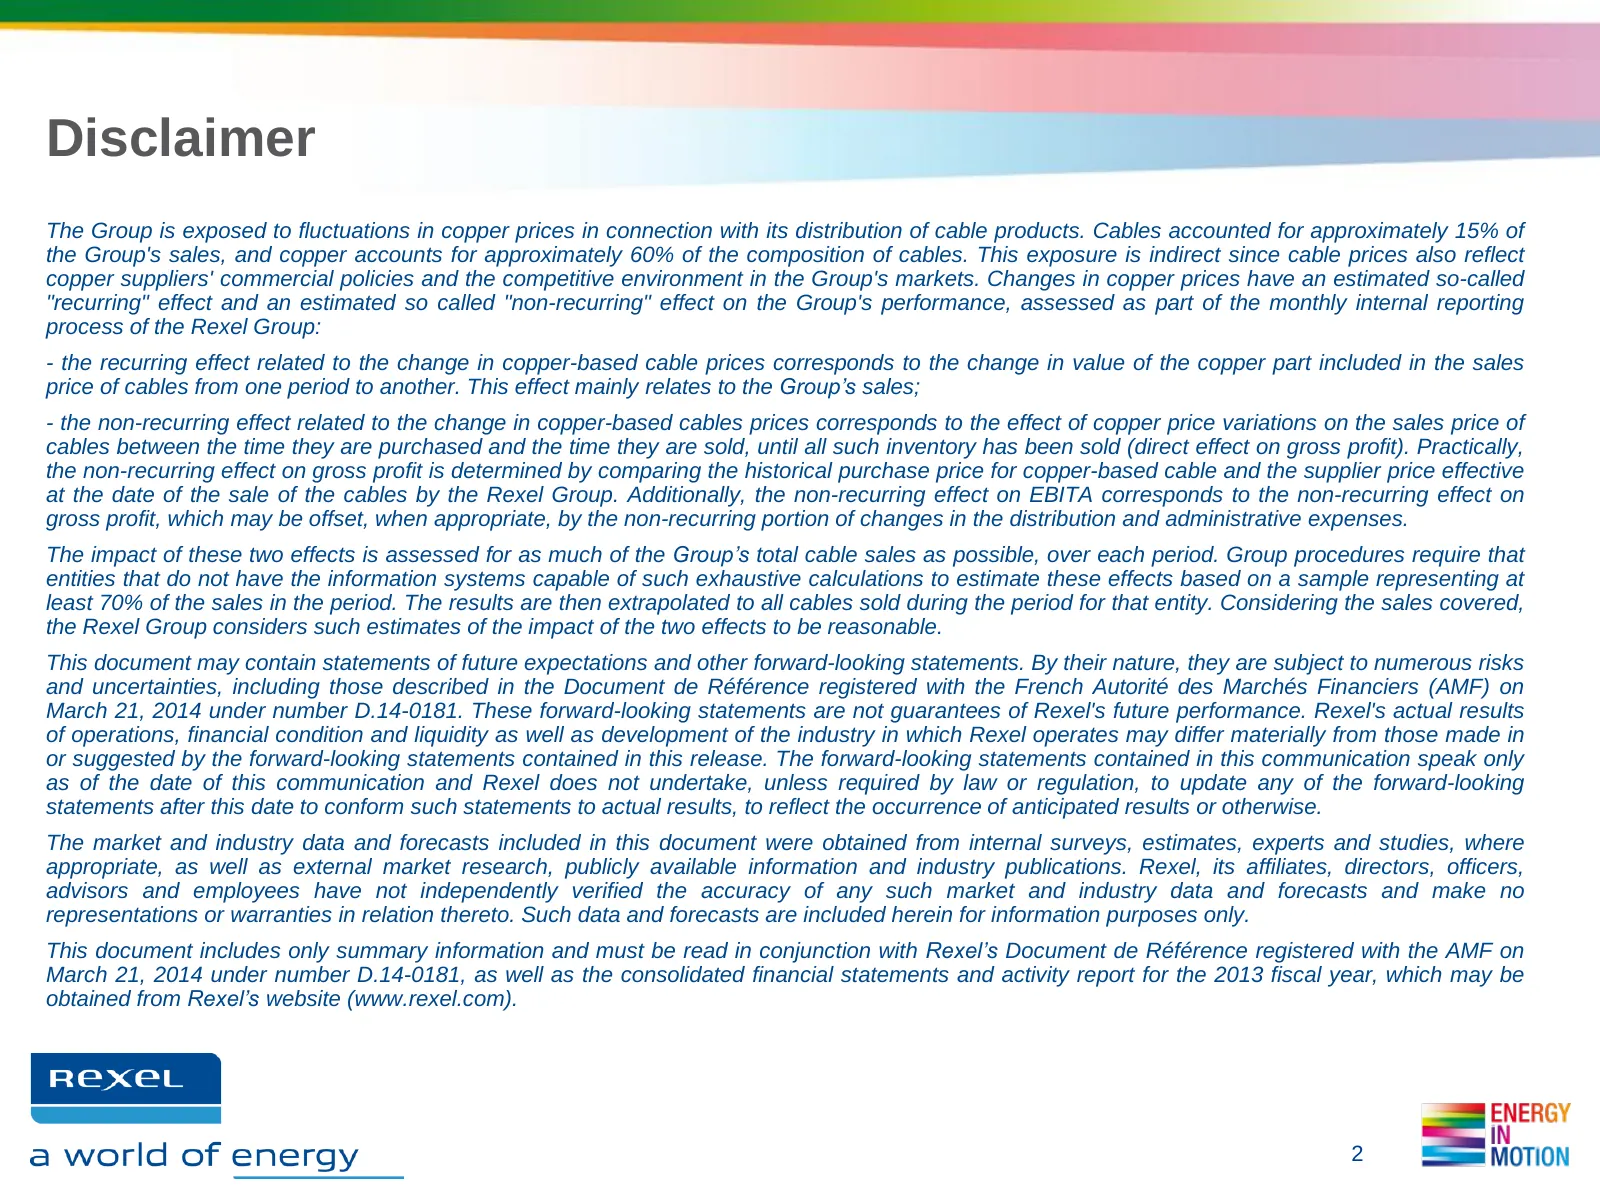
Disclaimer The Group is exposed to fluctuations in copper prices in connection with its distribution of cable products. Cables accounted for approximately 15% of the Group's sales, and copper accounts for approximately 60% of the composition of cables. This exposure is indirect since cable prices al
Slide 3: Company Overview
1 » COMPANY OVERVIEW Rexeu. as a world of energy ENERG) IN MOTION
Slide 4: Rexel plays a key role in the value chain
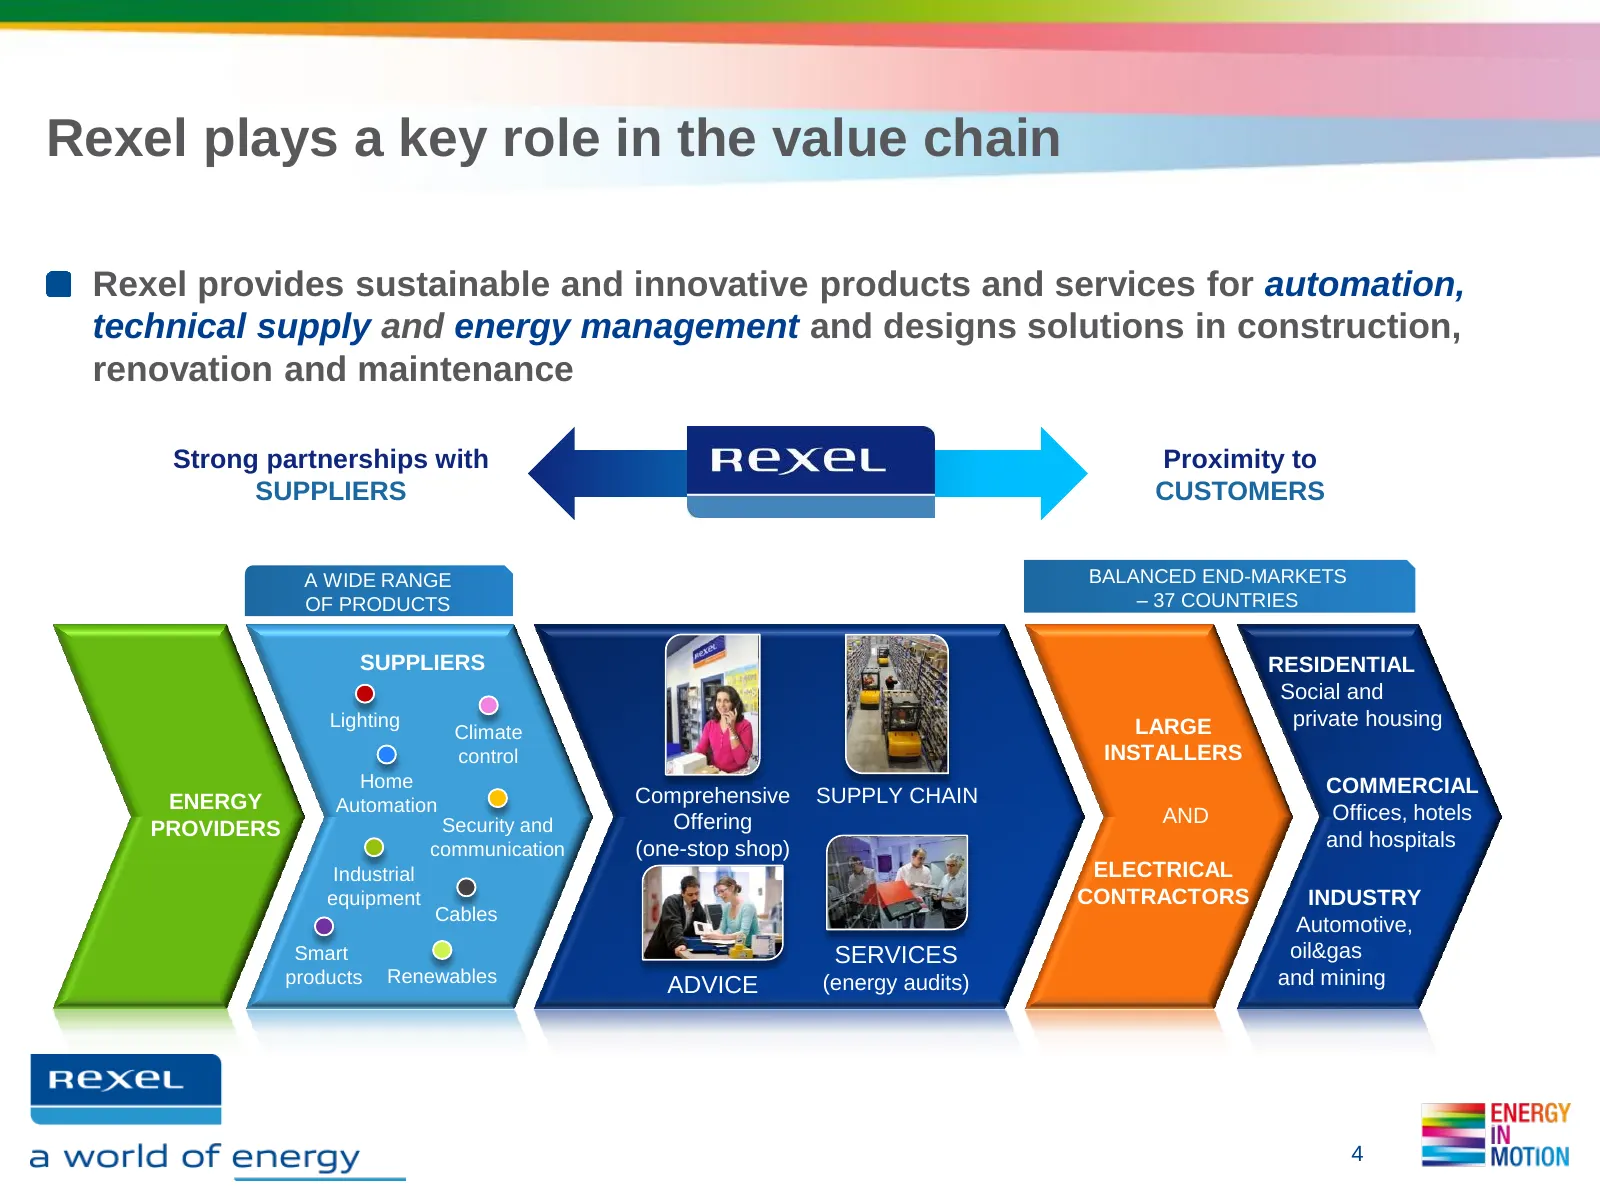
Rexel plays a key role in the value chain Rexel provides sustainable and innovative products and services for automation, technical supply and energy management and designs solutions in construction, renovation and maintenance Strong partnerships with Proximity to SUPPLIERS CUSTOMERS A WIDE RANGE BA
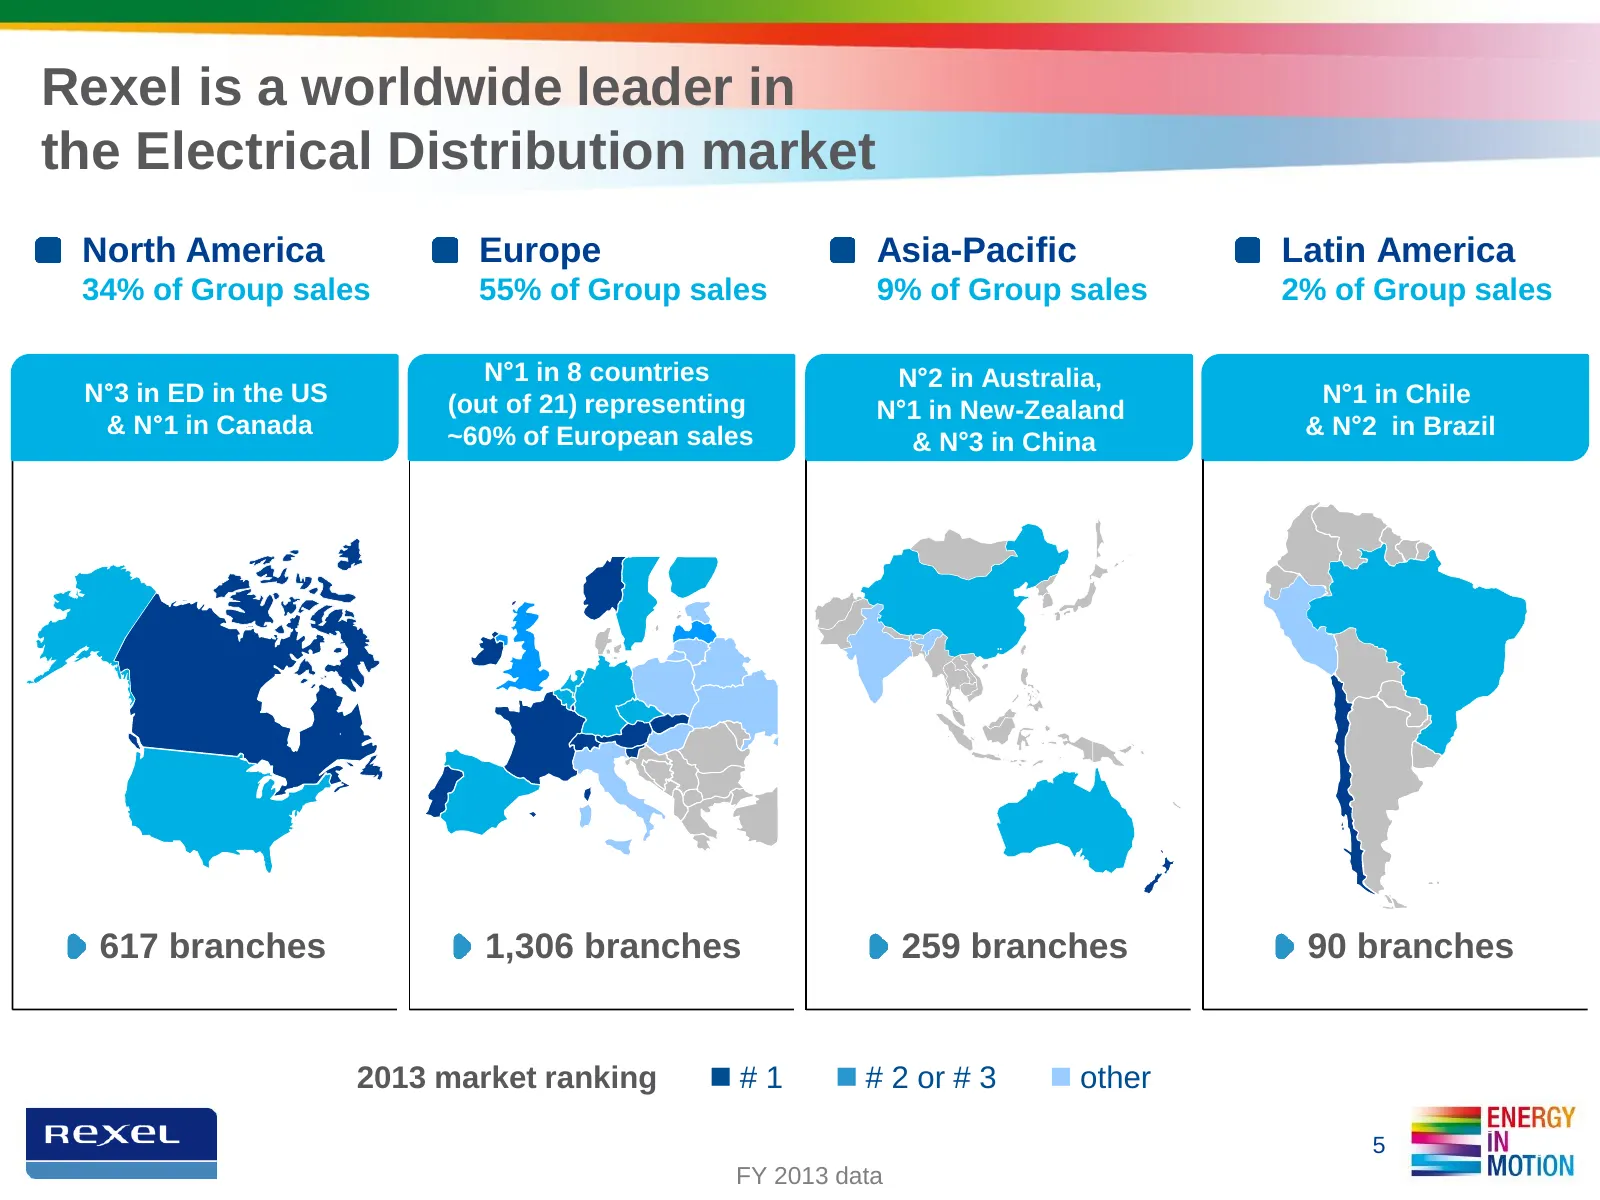
Slide 5: Rexel is a worldwide leader in the Electrical Distribution market
Rexel is a worldwide leader in the Electrical Distribution market North America Europe Asia-Pacific Latin America 34% of Group sales 55% of Group sales 9% of Group sales 2% of Group sales N°1 in 8 countries N°2 in Australia, N°3 in ED in the US (out of 21) representing N°1 in Chile N°1 in New-Zealan
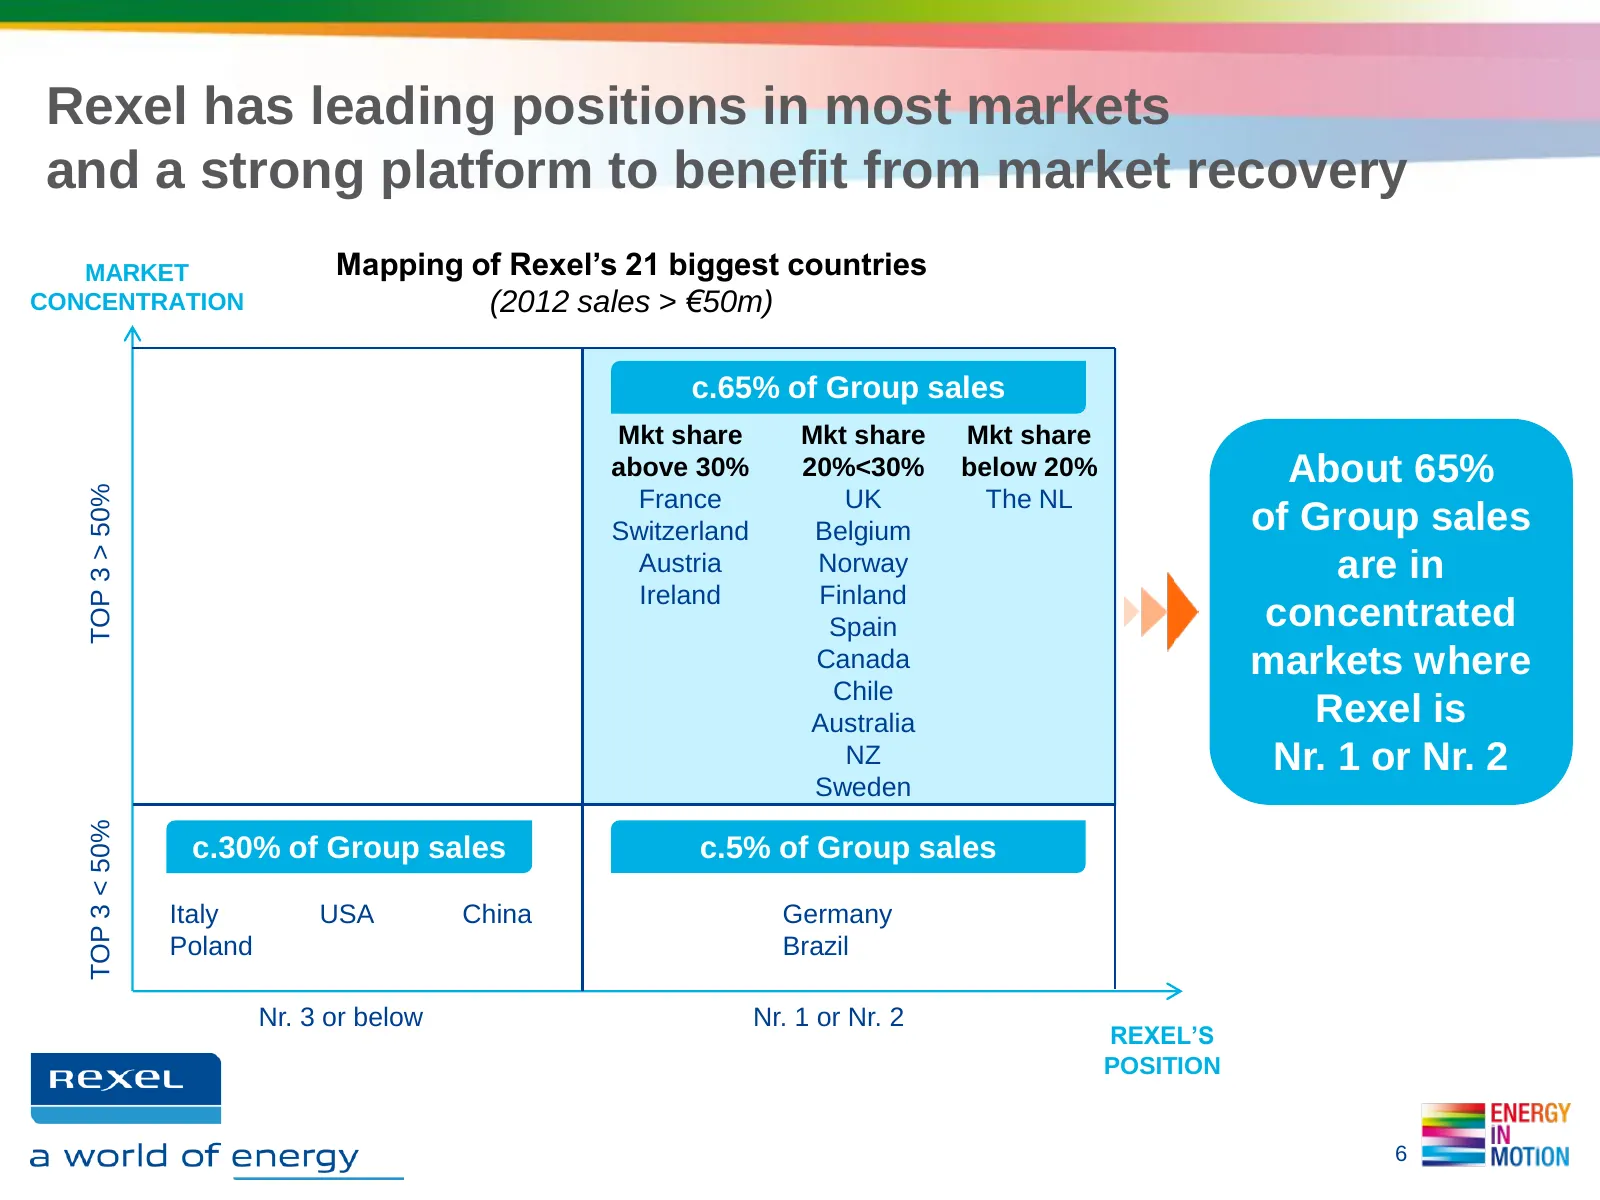
Slide 6: Rexel has leading positions in most markets
Rexel has leading positions in most markets and a strong platform to benefit from market recovery MARKET Mapping of Rexel’s 21 biggest countries CONCENTRATION (2012 sales > €50m) c.65% of Group sales Mkt share Mkt share Mkt share above 30% 20%<30% below 20% About 65% TOP 3 > 50% France UK The NL Swi
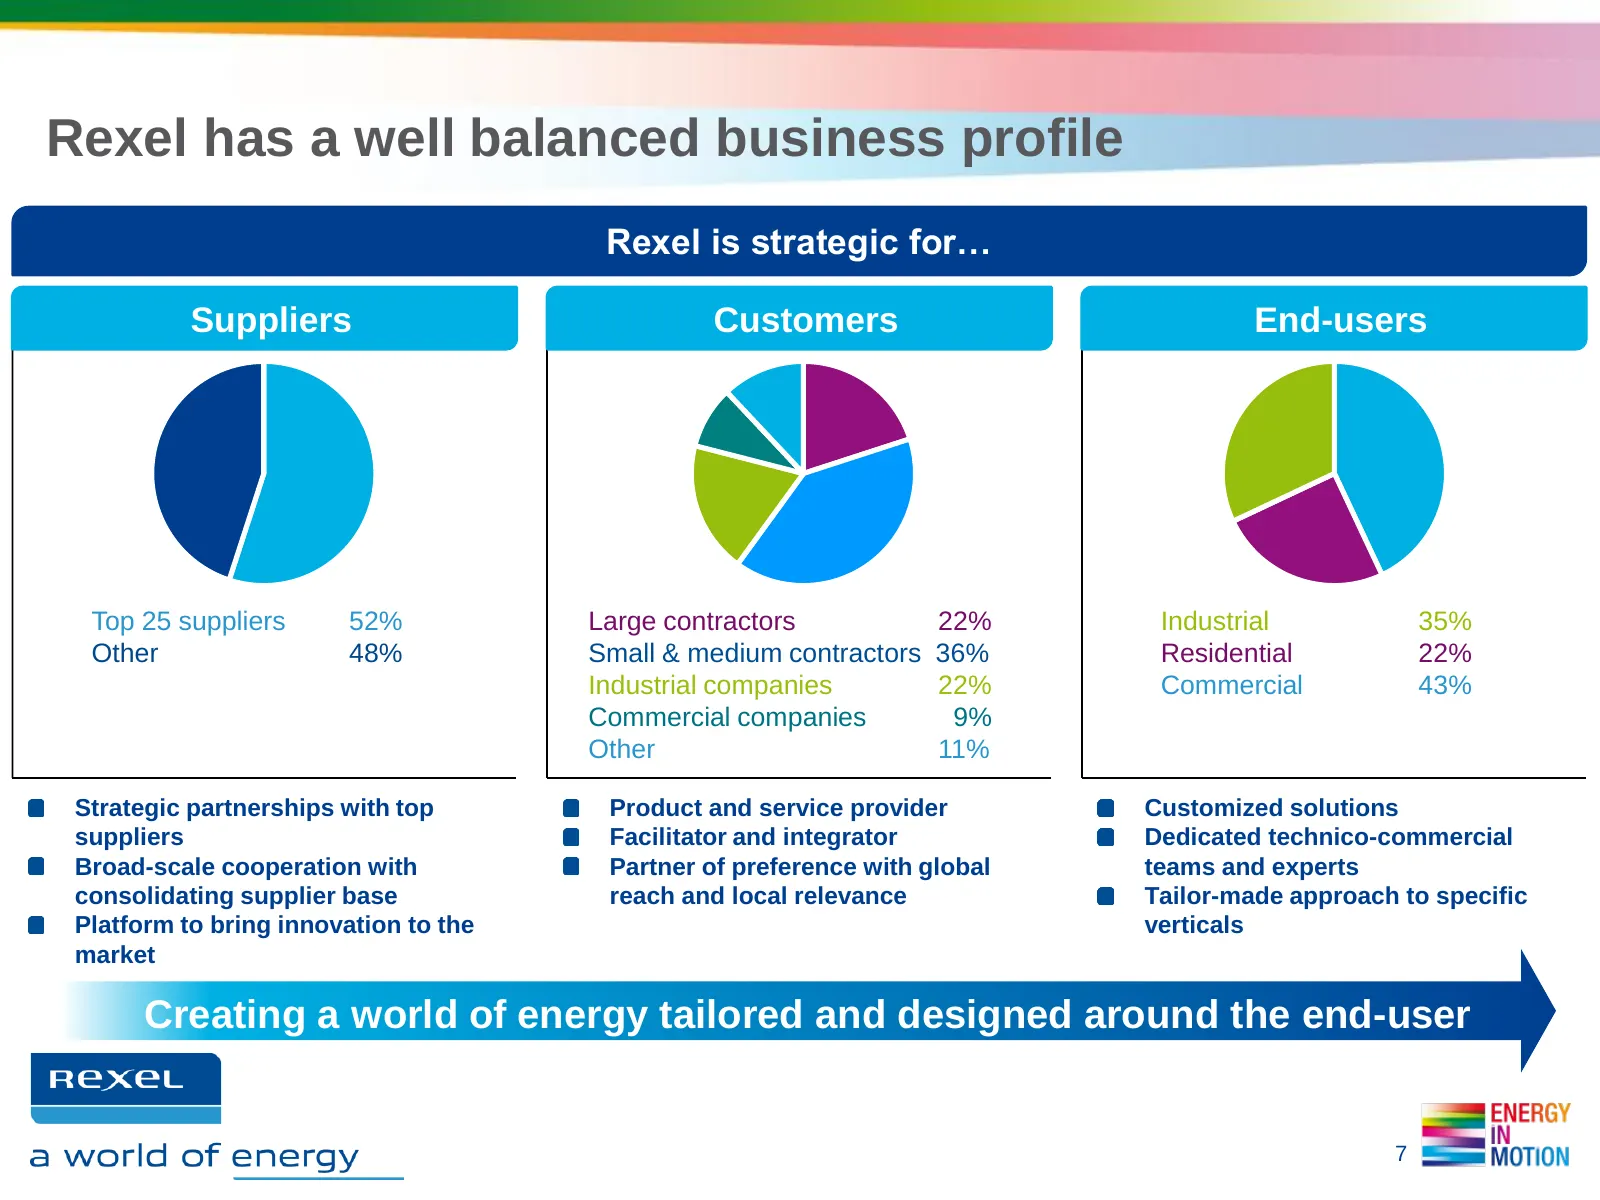
Slide 7: Rexel has a well balanced business profile
Rexel has a well balanced business profile Rexel is strategic for… Suppliers Customers End-users Top 25 suppliers 52% Large contractors 22% Industrial 35% Other 48% Small & medium contractors 36% Residential 22% Industrial companies 22% Commercial 43% Commercial companies 9% Other 11% Strategic part
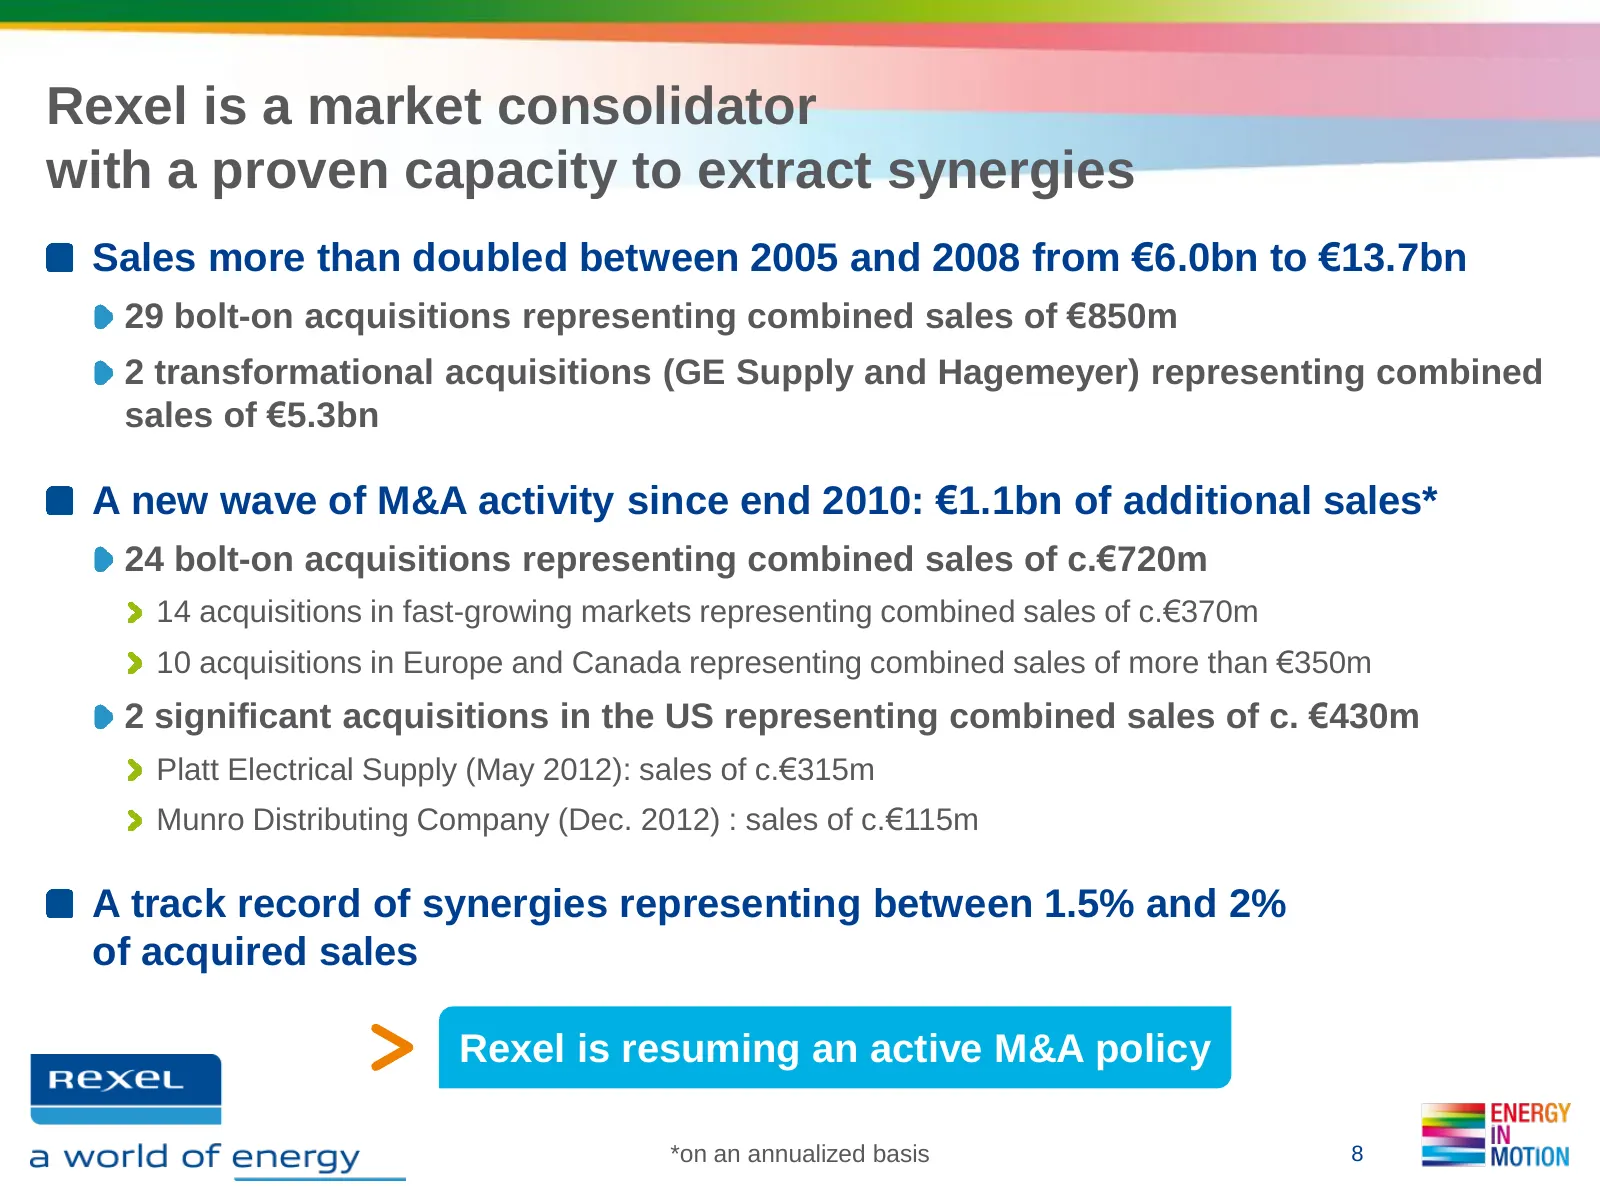
Slide 8: Rexel is a market consolidator with a proven capacity to extract synergies
Rexel is a market consolidator with a proven capacity to extract synergies Sales more than doubled between 2005 and 2008 from €6.0bn to €13.7bn 29 bolt-on acquisitions representing combined sales of €850m 2 transformational acquisitions (GE Supply and Hagemeyer) representing combined sales of €5.3bn
Slide 9: First Quarter Results
2 » FIRST QUARTER RESULTS Rexeu. as a world of energy ENERG) IN MOTION
Slide 10: Q1 2014 highlights: Return to organic sales growth
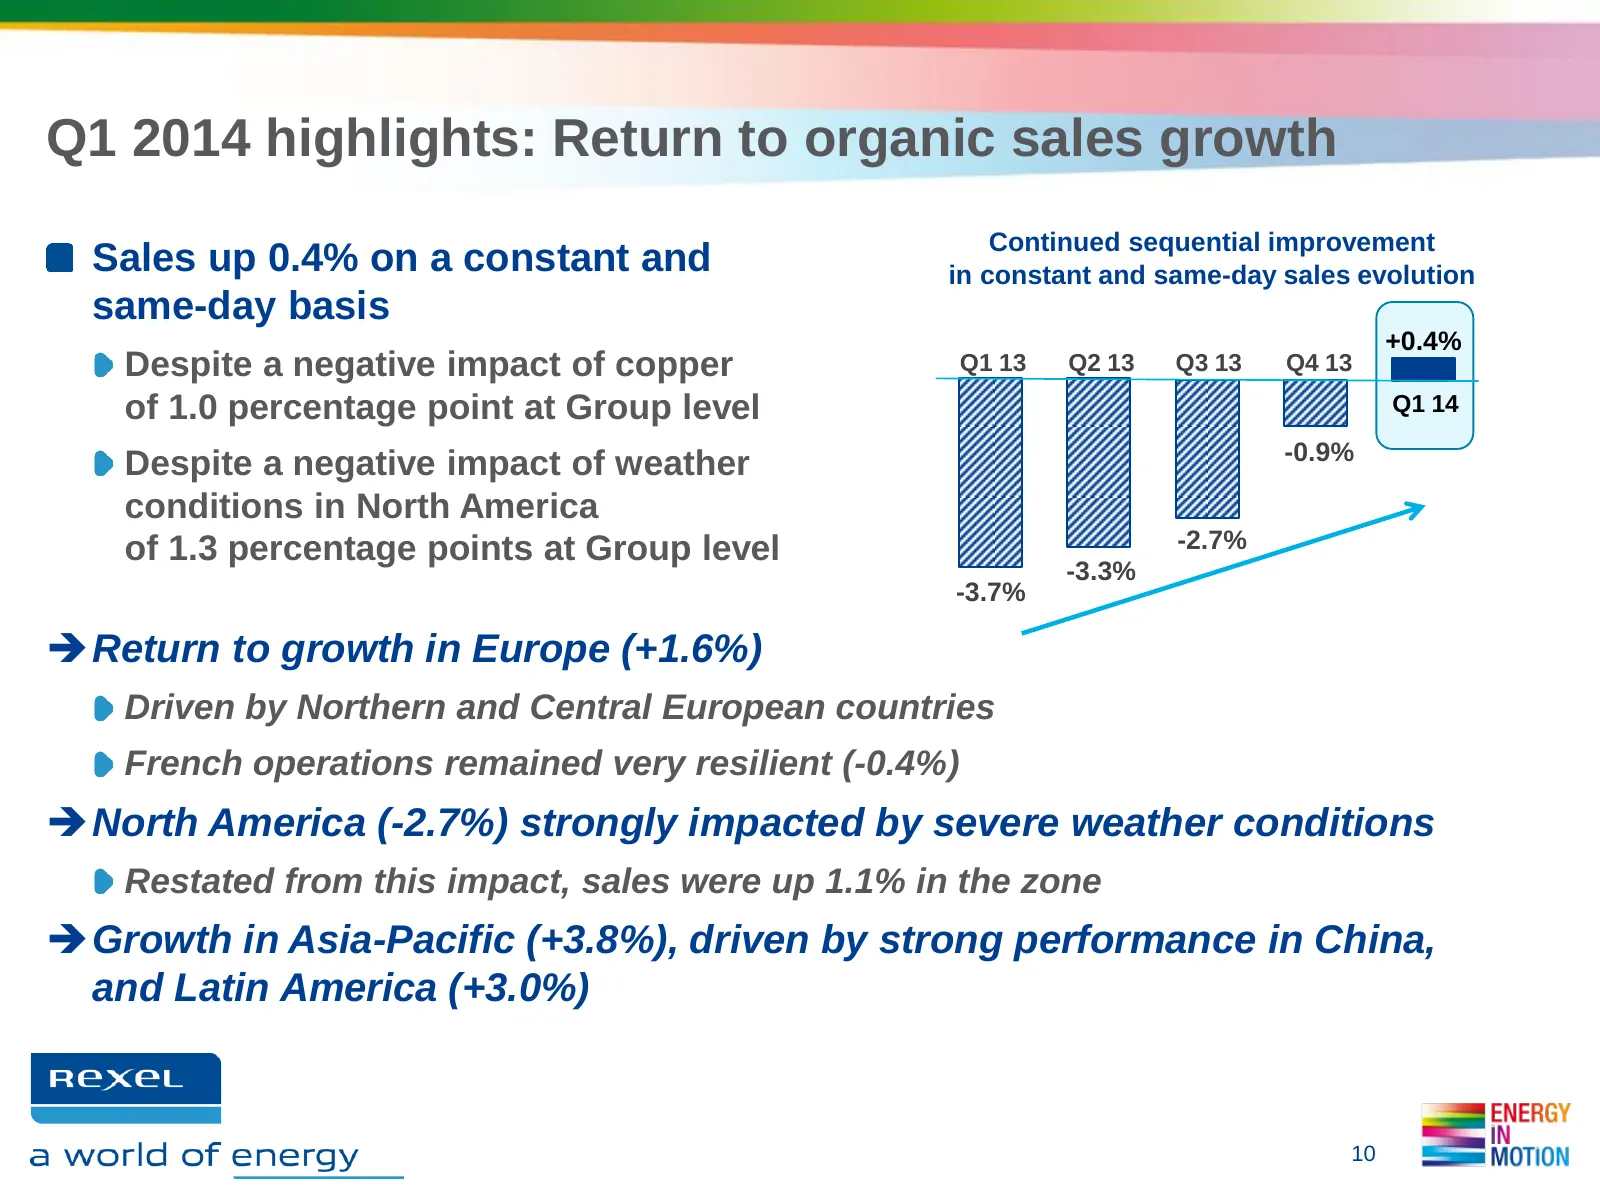
Q1 2014 highlights: Return to organic sales growth Continued sequential improvement Sales up 0.4% on a constant and in constant and same-day sales evolution same-day basis +0.4% Despite a negative impact of copper Q1 13 Q2 13 Q3 13 Q4 13 of 1.0 percentage point at Group level Q1 14 -0.9% Despite a n
Slide 11: Q1 2014 highlights: Resilient profitability and FY 2014 targets confirmed
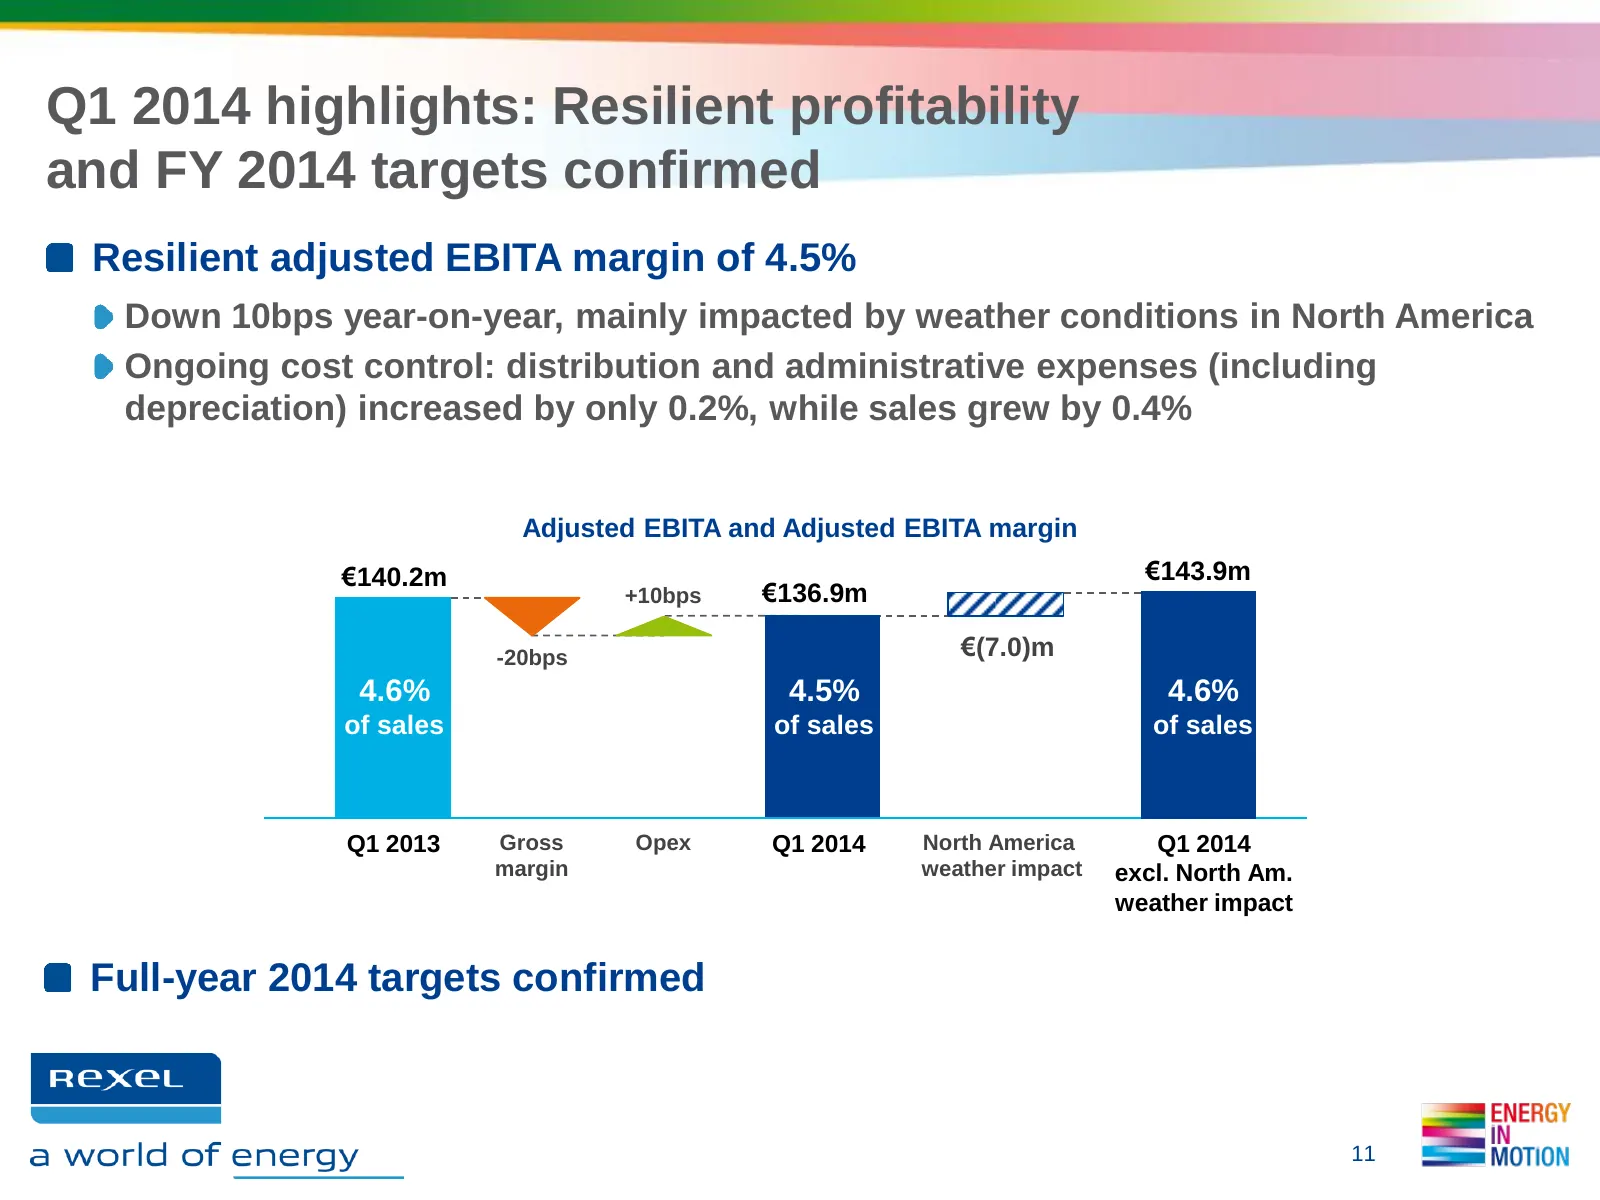
Q1 2014 highlights: Resilient profitability and FY 2014 targets confirmed Resilient adjusted EBITA margin of 4.5% Down 10bps year-on-year, mainly impacted by weather conditions in North America Ongoing cost control: distribution and administrative expenses (including depreciation) increased by only
Slide 12: Europe: Return to growth driven by Northern and Central Europe
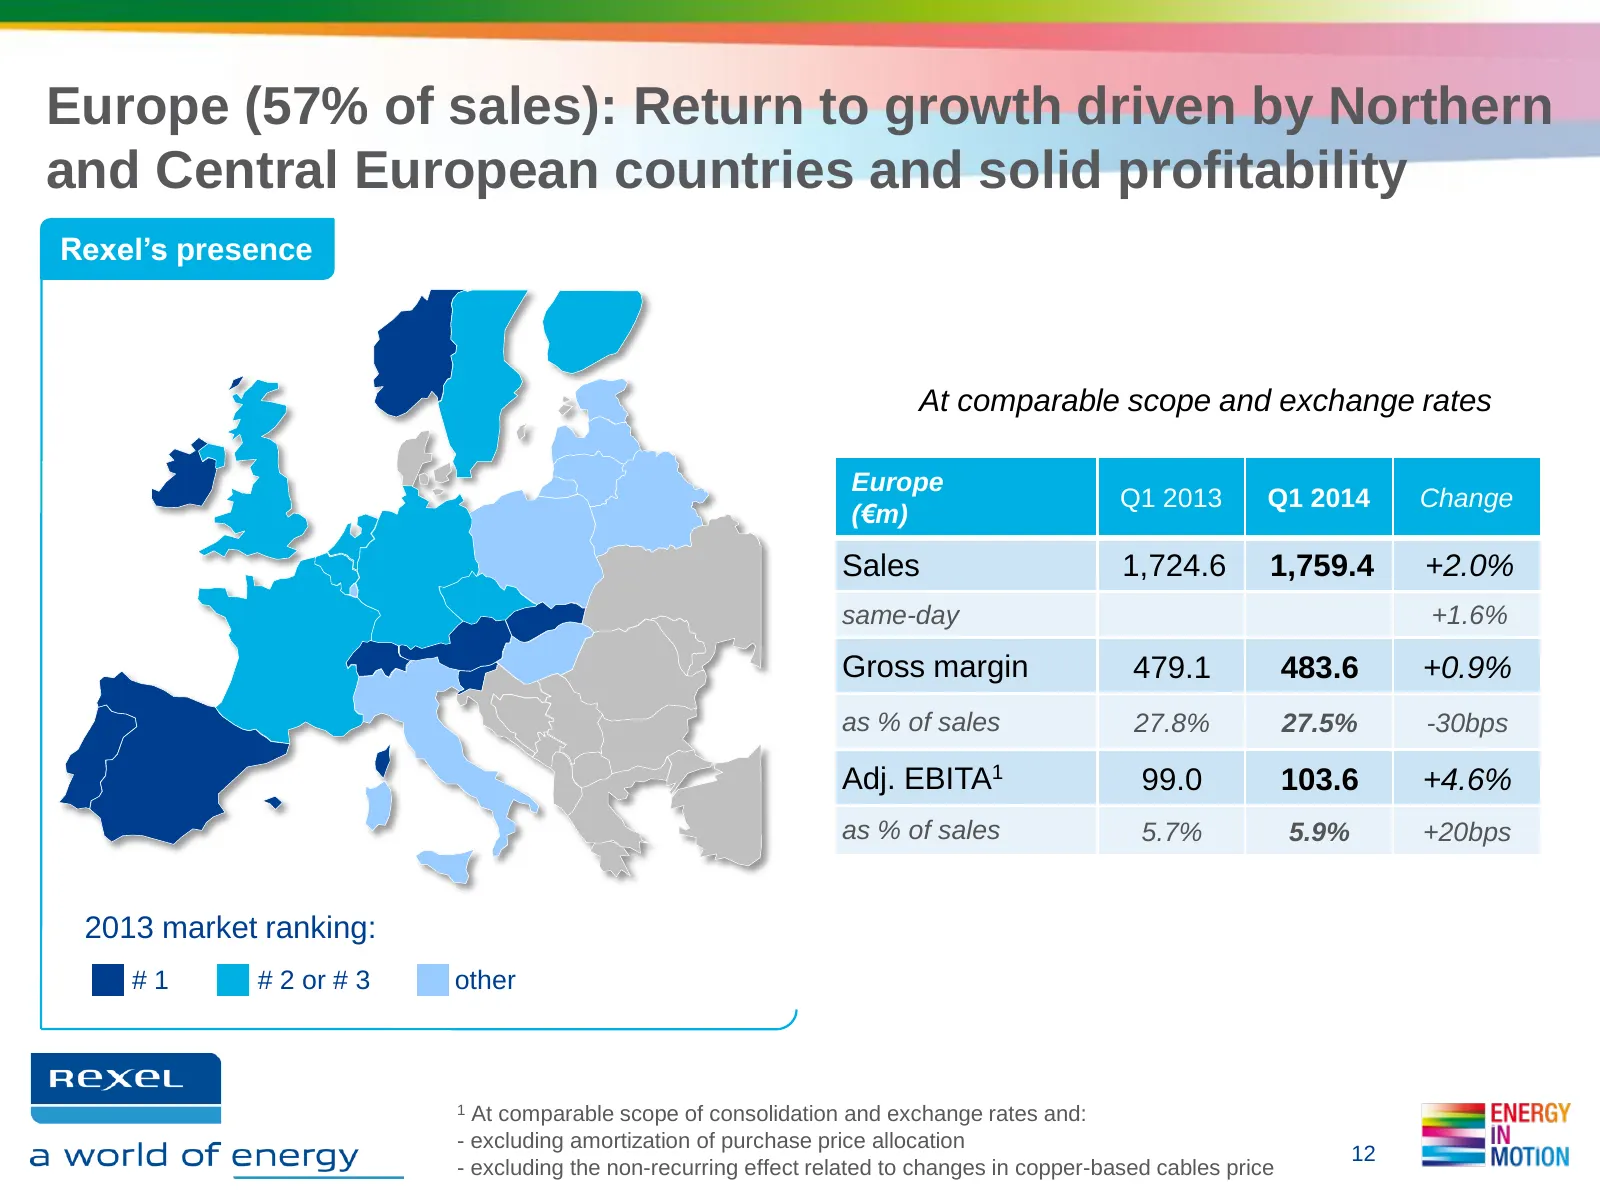
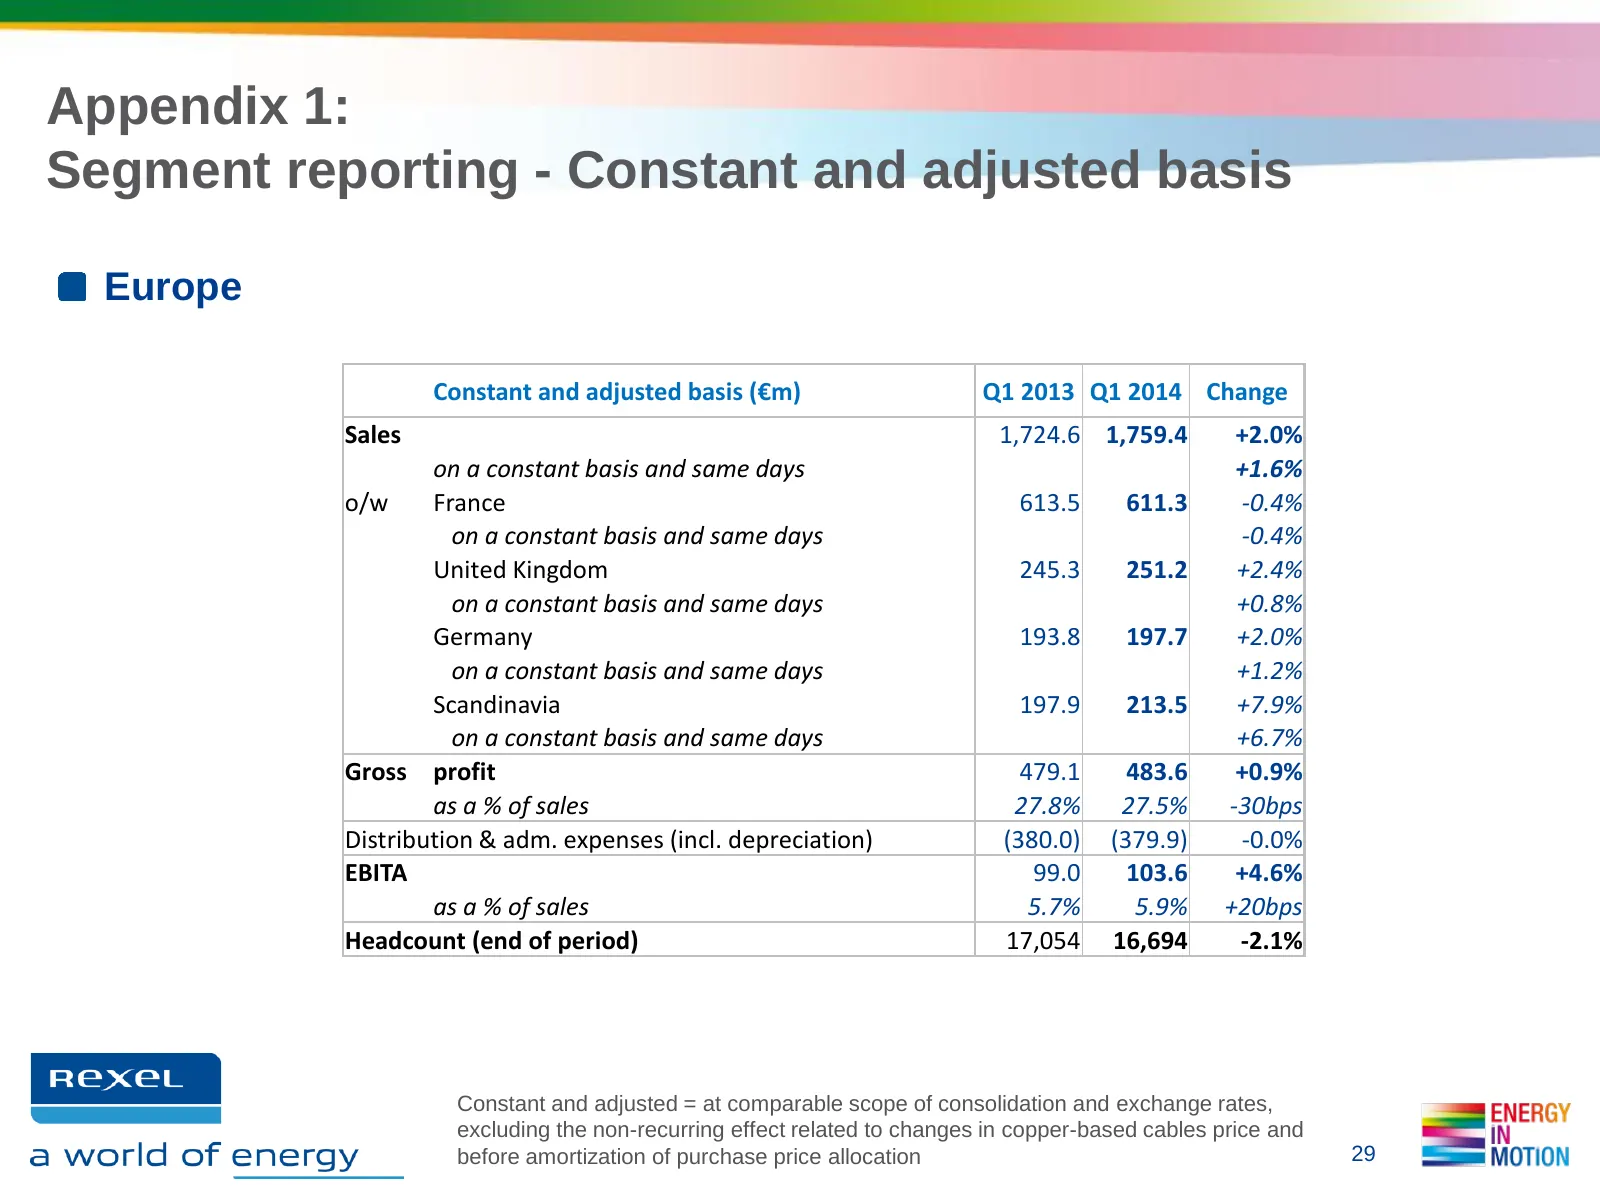
Europe (57% of sales): Return to growth driven by Northern and Central European countries and solid profitability Rexel’s presence At comparable scope and exchange rates Europe Q1 2013 Q1 2014 Change (€m) Sales 1,724.6 1,759.4 +2.0% same-day +1.6% Gross margin 479.1 483.6 +0.9% as % of sales 27.8% 2
Slide 13: Europe: Q1 2014 business highlights
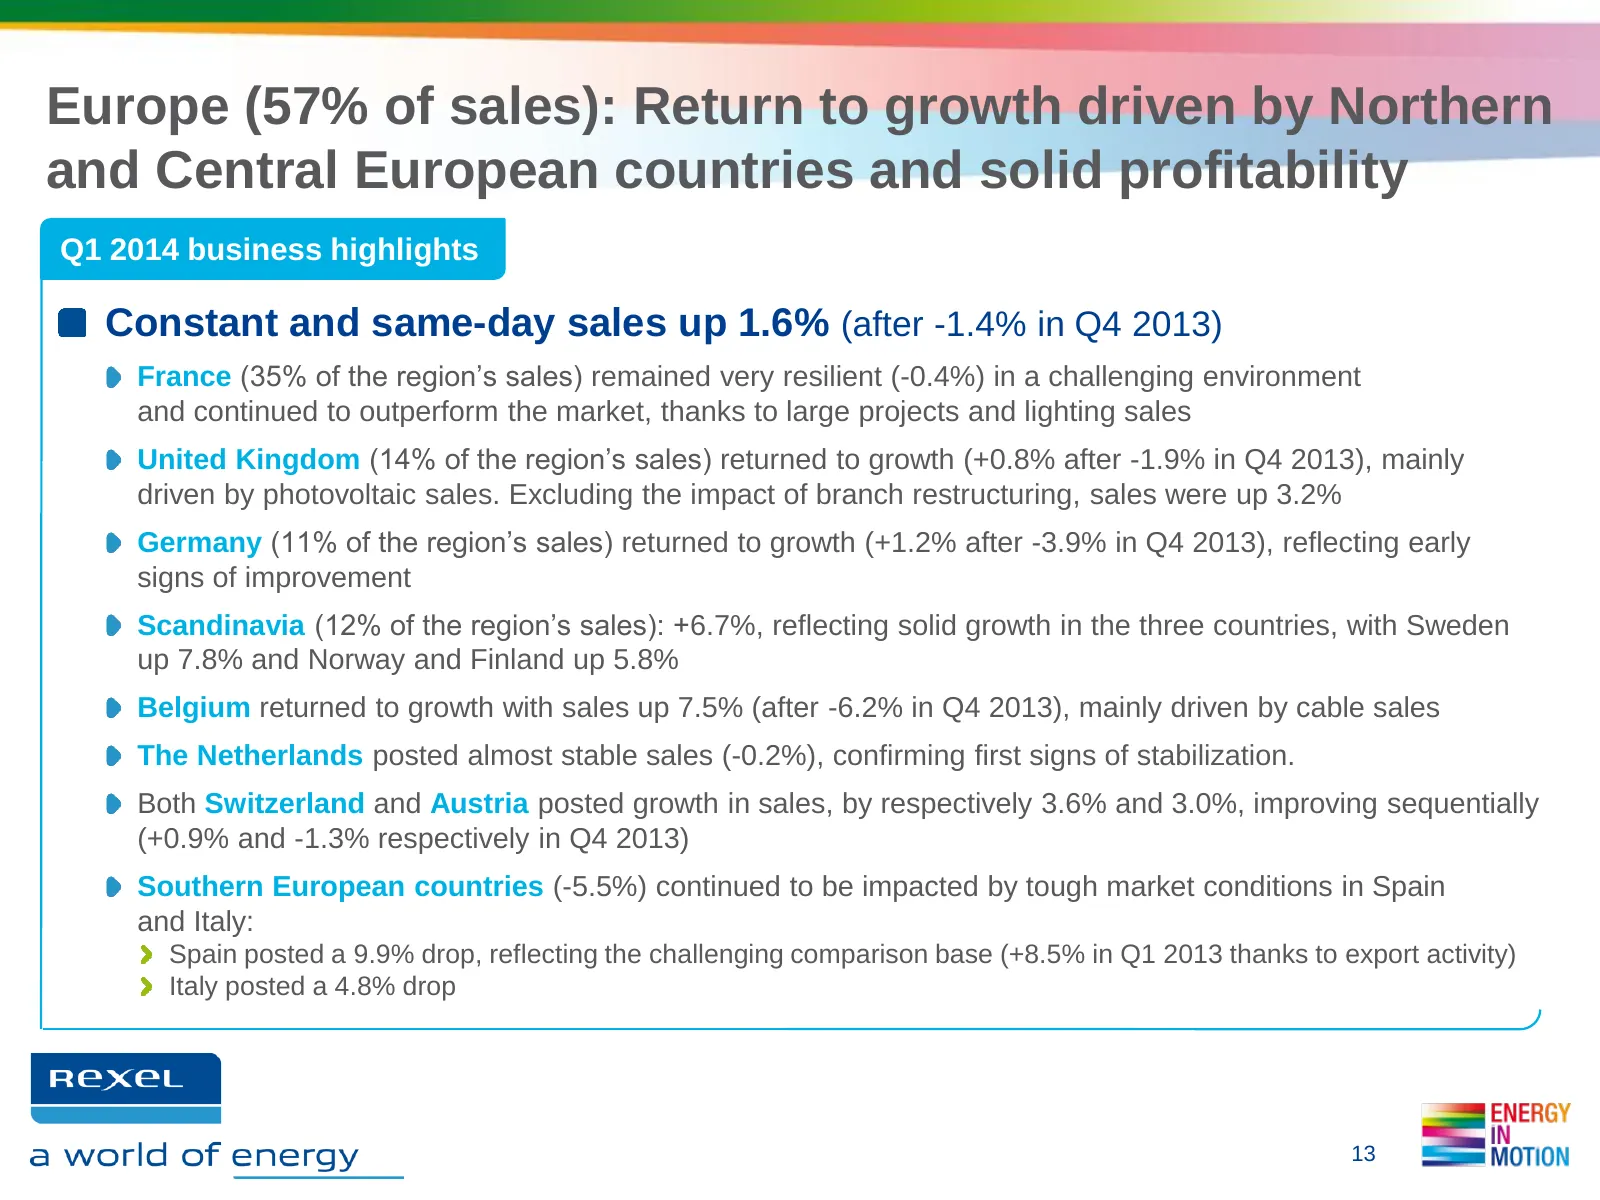
Europe (57% of sales): Return to growth driven by Northern and Central European countries and solid profitability Q1 2014 business highlights Constant and same-day sales up 1.6% (after -1.4% in Q4 2013) France (35% of the region’s sales) remained very resilient (-0.4%) in a challenging environment a
Slide 14: North America: Significant negative impact from weather conditions
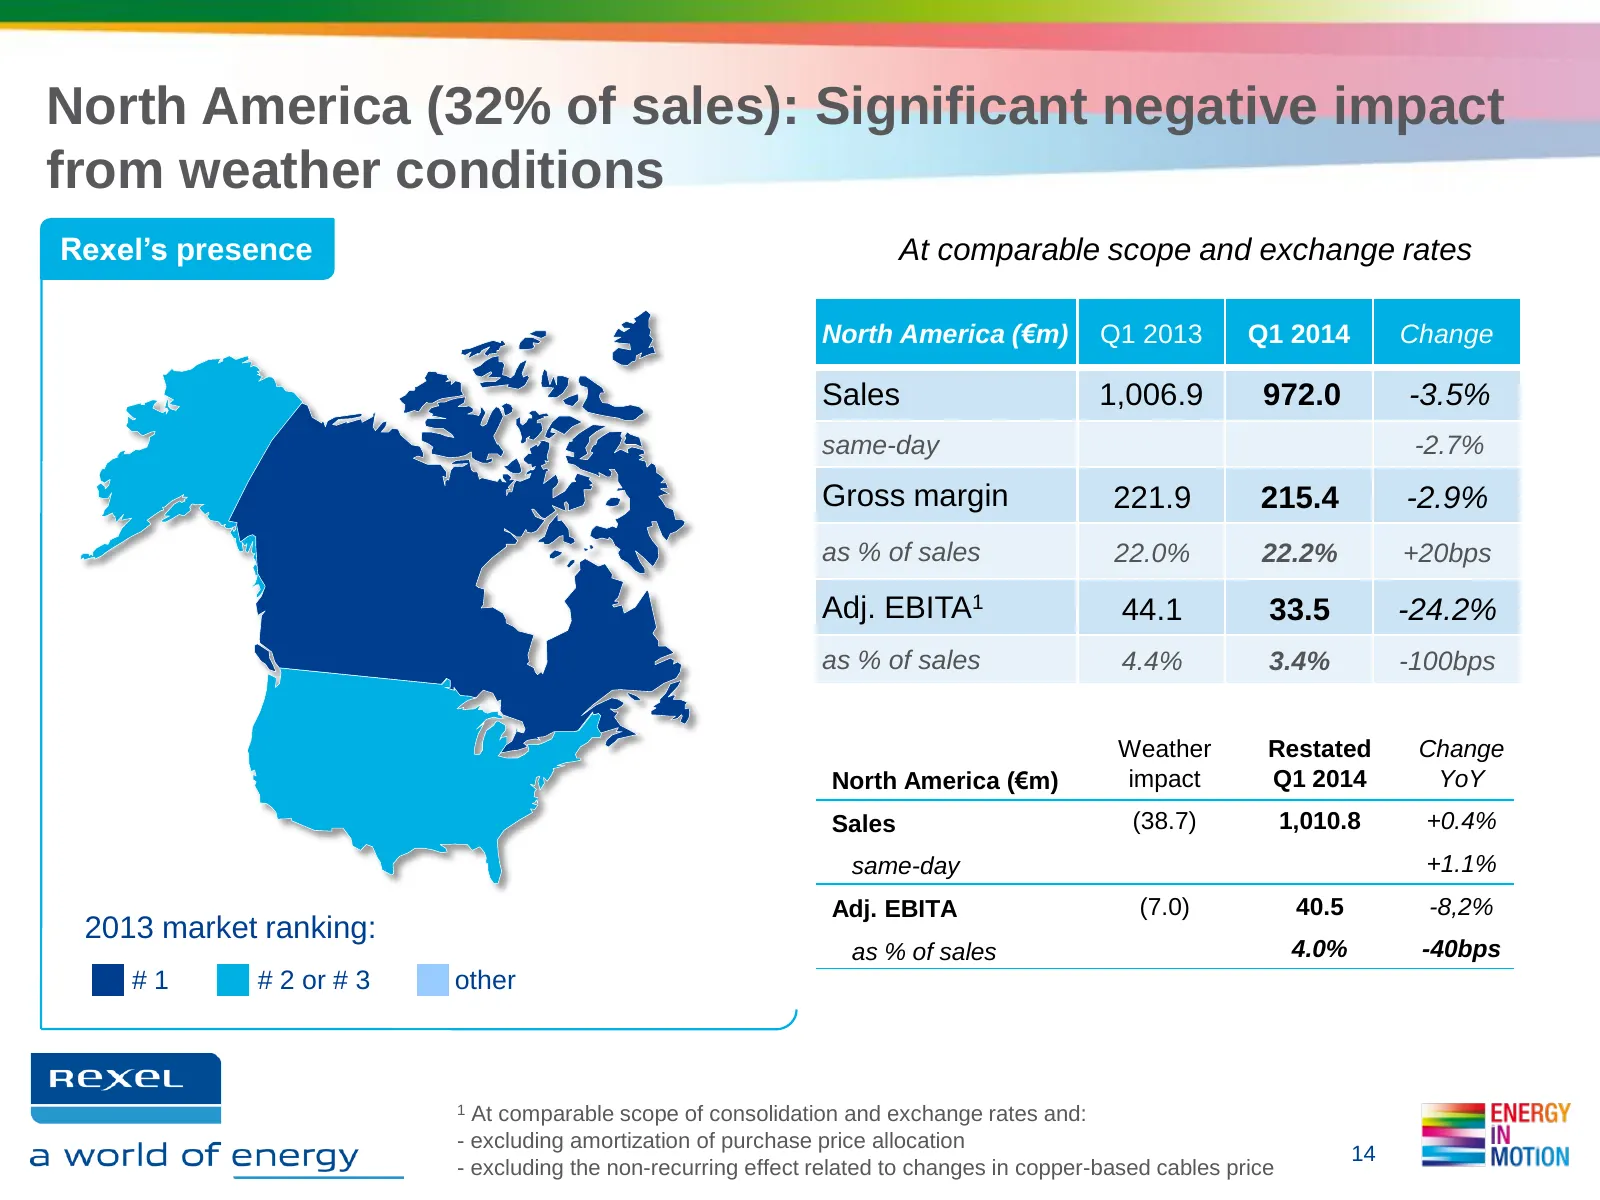
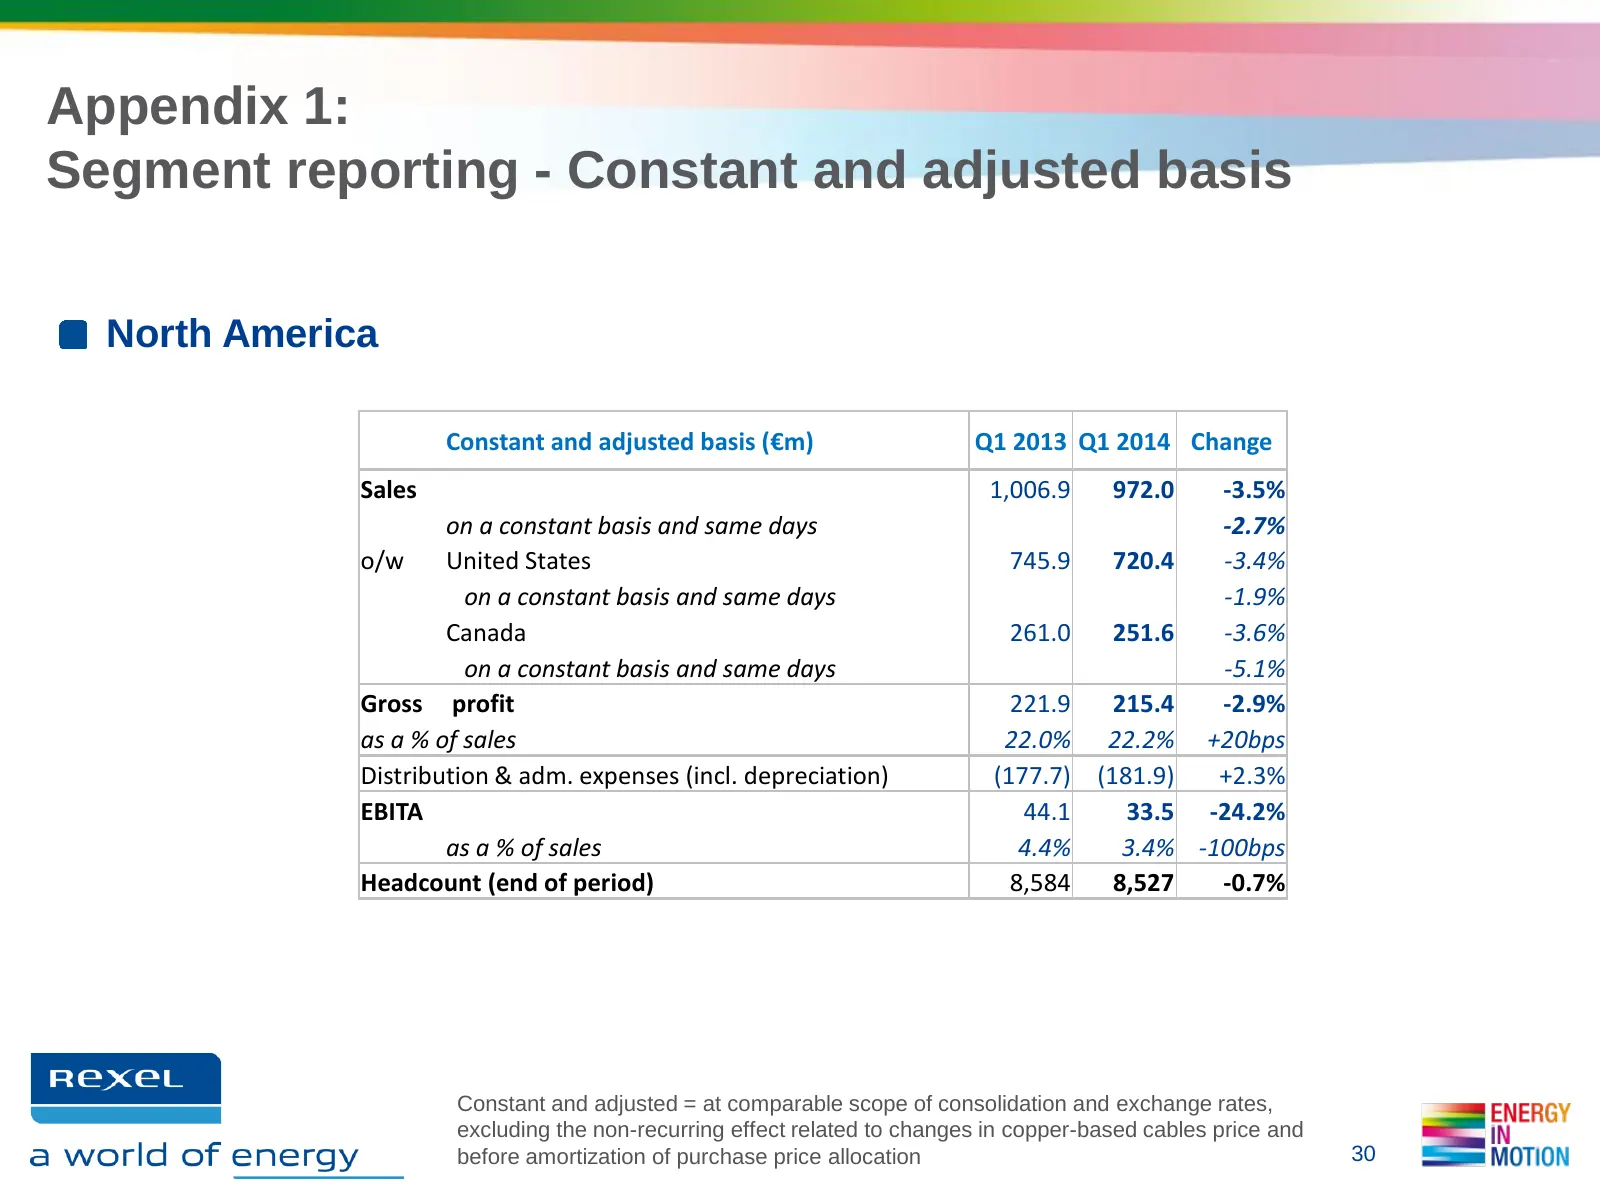
North America (32% of sales): Significant negative impact from weather conditions Rexel’s presence At comparable scope and exchange rates North America (€m) Q1 2013 Q1 2014 Change Sales 1,006.9 972.0 -3.5% same-day -2.7% Gross margin 221.9 215.4 -2.9% as % of sales 22.0% 22.2% +20bps Adj. EBITA1 44.
Slide 15: North America: Q1 2014 business highlights
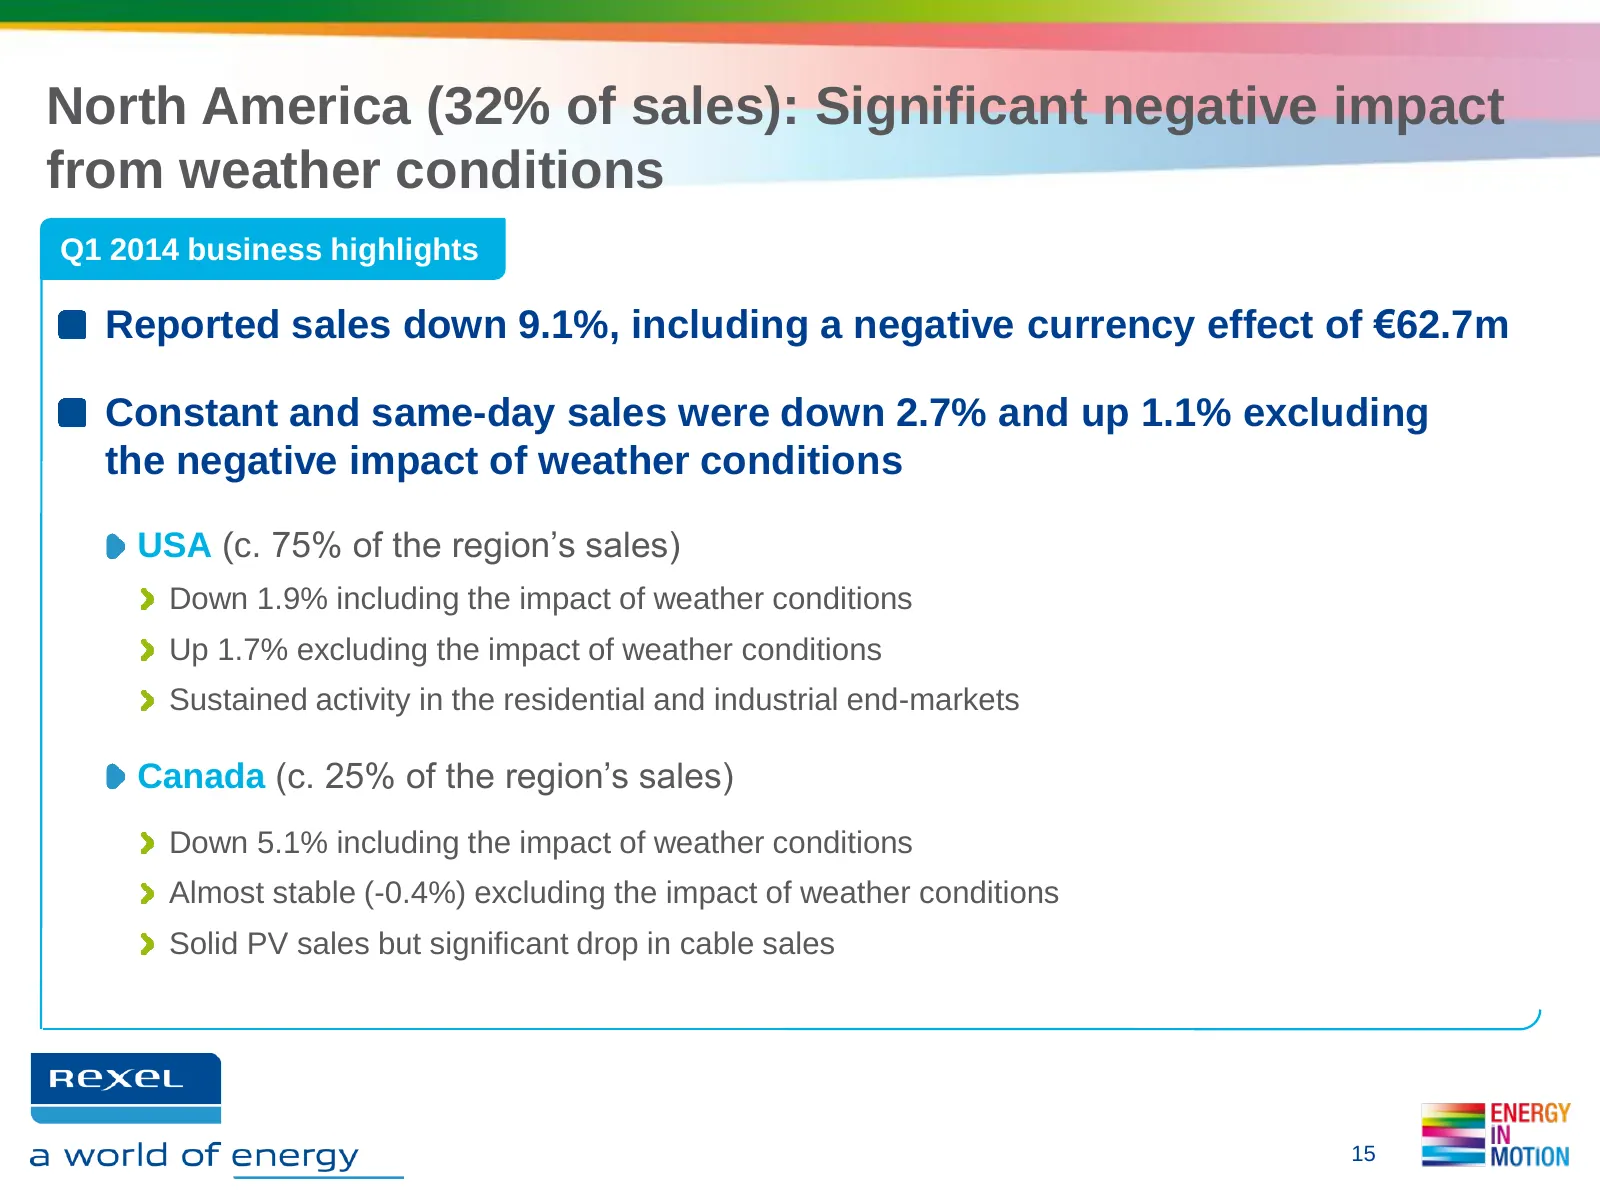
North America (32% of sales): Significant negative impact from weather conditions Q1 2014 business highlights Reported sales down 9.1%, including a negative currency effect of €62.7m Constant and same-day sales were down 2.7% and up 1.1% excluding the negative impact of weather conditions USA (c. 75
Slide 16: Asia-Pacific: Strong performance in China
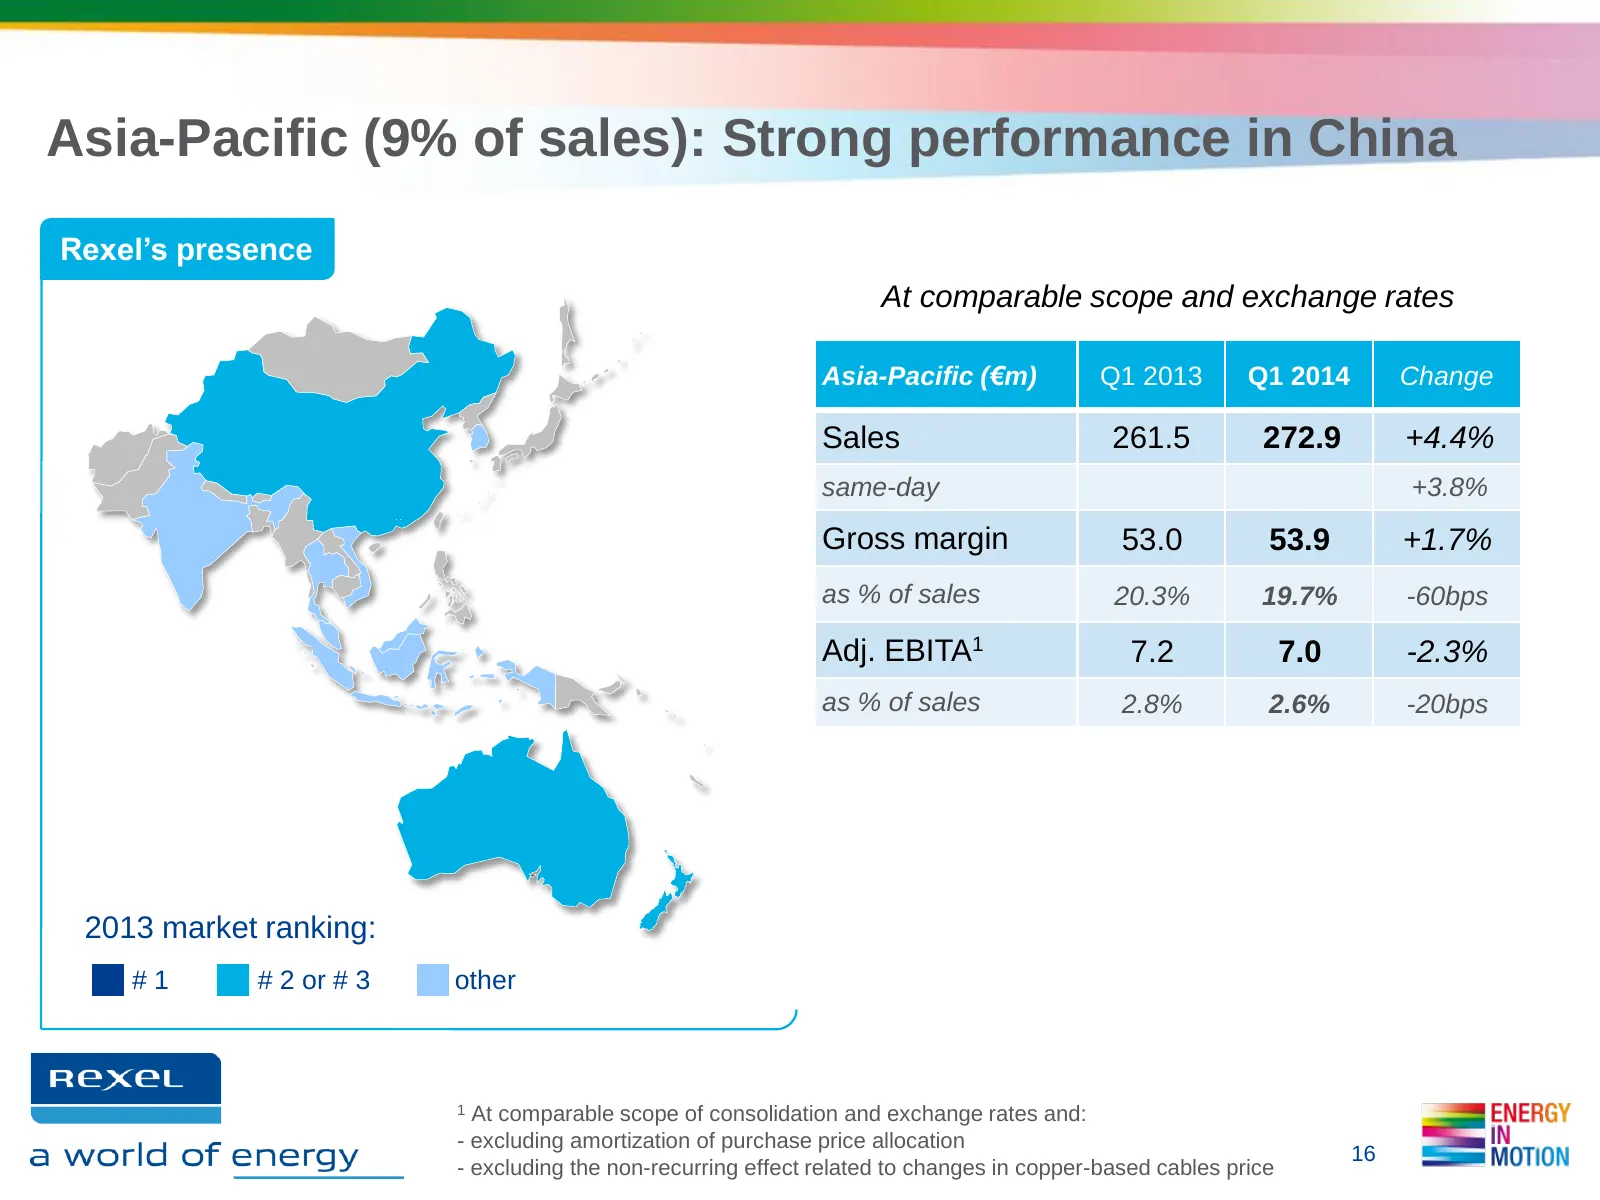
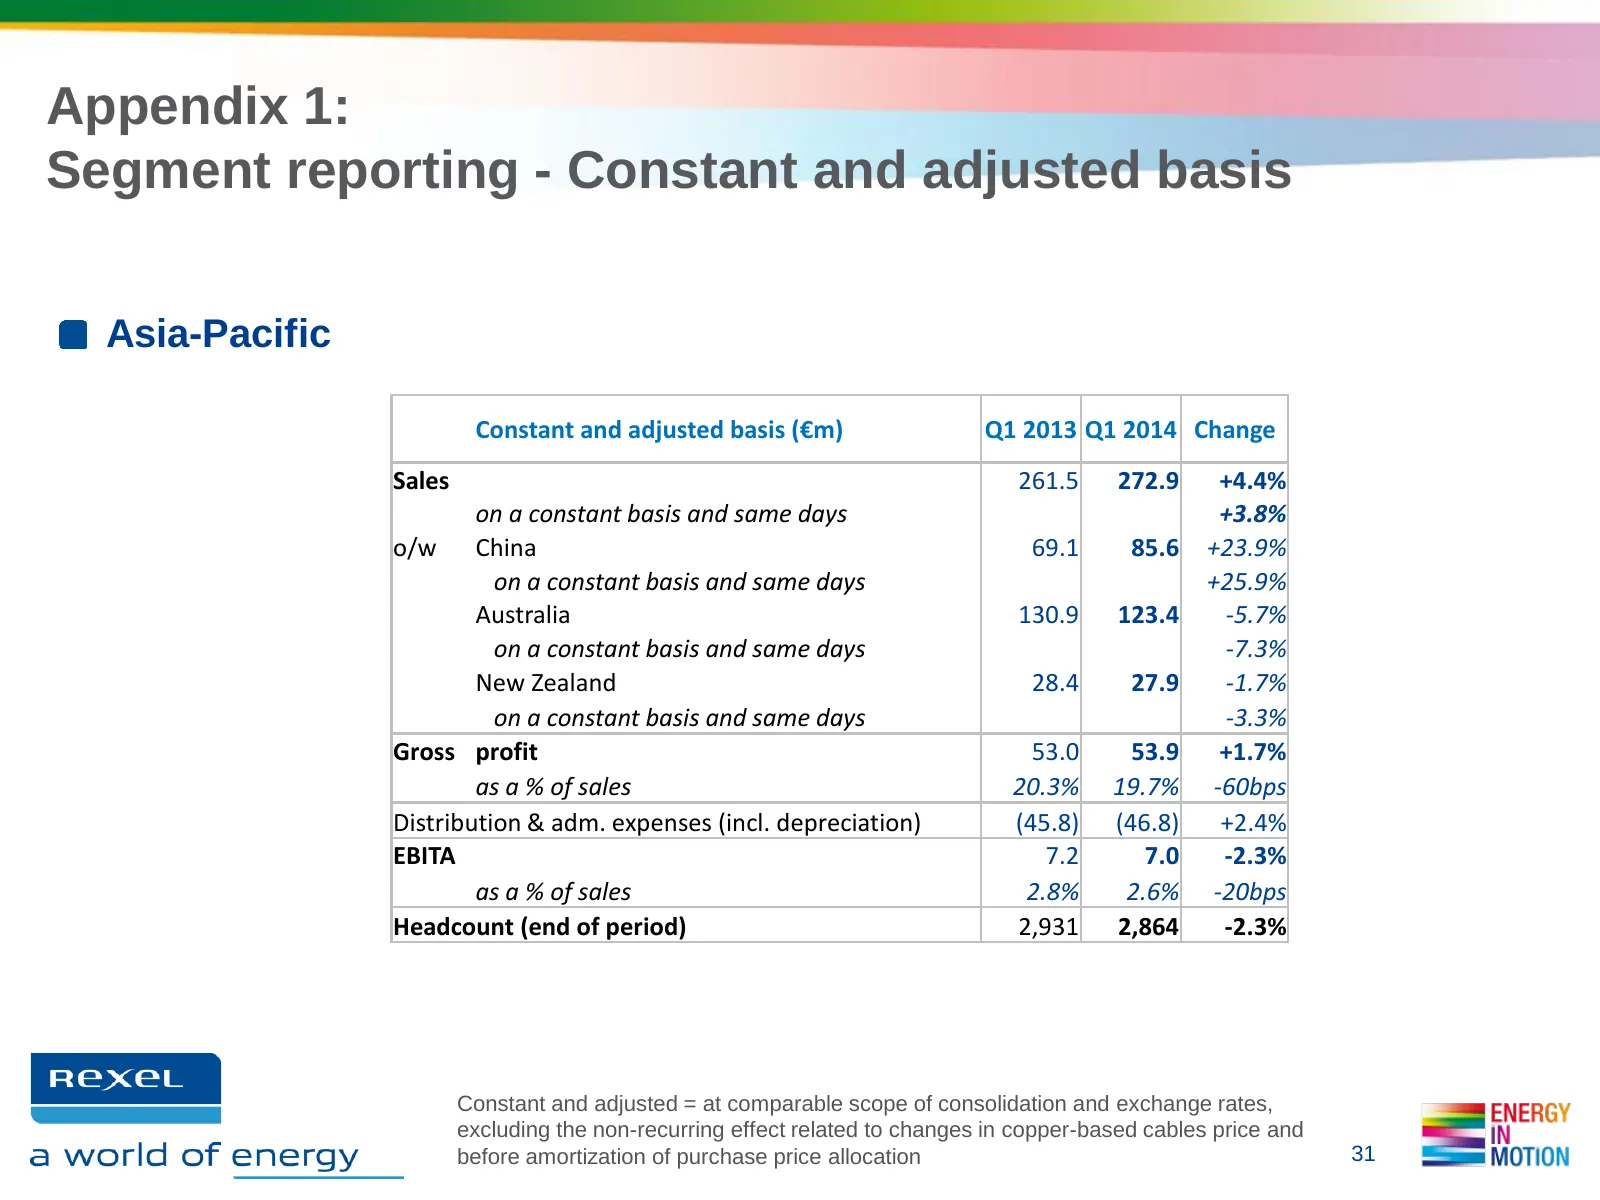
Asia-Pacific (9% of sales): Strong performance in China Rexel’s presence At comparable scope and exchange rates Asia-Pacific (€m) Q1 2013 Q1 2014 Change Sales 261.5 272.9 +4.4% same-day +3.8% Gross margin 53.0 53.9 +1.7% as % of sales 20.3% 19.7% -60bps Adj. EBITA1 7.2 7.0 -2.3% as % of sales 2.8% 2
Slide 17: Asia-Pacific: Q1 2014 business highlights
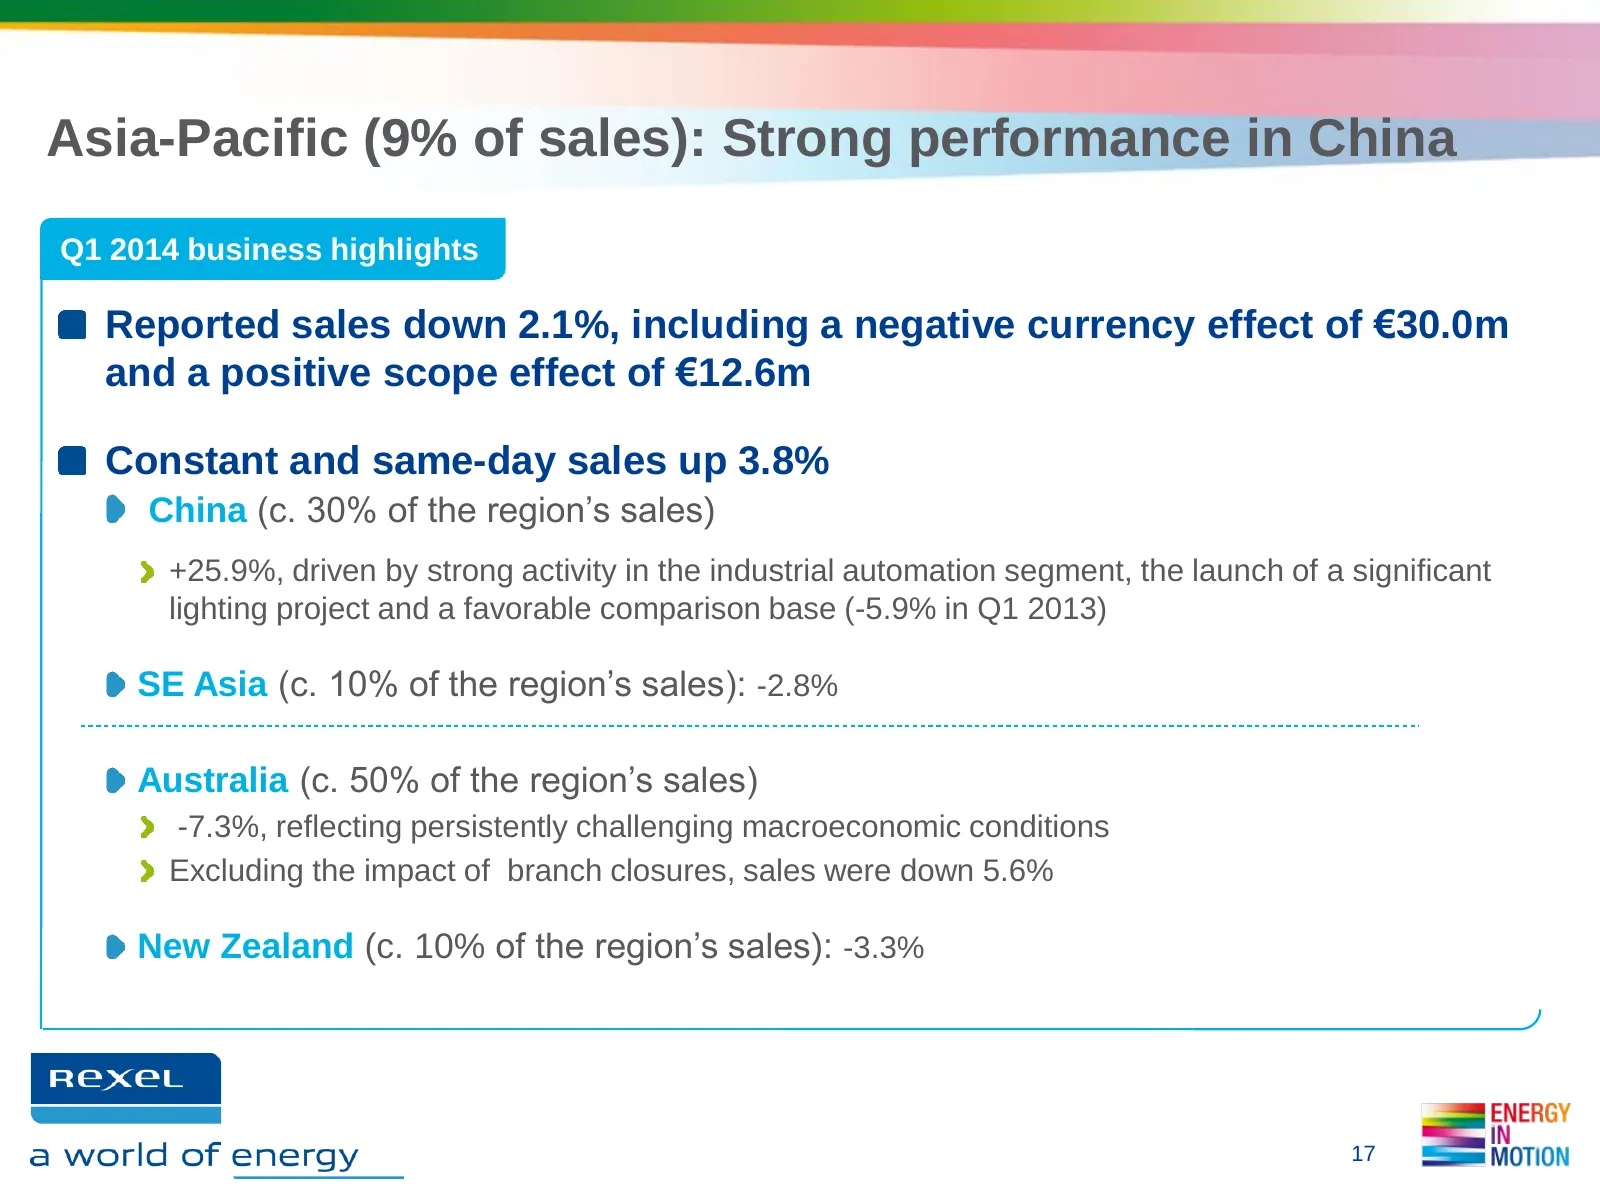
Asia-Pacific (9% of sales): Strong performance in China Q1 2014 business highlights Reported sales down 2.1%, including a negative currency effect of €30.0m and a positive scope effect of €12.6m Constant and same-day sales up 3.8% China (c. 30% of the region’s sales) +25.9%, driven by strong activit
Slide 18: Latin America: Slowdown in Brazil and sales growth in Chile
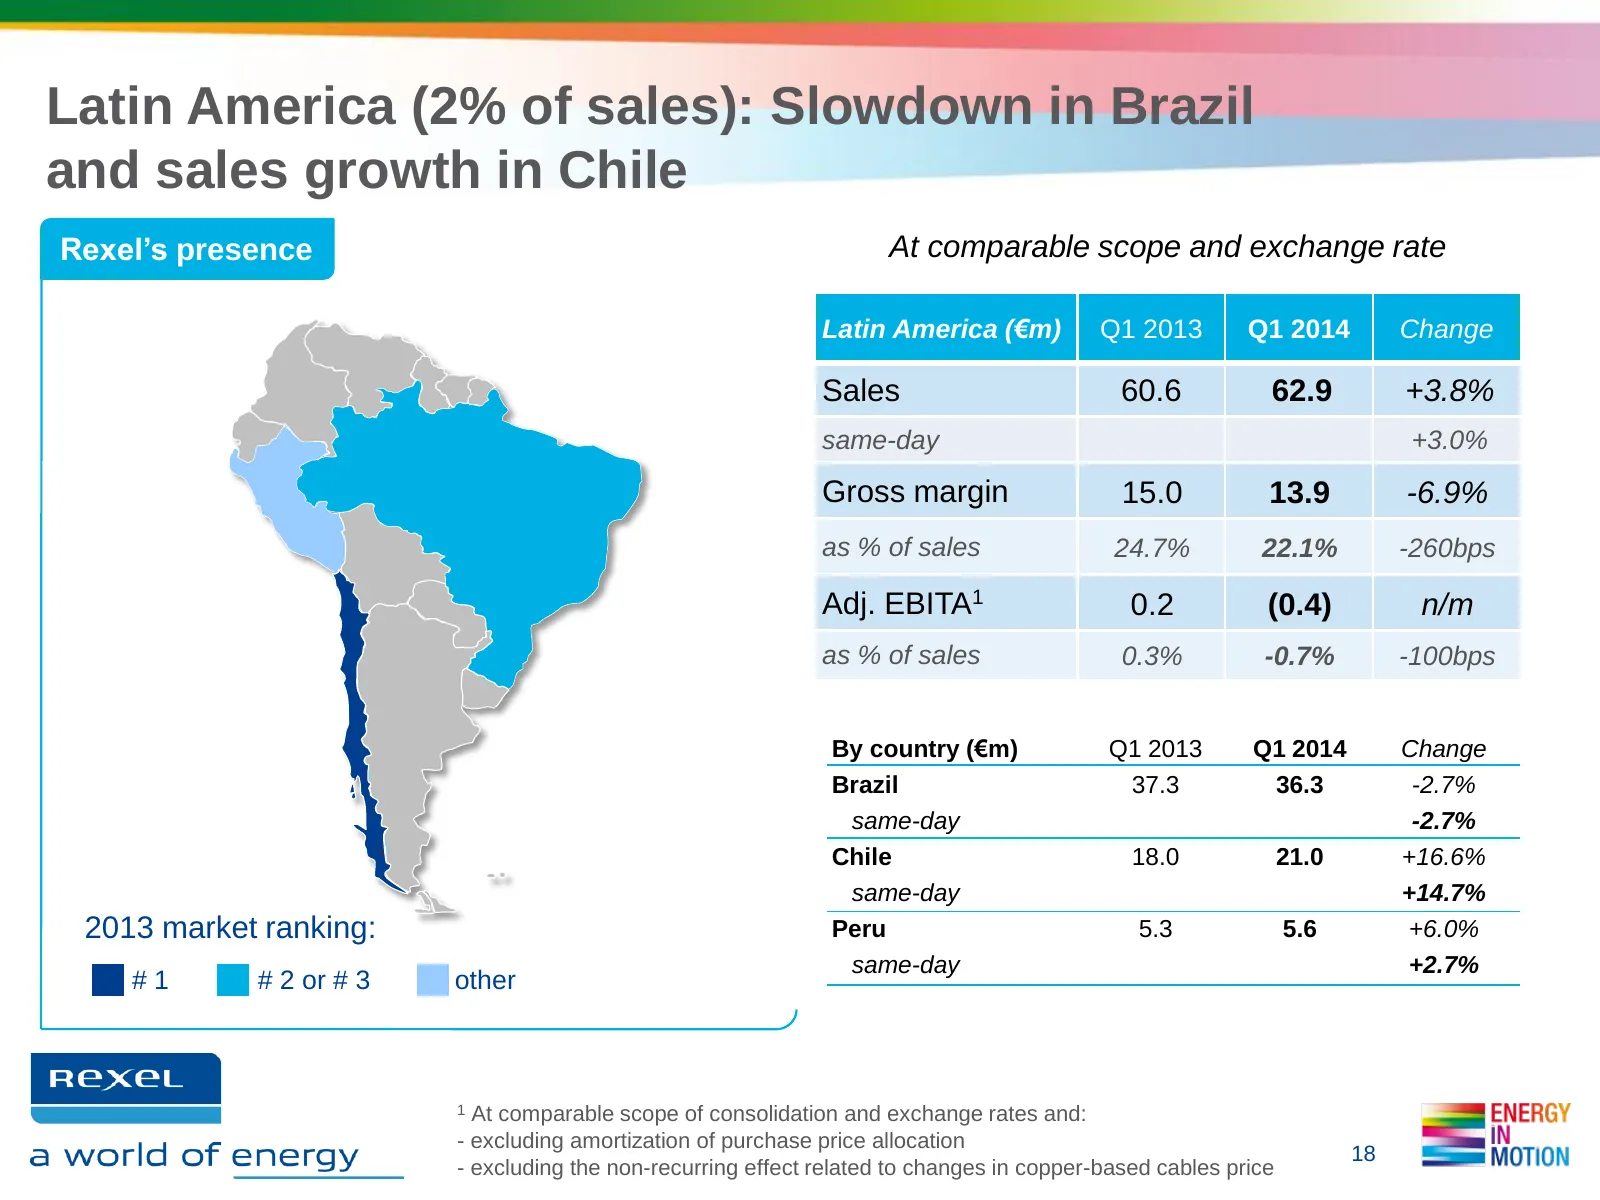
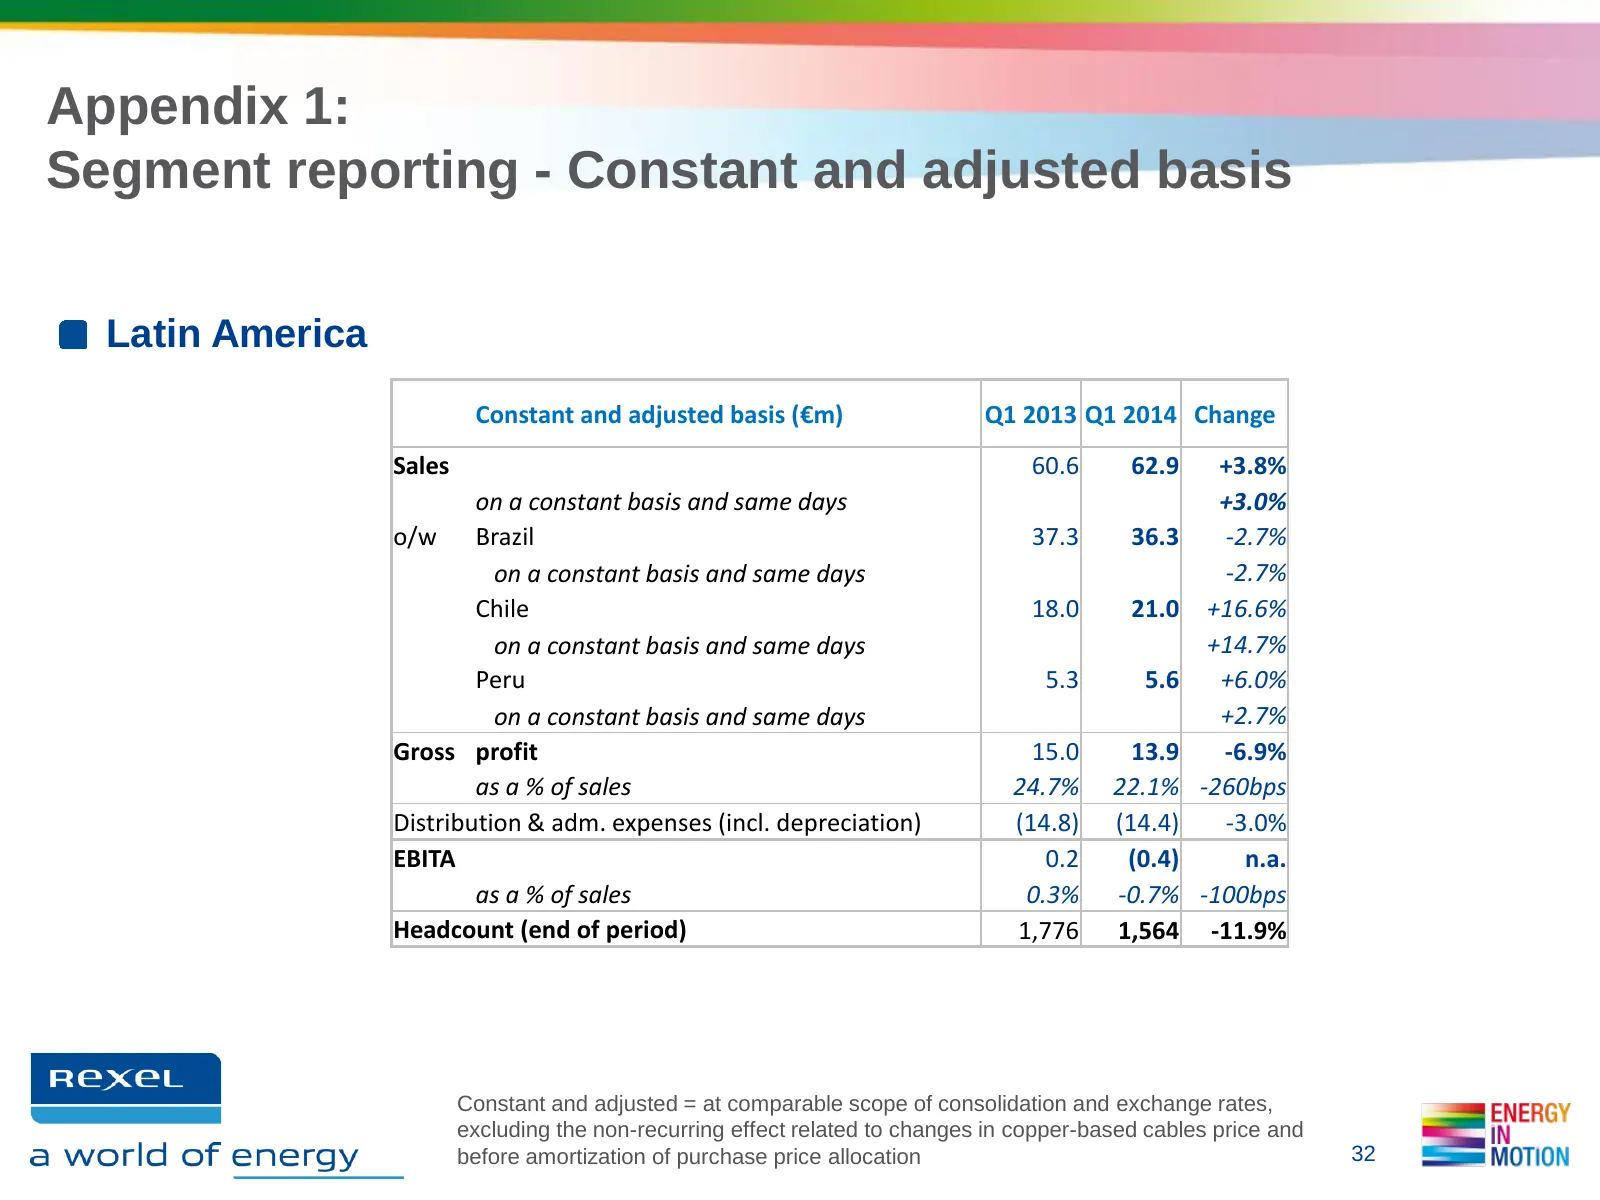
Latin America (2% of sales): Slowdown in Brazil and sales growth in Chile Rexel’s presence At comparable scope and exchange rate Latin America (€m) Q1 2013 Q1 2014 Change Sales 60.6 62.9 +3.8% same-day +3.0% Gross margin 15.0 13.9 -6.9% as % of sales 24.7% 22.1% -260bps Adj. EBITA1 0.2 (0.4) n/m as
Slide 19: Latin America: Q1 2014 business highlights
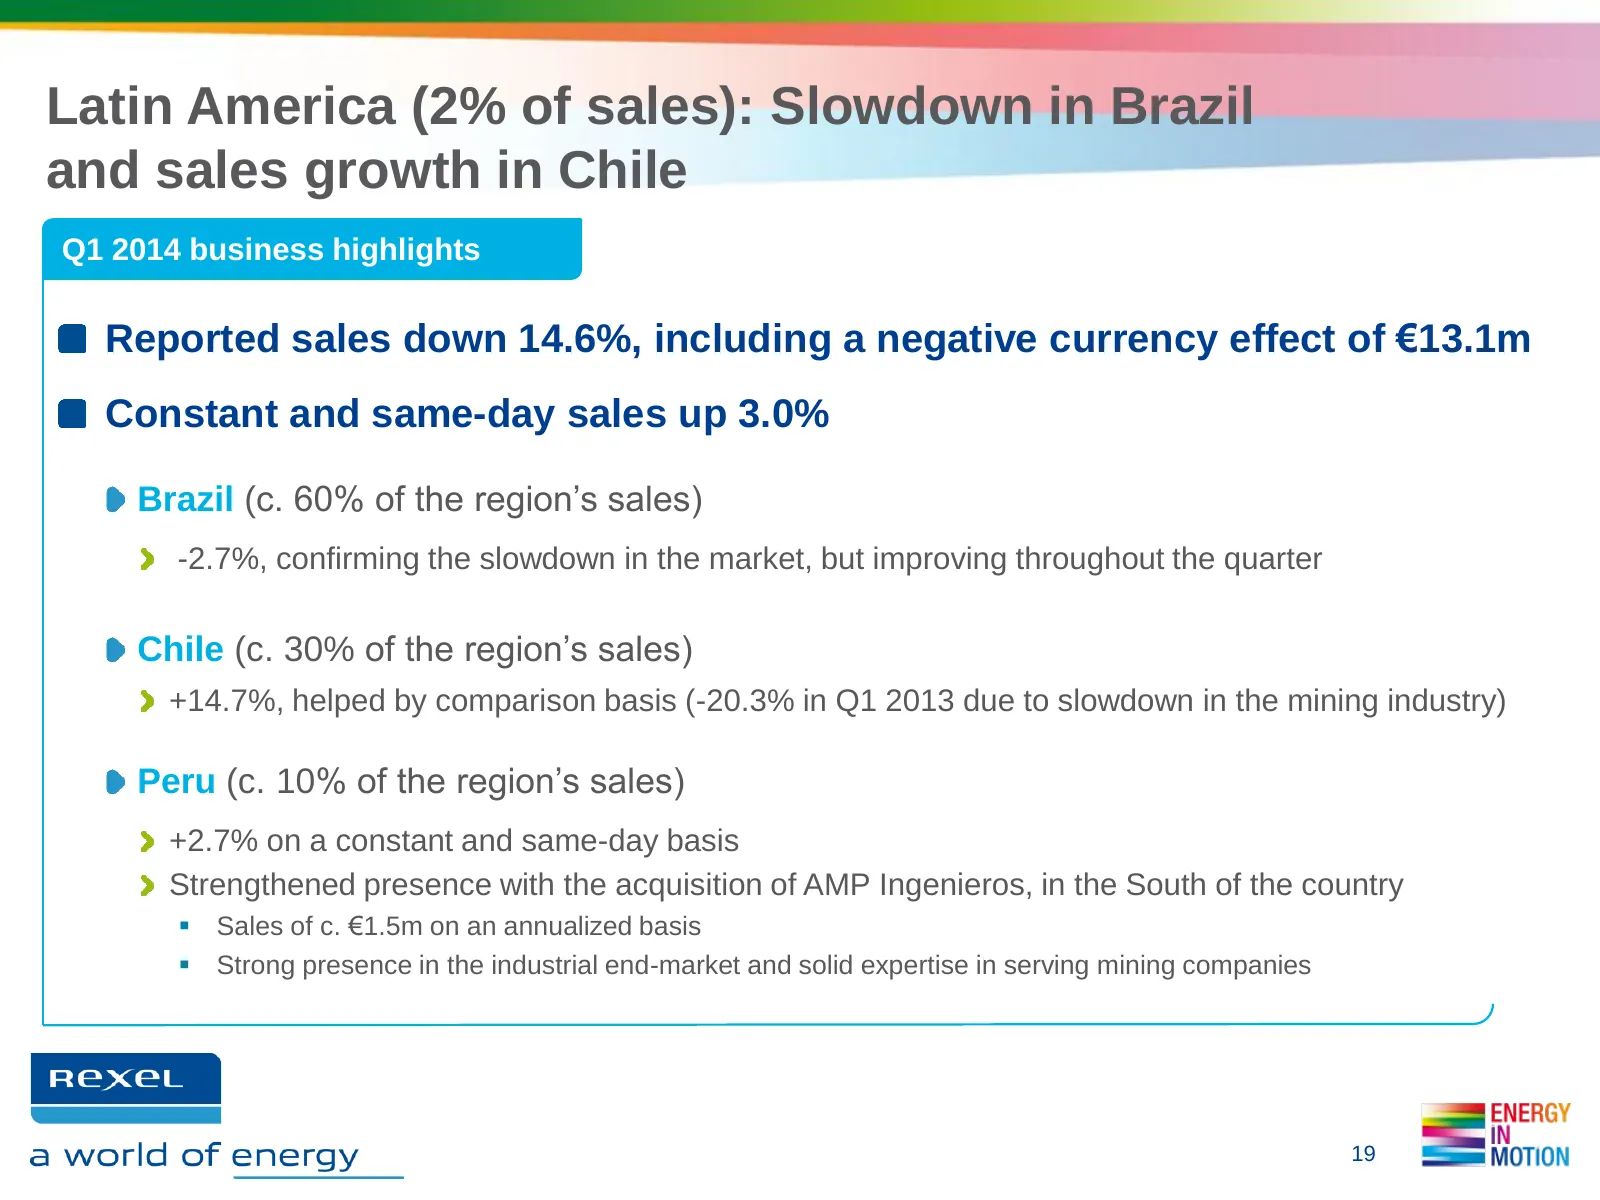
Latin America (2% of sales): Slowdown in Brazil and sales growth in Chile Q1 2014 business highlights Reported sales down 14.6%, including a negative currency effect of €13.1m Constant and same-day sales up 3.0% Brazil (c. 60% of the region’s sales) -2.7%, confirming the slowdown in the market, but
Slide 20: Continued sequential improvement in sales with return to organic growth
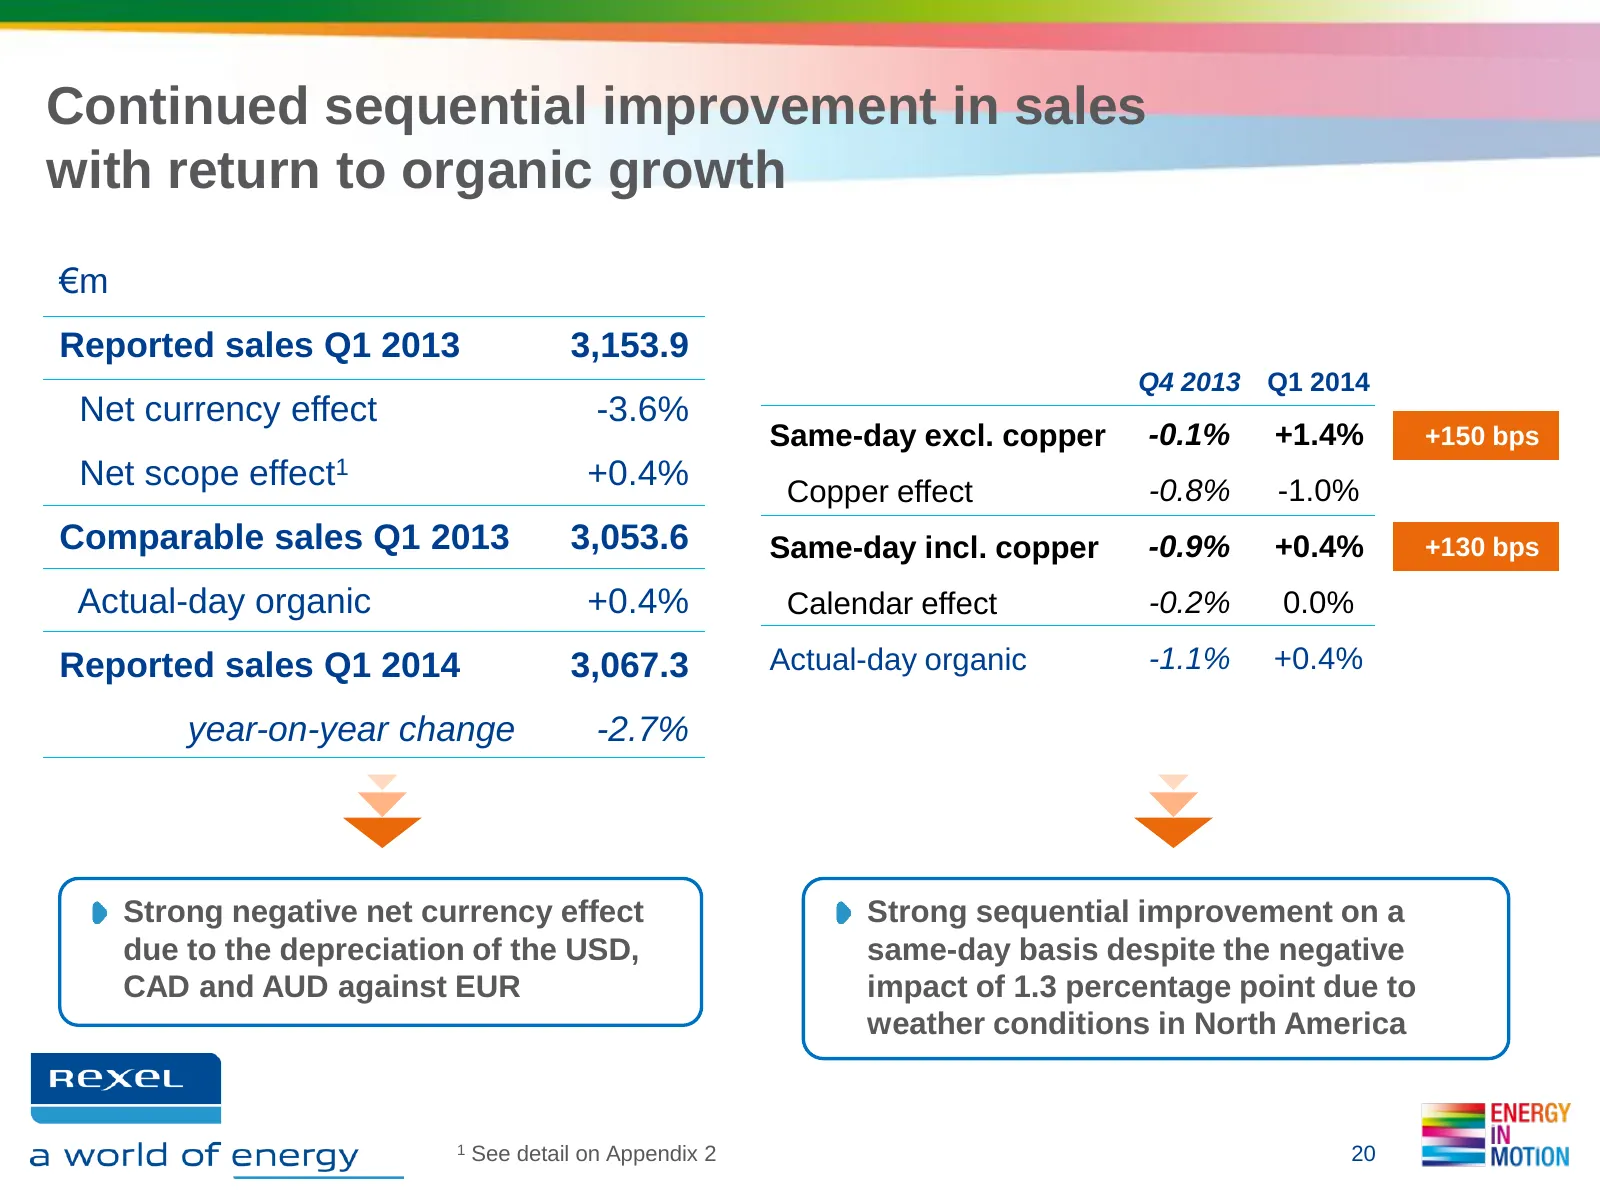
Continued sequential improvement in sales with return to organic growth €m Reported sales Q1 2013 3,153.9 Q4 2013 Q1 2014 Net currency effect -3.6% Same-day excl. copper -0.1% +1.4% +150 bps Net scope effect1 +0.4% Copper effect -0.8% -1.0% Comparable sales Q1 2013 3,053.6 Same-day incl. copper -0.9
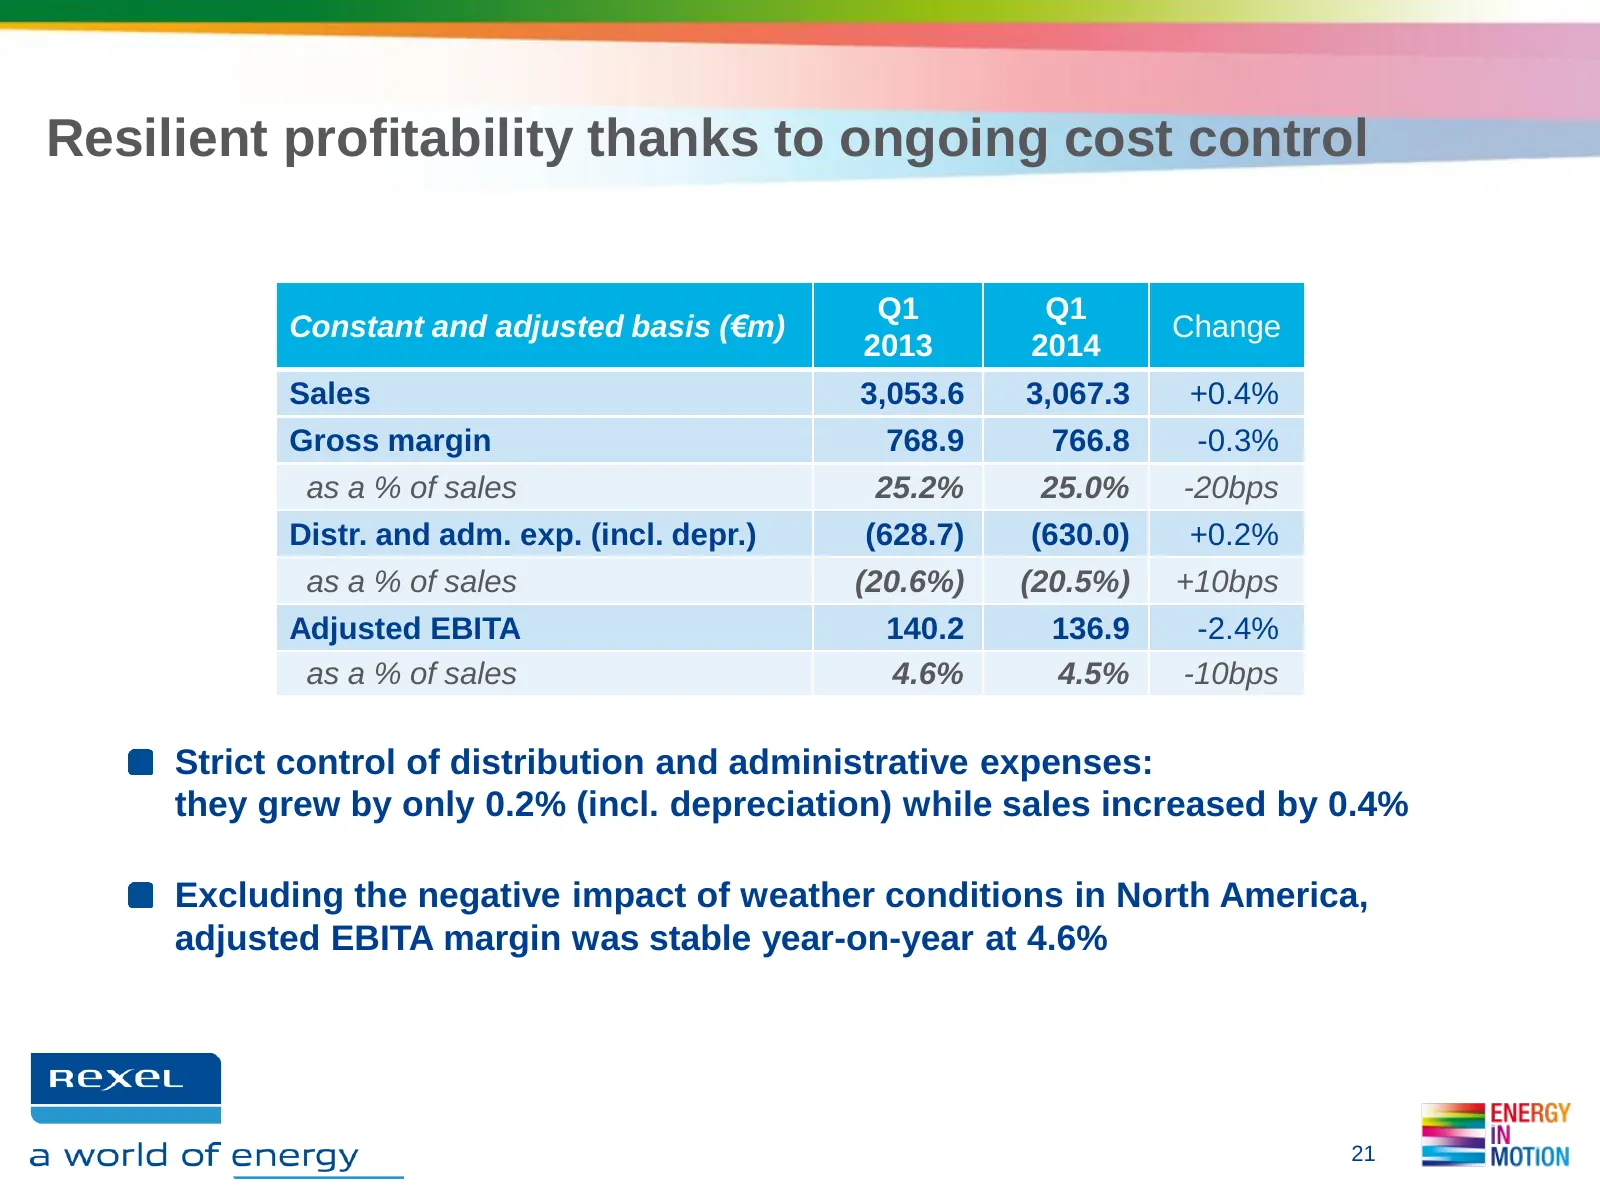
Slide 21: Resilient profitability thanks to ongoing cost control
Resilient profitability thanks to ongoing cost control Q1 Q1 Constant and adjusted basis (€m) Change 2013 2014 Sales 3,053.6 3,067.3 +0.4% Gross margin 768.9 766.8 -0.3% as a % of sales 25.2% 25.0% -20bps Distr. and adm. exp. (incl. depr.) (628.7) (630.0) +0.2% as a % of sales (20.6%) (20.5%) +10bps
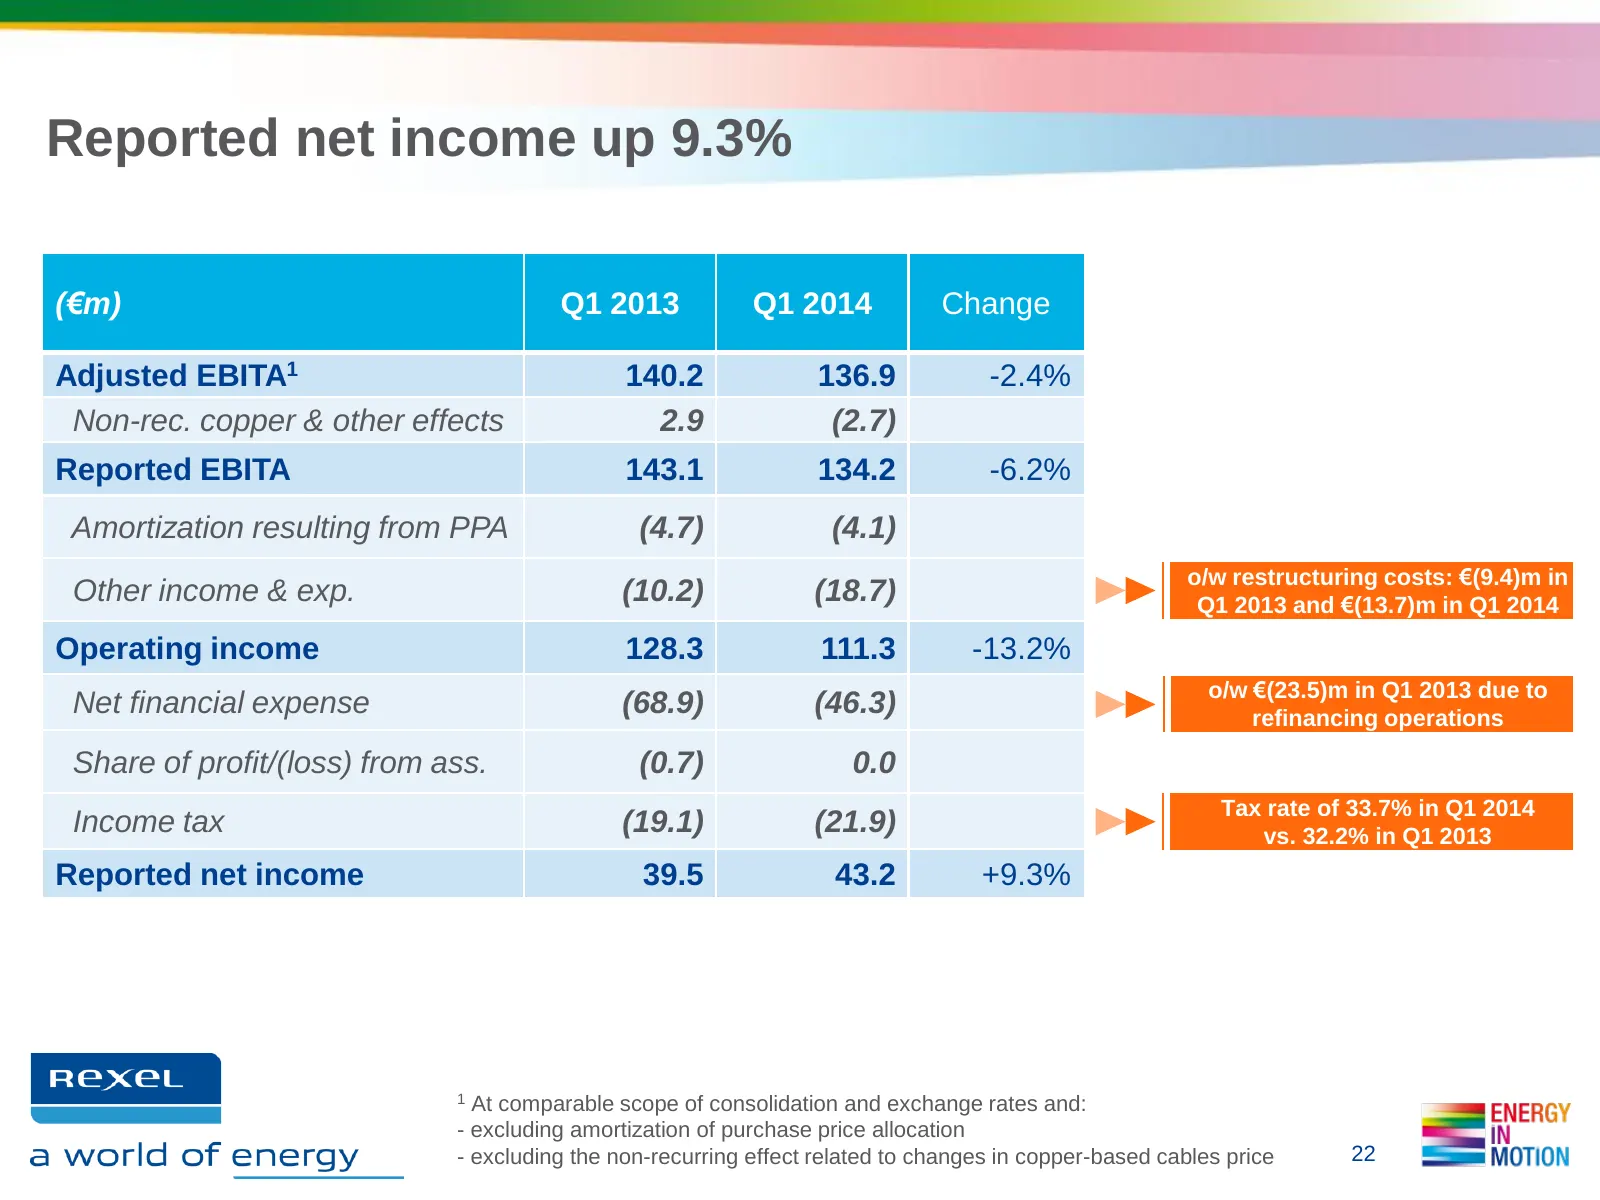
Slide 22: Reported net income up 9.3%
Reported net income up 9.3% (€m) Q1 2013 Q1 2014 Change Adjusted EBITA1 140.2 136.9 -2.4% Non-rec. copper & other effects 2.9 (2.7) Reported EBITA 143.1 134.2 -6.2% Amortization resulting from PPA (4.7) (4.1) o/w restructuring costs: €(9.4)m in Other income & exp. (10.2) (18.7) Q1 2013 and €(13.7)m
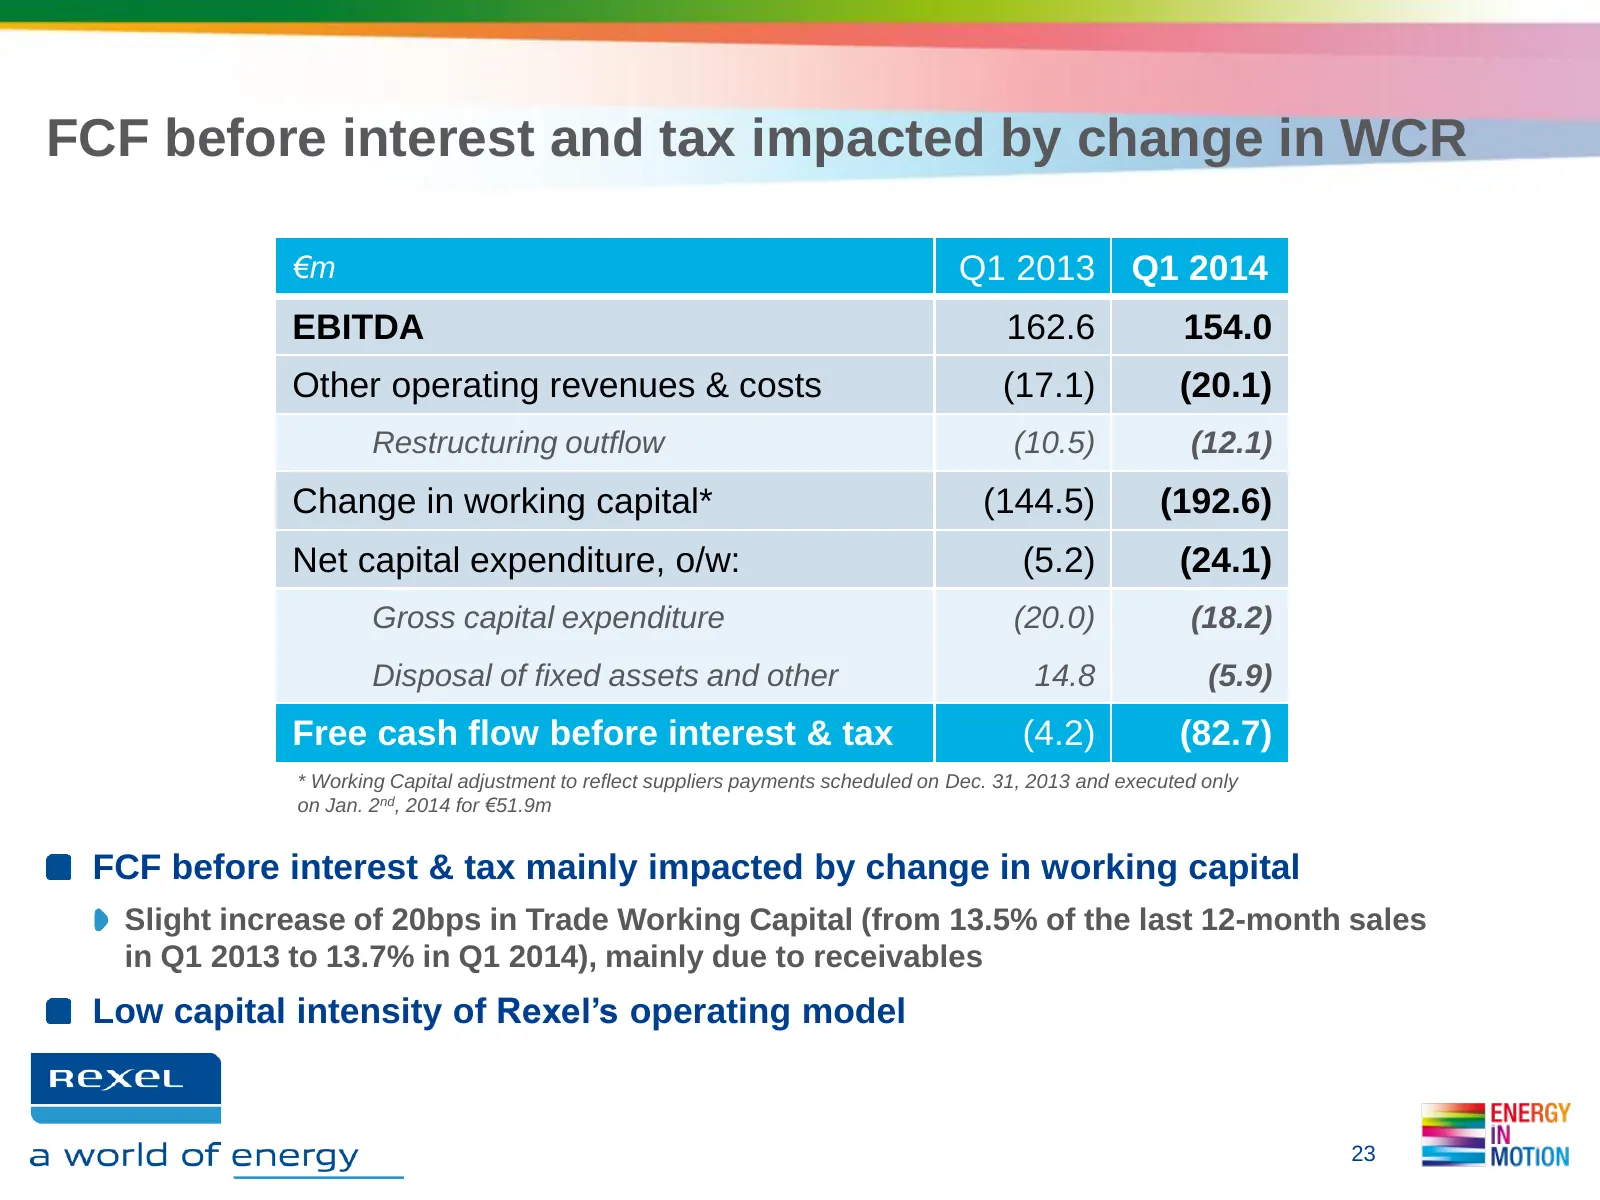
Slide 23: FCF before interest and tax impacted by change in WCR
FCF before interest and tax impacted by change in WCR €m Q1 2013 Q1 2014 EBITDA 162.6 154.0 Other operating revenues & costs (17.1) (20.1) Restructuring outflow (10.5) (12.1) Change in working capital* (144.5) (192.6) Net capital expenditure, o/w: (5.2) (24.1) Gross capital expenditure (20.0) (18.2)
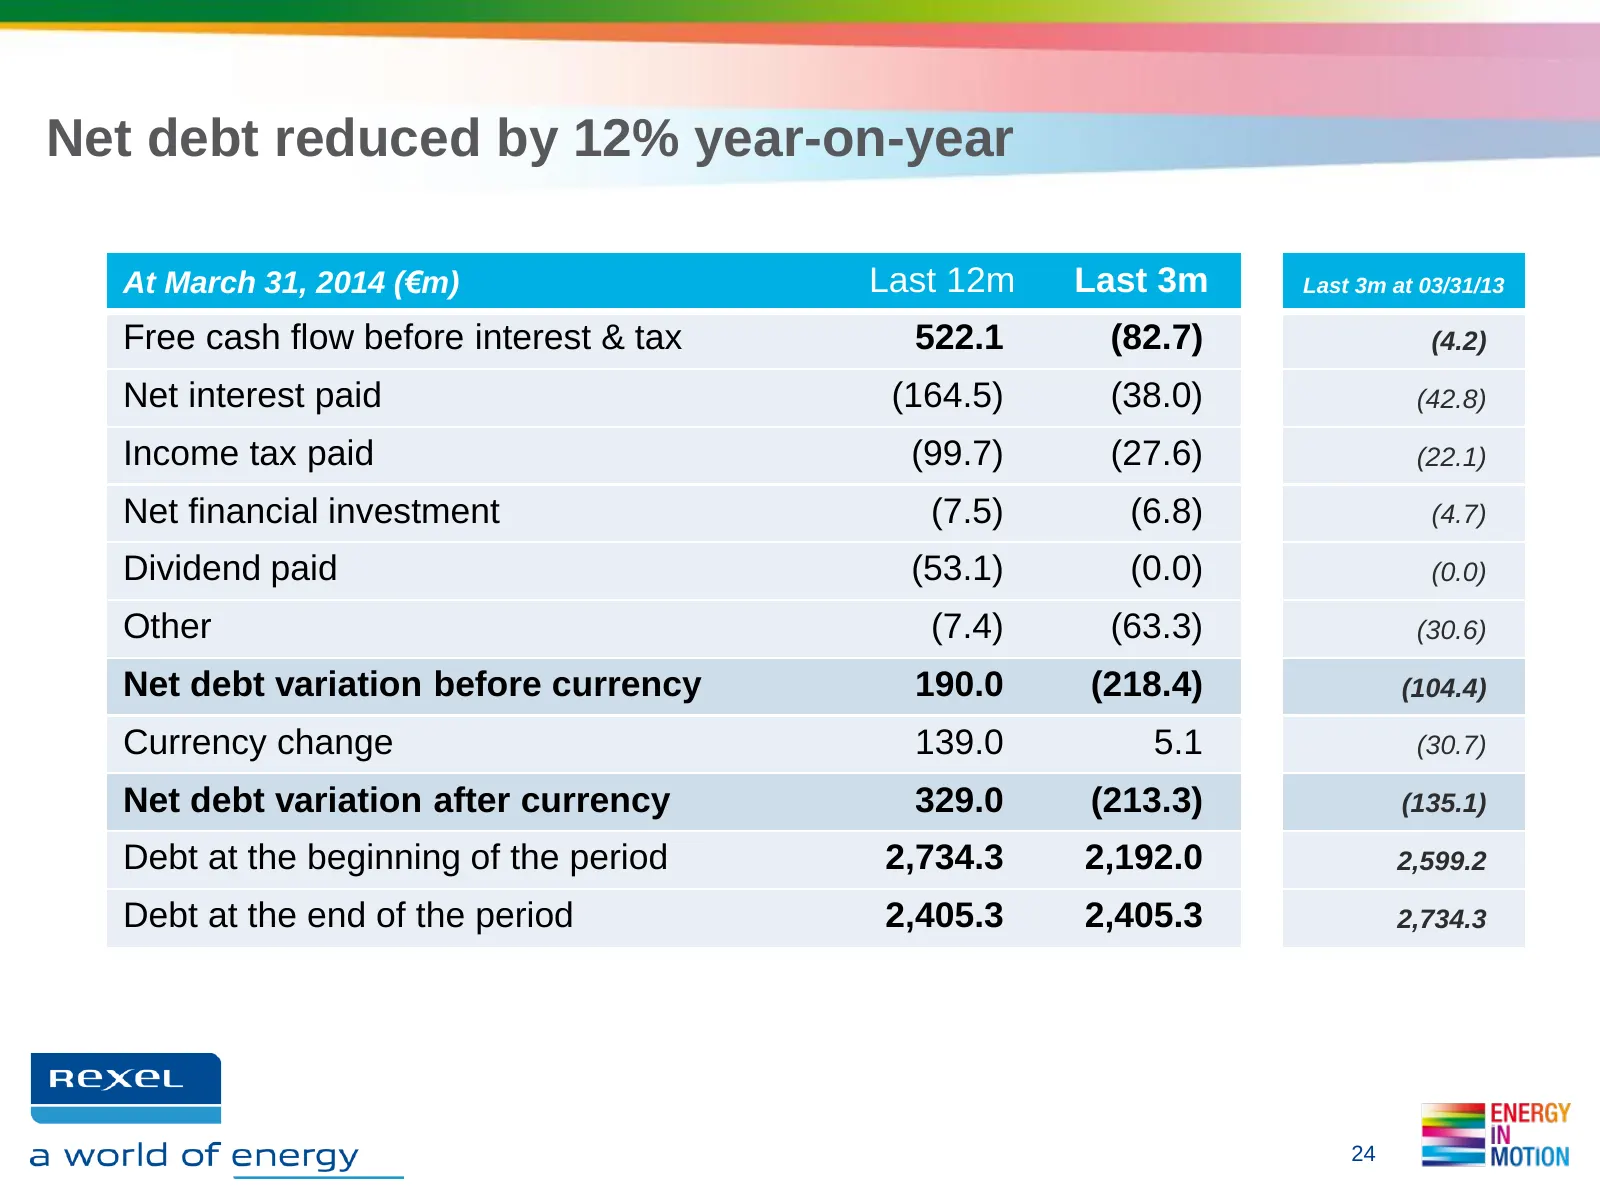
Slide 24: Net debt reduced by 12% year-on-year
Net debt reduced by 12% year-on-year At March 31, 2014 (€m) Last 12m Last 3m Last 3m at 03/31/13 Free cash flow before interest & tax 522.1 (82.7) (4.2) Net interest paid (164.5) (38.0) (42.8) Income tax paid (99.7) (27.6) (22.1) Net financial investment (7.5) (6.8) (4.7) Dividend paid (53.1) (0.0)
Slide 25: Sound financial structure
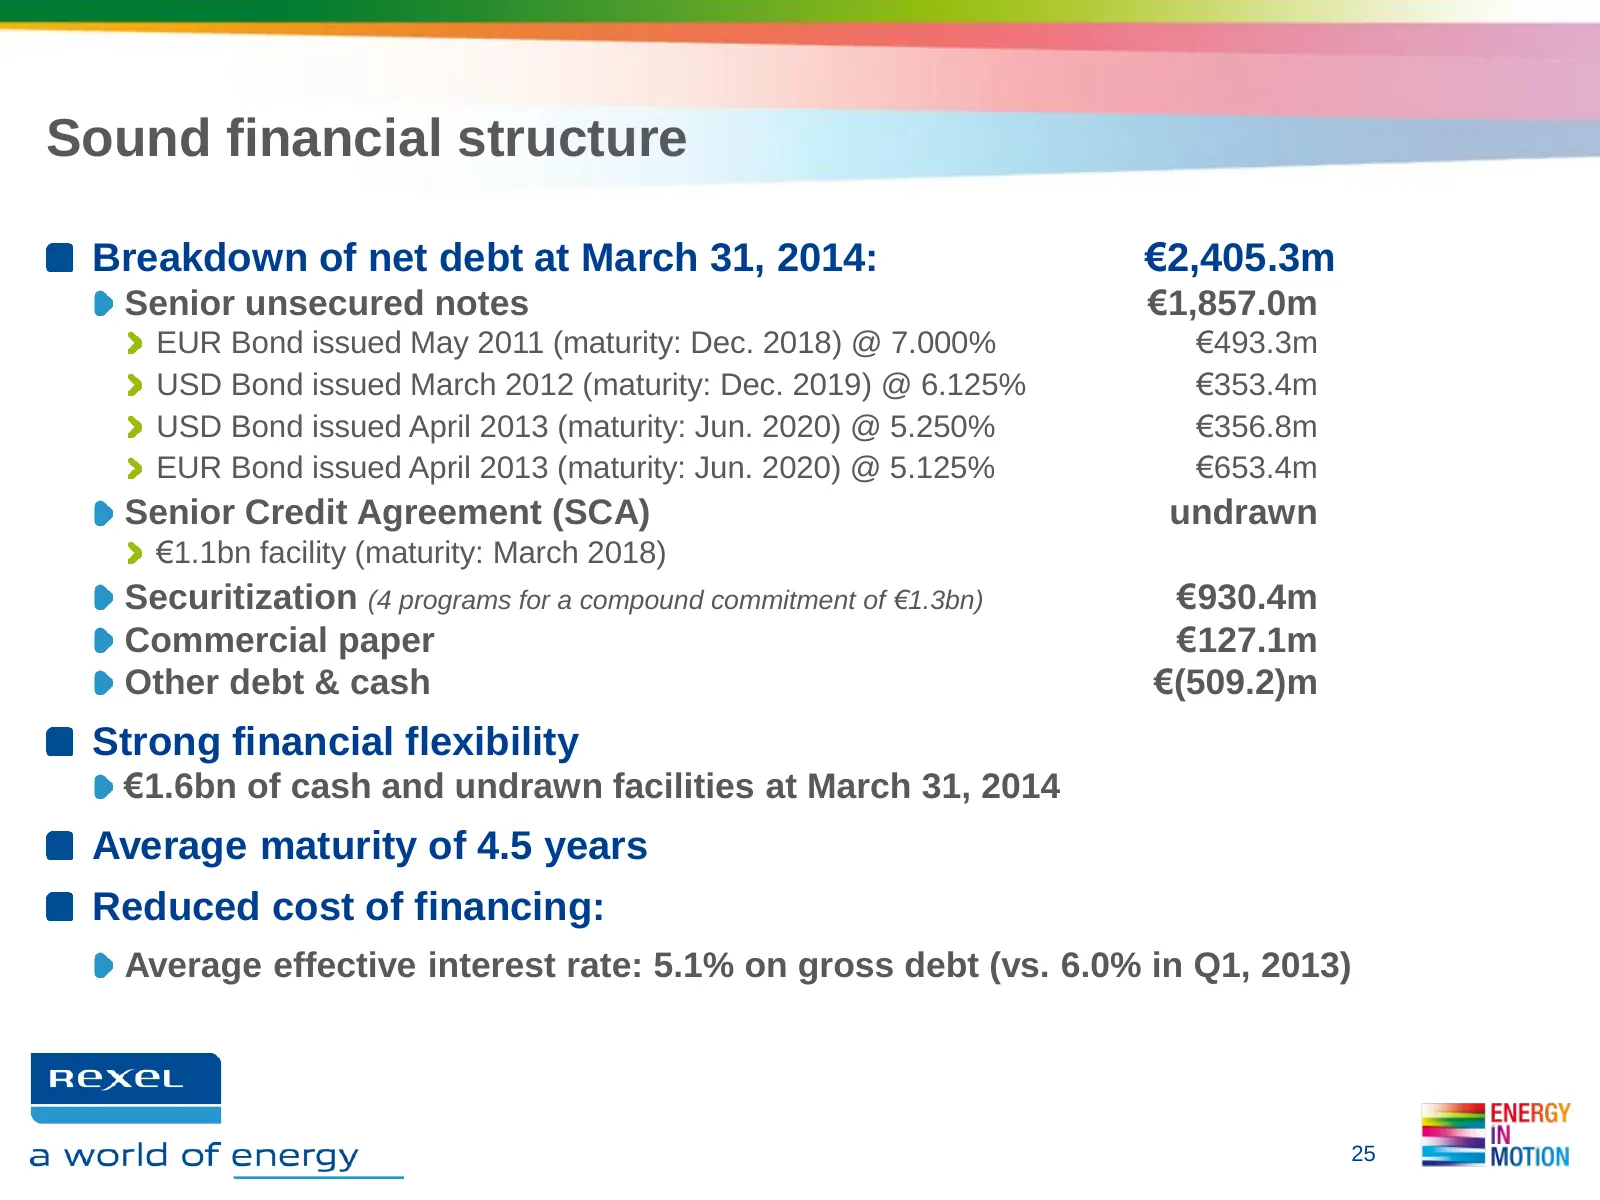
Sound financial structure Breakdown of net debt at March 31, 2014: €2,405.3m Senior unsecured notes €1,857.0m EUR Bond issued May 2011 (maturity: Dec. 2018) @ 7.000% €493.3m USD Bond issued March 2012 (maturity: Dec. 2019) @ 6.125% €353.4m USD Bond issued April 2013 (maturity: Jun. 2020) @ 5.250% €3
Slide 26: 2014 full-year targets confirmed
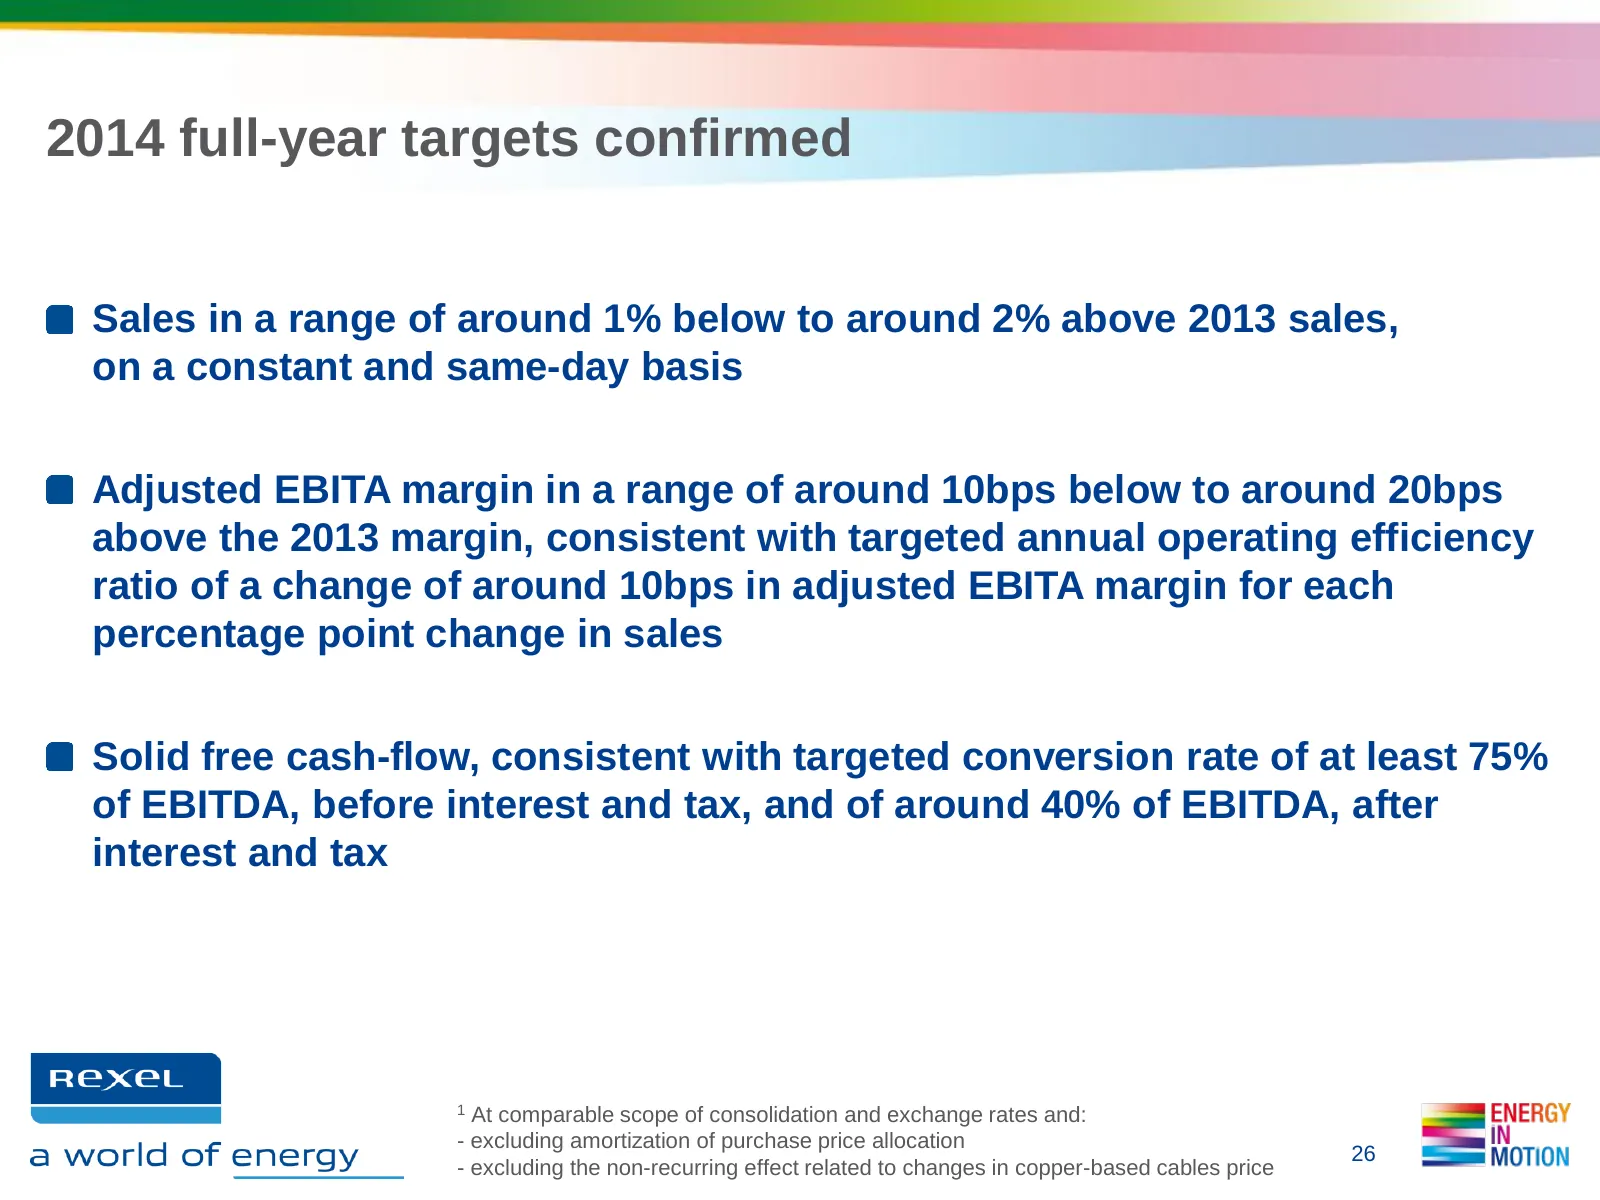
2014 full-year targets confirmed Sales in a range of around 1% below to around 2% above 2013 sales, on a constant and same-day basis Adjusted EBITA margin in a range of around 10bps below to around 20bps above the 2013 margin, consistent with targeted annual operating efficiency ratio of a change of
Slide 27: Appendices
3 » APPENDICES Rexeu. as a world of energy
Slide 28: Appendix 1: Segment reporting - Group
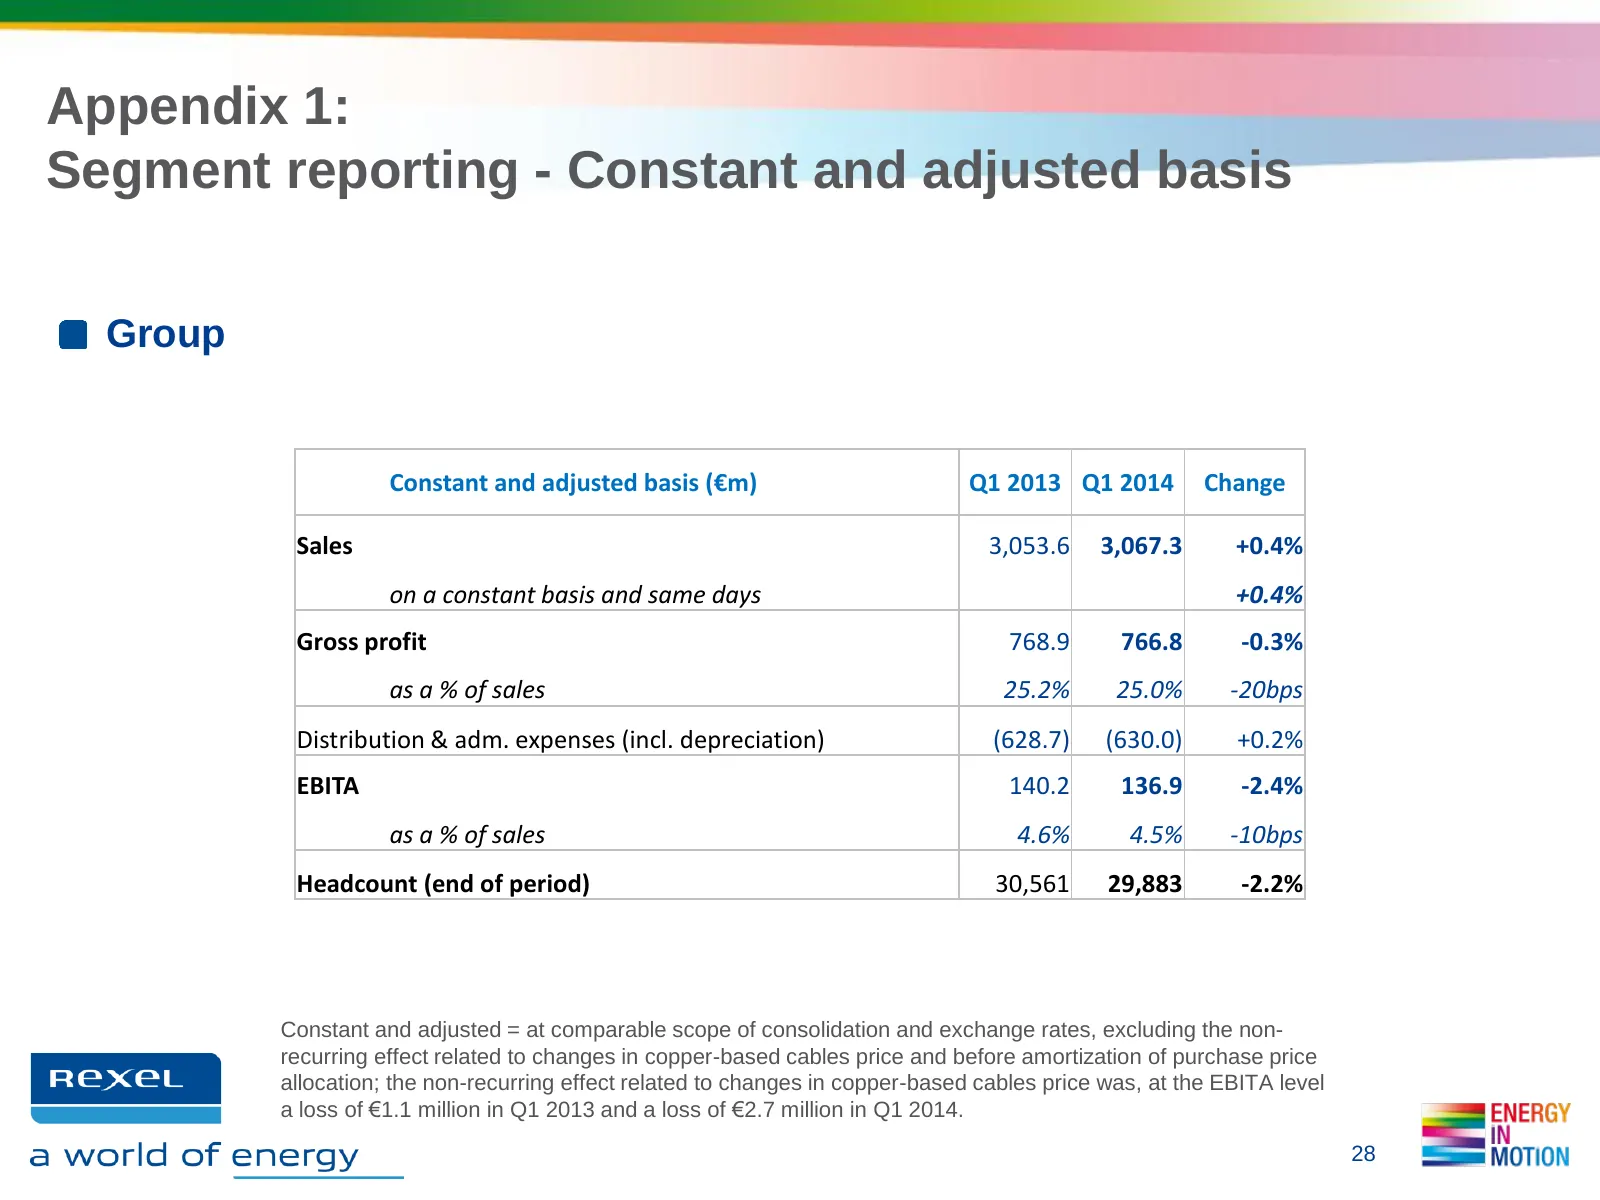
Appendix 1: Segment reporting - Constant and adjusted basis Group Constant and adjusted basis (€m) Q1 2013 Q1 2014 Change Sales 3,053.6 3,067.3 +0.4% on a constant basis and same days +0.4% Gross profit 768.9 766.8 -0.3% as a % of sales 25.2% 25.0% -20bps Distribution & adm. expenses (incl. deprecia
Slide 29: Appendix 1: Segment reporting - Europe
Appendix 1: Segment reporting - Constant and adjusted basis Europe Constant and adjusted basis (€m) Q1 2013 Q1 2014 Change Sales 1,724.6 1,759.4 +2.0% on a constant basis and same days +1.6% o/w France 613.5 611.3 -0.4% on a constant basis and same days -0.4% United Kingdom 245.3 251.2 +2.4% on a co
Slide 30: Appendix 1: Segment reporting - North America
Appendix 1: Segment reporting - Constant and adjusted basis North America Constant and adjusted basis (€m) Q1 2013 Q1 2014 Change Sales 1,006.9 972.0 -3.5% on a constant basis and same days -2.7% o/w United States 745.9 720.4 -3.4% on a constant basis and same days -1.9% Canada 261.0 251.6 -3.6% on
Slide 31: Appendix 1: Segment reporting - Asia-Pacific
Appendix 1: Segment reporting - Constant and adjusted basis Asia-Pacific Constant and adjusted basis (€m) Q1 2013 Q1 2014 Change Sales 261.5 272.9 +4.4% on a constant basis and same days +3.8% o/w China 69.1 85.6 +23.9% on a constant basis and same days +25.9% Australia 130.9 123.4 -5.7% on a consta
Slide 32: Appendix 1: Segment reporting - Latin America
Appendix 1: Segment reporting - Constant and adjusted basis Latin America Constant and adjusted basis (€m) Q1 2013 Q1 2014 Change Sales 60.6 62.9 +3.8% on a constant basis and same days +3.0% o/w Brazil 37.3 36.3 -2.7% on a constant basis and same days -2.7% Chile 18.0 21.0 +16.6% on a constant basi
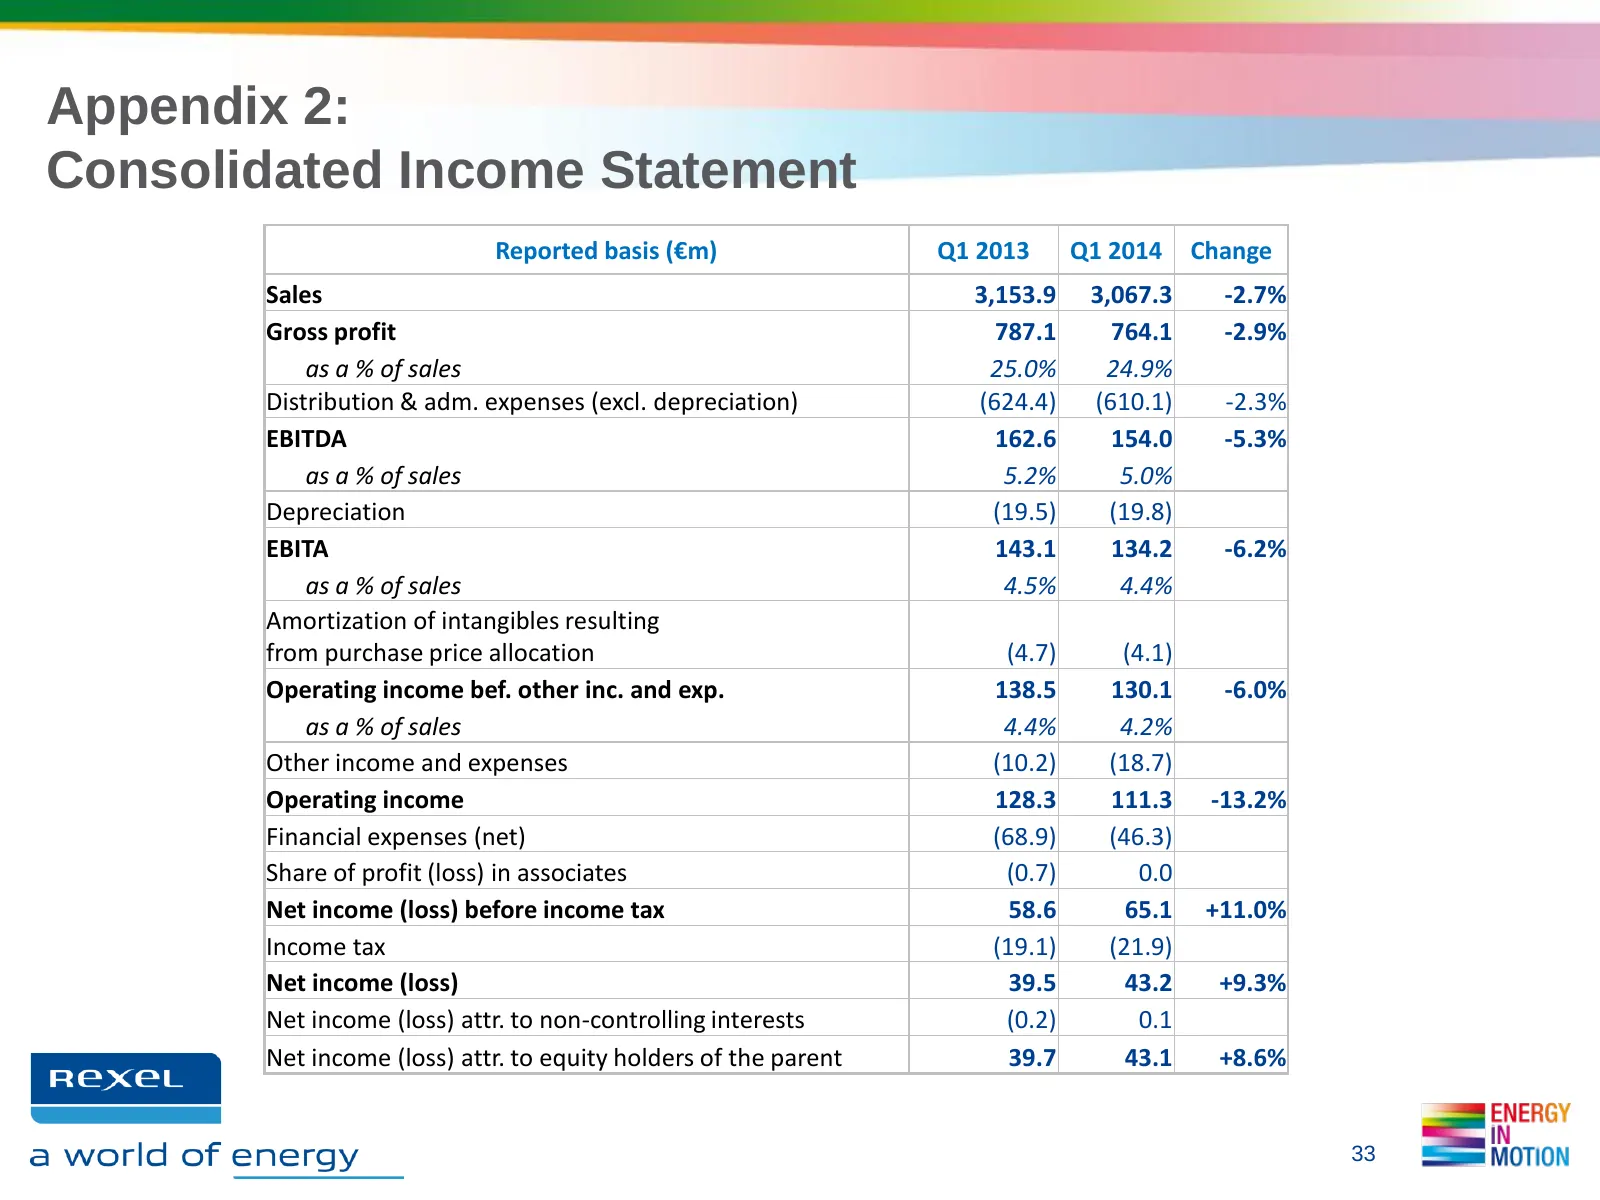
Slide 33: Appendix 2: Consolidated Income Statement
Appendix 2: Consolidated Income Statement Reported basis (€m) Q1 2013 Q1 2014 Change Sales 3,153.9 3,067.3 -2.7% Gross profit 787.1 764.1 -2.9% as a % of sales 25.0% 24.9% Distribution & adm. expenses (excl. depreciation) (624.4) (610.1) -2.3% EBITDA 162.6 154.0 -5.3% as a % of sales 5.2% 5.0% Depre
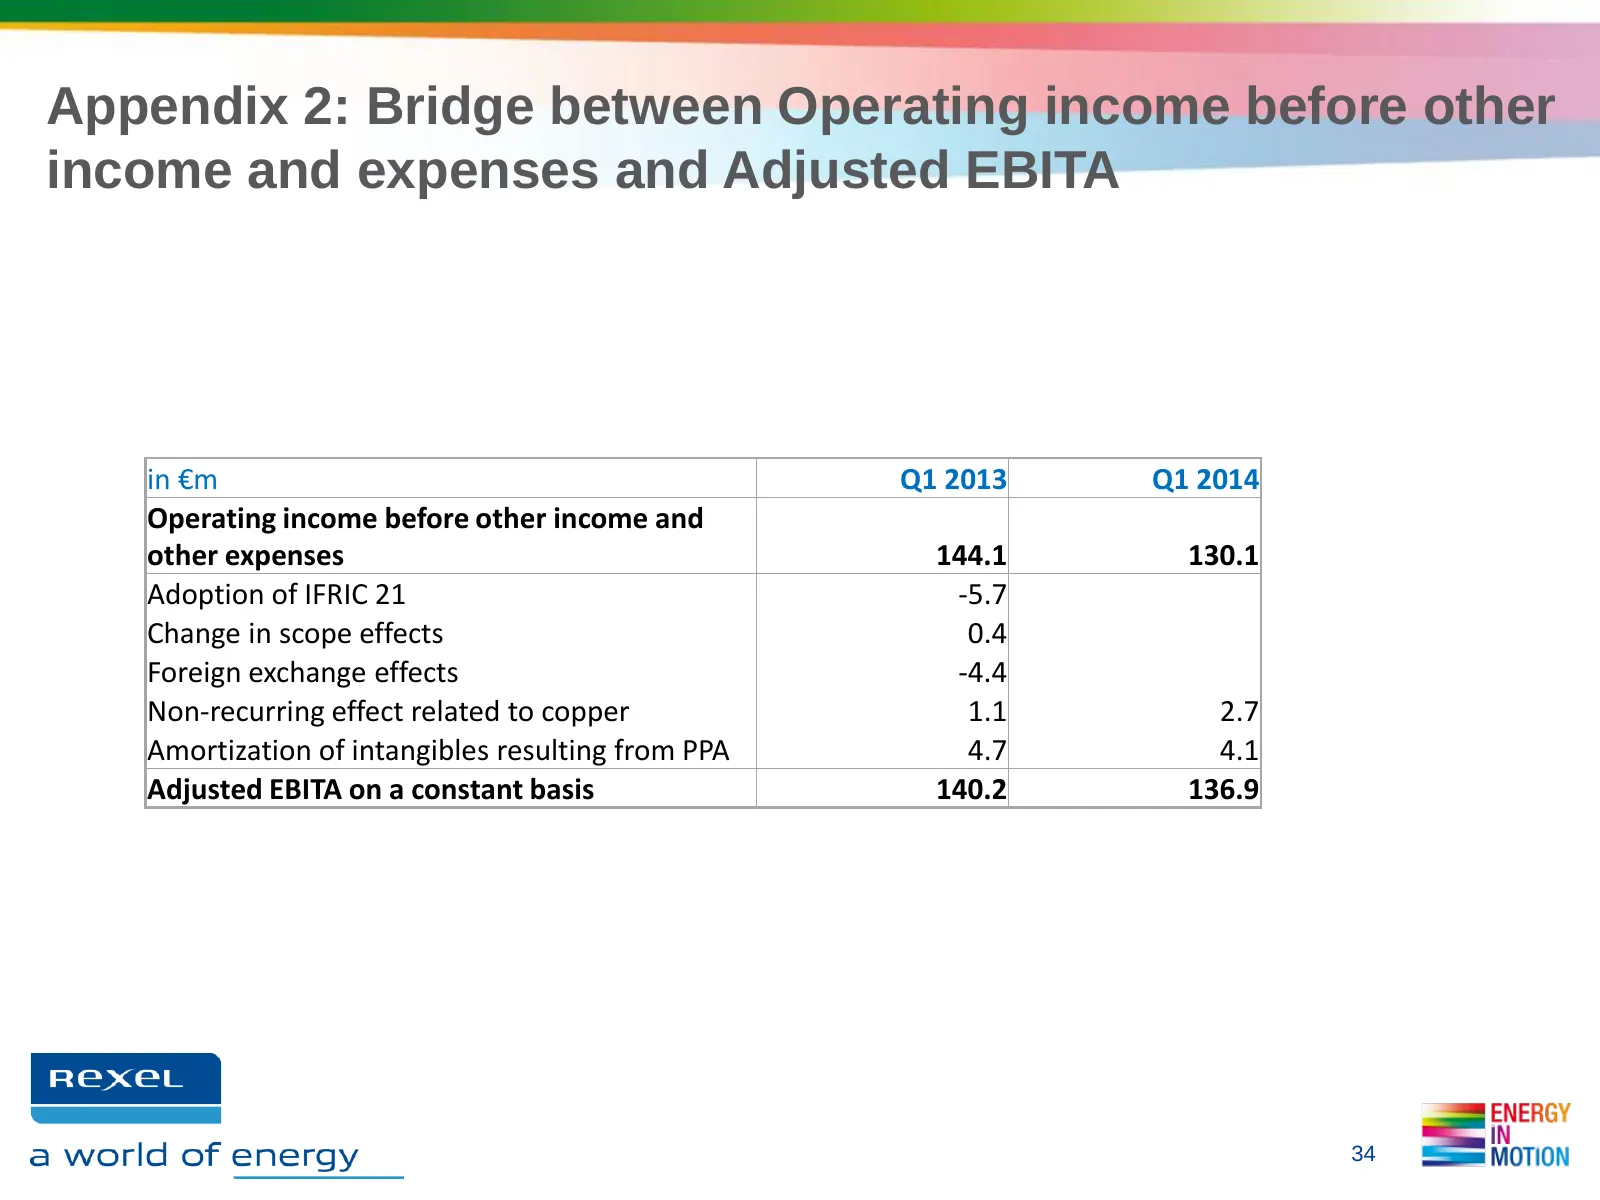
Slide 34: Appendix 2: Bridge to Adjusted EBITA
Appendix 2: Bridge between Operating income before other income and expenses and Adjusted EBITA in €m Q1 2013 Q1 2014 Operating income before other income and other expenses 144.1 130.1 Adoption of IFRIC 21 -5.7 Change in scope effects 0.4 Foreign exchange effects -4.4 Non-recurring effect related t
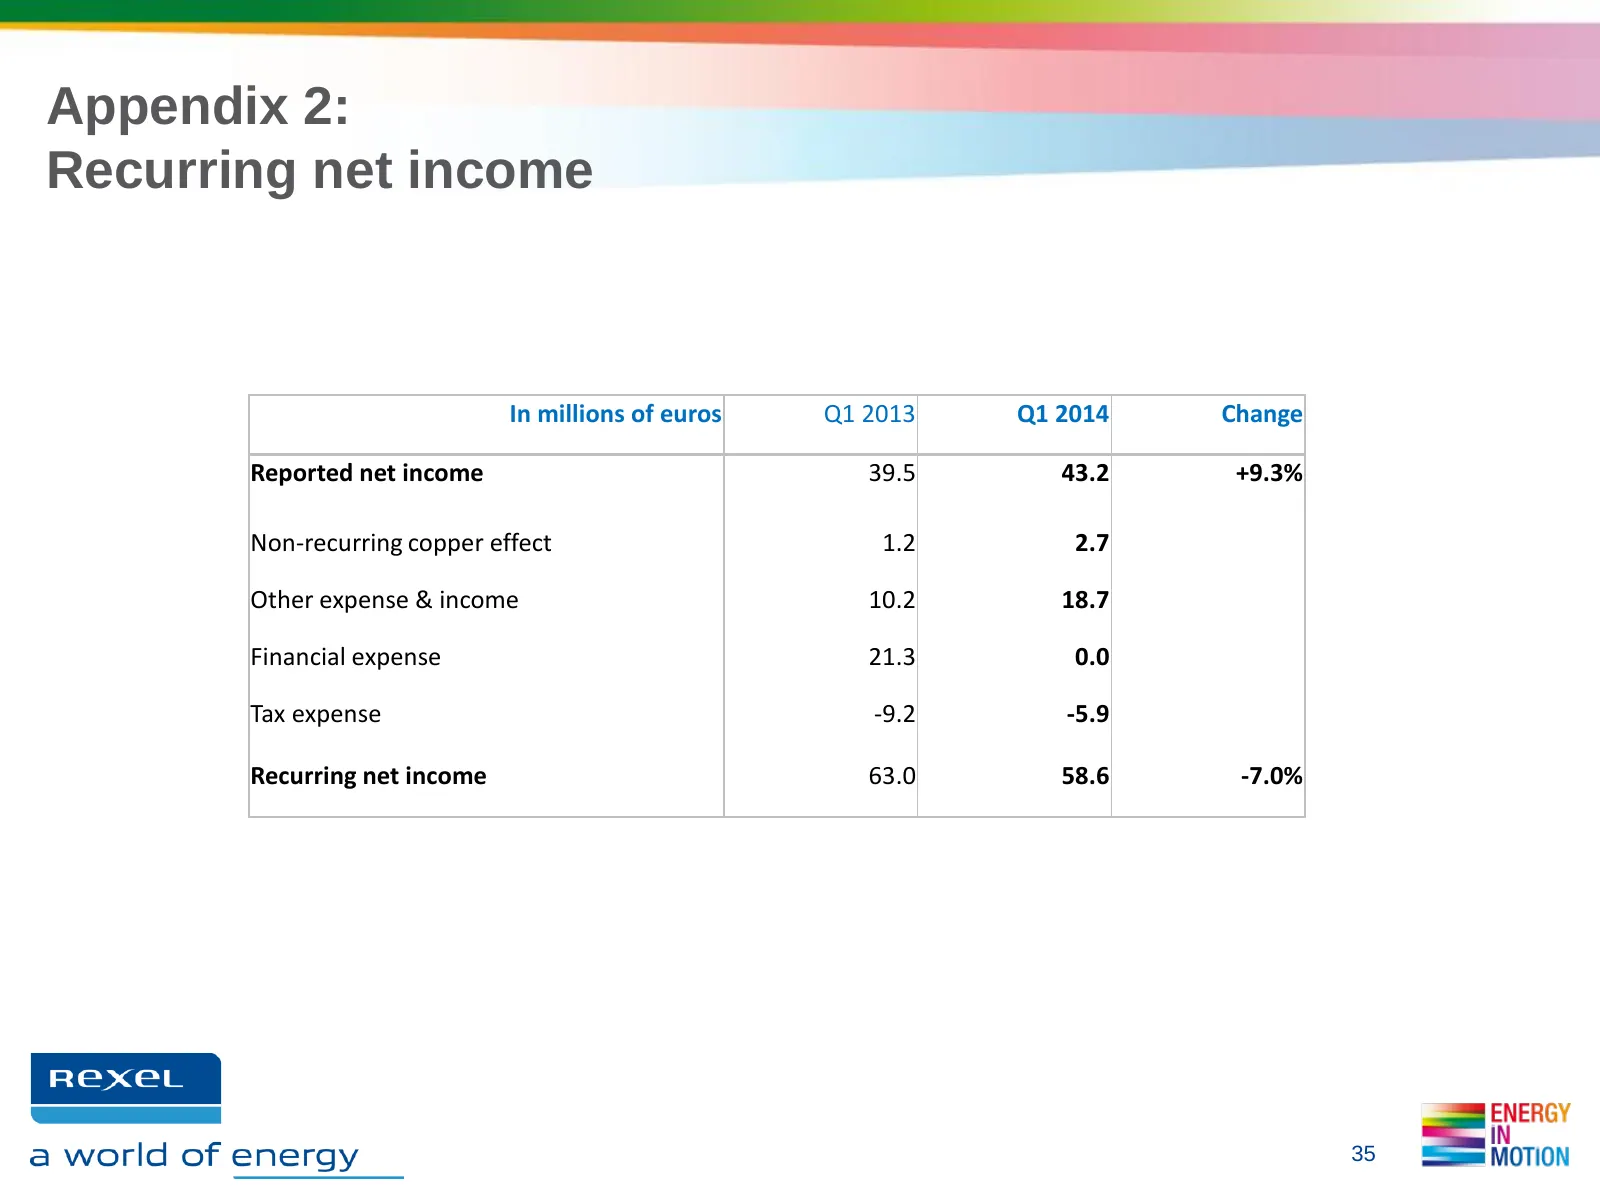
Slide 35: Appendix 2: Recurring net income
Appendix 2: Recurring net income In millions of euros Q1 2013 Q1 2014 Change Reported net income 39.5 43.2 +9.3% Non-recurring copper effect 1.2 2.7 Other expense & income 10.2 18.7 Financial expense 21.3 0.0 Tax expense -9.2 -5.9 Recurring net income 63.0 58.6 -7.0% 35
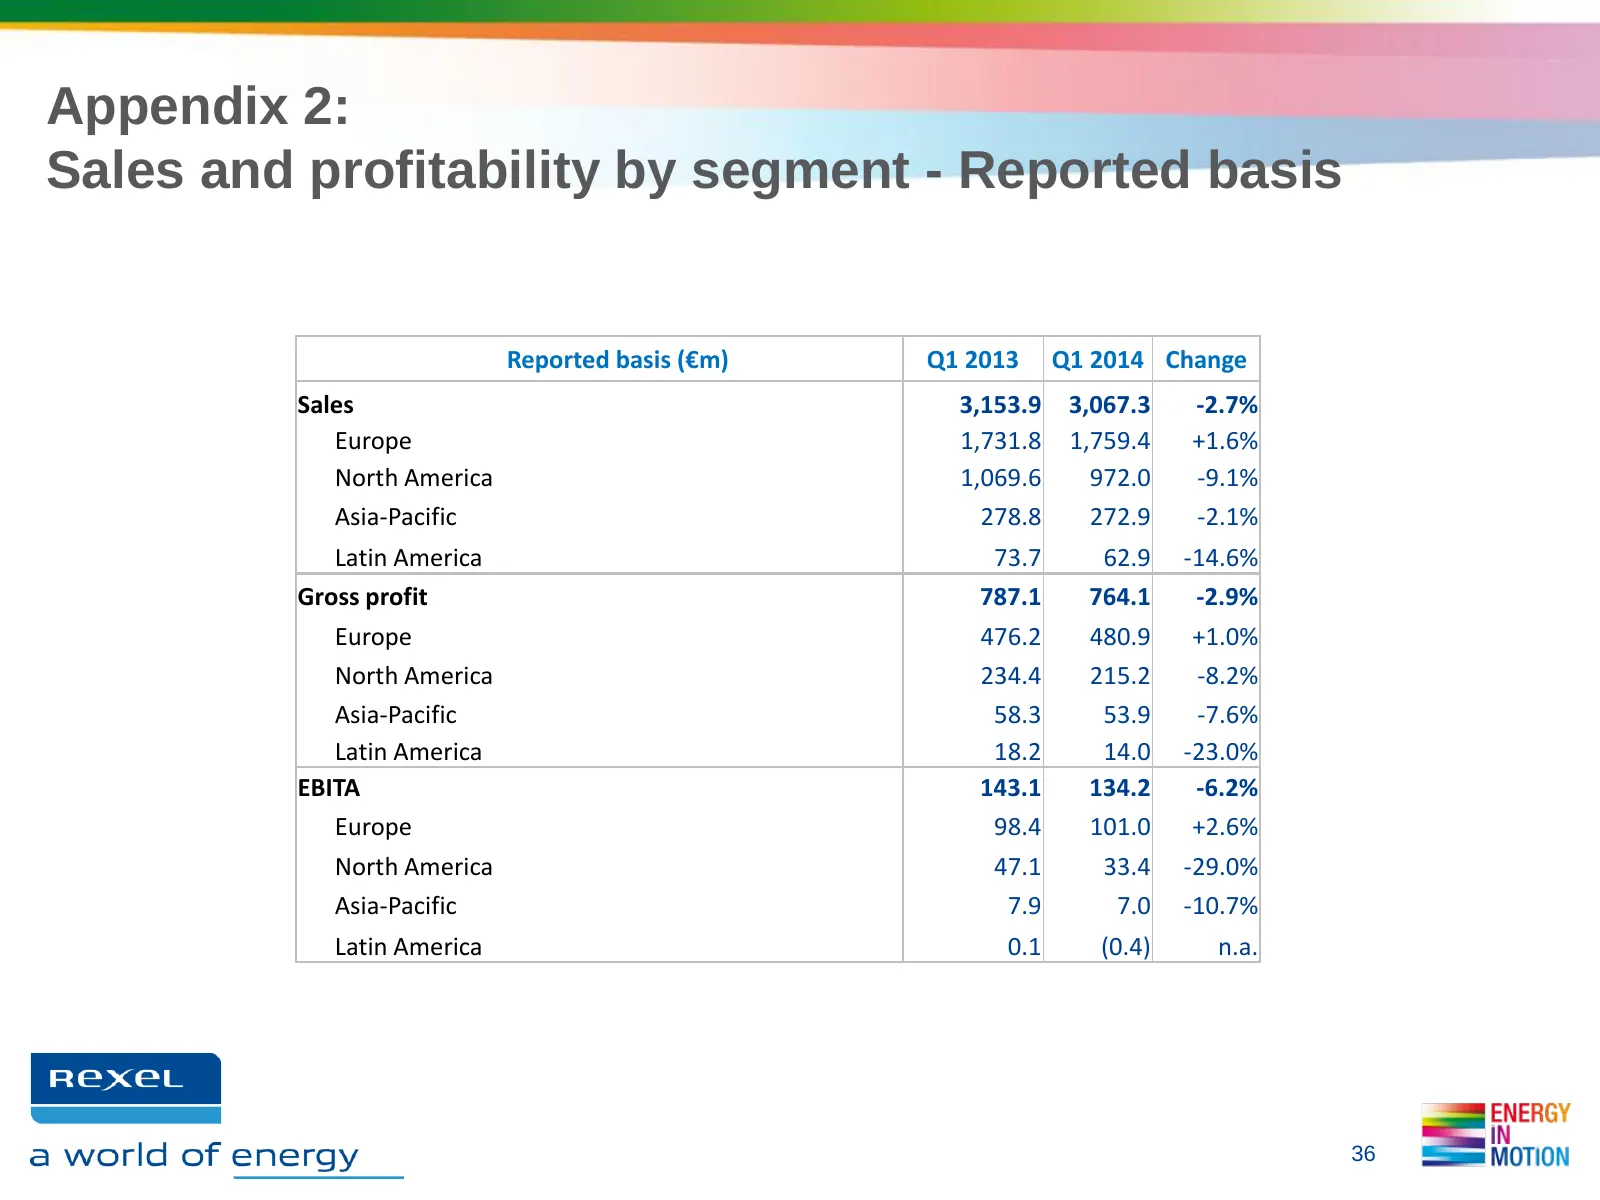
Slide 36: Appendix 2: Sales and profitability by segment - Reported basis
Appendix 2: Sales and profitability by segment - Reported basis Reported basis (€m) Q1 2013 Q1 2014 Change Sales 3,153.9 3,067.3 -2.7% Europe 1,731.8 1,759.4 +1.6% North America 1,069.6 972.0 -9.1% Asia-Pacific 278.8 272.9 -2.1% Latin America 73.7 62.9 -14.6% Gross profit 787.1 764.1 -2.9% Europe 47
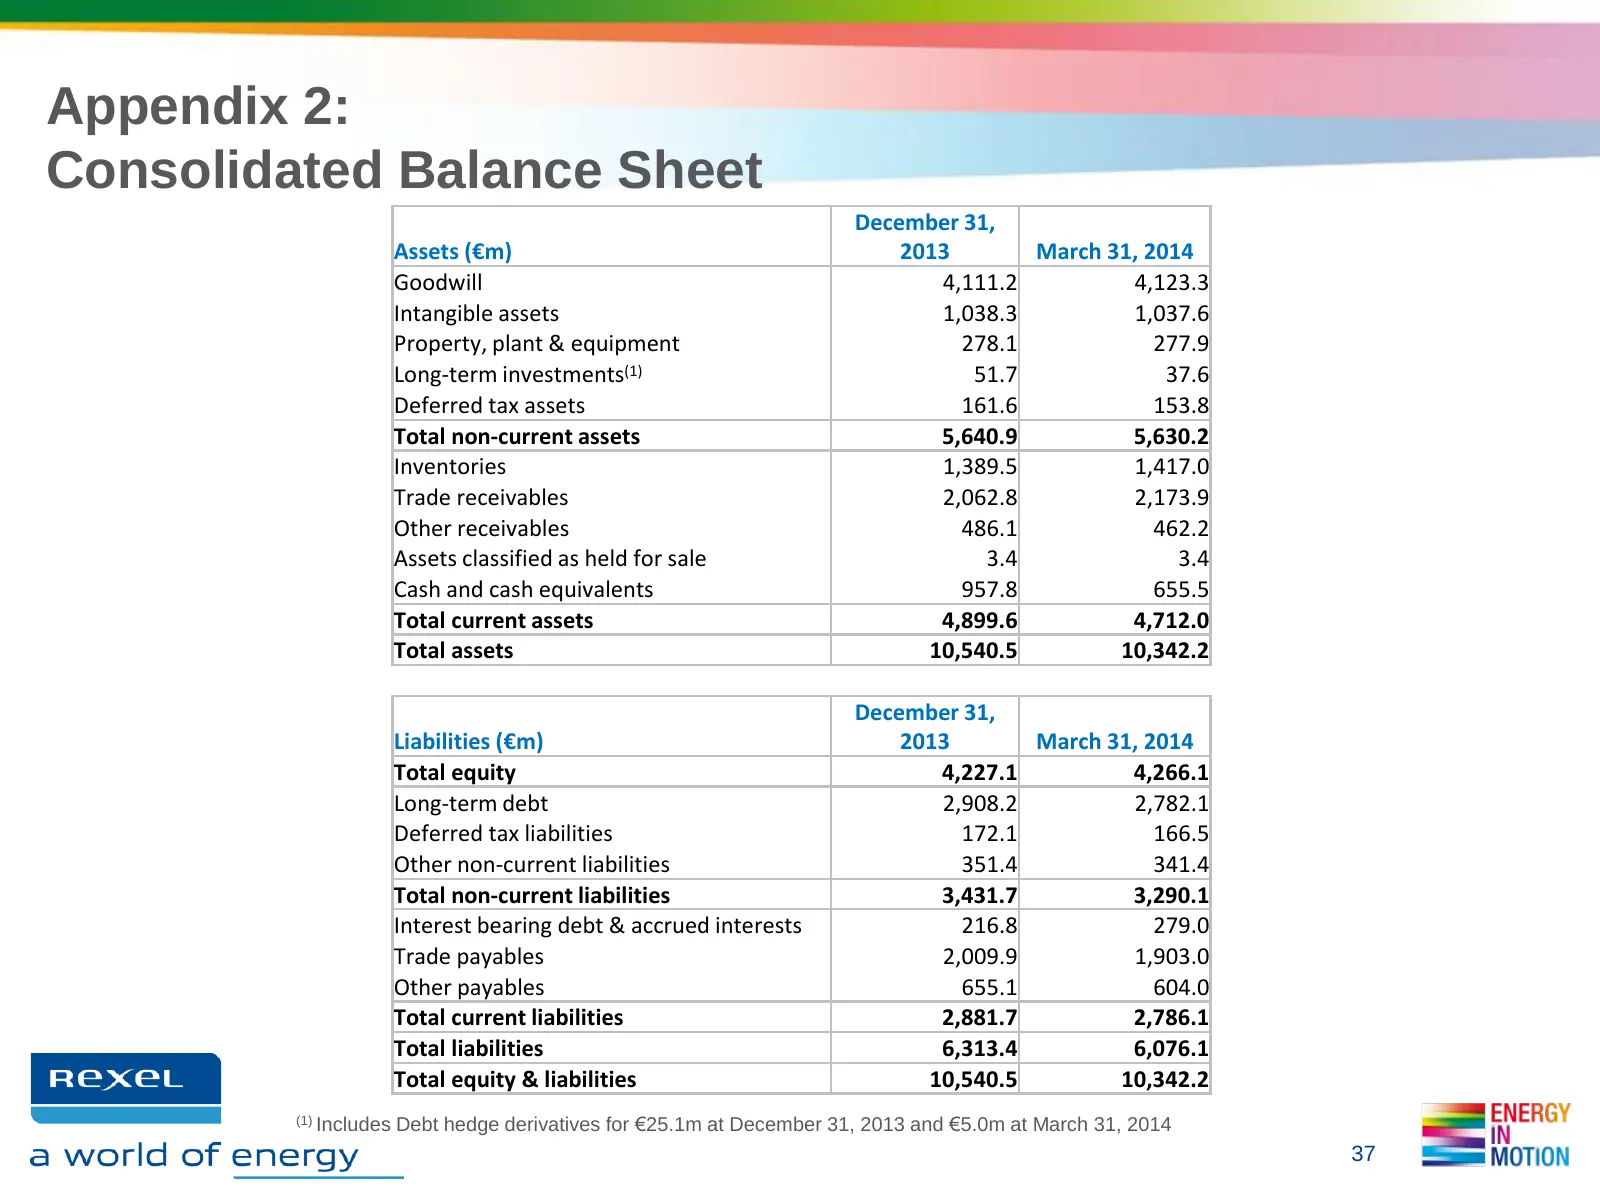
Slide 37: Appendix 2: Consolidated Balance Sheet
Appendix 2: Consolidated Balance Sheet December 31, Assets (€m) 2013 March 31, 2014 Goodwill 4,111.2 4,123.3 Intangible assets 1,038.3 1,037.6 Property, plant & equipment 278.1 277.9 Long-term investments(1) 51.7 37.6 Deferred tax assets 161.6 153.8 Total non-current assets 5,640.9 5,630.2 Inventori
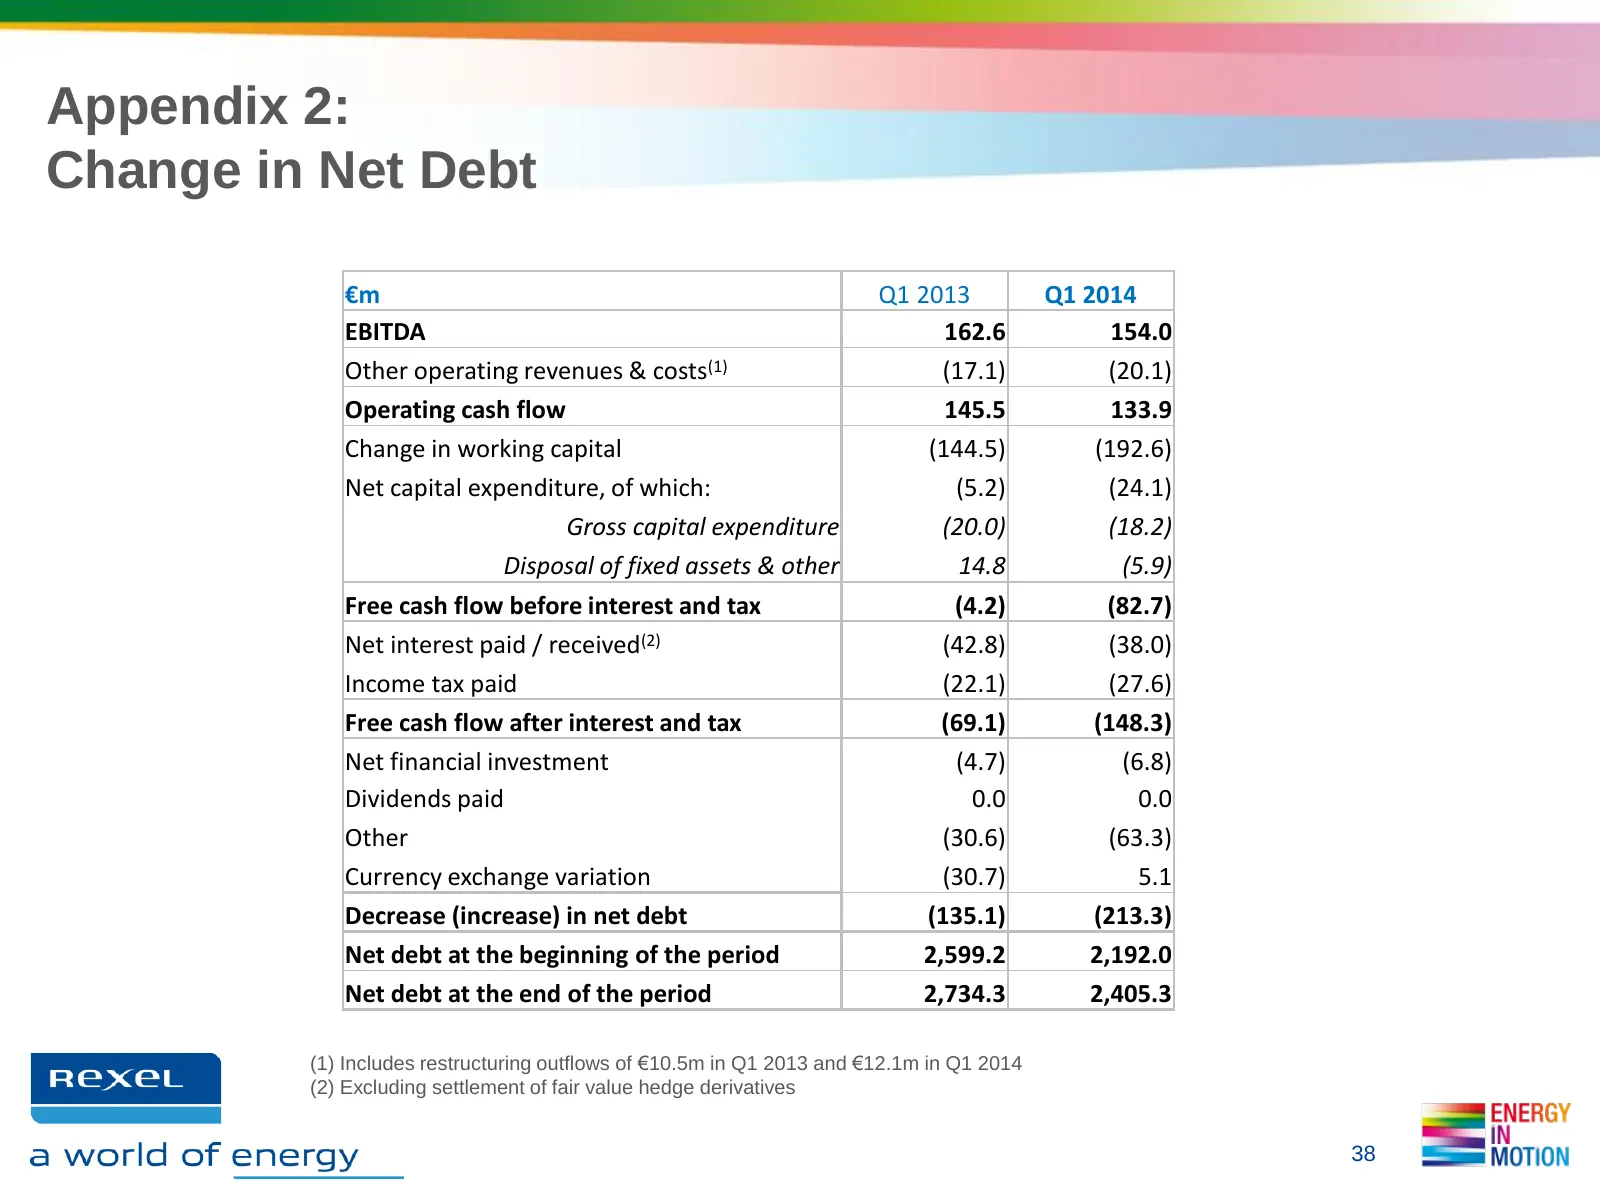
Slide 38: Appendix 2: Change in Net Debt
Appendix 2: Change in Net Debt €m Q1 2013 Q1 2014 EBITDA 162.6 154.0 Other operating revenues & costs(1) (17.1) (20.1) Operating cash flow 145.5 133.9 Change in working capital (144.5) (192.6) Net capital expenditure, of which: (5.2) (24.1) Gross capital expenditure (20.0) (18.2) Disposal of fixed a
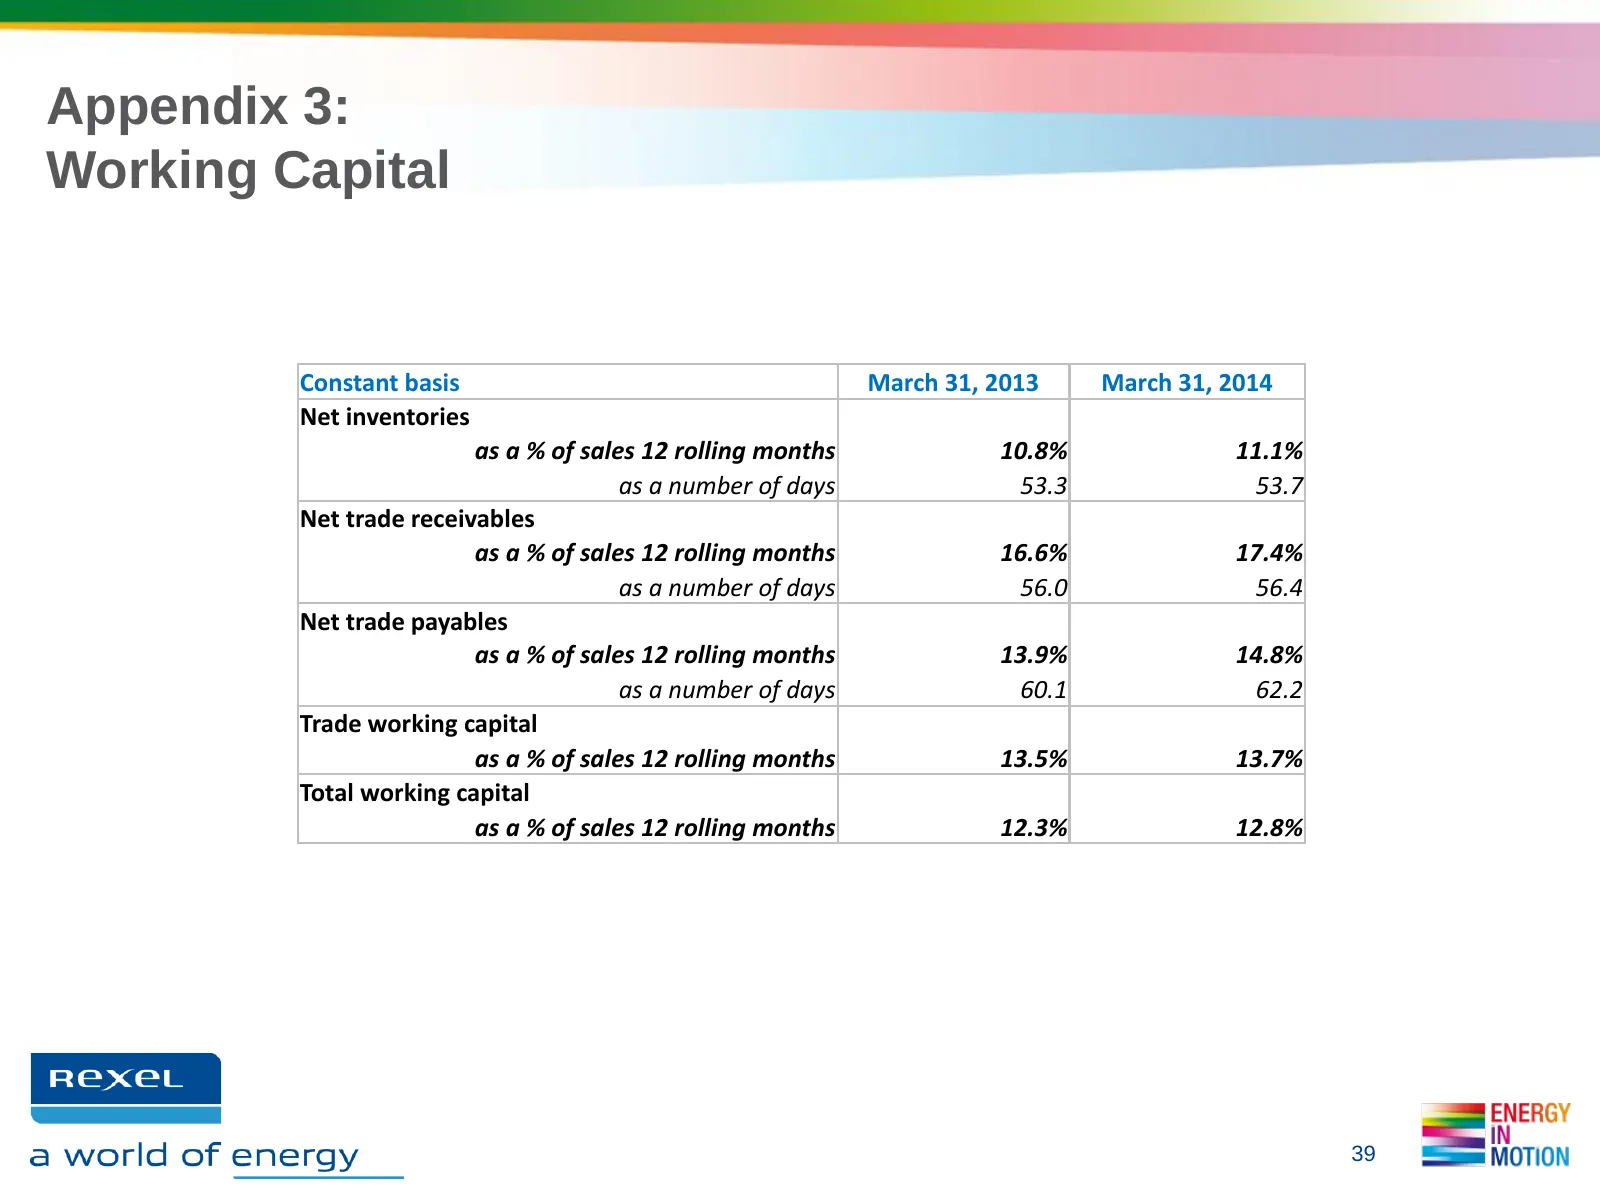
Slide 39: Appendix 3: Working Capital
Appendix 3: Working Capital Constant basis March 31, 2013 March 31, 2014 Net inventories as a % of sales 12 rolling months 10.8% 11.1% as a number of days 53.3 53.7 Net trade receivables as a % of sales 12 rolling months 16.6% 17.4% as a number of days 56.0 56.4 Net trade payables as a % of sales 12
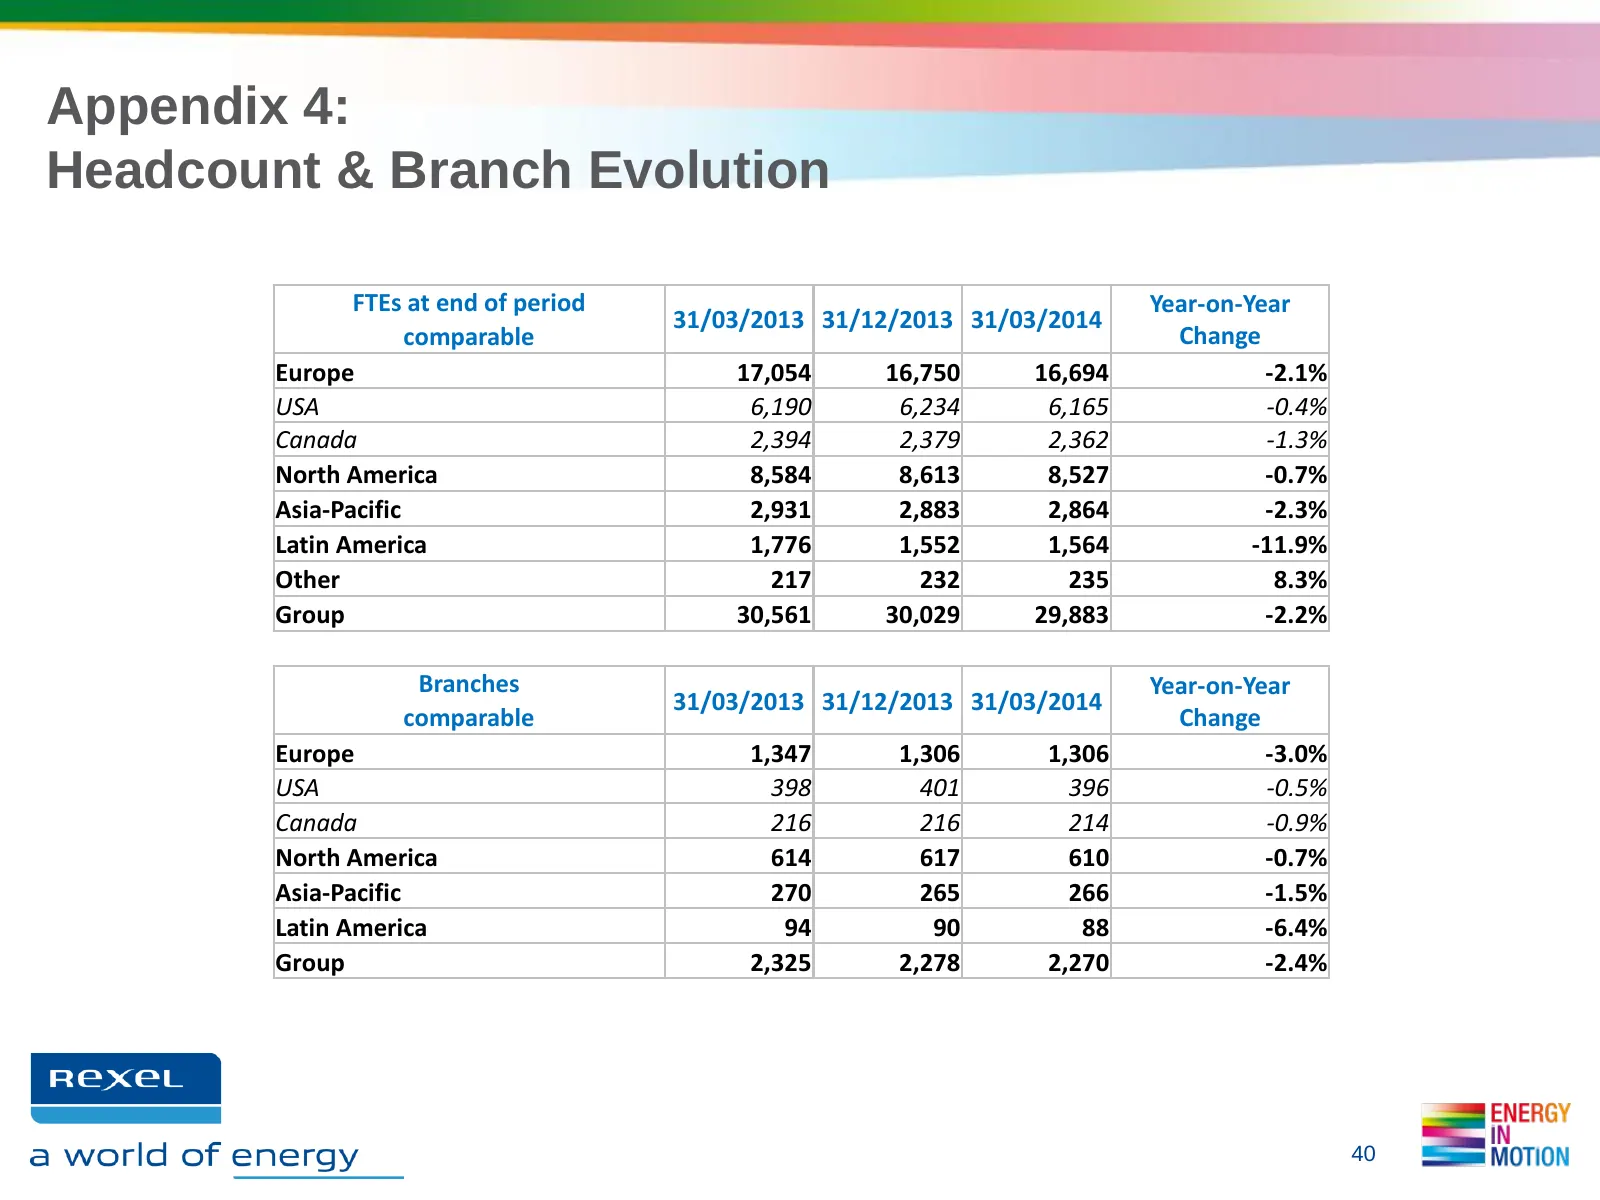
Slide 40: Appendix 4: Headcount & Branch Evolution
Appendix 4: Headcount & Branch Evolution FTEs at end of period Year-on-Year 31/03/2013 31/12/2013 31/03/2014 comparable Change Europe 17,054 16,750 16,694 -2.1% USA 6,190 6,234 6,165 -0.4% Canada 2,394 2,379 2,362 -1.3% North America 8,584 8,613 8,527 -0.7% Asia-Pacific 2,931 2,883 2,864 -2.3% Latin
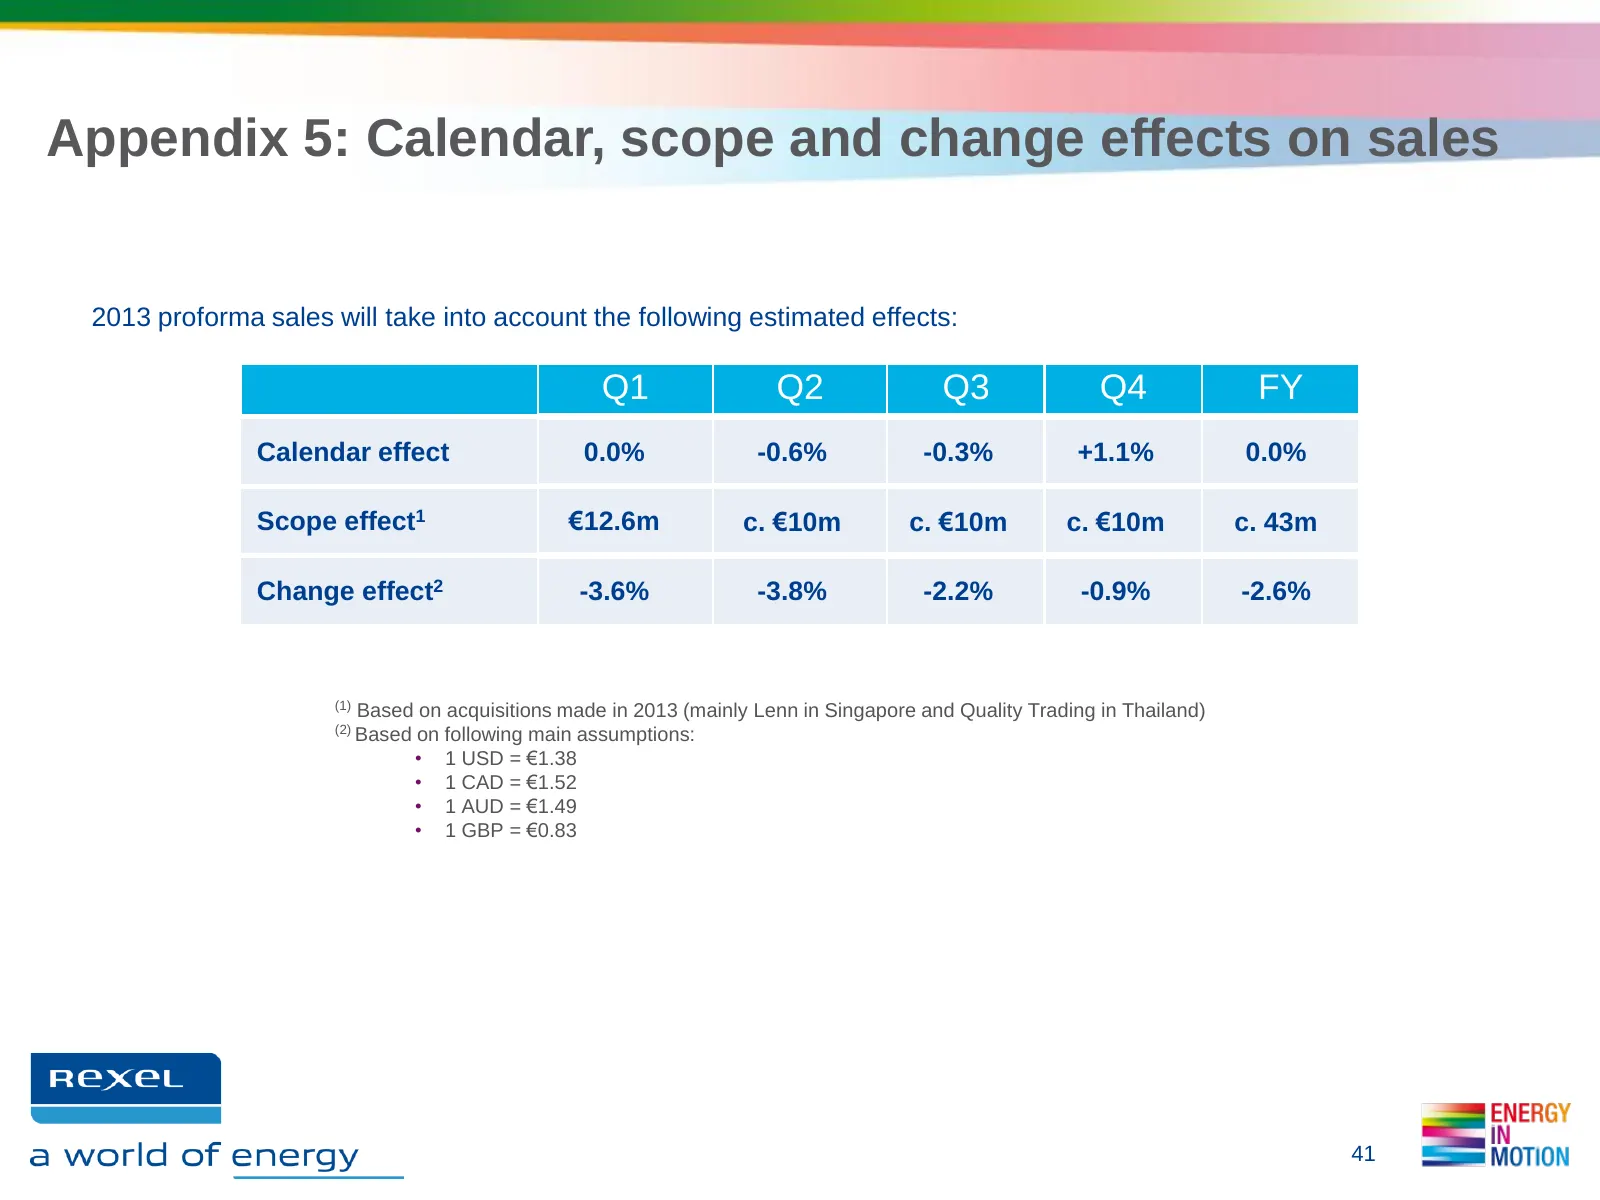
Slide 41: Appendix 5: Calendar, scope and change effects on sales
Appendix 5: Calendar, scope and change effects on sales 2013 proforma sales will take into account the following estimated effects: Q1 Q2 Q3 Q4 FY Calendar effect 0.0% -0.6% -0.3% +1.1% 0.0% Scope effect1 €12.6m c. €10m c. €10m c. €10m c. 43m Change effect2 -3.6% -3.8% -2.2% -0.9% -2.6% (1) Based on
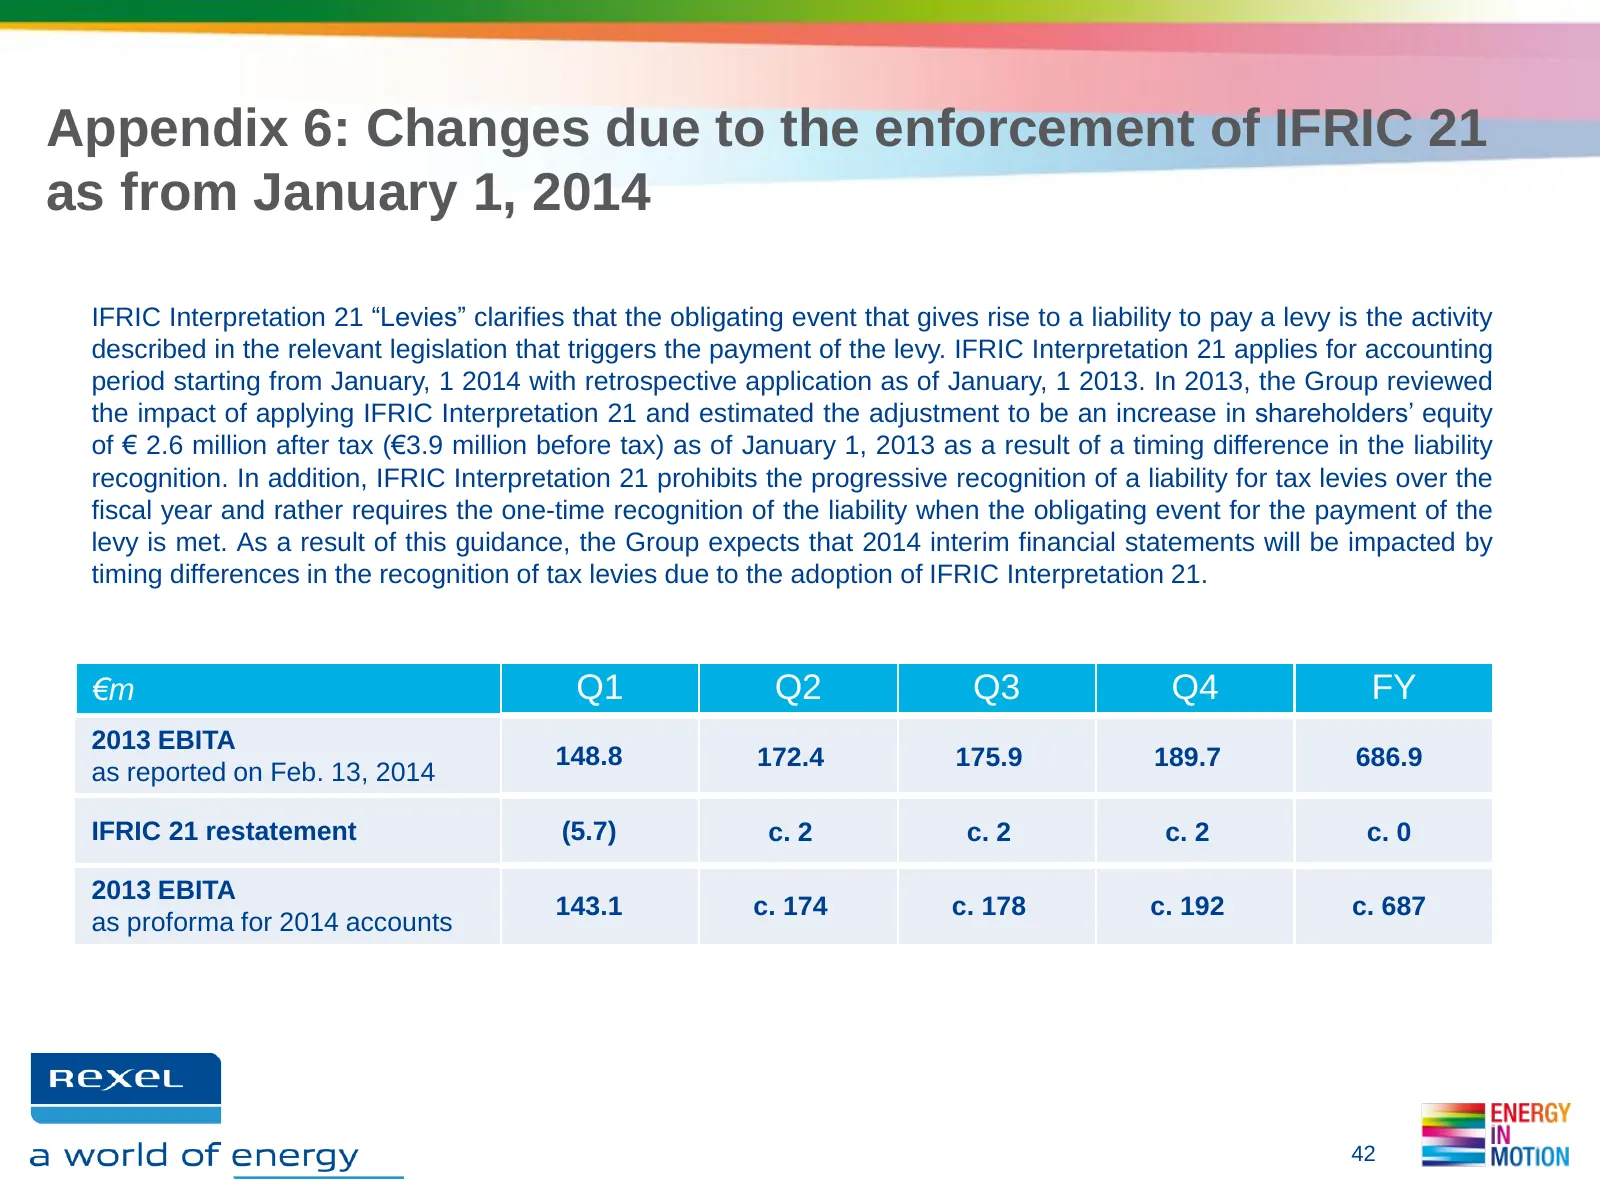
Slide 42: Appendix 6: Changes due to the enforcement of IFRIC 21
Appendix 6: Changes due to the enforcement of IFRIC 21 as from January 1, 2014 IFRIC Interpretation 21 “Levies” clarifies that the obligating event that gives rise to a liability to pay a levy is the activity described in the relevant legislation that triggers the payment of the levy. IFRIC Interpre
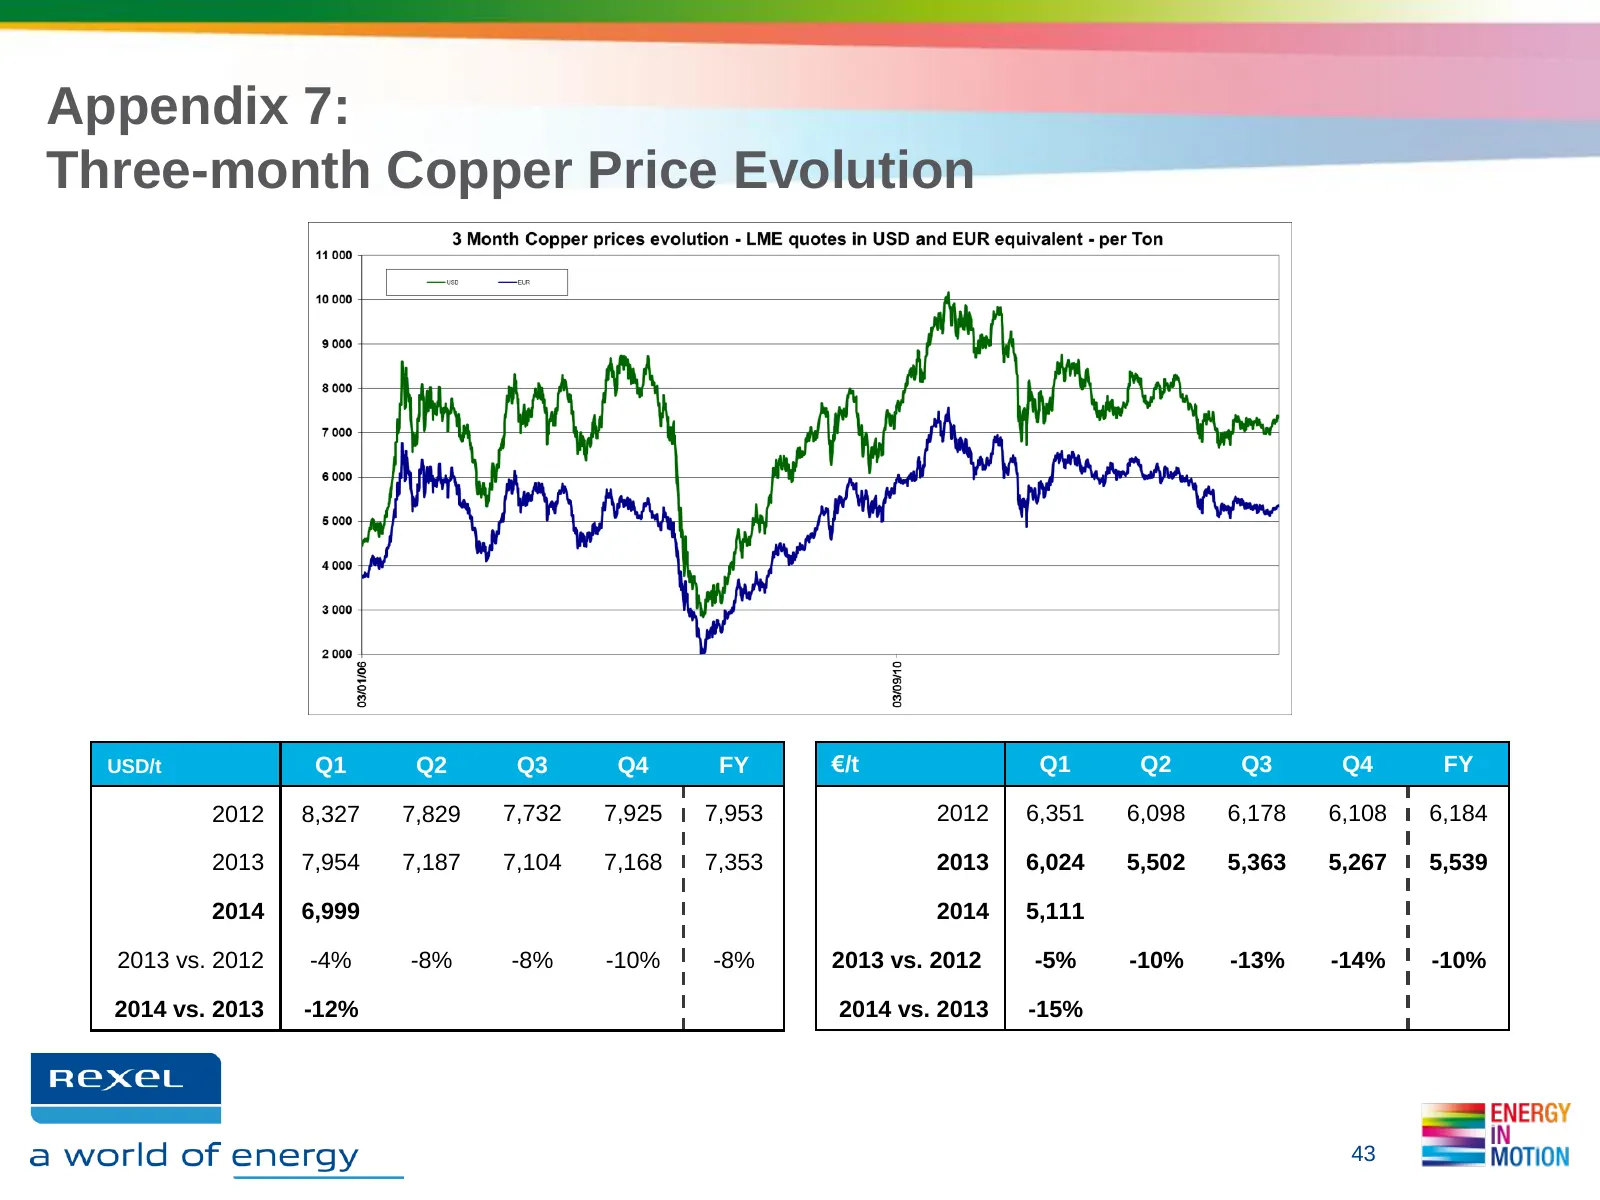
Slide 43: Appendix 7: Three-month Copper Price Evolution
Appendix 7: Three-month Copper Price Evolution USD/t Q1 Q2 Q3 Q4 FY €/t Q1 Q2 Q3 Q4 FY 2012 8,327 7,829 7,732 7,925 7,953 2012 6,351 6,098 6,178 6,108 6,184 2013 7,954 7,187 7,104 7,168 7,353 2013 6,024 5,502 5,363 5,267 5,539 2014 6,999 2014 5,111 2013 vs. 2012 -4% -8% -8% -10% -8% 2013 vs. 2012 -5
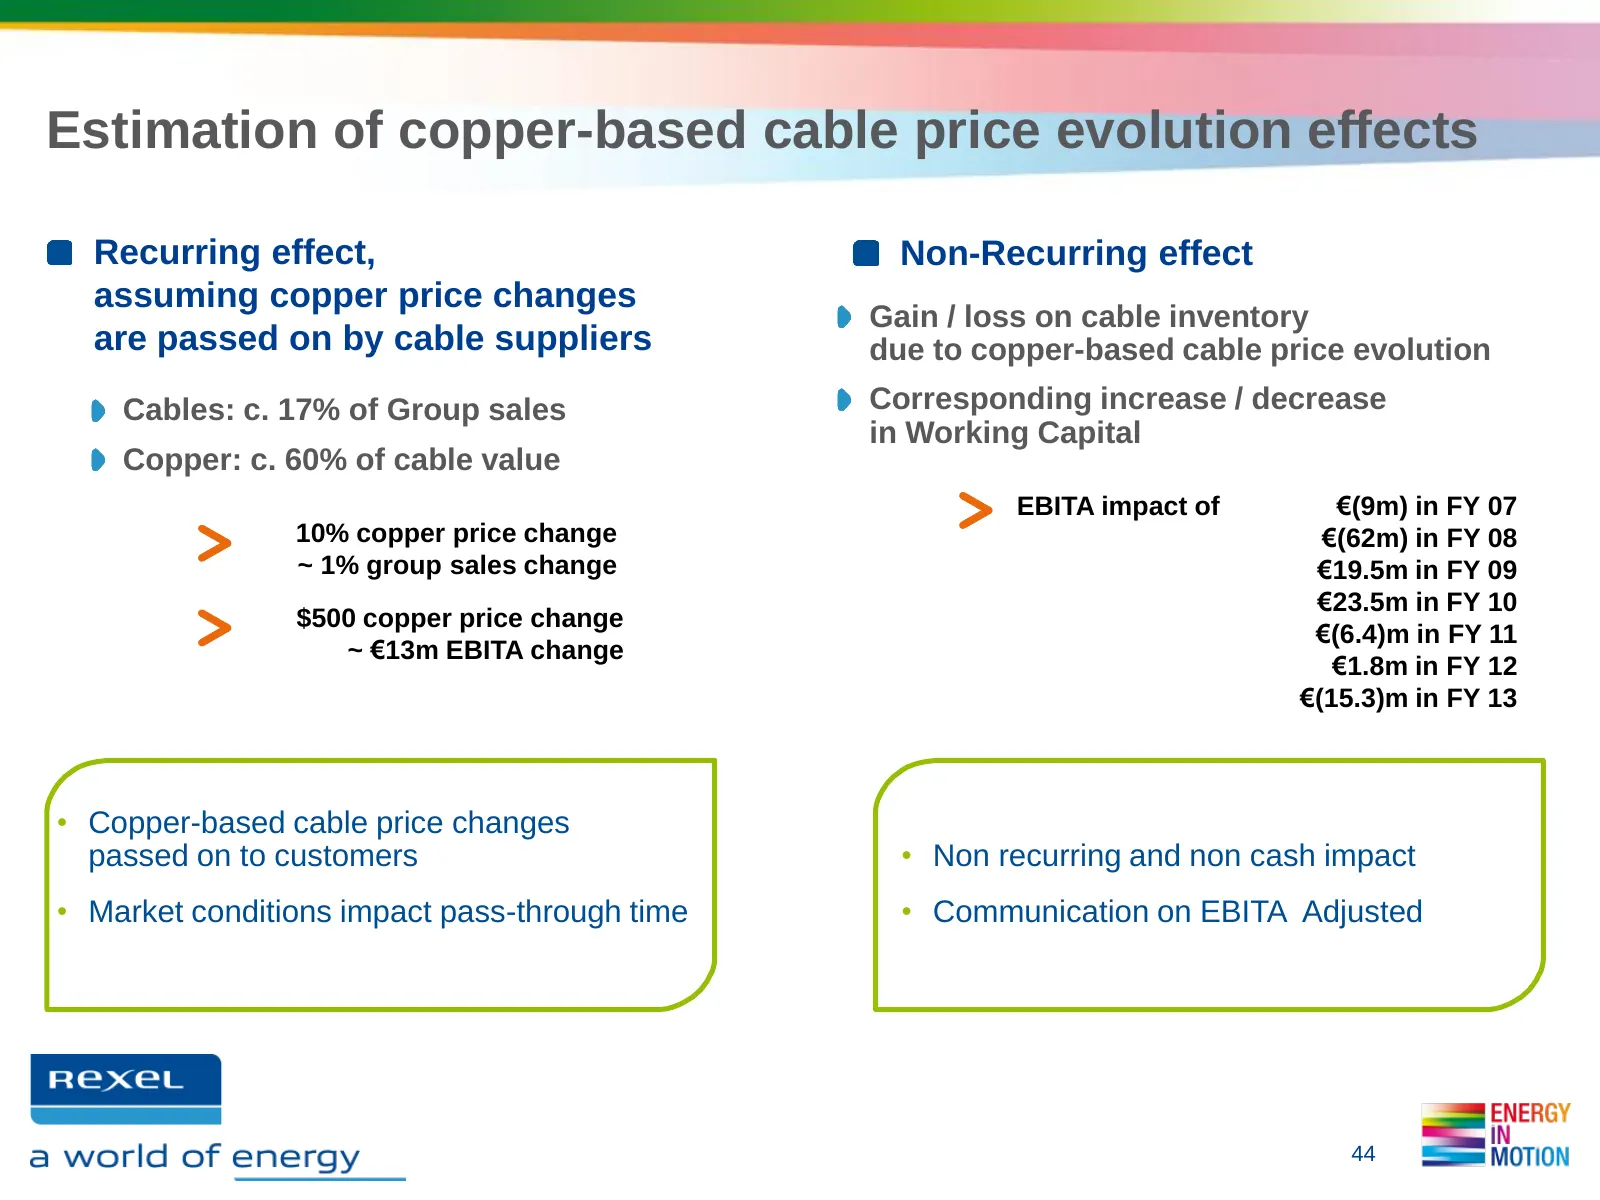
Slide 44: Estimation of copper-based cable price evolution effects
Estimation of copper-based cable price evolution effects Recurring effect, Non-Recurring effect assuming copper price changes Gain / loss on cable inventory are passed on by cable suppliers due to copper-based cable price evolution Cables: c. 17% of Group sales Corresponding increase / decrease in W
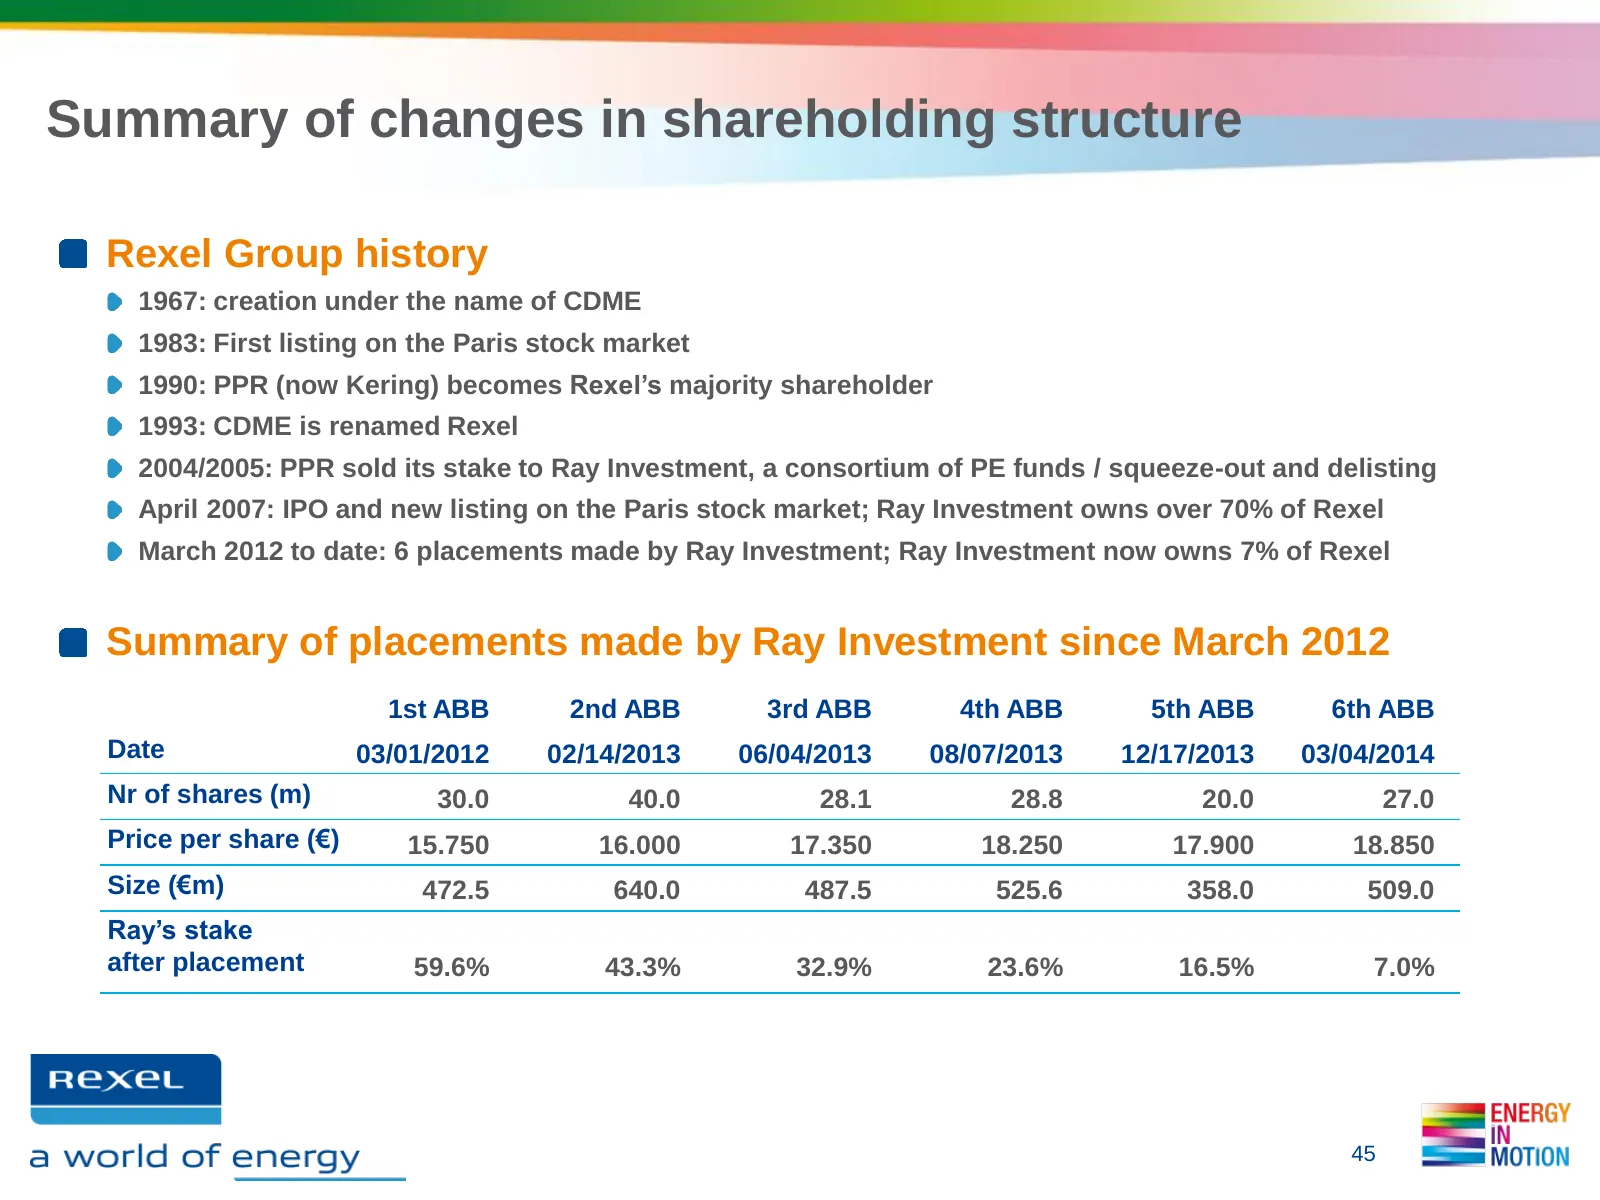
Slide 45: Summary of changes in shareholding structure
Summary of changes in shareholding structure Rexel Group history 1967: creation under the name of CDME 1983: First listing on the Paris stock market 1990: PPR (now Kering) becomes Rexel’s majority shareholder 1993: CDME is renamed Rexel 2004/2005: PPR sold its stake to Ray Investment, a consortium o
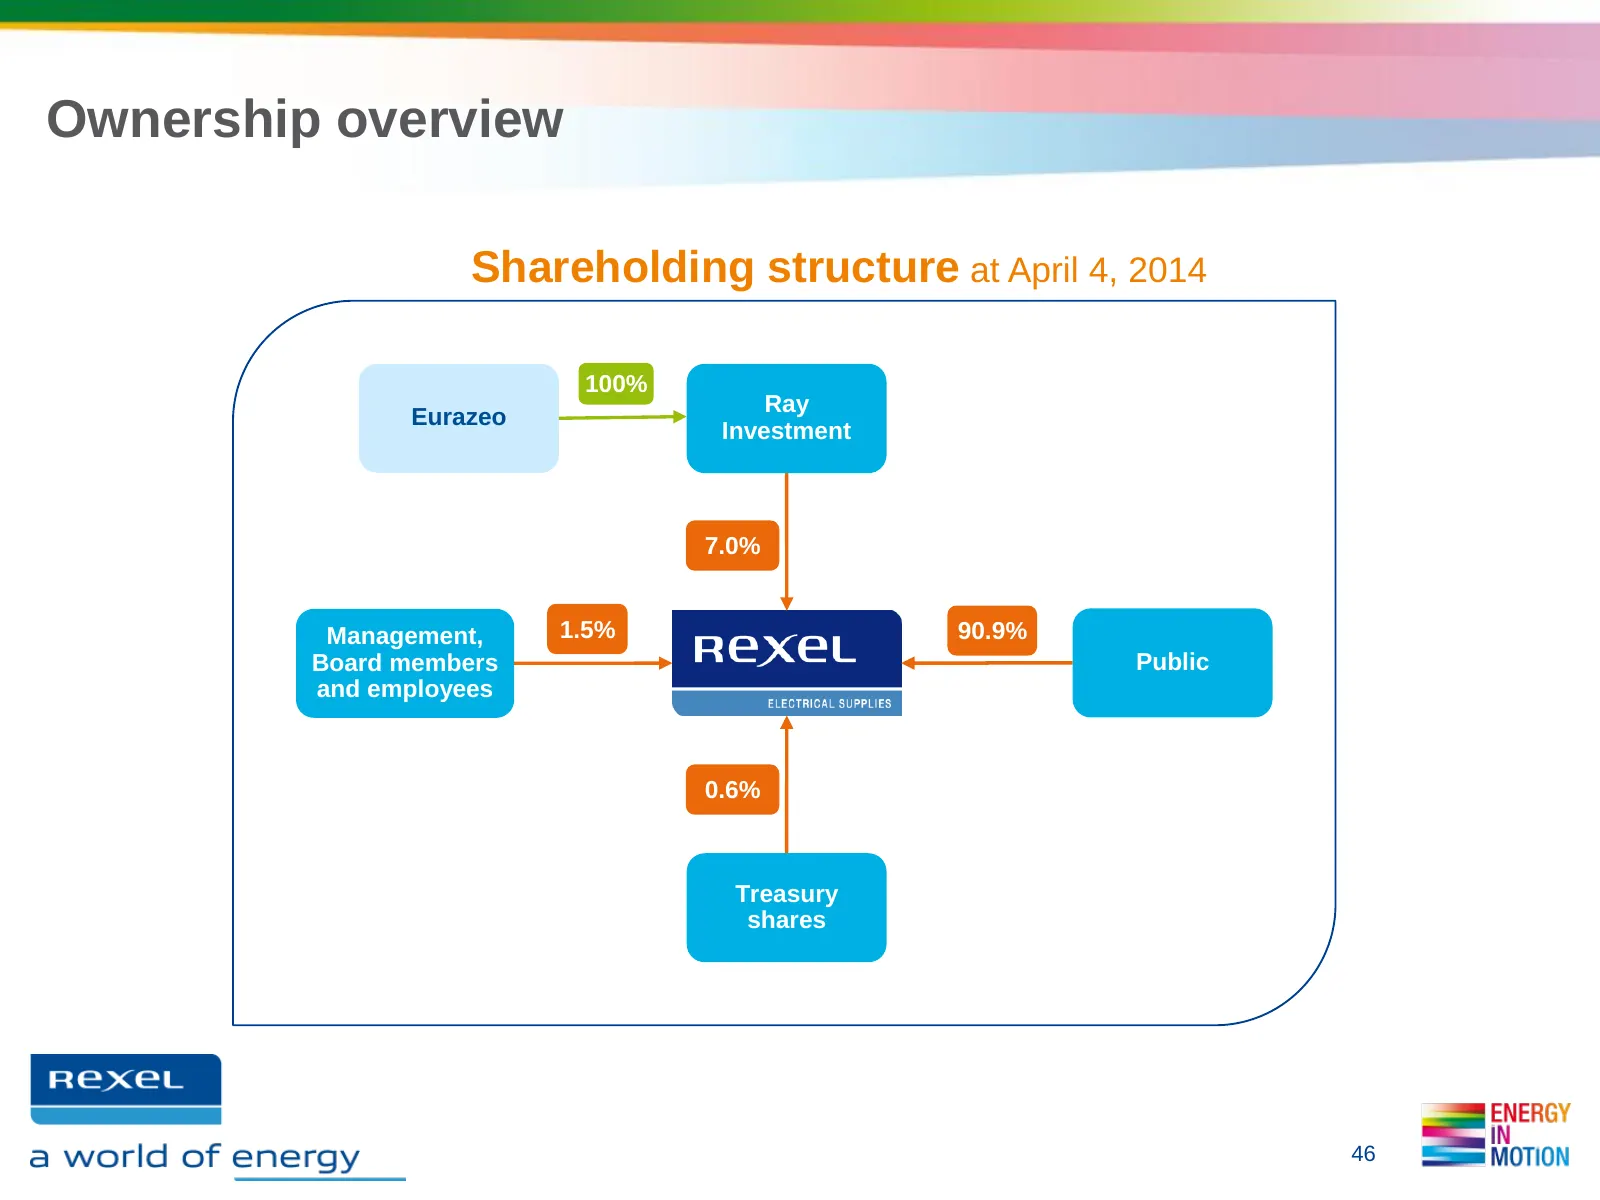
Slide 46: Ownership overview
Ownership overview Shareholding structure at April 4, 2014 100% Ray Eurazeo Investment 7.0% Management, 1.5% 90.9% Board members Public and employees 0.6% Treasury shares 46
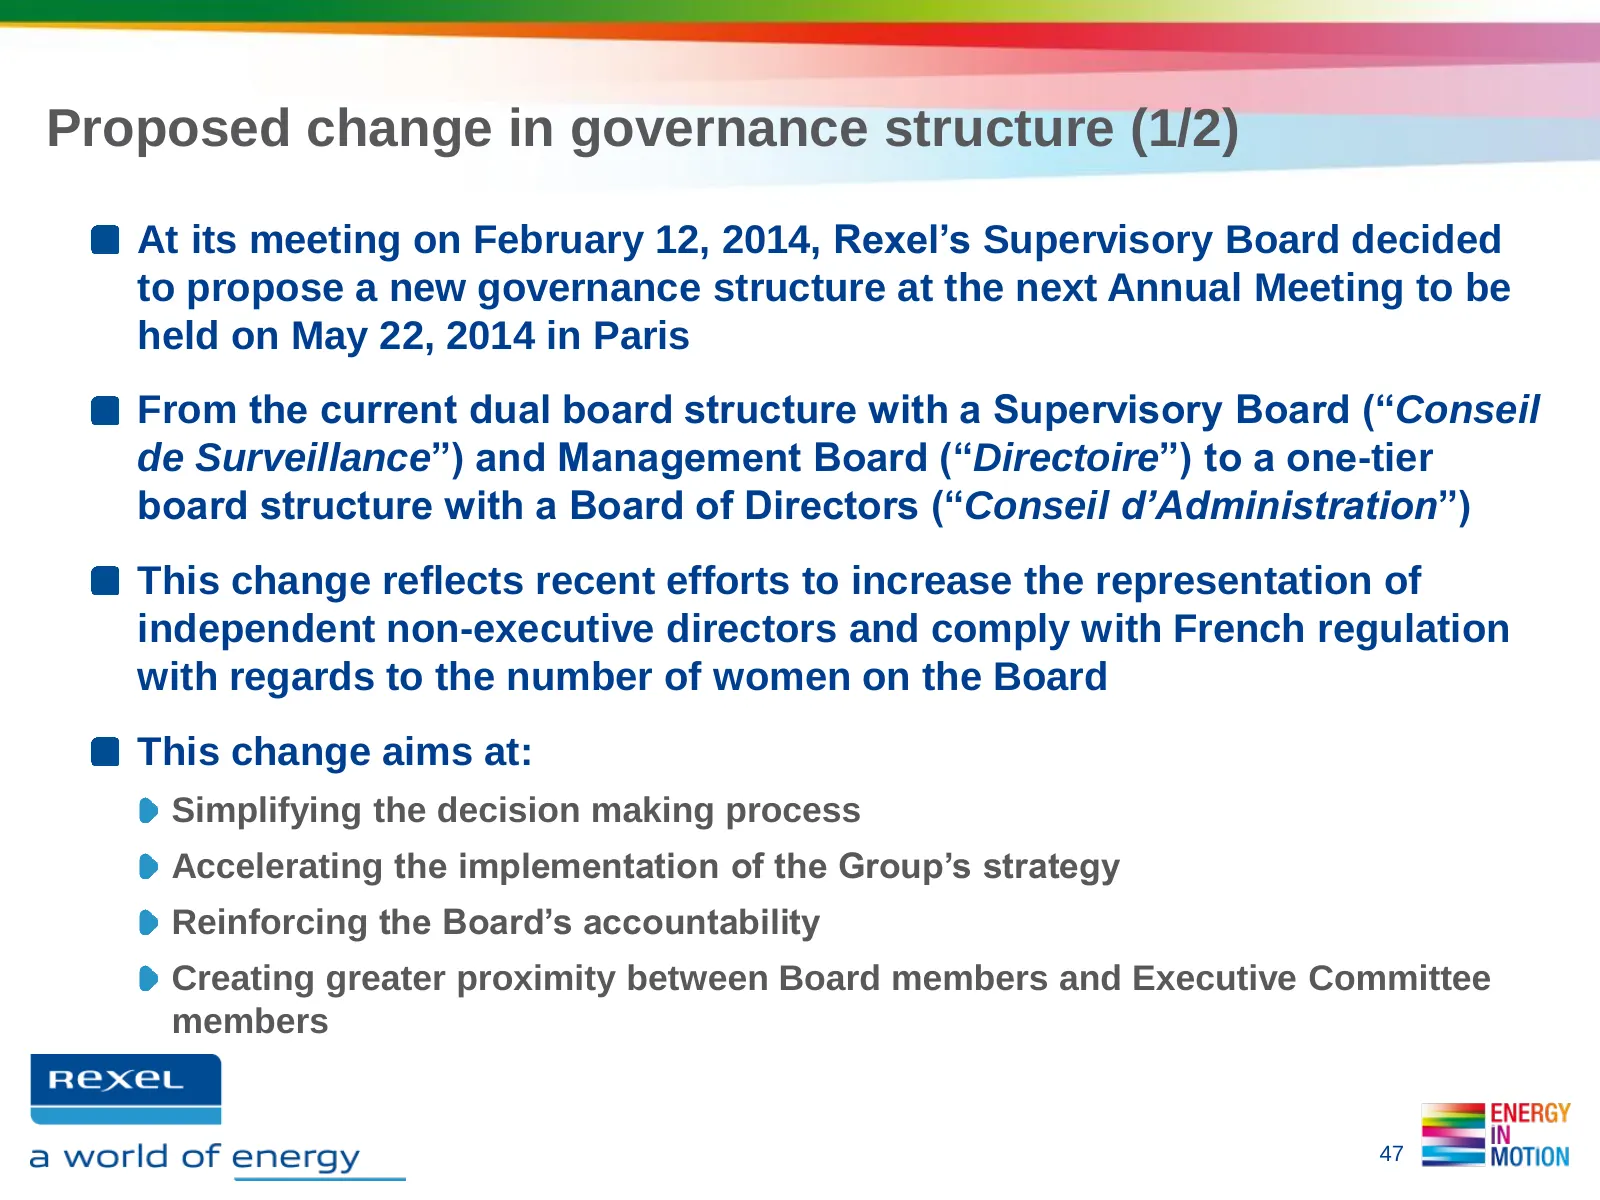
Slide 47: Proposed change in governance structure (1/2)
Proposed change in governance structure (1/2) At its meeting on February 12, 2014, Rexel’s Supervisory Board decided to propose a new governance structure at the next Annual Meeting to be held on May 22, 2014 in Paris From the current dual board structure with a Supervisory Board (“Conseil de Survei
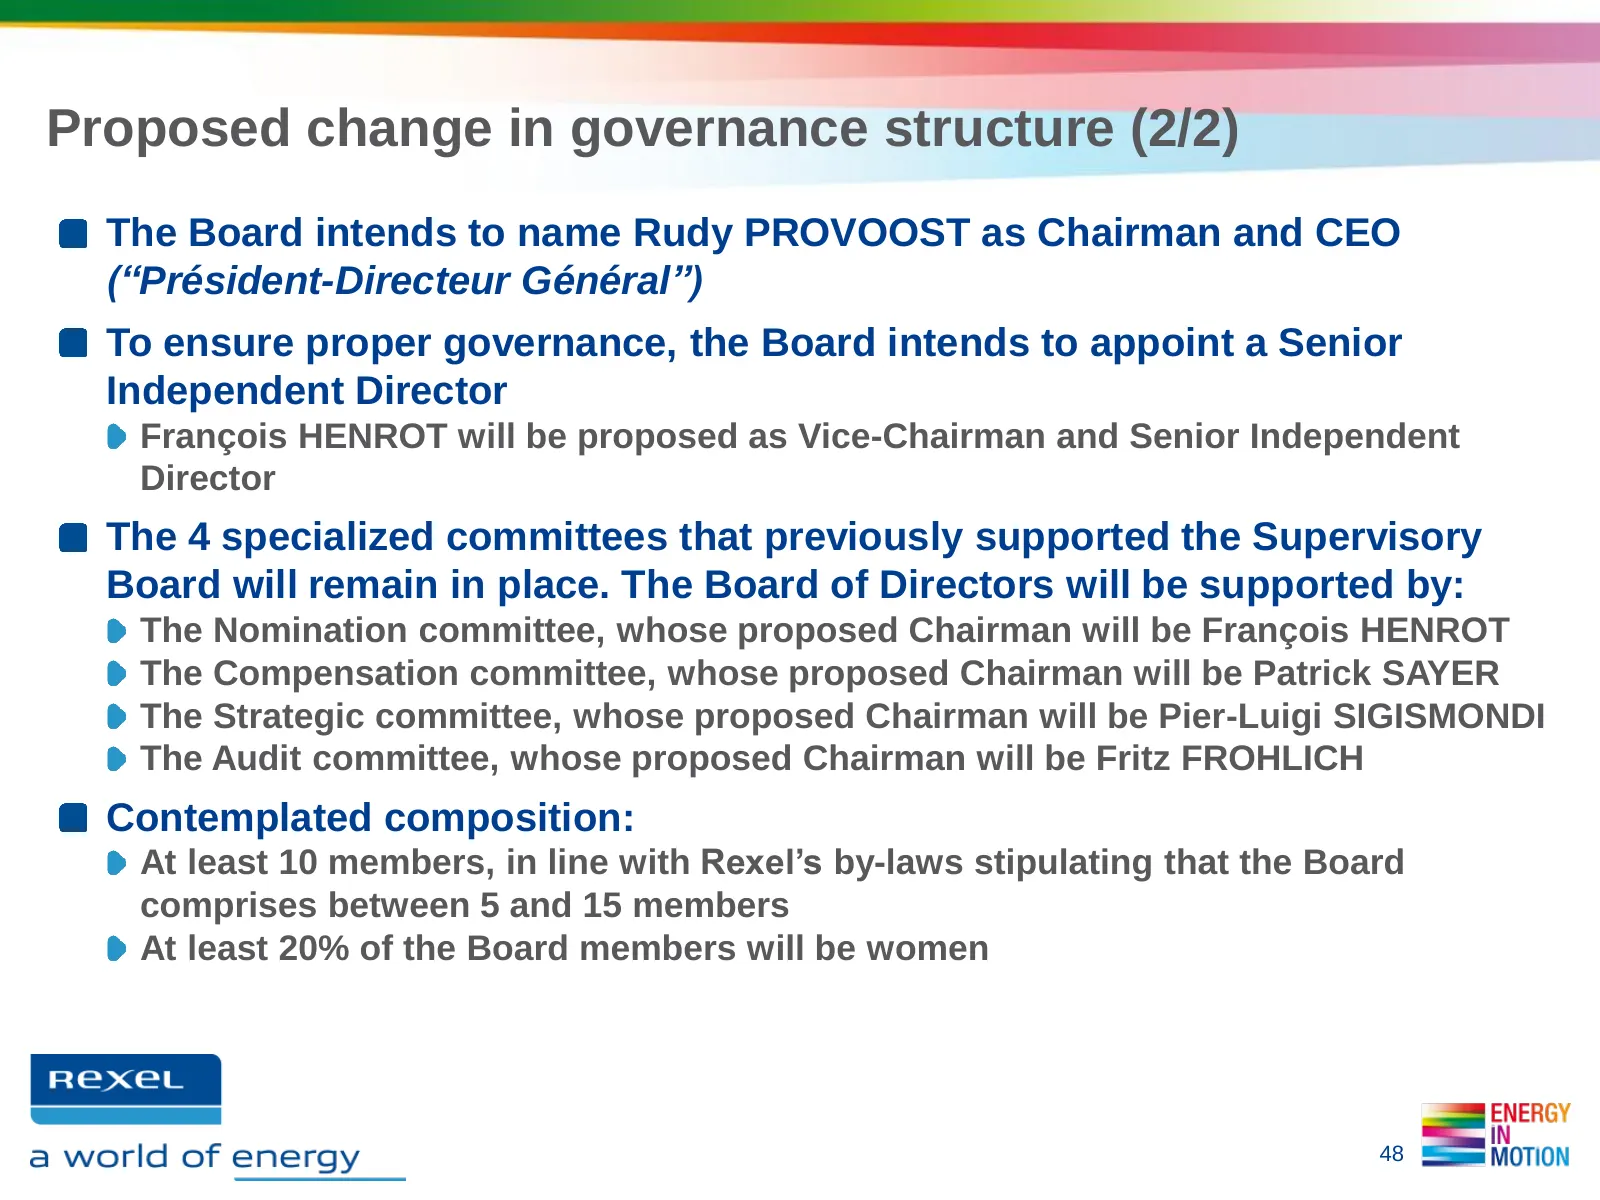
Slide 48: Proposed change in governance structure (2/2)
Proposed change in governance structure (2/2) The Board intends to name Rudy PROVOOST as Chairman and CEO (“Président-Directeur Général”) To ensure proper governance, the Board intends to appoint a Senior Independent Director François HENROT will be proposed as Vice-Chairman and Senior Independent D
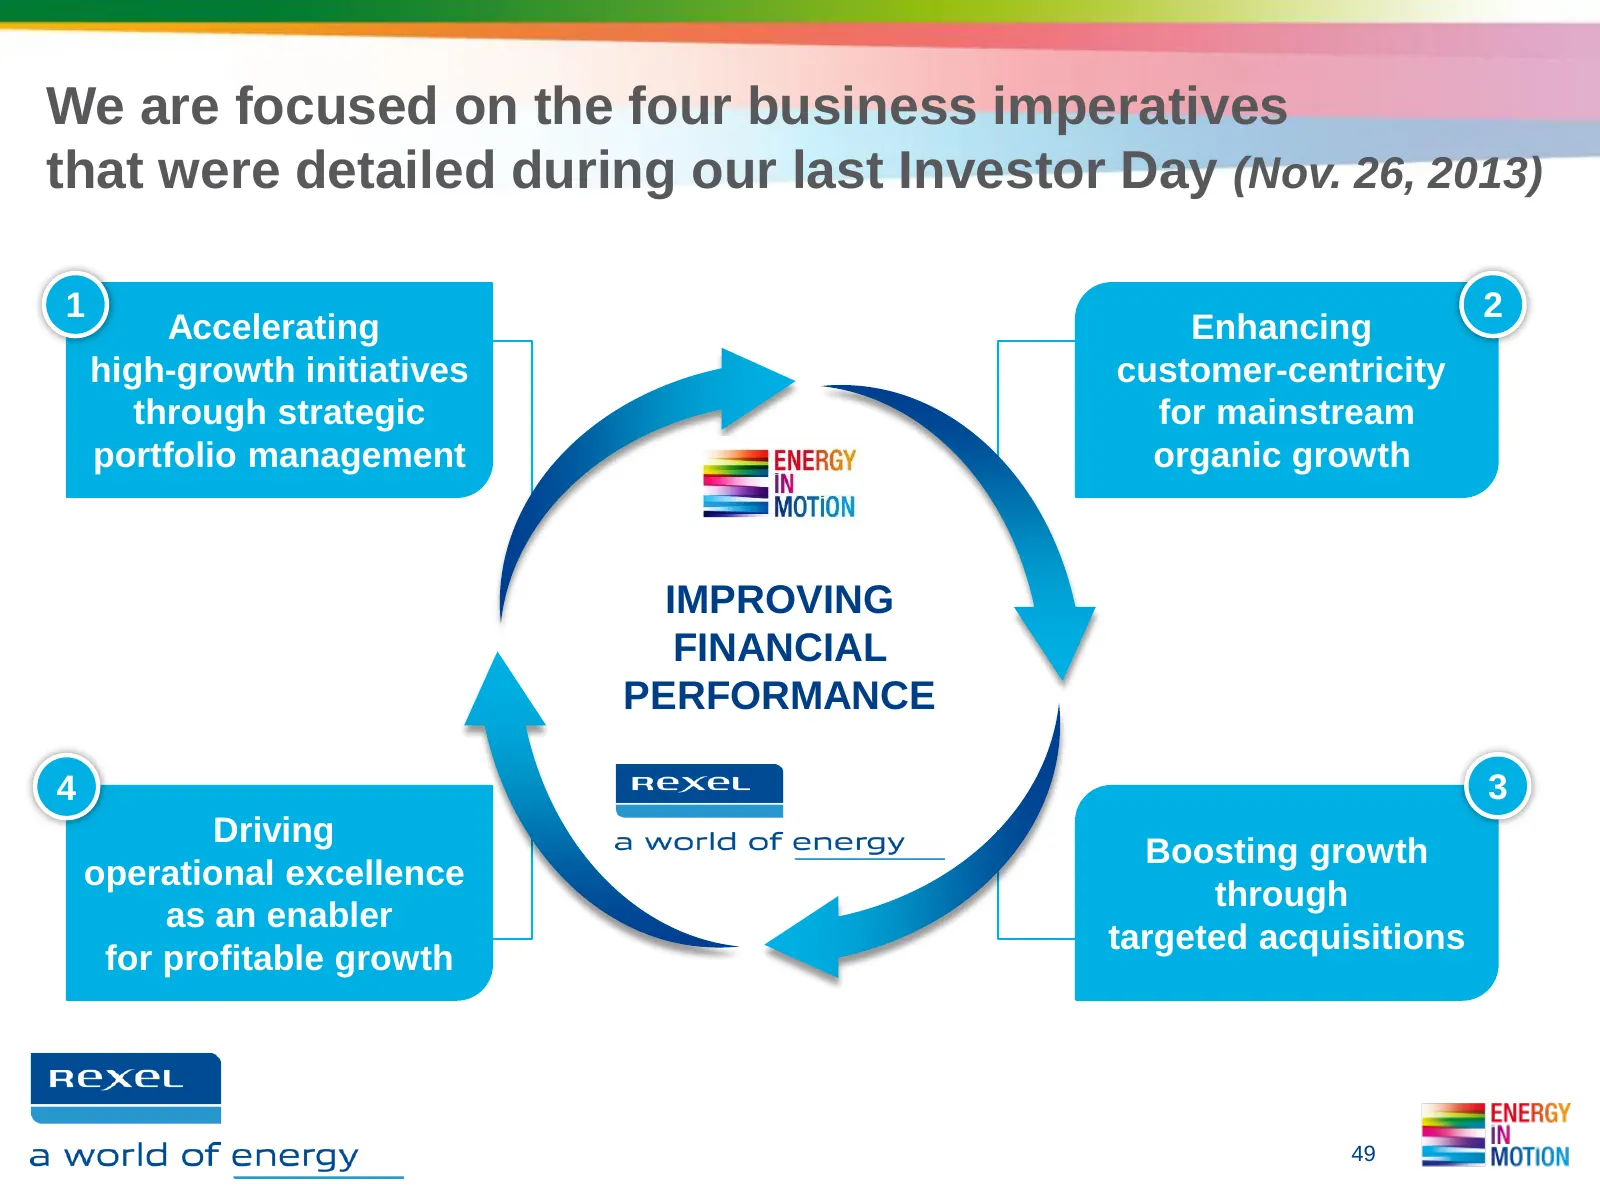
Slide 49: Four business imperatives from Investor Day
We are focused on the four business imperatives that were detailed during our last Investor Day (Nov. 26, 2013) 1 2 Accelerating Enhancing high-growth initiatives customer-centricity through strategic for mainstream portfolio management organic growth IMPROVING FINANCIAL PERFORMANCE 4 3 Driving Boos
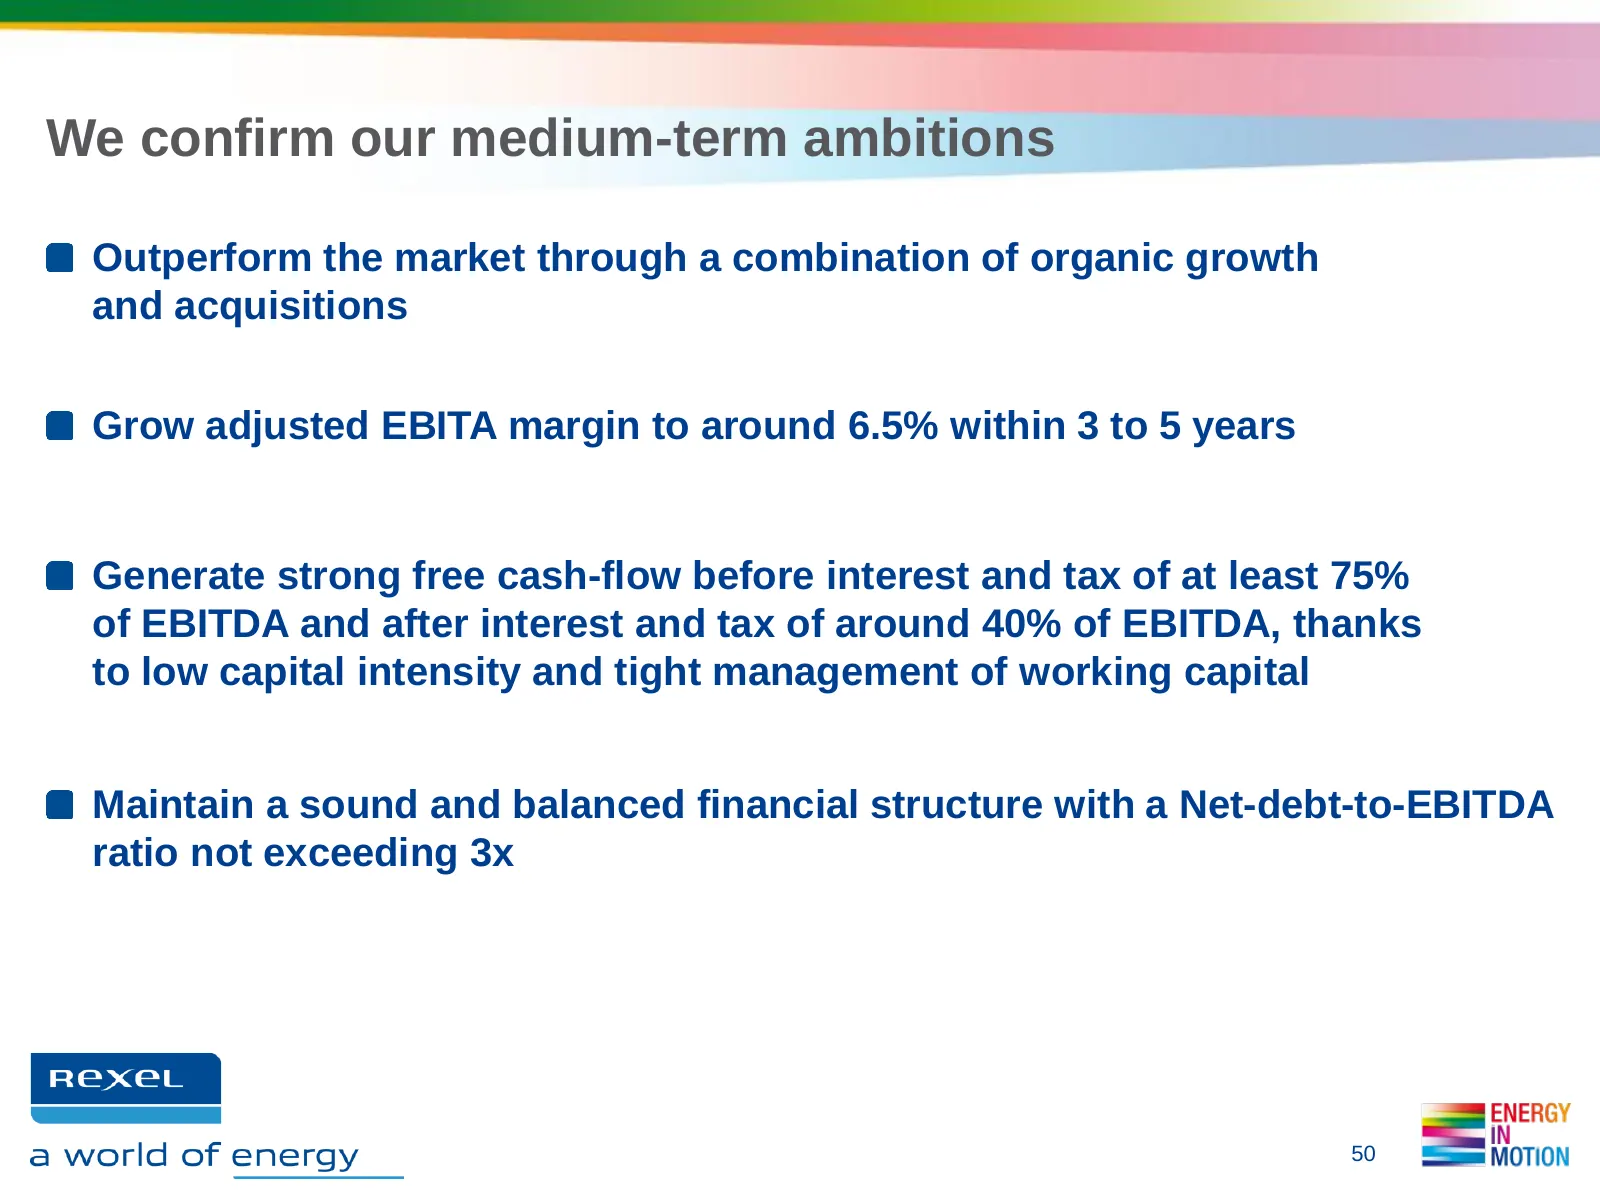
Slide 50: We confirm our medium-term ambitions
We confirm our medium-term ambitions Outperform the market through a combination of organic growth and acquisitions Grow adjusted EBITA margin to around 6.5% within 3 to 5 years Generate strong free cash-flow before interest and tax of at least 75% of EBITDA and after interest and tax of around 40%
Slide 51: Financial Calendar and contacts
Financial Calendar and contacts Financial Calendar Contacts • May 22, 2014 • Investors & Analysts AGM Marc MAILLET Tel: +33 1 42 85 76 12 • July 30, 2014 Email: marc.maillet@rexel.com Q2 and H1 results Florence MEILHAC • October 29, 2014 Tel: +33 1 42 85 57 61 Q3 and 9m results Email: florence.meilh
Source: Internet Archive copy of rexel.com
More decks from Rexel SA
 Q3 2026 Earnings Presentation13 slides · Oct 22, 2026
 Q2 2026 Earnings Presentation24 slides · Jul 27, 2026
 FY 2025 Earnings Presentation31 slides · Feb 11, 2026
 Q3 2025 Earnings Presentation15 slides · Oct 15, 2025
 Q2 2025 Earnings Presentation20 slides · Jul 28, 2025
 Q1 2025 Earnings Presentation16 slides · Apr 29, 2025