W. R. Grace & — Investor Presentation (September 2009)
61 slides from W. R. Grace &'s investor presentation, Sep 18, 2009
Slide 1: W. R. Grace & Co. Company Overview
© 2009 W. R. Grace & Co. W. R. Grace & Co. Company Overview September 18, 2009
Slide 2: Disclaimer
Disclaimer © 2009 W. R. Grace & Co. Safe Harbor Statement under the Private Securities Litigation Reform Act of 1995 This presentation contains forward-looking statements, that is, information related to future, not past, events. Such information generally includes the words “believes,” “plans,” “in
Slide 3: W. R. Grace & Co.
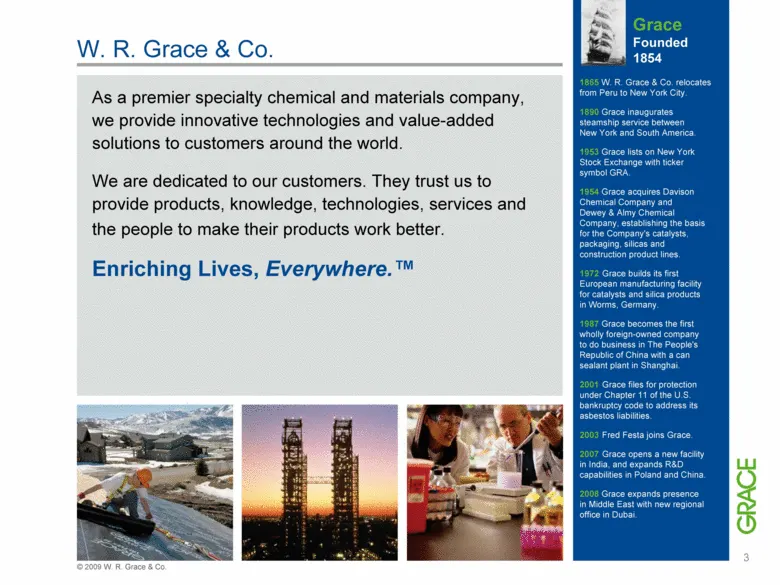
W. R. Grace & Co. As a premier specialty chemical and materials company, we provide innovative technologies and value-added solutions to customers around the world. We are dedicated to our customers. They trust us to provide products, knowledge, technologies, services and the people to make their pr
Slide 4: Our Core Strengths
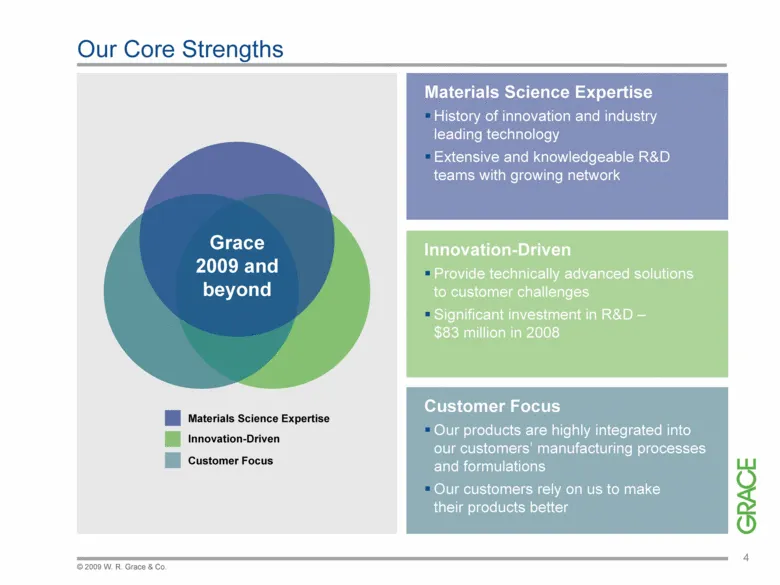
Our Core Strengths Grace 2009 and beyond Materials Science Expertise Innovation-Driven Customer Focus Materials Science Expertise History of innovation and industry leading technology Extensive and knowledgeable R&D teams with growing network Innovation-Driven Provide technically advanced solutions
Slide 5: Large Global Industries
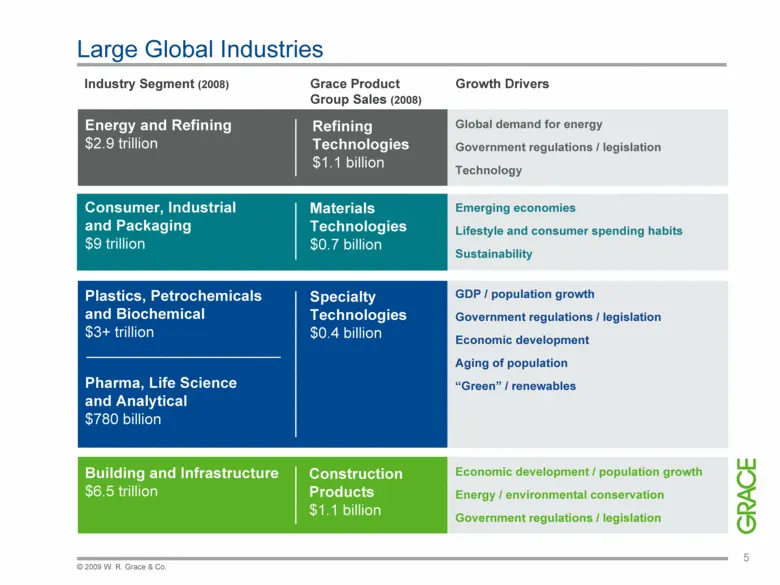
Large Global Industries Industry Segment (2008) Growth Drivers Grace Product Group Sales (2008) Refining Technologies $1.1 billion Energy and Refining $2.9 trillion Global demand for energy Government regulations / legislation Technology © 2009 W. R. Grace & Co. 5 Consumer, Industrial and Packaging
Slide 6: Balanced Business Profile
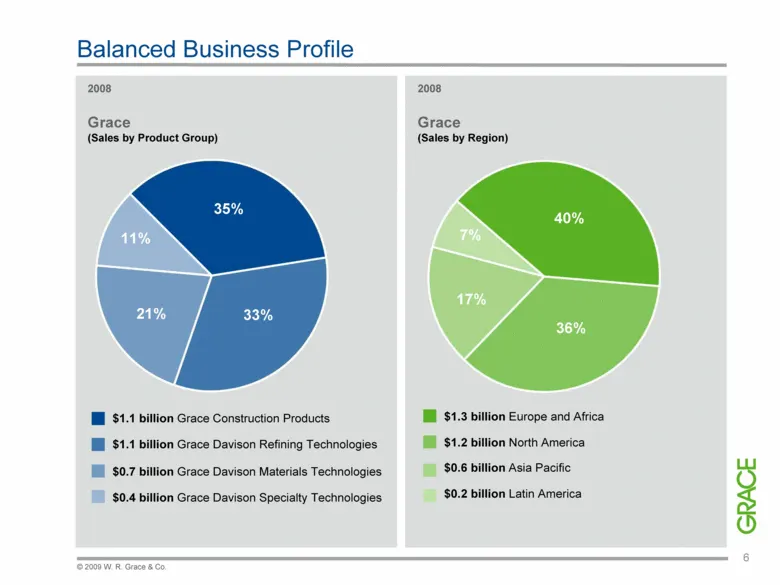
Balanced Business Profile 2008 Grace (Sales by Product Group) 2008 Grace (Sales by Region) $1.3 billion Europe and Africa $1.2 billion North America $0.6 billion Asia Pacific $0.2 billion Latin America 17% 36% 40% 7% $1.1 billion Grace Construction Products $1.1 billion Grace Davison Refining Techno
Slide 7: Financial Performance Record
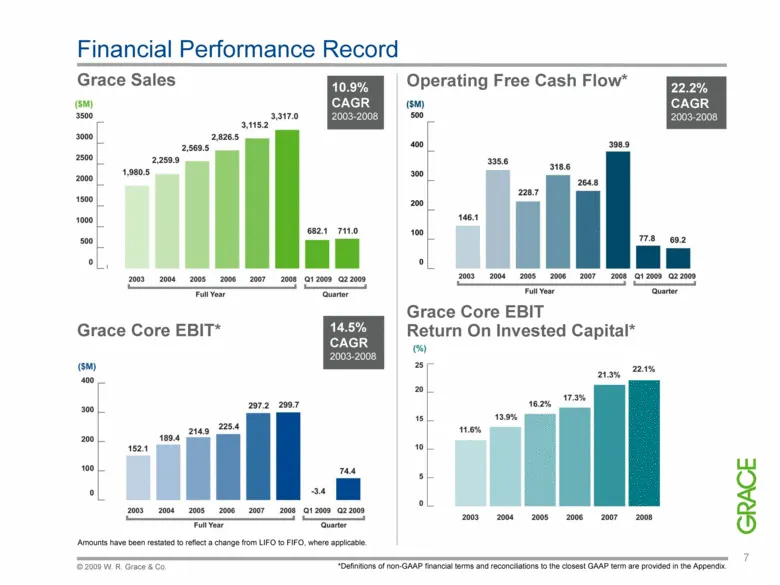
14.5% CAGR 2003-2008 Grace Core EBIT* Financial Performance Record © 2009 W. R. Grace & Co. 7 Amounts have been restated to reflect a change from LIFO to FIFO, where applicable. Grace Core EBIT Return On Invested Capital* 10.9% CAGR 2003-2008 Grace Sales 22.2% CAGR 2003-2008 Operating Free Cash Flow
Slide 8: Balanced Financial Performance
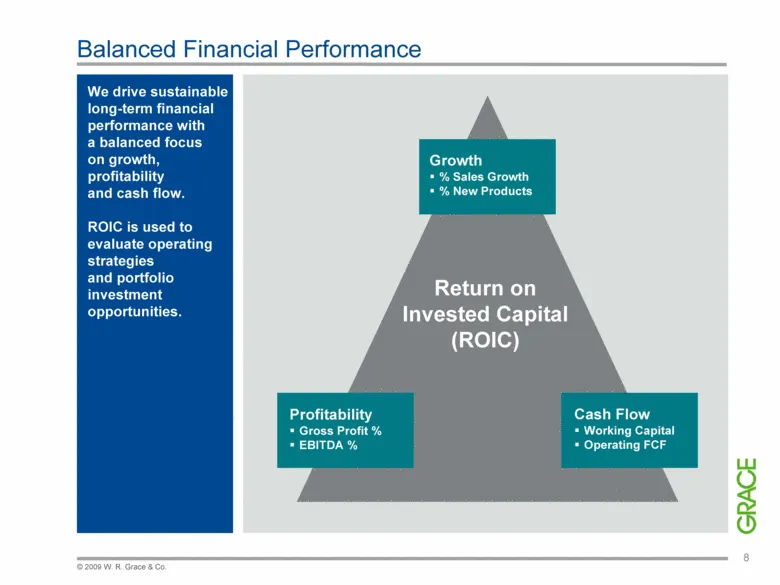
Balanced Financial Performance Return on Invested Capital (ROIC) Cash Flow Working Capital Operating FCF Profitability Gross Profit % EBITDA % Growth % Sales Growth % New Products We drive sustainable long-term financial performance with a balanced focus on growth, profitability and cash flow. ROIC
Slide 9: Profitability
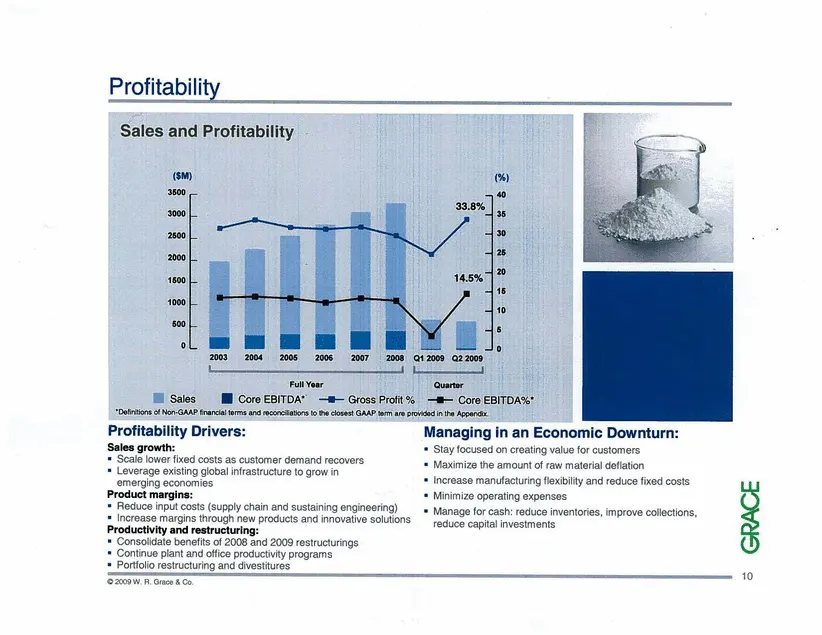
Profitability Sales and Profitability © 2009 W. R. Grace & Co. 10 Profitability Drivers: Sales growth: Scale lower fixed costs as customer demand recovers Leverage existing global infrastructure to grow in emerging economies Product margins: Reduce input costs (supply chain and sustaining engineerin
Slide 10: Cash Flow
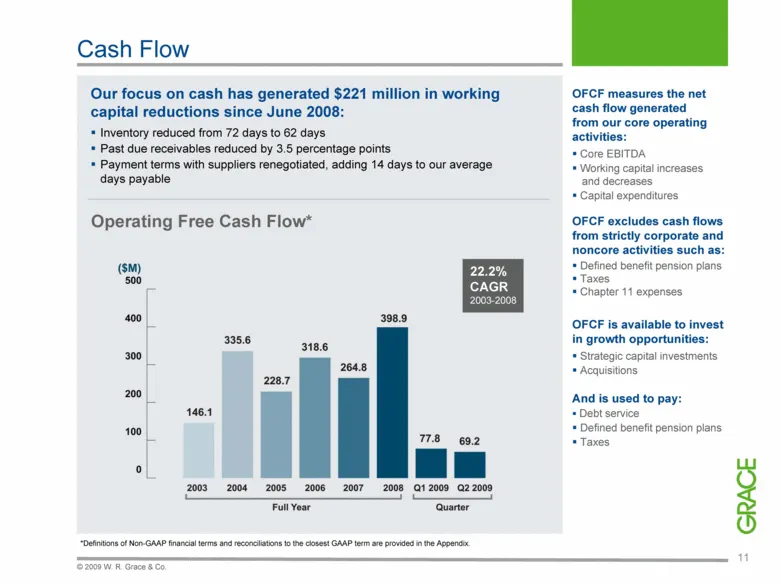
Cash Flow Operating Free Cash Flow* Our focus on cash has generated $221 million in working capital reductions since June 2008: Inventory reduced from 72 days to 62 days Past due receivables reduced by 3.5 percentage points Payment terms with suppliers renegotiated, adding 14 days to our average day
Slide 11: Capital Structure
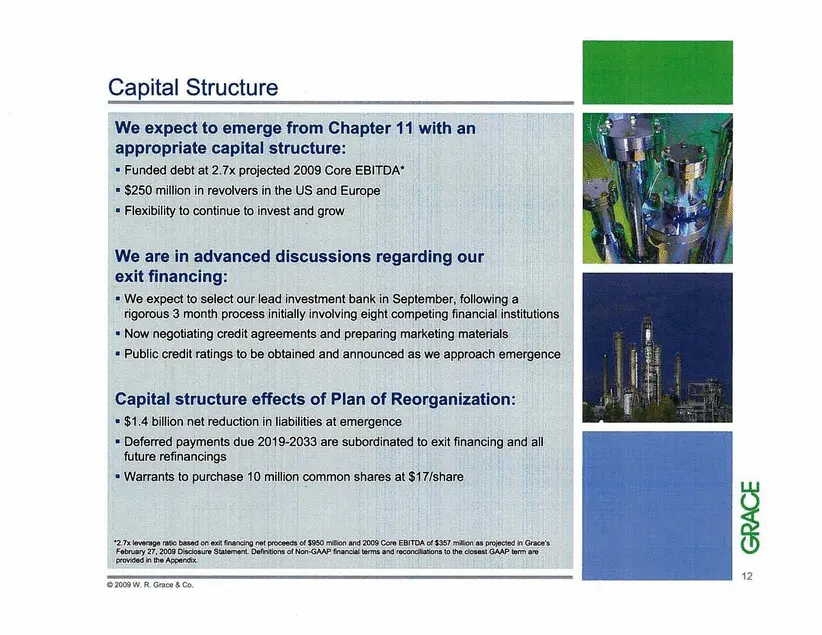
Capital Structure 12 © 2009 W. R. Grace & Co. We expect to emerge from Chapter 11 with an appropriate capital structure: Funded debt at 2.7x projected 2009 Core EBITDA* $250 million in revolvers in the US and Europe Flexibility to continue to invest and grow We are in advanced discussions regarding
Slide 12: Management Team
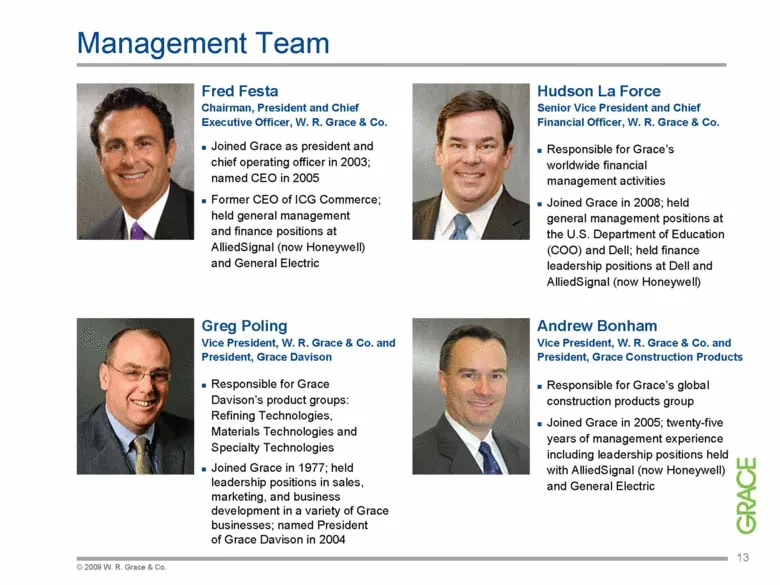
Management Team Fred Festa Chairman, President and Chief Executive Officer, W. R. Grace & Co. Joined Grace as president and chief operating officer in 2003; named CEO in 2005 Former CEO of ICG Commerce; held general management and finance positions at AlliedSignal (now Honeywell) and General Electri
Slide 13: Why Grace?
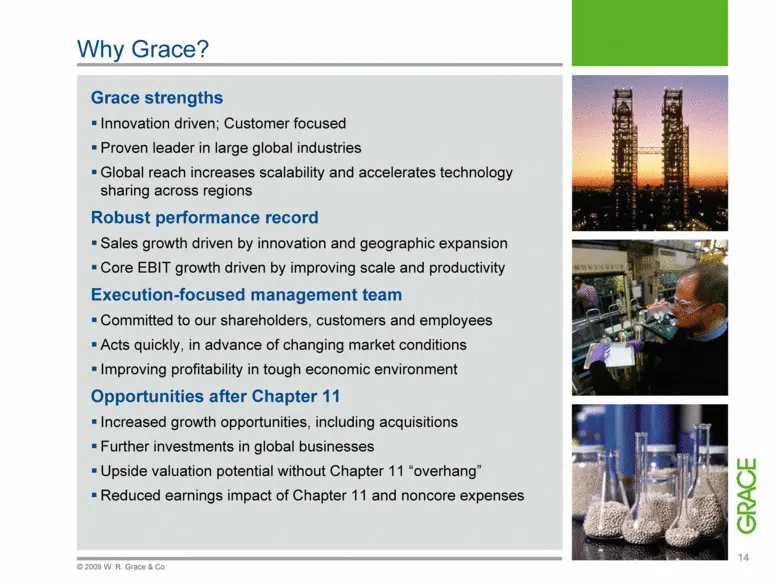
Why Grace? Grace strengths Innovation driven; Customer focused Proven leader in large global industries Global reach increases scalability and accelerates technology sharing across regions Robust performance record Sales growth driven by innovation and geographic expansion Core EBIT growth driven by
Slide 14: Davison
Davison 15 © 2009 W. R. Grace & Co.
Slide 15: Well Positioned for the Future
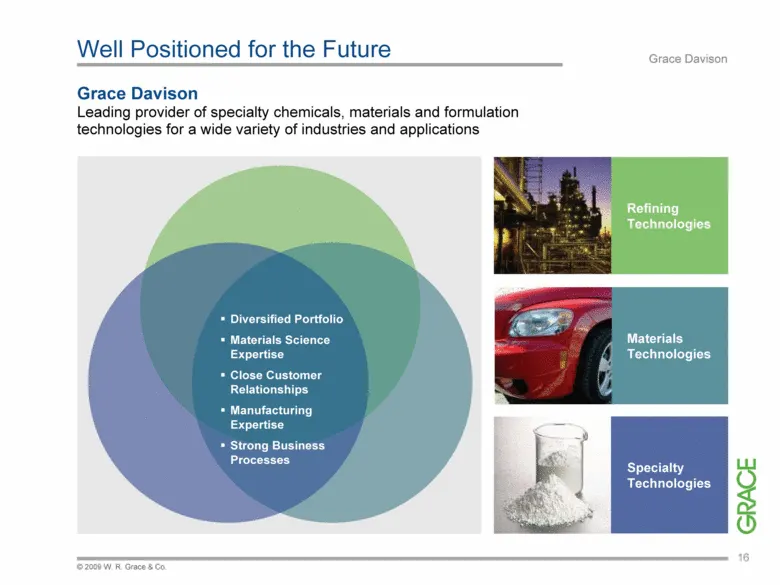
Well Positioned for the Future Grace Davison Grace Davison Leading provider of specialty chemicals, materials and formulation technologies for a wide variety of industries and applications Diversified Portfolio Materials Science Expertise Close Customer Relationships Manufacturing Expertise Strong B
Slide 16: Strengths
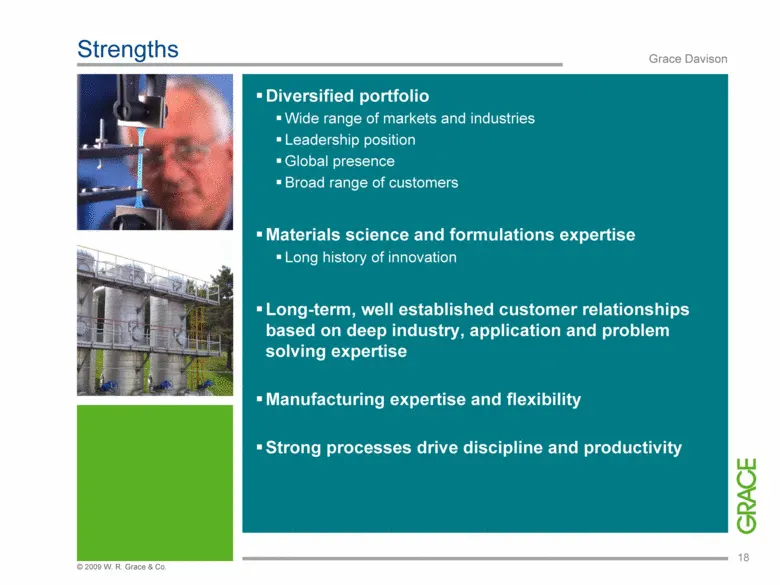
© 2009 W. R. Grace & Co. 18 Strengths Grace Davison Diversified portfolio Wide range of markets and industries Leadership position Global presence Broad range of customers Materials science and formulations expertise Long history of innovation Long-term, well established customer relationships based
Slide 17: Product Groups
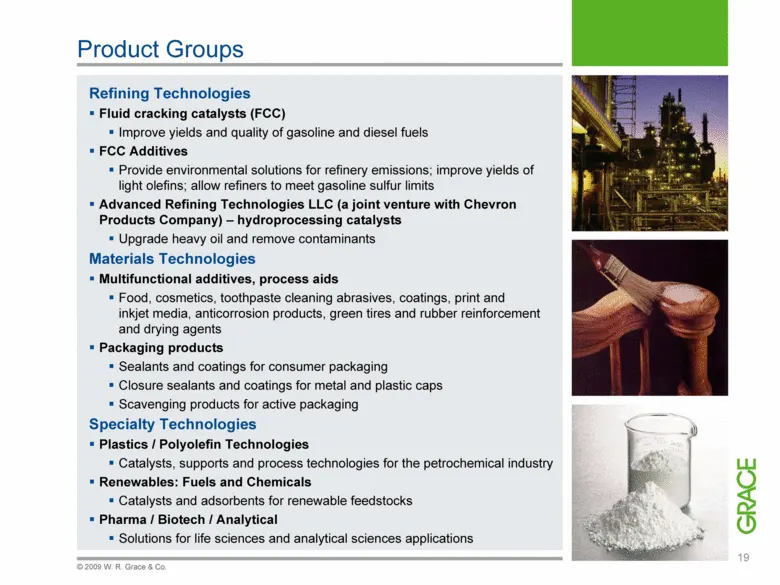
Product Groups © 2009 W. R. Grace & Co. Refining Technologies Fluid cracking catalysts (FCC) Improve yields and quality of gasoline and diesel fuels FCC Additives Provide environmental solutions for refinery emissions; improve yields of light olefins; allow refiners to meet gasoline sulfur limits Ad
Slide 18: Geographic Presence
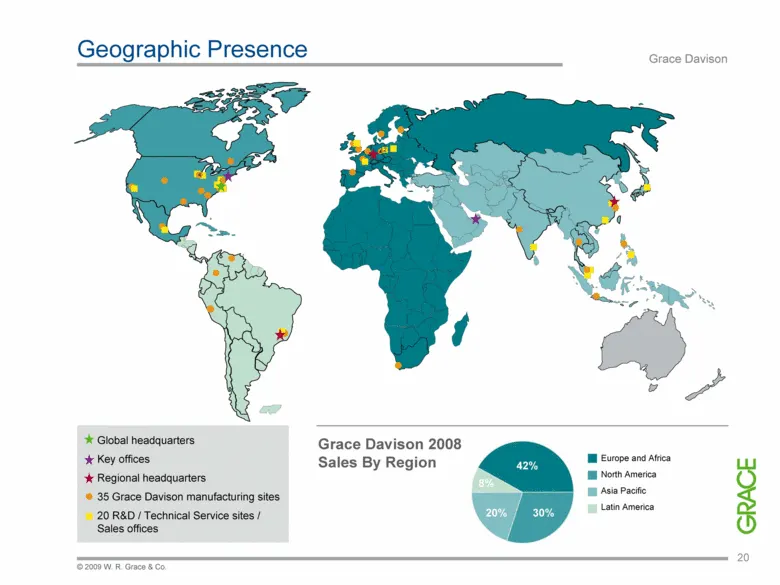
© 2009 W. R. Grace & Co. Global headquarters Key offices Regional headquarters 35 Grace Davison manufacturing sites 20 R&D / Technical Service sites / Sales offices Geographic Presence Grace Davison Grace Davison 2008 Sales By Region North America Asia Pacific Latin America 4 2 4 Europe and Africa 4
Slide 19: Customers
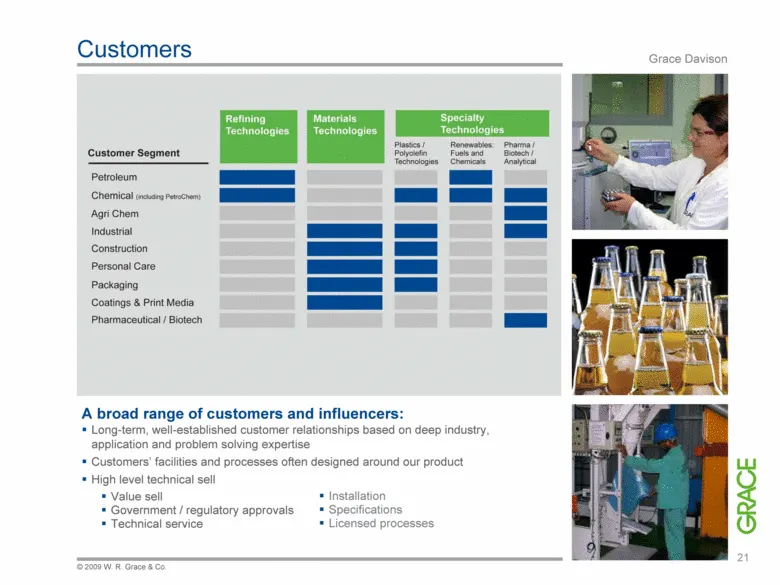
Customers Grace Davison © 2009 W. R. Grace & Co. A broad range of customers and influencers: Long-term, well-established customer relationships based on deep industry, application and problem solving expertise Customers’ facilities and processes often designed around our product High level technical
Slide 20: Competitors
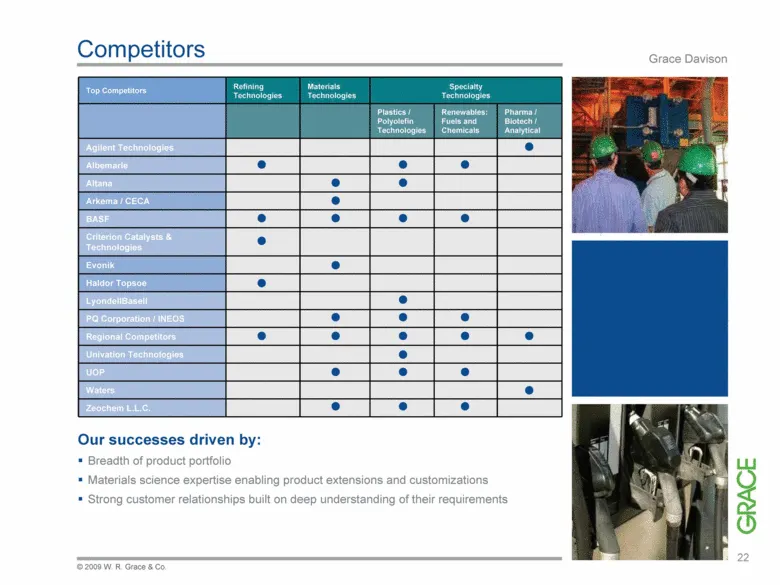
Competitors Top Competitors Refining Technologies Materials Technologies Specialty Technologies Plastics / Polyolefin Technologies Renewables: Fuels and Chemicals Pharma / Biotech / Analytical Agilent Technologies Albemarle Altana Arkema / CECA BASF Criterion Catalysts & Technologies Evonik Haldor T
Slide 21: Worldwide Leader in Materials Science
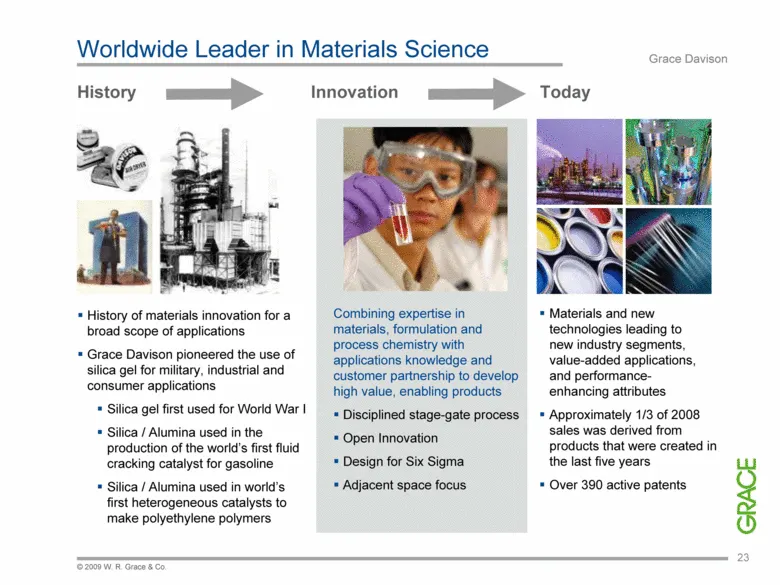
Worldwide Leader in Materials Science Grace Davison History Innovation Today Combining expertise in materials, formulation and process chemistry with applications knowledge and customer partnership to develop high value, enabling products Disciplined stage-gate process Open Innovation Design for Six
Slide 22: Summary Profile
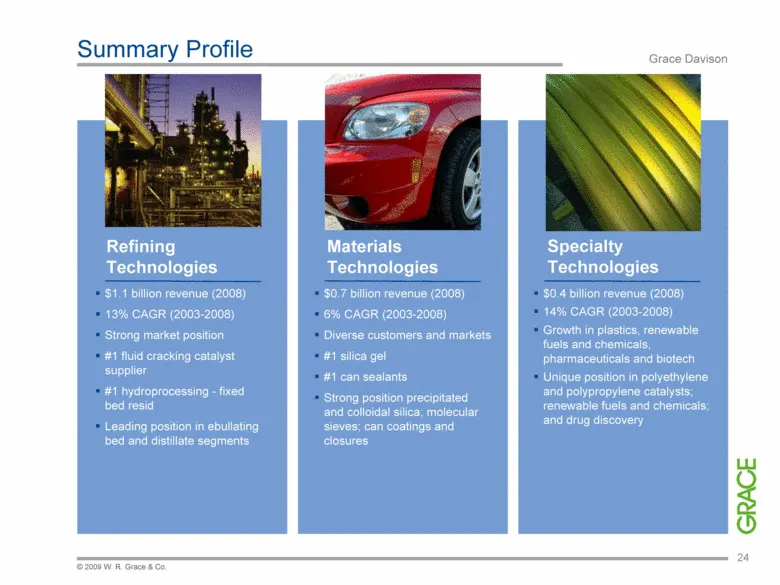
Summary Profile Grace Davison © 2009 W. R. Grace & Co. Materials Technologies Specialty Technologies Refining Technologies $1.1 billion revenue (2008) 13% CAGR (2003-2008) Strong market position #1 fluid cracking catalyst supplier #1 hydroprocessing - fixed bed resid Leading position in ebullating b
Slide 23: Refining Technologies
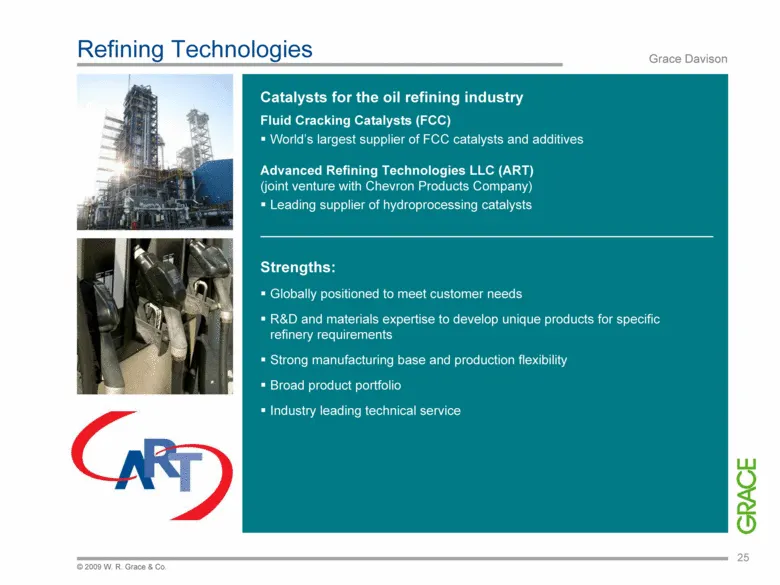
Refining Technologies Grace Davison Catalysts for the oil refining industry Fluid Cracking Catalysts (FCC) World’s largest supplier of FCC catalysts and additives Advanced Refining Technologies LLC (ART) (joint venture with Chevron Products Company) Leading supplier of hydroprocessing catalysts Stre
Slide 24: Refining Technologies
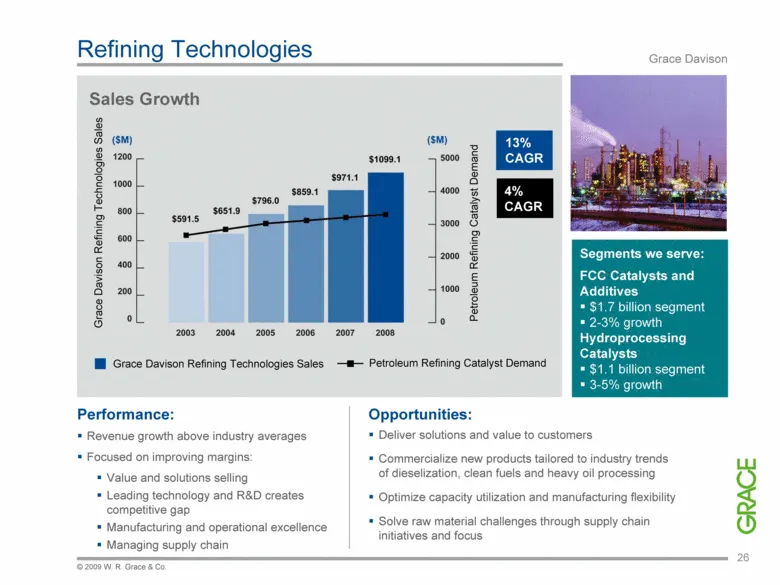
Refining Technologies Grace Davison © 2009 W. R. Grace & Co. Segments we serve: FCC Catalysts and Additives $1.7 billion segment 2-3% growth Hydroprocessing Catalysts $1.1 billion segment 3-5% growth Performance: Revenue growth above industry averages Focused on improving margins: Value and solution
Slide 25: Refining Technologies Key Drivers and Growth Opportunities
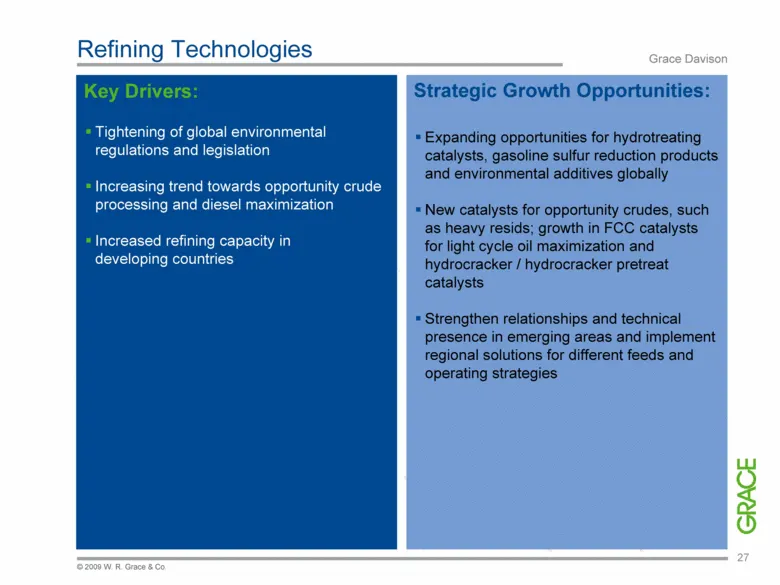
Grace Davison © 2009 W. R. Grace & Co. Refining Technologies Key Drivers: Strategic Growth Opportunities: Tightening of global environmental regulations and legislation Increasing trend towards opportunity crude processing and diesel maximization Increased refining capacity in developing countries E
Slide 26: Materials Technologies
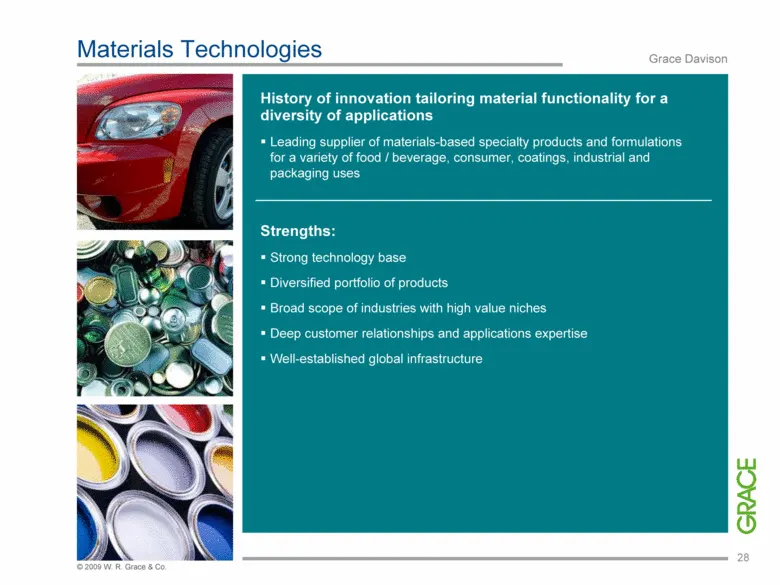
Materials Technologies Grace Davison History of innovation tailoring material functionality for a diversity of applications Leading supplier of materials-based specialty products and formulations for a variety of food / beverage, consumer, coatings, industrial and packaging uses Strengths: Strong te
Slide 27: Materials Technologies Sales Growth
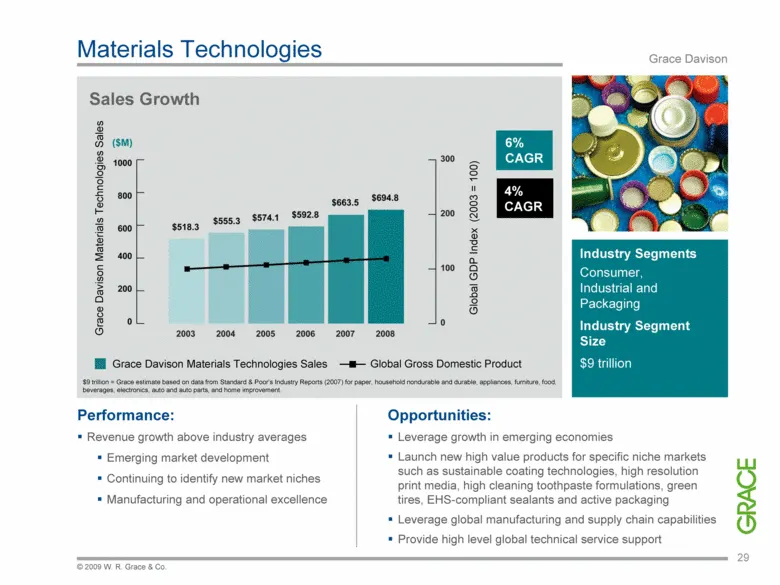
Materials Technologies Grace Davison © 2009 W. R. Grace & Co. Sales Growth Grace Davison Materials Technologies Sales Global Gross Domestic Product Grace Davison Materials Technologies Sales Global GDP Index (2003 = 100) 6% CAGR 4% CAGR $9 trillion = Grace estimate based on data from Standard & Poor
Slide 28: Key Applications for Materials Technologies
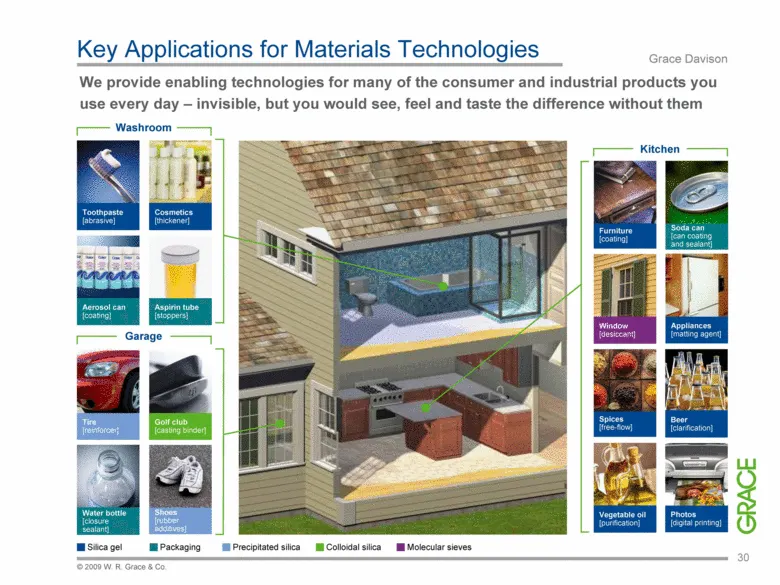
Key Applications for Materials Technologies Grace Davison © 2009 W. R. Grace & Co. Kitchen Garage We provide enabling technologies for many of the consumer and industrial products you use every day – invisible, but you would see, feel and taste the difference without them Tire [reinforcer] Golf club
Slide 29: Materials Technologies Key Drivers and Growth Opportunities
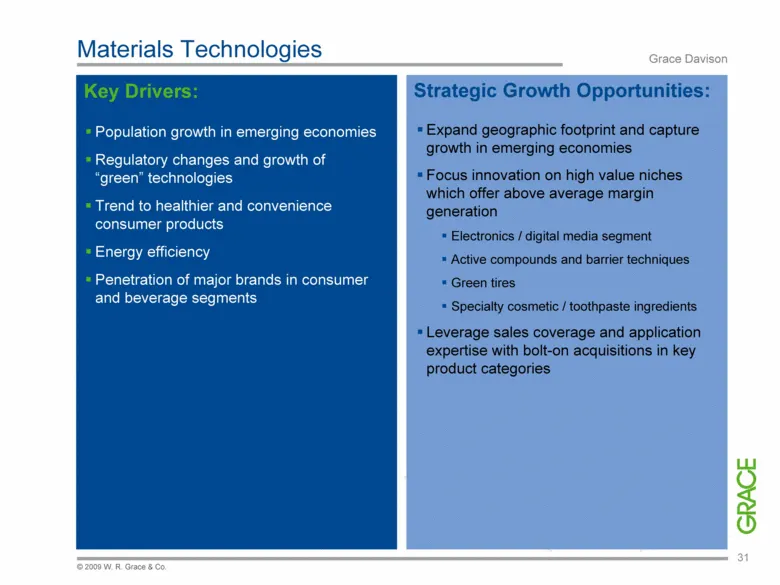
Grace Davison © 2009 W. R. Grace & Co. Materials Technologies Key Drivers: Strategic Growth Opportunities: Population growth in emerging economies Regulatory changes and growth of “green” technologies Trend to healthier and convenience consumer products Energy efficiency Penetration of major brands
Slide 30: Specialty Technologies
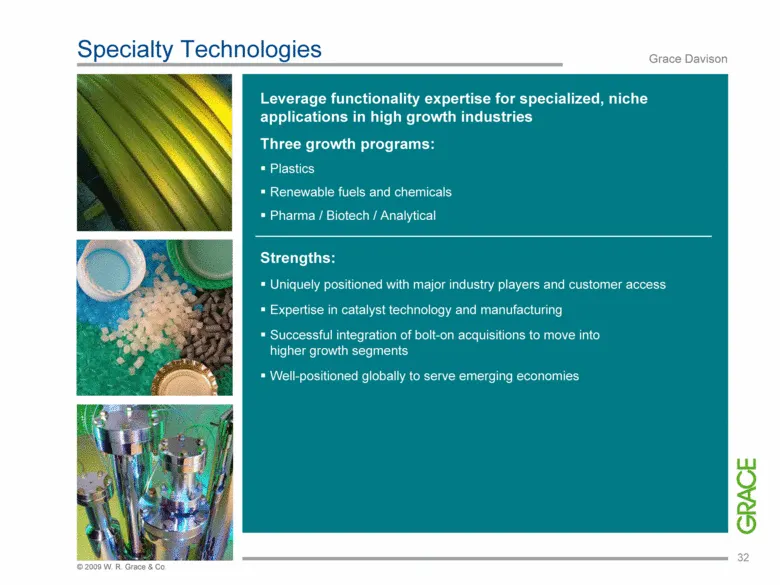
Specialty Technologies Grace Davison Leverage functionality expertise for specialized, niche applications in high growth industries Three growth programs: Plastics Renewable fuels and chemicals Pharma / Biotech / Analytical Strengths: Uniquely positioned with major industry players and customer acce
Slide 31: Specialty Technologies Opportunities
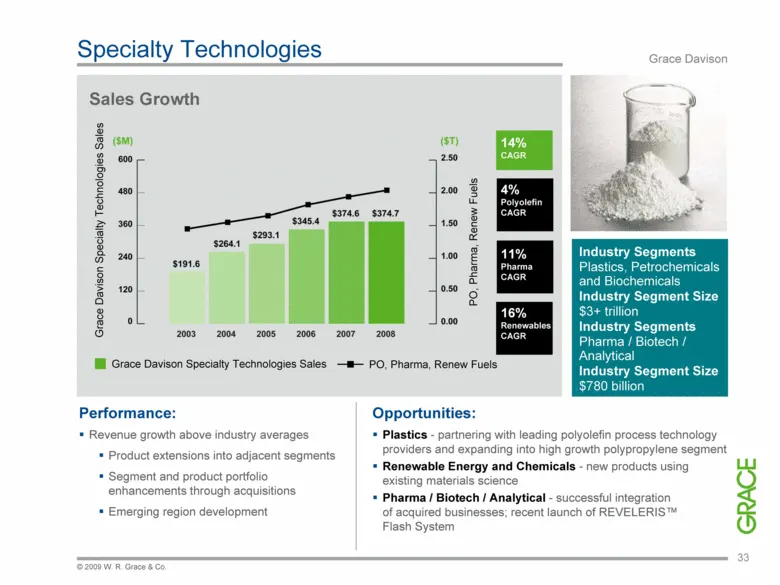
Specialty Technologies Grace Davison Opportunities: Plastics - partnering with leading polyolefin process technology providers and expanding into high growth polypropylene segment Renewable Energy and Chemicals - new products using existing materials science Pharma / Biotech / Analytical - successfu
Slide 32: Polyolefin Catalysts and Components
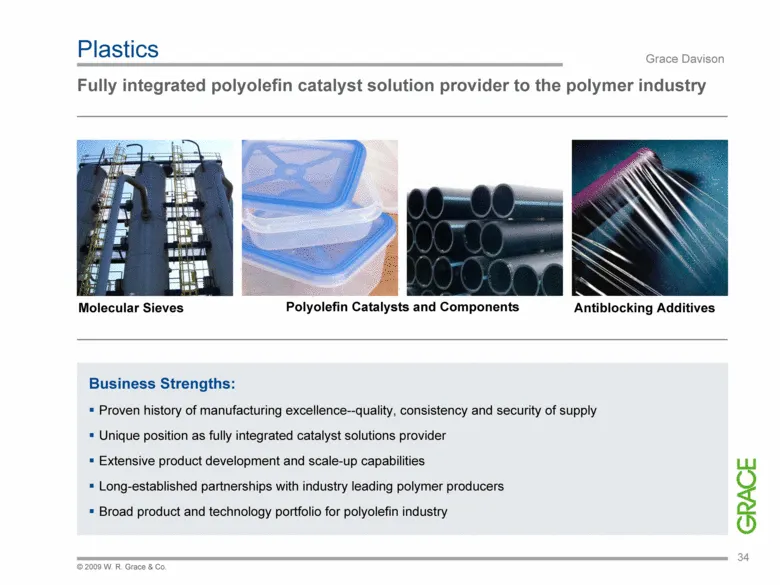
© 2009 W. R. Grace & Co. Polyolefin Catalysts and Components Plastics Grace Davison Fully integrated polyolefin catalyst solution provider to the polymer industry 34 Antiblocking Additives Molecular Sieves Business Strengths: Proven history of manufacturing excellence—quality, consistency and securi
Slide 33: Plastics Key Drivers and Growth Opportunities
Grace Davison © 2009 W. R. Grace & Co. Plastics Key Drivers: Strategic Growth Opportunities: $1 billion catalyst industry growing at 5% CAGR Per capita resin consumption will continue to increase in developing economies* 14 lbs. per person versus 80 lbs. per person (average consumption of advanced e
Slide 34: Renewables: Fuels and Chemicals
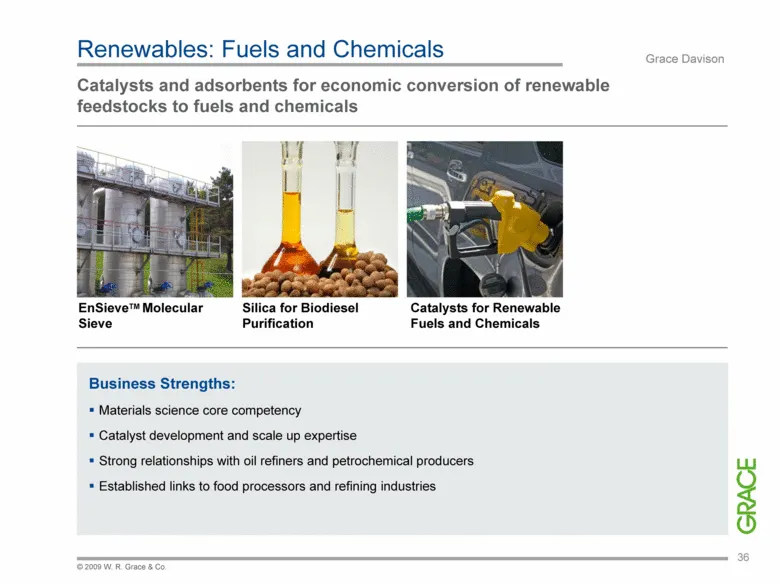
© 2009 W. R. Grace & Co. Renewables: Fuels and Chemicals Grace Davison Catalysts and adsorbents for economic conversion of renewable feedstocks to fuels and chemicals EnSieveTM Molecular Sieve Silica for Biodiesel Purification Catalysts for Renewable Fuels and Chemicals Business Strengths: Materials
Slide 35: Renewables Key Drivers and Growth Opportunities
Grace Davison © 2009 W. R. Grace & Co. Renewables: Fuels and Chemicals Key Drivers: Renewables segment growing at 25% CAGR to $400 billion by 2015* Strategic Growth Opportunities: Develop improved desiccants, adsorbents, and catalysts that enable the economic production of fuels and chemicals from b
Slide 36: Pharma / Biotech / Analytical
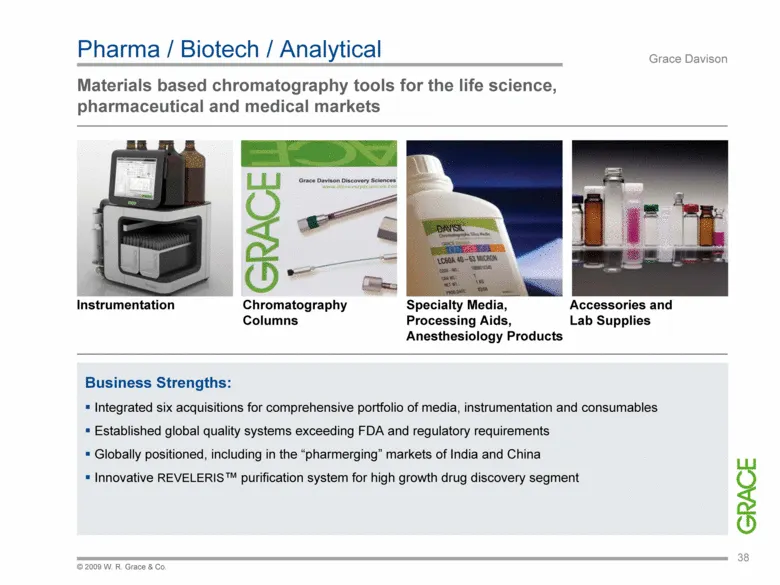
Pharma / Biotech / Analytical Grace Davison Materials based chromatography tools for the life science, pharmaceutical and medical markets © 2009 W. R. Grace & Co. 38 Instrumentation Chromatography Columns Specialty Media, Processing Aids, Anesthesiology Products Accessories and Lab Supplies Business
Slide 37: Pharma / Biotech / Analytical Key Drivers
Grace Davison © 2009 W. R. Grace & Co. Pharma / Biotech / Analytical Key Drivers: Strategic Growth Opportunities: $182 billion of blockbuster drugs coming off patents 2011-2014 $123 billion R&D spend at 3% growth to $144 billion next 5 years Biotech evolution set to overtake conventional technology
Slide 38: Innovation for Growth
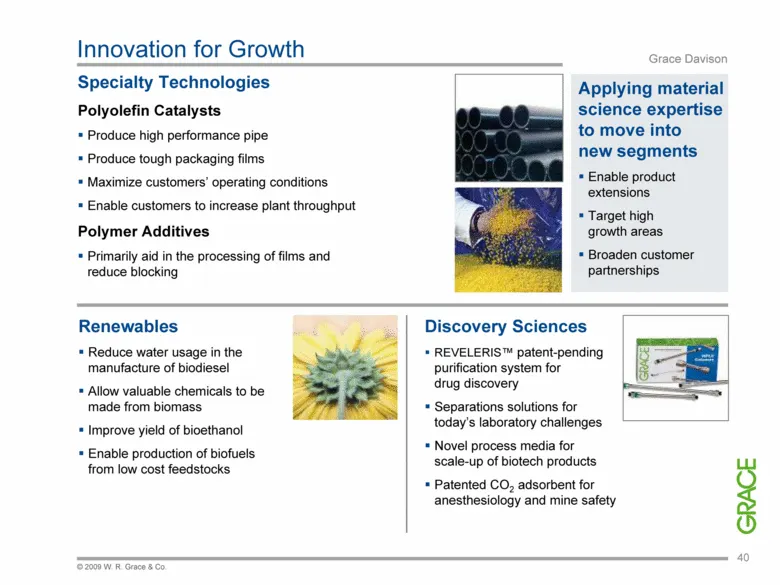
Innovation for Growth Grace Davison Specialty Technologies Polyolefin Catalysts Produce high performance pipe Produce tough packaging films Maximize customers’ operating conditions Enable customers to increase plant throughput Polymer Additives Primarily aid in the processing of films and reduce blo
Slide 39: Grace Davison Profitability
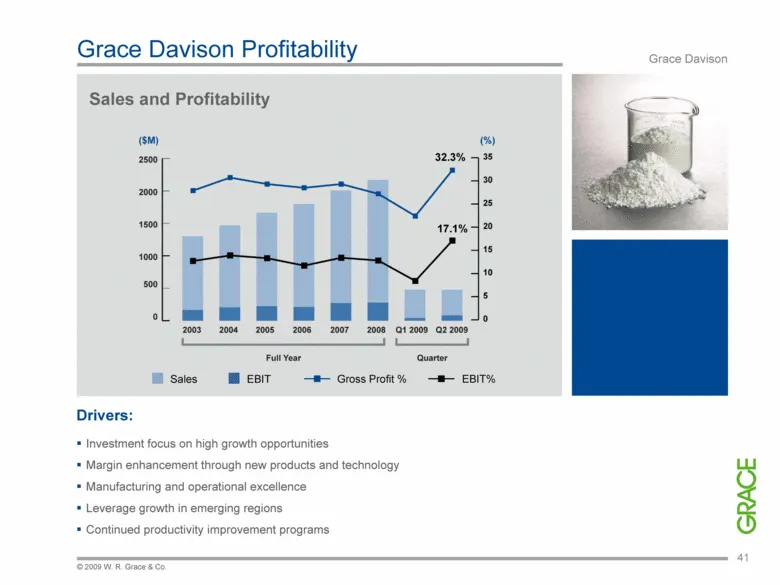
© 2009 W. R. Grace & Co. Grace Davison Profitability Grace Davison Sales and Profitability 17.1% 32.3% Sales EBIT EBIT% Gross Profit % Drivers: Investment focus on high growth opportunities Margin enhancement through new products and technology Manufacturing and operational excellence Leverage growt
Slide 40: Grace Davison Summary
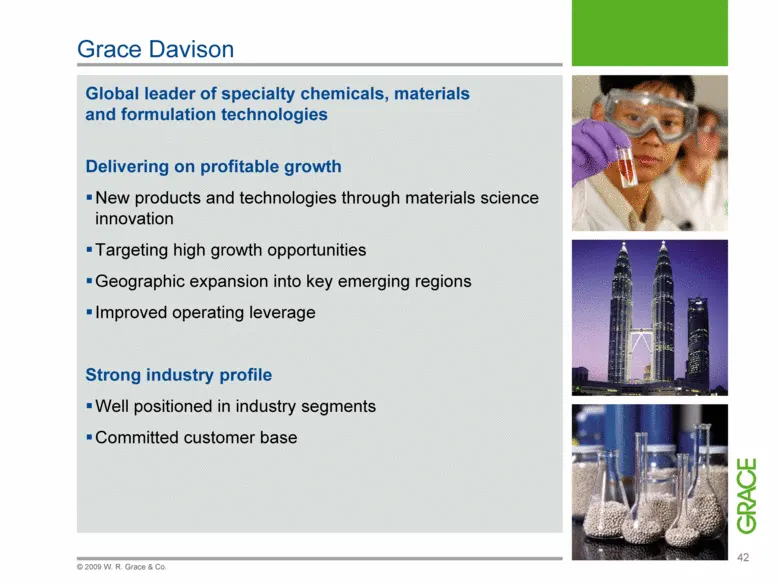
Grace Davison Global leader of specialty chemicals, materials and formulation technologies Delivering on profitable growth New products and technologies through materials science innovation Targeting high growth opportunities Geographic expansion into key emerging regions Improved operating leverage

Slide 41: Construction Products
Construction Products 43 © 2009 W. R. Grace & Co.
Slide 42: Building the Future
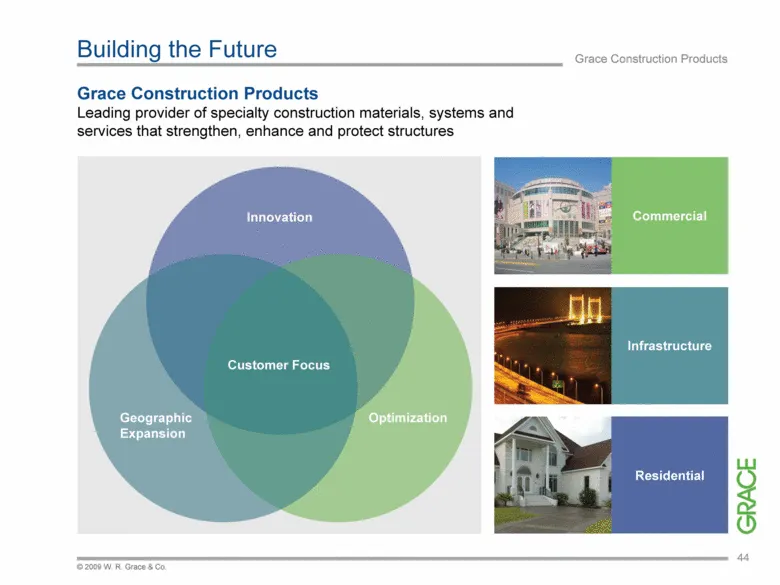
Building the Future Grace Construction Products Leading provider of specialty construction materials, systems and services that strengthen, enhance and protect structures Grace Construction Products Innovation Customer Focus Geographic Expansion Optimization Commercial Infrastructure Residential 44
Slide 43: Our Focus
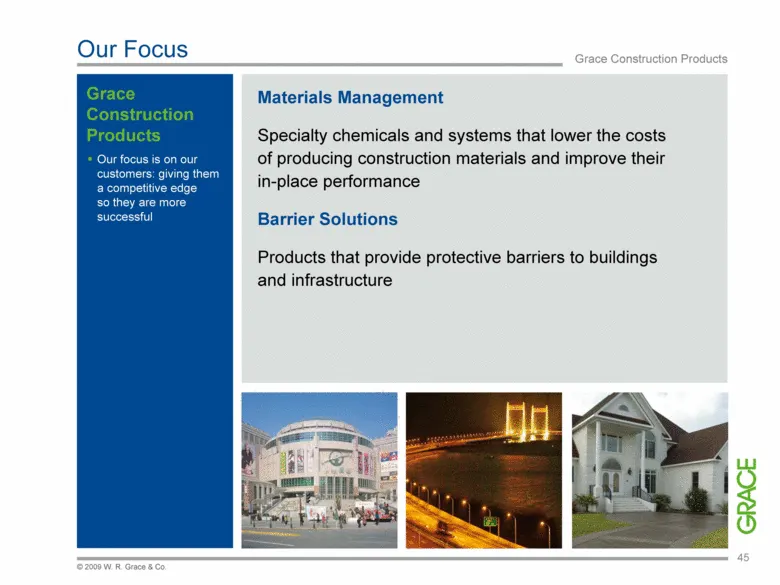
© 2009 W. R. Grace & Co. Our Focus Grace Construction Products Our focus is on our customers: giving them a competitive edge so they are more successful Grace Construction Products Materials Management Specialty chemicals and systems that lower the costs of producing construction materials and impro
Slide 44: Business Profile
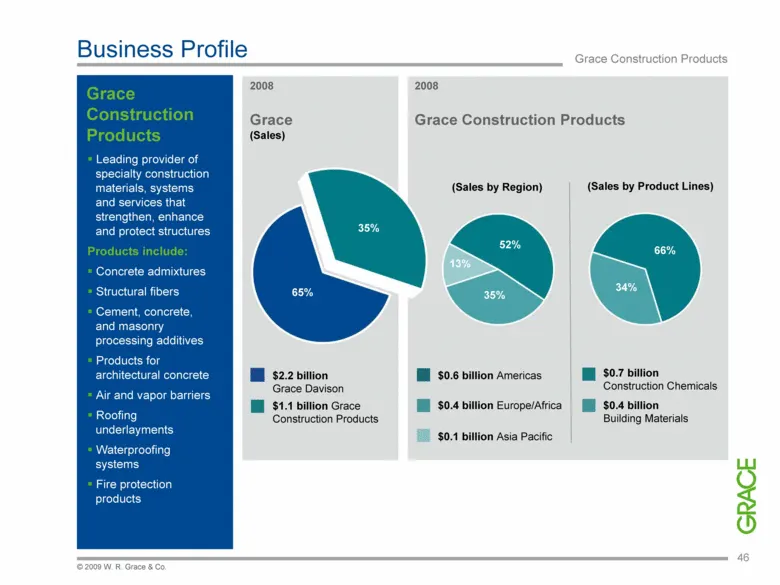
Business Profile Grace Construction Products 2008 Grace Construction Products $0.4 billion Europe/Africa $0.6 billion Americas $0.1 billion Asia Pacific 52% 35% 13% Leading provider of specialty construction materials, systems and services that strengthen, enhance and protect structures Products inc
Slide 45: Strengths
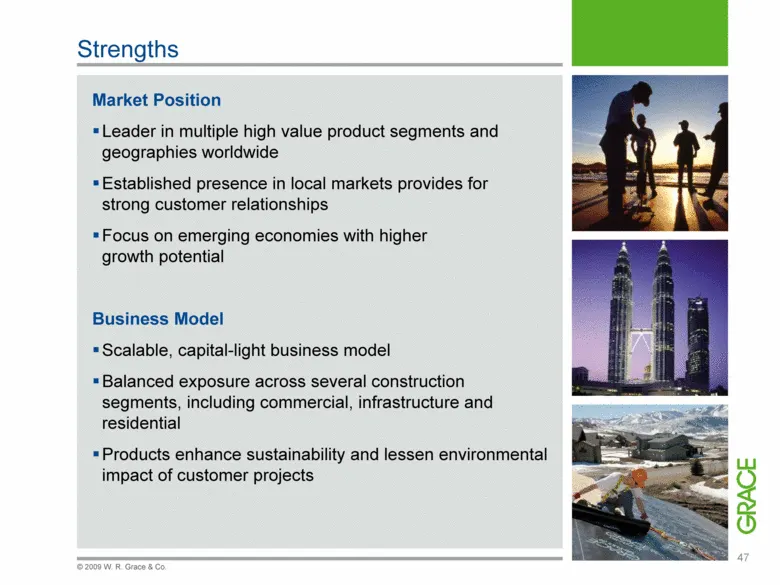
Strengths Market Position Leader in multiple high value product segments and geographies worldwide Established presence in local markets provides for strong customer relationships Focus on emerging economies with higher growth potential Business Model Scalable, capital-light business model Balanced
Slide 46: Customers and Influencers
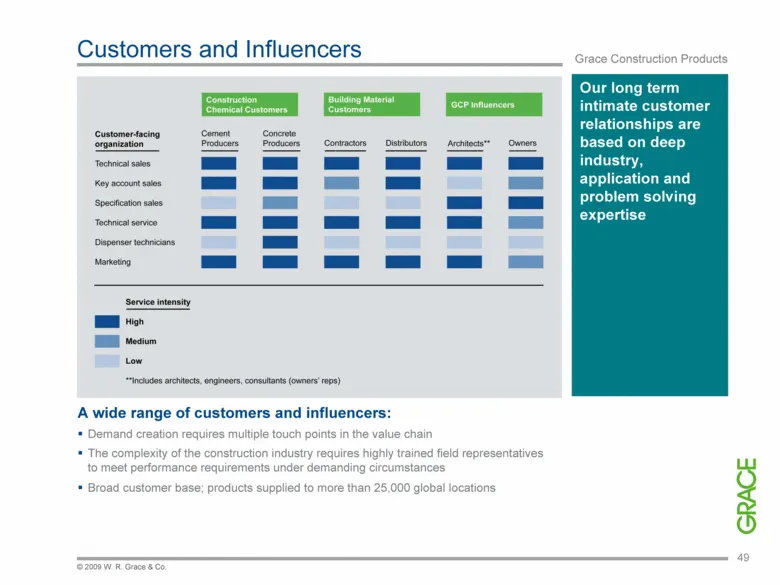
© 2009 W. R. Grace & Co. Customers and Influencers Grace Construction Products Our long term intimate customer relationships are based on deep industry, application and problem solving expertise A wide range of customers and influencers: Demand creation requires multiple touch points in the value ch
Slide 47: Competitors
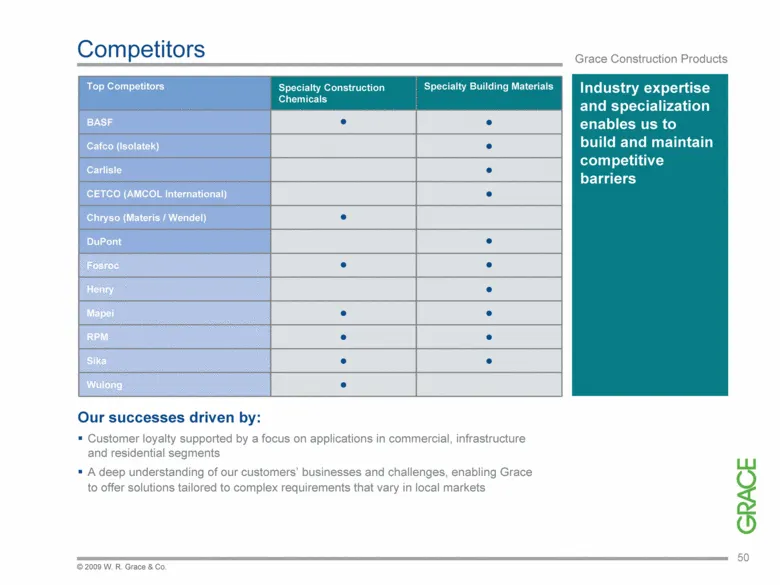
Competitors Grace Construction Products Top Competitors Specialty Construction Chemicals Specialty Building Materials BASF Cafco (Isolatek) Carlisle CETCO (AMCOL International) Chryso (Materis / Wendel) DuPont Fosroc Henry Mapei RPM Sika Wulong Industry expertise and specialization enables us to bui
Slide 48: Culture of Innovation
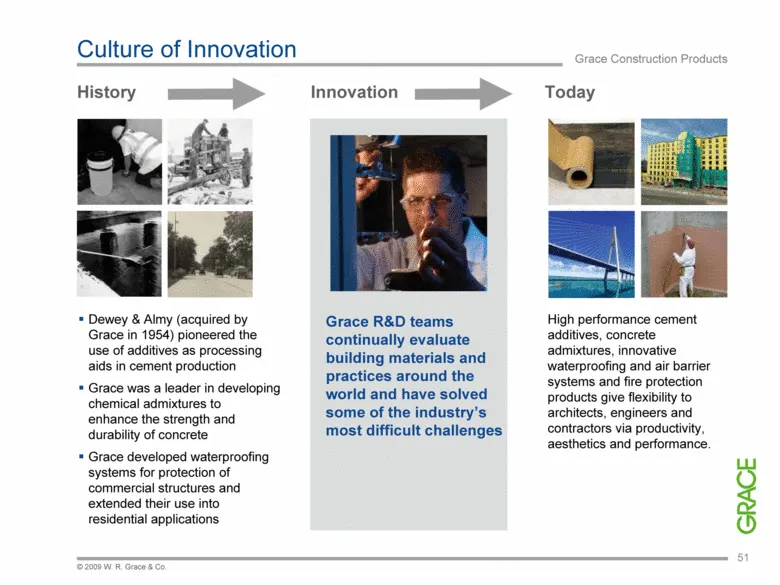
Culture of Innovation Grace Construction Products History Innovation Today High performance cement additives, concrete admixtures, innovative waterproofing and air barrier systems and fire protection products give flexibility to architects, engineers and contractors via productivity, aesthetics and
Slide 49: Innovation at Work
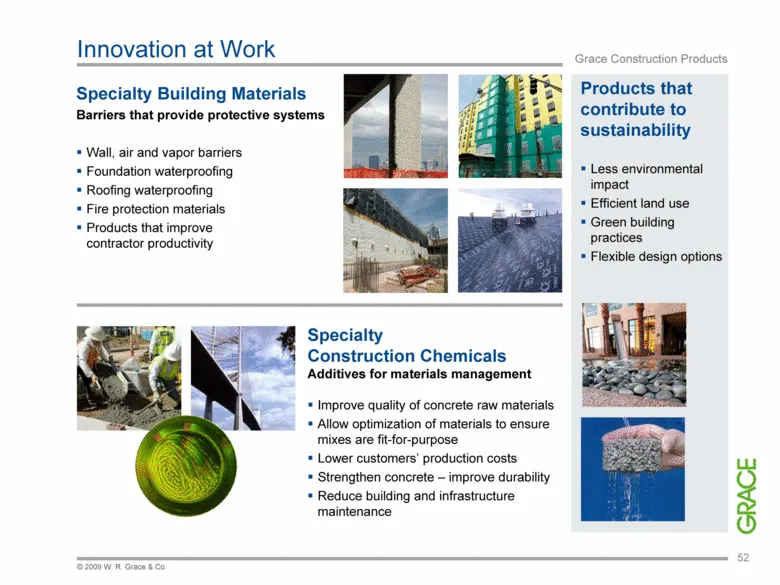
Innovation at Work Grace Construction Products Specialty Construction Chemicals Additives for materials management Improve quality of concrete raw materials Allow optimization of materials to ensure mixes are fit-for-purpose Lower customers’ production costs Strengthen concrete – improve durability
Slide 50: Commercial Building Applications
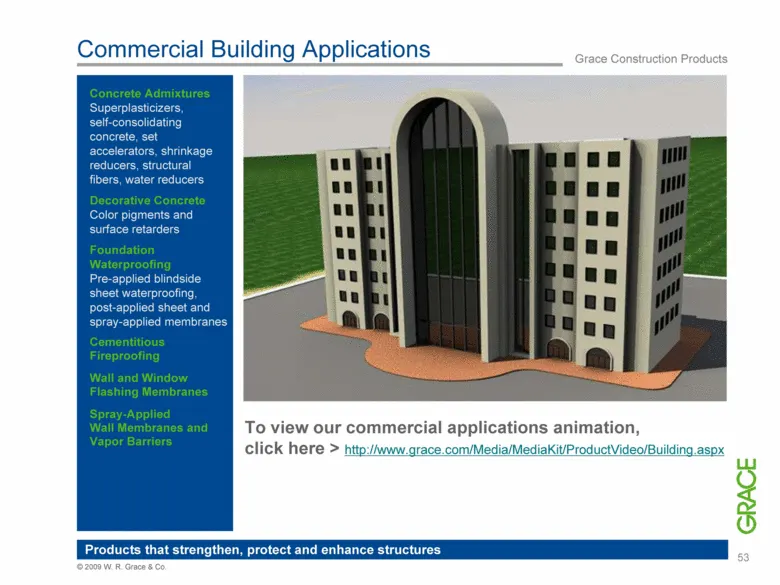
Commercial Building Applications Products that strengthen, protect and enhance structures Concrete Admixtures Superplasticizers, self-consolidating concrete, set accelerators, shrinkage reducers, structural fibers, water reducers Decorative Concrete Color pigments and surface retarders Foundation Wa
Slide 51: Infrastructure Applications
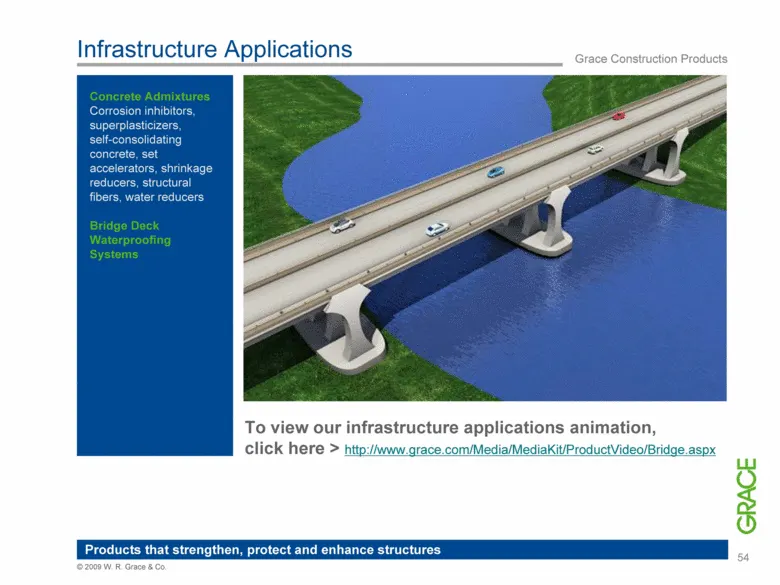
Infrastructure Applications Products that strengthen, protect and enhance structures Concrete Admixtures Corrosion inhibitors, superplasticizers, self-consolidating concrete, set accelerators, shrinkage reducers, structural fibers, water reducers Bridge Deck Waterproofing Systems To view our infrast
Slide 52: Residential Applications
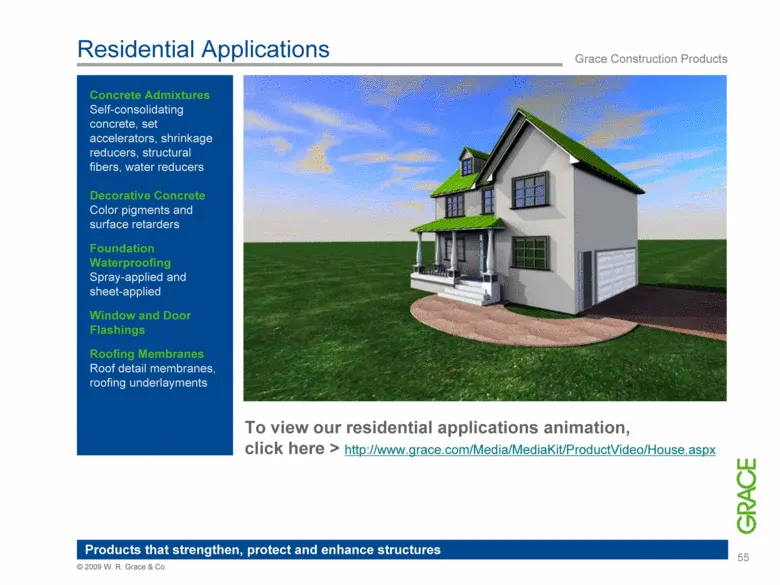
Residential Applications Products that strengthen, protect and enhance structures Concrete Admixtures Self-consolidating concrete, set accelerators, shrinkage reducers, structural fibers, water reducers Decorative Concrete Color pigments and surface retarders Foundation Waterproofing Spray-applied a
Slide 53: Industry Growth Drivers
56 © 2009 W. R. Grace & Co. Industry Growth Drivers Global demographics and development in emerging economies Macro trends such as energy conservation and sustainability / Green Building Increasing sophistication of building and construction practices Credit market recovery, with improved financing
Slide 54: 2003-2008 Construction Spending Growth
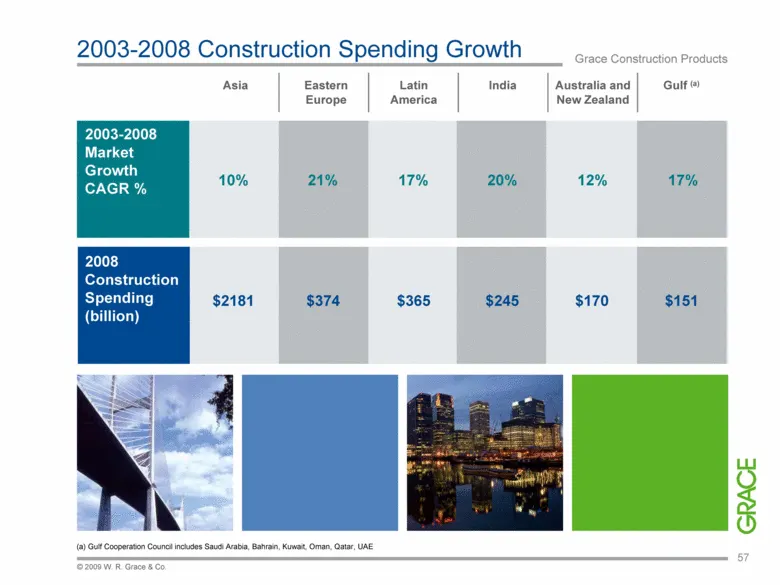
2003-2008 Construction Spending Growth Grace Construction Products © 2009 W. R. Grace & Co. 57 Asia (a) Gulf Cooperation Council includes Saudi Arabia, Bahrain, Kuwait, Oman, Qatar, UAE 10% 21% 17% 20% 12% 17% $2181 $374 $365 $245 $170 $151 2003-2008 Market Growth CAGR % 2008 Construction Spending (
Slide 55: Global Stimulus Programs
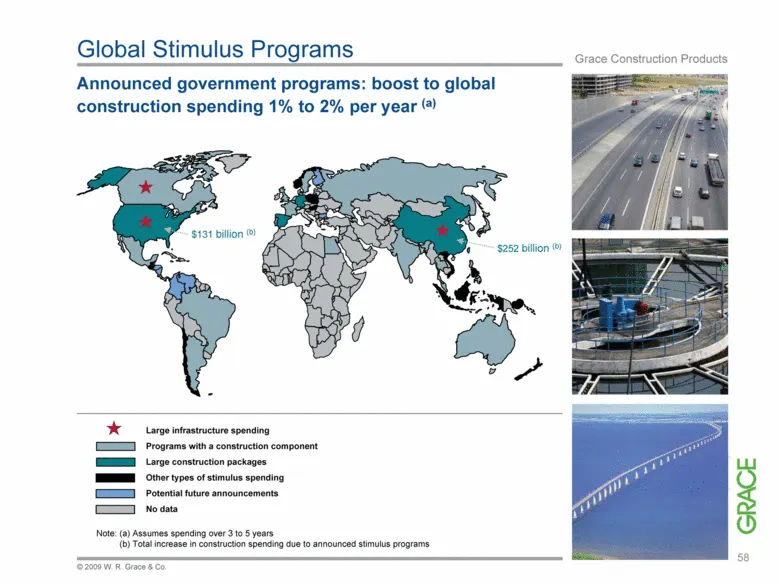
Global Stimulus Programs Announced government programs: boost to global construction spending 1% to 2% per year (a) Grace Construction Products Large infrastructure spending Programs with a construction component Large construction packages Other types of stimulus spending Potential future announcem
Slide 56: Grace Construction Products Profitability
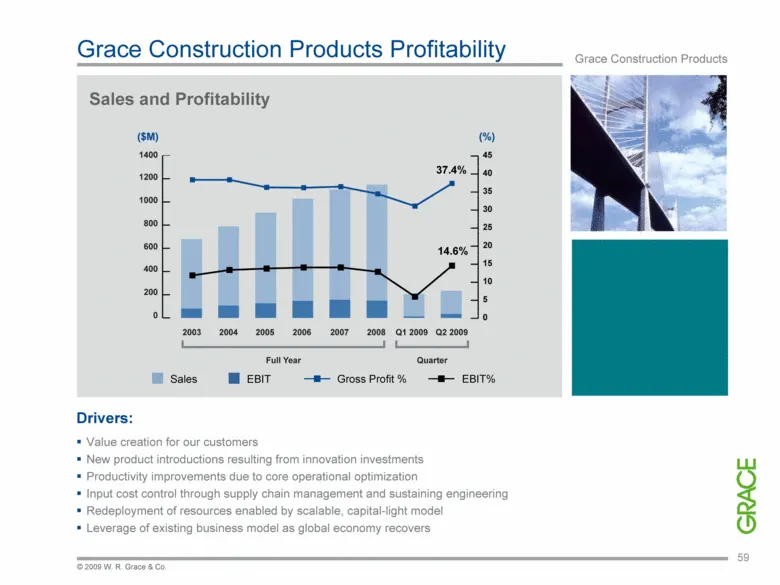
© 2009 W. R. Grace & Co. 59 Grace Construction Products Grace Construction Products Profitability Sales and Profitability Sales EBIT EBIT% Gross Profit % 14.6% 37.4% Drivers: Value creation for our customers New product introductions resulting from innovation investments Productivity improvements du
Slide 57: Contact Us
W. R. Grace & Co. Contact Us 7500 Grace Drive Columbia, Maryland 21044 USA Investor Relations +1 410.531.4167 investor.relations@grace.com www.grace.com 61 © 2009 W. R. Grace & Co.
Slide 58: Non-GAAP Financial Terms
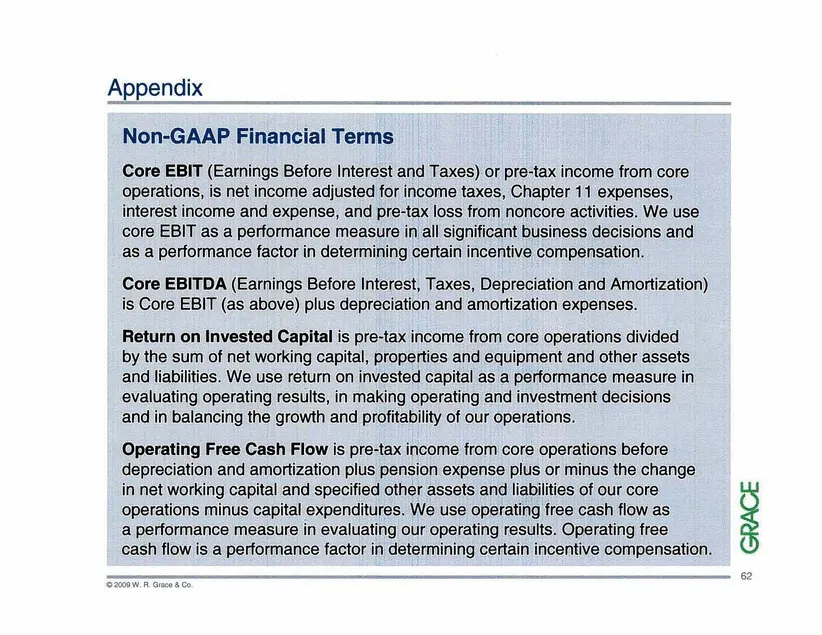
© 2009 W. R. Grace & Co. Non-GAAP Financial Terms Core EBIT (Earnings Before Interest and Taxes) or pre-tax income from core operations, is net income adjusted for income taxes, Chapter 11 expenses, interest income and expense, and pre-tax loss from noncore activities. We use core EBIT as a performa
Slide 59: Non-GAAP measures limitations
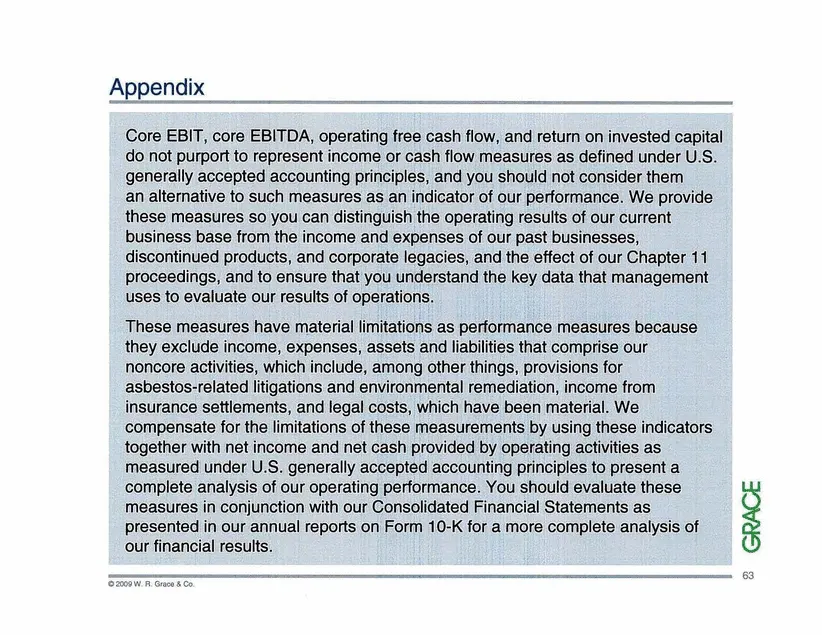
© 2009 W. R. Grace & Co. Core EBIT, Core EBITDA, operating free cash flow, and return on invested capital do not purport to represent income or cash flow measures as defined under U.S. generally accepted accounting principles, and you should not consider them an alternative to such measures as an in
Slide 60: Reconciliation of Non-GAAP Financial Measures
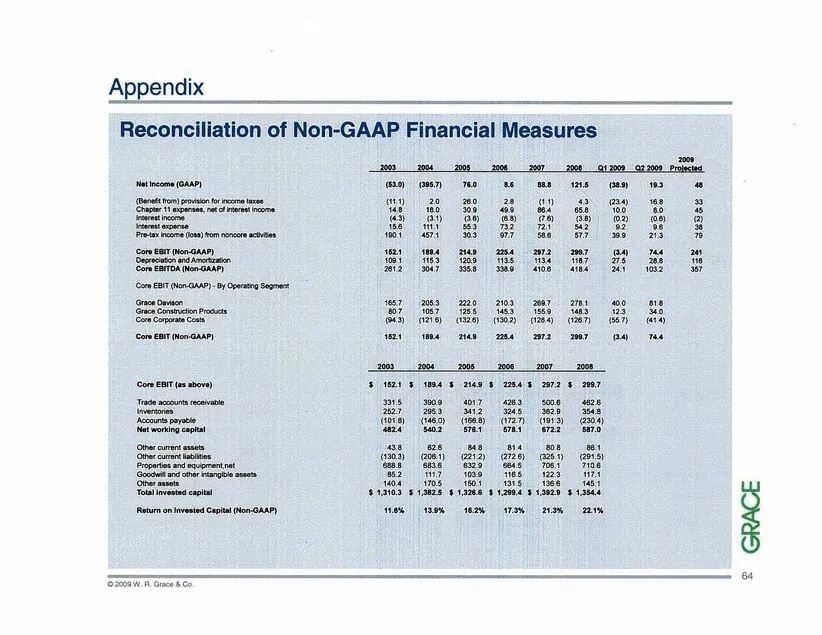
64 © 2009 W. R. Grace & Co. Reconciliation of Non-GAAP Financial Measures 2003 2004 2005 2006 2007 2008 Q1 2009 Q2 2009 Net Income (GAAP) (53.0) (395.7) 76.0 8.6 88.8 121.5 (38.9) 19.3 (Benefit from) provision for income taxes (11.1) 2.0 26.0 2.8 (1.1) 4.3 (23.4) 16.8 Chapter 11 expenses, net of int
Slide 61: Reconciliation of Non-GAAP Financial Measures
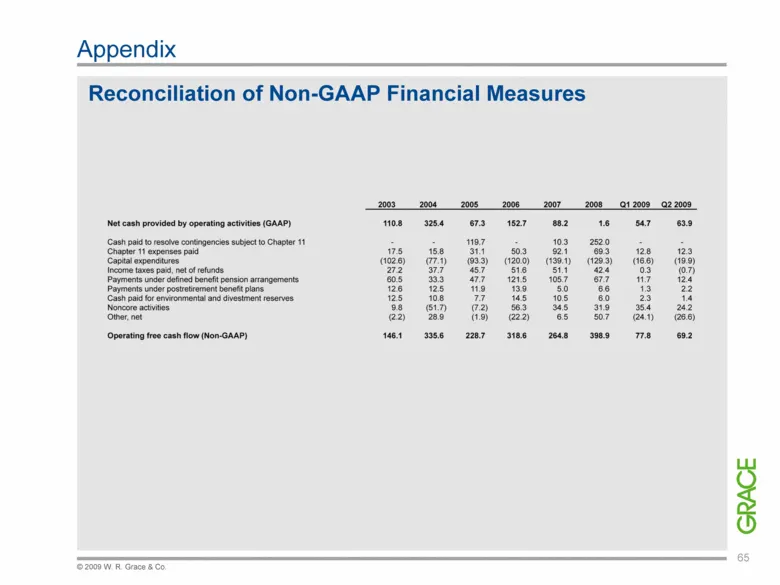
65 © 2009 W. R. Grace & Co. Reconciliation of Non-GAAP Financial Measures Appendix 2003 2004 2005 2006 2007 2008 Q1 2009 Q2 2009 Net cash provided by operating activities (GAAP) 110.8 325.4 67.3 152.7 88.2 1.6 54.7 63.9 Cash paid to resolve contingencies subject to Chapter 11 - - 119.7 - 10.3 252.0
Source: SEC EDGAR · 8-K filed Sep 18, 2009
More decks from W. R. Grace & Co
 Merger or Acquisition (February 2021)11 slides · Feb 26, 2021
 Investor Presentation (September 2020)27 slides · Sep 17, 2020
 Investor Presentation (August 2020)25 slides · Aug 26, 2020
 Investor Presentation (February 2020)25 slides · Feb 11, 2020
 Credit Suisse Basic Materials Conference 201922 slides · Sep 10, 2019
 Deutsche Bank Annual Global Industrials & Materials Summit 201920 slides · Jun 6, 2019