W. R. Grace & — Investor Presentation (September 2020)
27 slides from W. R. Grace &'s investor presentation, Sep 17, 2020
Slide 1: Investor Presentation September 2020
Investor Presentation September 2020
Slide 2: Disclaimer: Safe Harbor for Forward-Looking Statements
DISCLAIMER Statement Regarding Safe Harbor For Forward-Looking Statements This presentation and the exhibits hereto contain forward-looking statements, that is, information related to future, not past, events. Such statements generally include the words “believes,” “plans,” “intends,” “targets,” “wi

Slide 3: Key Messages
Key Messages GRACE Talent | Technology | Trust™
Slide 4: Effectively Executing Through COVID; Reaffirming 3Q20 Planning Assumptions
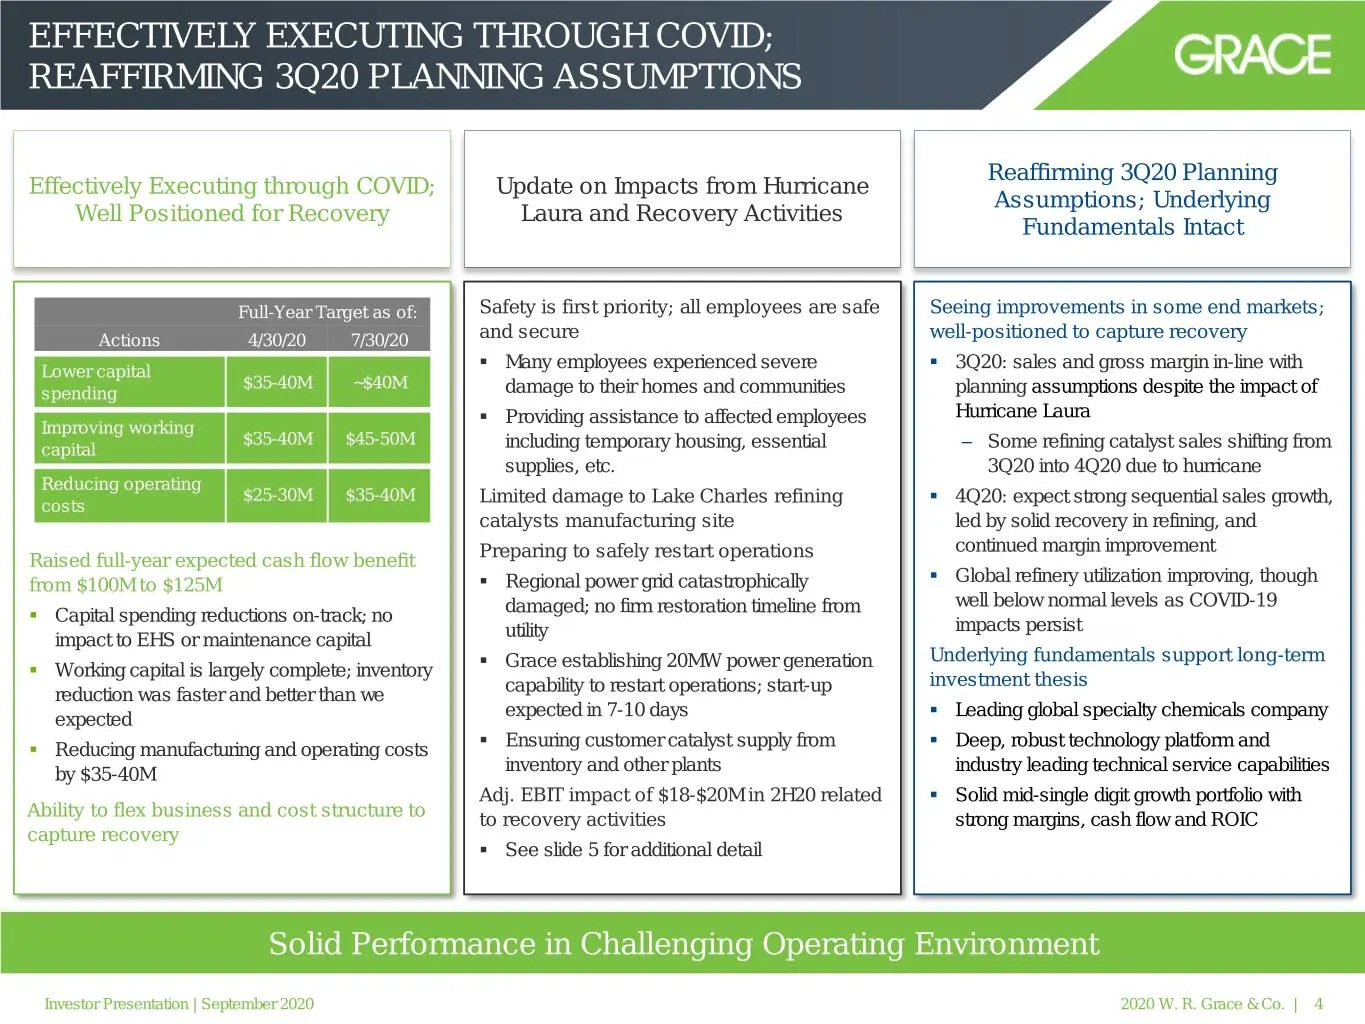
EFFECTIVELY EXECUTING THROUGH COVID; REAFFIRMING 3Q20 PLANNING ASSUMPTIONS Reaffirming 3Q20 Planning Effectively Executing through COVID; Update on Impacts from Hurricane Assumptions; Underlying Well Positioned for Recovery Laura and Recovery Activities Fundamentals Intact Full-Year Target as of: Sa
Slide 5: Second Half Update
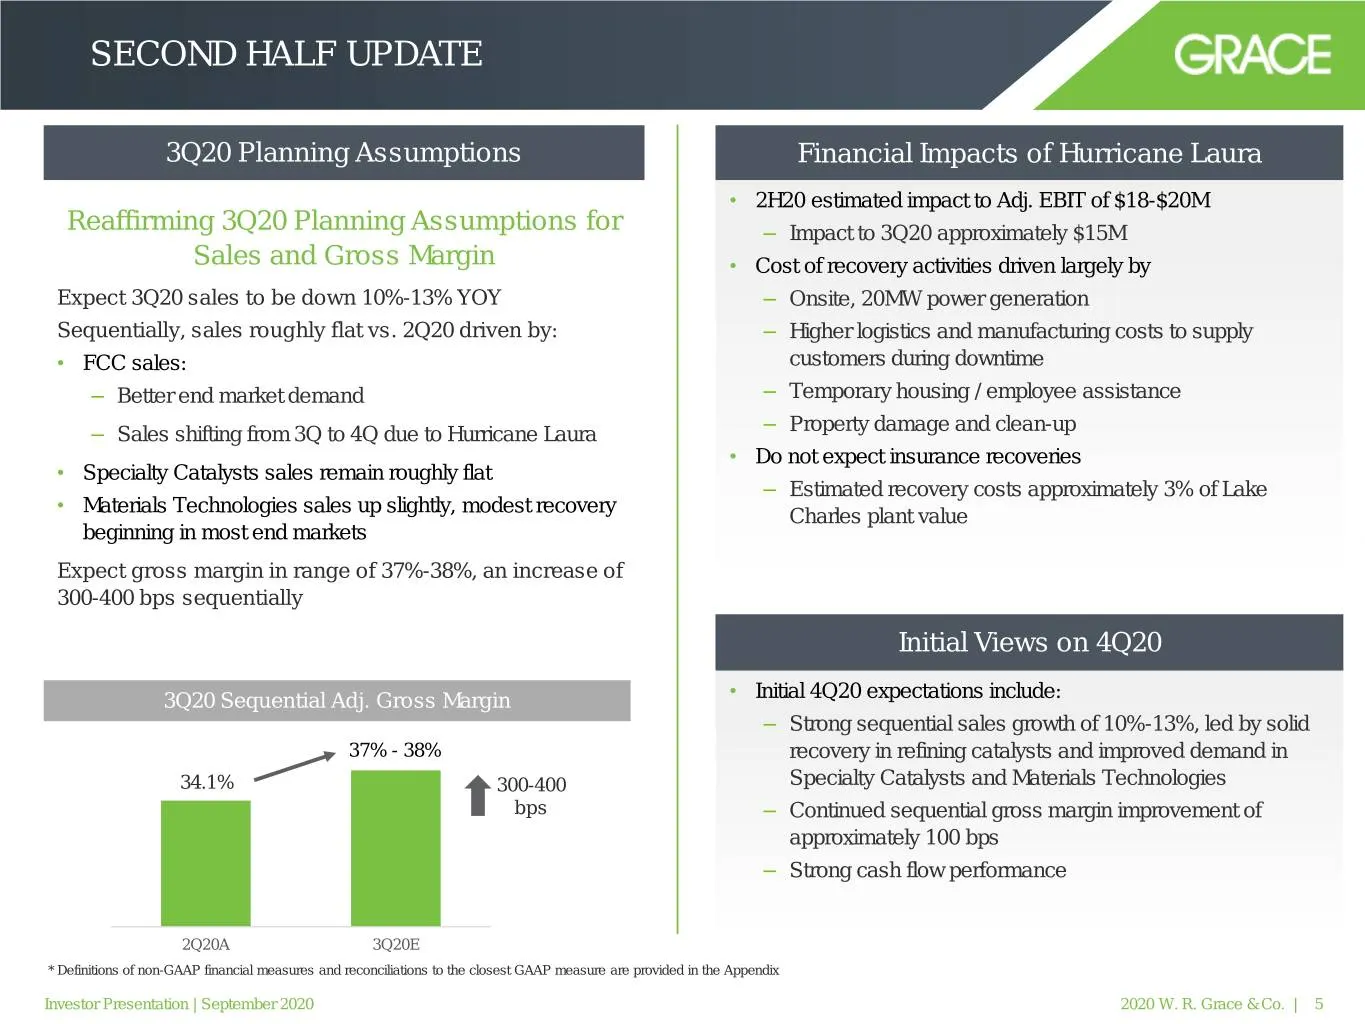
SECOND HALF UPDATE 3Q20 Planning Assumptions Financial Impacts of Hurricane Laura • 2H20 estimated impact to Adj. EBIT of $18-$20M Reaffirming 3Q20 Planning Assumptions for – Impact to 3Q20 approximately $15M Sales and Gross Margin • Cost of recovery activities driven largely by Expect 3Q20 sales to
Slide 6: Long-Term Investment Thesis Remains Intact
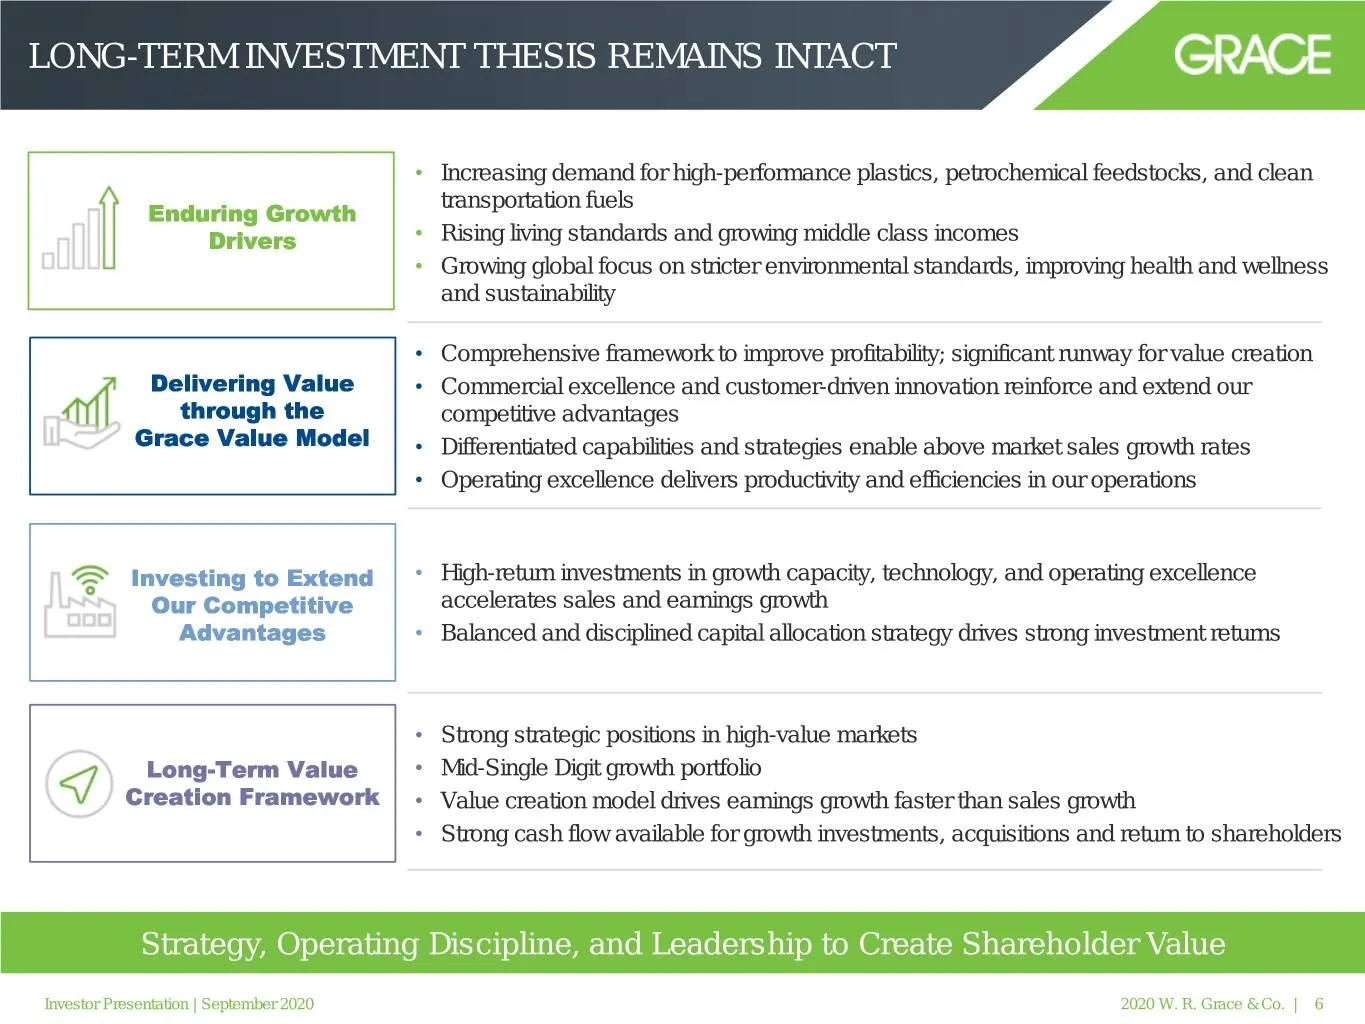
LONG-TERM INVESTMENT THESIS REMAINS INTACT • Increasing demand for high-performance plastics, petrochemical feedstocks, and clean transportation fuels Enduring Growth Drivers • Rising living standards and growing middle class incomes • Growing global focus on stricter environmental standards, improv

Slide 7: Grace Overview & Strategy
Grace Overview & Strategy GRACE Talent | Technology | Trust™
Slide 8: Grace at a Glance
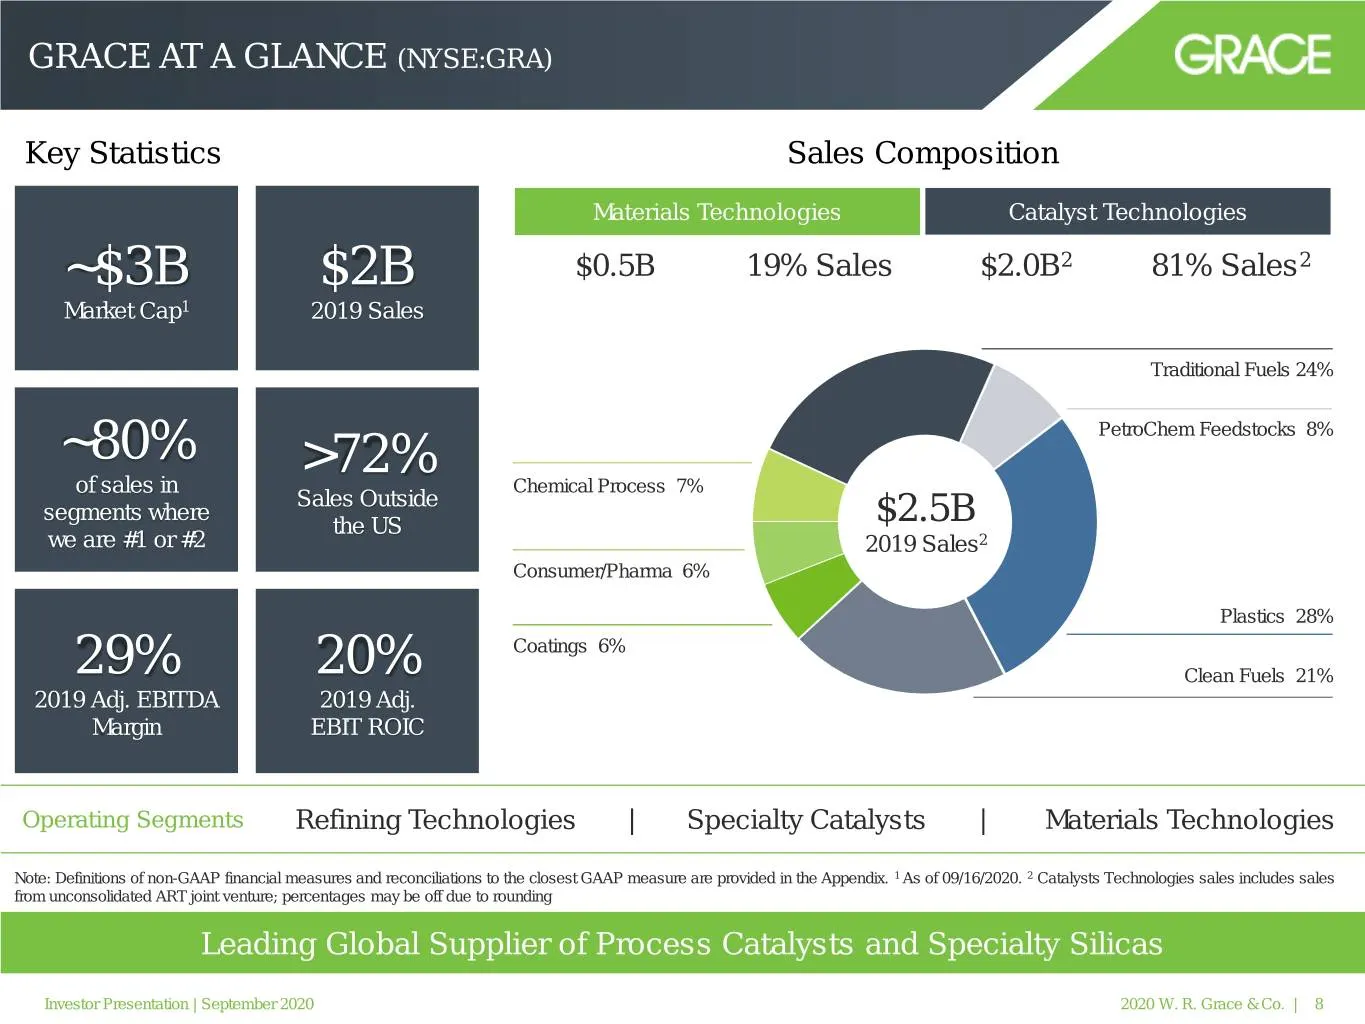
GRACE AT A GLANCE (NYSE:GRA) Key Statistics Sales Composition Materials Technologies Catalyst Technologies ~$3B $2B $0.5B 19% Sales $2.0B2 81% Sales2 Market Cap1 2019 Sales Traditional Fuels 24% PetroChem Feedstocks 8% ~80% >72% of sales in Chemical Process 7% Sales Outside segments where the US $2.
Slide 9: Grace's Leadership Team
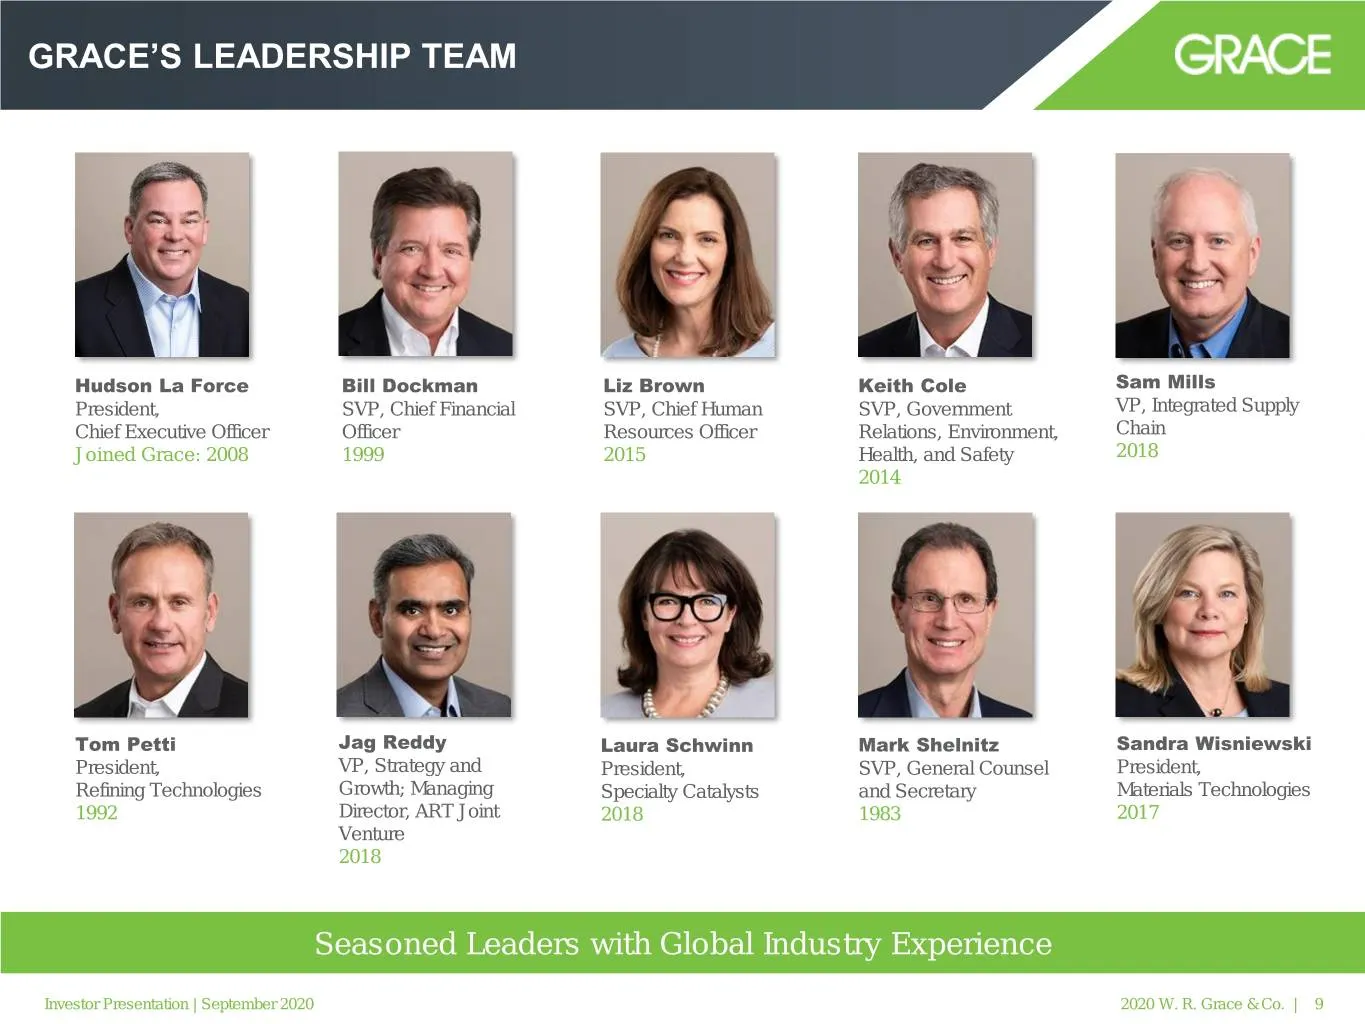
GRACE’S LEADERSHIP TEAM Hudson La Force Bill Dockman Liz Brown Keith Cole Sam Mills President, SVP, Chief Financial SVP, Chief Human SVP, Government VP, Integrated Supply Chief Executive Officer Officer Resources Officer Relations, Environment, Chain Joined Grace: 2008 1999 2015 Health, and Safety 2
Slide 10: Leading Positions in High-Value End Markets Tied to Positive, Secular Trends
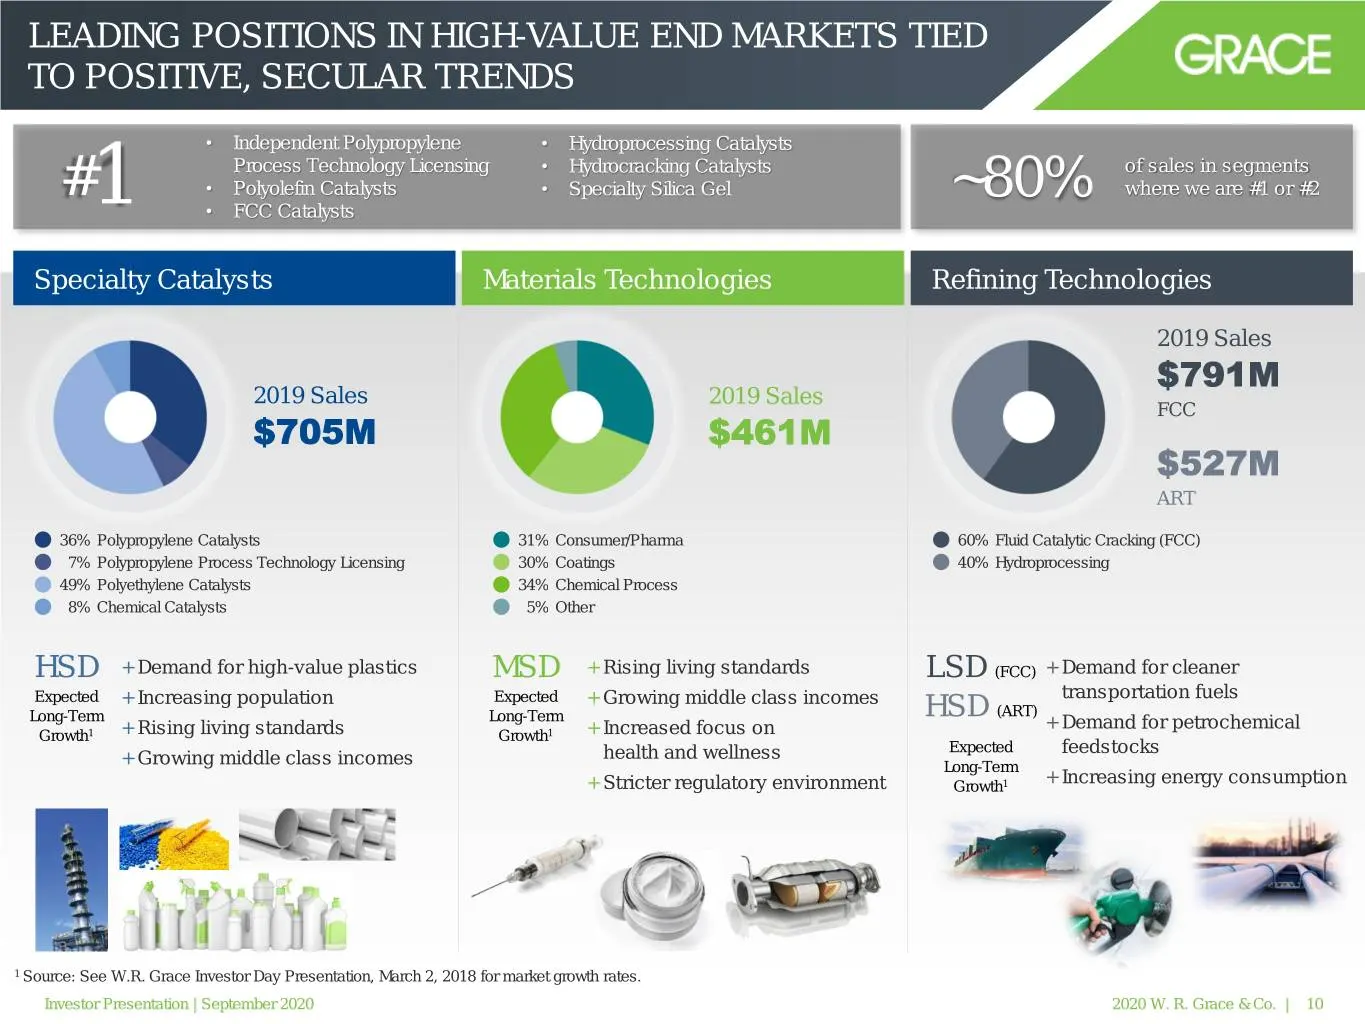
LEADING POSITIONS IN HIGH-VALUE END MARKETS TIED TO POSITIVE, SECULAR TRENDS • Independent Polypropylene • Hydroprocessing Catalysts Process Technology Licensing • Hydrocracking Catalysts of sales in segments #1 • Polyolefin Catalysts • Specialty Silica Gel ~80% where we are #1 or #2 • FCC Catalysts
Slide 11: Leveraging the Grace Value Model to Strengthen Our Competitive Advantage
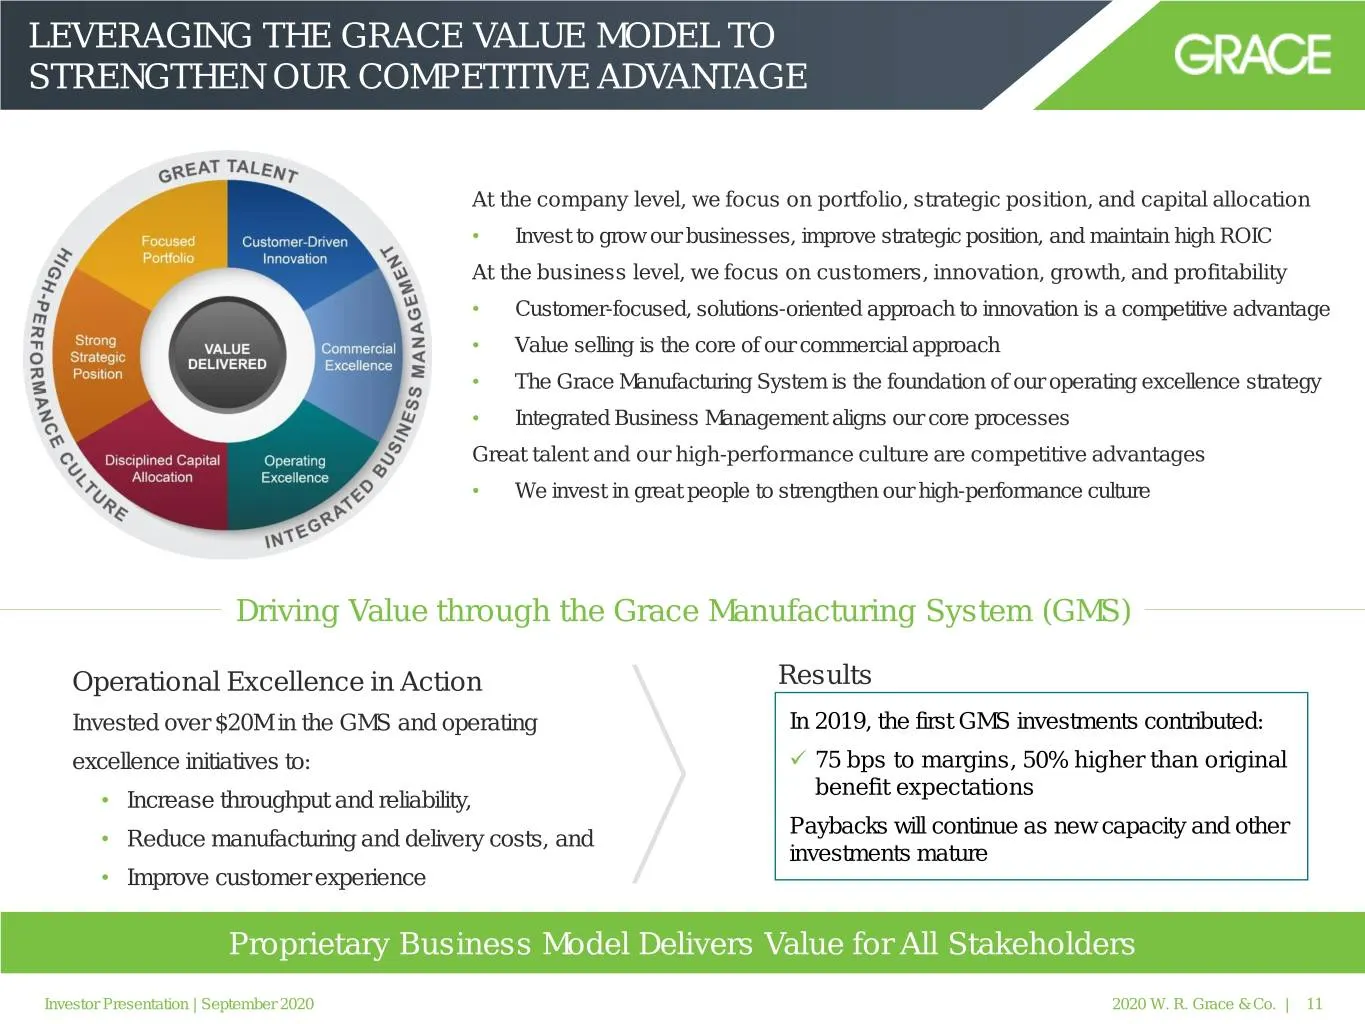
LEVERAGING THE GRACE VALUE MODEL TO STRENGTHEN OUR COMPETITIVE ADVANTAGE At the company level, we focus on portfolio, strategic position, and capital allocation • Invest to grow our businesses, improve strategic position, and maintain high ROIC At the business level, we focus on customers, innovatio
Slide 12: Grace Value Model Drives ESG Excellence
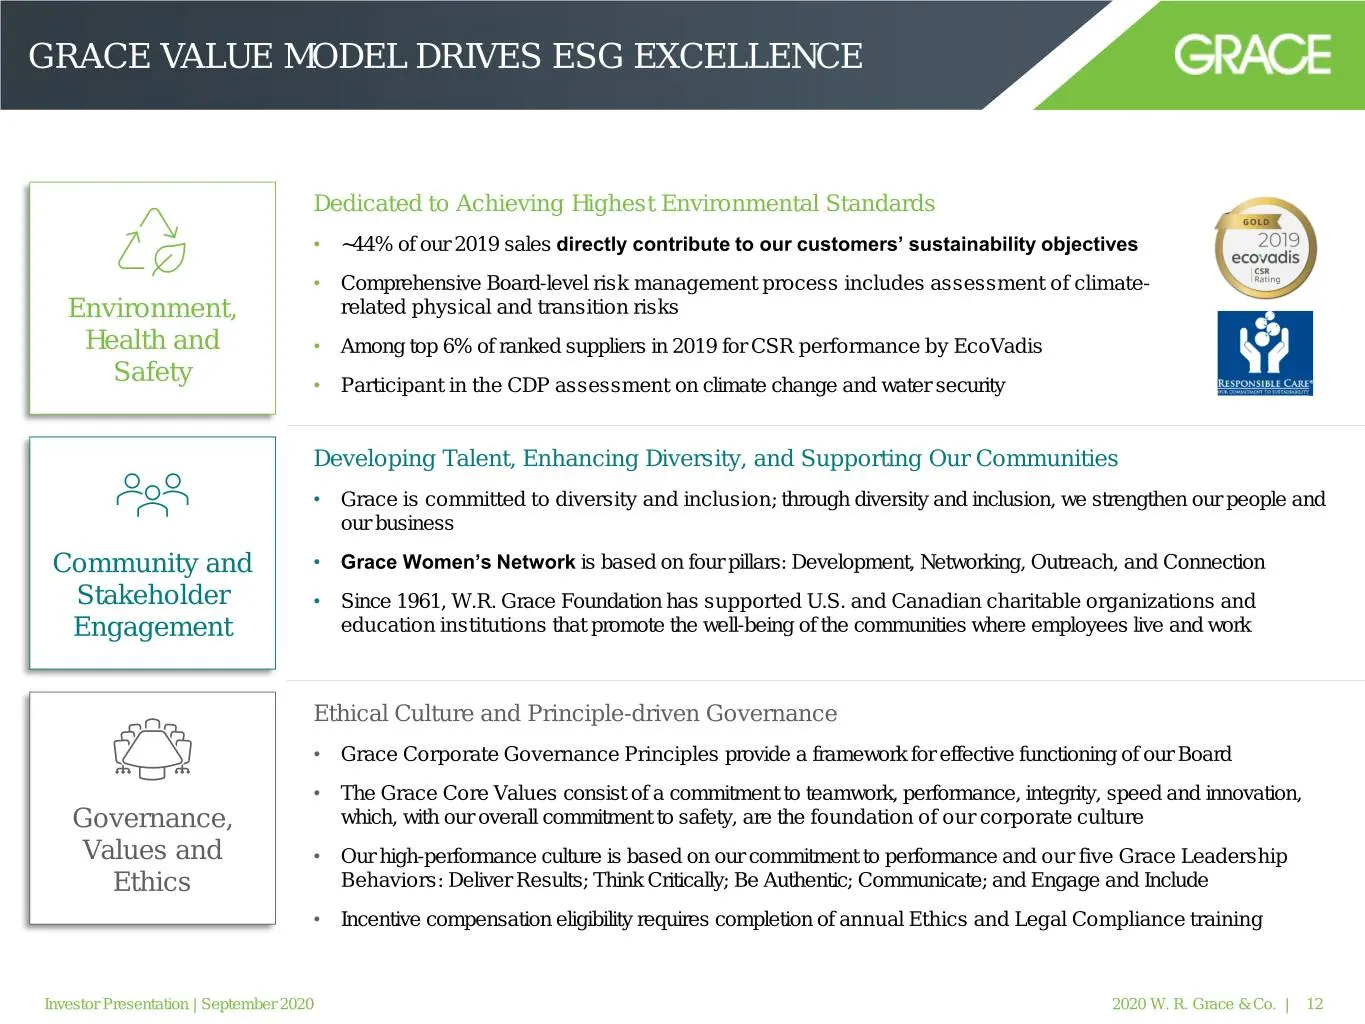
GRACE VALUE MODEL DRIVES ESG EXCELLENCE Dedicated to Achieving Highest Environmental Standards • ~44% of our 2019 sales directly contribute to our customers’ sustainability objectives • Comprehensive Board-level risk management process includes assessment of climate- Environment, related physical an
Slide 13: Products Increasingly Contribute to Our Customers' Sustainability Objectives
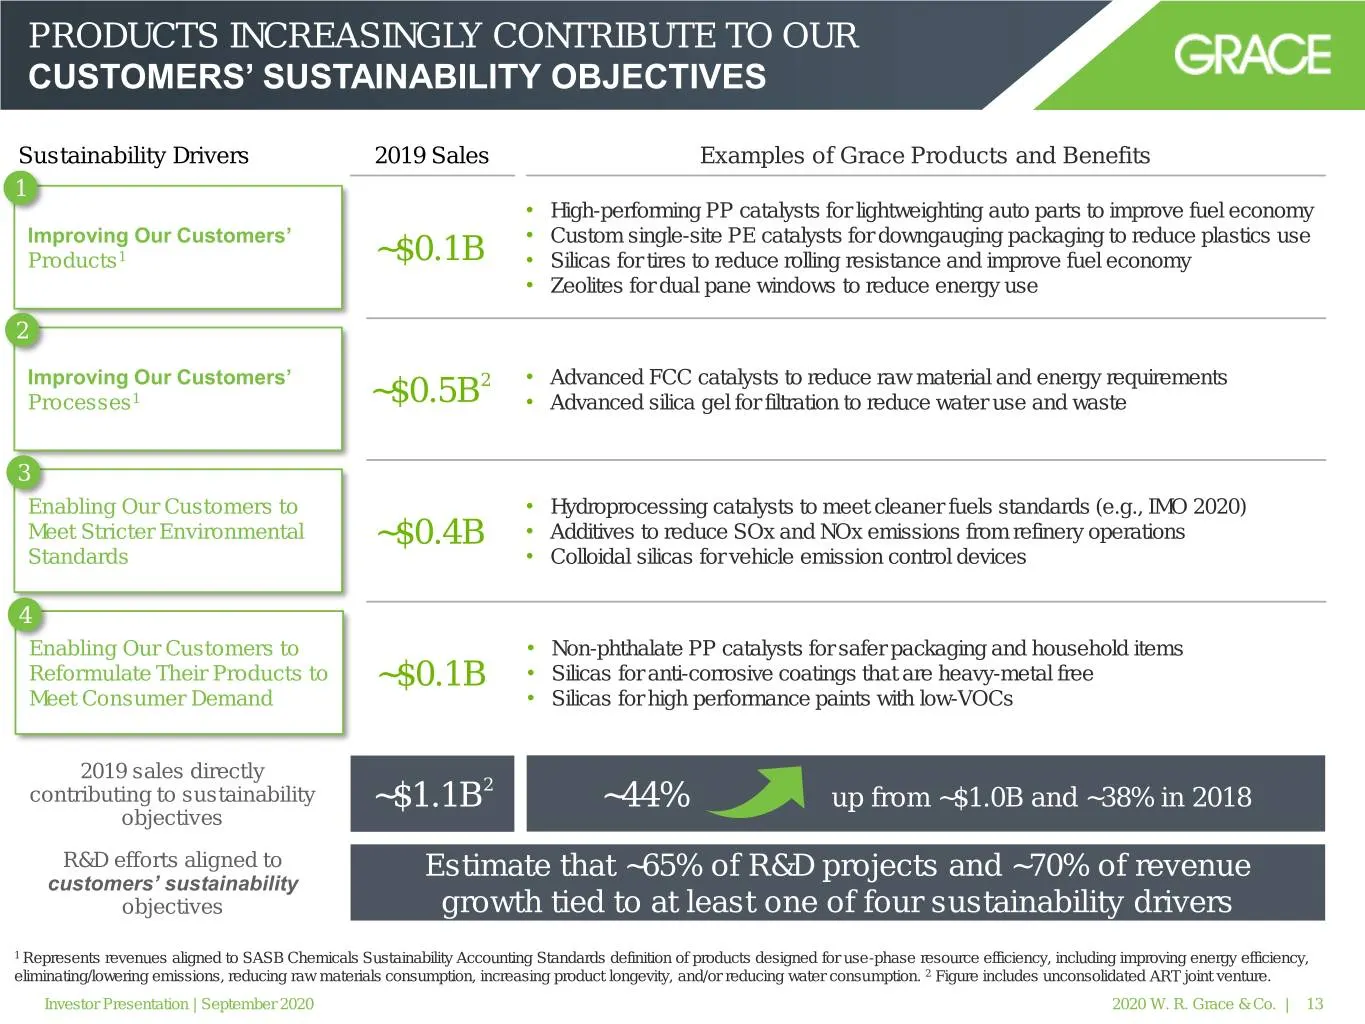
PRODUCTS INCREASINGLY CONTRIBUTE TO OUR CUSTOMERS’ SUSTAINABILITY OBJECTIVES Sustainability Drivers 2019 Sales Examples of Grace Products and Benefits 1 • High-performing PP catalysts for lightweighting auto parts to improve fuel economy Improving Our Customers’ • Custom single-site PE catalysts for
Slide 14: Unique Competitive Advantages
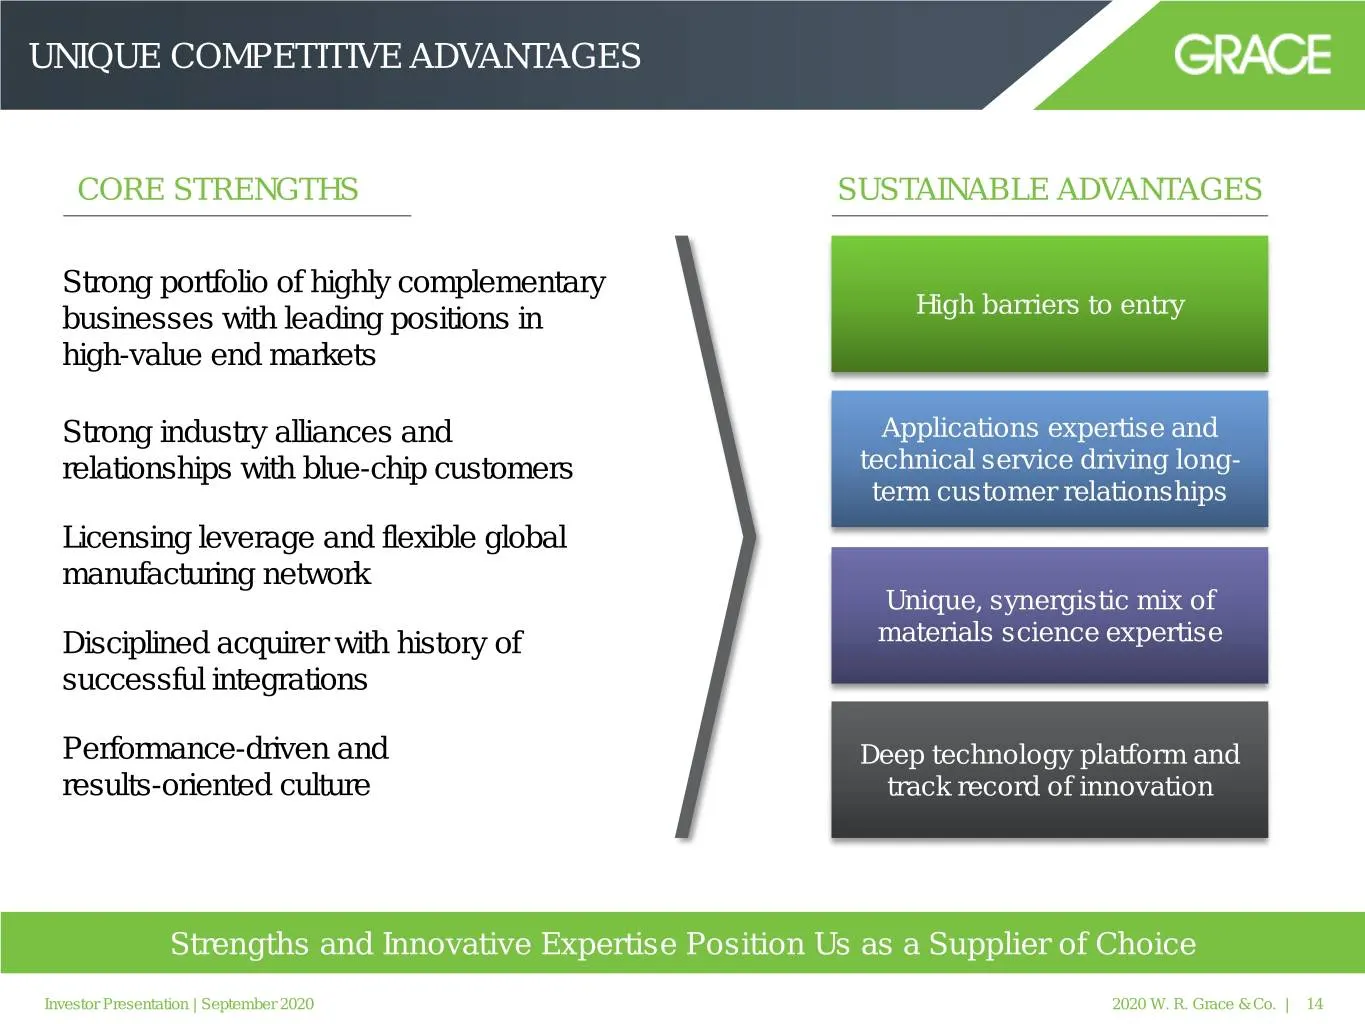
UNIQUE COMPETITIVE ADVANTAGES CORE STRENGTHS SUSTAINABLE ADVANTAGES Strong portfolio of highly complementary businesses with leading positions in High barriers to entry high-value end markets Strong industry alliances and Applications expertise and relationships with blue-chip customers technical se
Slide 15: Strategic Framework and Updates
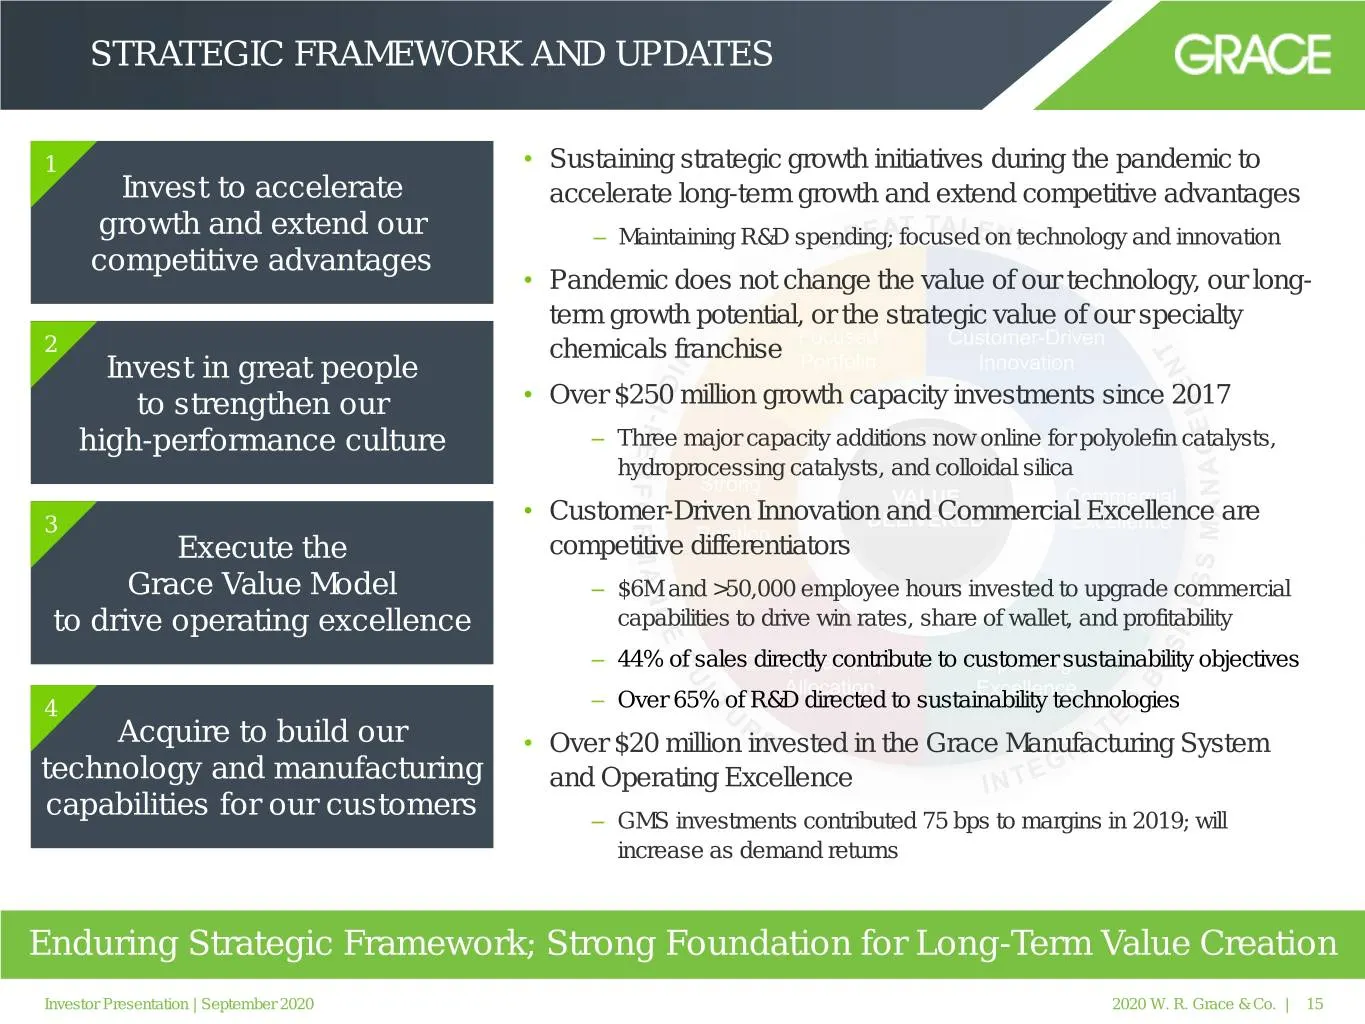
STRATEGIC FRAMEWORK AND UPDATES 1 • Sustaining strategic growth initiatives during the pandemic to Invest to accelerate accelerate long-term growth and extend competitive advantages growth and extend our – Maintaining R&D spending; focused on technology and innovation competitive advantages • Pandem
Slide 16: Strong Financial Position and Capital Allocation Framework
Strong Financial Position and Capital Allocation Framework
Slide 17: Strong Financial Position
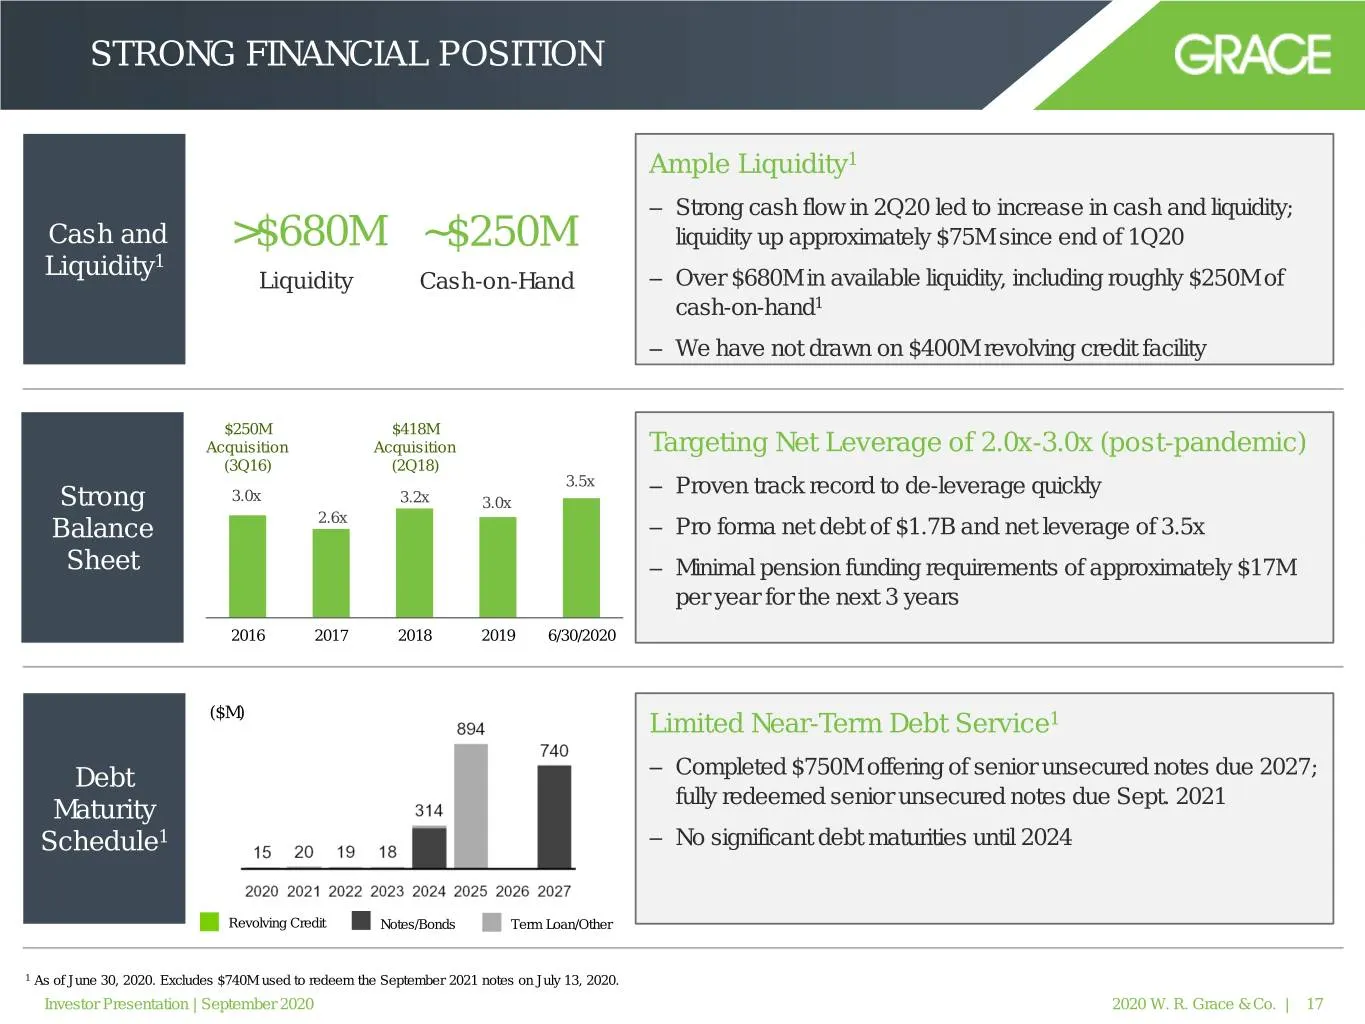
STRONG FINANCIAL POSITION Ample Liquidity1 – Strong cash flow in 2Q20 led to increase in cash and liquidity; Cash and >$680M ~$250M liquidity up approximately $75M since end of 1Q20 Liquidity1 Liquidity Cash-on-Hand – Over $680M in available liquidity, including roughly $250M of cash-on-hand1 – We h
Slide 18: Disciplined Capital Allocation
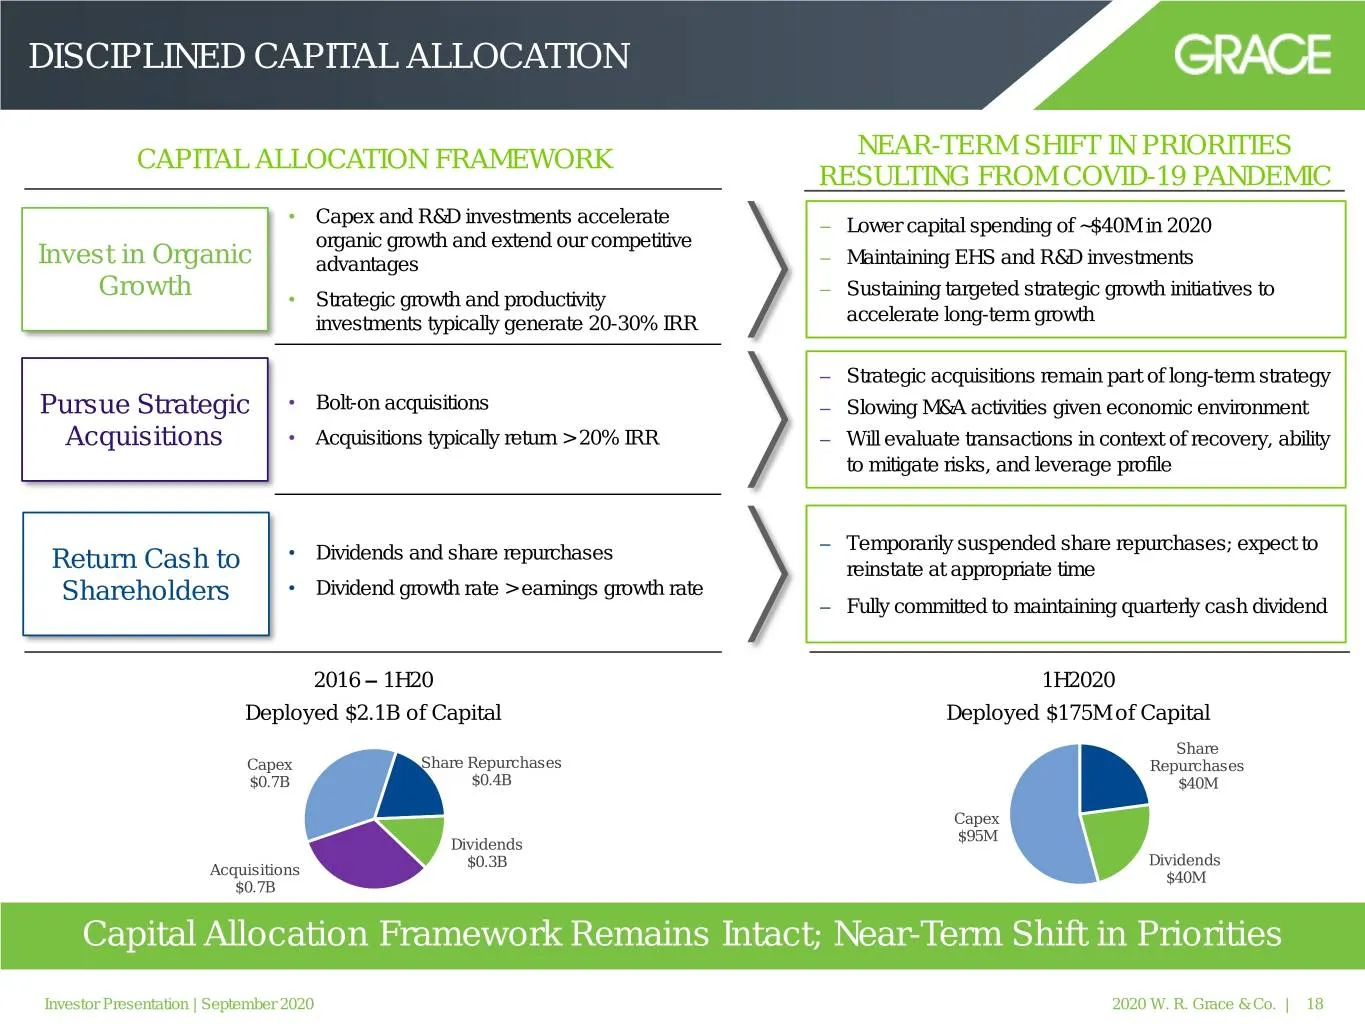
DISCIPLINED CAPITAL ALLOCATION NEAR-TERM SHIFT IN PRIORITIES CAPITAL ALLOCATION FRAMEWORK RESULTING FROM COVID-19 PANDEMIC • Capex and R&D investments accelerate – Lower capital spending of ~$40M in 2020 organic growth and extend our competitive Invest in Organic advantages – Maintaining EHS and R&D
Slide 19: Capital Allocation Highlights
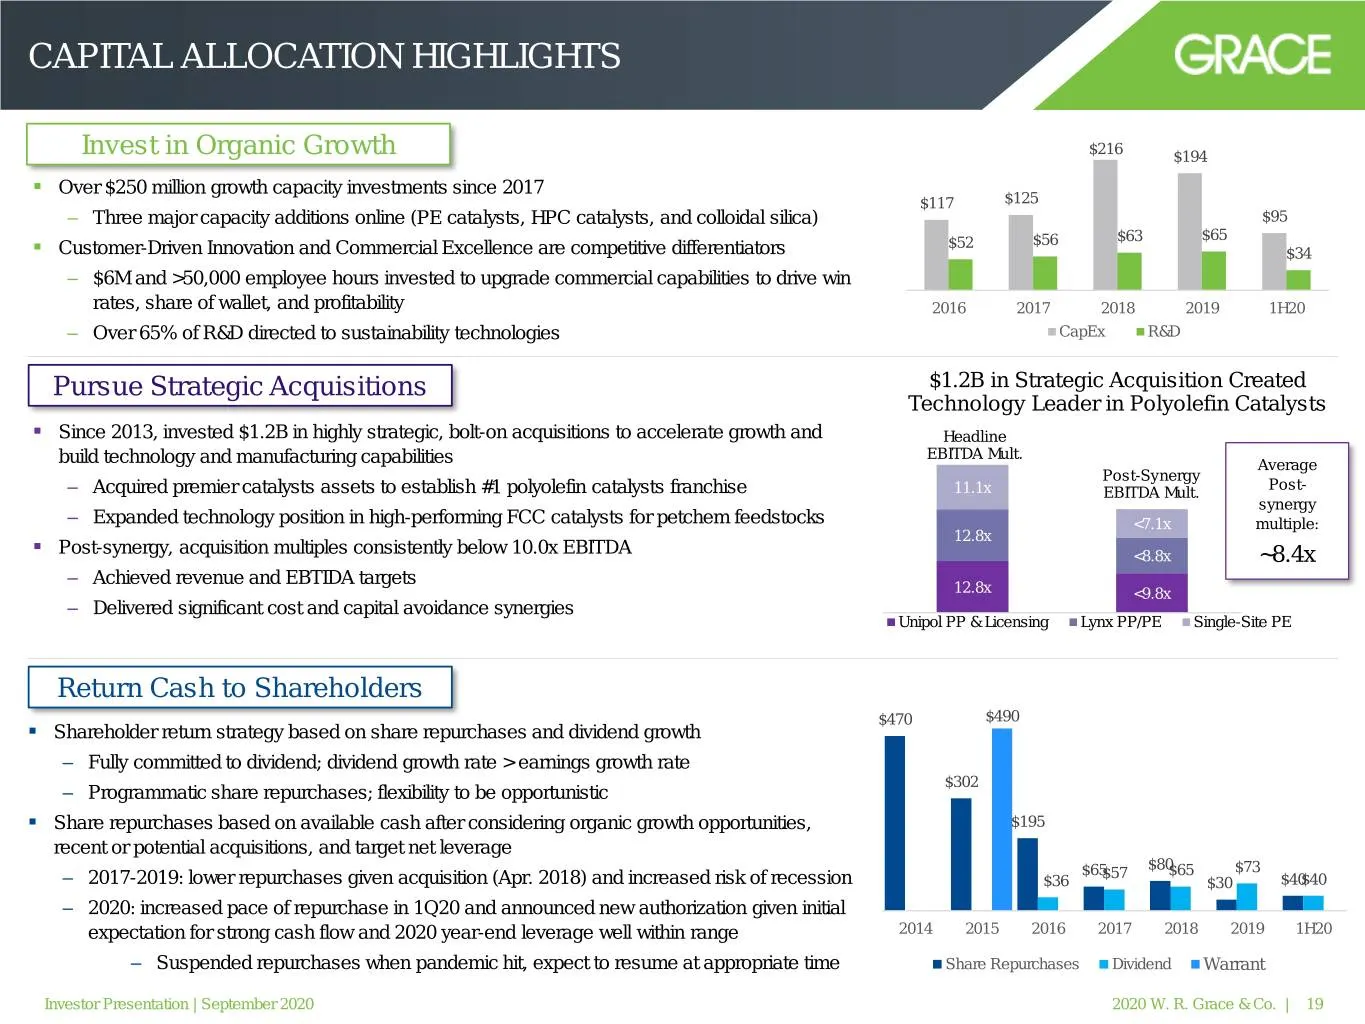
CAPITAL ALLOCATION HIGHLIGHTS $216 Invest in Organic Growth $194 ▪ Over $250 million growth capacity investments since 2017 $117 $125 – Three major capacity additions online (PE catalysts, HPC catalysts, and colloidal silica) $95 $65 $52 $56 $63 ▪ Customer-Driven Innovation and Commercial Excellence
Slide 20: Key Takeaways
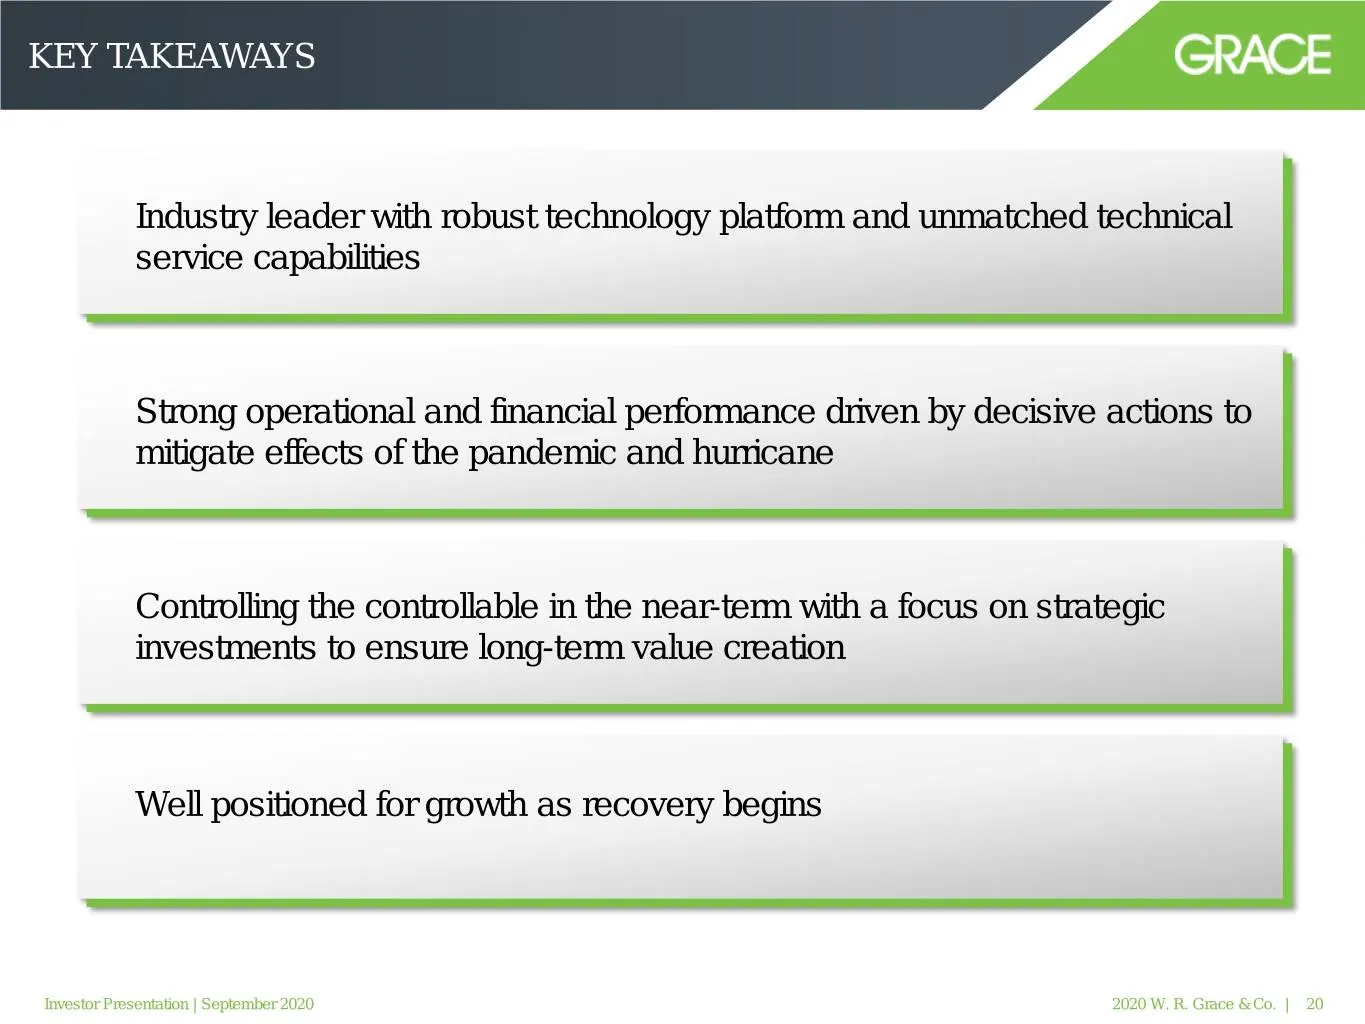
KEY TAKEAWAYS Industry leader with robust technology platform and unmatched technical service capabilities 02. Strong operational and financial performance driven by decisive actions to mitigate effects of the pandemic and hurricane Controlling the controllable in the near-term with a focus on strat

Slide 21: Appendix
Appendix GRACE Talent | Technology | Trust™
Slide 22: Appendix: Definitions and Reconciliations of Non-GAAP Measures
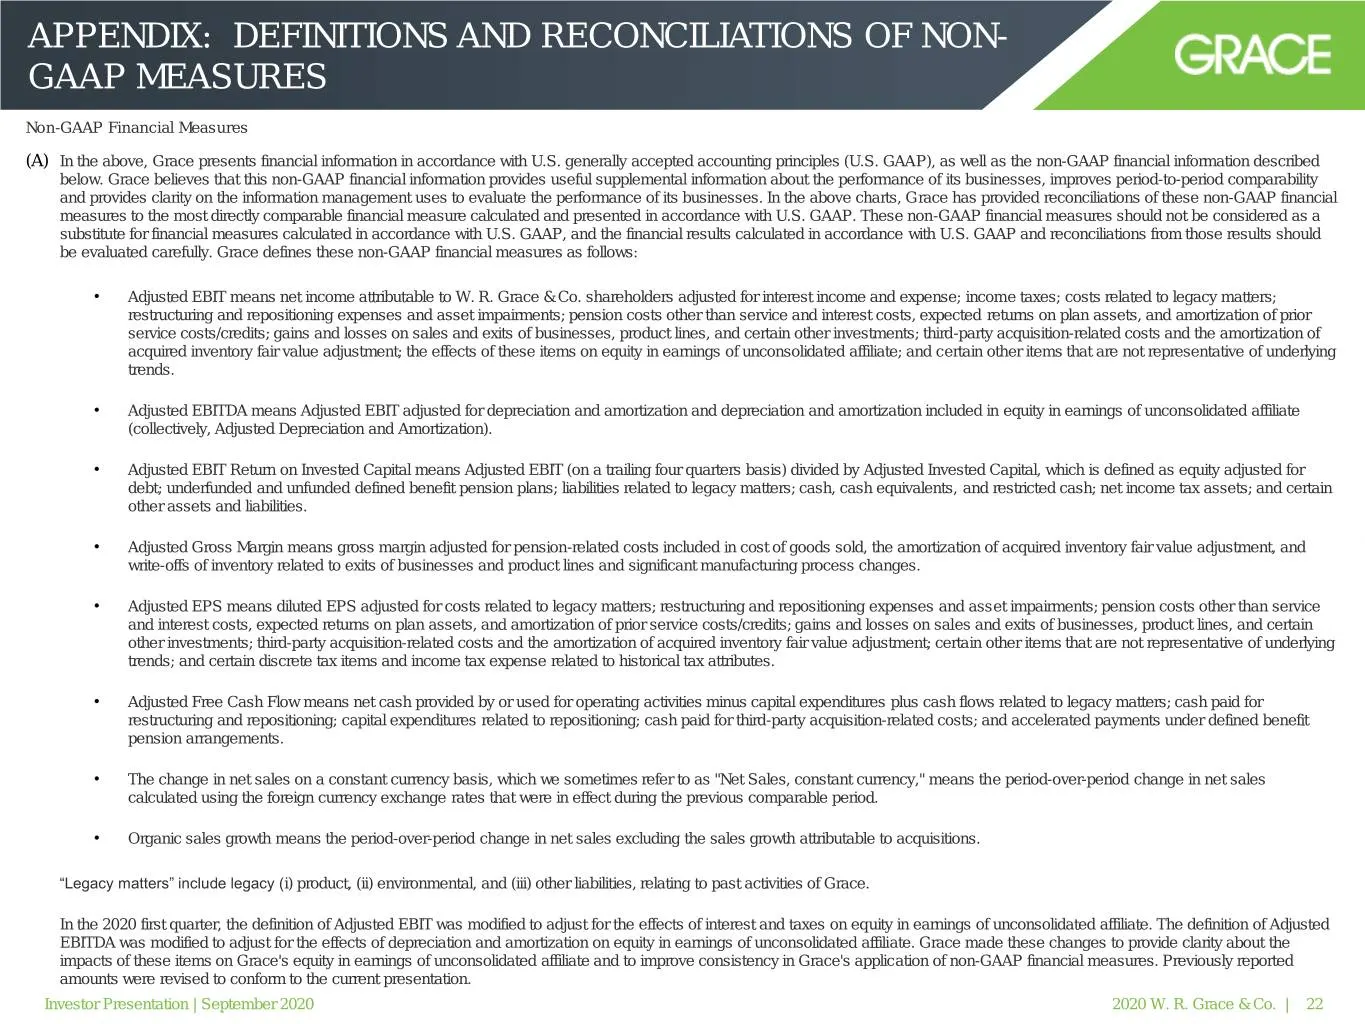
APPENDIX: DEFINITIONS AND RECONCILIATIONS OF NON- GAAP MEASURES Non-GAAP Financial Measures (A) In the above, Grace presents financial information in accordance with U.S. generally accepted accounting principles (U.S. GAAP), as well as the non-GAAP financial information described below. Grace believ
Slide 23: Appendix: Definitions and Reconciliations of Non-GAAP Measures (Continued)
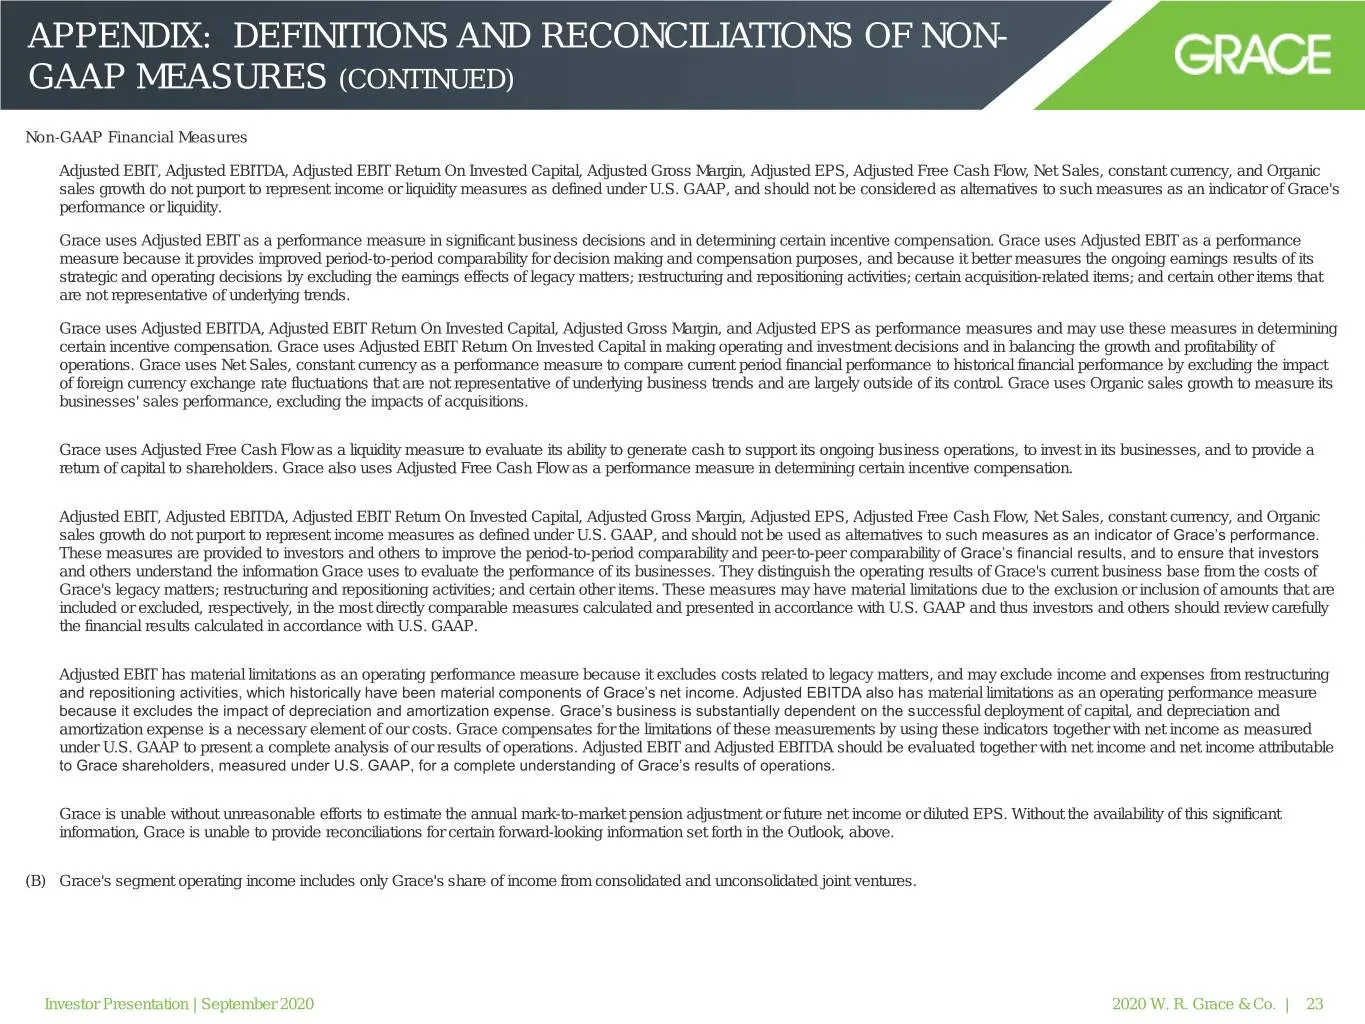
APPENDIX: DEFINITIONS AND RECONCILIATIONS OF NON- GAAP MEASURES (CONTINUED) Non-GAAP Financial Measures Adjusted EBIT, Adjusted EBITDA, Adjusted EBIT Return On Invested Capital, Adjusted Gross Margin, Adjusted EPS, Adjusted Free Cash Flow, Net Sales, constant currency, and Organic sales growth do no
Slide 24: Appendix: Definitions and Reconciliations of Non-GAAP Measures (Continued)
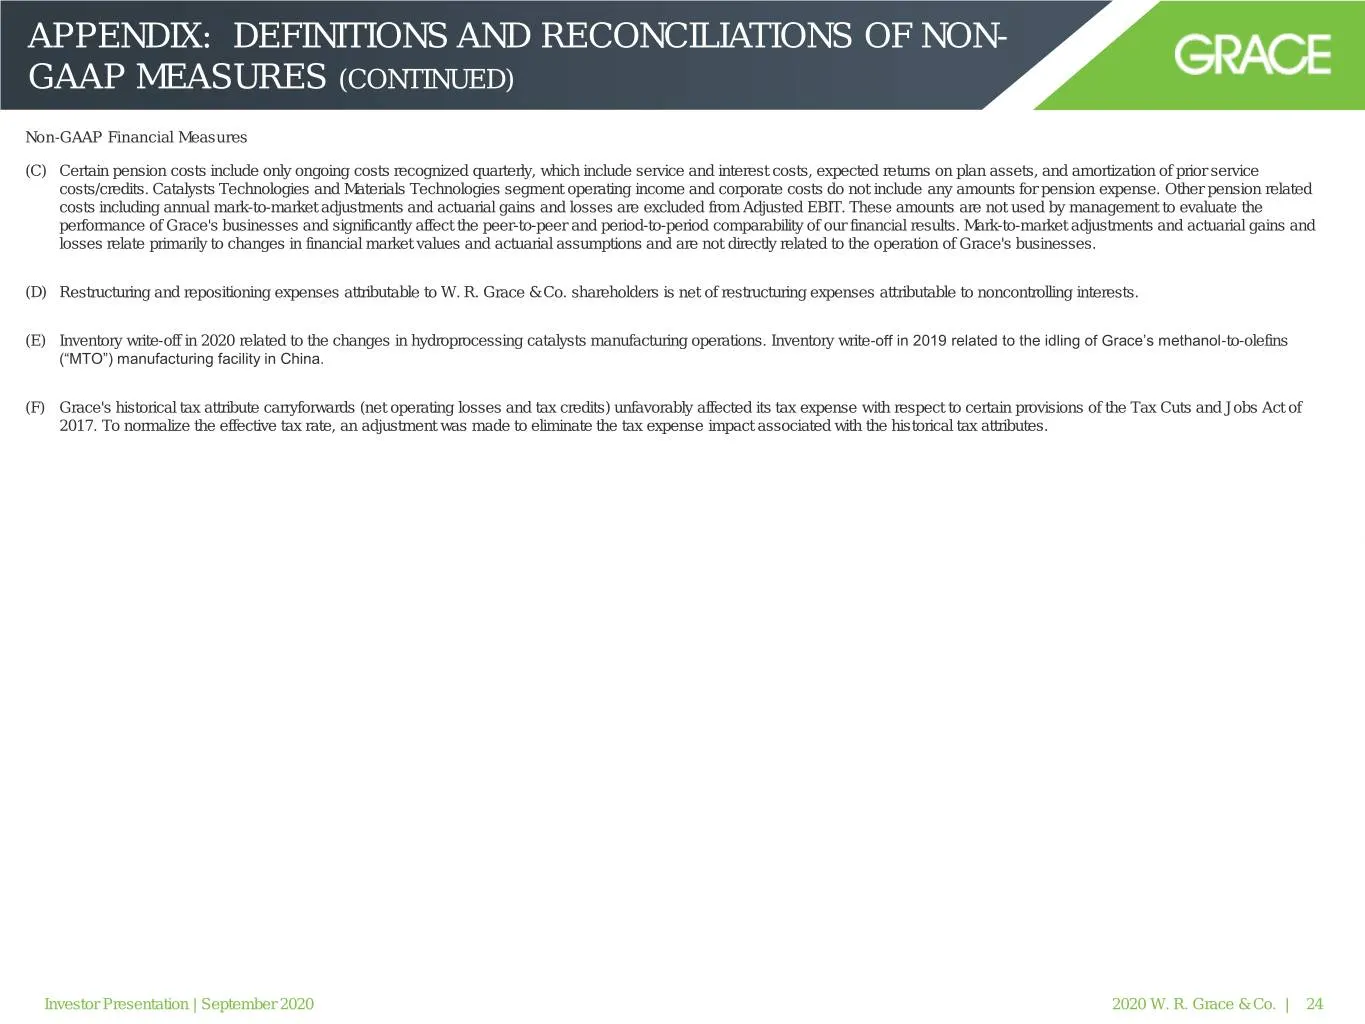
APPENDIX: DEFINITIONS AND RECONCILIATIONS OF NON- GAAP MEASURES (CONTINUED) Non-GAAP Financial Measures (C) Certain pension costs include only ongoing costs recognized quarterly, which include service and interest costs, expected returns on plan assets, and amortization of prior service costs/credit
Slide 25: Appendix: Reconciliation of Non-GAAP Measures (Continued)
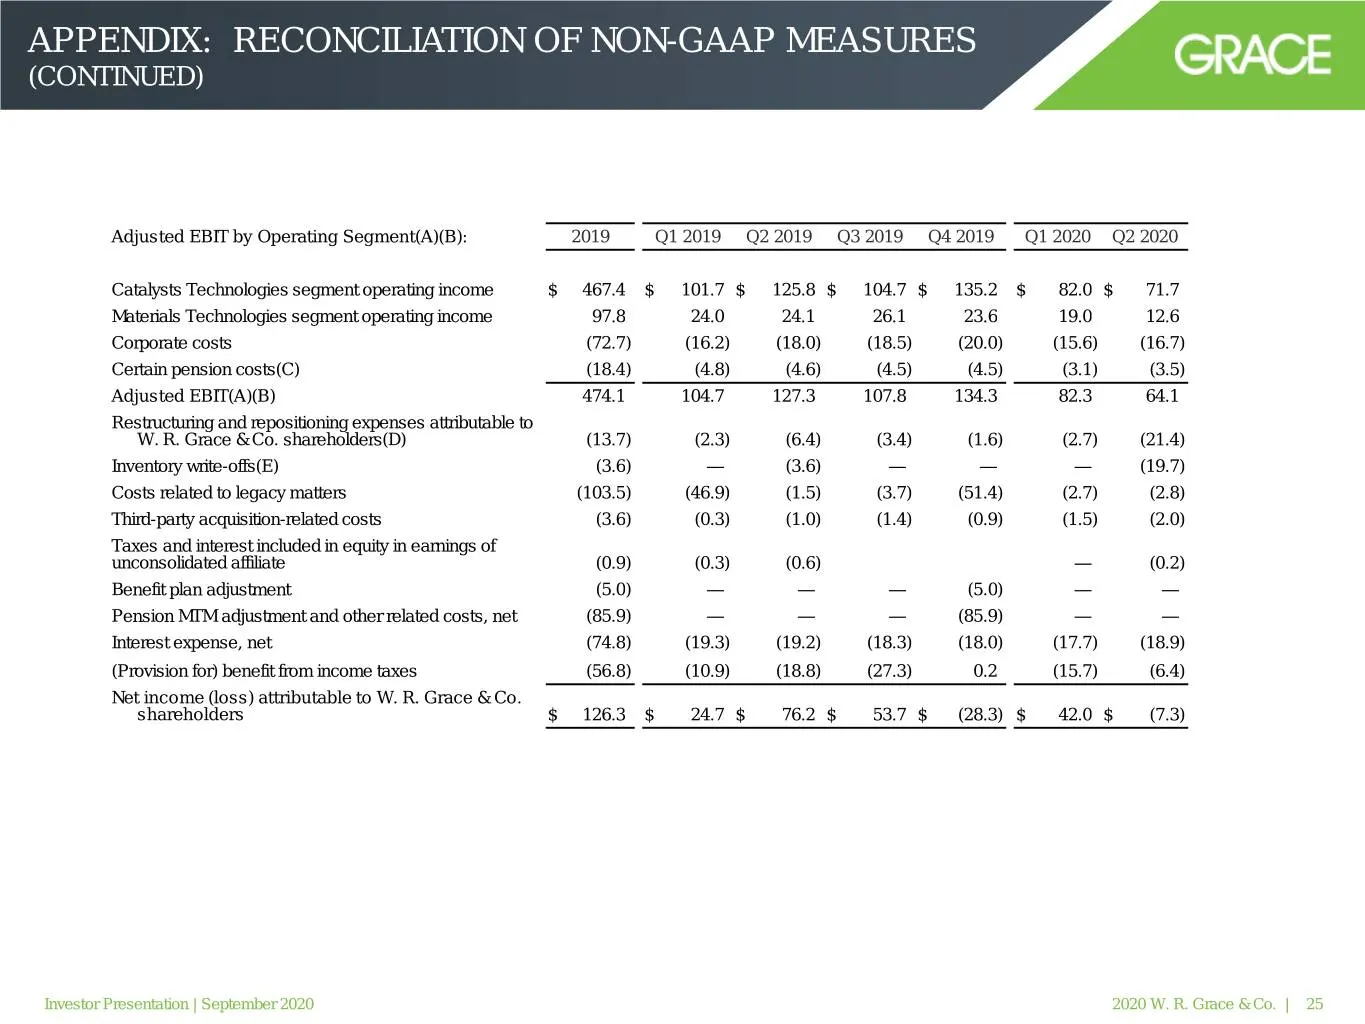
APPENDIX: RECONCILIATION OF NON-GAAP MEASURES (CONTINUED) Adjusted EBIT by Operating Segment(A)(B): 2019 Q1 2019 Q2 2019 Q3 2019 Q4 2019 Q1 2020 Q2 2020 Catalysts Technologies segment operating income $ 467.4 $ 101.7 $ 125.8 $ 104.7 $ 135.2 $ 82.0 $ 71.7 Materials Technologies segment operating inco
Slide 26: Appendix: Reconciliation of Non-GAAP Measures (Continued)
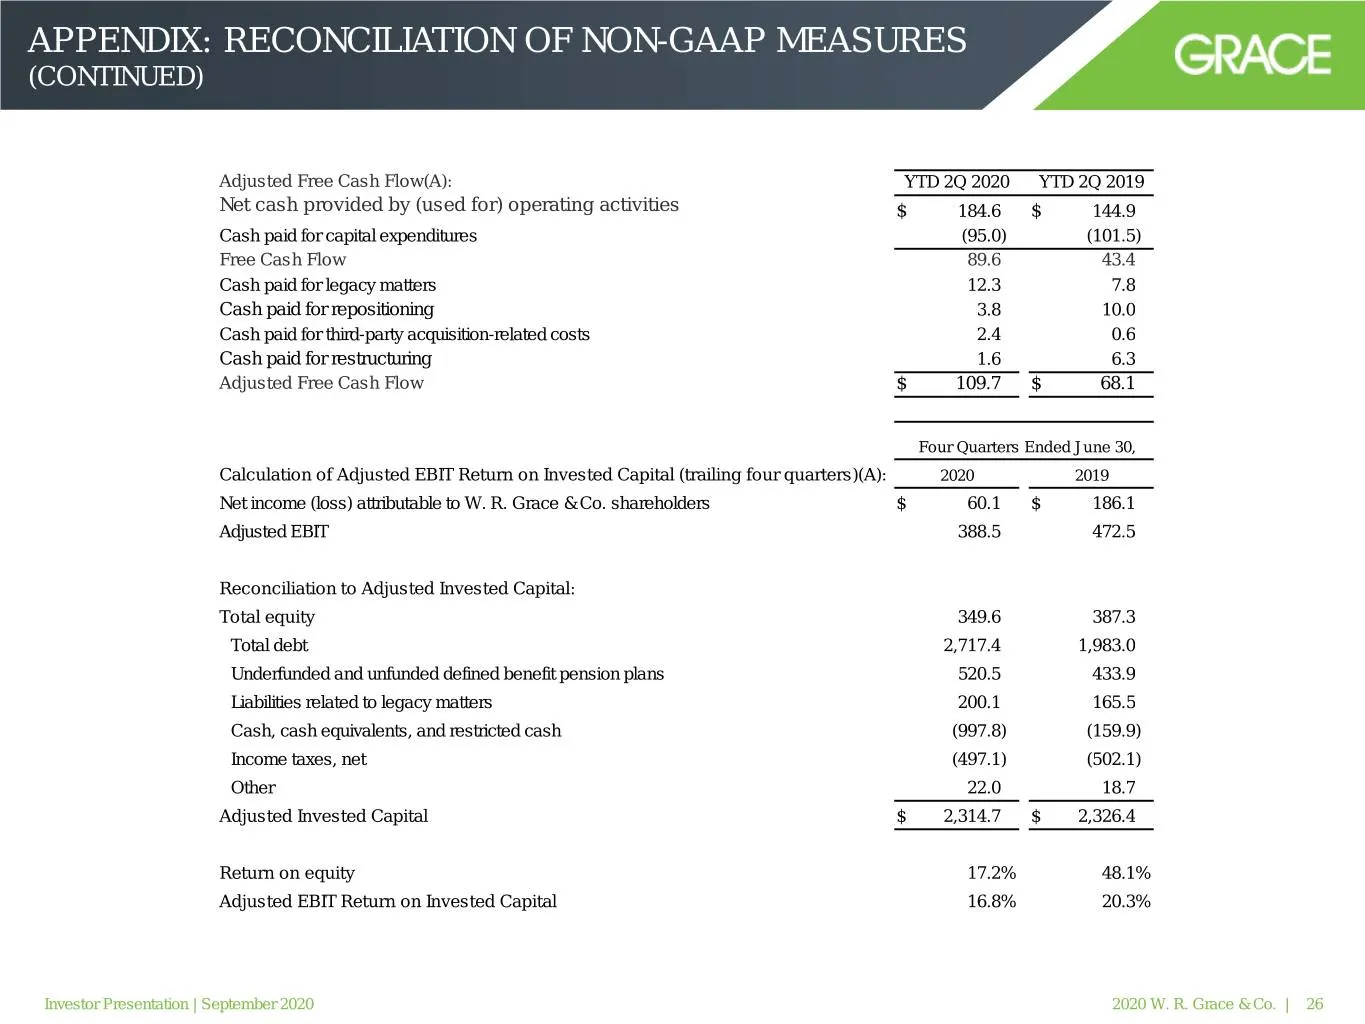
APPENDIX: RECONCILIATION OF NON-GAAP MEASURES (CONTINUED) Adjusted Free Cash Flow(A): YTD 2Q 2020 YTD 2Q 2019 Net cash provided by (used for) operating activities $ 184.6 $ 144.9 Cash paid for capital expenditures (95.0) (101.5) Free Cash Flow 89.6 43.4 Cash paid for legacy matters 12.3 7.8 Cash pai
Slide 27: Appendix: Reconciliation of Non-GAAP Measures (Continued)
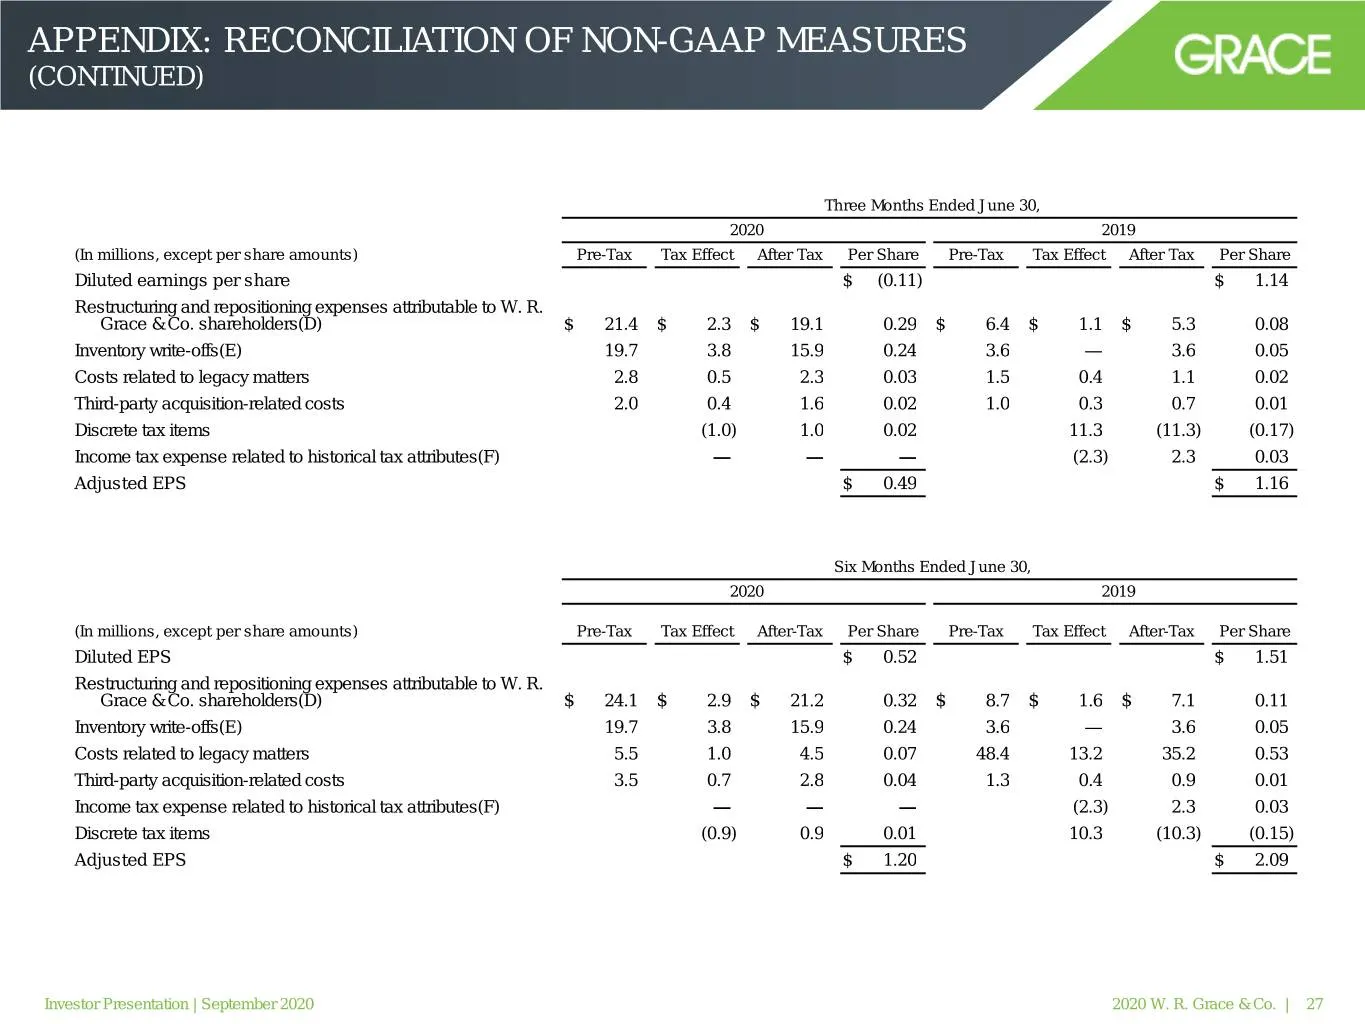
APPENDIX: RECONCILIATION OF NON-GAAP MEASURES (CONTINUED) Three Months Ended June 30, 2020 2019 (In millions, except per share amounts) Pre-Tax Tax Effect After Tax Per Share Pre-Tax Tax Effect After Tax Per Share Diluted earnings per share $ (0.11) $ 1.14 Restructuring and repositioning expenses at
Source: SEC EDGAR · 8-K filed Sep 17, 2020
More decks from W. R. Grace & Co
 Merger or Acquisition (February 2021)11 slides · Feb 26, 2021
 Investor Presentation (August 2020)25 slides · Aug 26, 2020
 Investor Presentation (February 2020)25 slides · Feb 11, 2020
 Credit Suisse Basic Materials Conference 201922 slides · Sep 10, 2019
 Deutsche Bank Annual Global Industrials & Materials Summit 201920 slides · Jun 6, 2019
 Goldman Sachs Basic Materials Conference 201827 slides · May 15, 2018