Health Net — Investor Day (November 2008)
92 slides from Health Net's investor day presentation, Nov 18, 2008

Slide 1: Health Net, Inc. Investor Conference
Health Net, Inc. Health Net, Inc. Investor Conference Investor Conference November 18, 2008 Exhibit 99.1

Slide 2: Cautionary Statement
Cautionary Statement All statements in this presentation, other than statements of historical information provided herein, including but not limited to the guidance for future periods included herein and the assumptions underlying such projections, may be deemed to be forward- looking statements and

Slide 3: Non-GAAP Measures
Non-GAAP Measures These presentations include quarterly and full-year income statement measurements that are not calculated and presented in accordance with Generally Accepted Accounting Principles. Audience participants should refer to the reconciliation table available in the company’s third quart

Slide 4: Agenda
Registration & Continental Breakfast 7.30 a.m. 8.00 – 8.30 a.m. Introduction & Strategic Review Angie McCabe, Vice President, Investor Relations Jay Gellert, President & Chief Executive Officer 8.30 – 10.00 a.m. Review of Operations & Operations Strategy Update Jim Woys, Chief Operating Officer Fede

Slide 5: Health Net, Inc. Investor Conference
Health Net, Inc. Health Net, Inc. Investor Conference Investor Conference

Slide 6: Strategic Review
Strategic Review Strategic Review Jay Gellert President and Chief Executive Officer November 18, 2008

Slide 7: Strategic Review
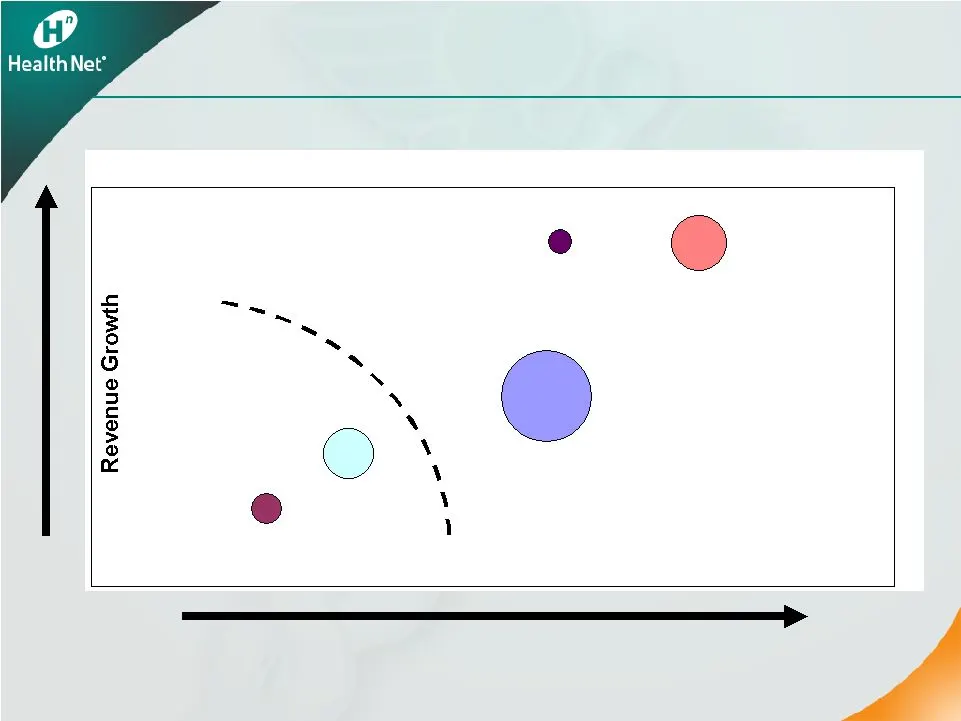
Strategic Review Strategic Review • Basic assets are solid – TRICARE/MHN – California/Oregon • 2008 performance was impaired by: – Medicare – Arizona – Northeast • The 2009 bid addresses the Medicare issues • While our other operations have critical mass, there is a scale problem in: – Arizona – Nor
Slide 8: HNT Business Unit Profile
HNT Business Unit Profile HNT Business Unit Profile High High Revenue represented by size of circle Pretax Margin CA/OR SPD HNFS/MHN NE AZ

Slide 9: Northeast and Arizona: Scale Issues
Northeast and Arizona: Northeast and Arizona: Scale Issues Scale Issues • 2009 combined revenues expected to be between $3.7 billion to $3.8 billion • Combined year-end 2008 membership of: – 580,000 Commercial members – 131,000 Medicare members – 46,000 Medicaid members • Operate G&A at approximatel

Slide 10: TRICARE/MHN, California/Northwest and Senior Products
TRICARE/MHN, California/Northwest TRICARE/MHN, California/Northwest and Senior Products and Senior Products • Combined revenues expected to be approximately $12 billion in 2009 • These operations have approximately: – 1.5 million commercial members – 165,000 MA members – 760,000 Medicaid members – 5

Slide 11: Our Direction
Our Direction Our Direction • Address Arizona/Northeast issues • Achieve 2009 plan • Maintain and improve balance sheet • Continue to review strategy

Slide 12: Introduction to the Operations Organization
Introduction to the Introduction to the Operations Organization Operations Organization Jim Woys Executive Vice President and Chief Operating Officer November 18, 2008

Slide 13: A New Management Team
• Reorganized, energized and ready-to-go • Most successful managers in the company • Know markets and customers • Focused on California, Oregon and Federal Services • Release potential of HNT’s opportunities for near- and long-term improvement A New Management Team

Slide 14: Immediate Focus
Immediate Focus Grow Profitably Actively manage the trend Improve operational performance

Slide 15: Profitable Growth
Profitable Growth Profitable Growth • Unified sales, market, product approach • Appropriate pricing structure • Clear, targeted growth in identified markets and segments • Margin expansion and profitable growth Key Strategy Key Strategy Attack and defend where clear value proposition exists Key Comm

Slide 16: Managing Trend
Managing Trend Managing Trend • Results-oriented structure • Geographical review of hospital and provider contracts • Care management programs • Predictable health care costs Key Strategy Key Strategy Predictability and proactive management Key Management Tactics Key Management Tactics • Unit cost –

Slide 17: Operational Excellence
Operational Excellence Operational Excellence • Consolidated operation management, analytics and reporting • Reduced variation • Outsourcing transactional jobs • Driving electronic channel making it easy to do business with HNT • Better Service – less cost Key Strategy Key Strategy Great at the basi

Slide 18: Near-Term Goals
Near-Term Goals Improve shareholder value Increase value of franchise Deliver profitable results

Slide 19: The Operations Team
The Operations Team • Steven Tough President, Health Plans and Government Programs – Steven Sell President, Health Net of California – Scott Kelly Chief Government Programs Officer • John Sivori President, Regional Health Plans and Pharmacy • Dr. Jonathan Scheff Chief Medical Officer • Scott Law Chi

Slide 20: Operational Performance
- 2008 - Operational Performance Operational Performance Jim Woys Executive Vice President and Chief Operating Officer November 18, 2008

Slide 21: 2008 and 2009 Guidance
2008 and 2009 Guidance 2008 and 2009 Guidance Membership Commercial Risk -8 to -9% -3 to -5% Medicaid +6 to 7% +2 to +3% Medicare Advantage (incl PFFS) +20 to 25% -1 to -2% PDP +40 to 45% -15 to -20% Commercial Yields ~ 8.3% ~ 9 to 9.5% Commercial HCC Trends ~ 10.9% ~ 40 to 60 bps < yield G&A Expens

Slide 22: Understanding the Underlying Trend
Understanding the Underlying Trend Understanding the Underlying Trend Conducted in-depth analyses of: Conducted in-depth analyses of: • Underlying trends for all markets and all segments for 2007, 2008 and expected 2009 • Actual trends based on incurred dates after adjusting for all prior period cha

Slide 23: Guidance vs. Underlying Trend
2008 2009 Guidance vs. Underlying Trend Guidance vs. Underlying Trend Guidance 10.9% 8.6% - 8.9% Effect Guardian (2.7%) Revised 8.2% Effect of Prior Period (1.4%) .5% Net Underlying Trend 6.8% 9.1% - 9.4%

Slide 24: 2008 and 2009 Commercial Health Care Cost Trends
2008 and 2009 Commercial 2008 and 2009 Commercial Health Care Cost Trends Health Care Cost Trends Underlying health care cost trend after adjusting for prior period development and effect of Guardian transaction (1) (1) Commercial '07 - '08 '08 - '09 Yield 8.3% 9.0% - 9.5% Health Care Cost Physician

Slide 25: 2008 Commercial Unit Cost and Utilization Metrics
2008 Commercial Unit Cost 2008 Commercial Unit Cost and Utilization Metrics and Utilization Metrics Underlying operational health care cost metrics after adjusting for prior period development (1) (1) Unit Cost & Utilization Q1 Q2 Q3 Hospital Inpatient Days/1,000 5.0% 4.1% 10.7% Admits/1,000 1.3% 2.

Slide 26: Underlying Medicare Trend
Underlying Medicare Trend Underlying Medicare Trend Expected 6.4% 4.5% Effect of Prior Period .2% (.1)% Net Underlying Trend 6.6% 4.4% Note: Metrics exclude Medicare Part D

Slide 27: 2007 to 2009 Medicare Health Care Costs
2007 to 2009 Medicare 2007 to 2009 Medicare Health Care Costs Health Care Costs Underlying health care cost trend after adjusting for prior period development and effect of Guardian transaction (1) (1) Medicare Advanatage '07 - '08 '08 - '09 Yield 2.6% 6.0% Health Care Cost Physician Physician - Cla

Slide 28: 2008 Medicare Unit Cost and Utilization
2008 Medicare Unit Cost 2008 Medicare Unit Cost and Utilization and Utilization Underlying operational health care cost metrics after adjusting for prior period development; excludes Private Fee-for-Service (1) (1) Medicare Advantage Unit Cost & Utilization Q1 Q2 Q3 Hospital Inpatient Days/1,000 5.0

Slide 29: Commercial
Commercial Commercial

Slide 30: 2009 Underlying Health Care Cost Trend: HNCA Commercial
2009 Underlying Health Care Cost Trend: 2009 Underlying Health Care Cost Trend: HNCA – HNCA – Commercial Commercial Hospital trends reflect conversion of two hospitals from capitated to noncapitated arrangements Underlying health care cost trend after adjusting for prior period development (1) (2) (

Slide 31: 2008 Financial Performance: HNCA Commercial
2008 Financial Performance: 2008 Financial Performance: HNCA – HNCA – Commercial Commercial Based on membership in noncapitated hospital arrangements (approximately 82% of total membership) Underlying operational health care cost metrics after adjusting for prior period development (1) (2) (1) (2) U

Slide 32: 2008 Performance: HNCA Commercial
2008 Performance: 2008 Performance: HNCA – HNCA – Commercial Commercial • Pressure on premium yields due to competitive environment • Higher health care costs – Flu season – Late development impacting unit cost assumptions • Two groups converted from dual to shared risk • Cancelled hospital contract

Slide 33: 2009 Expectations: HNCA Commercial
2009 Expectations: 2009 Expectations: HNCA – HNCA – Commercial Commercial • Focused, clear and simple plan block-and-tackle • 82% book is priced at a yield of 9.1% – 99% of Special Accounts (1/3 membership) under contract – Assumes 1% higher rating compared to 2008 and a lower impact from mix change

Slide 34: 2009 Health Care Cost Trend Expectations: Oregon Commercial
2009 Health Care Cost Trend Expectations: 2009 Health Care Cost Trend Expectations: Oregon - Oregon - Commercial Commercial Underlying health care cost trend after adjusting for prior period development (1) (1) '07 - '08 '08 - '09 Yield 5.7% 7.9% Health Care Cost Physician Physician - Claims 7.3% 6.

Slide 35: 2009 Health Care Cost Trend Expectations: Northeast Commercial
2009 Health Care Cost Trend Expectations: 2009 Health Care Cost Trend Expectations: Northeast - Northeast - Commercial Commercial Underlying health care cost trend after adjusting for prior period development and effect of Guardian transaction (1) (1) '07 - '08 '08 - '09 Yield 6.7% 5.3% Health Care

Slide 36: 2009 Health Care Cost Trend Expectations: Arizona Commercial
2009 Health Care Cost Trend Expectations: 2009 Health Care Cost Trend Expectations: Arizona - Arizona - Commercial Commercial Underlying health care cost trend after adjusting for prior period development (1) (1) '07 - '08 '08 - '09 Yield 4.7% 8.0% Health Care Cost Physician Physician - Claims 9.7%

Slide 37: 2008 Performance: Oregon, Northeast, Arizona Commercial
2008 Performance: 2008 Performance: Oregon, Northeast, Arizona – Oregon, Northeast, Arizona – Commercial Commercial • Oregon – Continued solid performance – Membership = generally flat • Emerging strength in small group market (4Q08) – Revenue • Lower than necessary yield in mid-size and large group

Slide 38: 2009 Expectations: Oregon, Northeast, Arizona
2009 Expectations: 2009 Expectations: Oregon, Northeast, Arizona Oregon, Northeast, Arizona • Oregon – Continued positive performance – Expect some health care cost recovery by assuming normal frequency of high cost cases – Positive yield on mid-size and large group business due to the pricing corre

Slide 39: Medicare
Medicare Medicare

Slide 40: 2009 Underlying Health Care Cost Trends: Medicare
2009 Underlying Health Care Cost Trends: 2009 Underlying Health Care Cost Trends: Medicare Medicare Underlying health care cost trend after adjusting for prior period development (1) (1) Medicare Advantage '07 - '08 '08 - '09 Yield 2.7% 6.2% Health Care Cost Physician Physician - Claims 13.6% 14.1%

Slide 41: Medicare: What Happened in 2008?
Medicare: What Happened in 2008? Medicare: What Happened in 2008? • Benefit leader in 2008 • Experienced substantial growth across MAPD • Early 2008 experience led to margin deterioration – Rich benefits and low member out-of-pocket costs – Higher utilization than planned – Lower RAF scores than ind

Slide 42: 2009 Expectations: Medicare
• Priced 2009 bids to address MCR concerns across all products – Factored for higher-than-expected HCC in 2008 • Adjusted premiums and benefit design (specialist co-pay, hospital co-pay) to improve gross margin – will result in membership deterioration in some plans • Contracted industry leading ris

Slide 43: Federal Services / MHN
Federal Services / MHN Federal Services / MHN Steve Tough President, Health Plans and Government Programs November 18, 2008

Slide 44: 2009 and Beyond
2009 and Beyond 2009 and Beyond • Relationships with our customers are very strong • Service and financial performance has been excellent • TRICARE, Military & Family Life Consultants (MFLC) and EAP programs remain solid cornerstones • Base of operations provides a sound foundation for the future •

Slide 45: Current TRICARE Contract
Current TRICARE Contract Current TRICARE Contract • Excellent performance—meeting or exceeding all contract requirements and benchmarks • Top-to-bottom relationship with customer is solid • Financial results – Expect to reach $2.6 billion in total contract revenue in 2008 (8.5% increase over 2007) –

Slide 46: Current TRICARE Contract
Current TRICARE Contract Current TRICARE Contract • Confident of ability to deliver on 2009 plan – On track to meet Option Period 5 performance targets – Current TRICARE business model continues through April 2010 – Engaged in Option Period 6 discussions – Based on previous experience, we expect an

Slide 47: TRICARE Contract Re-Procurement Overview
TRICARE Contract TRICARE Contract Re-Procurement Overview Re-Procurement Overview • Proposal delivered at end of June 2008 – Terms are valid for 270 days (through March 27, 2009) • Statement of work is nearly the same as current TRICARE contract • Period of Performance, as currently stated in the RF

Slide 48: TRICARE Contract Re-Procurement Overview
TRICARE Contract TRICARE Contract Re-Procurement Overview Re-Procurement Overview • Three factors in evaluating the proposals – Technical approach – Past performance – Price/cost • Extension of current contract – Re-procurement terms extended the period of performance for the current contract throug

Slide 49: Solid TRICARE Performance
• Customer remains our number one priority • TRICARE program continues to run extremely well – Ongoing partnership with the Government on innovative solutions for military beneficiaries – Continued high satisfaction with the TRICARE benefit and Health Net as a contractor Recently achieved the highes

Slide 50: MFLC: A Department of Defense Program
MFLC: A Department of Defense Program MFLC: A Department of Defense Program • Short-term, situational non-medical counseling services and outreach • Assists service members and their families through the challenges of military life • 5-year, $300 million contract awarded to MHN effective April 1, 20

Slide 51: Opportunities
Opportunities Opportunities • International – Dubai Health Authority – Evolving opportunities in the Middle East • Department of Defense – TRICARE Overseas – MFLC expansion – TRICARE/Medicare Pilot – National Guard and Reserve health care service support Single team focused on opportunities and leve

Slide 52: Opportunities
Opportunities Opportunities • Department of Veterans Affairs – Regional programs – civilian network and clinic support – Mental/behavioral health surge capacity – VetAdvisor expansion (includes TBI and PTSD screening) • Other government and commercial entities – Targeted commercial market segments (

Slide 53: Health Net, Inc. Investor Conference
Health Net, Inc. Health Net, Inc. Investor Conference Investor Conference

Slide 54: Medicare Programs
Medicare Programs Medicare Programs Scott Kelly Chief Government Programs Officer November 18, 2008

Slide 55: Medicare Advantage Market
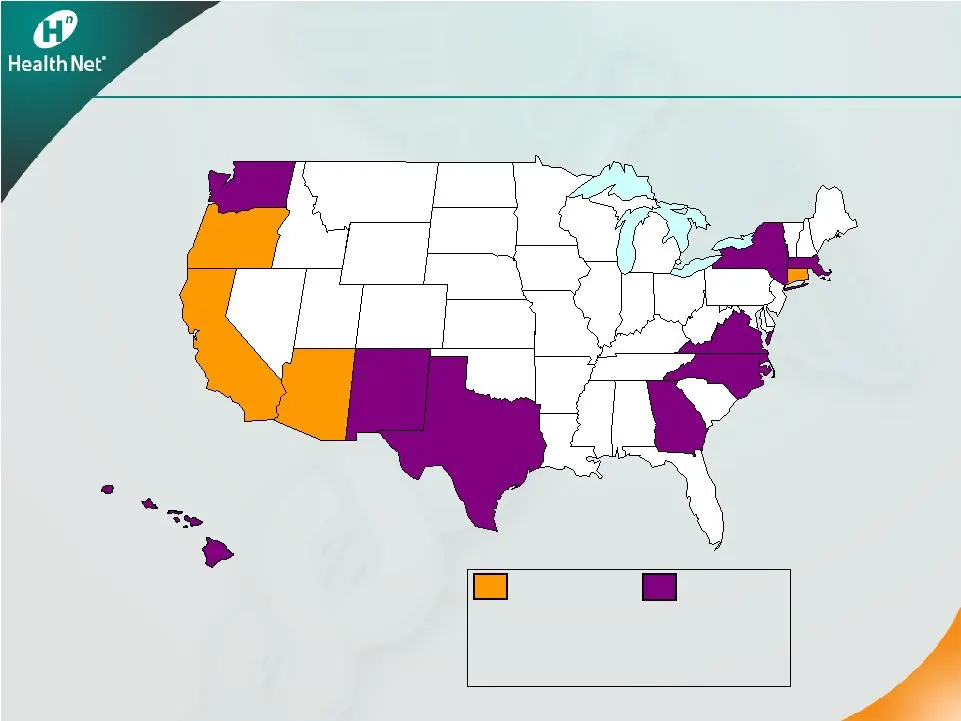
Medicare Advantage Market Medicare Advantage Market • Broad array of products: HMO/HMO-POS, SNP, PFFS, PPO, RPPO, PDP • Highly regulated and very competitive across product lines – Market continues to grow HNT accounted for greater than 35% of industry growth in its markets – Regulatory challenges M
Slide 56: Medicare Market View
Medicare Market View Medicare Market View Oregon CCPs/PFFS/PDP California CCPs/PDP PFFS/MedSup Washington PDP/PFFS Arizona CCPs/PDP New Mexico PDP/PFFS Texas PDP/PFFS Connecticut CCPs/PDP PFFS New York PDP/PFFS Hawaii PDP/PFFS CCPs & PDP (may incl. PFFS) PFFS & PDP Note: PDP is offered in all 50 sta

Slide 57: Medicare Advantage Positioning
7 Health Net, Inc. 232,284 290,033 3.0% 57,749 24.9% Medicare Advantage Positioning Medicare Advantage Positioning • Health Net is now the seventh largest MA plan nationally – Limited core market footprint HNT led growth in its core markets – Limited PFFS engagement nationally • Health Net grew by 2

Slide 58: Medicare Part D Positioning
8 Health Net, Inc. 368,121 534,671 3.1% 166,550 45.2% Medicare Part D Positioning Medicare Part D Positioning • Health Net ranks eighth nationally among PDP plans • Health Net grew by 45% in 2008 • Adjusted bids to address MCR concerns, resulting in 2009 projected membership deterioration of approxi

Slide 59: 2008 Performance
2008 Performance 2008 Performance • Benefit leader in 2008 • Experienced substantial growth across MAPD • Early 2008 experience led to margin deterioration – Rich benefits and low member out-of-pocket costs – Higher utilization than planned – Lower RAF scores than industry 2007 - 2008 (Percent Chang

Slide 60: 2009 Membership Projections
2009 Membership Projections 2009 Membership Projections (in thousands) Expectations Guidance % Change California Oregon Arizona Northeast Expansion States Total Medicare Advantage -1 to -2 % Health Net Medicare Advantage Enrollment

Slide 61: 2009 Expectations
2009 Expectations 2009 Expectations • Priced 2009 bids to address MCR concerns across all products – Factored for higher than expected HCC in 2008 • Adjusted premiums and benefit design (specialist co-pay, hospital co-pay) to improve gross margin – will cause membership deterioration in some plans •

Slide 62: Opportunities
Opportunities Opportunities • Revenue enhancement through RAF score improvement – Continuation of industry-proven RAF initiatives in all markets – Supplement RAF activity with network management support – Data collection efforts expanded to pull directly from source systems • Ensures complete retrie

Slide 63: California Market
California Market California Market Steve Sell President Health Net of California November 18, 2008
Slide 64: California Market Dynamics
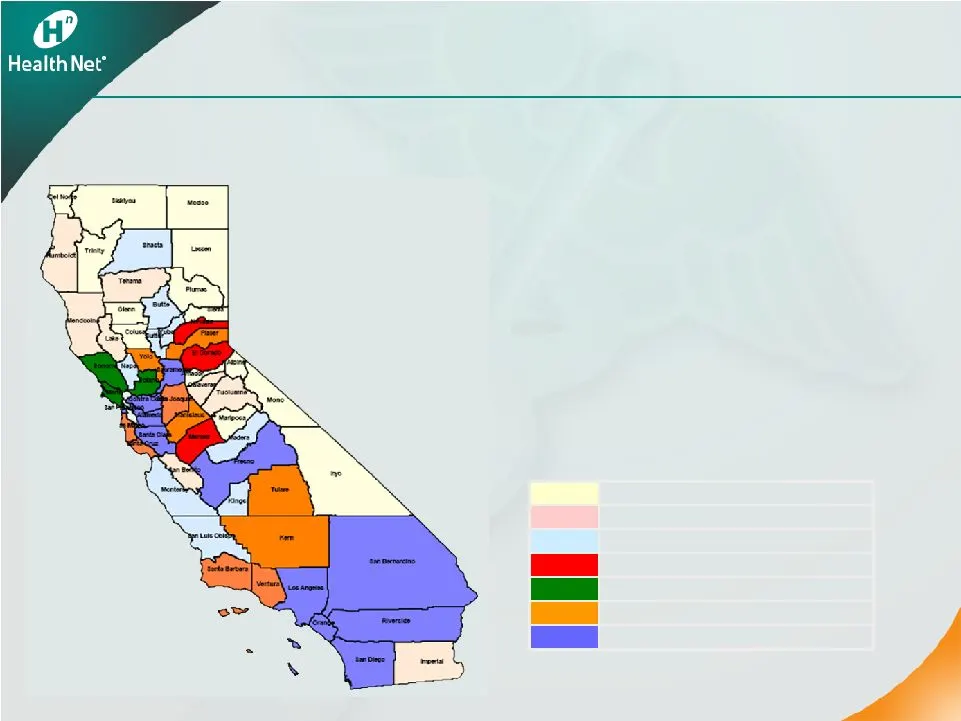
California Market Dynamics California Market Dynamics • Largest state in U.S. with 37 million people • Membership concentrated around high population density areas • Highest managed care penetration in the U.S. • Slowing economy >50,000 Members 20,000-49,999 Members 10,000-19,999 Members 5,000-9,999
Slide 65: Why Buy A Health Net Product?
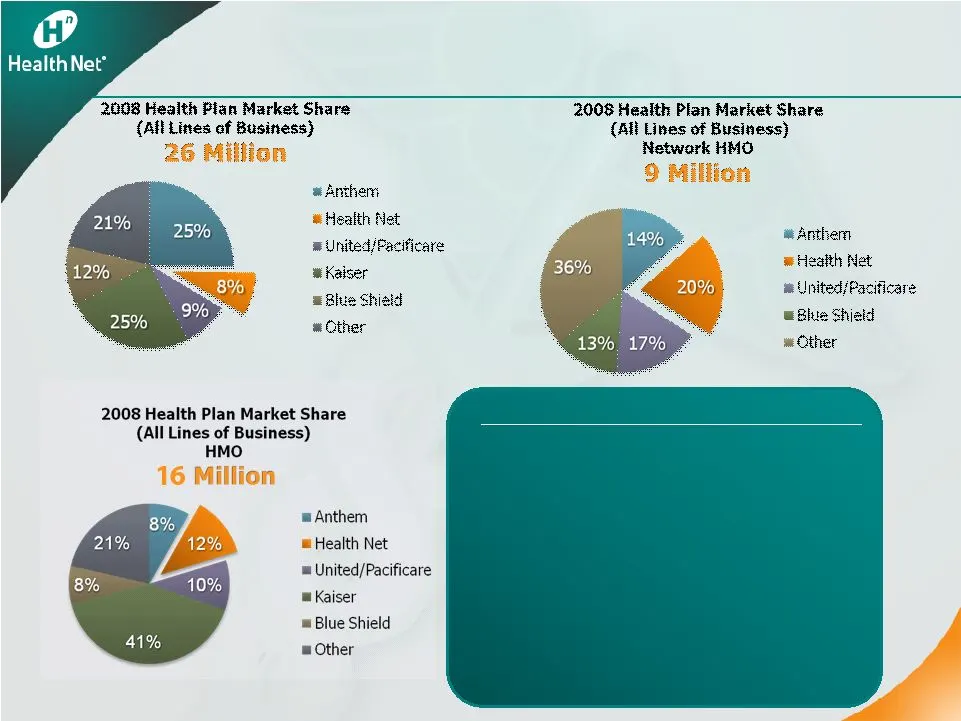
Why Buy A Health Net Product? • $7 billion health plan with 2.2 million members • Dominant network HMO • Strong network and provider partnerships • Targeted geographies • Diversified product portfolio Market Positioning Market Positioning Source: Health Leaders, January 2008 (includes ASO)

Slide 66: Action Plan
Action Plan Action Plan • Focus on the basics – Sales and account management – Product and marketing – Underwriting discipline; population and account level • Build on strengths and key differentiators – Competitive HMO offering – HMO Portfolio (EOA, Silver, Salud, Optimizer) – Responsive and high t

Slide 67: Focus on Sub-Segments
Segments/ Sub-Segments 2008 Revenue Membership (12/08 Projected) Membership (12/09 Forecast) B/(W) Focus on Sub-Segments Focus on Sub-Segments Total Commercial $5.0 B 1,355 K (54,000) Large –SPA –L&T –Mid $3.5 B 1.7 B 0.3 B 1.5 B 908 K 448 K 74 K 386 K (36,000) (27,000) (9,000) Small/Individual –Sma

Slide 68: Market Segment Health Net – Sweet Spot
Market Segment Health Net – Sweet Spot Action Plan Action Plan SPA/L&T Focus: Large CA-centric employers and unions Need: – High-touch account management and service – Price-competitive HMO as slice offering – Low-cost offering without cost-shift Mid-Market Focus: Public Entities (Municipalities, Sc

Slide 69: Challenges
Challenges Challenges • Convert difficult economic environment into an opportunity by providing low - cost, profitable options to individuals and groups • Focus on value proposition to offset pricing pressure • Improve PPO product – cost structure and servicing for 2010 and beyond • Price according

Slide 70: Opportunities
Opportunities Opportunities • Well-positioned in California for 2009 – Strong HMO presence (11% market share) – Over 30 years of history in California – Provides a low cost option in a strained economy • Provide differentiated value compared to competition – One of two dominant local HMO options (ex

Slide 71: Opportunities
Opportunities Opportunities • Focus for 2009 – Targeted growth in high value geographical markets – Offer low-cost options (without unaffordable cost shift) – Pursue local opportunities in small, mid- and large group markets – Demonstrated value proposition and strengthened account services

Slide 72: Health Net, Inc. Investor Conference
Health Net, Inc. Health Net, Inc. Investor Conference Investor Conference

Slide 73: Operations Strategy Update
Operations Strategy Operations Strategy Update Update Jim Woys Executive Vice President and Chief Operating Officer November 18, 2008

Slide 74: HealthNet"
rH HealthNet"

Slide 75: Achieving Operational Excellence
Achieving Operational Excellence Achieving Operational Excellence 2007 to 2008 Recognize Opportunity 2008 to 2009 Year of Investment 2009 to 2011 Harvesting Benefits • Multiple systems • Manual processes and workarounds • System consolidation planning • Sequencing of highest benefit projects • Aging

Slide 76: Capability Improvements
• Improve service delivery while reducing costs • Economically replace aging technology • Outsource commoditized IT services • Improve quality and reliability of IT development work products • Eliminate redundancies and variation and increase performance • Improve customer service capabilities • Lau

Slide 77: HealthNet"
rH HealthNet"
Slide 78: Cost Structure Repositioning
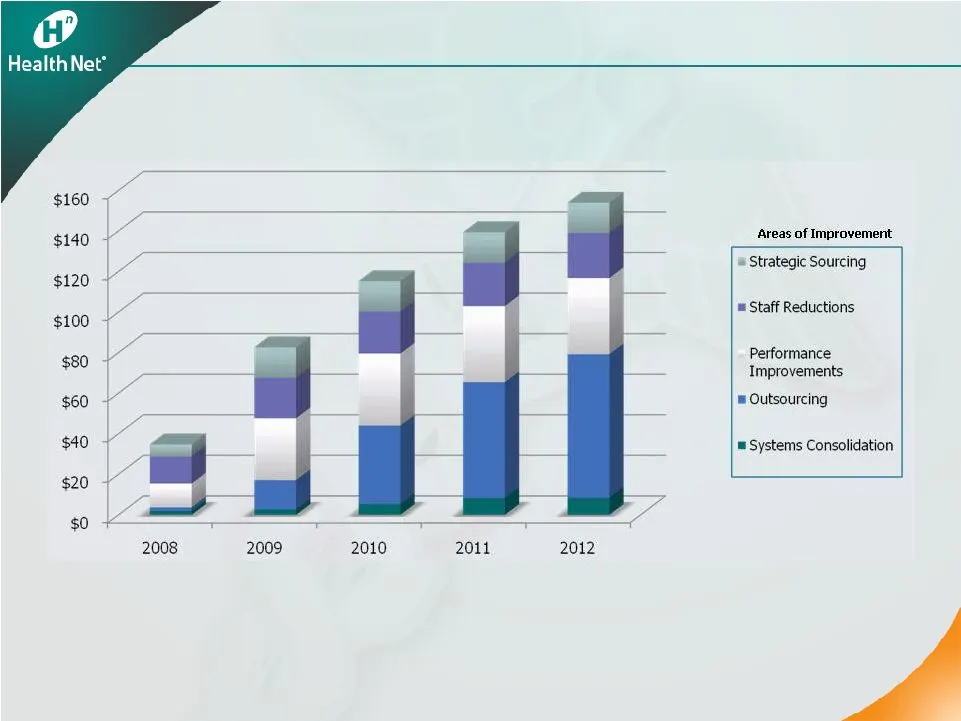
Cost Structure Repositioning Cost Structure Repositioning Operations Strategy Improvements (In Millions) • Outsourcing accounts for approximately 50% of the overall improvement • Performance improvements are result of centralized and consolidated operations, uniform metrics, use of electronic channe
Slide 79: Restructuring Charge/Savings
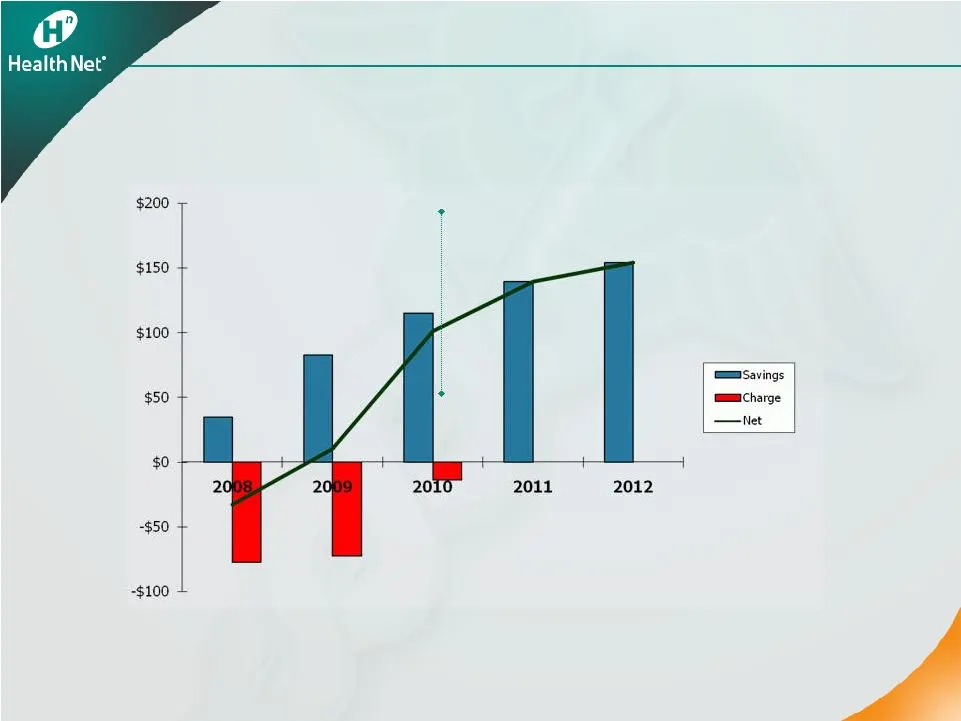
Restructuring Charge/Savings Restructuring Charge/Savings Operations Strategy Impact (In Millions) Restructuring charges include severance, retention, relocation, performance bonus, consulting, and data center relocation Break Even Year

Slide 80: Guidance vs. Actuals
Guidance vs. Actuals Guidance vs. Actuals Actual / Expectation Guidance 11.0% 10.2% 10.0% 9.5% 9.6% G&A Exceeds Guidance G&A Exceeds Guidance

Slide 81: Financial Review
Financial Review Financial Review Joseph C. Capezza Executive Vice President and Chief Financial Officer November 18, 2008

Slide 82: Agenda
Agenda Agenda • 2008 Results and Guidance • 2009 Expectations

Slide 83: 2008 Performance
2008 Performance 2008 Performance • Commercial premium yields above original guidance • Lower commercial membership • Medicaid, Medicare Advantage and PDP membership grew significantly during the year • Due to higher cost trends, primarily hospital unit cost and utilization, year-over-year deteriora

Slide 84: 2008 Balance Sheet Metrics
2008 Balance Sheet Metrics 2008 Balance Sheet Metrics As of September 30, 2008 Cash and investment holdings $2.2 Billion Strong Liquidity Ratios: – Cash ratio 0.98 – Current ratio 1.56 Debt-to-capital ratio 27.6%

Slide 85: Investment Portfolio Highlights
Investment Portfolio Highlights Investment Portfolio Highlights Market Value $1.8 Billion – Net unrealized losses $43 Million Market value yield-to-maturity 5.3% Average coupon 5.1% Average duration 3.9 years Average rating AA+ Subprime risk -0- As of September 30, 2008

Slide 86: Agenda
Agenda Agenda • 2008 Results and Guidance • 2009 Expectations

Slide 87: 2009 Earnings Guidance
2009 Earnings Guidance 2009 Earnings Guidance Year-end Membership • Commercial Risk -3 to -5% • Medicaid +2 to +3% • Medicare Advantage -1 to -2% • PDP -15 to –20% Consolidated Revenues $15.5 to $16 billion Commercial Premium Yields ~ 9 to 9.5% Commercial Health Care Cost Trends ~ 40 to 60 bps < yie

Slide 88: HealthNet"
rH HealthNet"

Slide 89: Key Drivers of 2009 EPS Improvement
Key Drivers of 2009 EPS Improvement Key Drivers of 2009 EPS Improvement * *2009 guidance excludes expected operations strategy-related charges of $70 million to $80 million * Excludes nine months YTD 2008 litigation-related charges of $59 million, operations strategy-related charges of $53 million,

Slide 90: Cash Position at the Parent Company
Cash Position at the Parent Company Cash Position at the Parent Company ($ Millions) Actual cash at Parent (9/30/08) $140 Expected cash at Parent (12/31/08) $210 2009 Annual cash needs Interest expense Debt repayment Other Total ($85) Average dividends from subsidiaries $100 Expected cash at Parent

Slide 91: 2009 Cash & Investments Guidance
2009 Cash & Investments Guidance 2009 Cash & Investments Guidance • Operating cash flow approximately 115% of net income or $275 million to $295 million • Capital expenditures of approximately $50 million to $55 million • No share repurchases • Maintain strong capital position with a total RBC of ap

Slide 92: Summary
Summary Summary • Visibility to 2009 earnings growth • Focus on margin improvement • Executing on G&A expense management • Investment portfolio and balance sheet strong
Source: SEC EDGAR · 8-K filed Nov 18, 2008
More decks from Health Net Inc
 Q2 2015 Earnings Presentation25 slides · Sep 23, 2015
 SPAC Merger (July 2015)18 slides · Jul 15, 2015
 SPAC Merger (July 2015)18 slides · Jul 14, 2015
 Merger or Acquisition (July 2015)13 slides · Jul 2, 2015
 Investor Day (February 2012)74 slides · Feb 16, 2012
 30th Annual J.P. Morgan Healthcare Conference (January 2012)13 slides · Jan 9, 2012