Susquehanna Bancshares — Investor Presentation (February 2014)
45 slides from Susquehanna Bancshares's investor presentation, Feb 7, 2014
Slide 1: Susquehanna Bancshares, Inc. Investor Presentation 1st Quarter 2014
Exhibit 99.1 Susquehanna Bancshares, Inc. Investor Presentation 1 st Quarter 2014
Slide 2: Forward-Looking Statements
Forward-Looking Statements During the course of this presentation, we may make forward-looking statements regarding priorities and strategic objectivesof Susquehanna Bancshares, Inc., as well as capital ratios, efficiency ratios, net income and earnings. Investors should understand that these forwar
Slide 3: Why Susquehanna?
Why Susquehanna? Business Strategy Regional bank with a customer-focused “community bank” delivery model Grow deposits – attractive markets with rich deposit base and favorable demographics Commercial loan focus – ample small business opportunities within footprint Enhance fee income activities – ca
Slide 4: Table of Contents
Table of Contents Susquehanna Overview 5 Financial Review: Fourth Quarter and Full Year 2013 10 Business Strategy: Regional Bank With a Customer-Focused 15 “Community Bank”Delivery Model Valuation and Long-Term Upside 28 Quarterly Financial Supplement 31 4

Slide 5: Susquehanna Overview
ae aad Susquehanna Overview
Slide 6: Susquehanna Overview
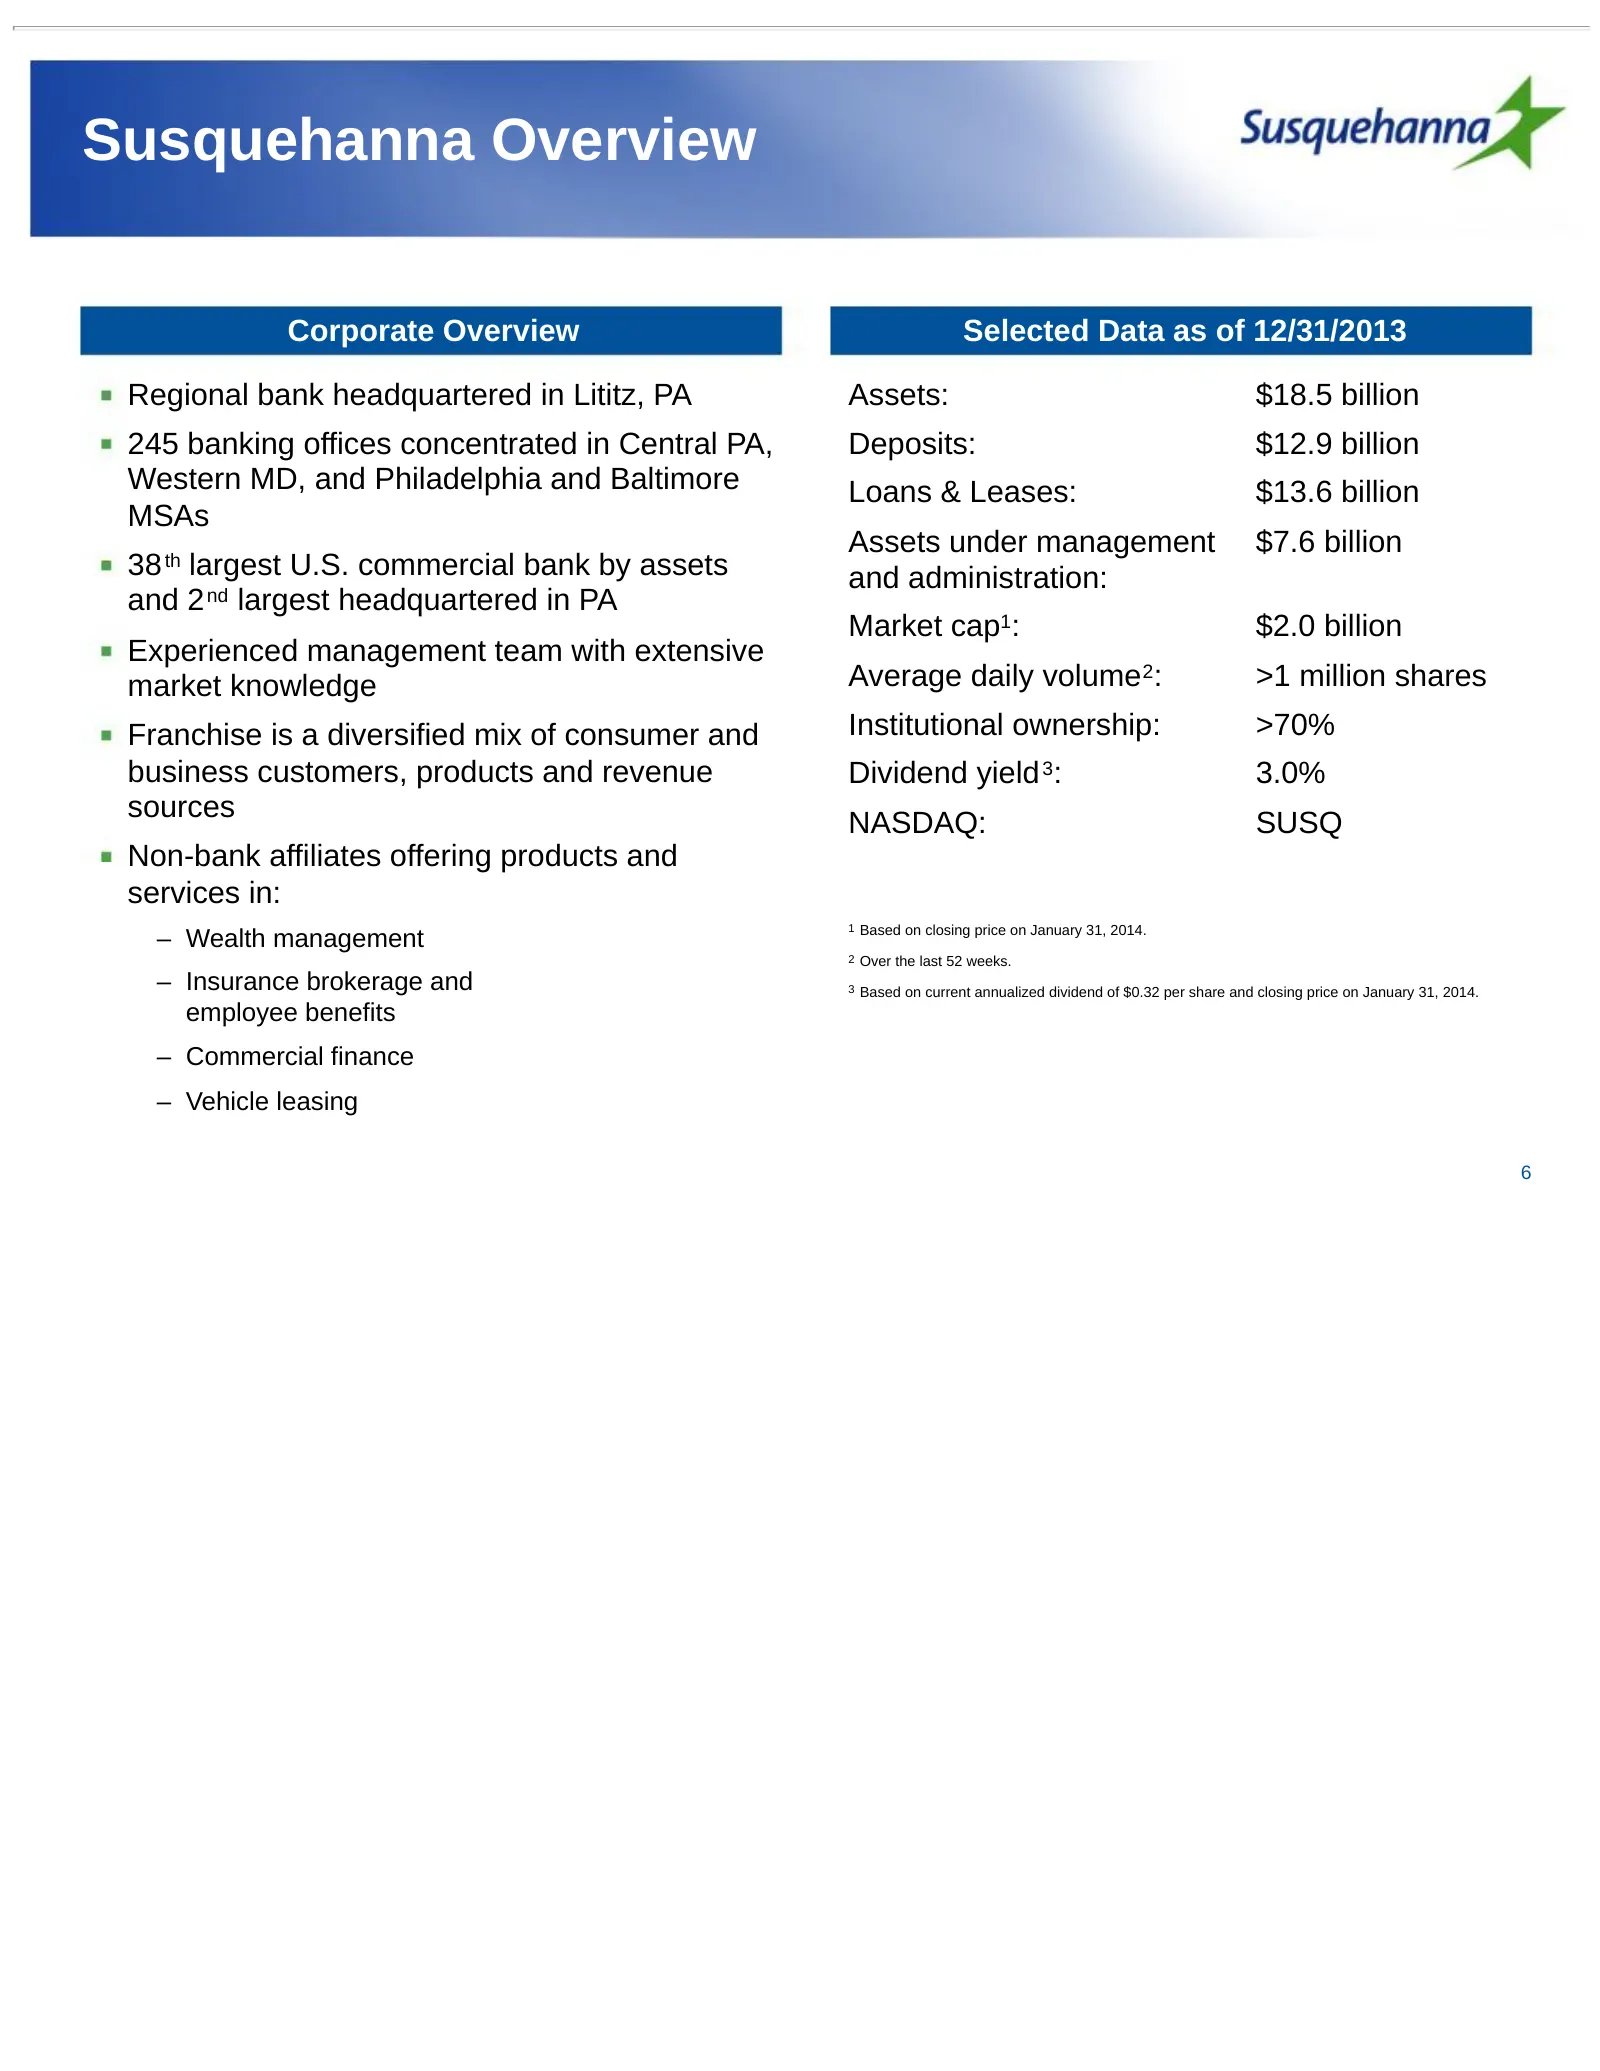
Susquehanna Overview Corporate Overview Selected Data as of 12/31/2013 Regional bank headquartered in Lititz, PA Assets: $18.5 billion 245 banking offices concentrated in Central PA, Deposits: $12.9 billion Western MD, and Philadelphia and Baltimore Loans & Leases: $13.6 billion MSAs Assets under ma
Slide 7: Uniquely Positioned
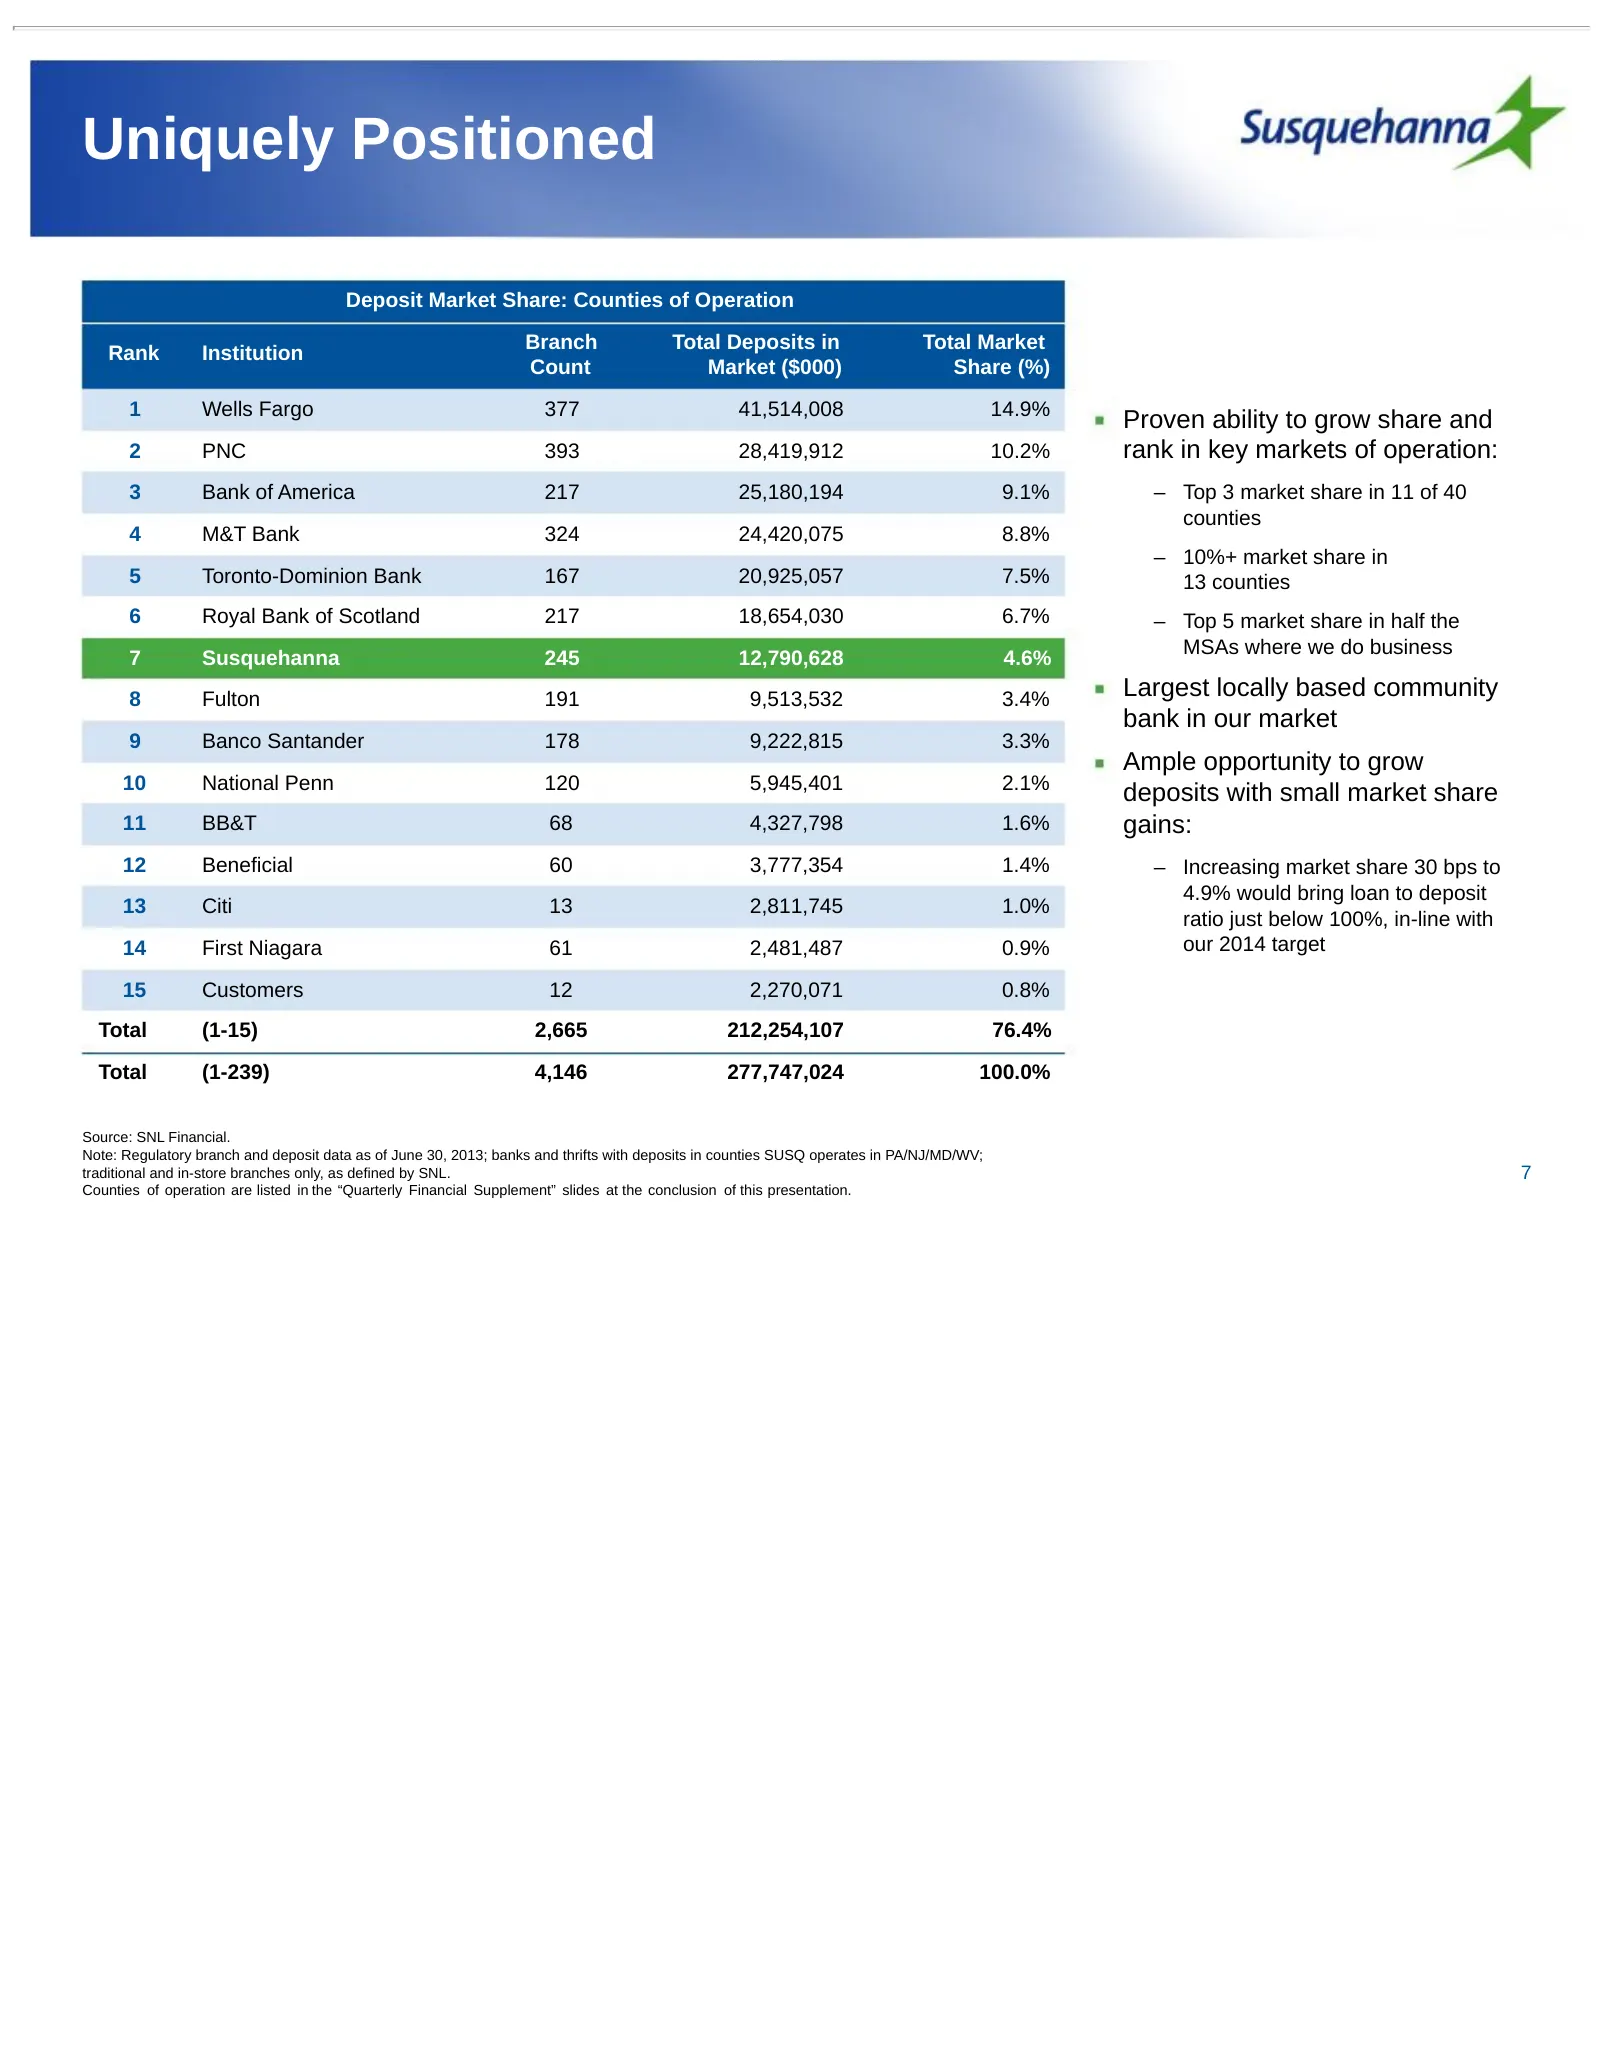
Uniquely Positioned Deposit Market Share: Counties of Operation Branch Total Deposits in Total Market Rank Institution Count Market ($000) Share (%) 1 Wells Fargo 377 41,514,008 14.9% Proven ability to grow share and 2 PNC 393 28,419,912 10.2% rank in key markets of operation: 3 Bank of America 217
Slide 8: Leading Competitive Position
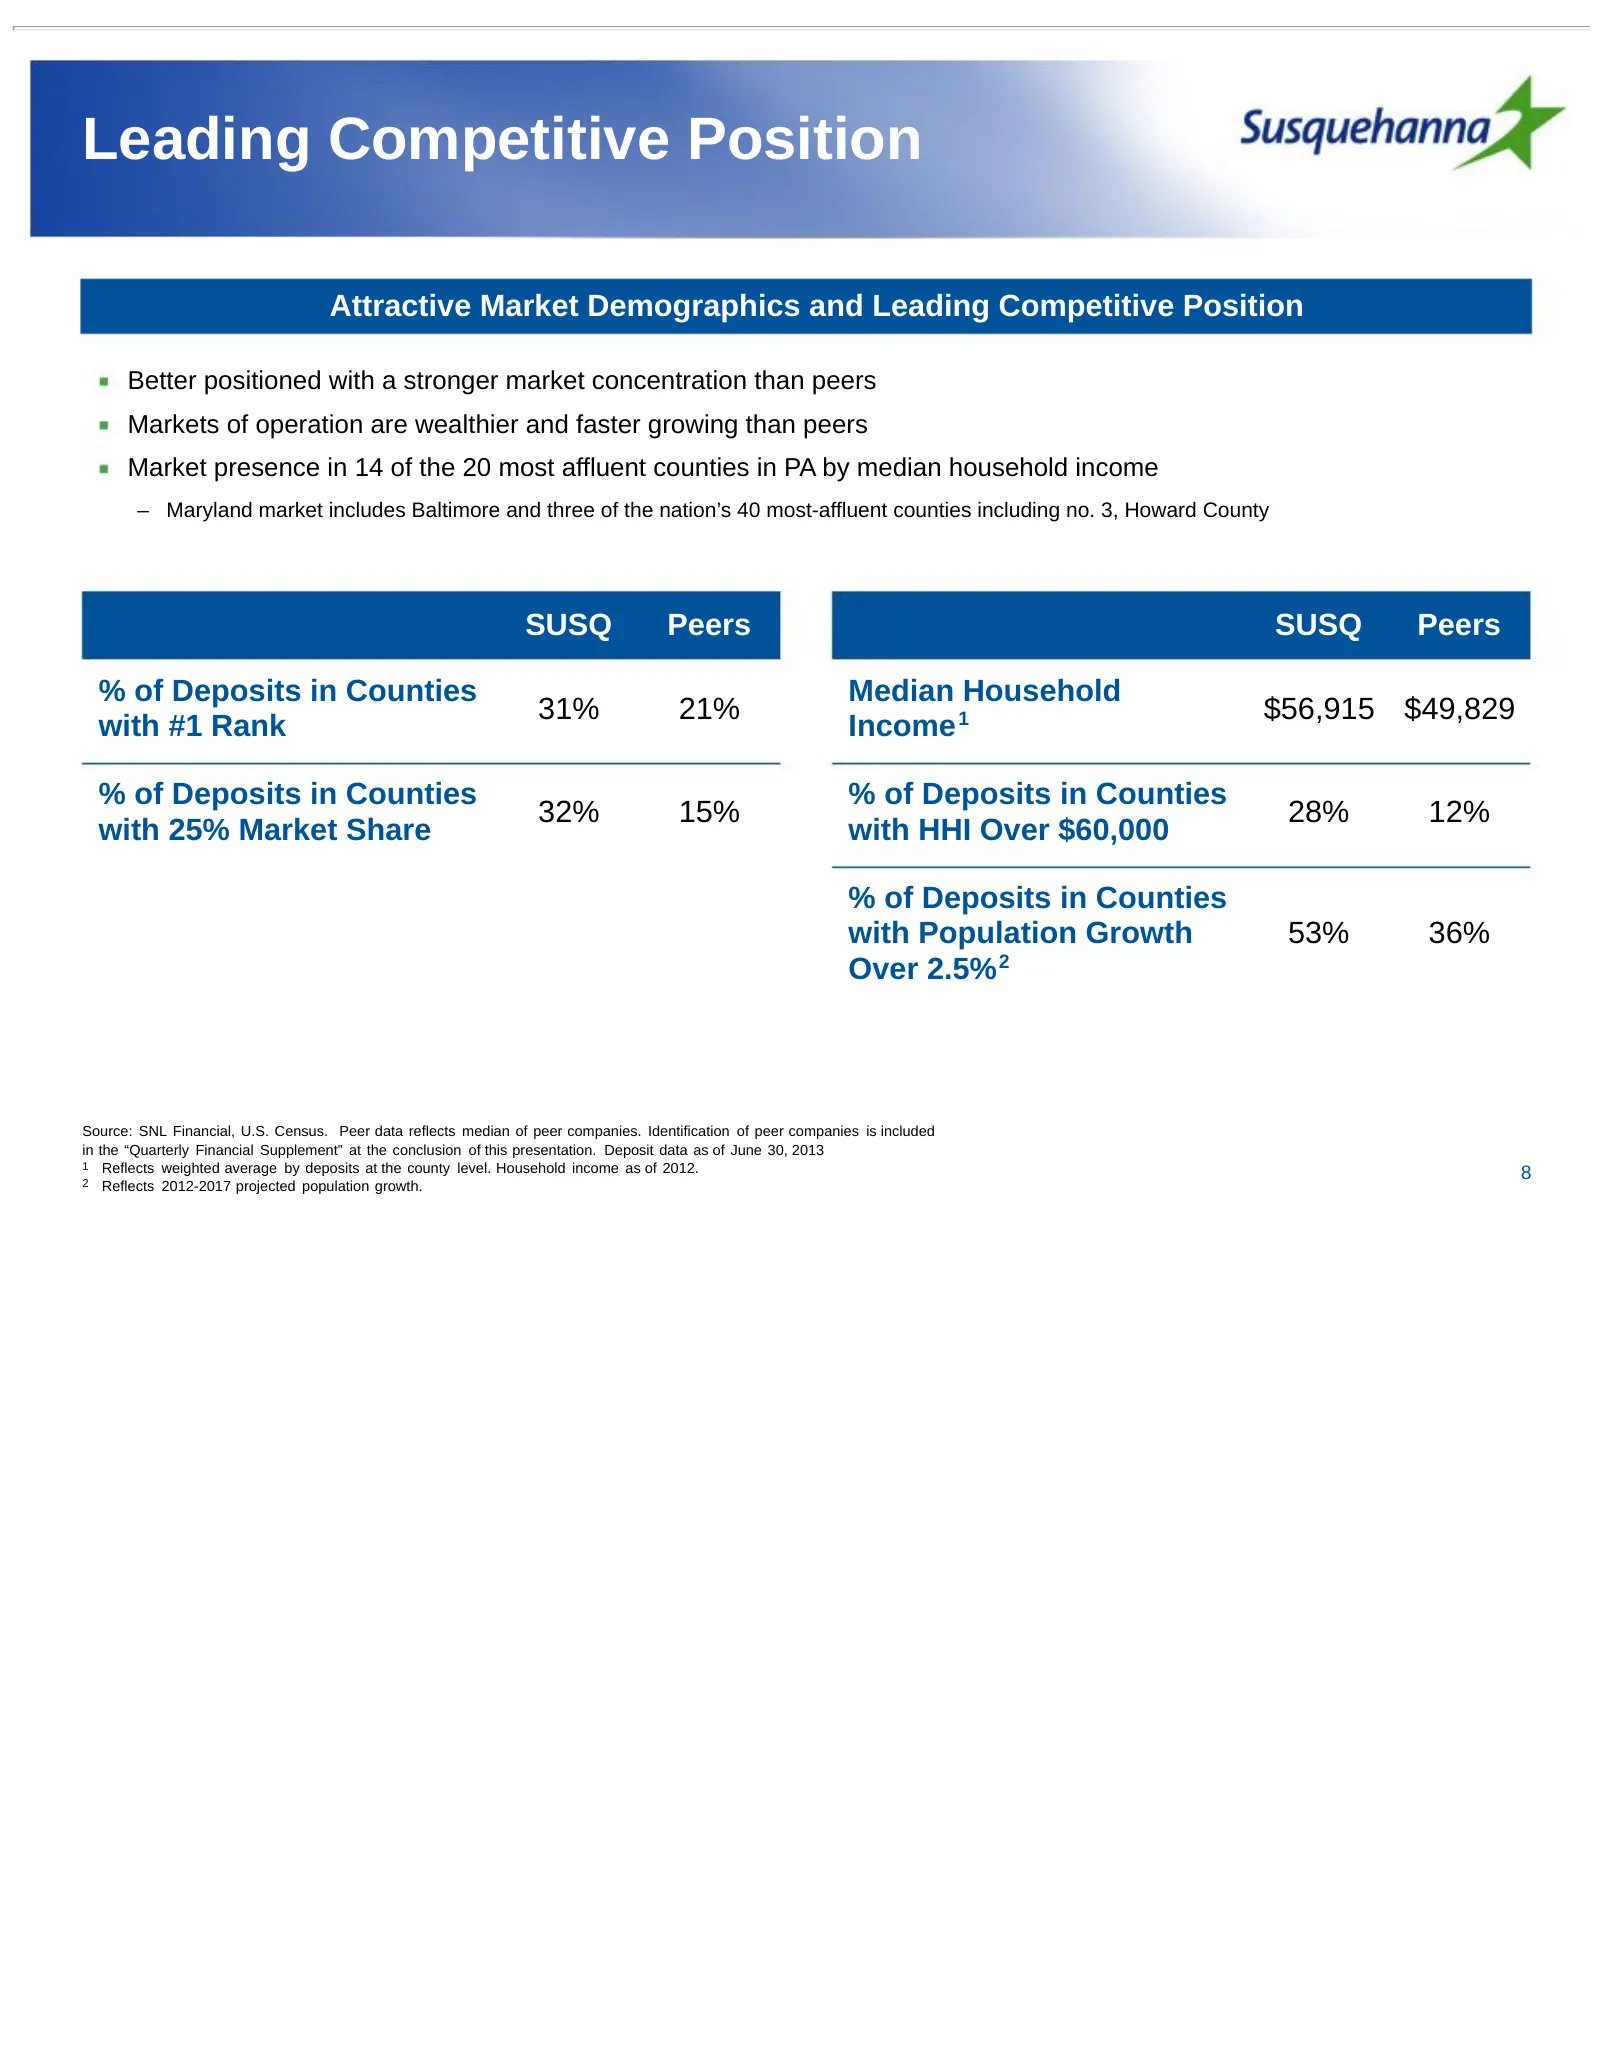
Leading Competitive Position Attractive Market Demographics and Leading Competitive Position Better positioned with a stronger market concentration than peers Markets of operation are wealthier and faster growing than peers Market presence in 14 of the 20 most affluent counties in PA by median house
Slide 9: Positioned for Further Growth
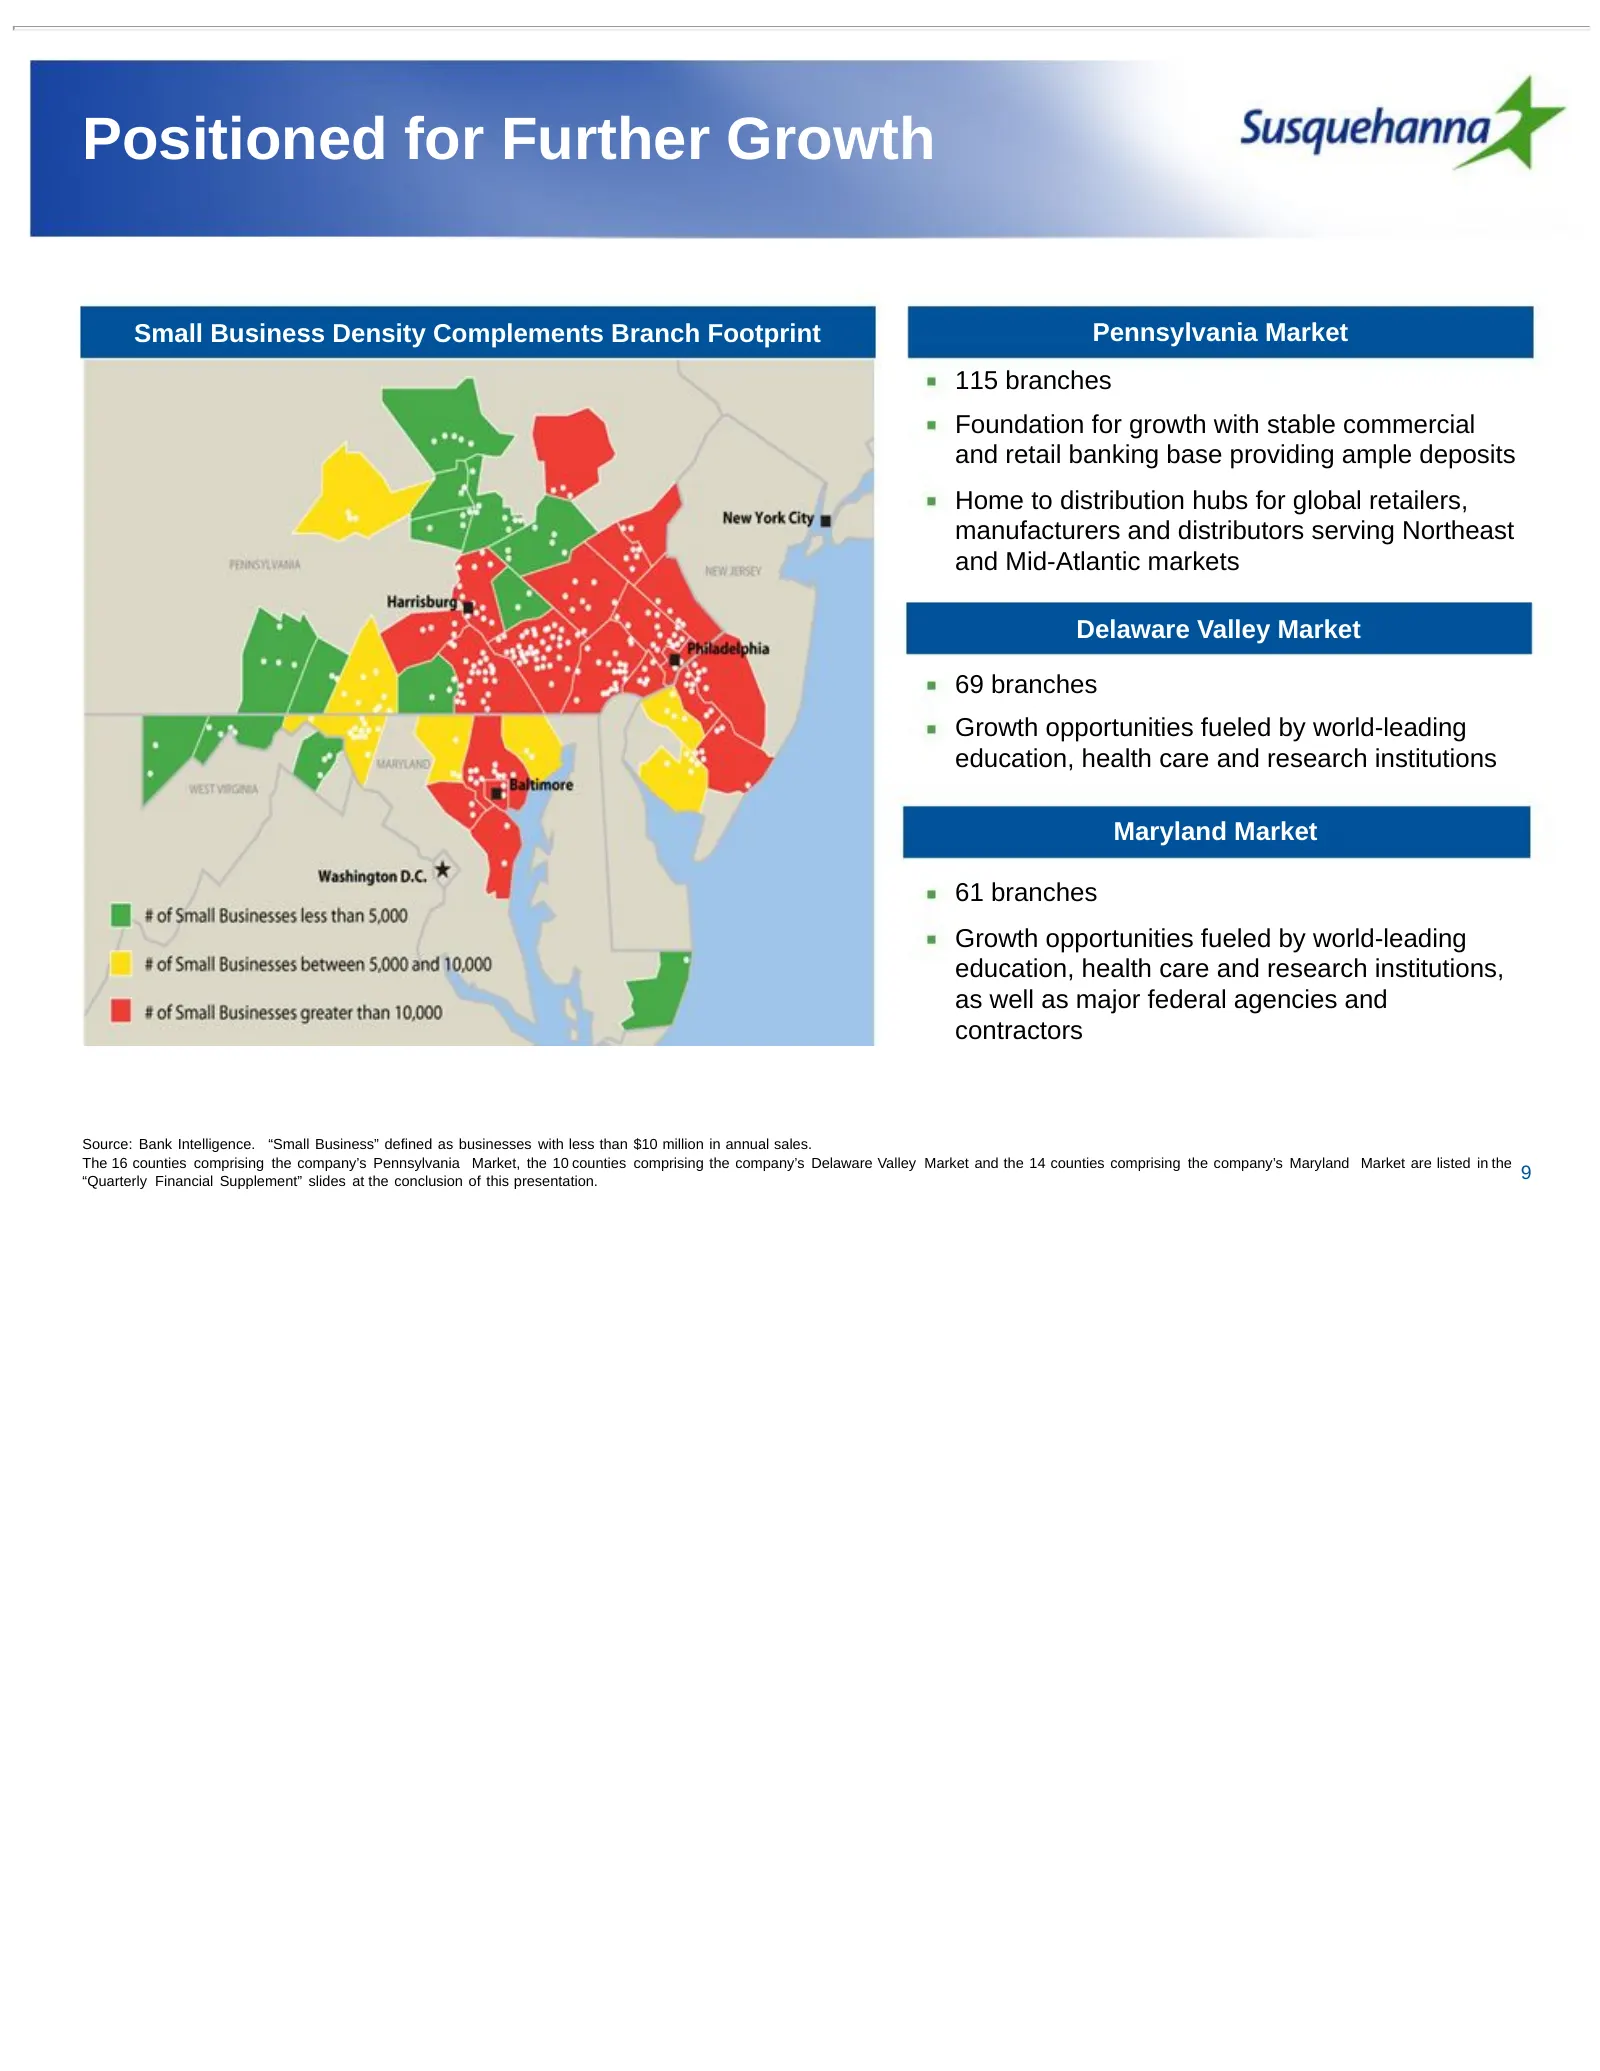
Positioned for Further Growth Small Business Density Complements Branch Footprint Pennsylvania Market 115 branches Foundation for growth with stable commercial and retail banking base providing ample deposits Home to distribution hubs for global retailers, manufacturers and distributors serving Nort
Slide 10: Financial Review: Fourth Quarter and Full Year 2013
Financial Review: Fourth Quarter and Full Year 2013 10
Slide 11: Fourth Quarter 2013 Highlights
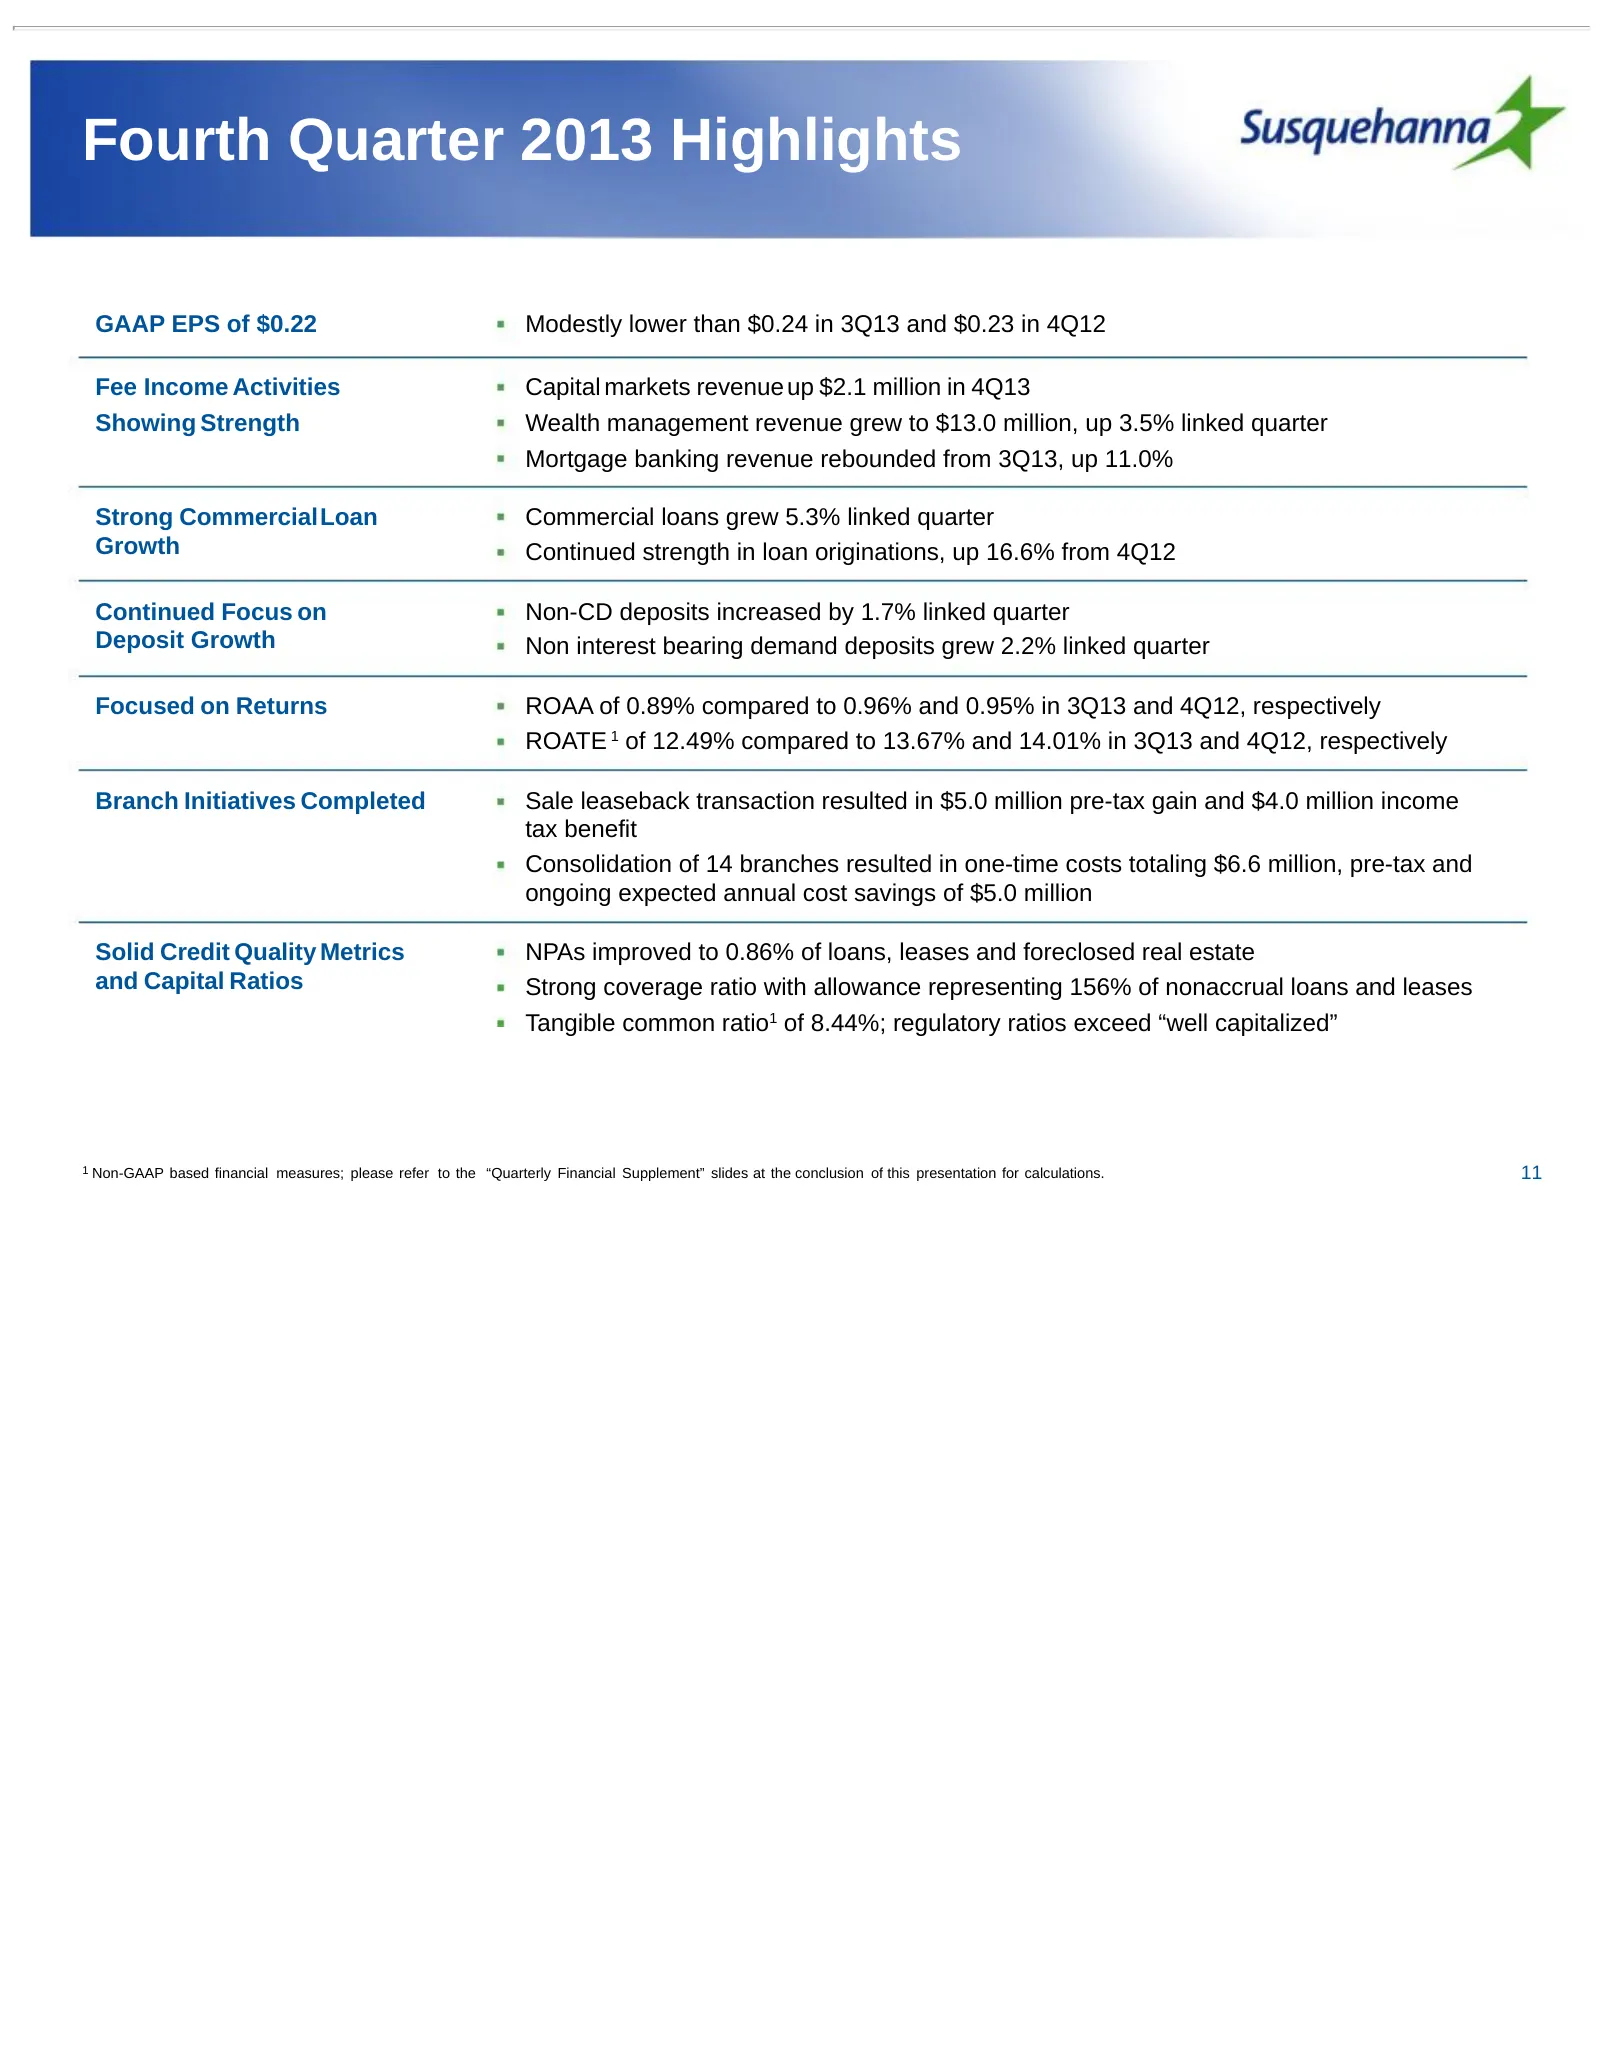
Fourth Quarter 2013 Highlights GAAP EPS of $0.22 Modestly lower than $0.24 in 3Q13 and $0.23 in 4Q12 Fee Income Activities Capital markets revenue up $2.1 million in 4Q13 Showing Strength Wealth management revenue grew to $13.0 million, up 3.5% linked quarter Mortgage banking revenue rebounded from
Slide 12: Fourth Quarter Purchase Accounting Impact
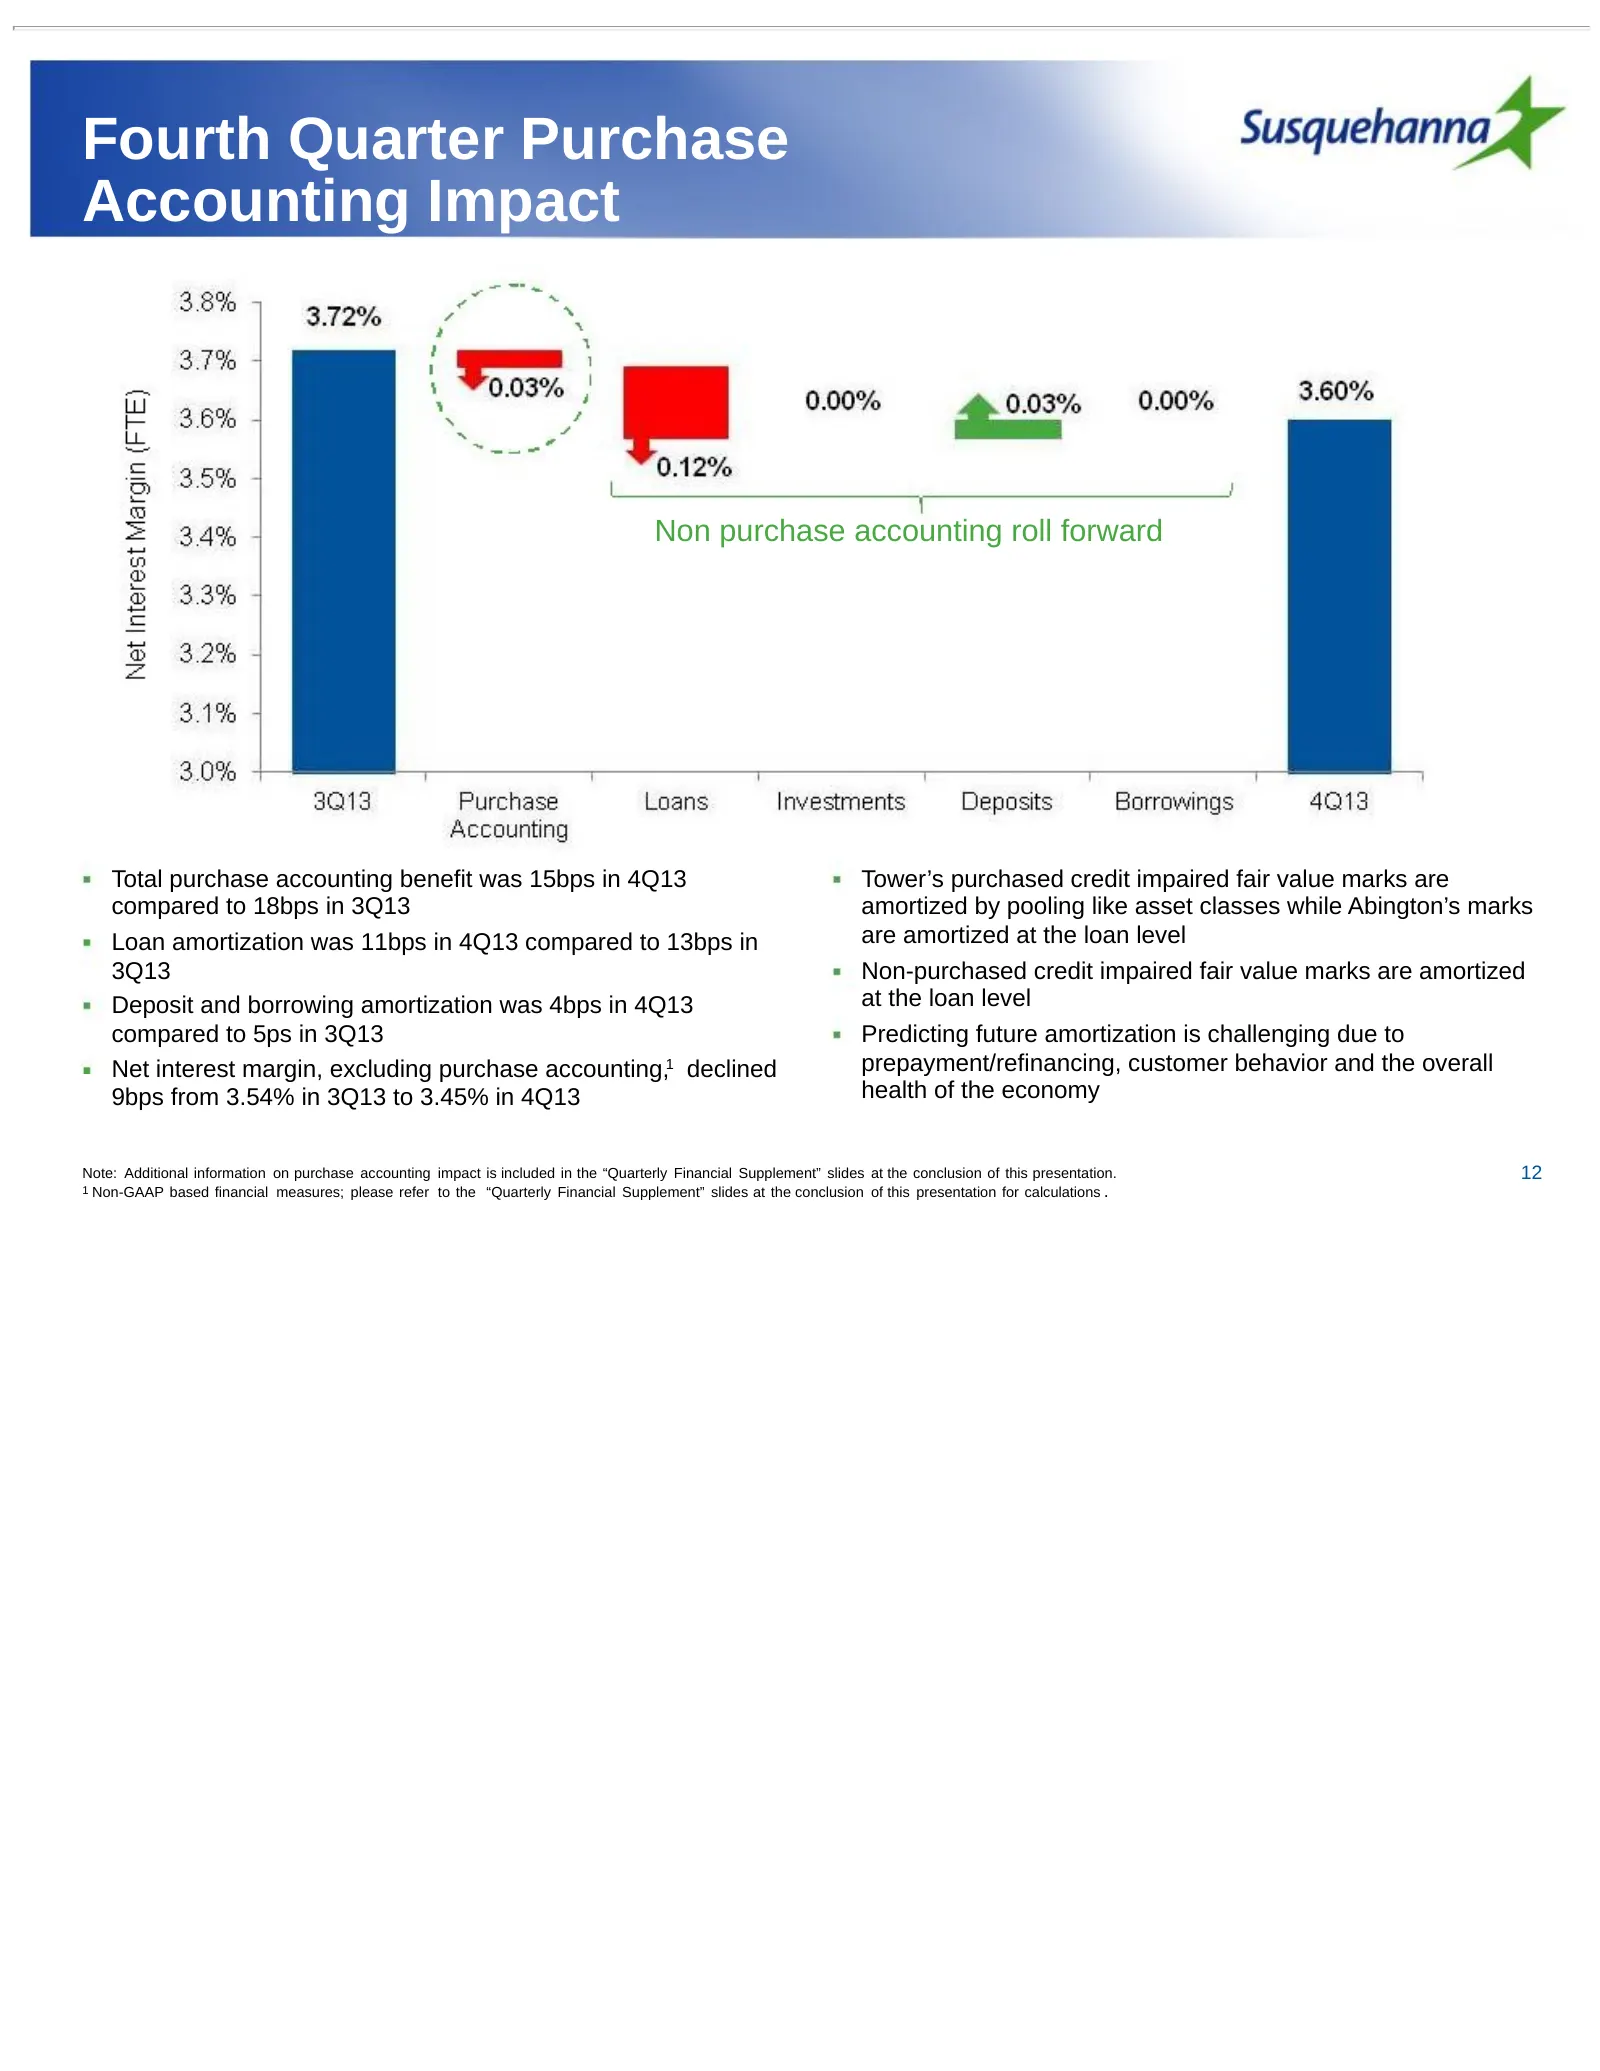
Fourth Quarter Purchase Accounting Impact Non purchase accounting roll forward Total purchase accounting benefit was 15bps in 4Q13 Tower’s purchased credit impaired fair value marks are compared to 18bps in 3Q13 amortized by pooling like asset classes while Abington’s marks Loan amortization was 11b
Slide 13: Full Year 2013 Highlights
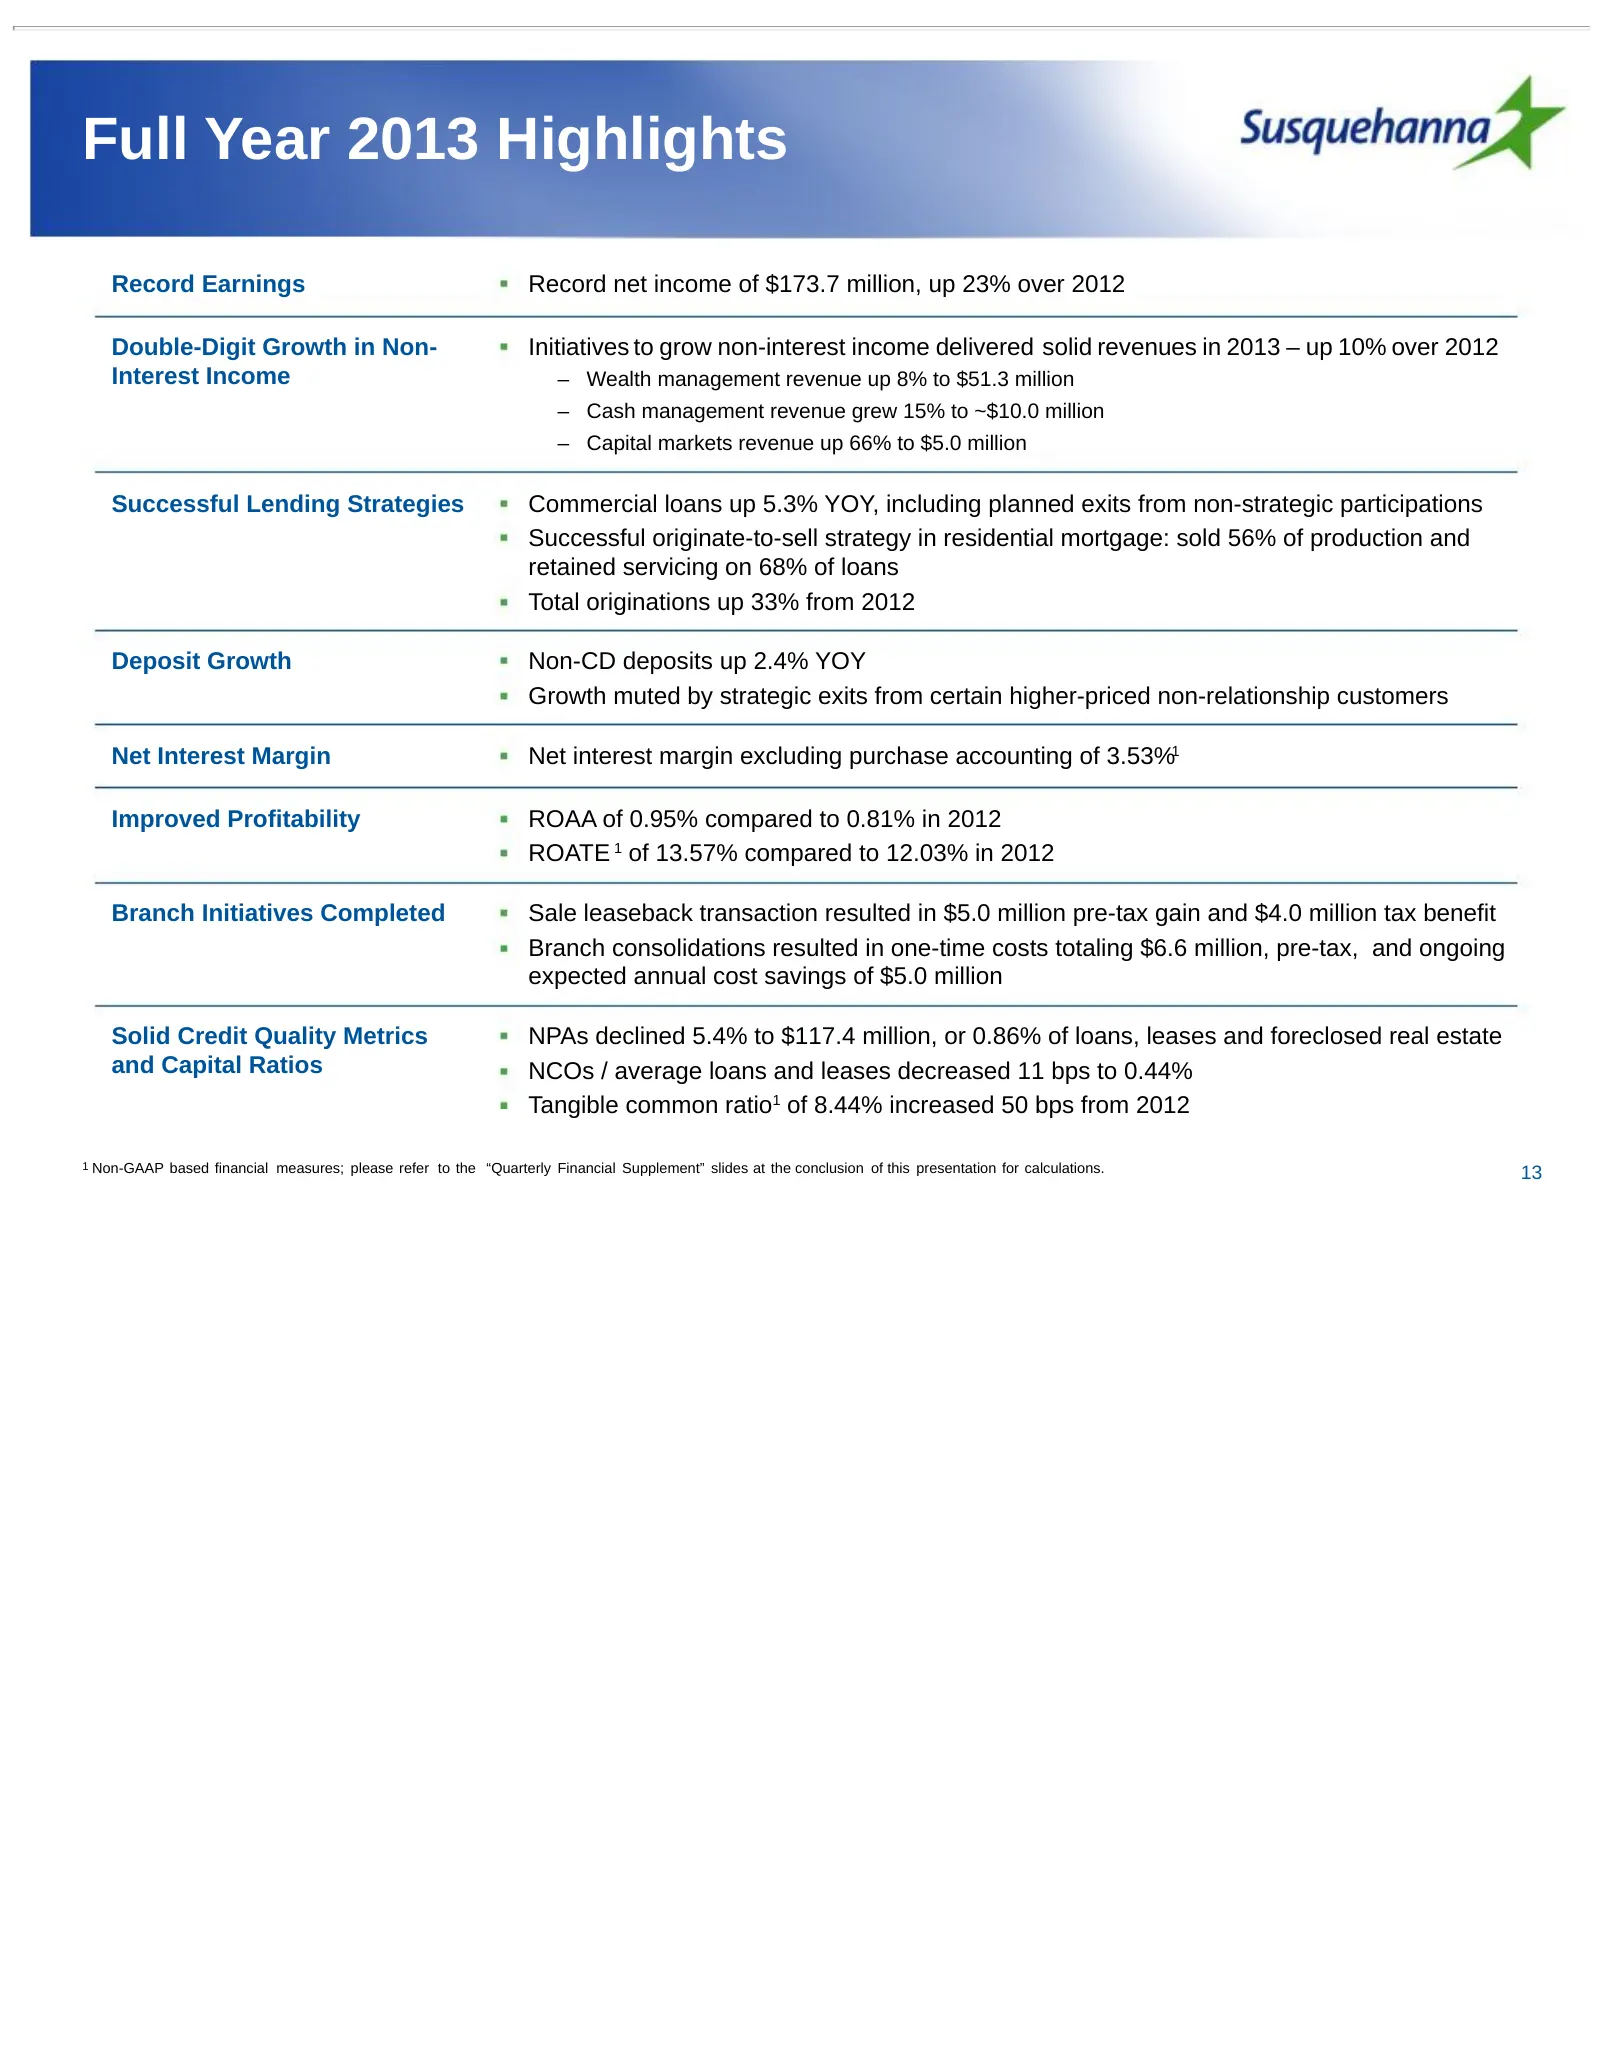
Full Year 2013 Highlights Record Earnings Record net income of $173.7 million, up 23% over 2012 Double-Digit Growth in Non- Initiatives to grow non-interest income delivered solid revenues in 2013 – up 10% over 2012 Interest Income – Wealth management revenue up 8% to $51.3 million – Cash management
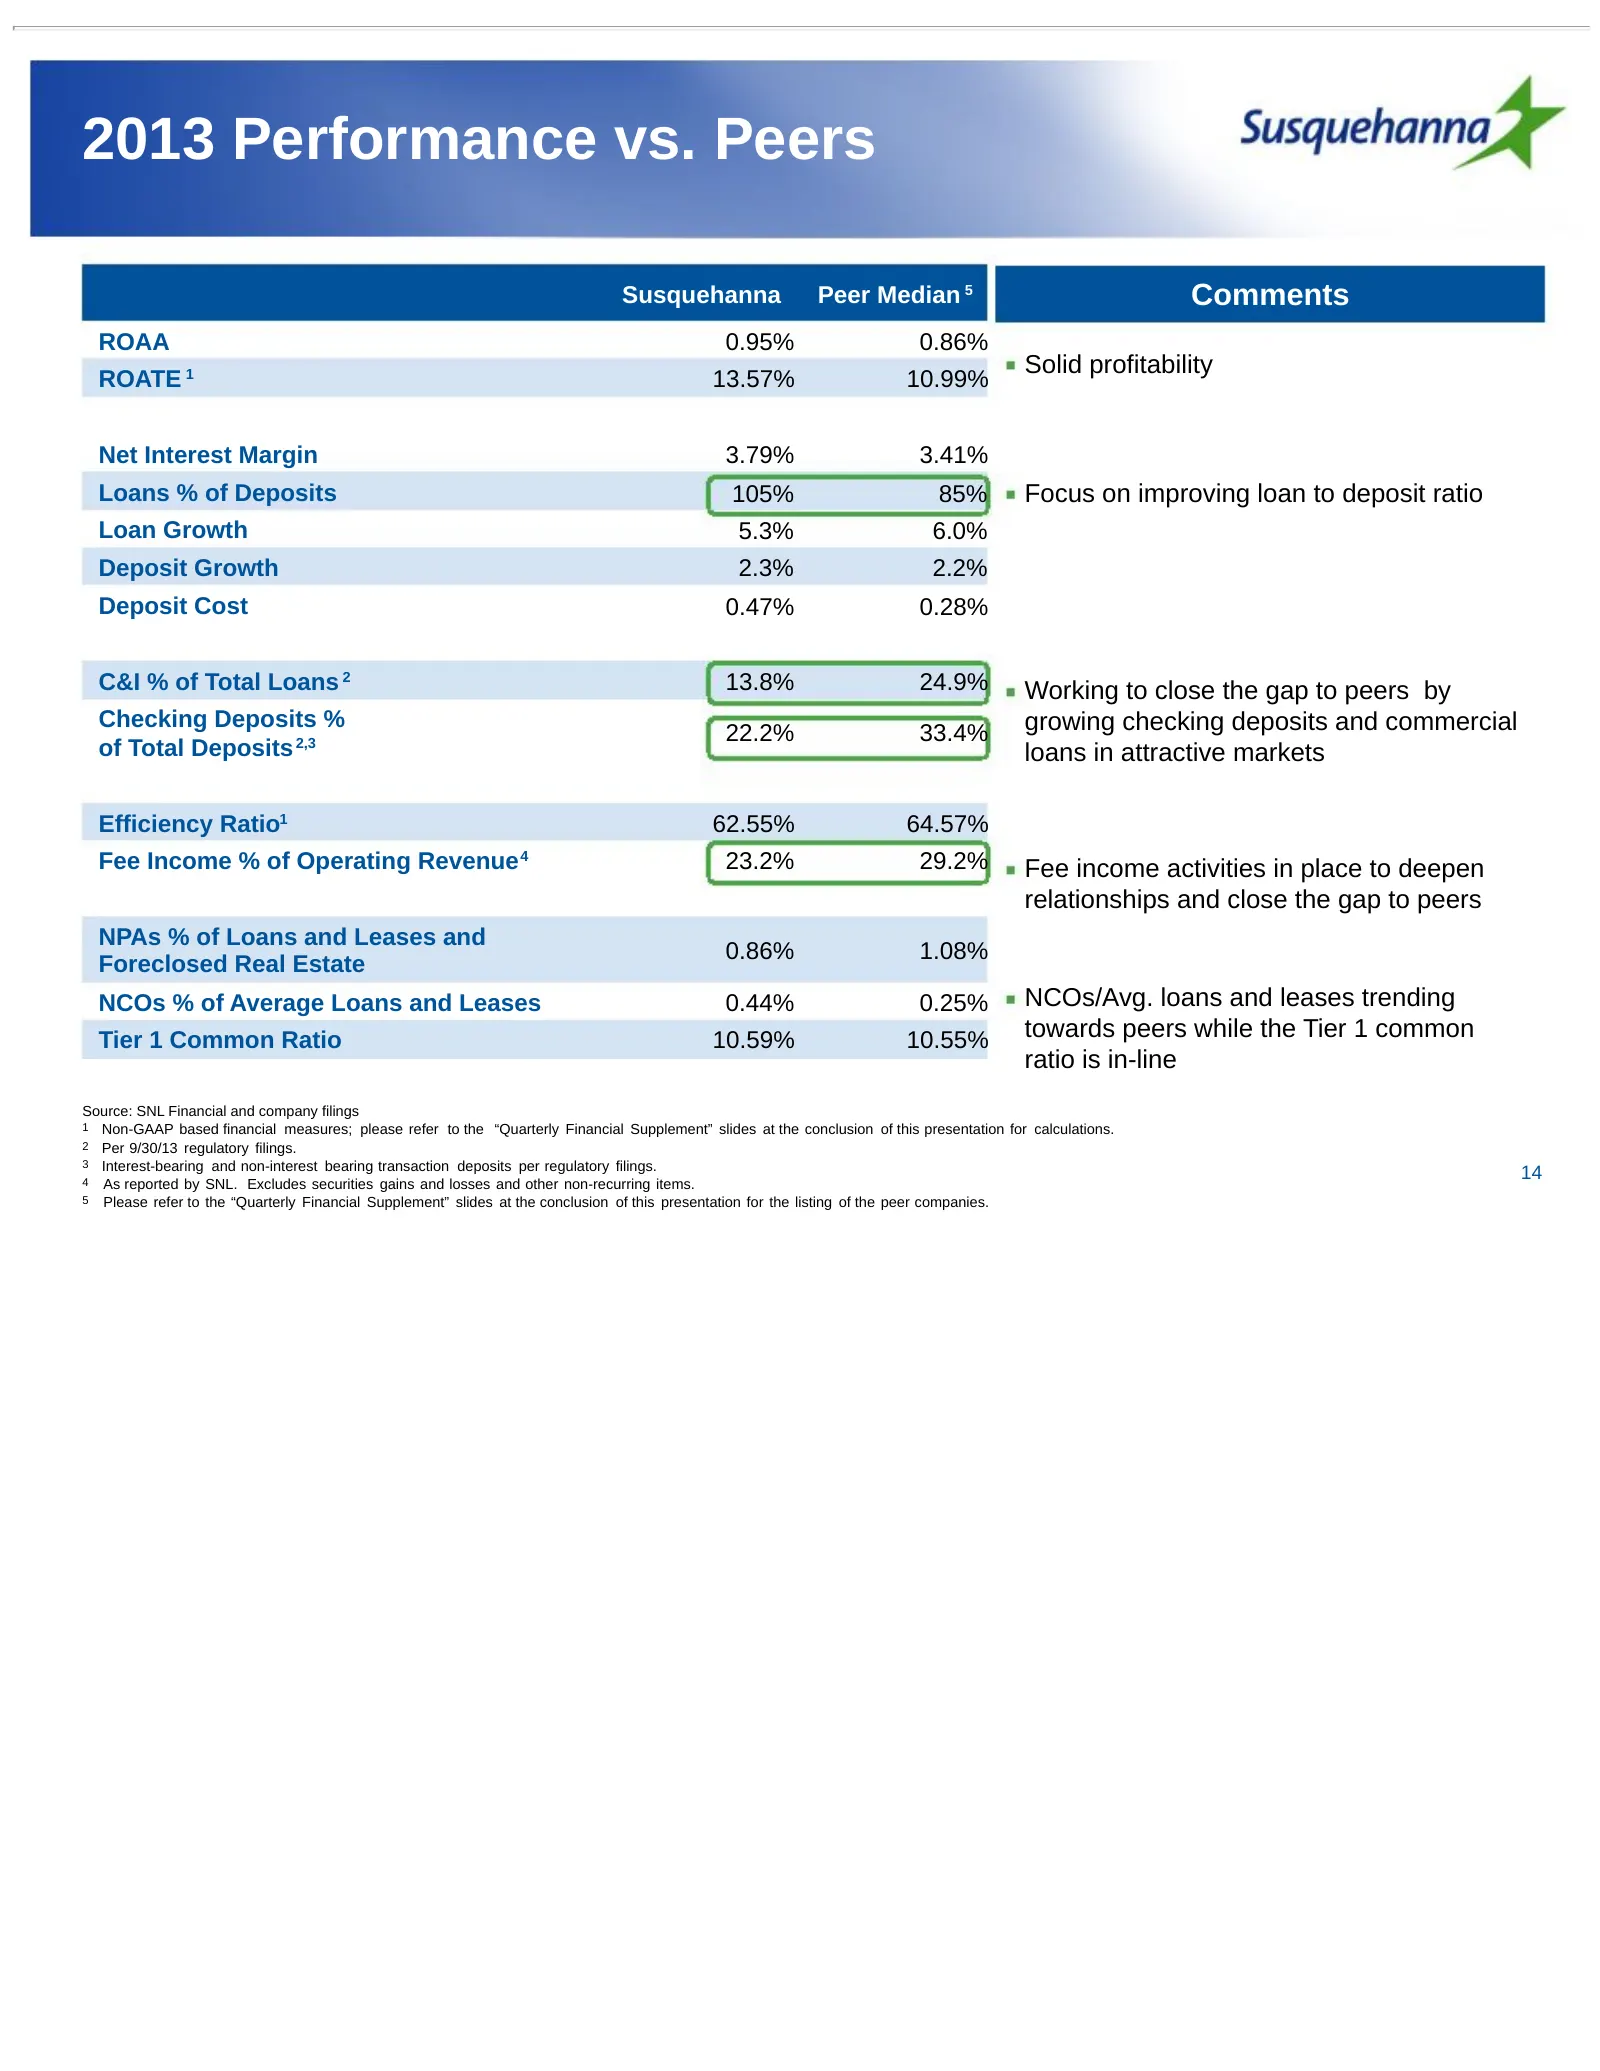
Slide 14: 2013 Performance vs. Peers
2013 Performance vs. Peers Susquehanna Peer Median 5 Comments ROAA 0.95% 0.86% Solid profitability ROATE 1 13.57% 10.99% Net Interest Margin 3.79% 3.41% Loans % of Deposits 105% 85% Focus on improving loan to deposit ratio Loan Growth 5.3% 6.0% Deposit Growth 2.3% 2.2% Deposit Cost 0.47% 0.28% C&I %
Slide 15: Business Strategy: Regional Bank With a Customer-Focused Community Bank Delivery Model
Business Strategy: Regional Bank With a Customer-Focused “Community Bank” Delivery Model 15
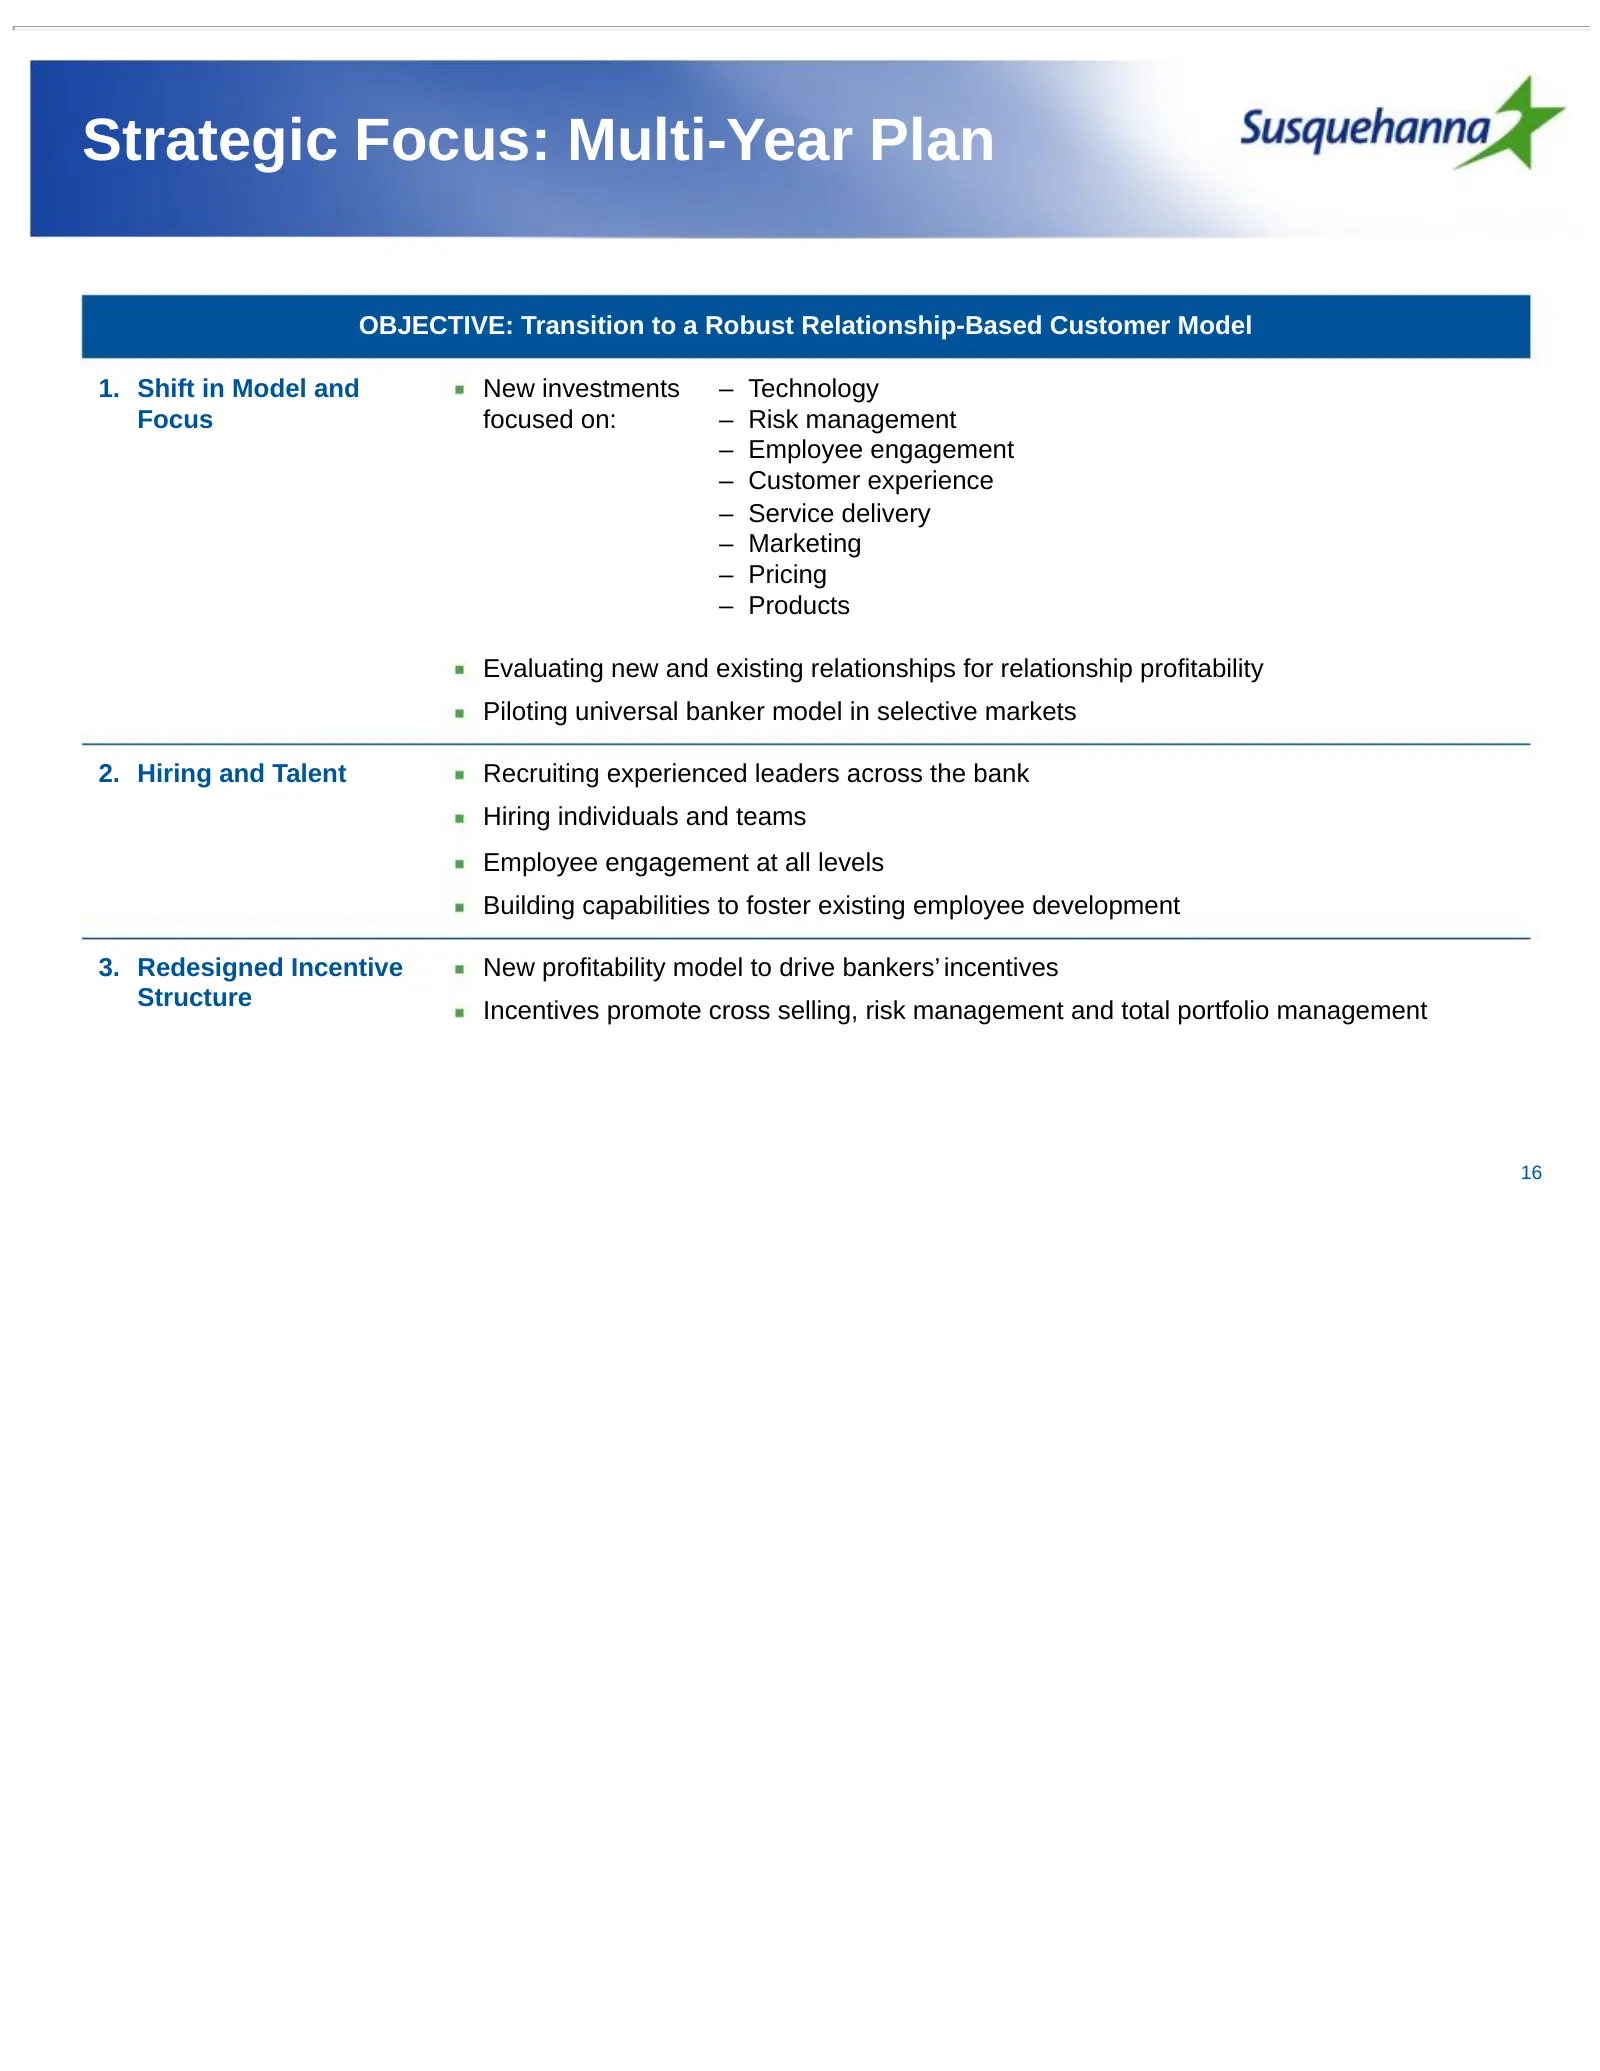
Slide 16: Strategic Focus: Multi-Year Plan
Strategic Focus: Multi-Year Plan OBJECTIVE: Transition to a Robust Relationship-Based Customer Model 1. Shift in Model and New investments – Technology Focus focused on: – Risk management – Employee engagement – Customer experience – Service delivery – Marketing – Pricing – Products Evaluating new a
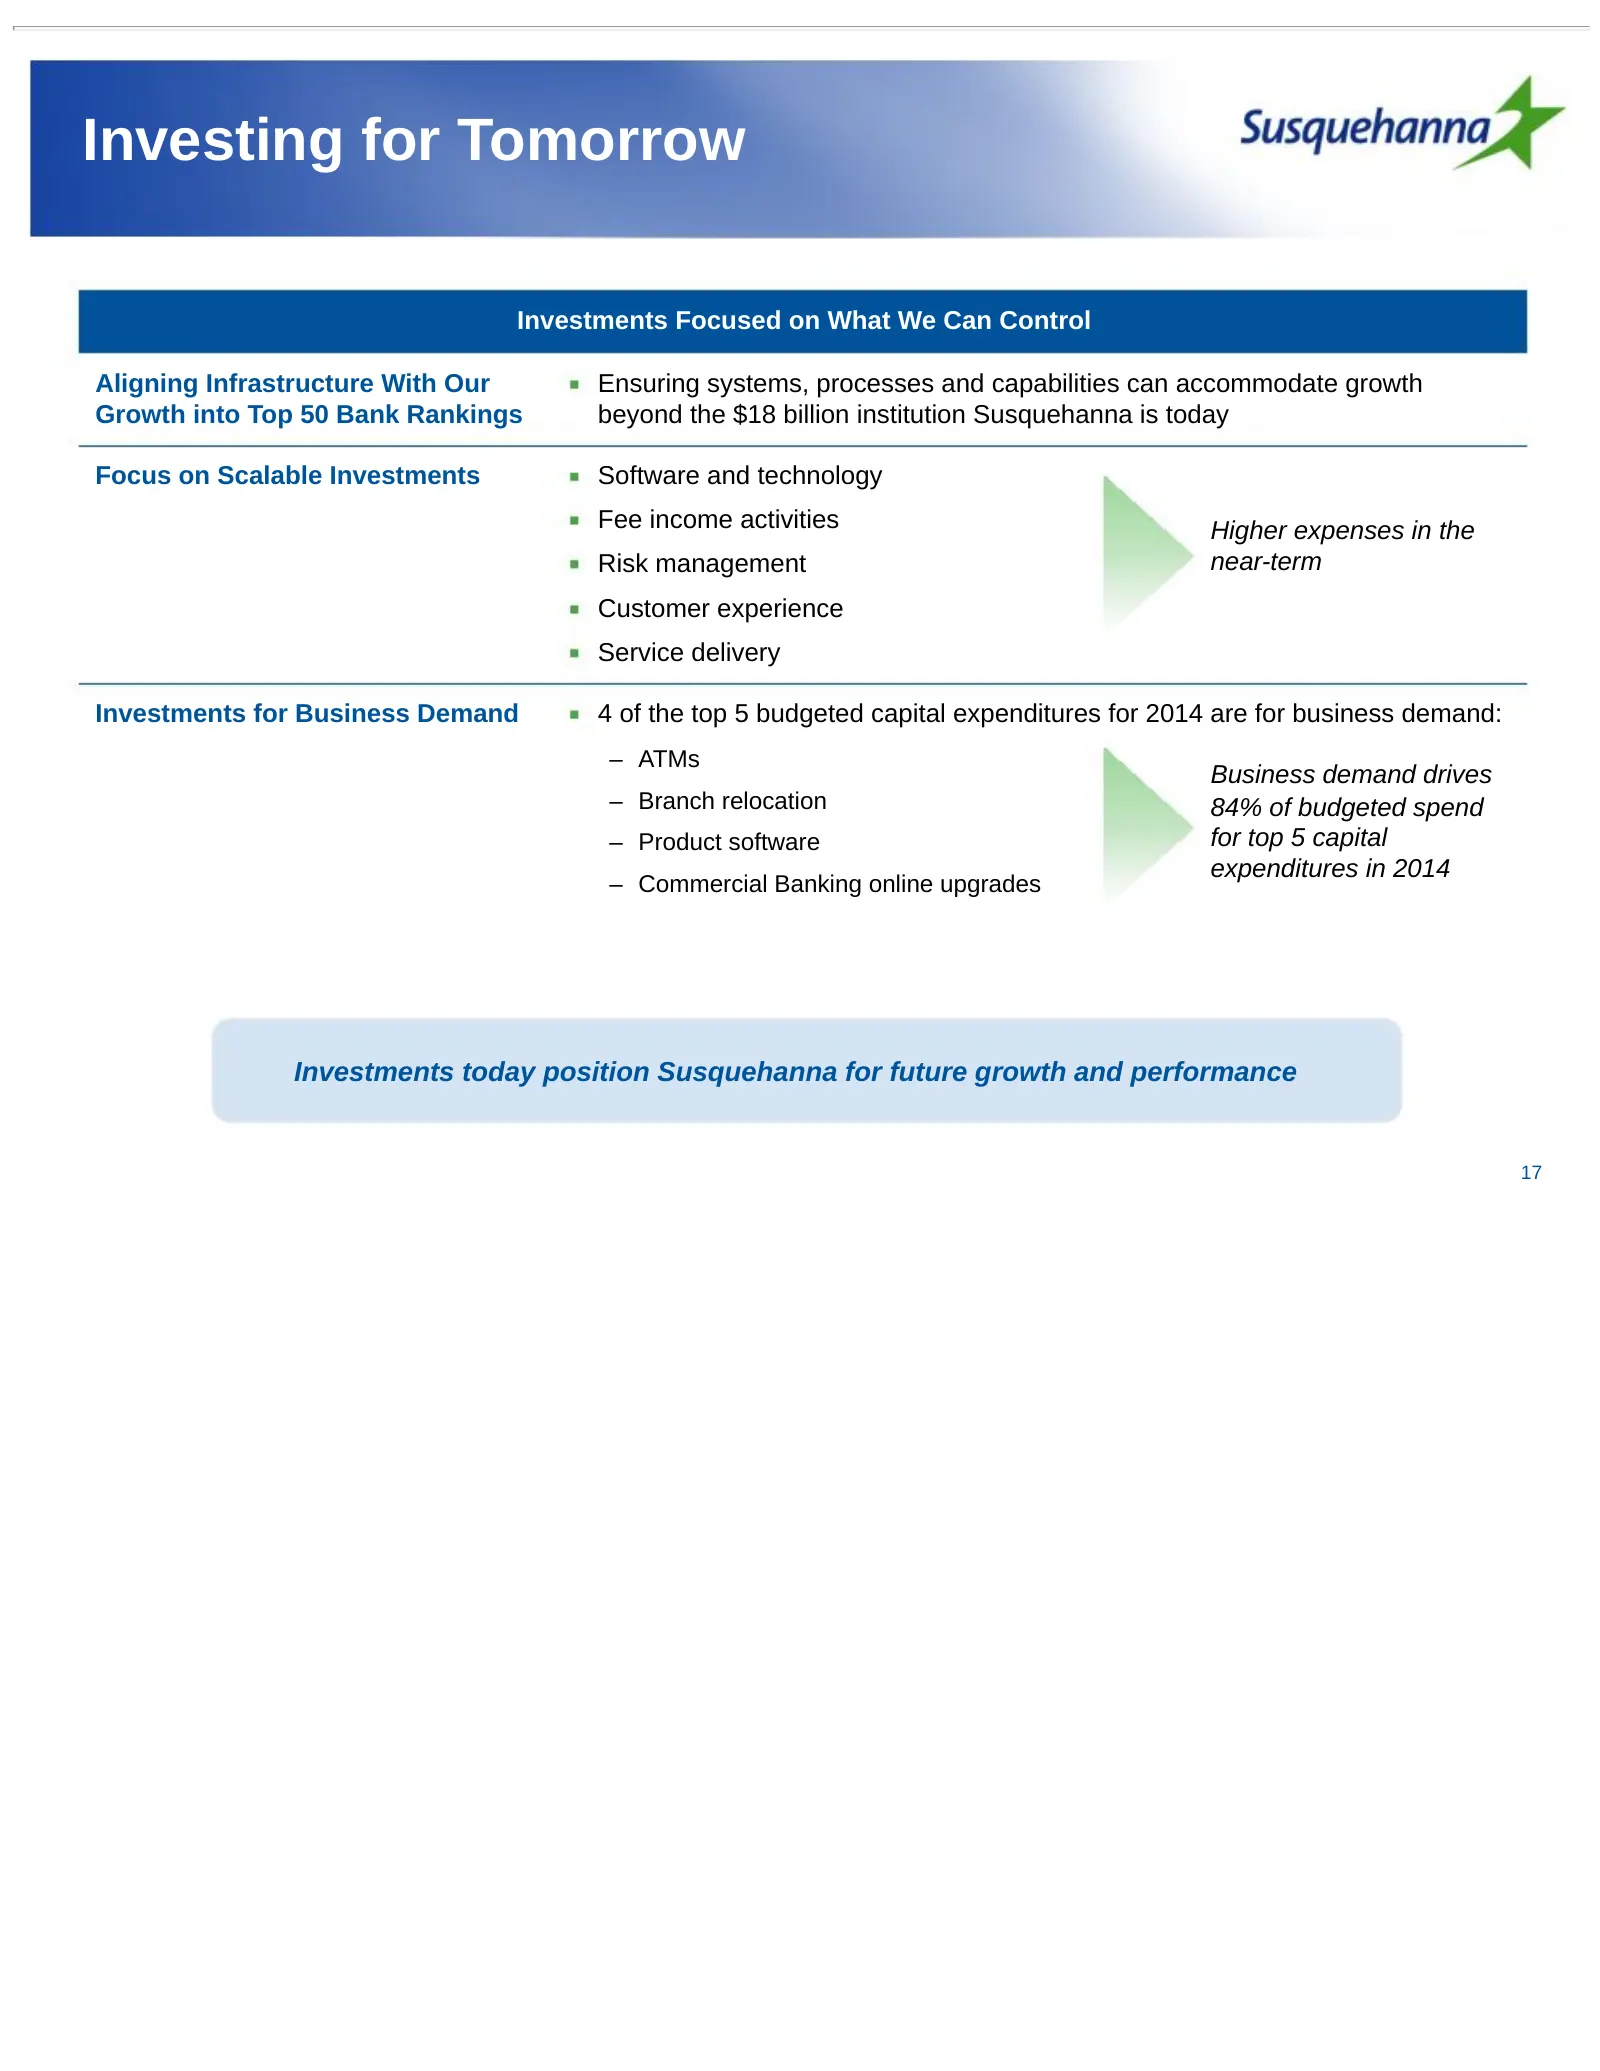
Slide 17: Investing for Tomorrow
Investing for Tomorrow Investments Focused on What We Can Control Aligning Infrastructure With Our Ensuring systems, processes and capabilities can accommodate growth Growth into Top 50 Bank Rankings beyond the $18 billion institution Susquehanna is today Focus on Scalable Investments Software and t
Slide 18: Investing in Talent
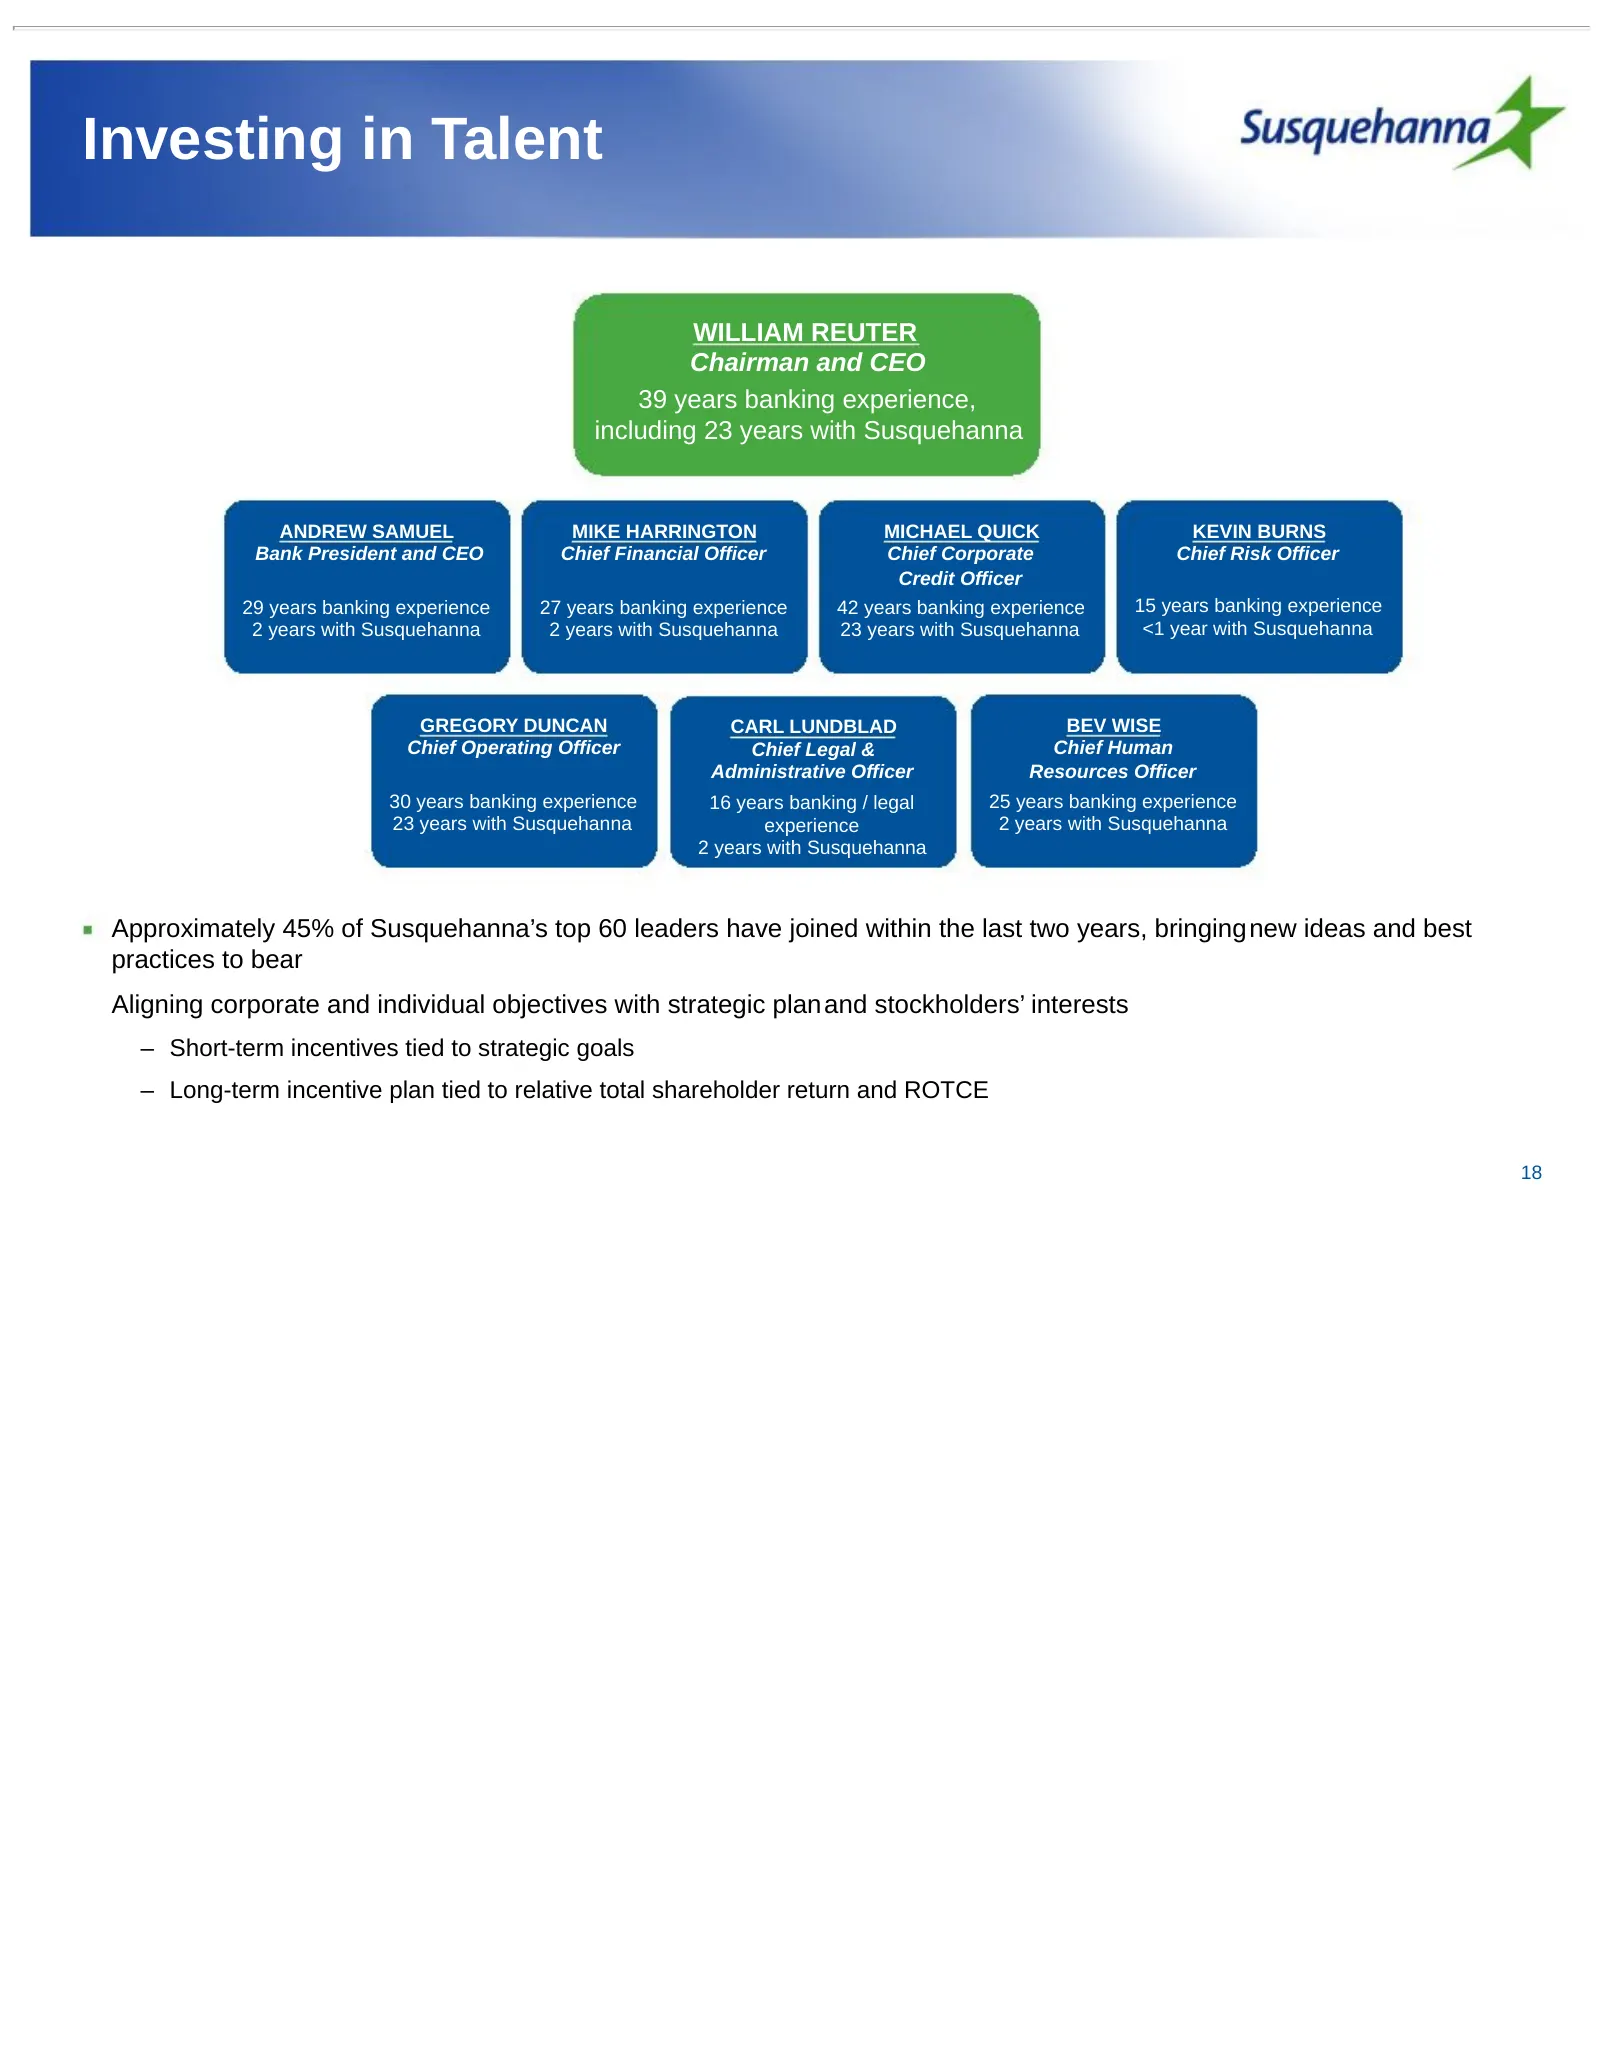
Investing in Talent WILLIAM REUTER Chairman and CEO 39 years banking experience, including 23 years with Susquehanna ANDREW SAMUEL MIKE HARRINGTON MICHAEL QUICK KEVIN BURNS Bank President and CEO Chief Financial Officer Chief Corporate Chief Risk Officer Credit Officer 29 years banking experience 27
Slide 19: Business Strategy
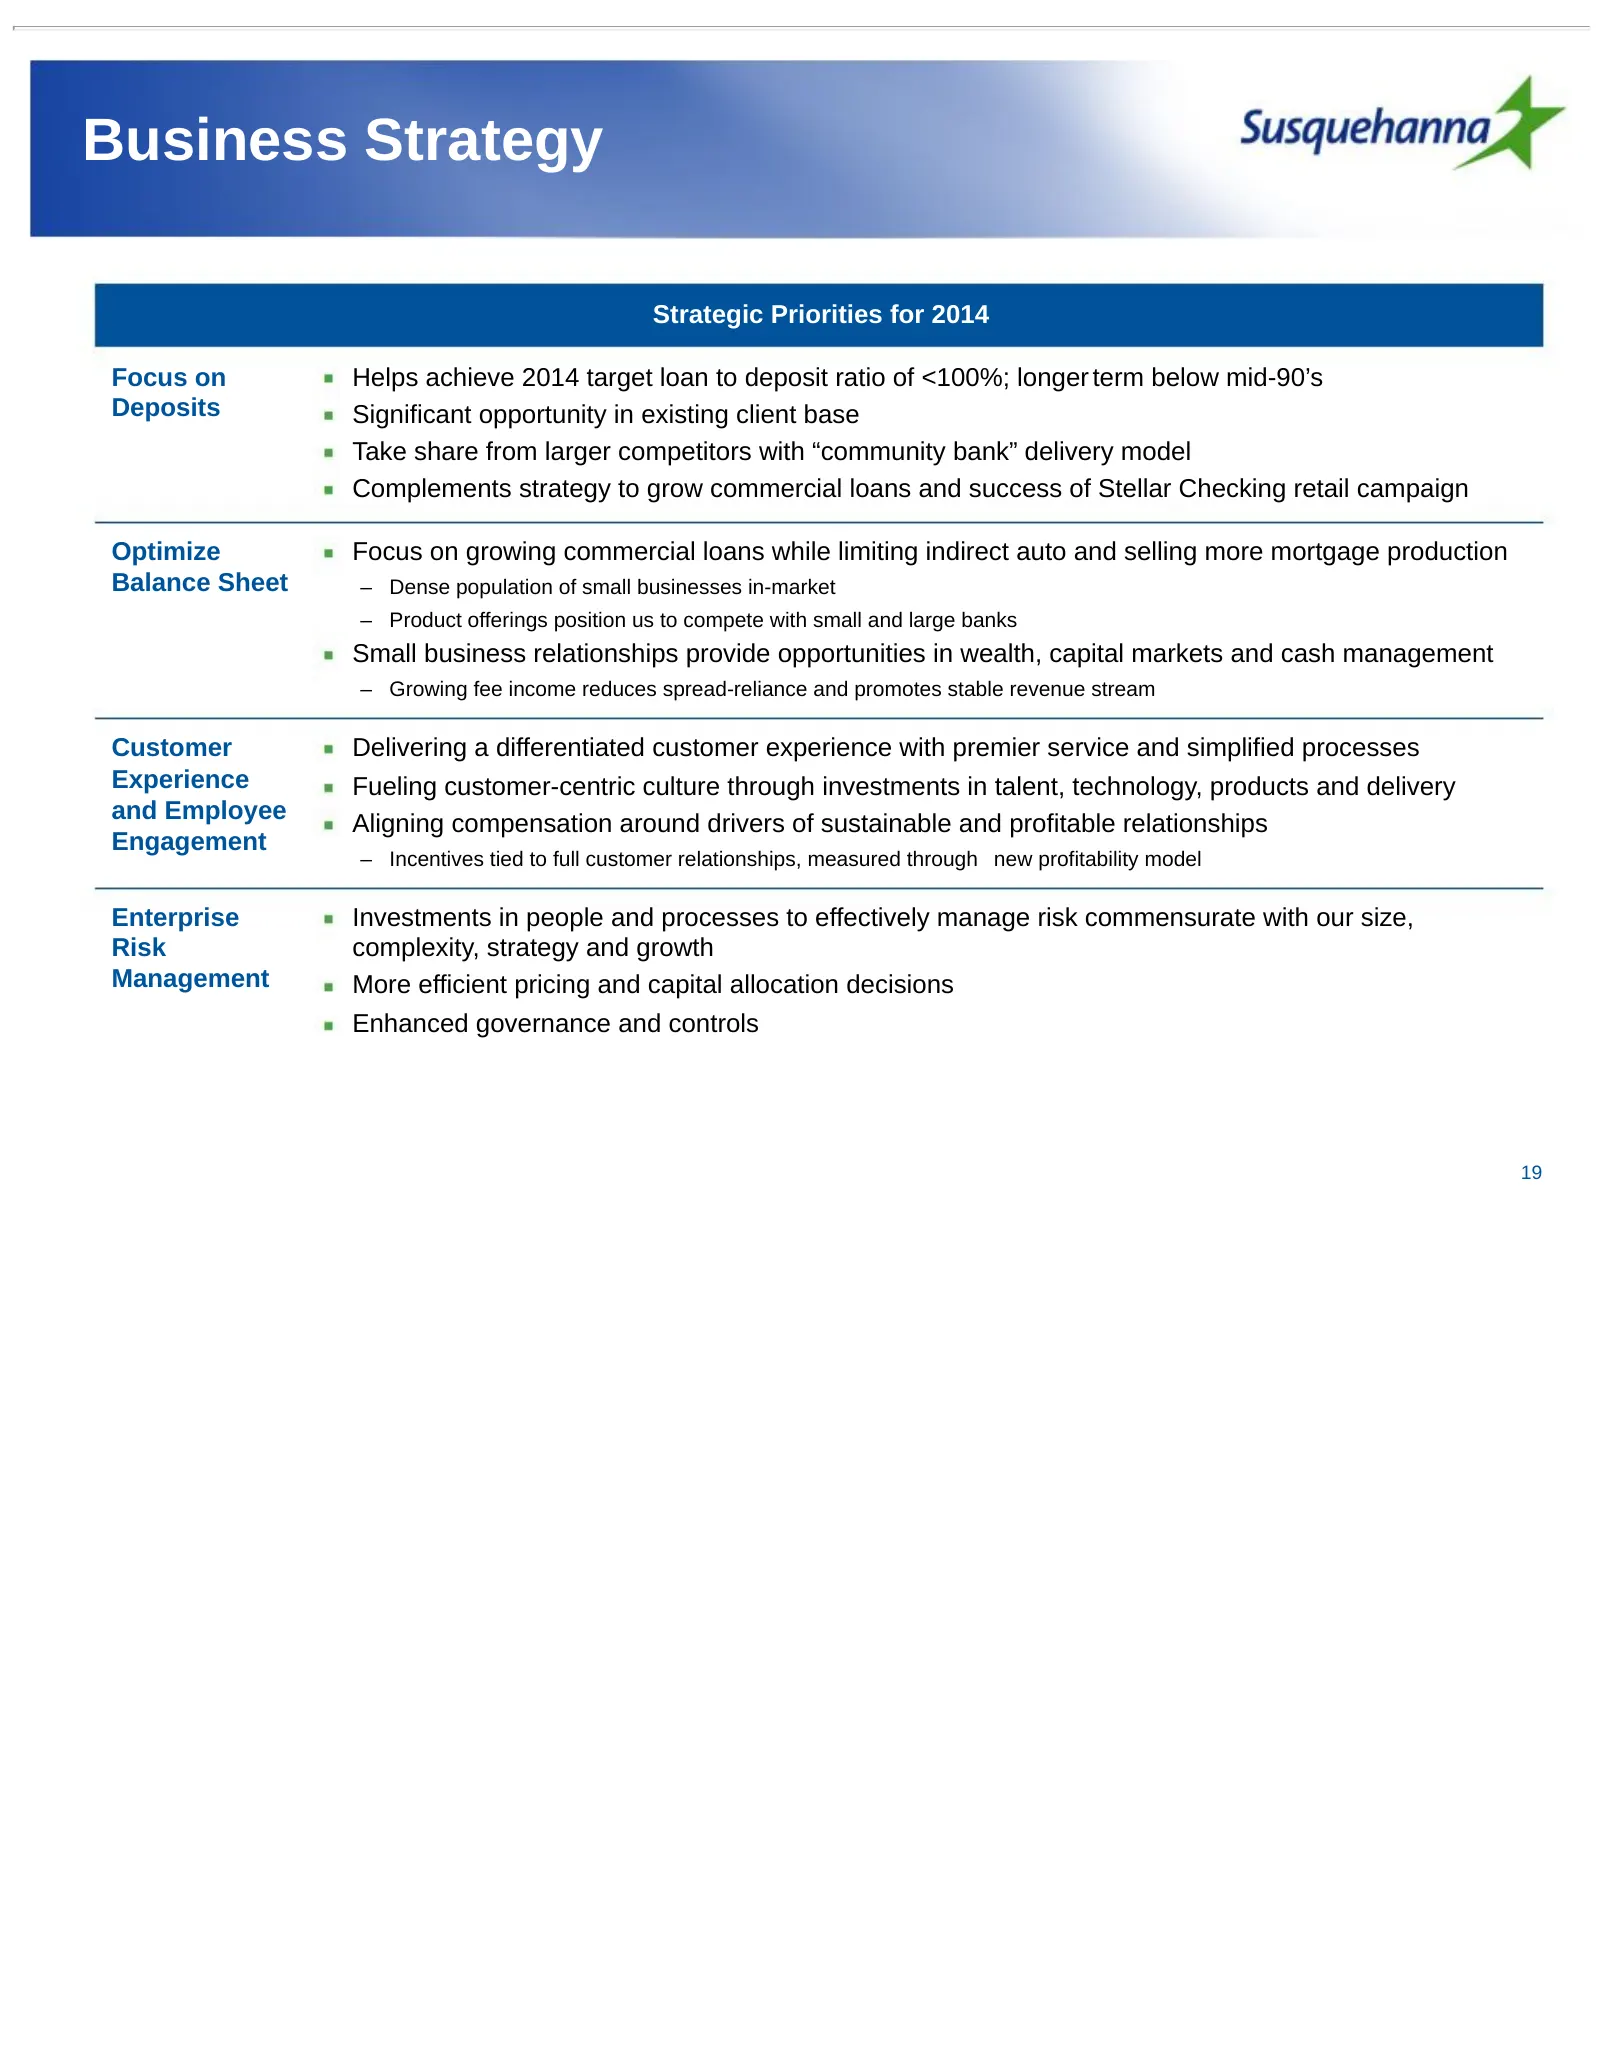
Business Strategy Strategic Priorities for 2014 Focus on Helps achieve 2014 target loan to deposit ratio of <100%; longer term below mid-90’s Deposits Significant opportunity in existing client base Take share from larger competitors with “community bank” delivery model Complements strategy to grow
Slide 20: Focus: Deposits
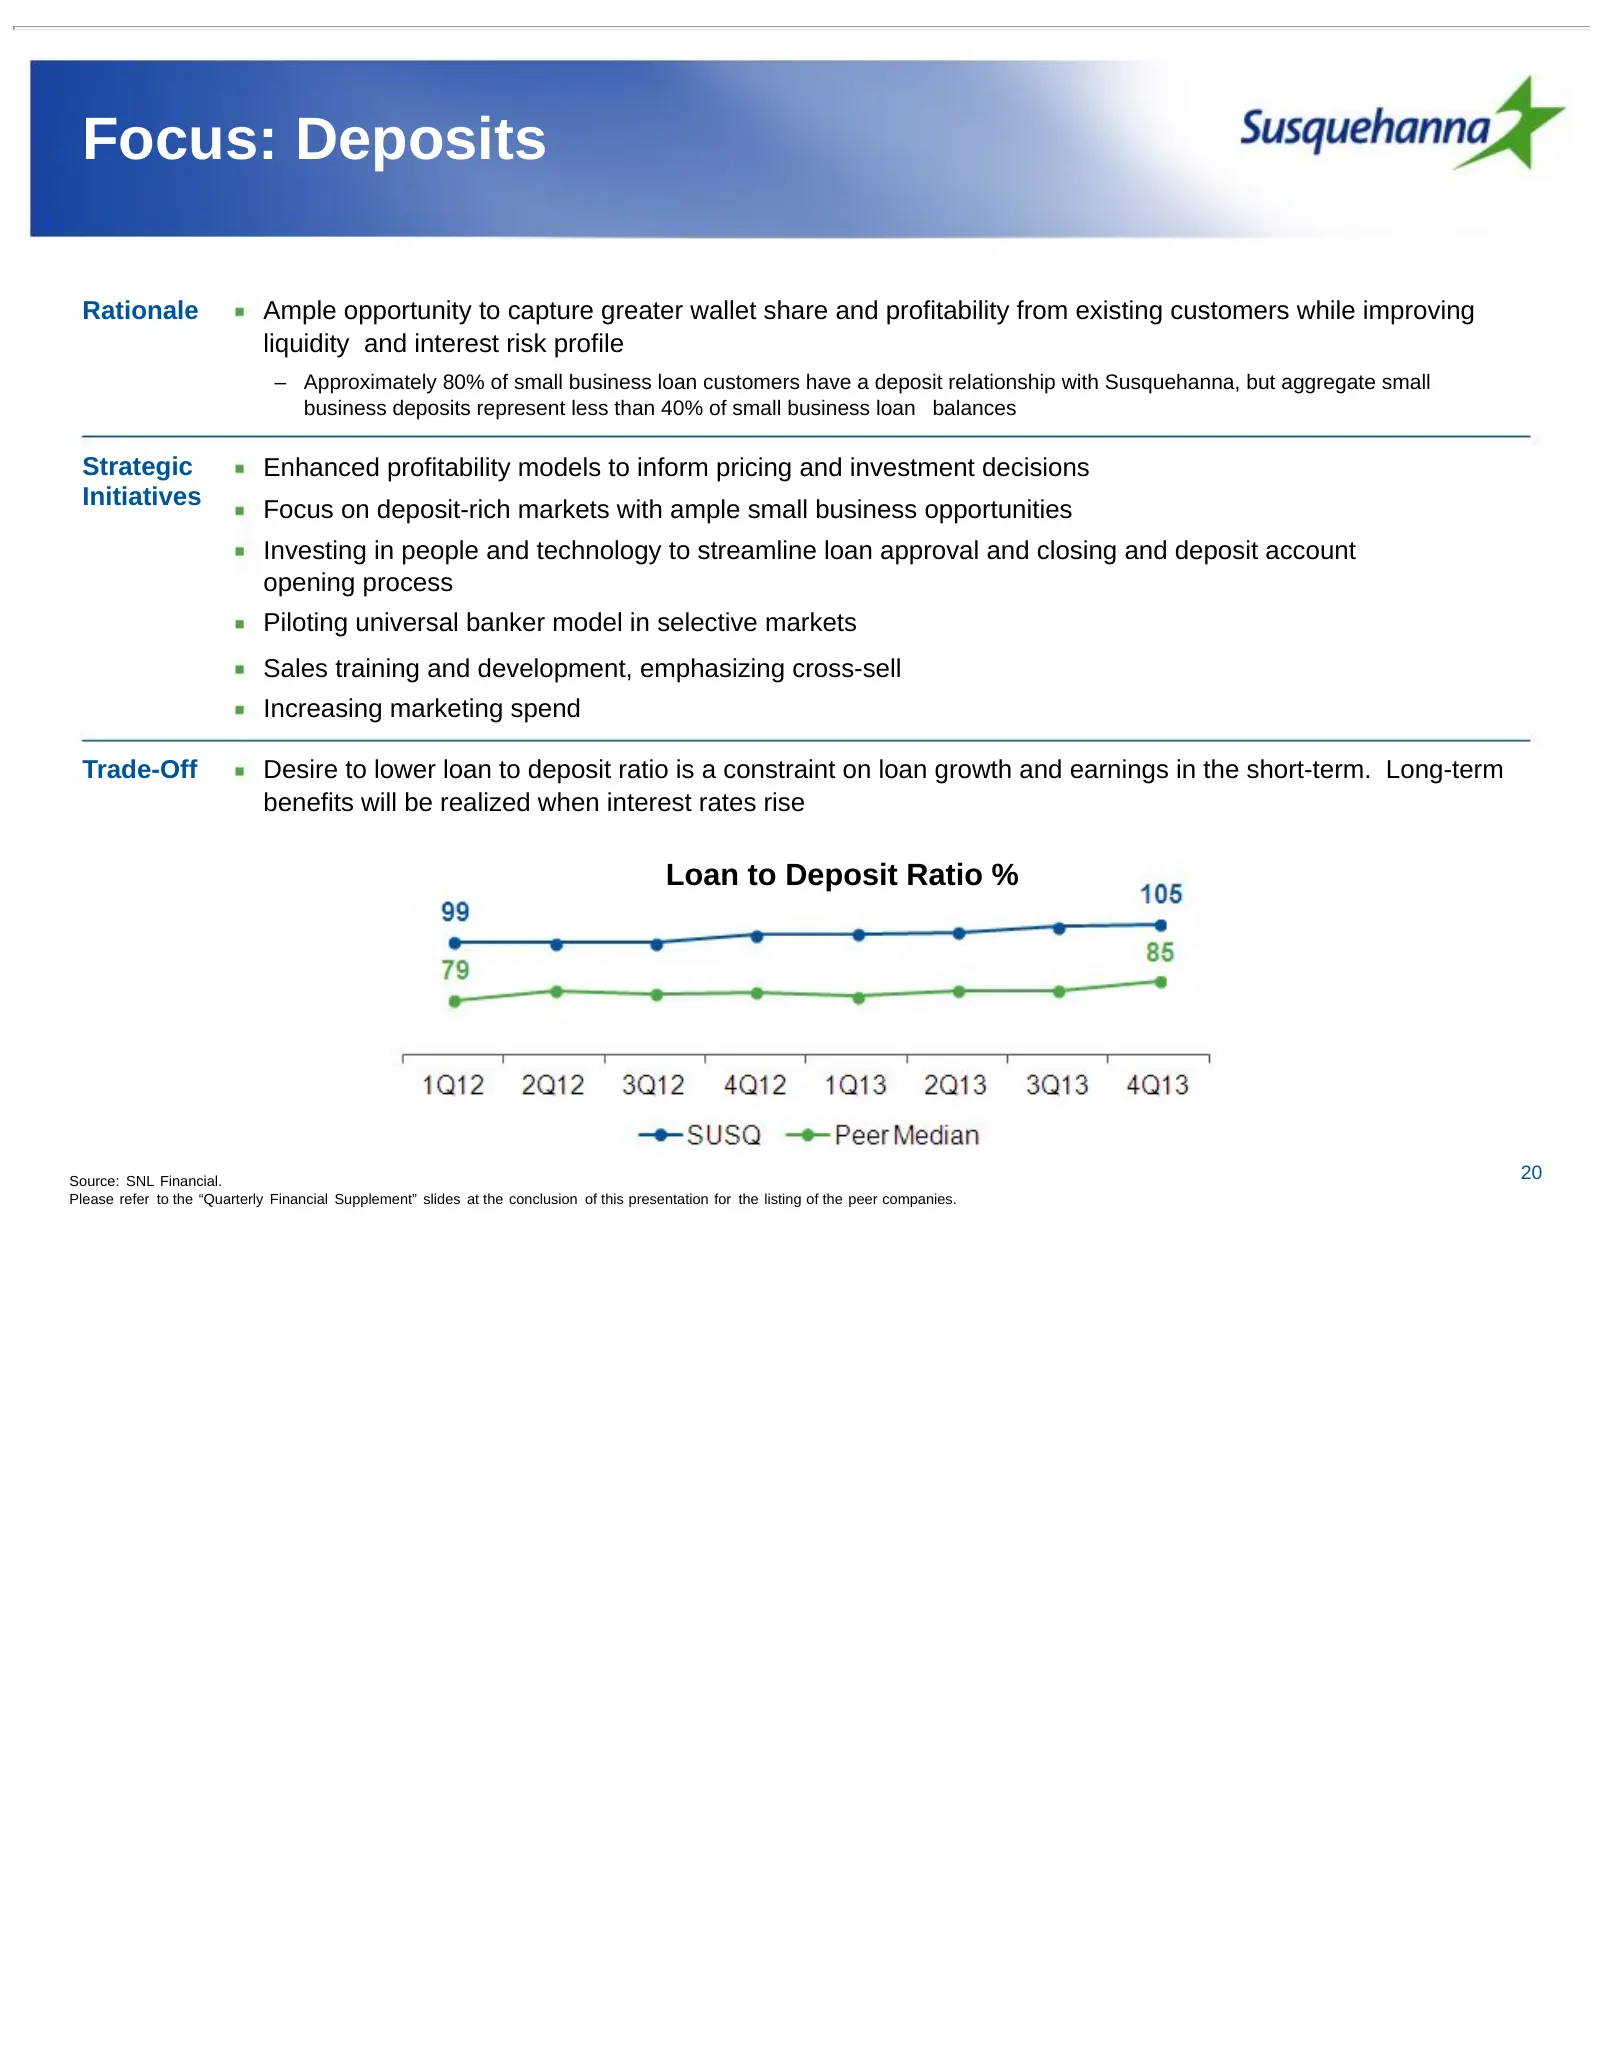
Focus: Deposits Rationale Ample opportunity to capture greater wallet share and profitability from existing customers while improving liquidity and interest risk profile – Approximately 80% of small business loan customers have a deposit relationship with Susquehanna, but aggregate small business de
Slide 21: Strong Deposit Growth
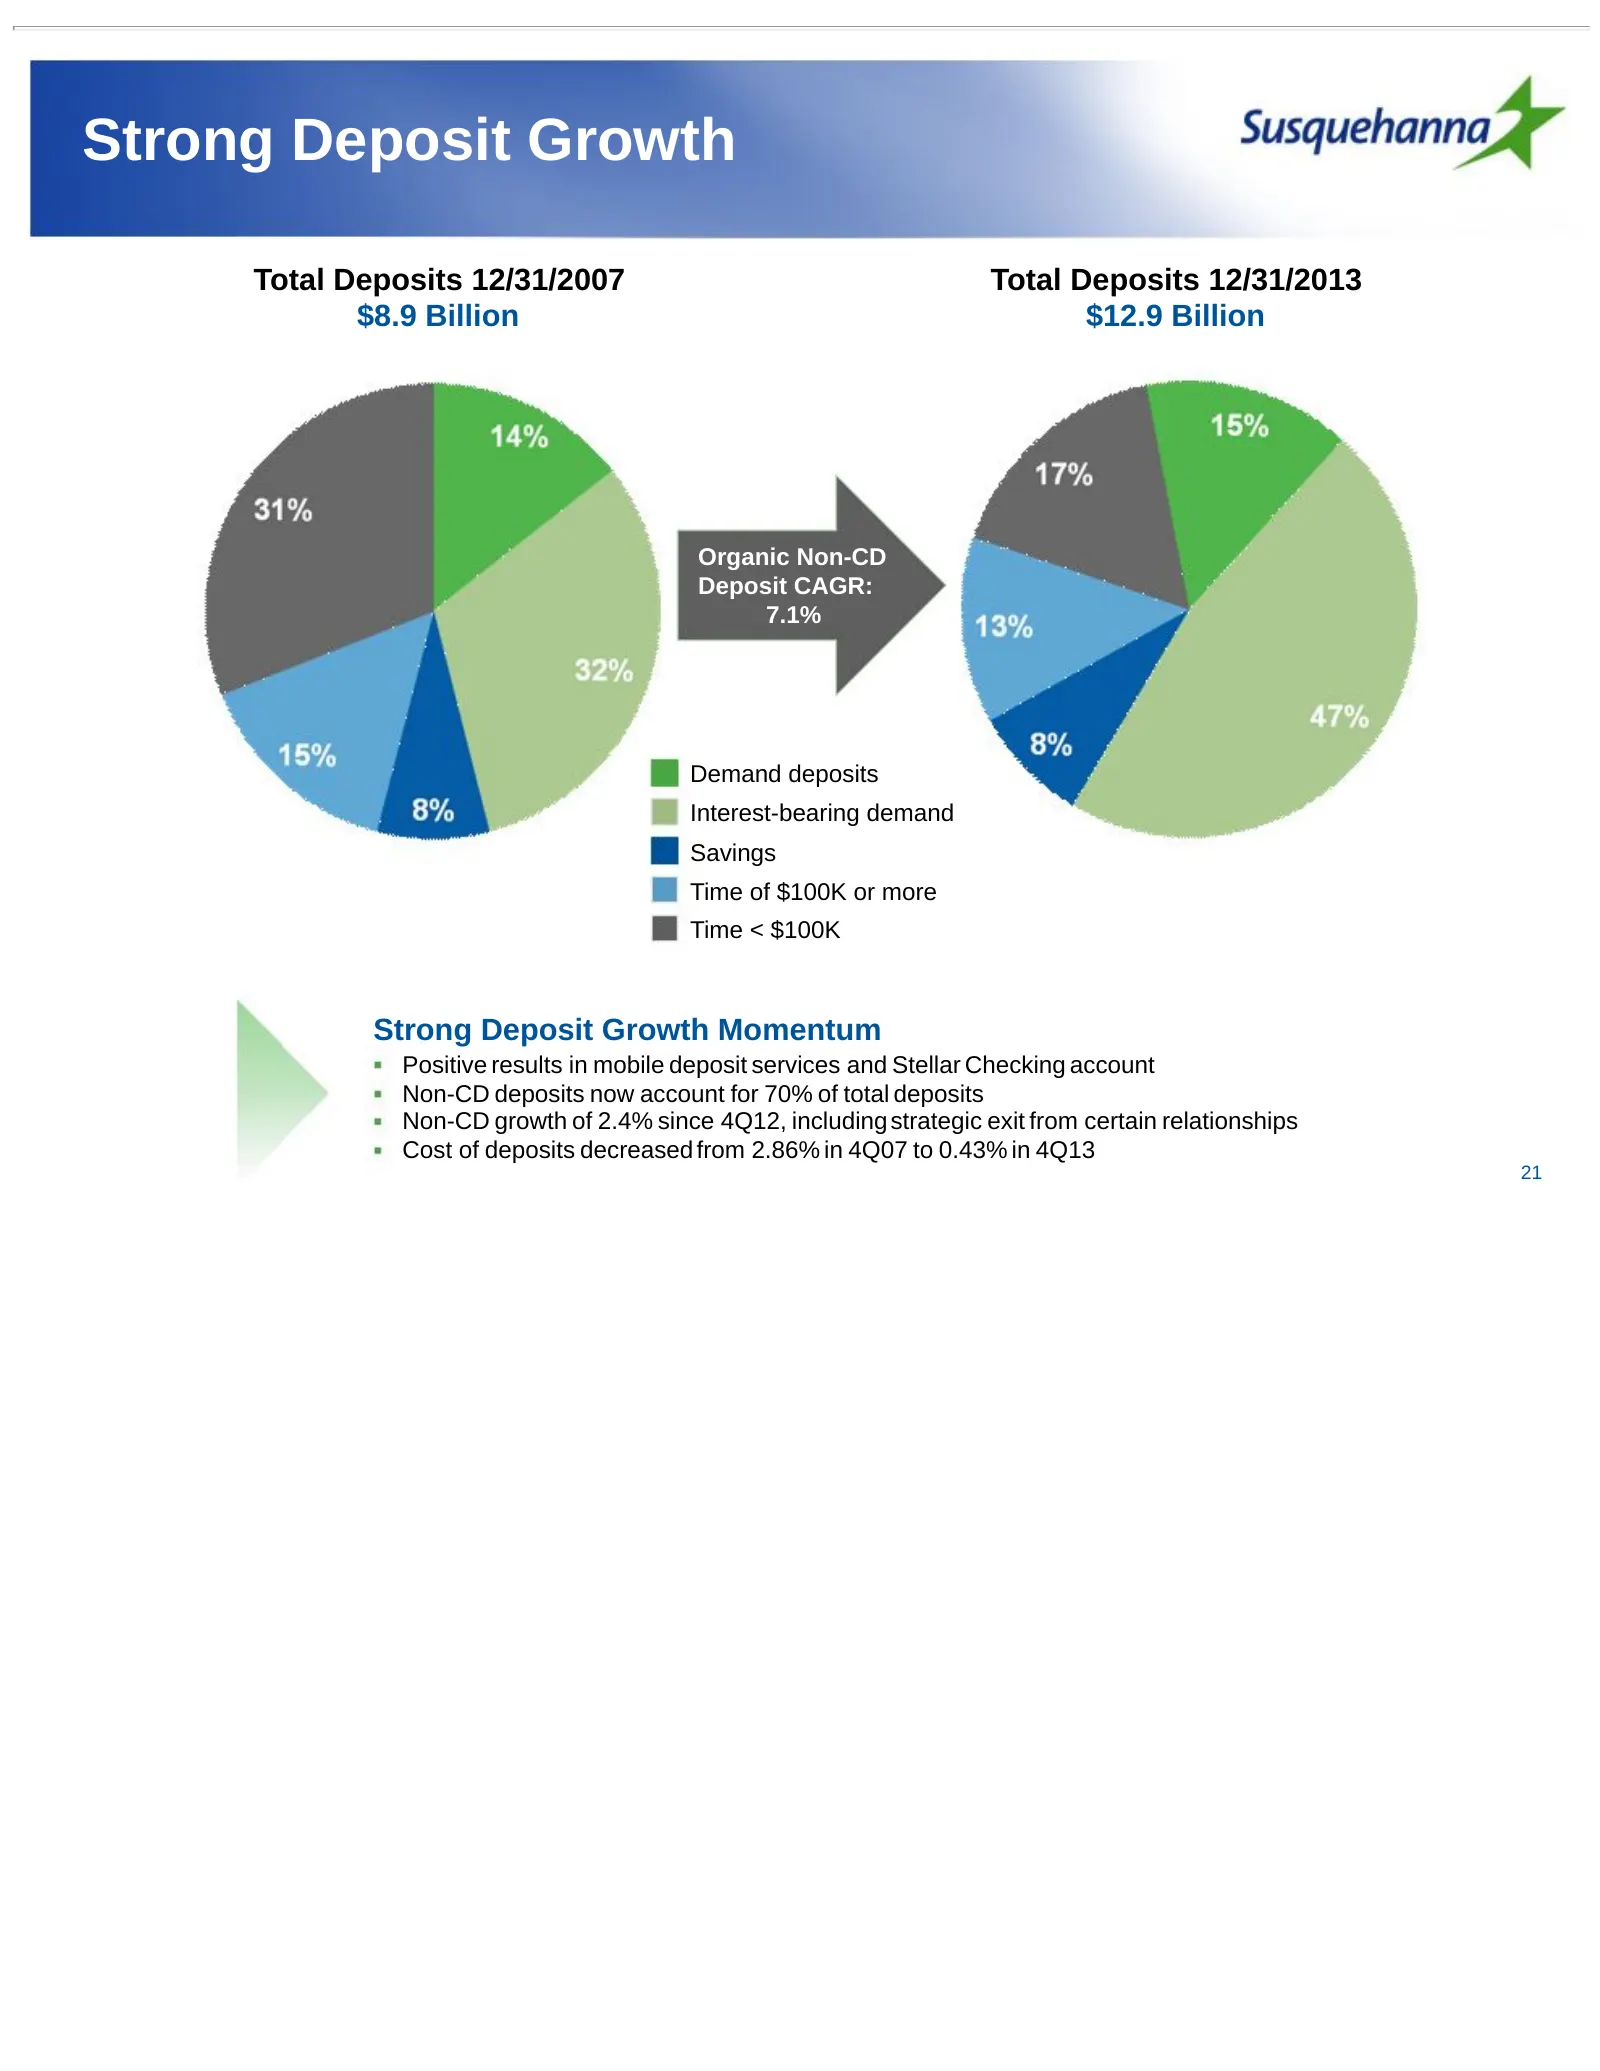
Strong Deposit Growth Total Deposits 12/31/2007 Total Deposits 12/31/2013 $8.9 Billion $12.9 Billion Organic Non-CD Deposit CAGR: 7.1% Demand deposits Interest-bearing demand Savings Time of $100K or more Time < $100K Strong Deposit Growth Momentum Positive results in mobile deposit services and Ste
Slide 22: Deposit Initiatives
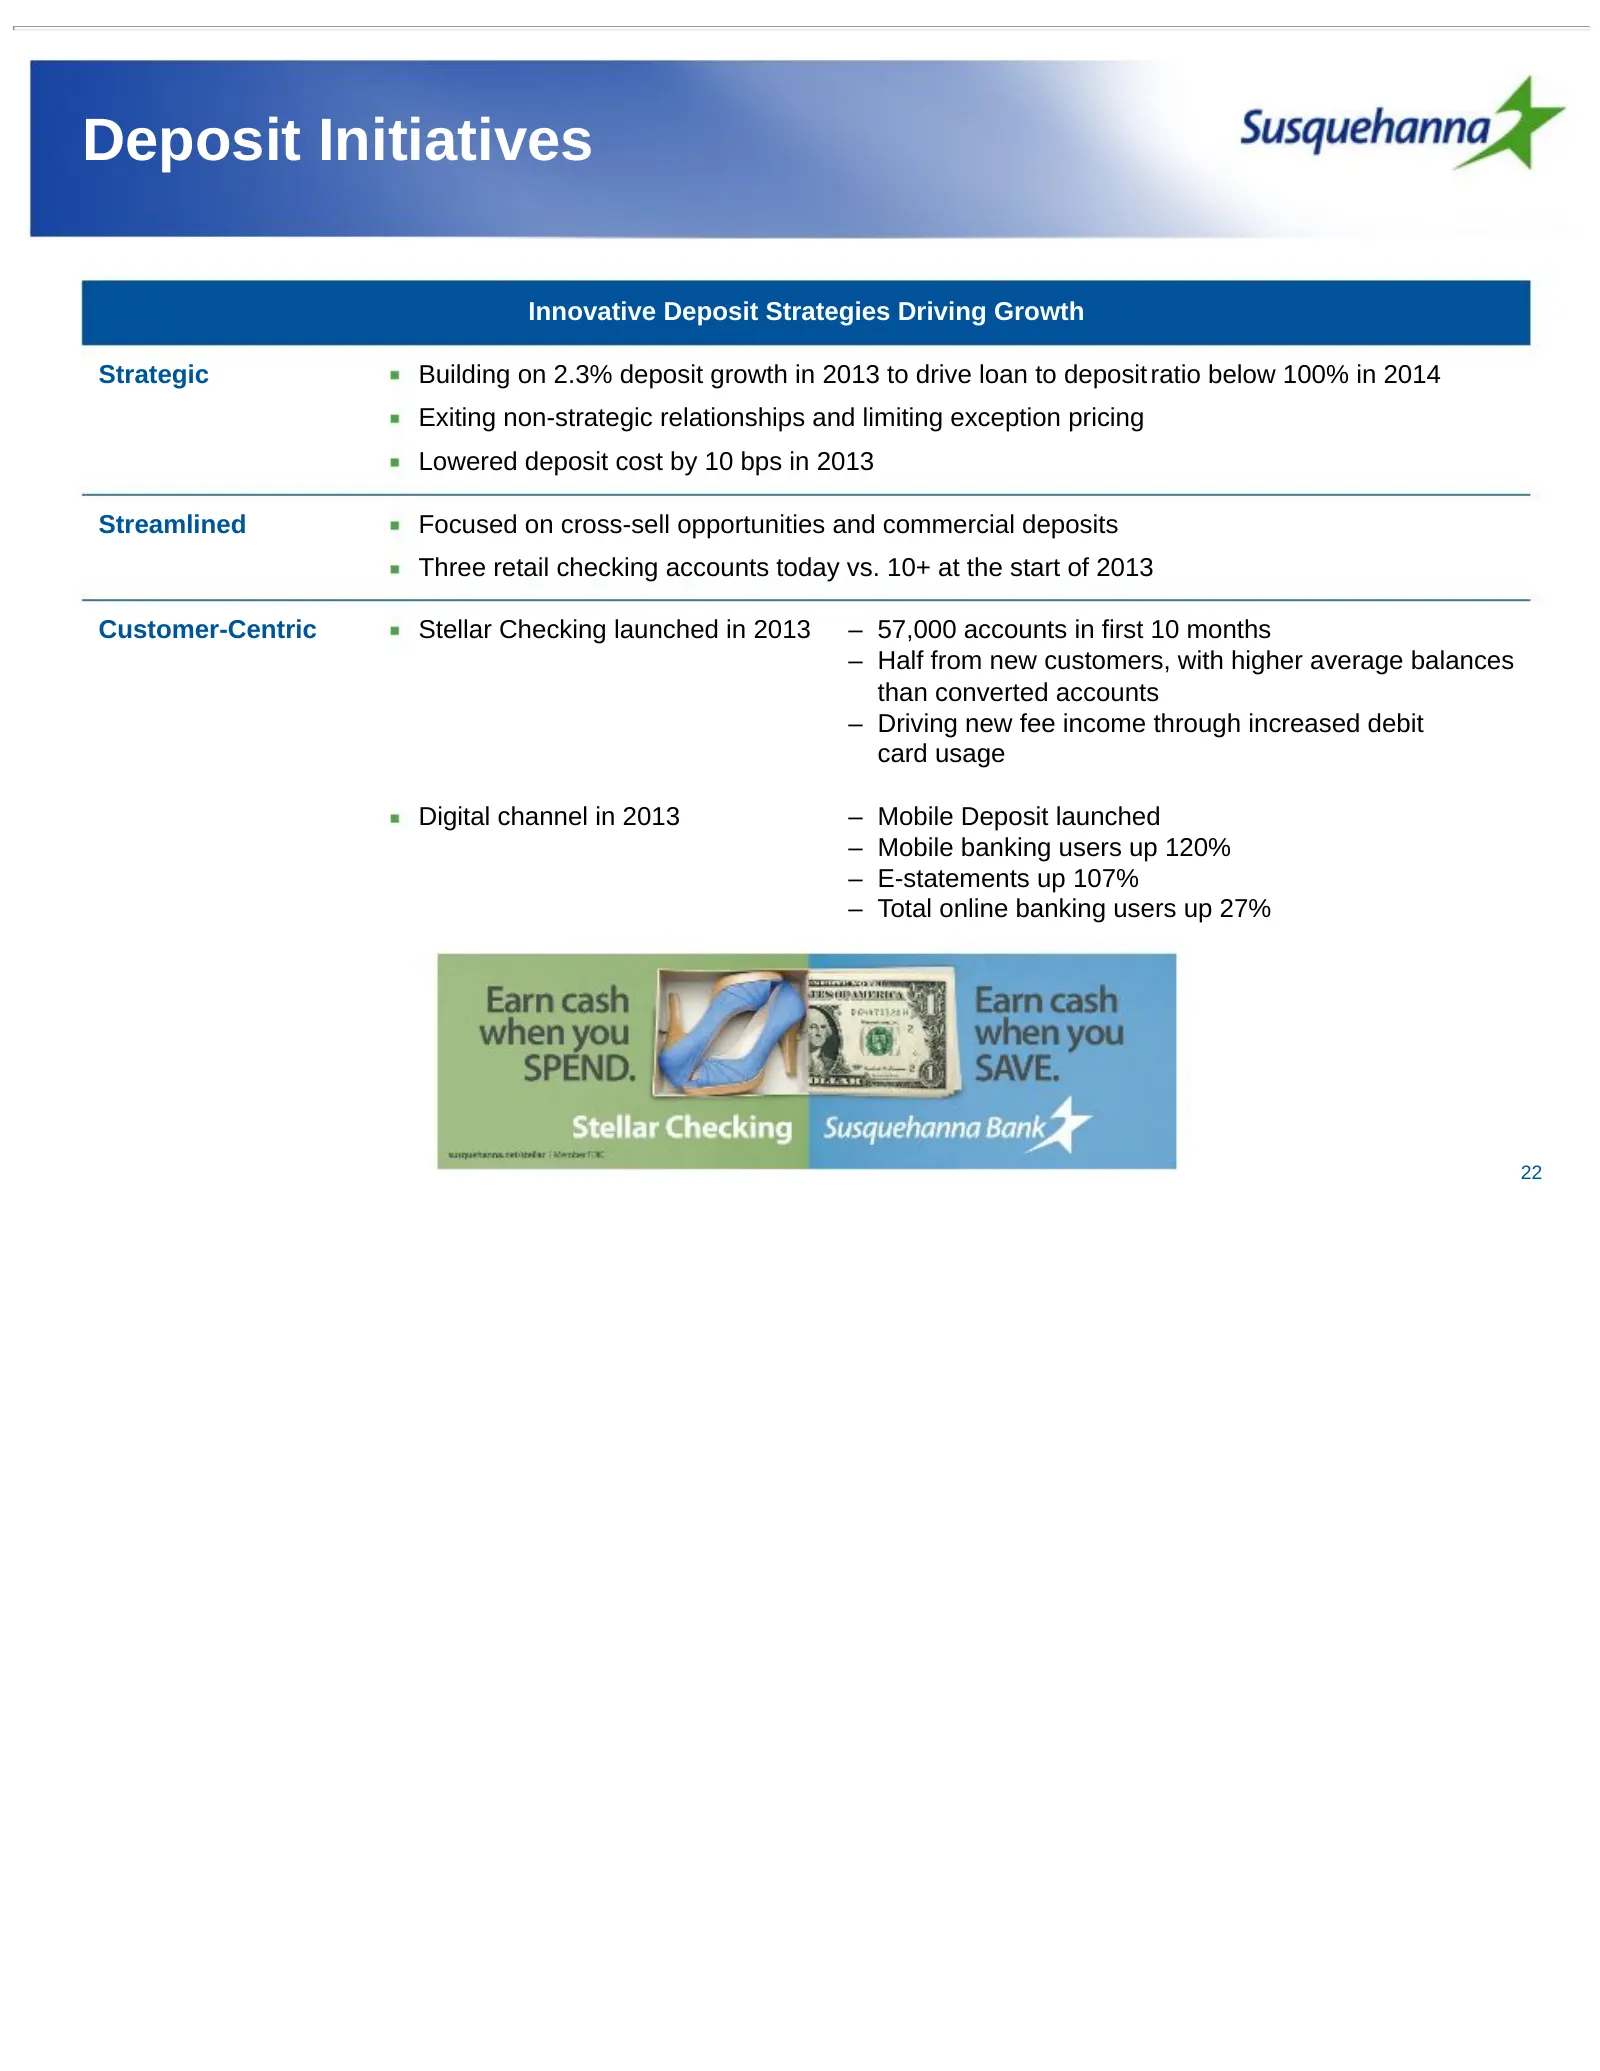
Deposit Initiatives Innovative Deposit Strategies Driving Growth Strategic Building on 2.3% deposit growth in 2013 to drive loan to deposit ratio below 100% in 2014 Exiting non-strategic relationships and limiting exception pricing Lowered deposit cost by 10 bps in 2013 Streamlined Focused on cross-
Slide 23: Disciplined Asset Allocation: Focus on Commercial Loans
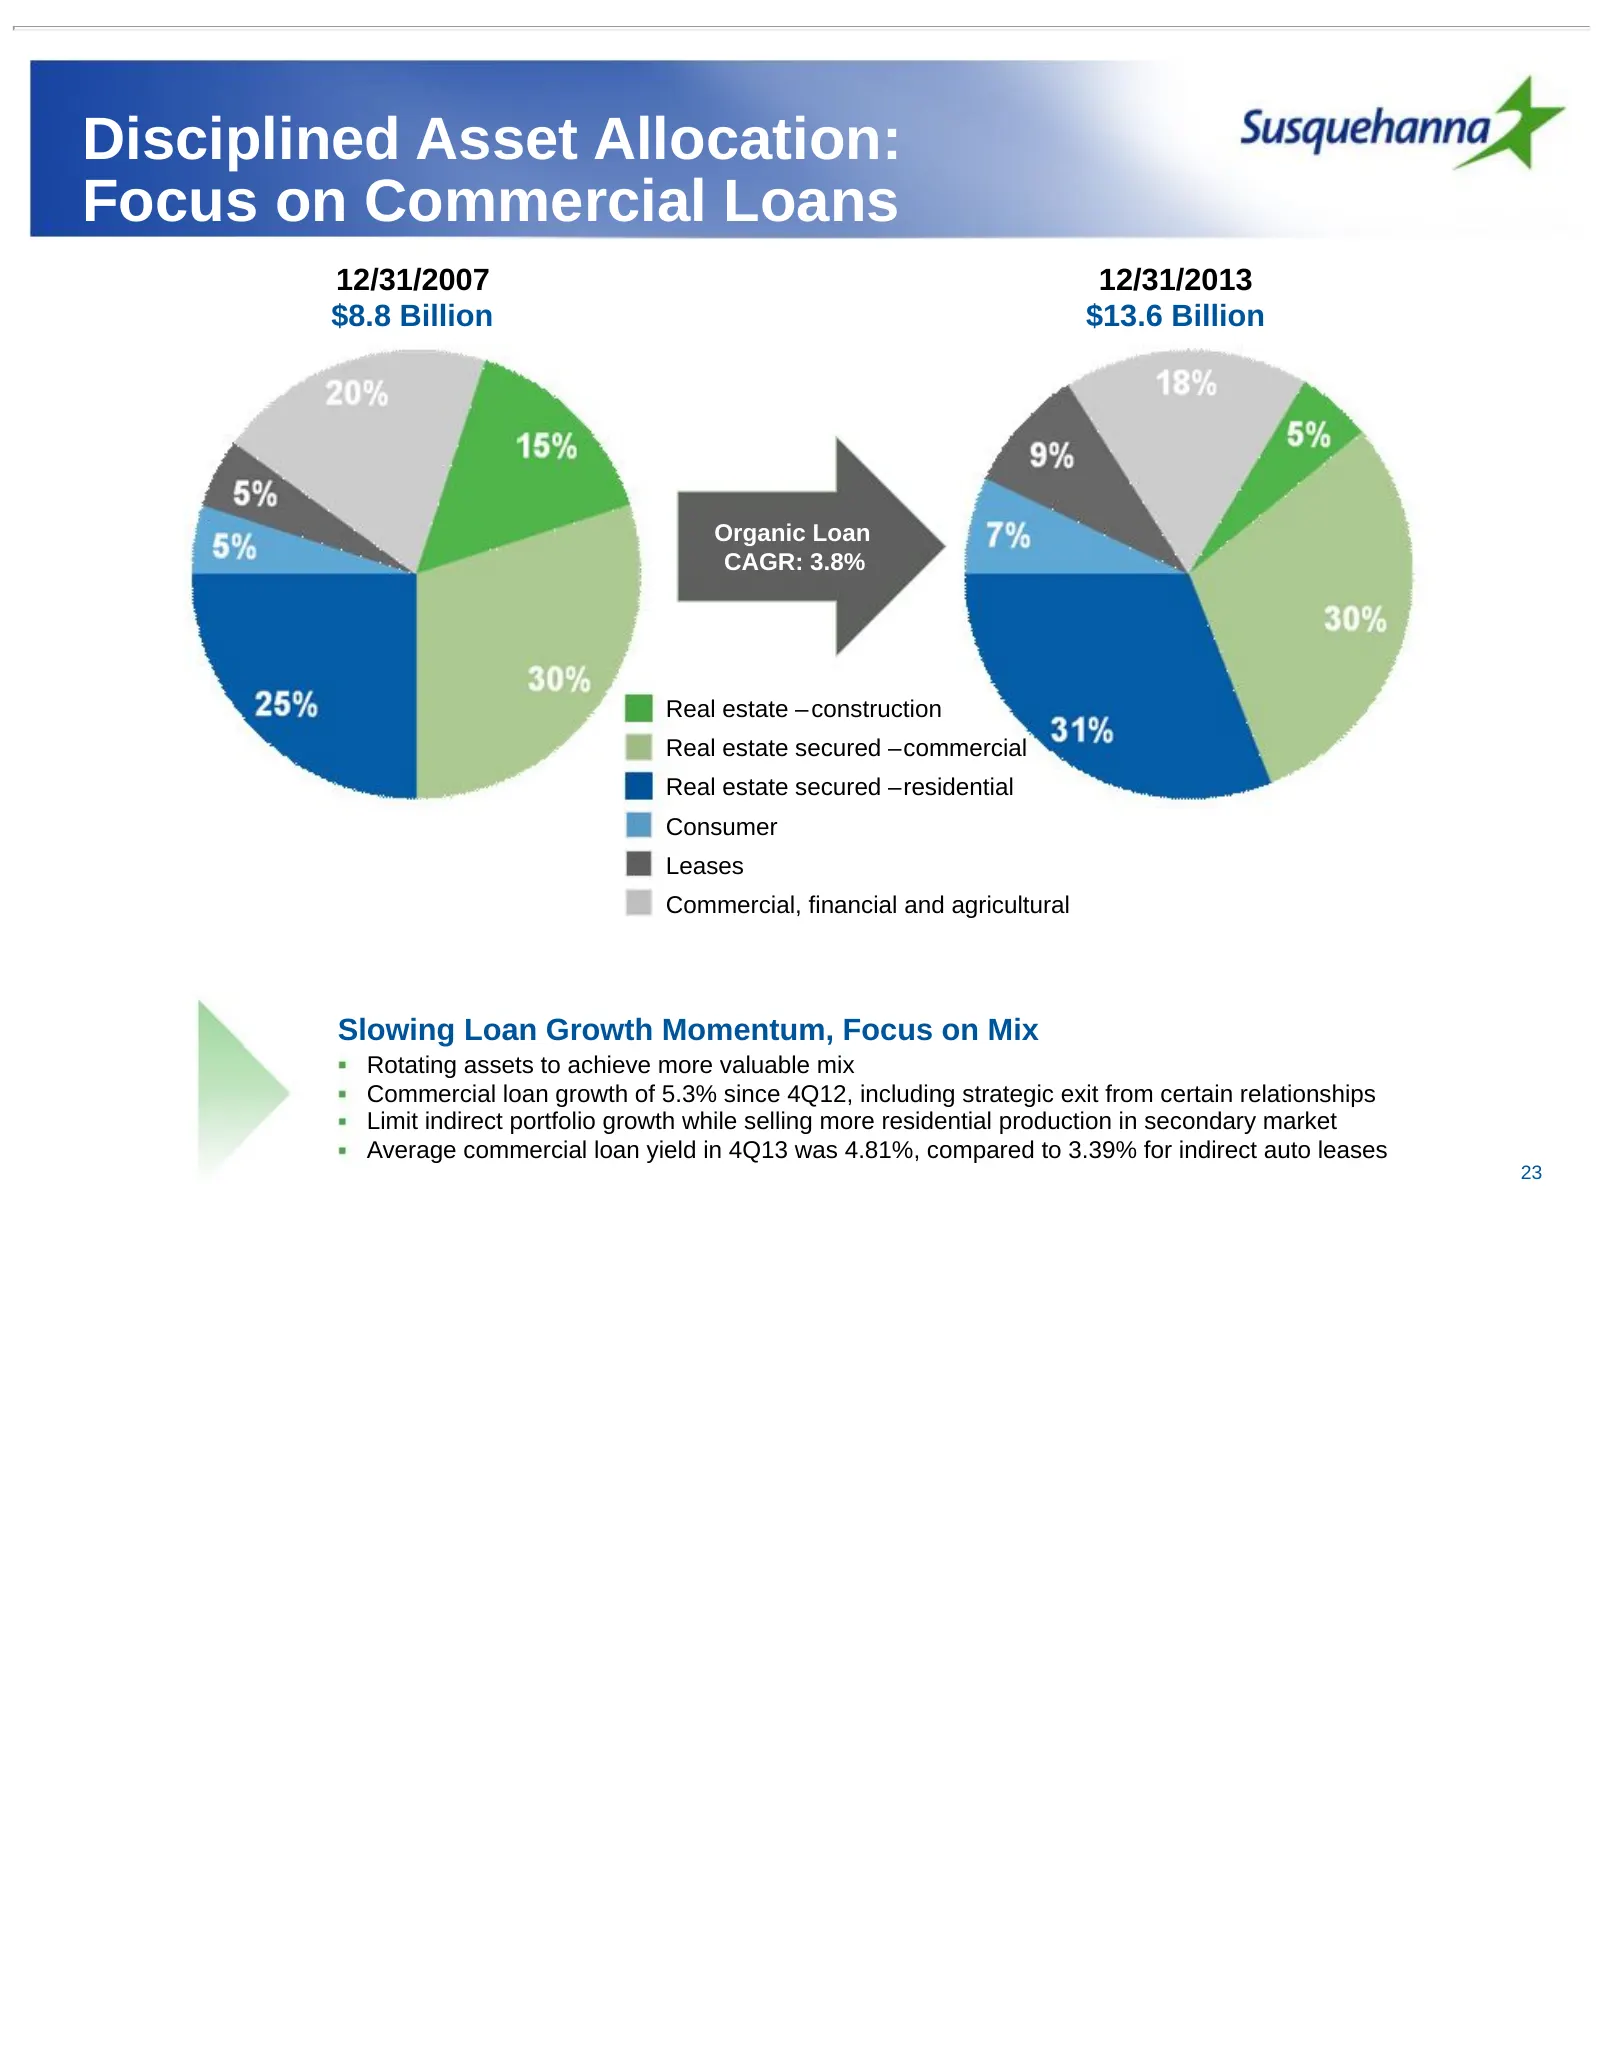
Disciplined Asset Allocation: Focus on Commercial Loans 12/31/2007 12/31/2013 $8.8 Billion $13.6 Billion Organic Loan CAGR: 3.8% Real estate – construction Real estate secured –commercial Real estate secured –residential Consumer Leases Commercial, financial and agricultural Slowing Loan Growth Mome
Slide 24: Net Interest Margin
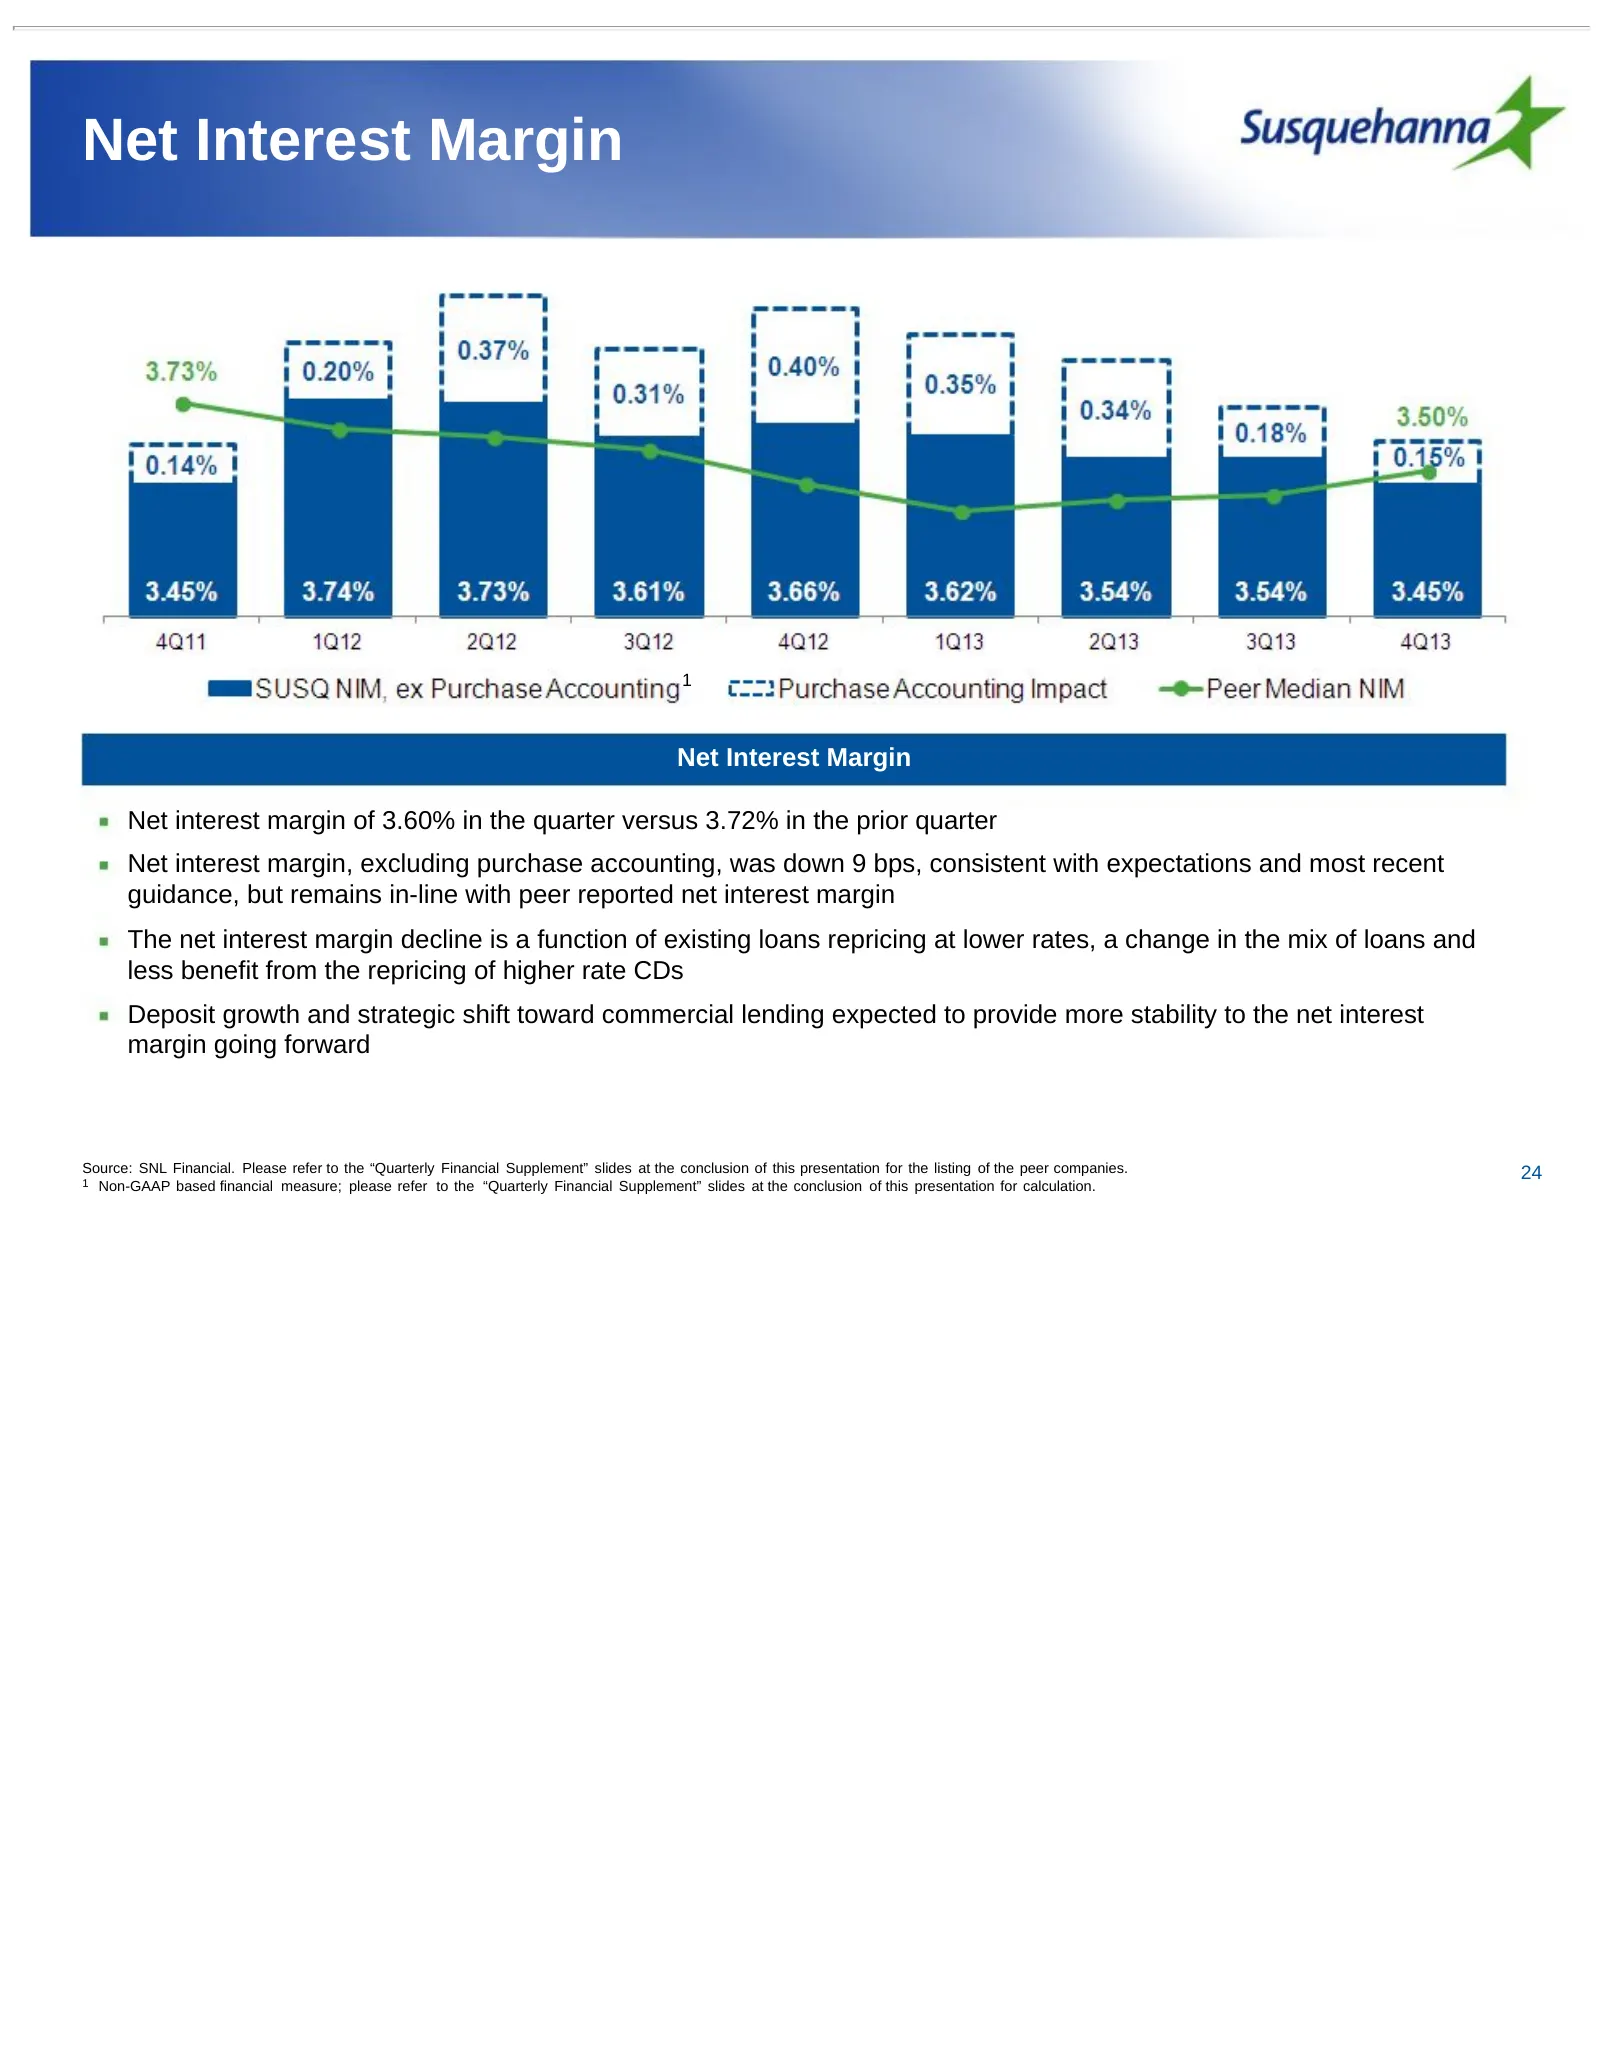
Net Interest Margin 1 Net Interest Margin Net interest margin of 3.60% in the quarter versus 3.72% in the prior quarter Net interest margin, excluding purchase accounting, was down 9 bps, consistent with expectations and most recent guidance, but remains in-line with peer reported net interest margi
Slide 25: Non-Interest Income
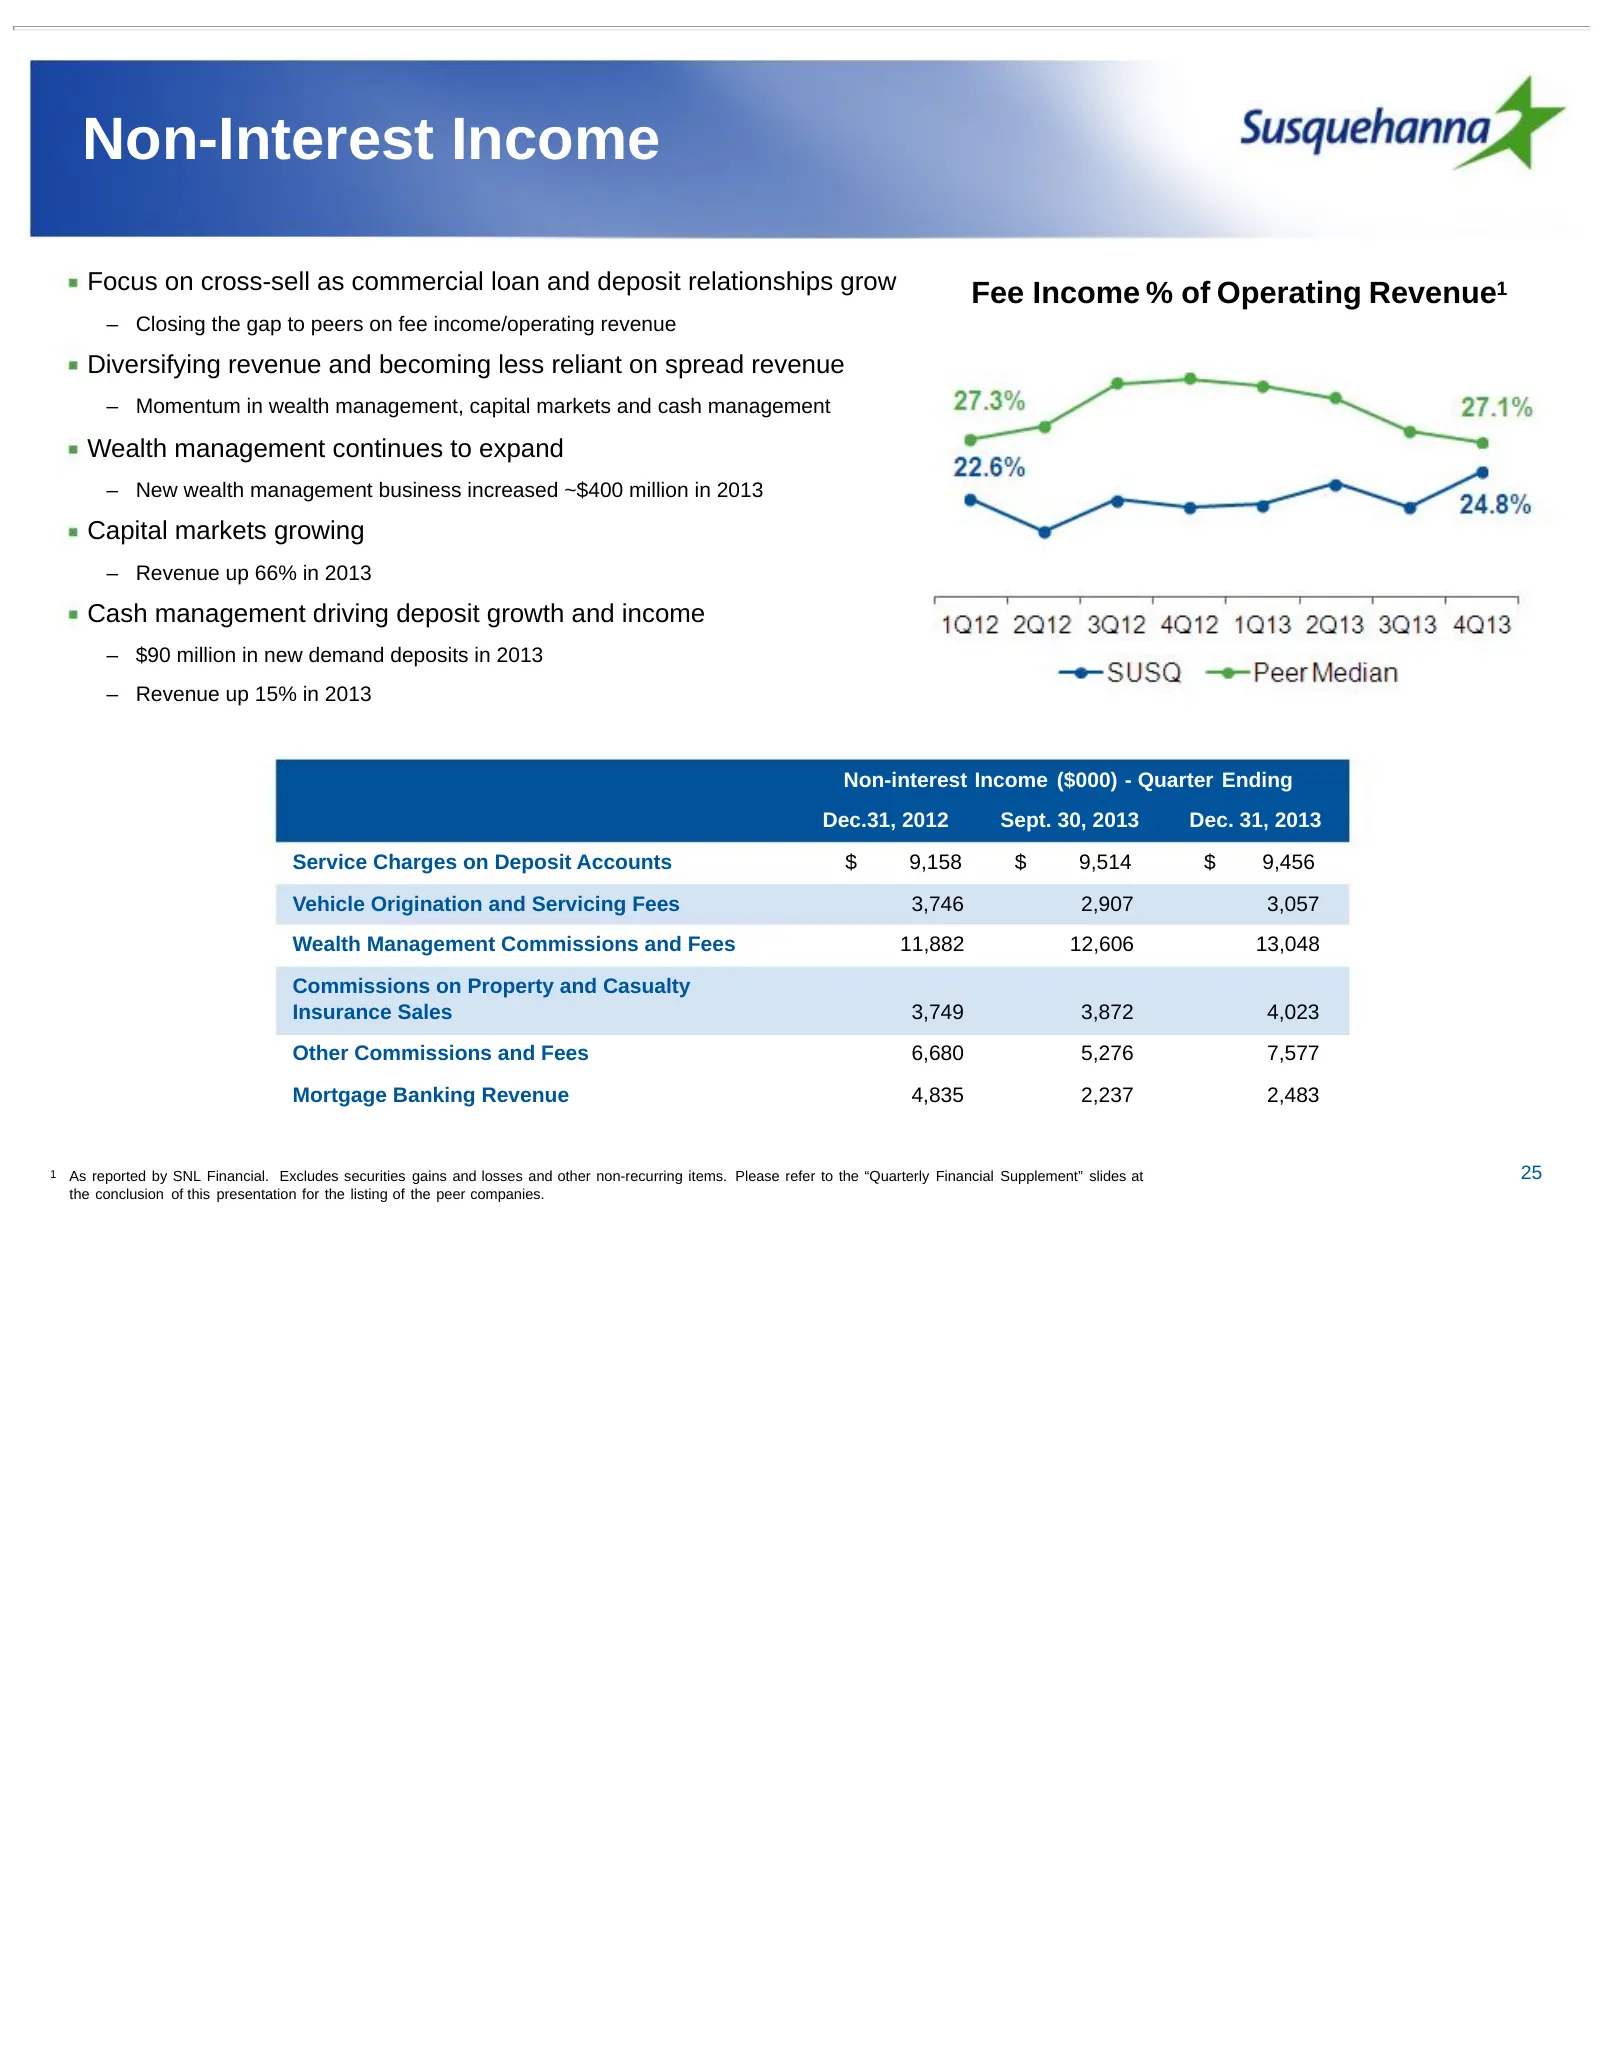
Non-Interest Income Focus on cross-sell as commercial loan and deposit relationships grow Fee Income % of Operating Revenue1 – Closing the gap to peers on fee income/operating revenue Diversifying revenue and becoming less reliant on spread revenue – Momentum in wealth management, capital markets an
Slide 26: Expense Management
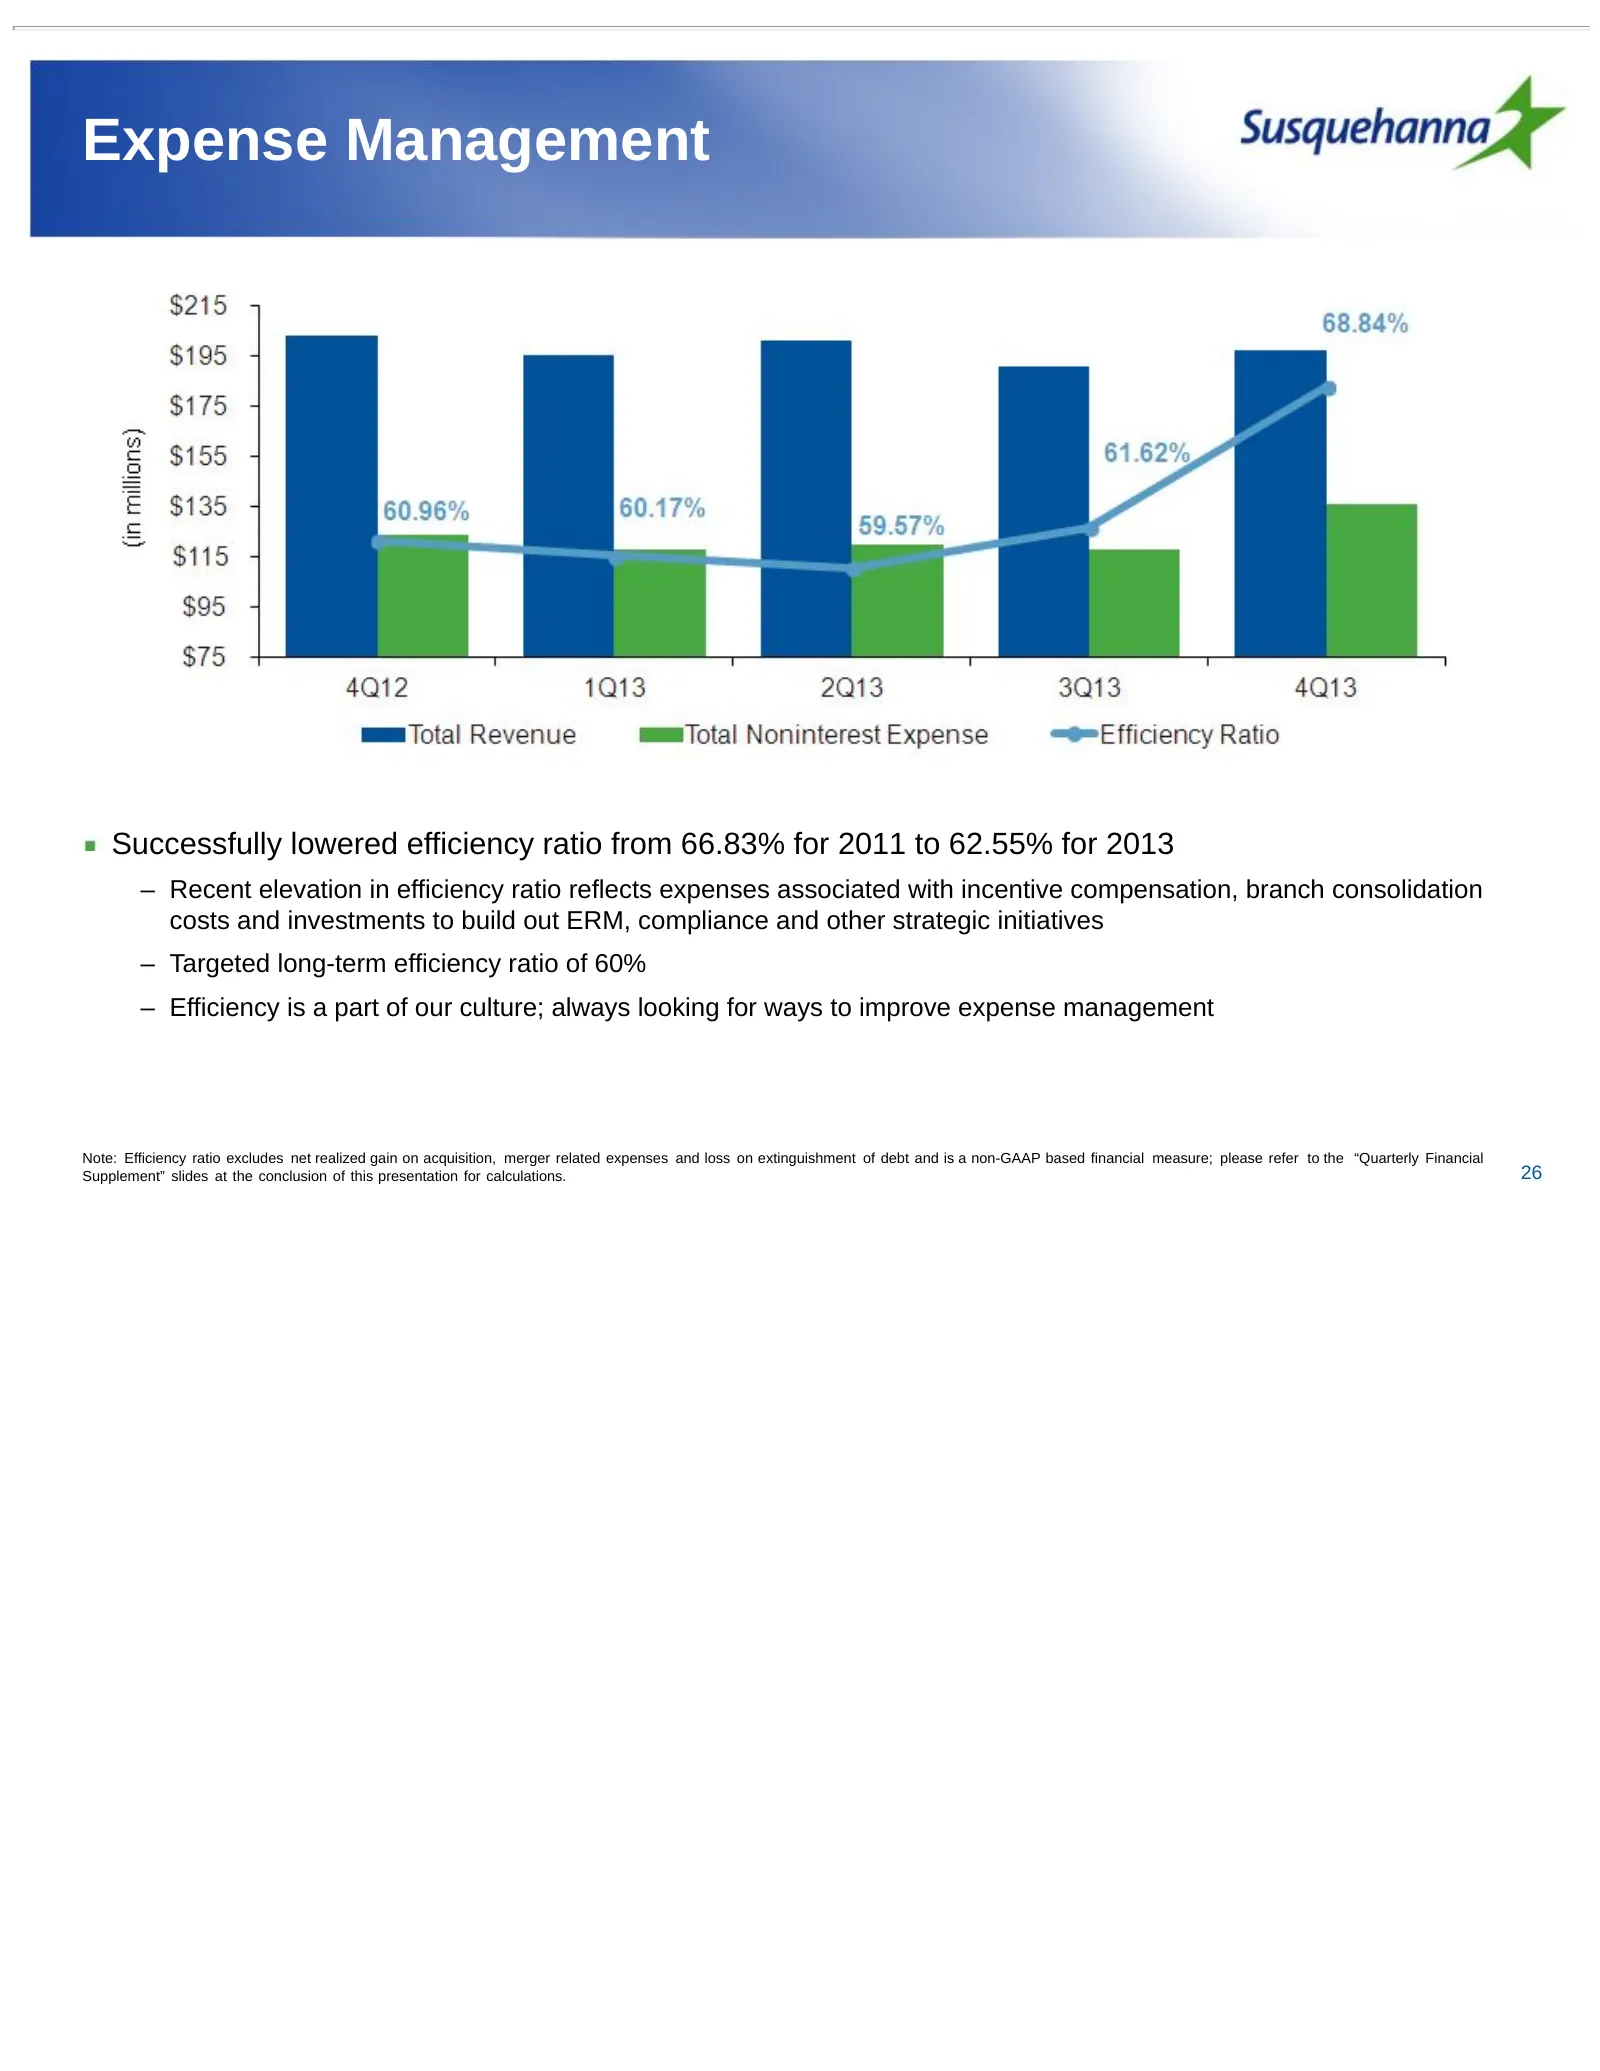
Expense Management Successfully lowered efficiency ratio from 66.83% for 2011 to 62.55% for 2013 – Recent elevation in efficiency ratio reflects expenses associated with incentive compensation, branch consolidation costs and investments to build out ERM, compliance and other strategic initiatives –
Slide 27: 1Q14 Outlook & Current Trends
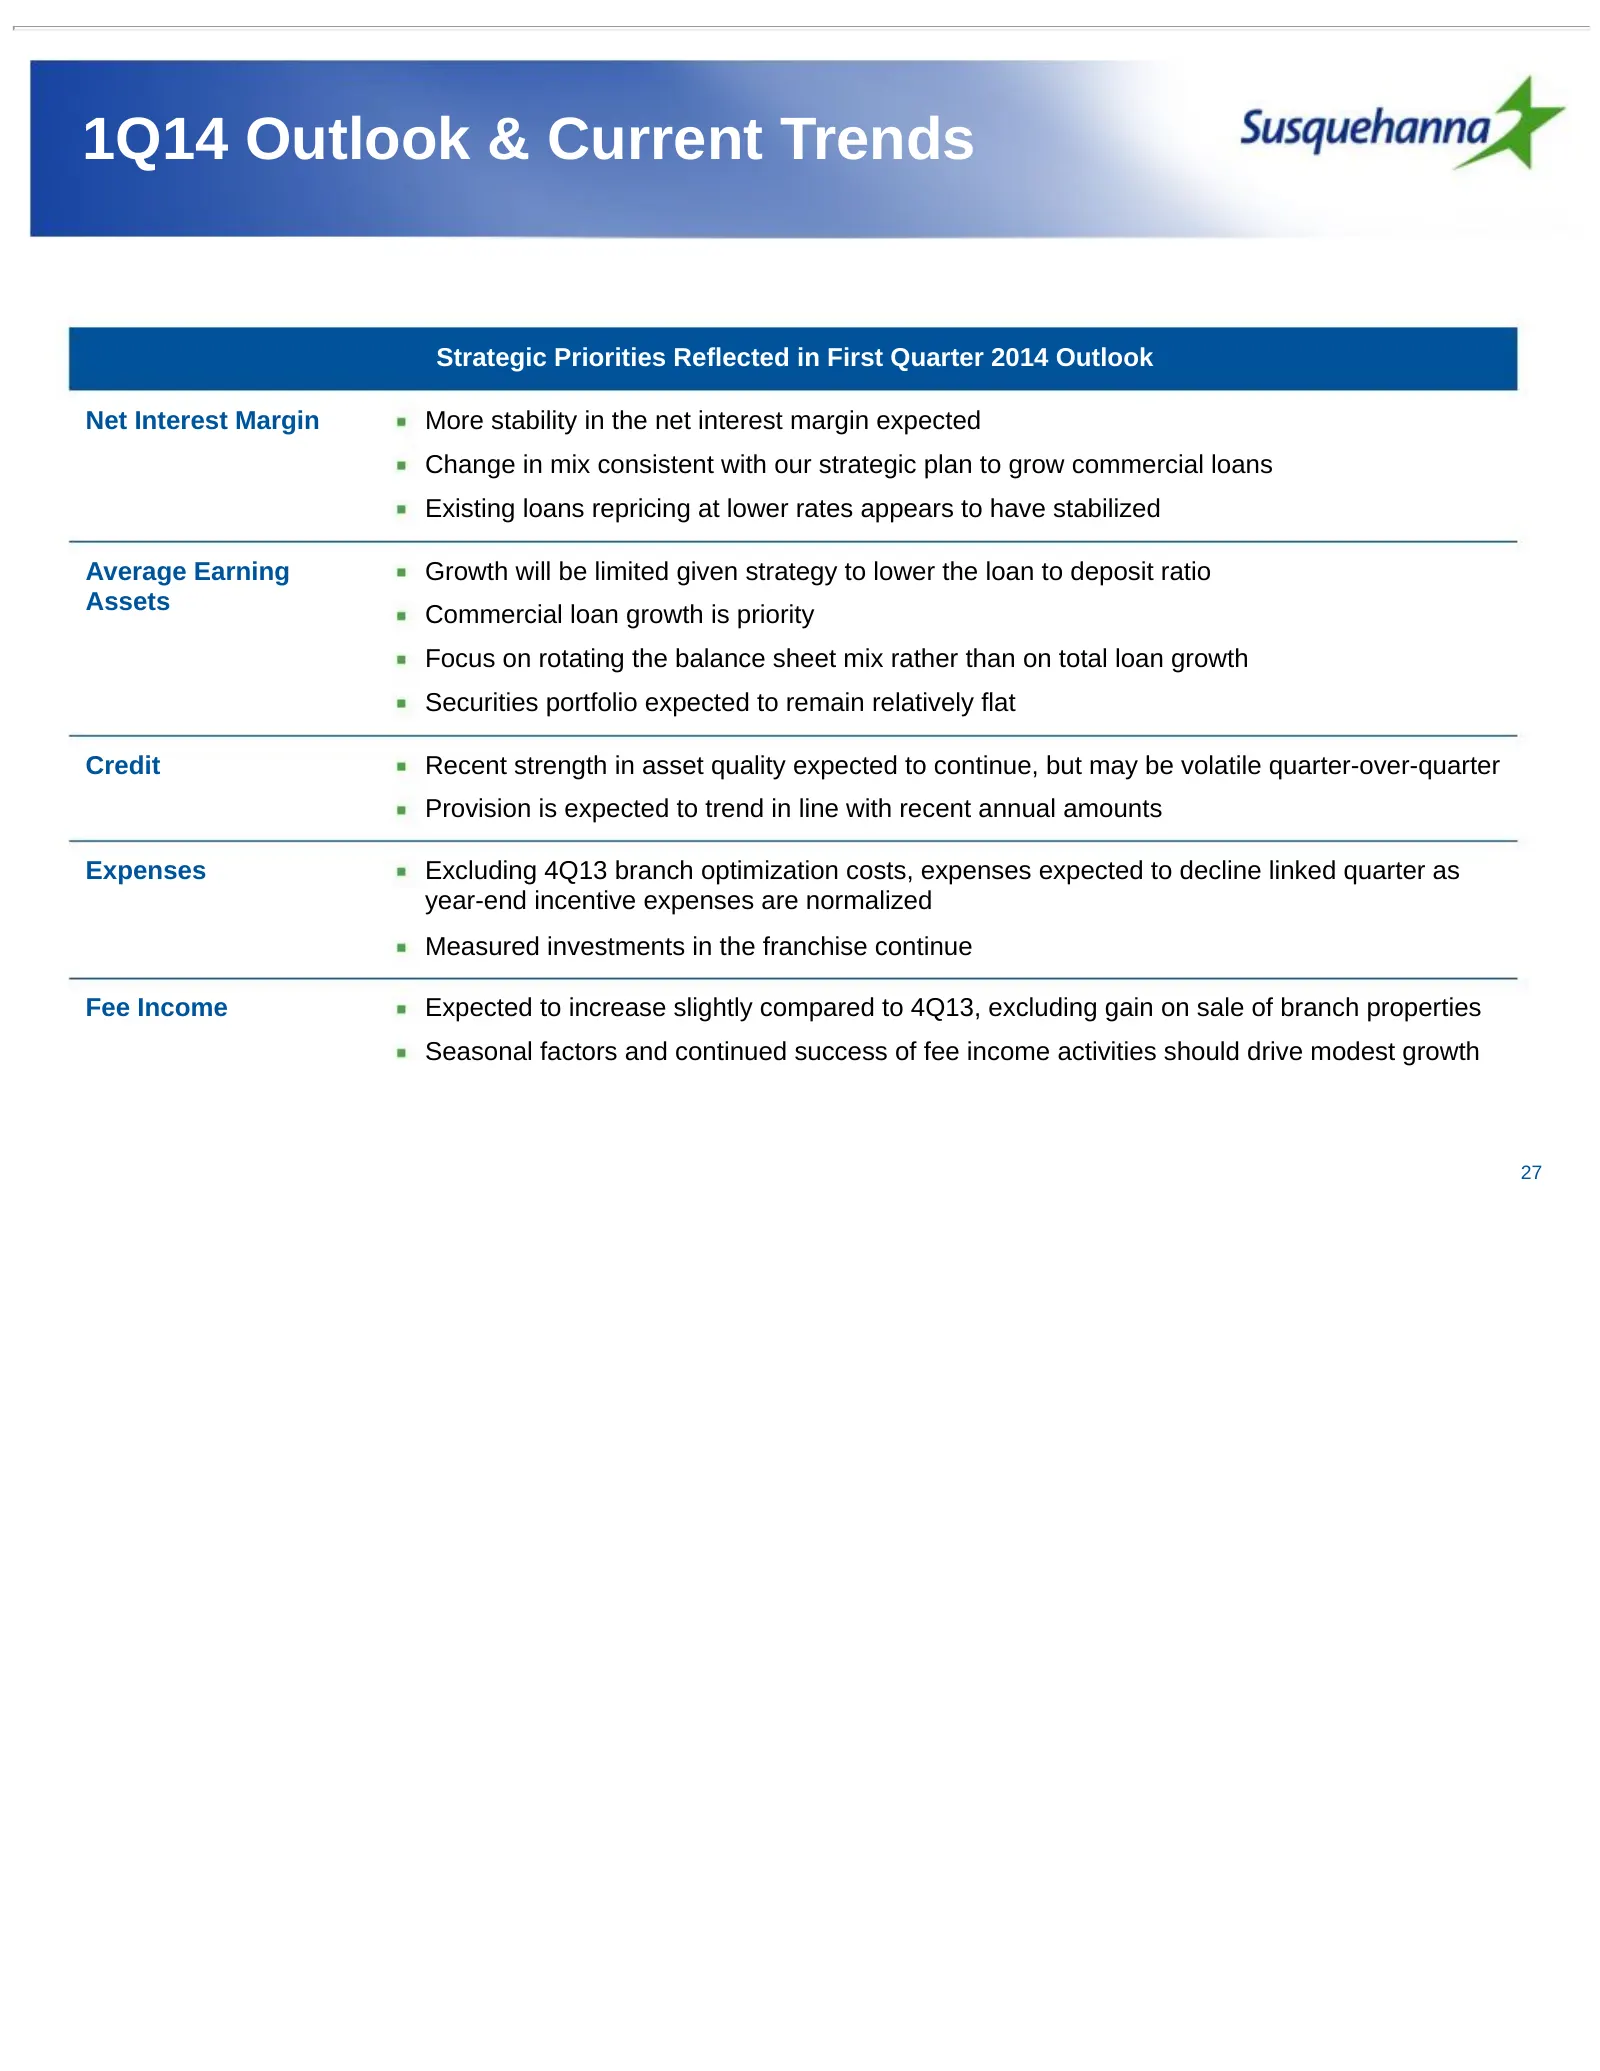
1Q14 Outlook & Current Trends Strategic Priorities Reflected in First Quarter 2014 Outlook Net Interest Margin More stability in the net interest margin expected Change in mix consistent with our strategic plan to grow commercial loans Existing loans repricing at lower rates appears to have stabiliz
Slide 28: Valuation and Long Term Upside
Valuation and Long Term Upside 28
Slide 29: Valuation
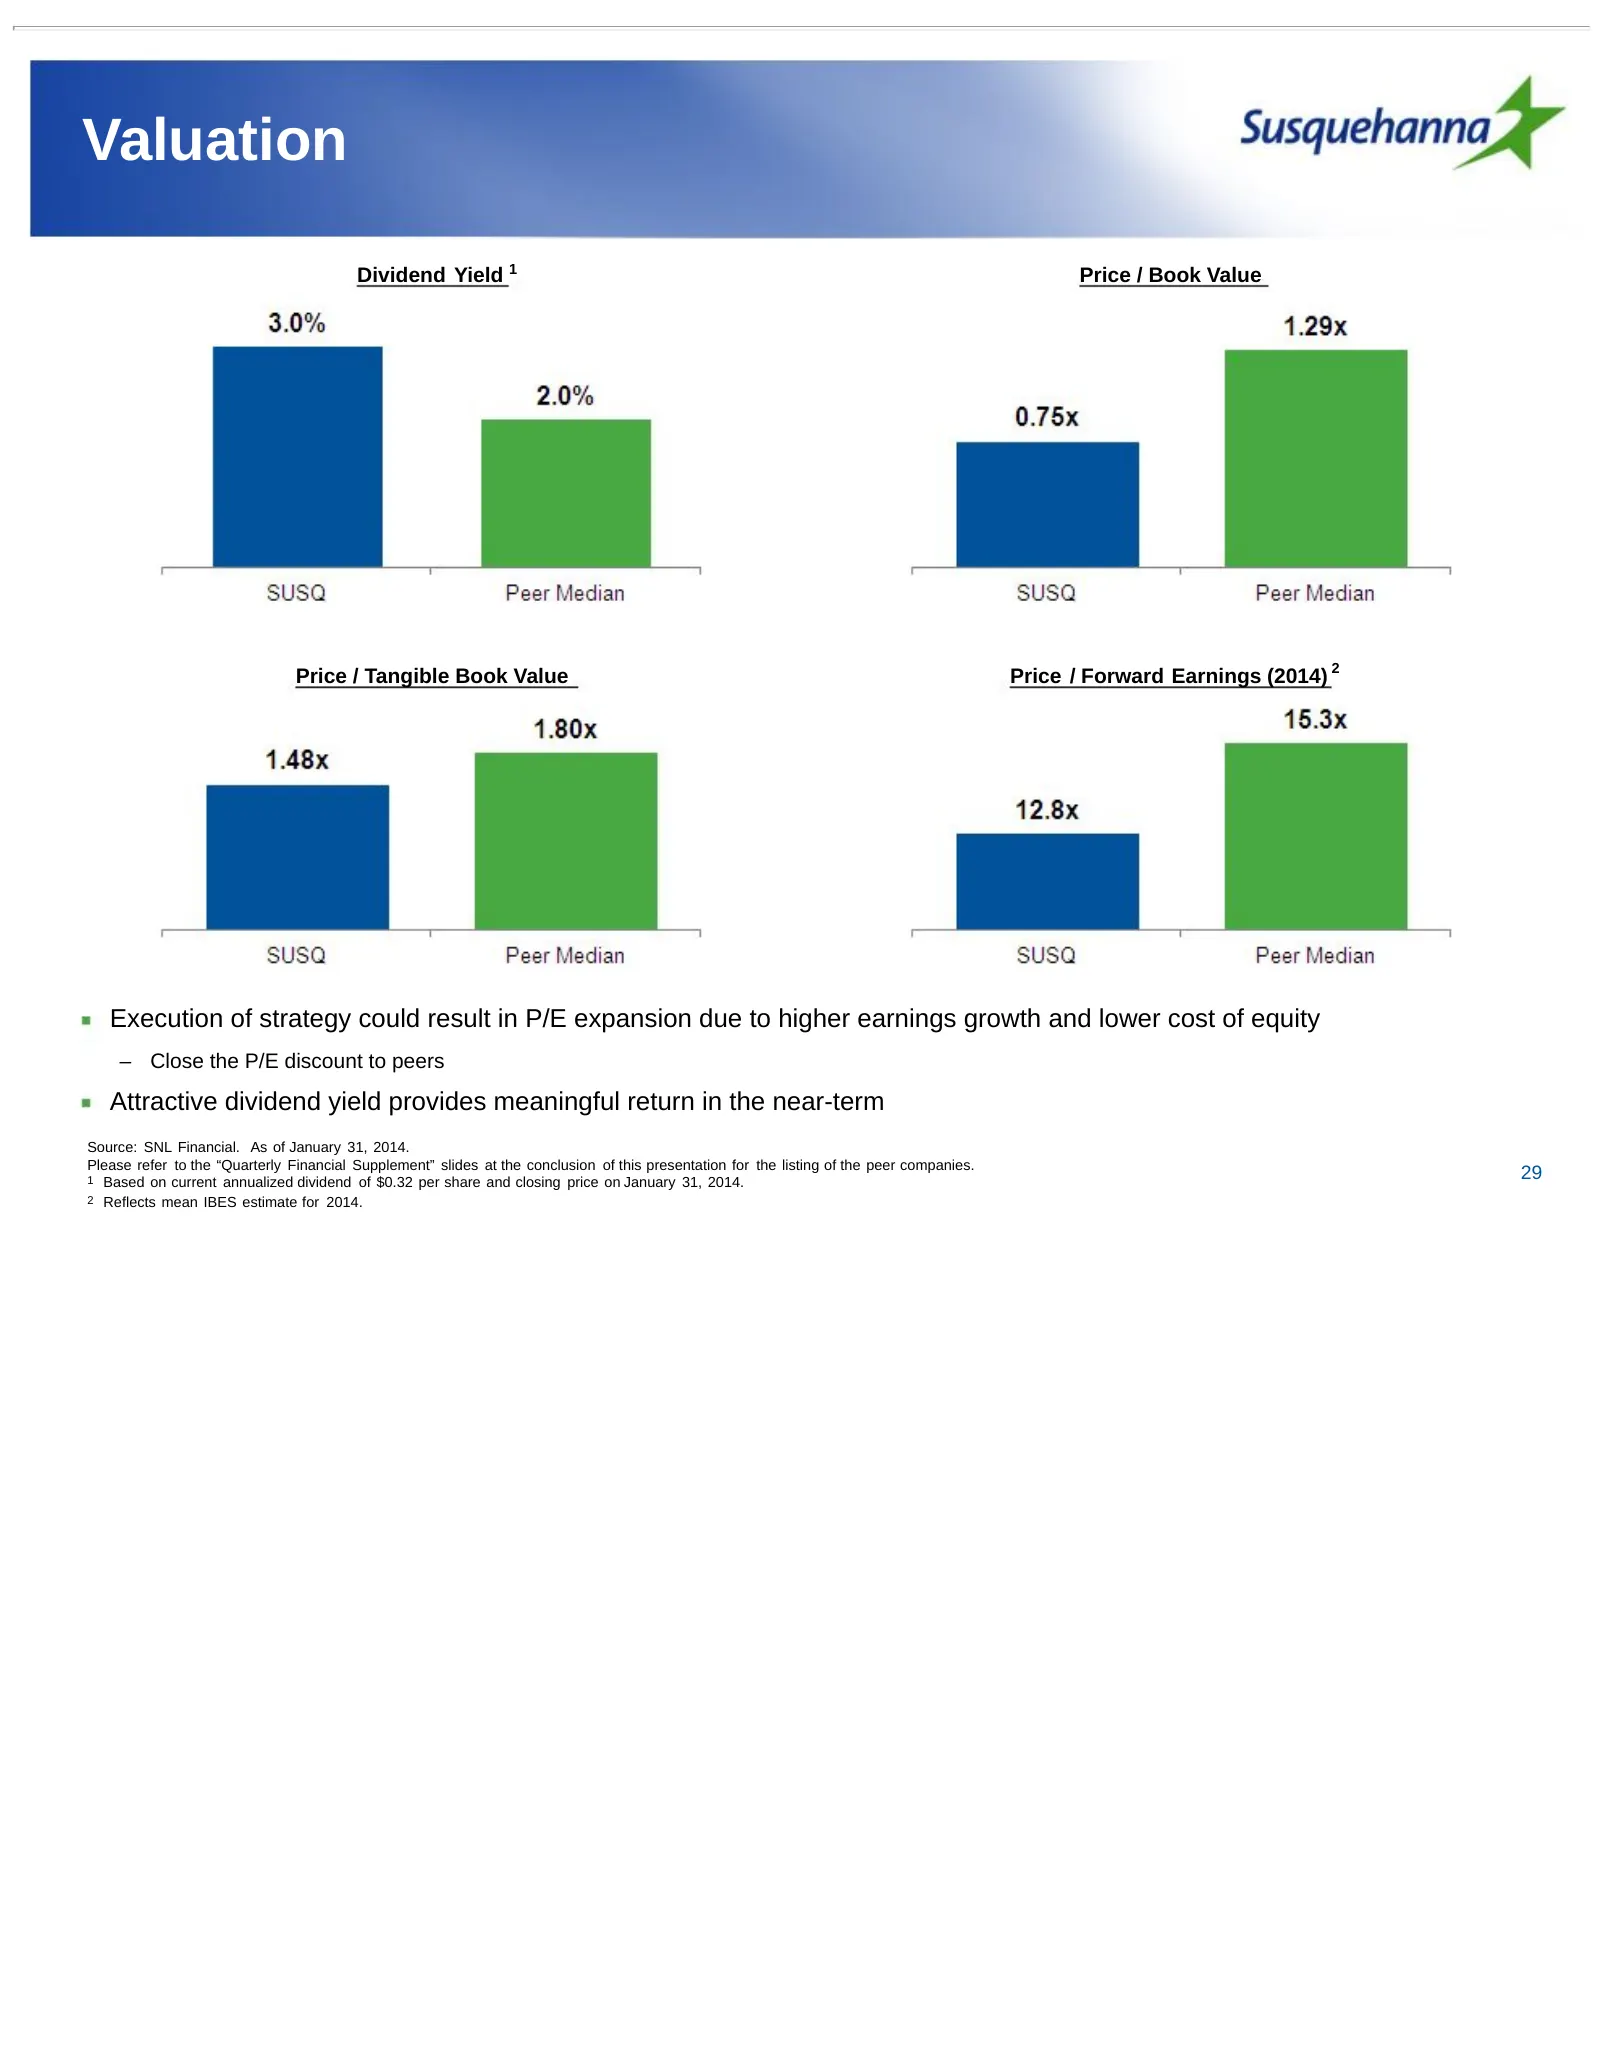
Valuation Dividend Yield 1 Price / Book Value Price / Tangible Book Value Price / Forward Earnings (2014) 22 Execution of strategy could result in P/E expansion due to higher earnings growth and lower cost of equity – Close the P/E discount to peers Attractive dividend yield provides meaningful retu
Slide 30: Solid Capital Generation
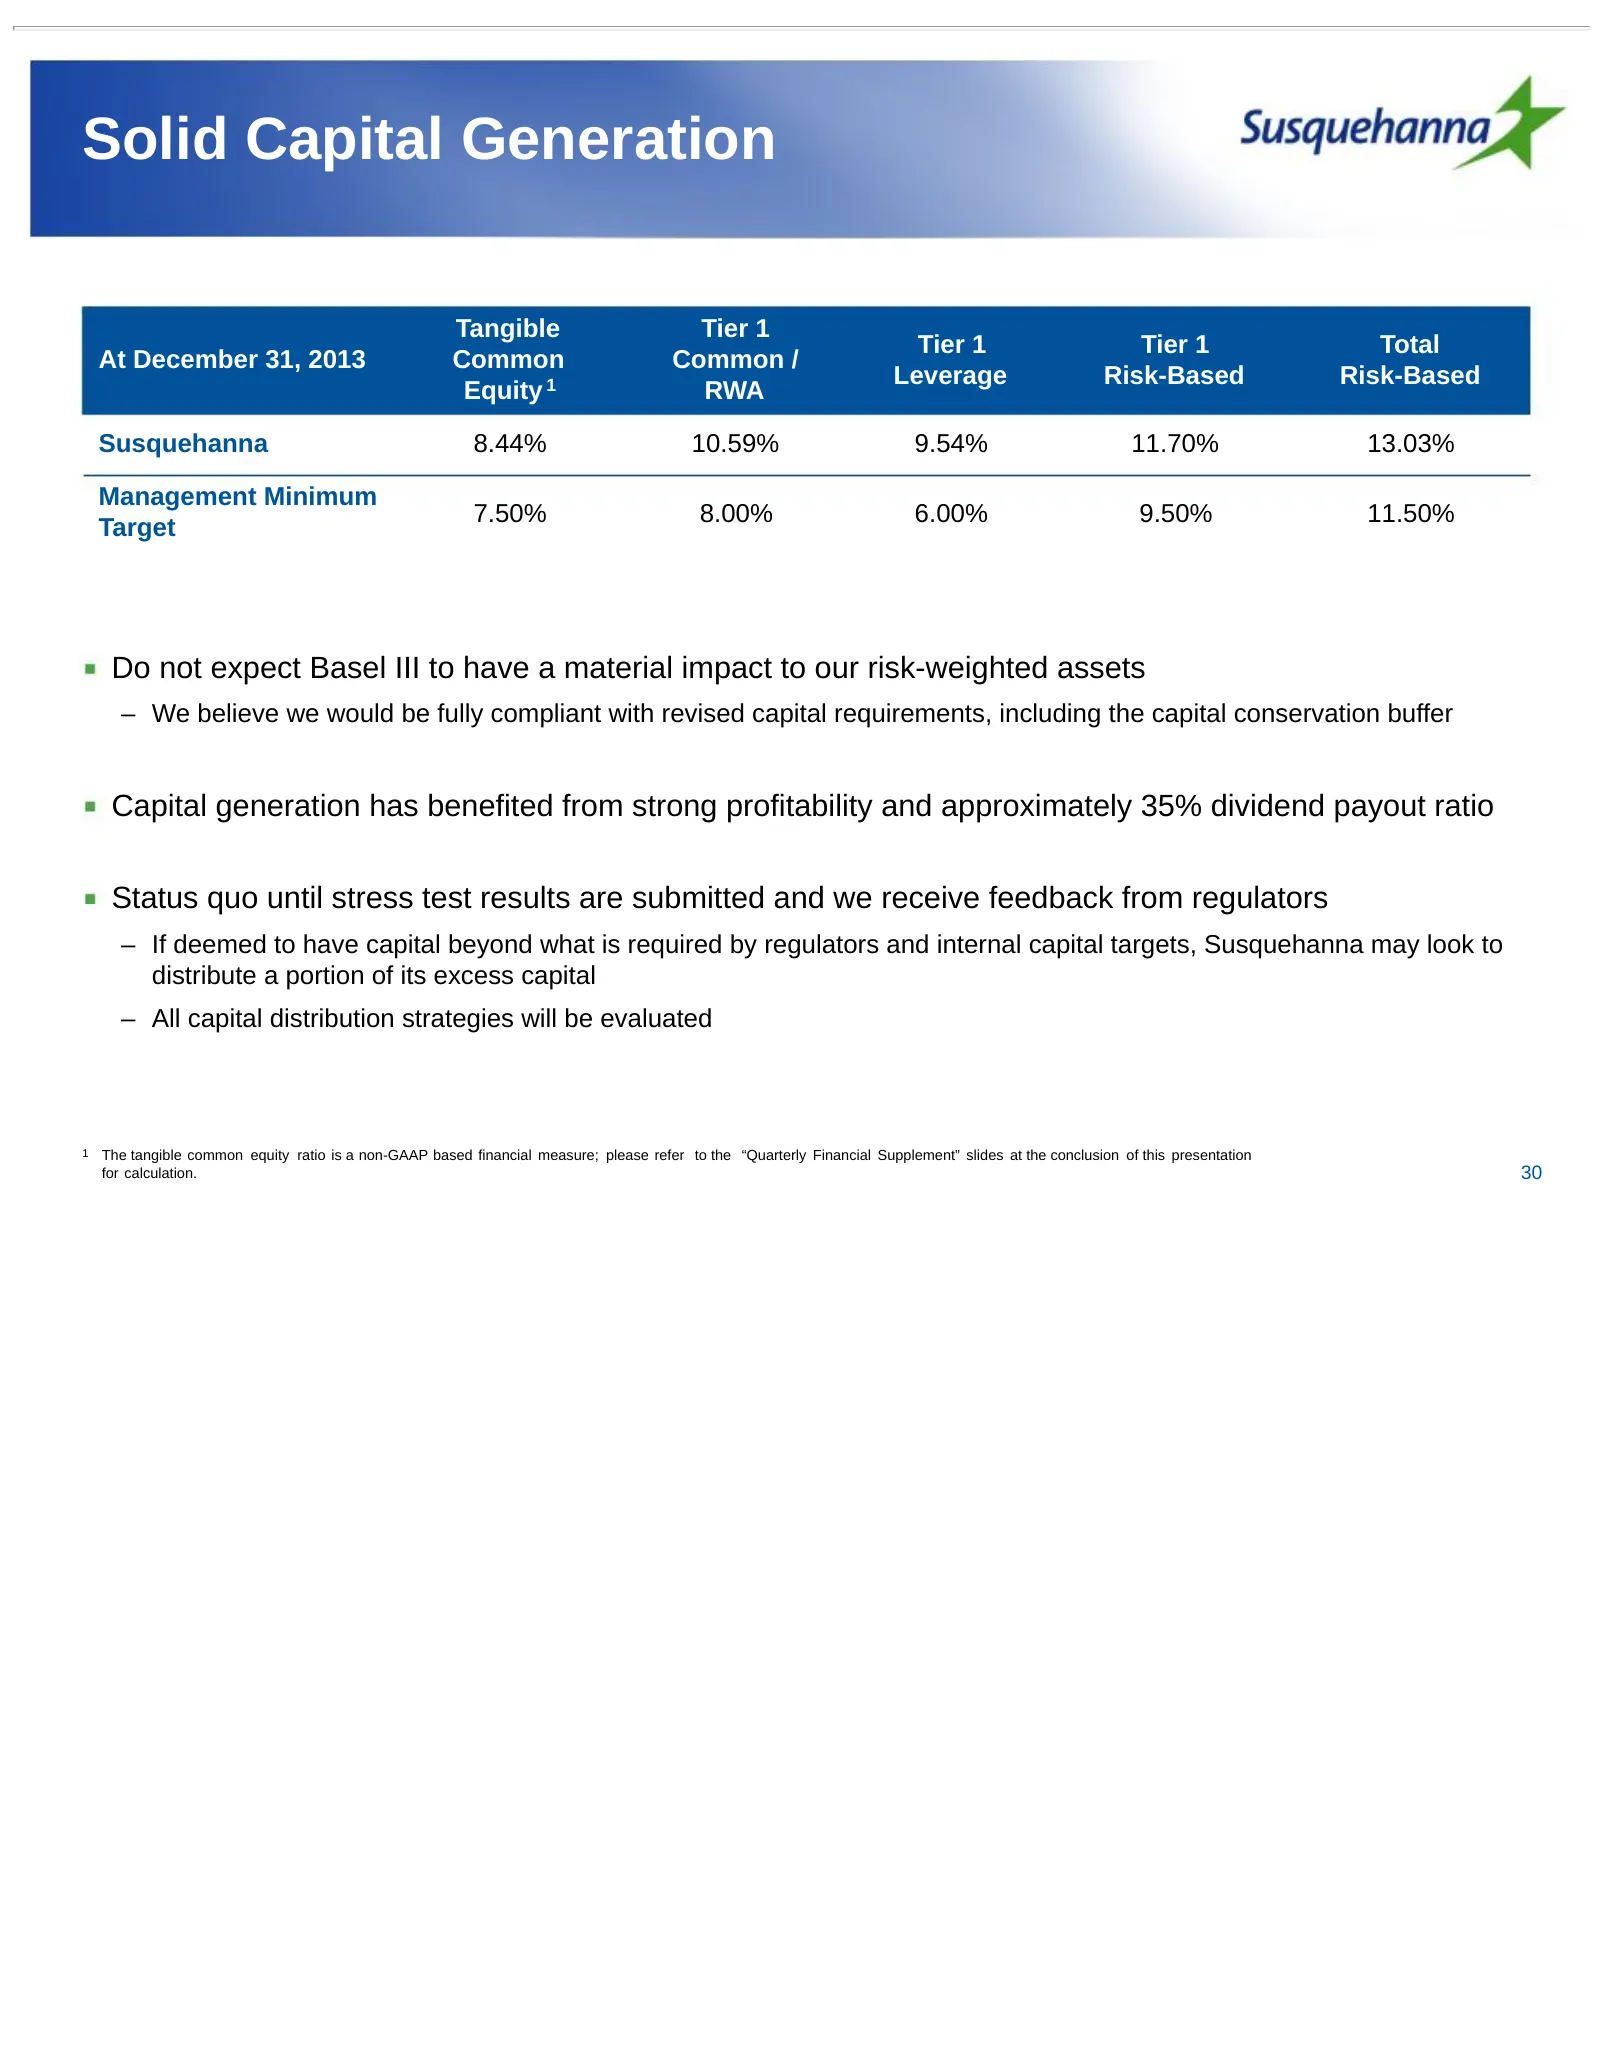
Solid Capital Generation Tangible Tier 1 Tier 1 Tier 1 Total At December 31, 2013 Common Common / Leverage Risk-Based Risk-Based Equity 1 RWA Susquehanna 8.44% 10.59% 9.54% 11.70% 13.03% Management Minimum 7.50% 8.00% 6.00% 9.50% 11.50% Target Do not expect Basel III to have a material impact to our
Slide 31: Quarterly Financial Supplement
Quarterly Financial Supplement 31
Slide 32: Susquehanna Bank Markets
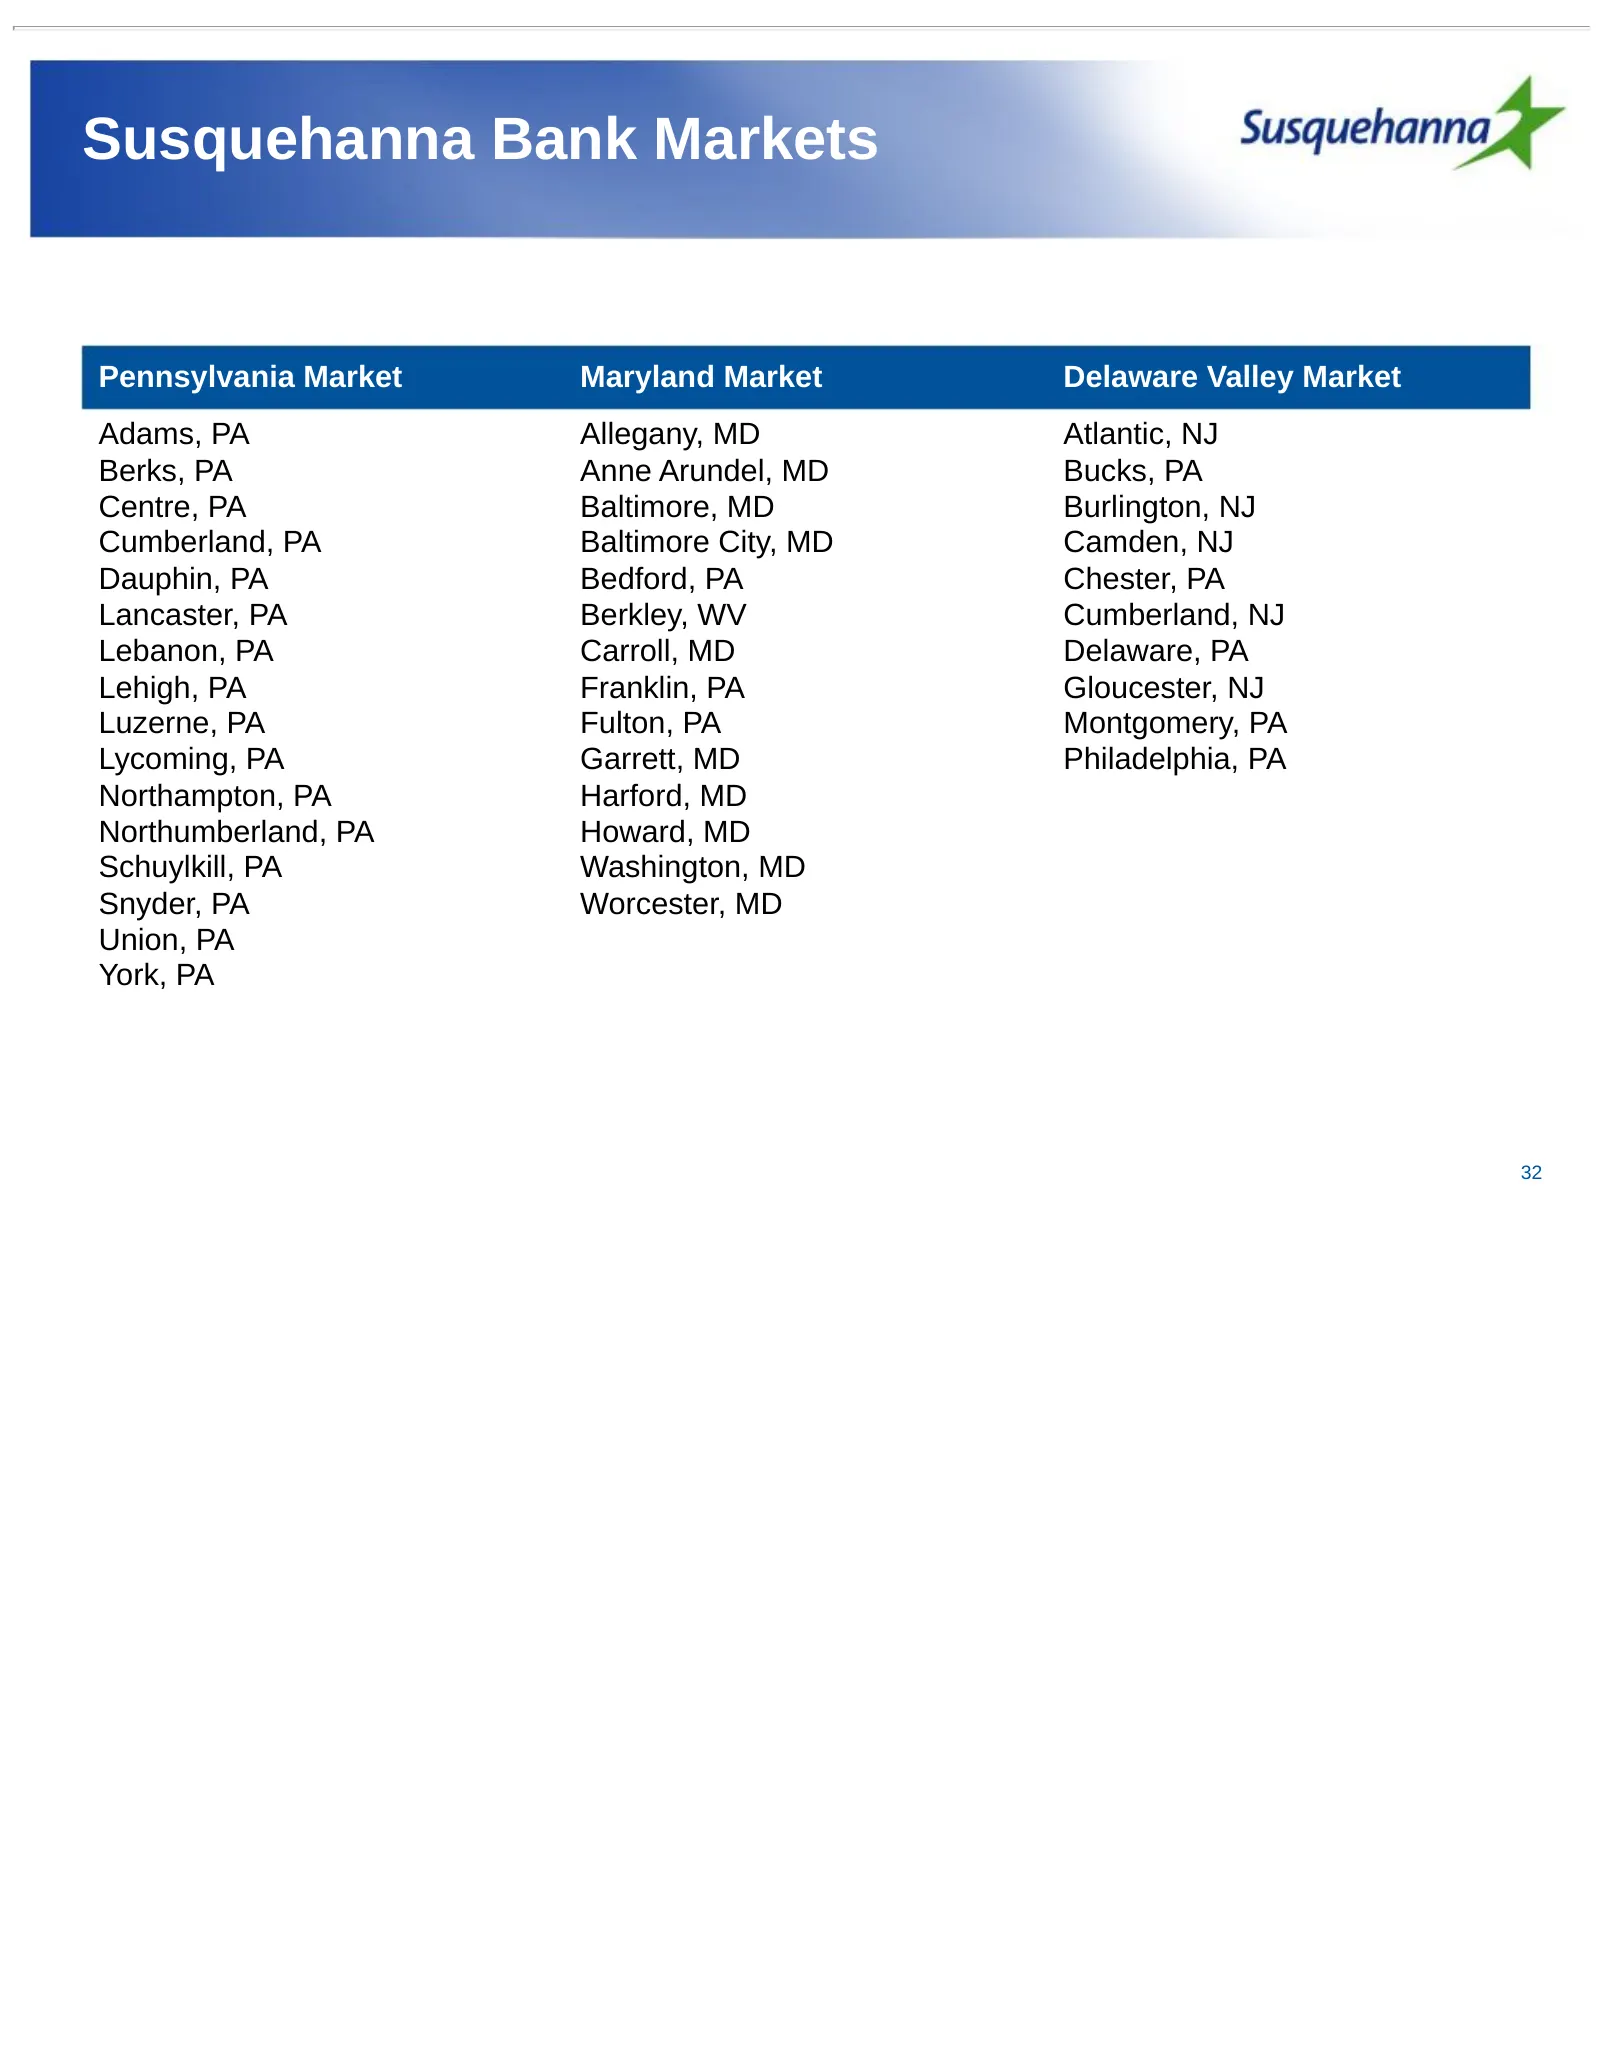
Susquehanna Bank Markets Pennsylvania Market Maryland Market Delaware Valley Market Adams, PA Allegany, MD Atlantic, NJ Berks, PA Anne Arundel, MD Bucks, PA Centre, PA Baltimore, MD Burlington, NJ Cumberland, PA Baltimore City, MD Camden, NJ Dauphin, PA Bedford, PA Chester, PA Lancaster, PA Berkley,
Slide 33: Peer Companies
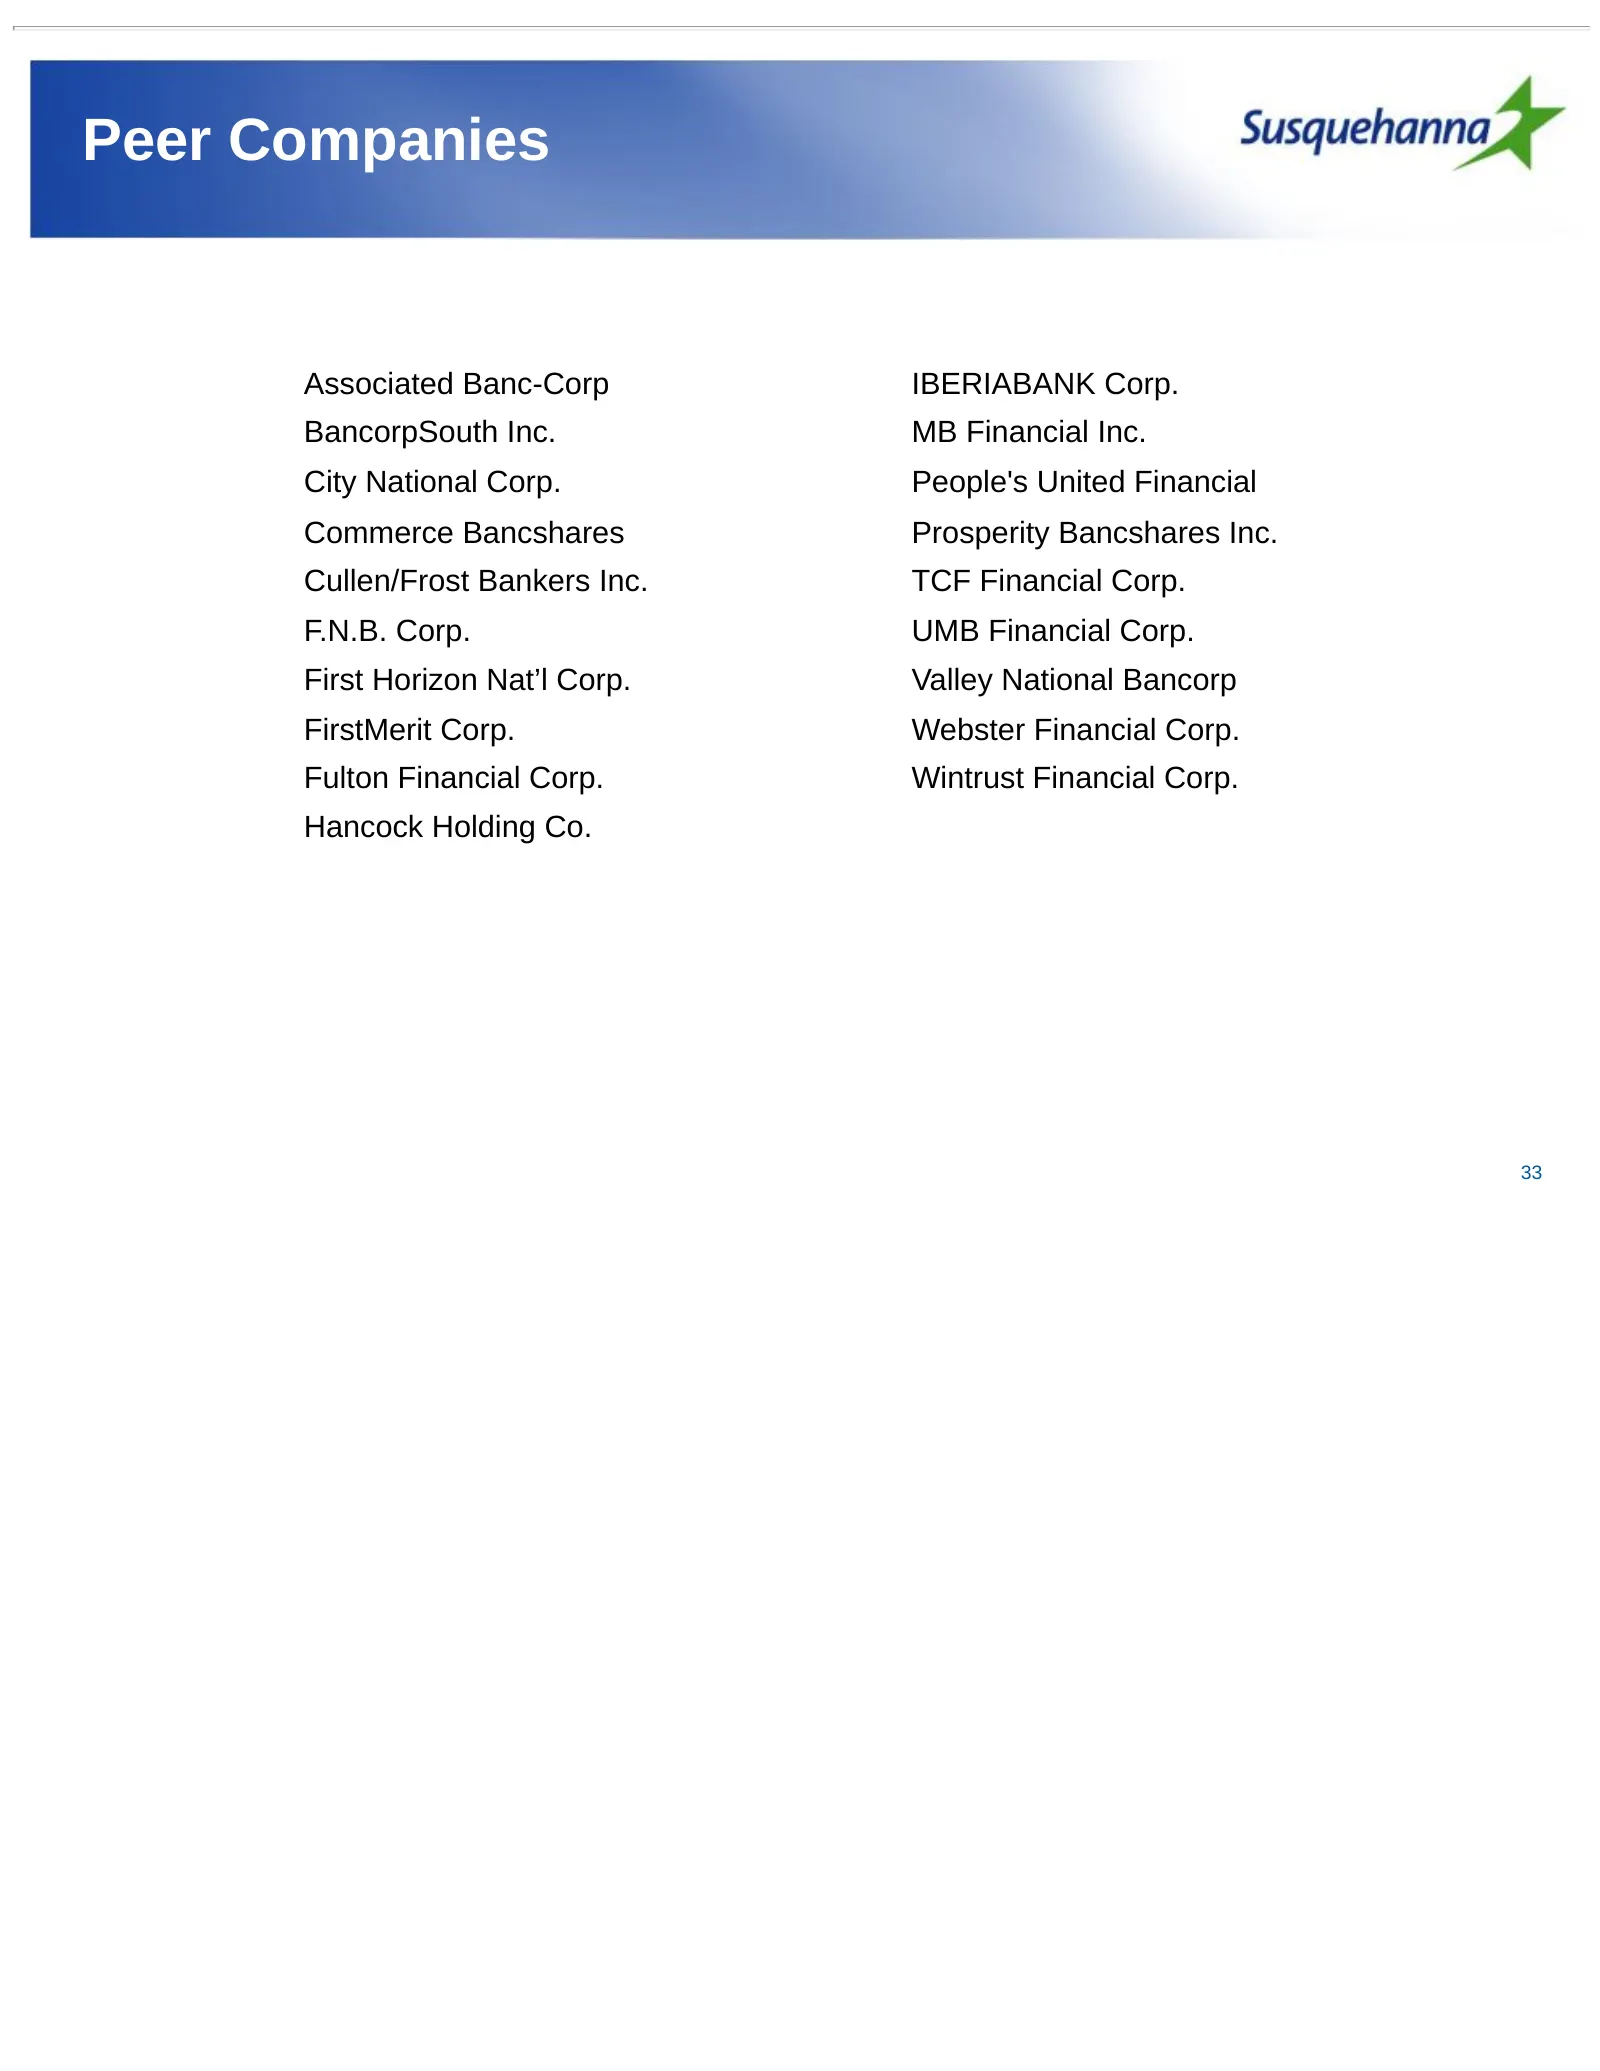
Peer Companies Associated Banc-Corp IBERIABANK Corp. BancorpSouth Inc. MB Financial Inc. City National Corp. People's United Financial Commerce Bancshares Prosperity Bancshares Inc. Cullen/Frost Bankers Inc. TCF Financial Corp. F.N.B. Corp. UMB Financial Corp. First Horizon Nat’l Corp. Valley Nation
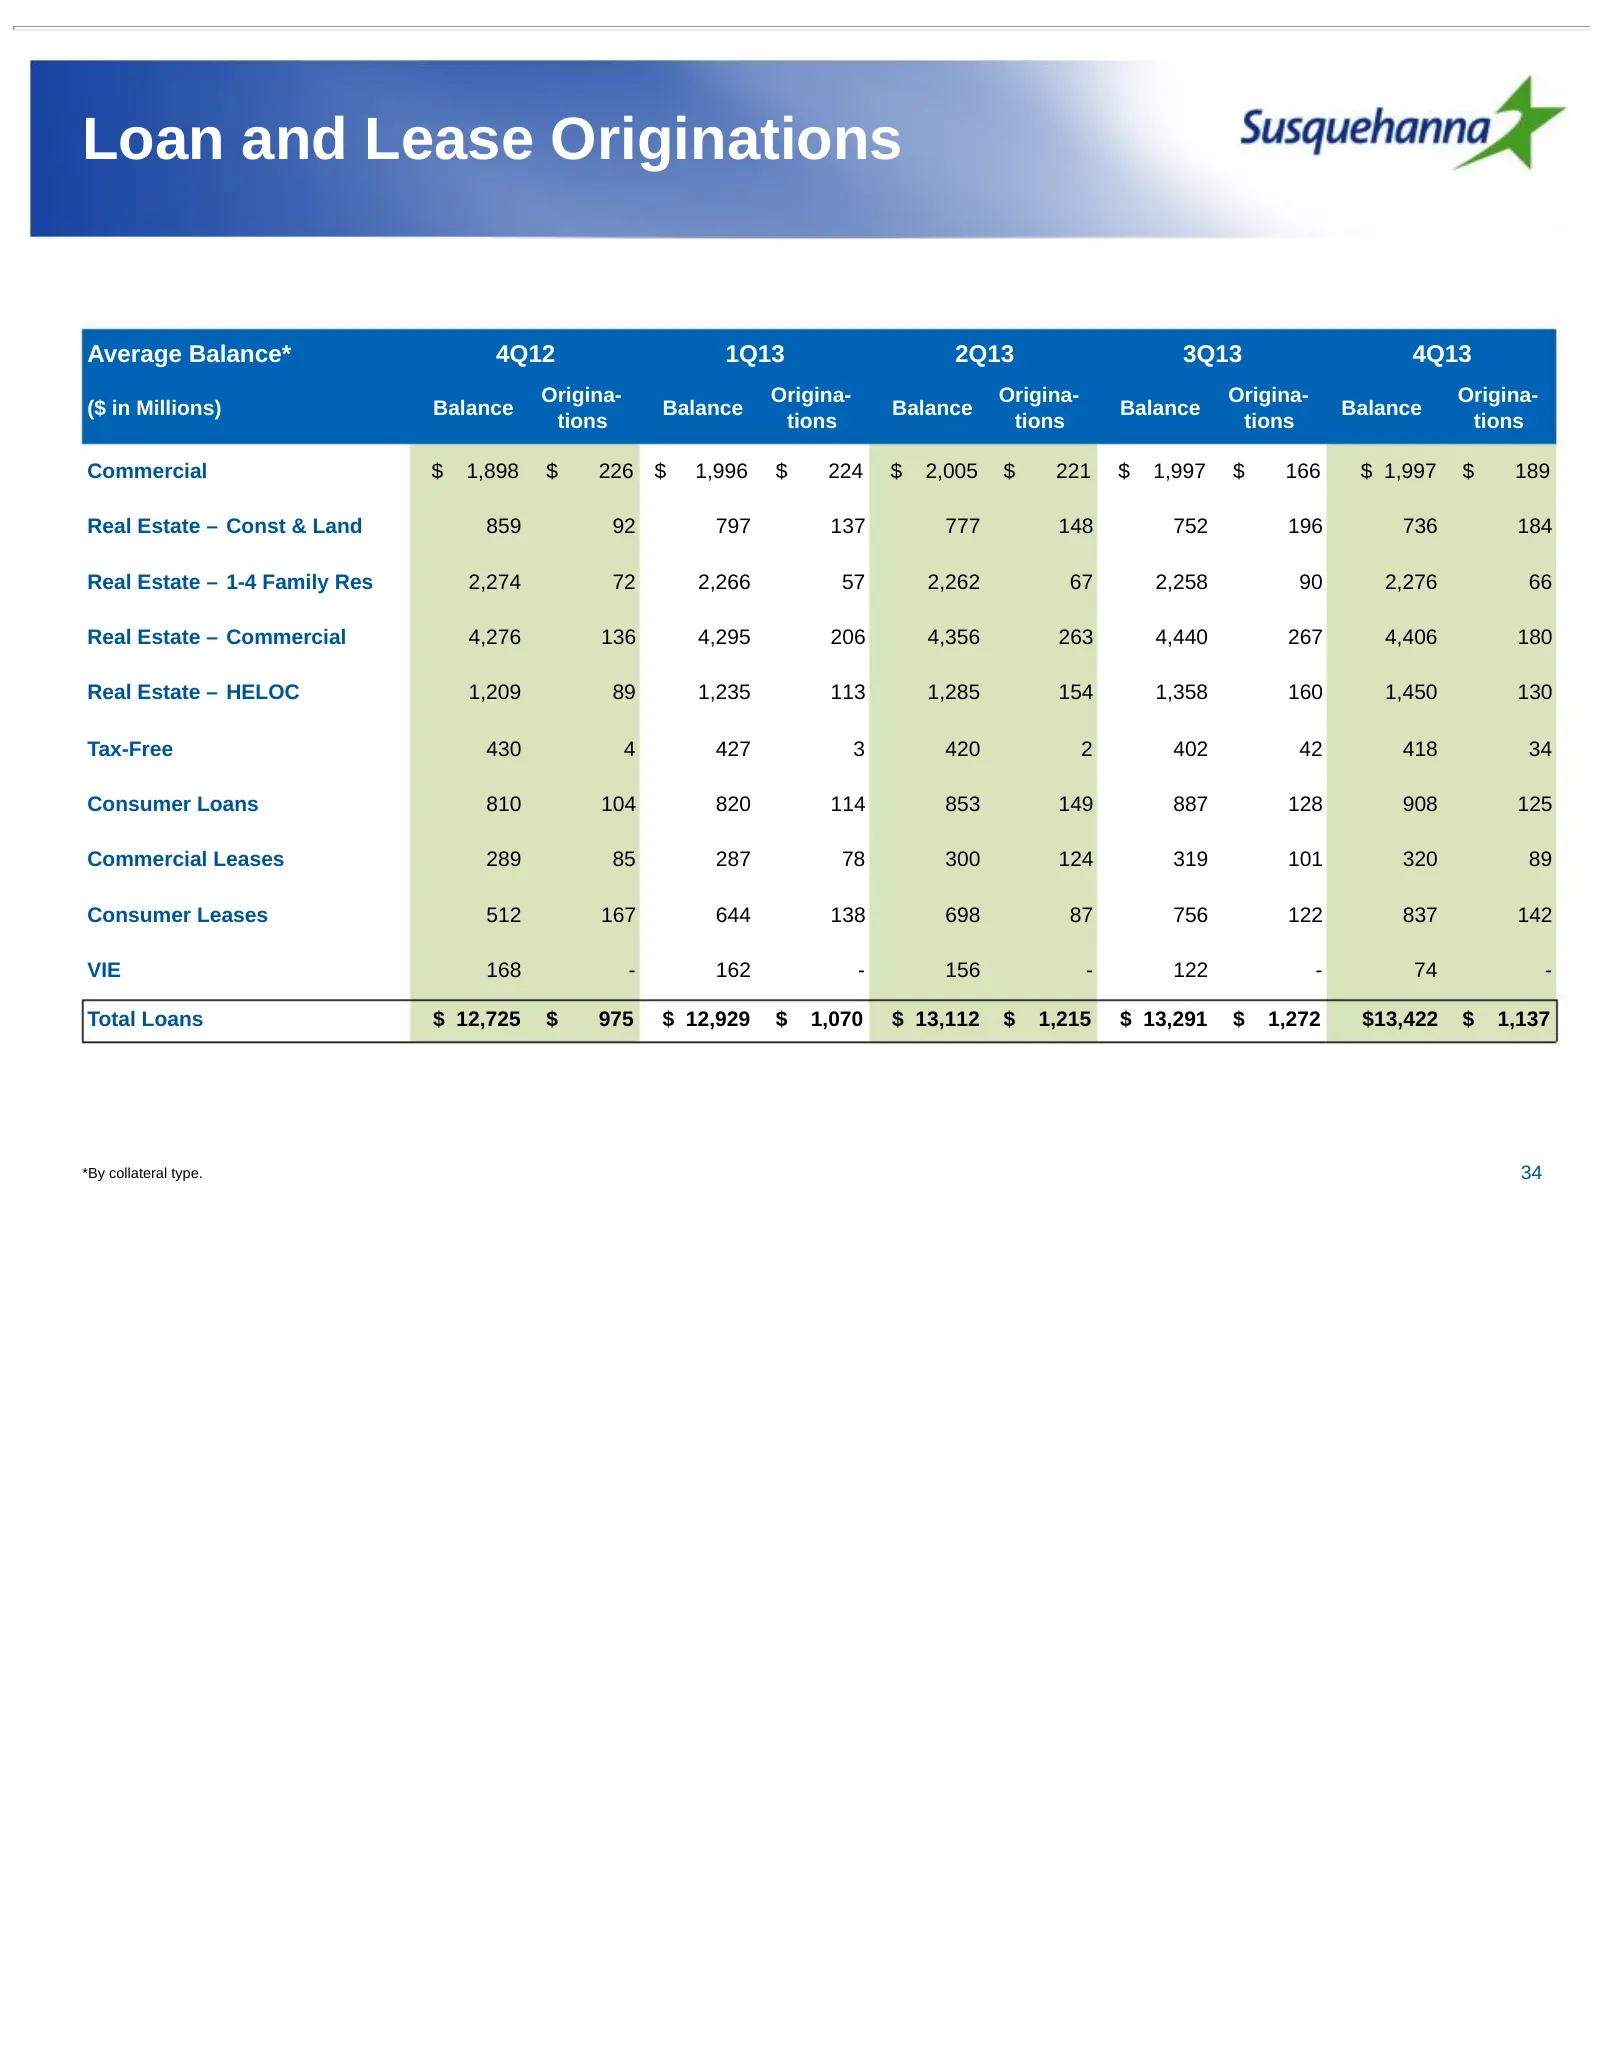
Slide 34: Loan and Lease Originations
Loan and Lease Originations Average Balance* 4Q12 1Q13 2Q13 3Q13 4Q13 Origina- Origina- Origina- Origina- Origina- ($ in Millions) Balance Balance Balance Balance Balance tions tions tions tions tions Commercial $ 1,898 $ 226 $ 1,996 $ 224 $ 2,005 $ 221 $ 1,997 $ 166 $ 1,997 $ 189 Real Estate – Cons
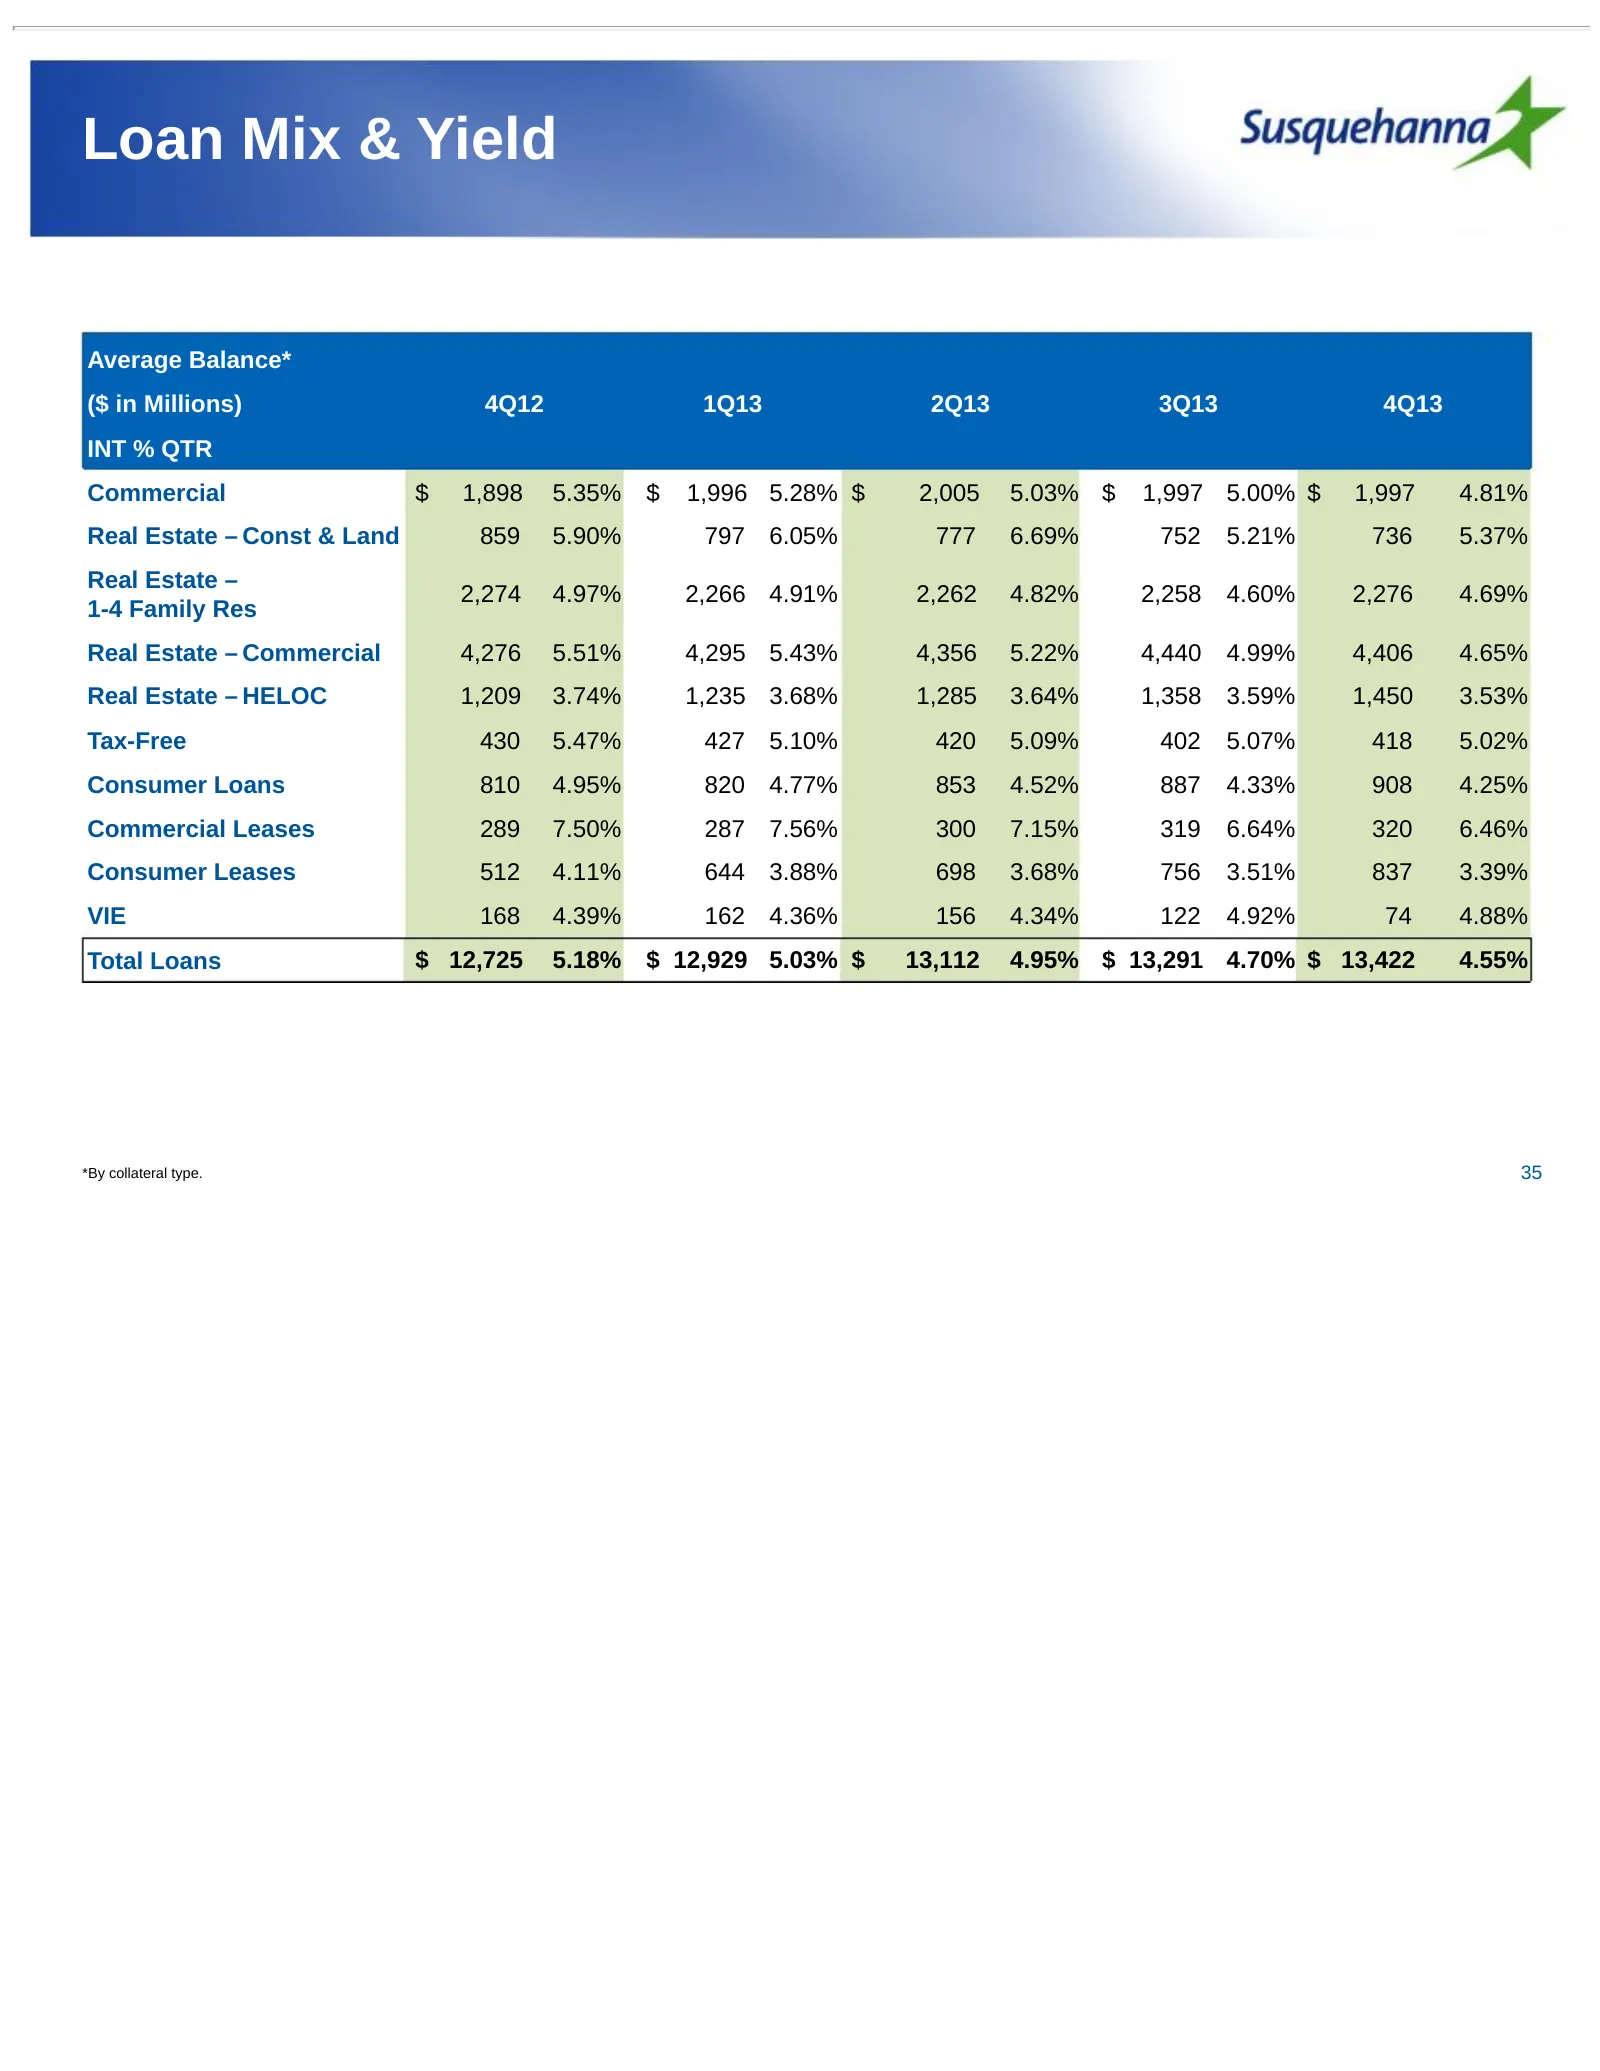
Slide 35: Loan Mix & Yield
Loan Mix & Yield Average Balance* ($ in Millions) 4Q12 1Q13 2Q13 3Q13 4Q13 INT % QTR Commercial $ 1,898 5.35% $ 1,996 5.28% $ 2,005 5.03% $ 1,997 5.00% $ 1,997 4.81% Real Estate – Const & Land 859 5.90% 797 6.05% 777 6.69% 752 5.21% 736 5.37% Real Estate – 2,274 4.97% 2,266 4.91% 2,262 4.82% 2,258 4
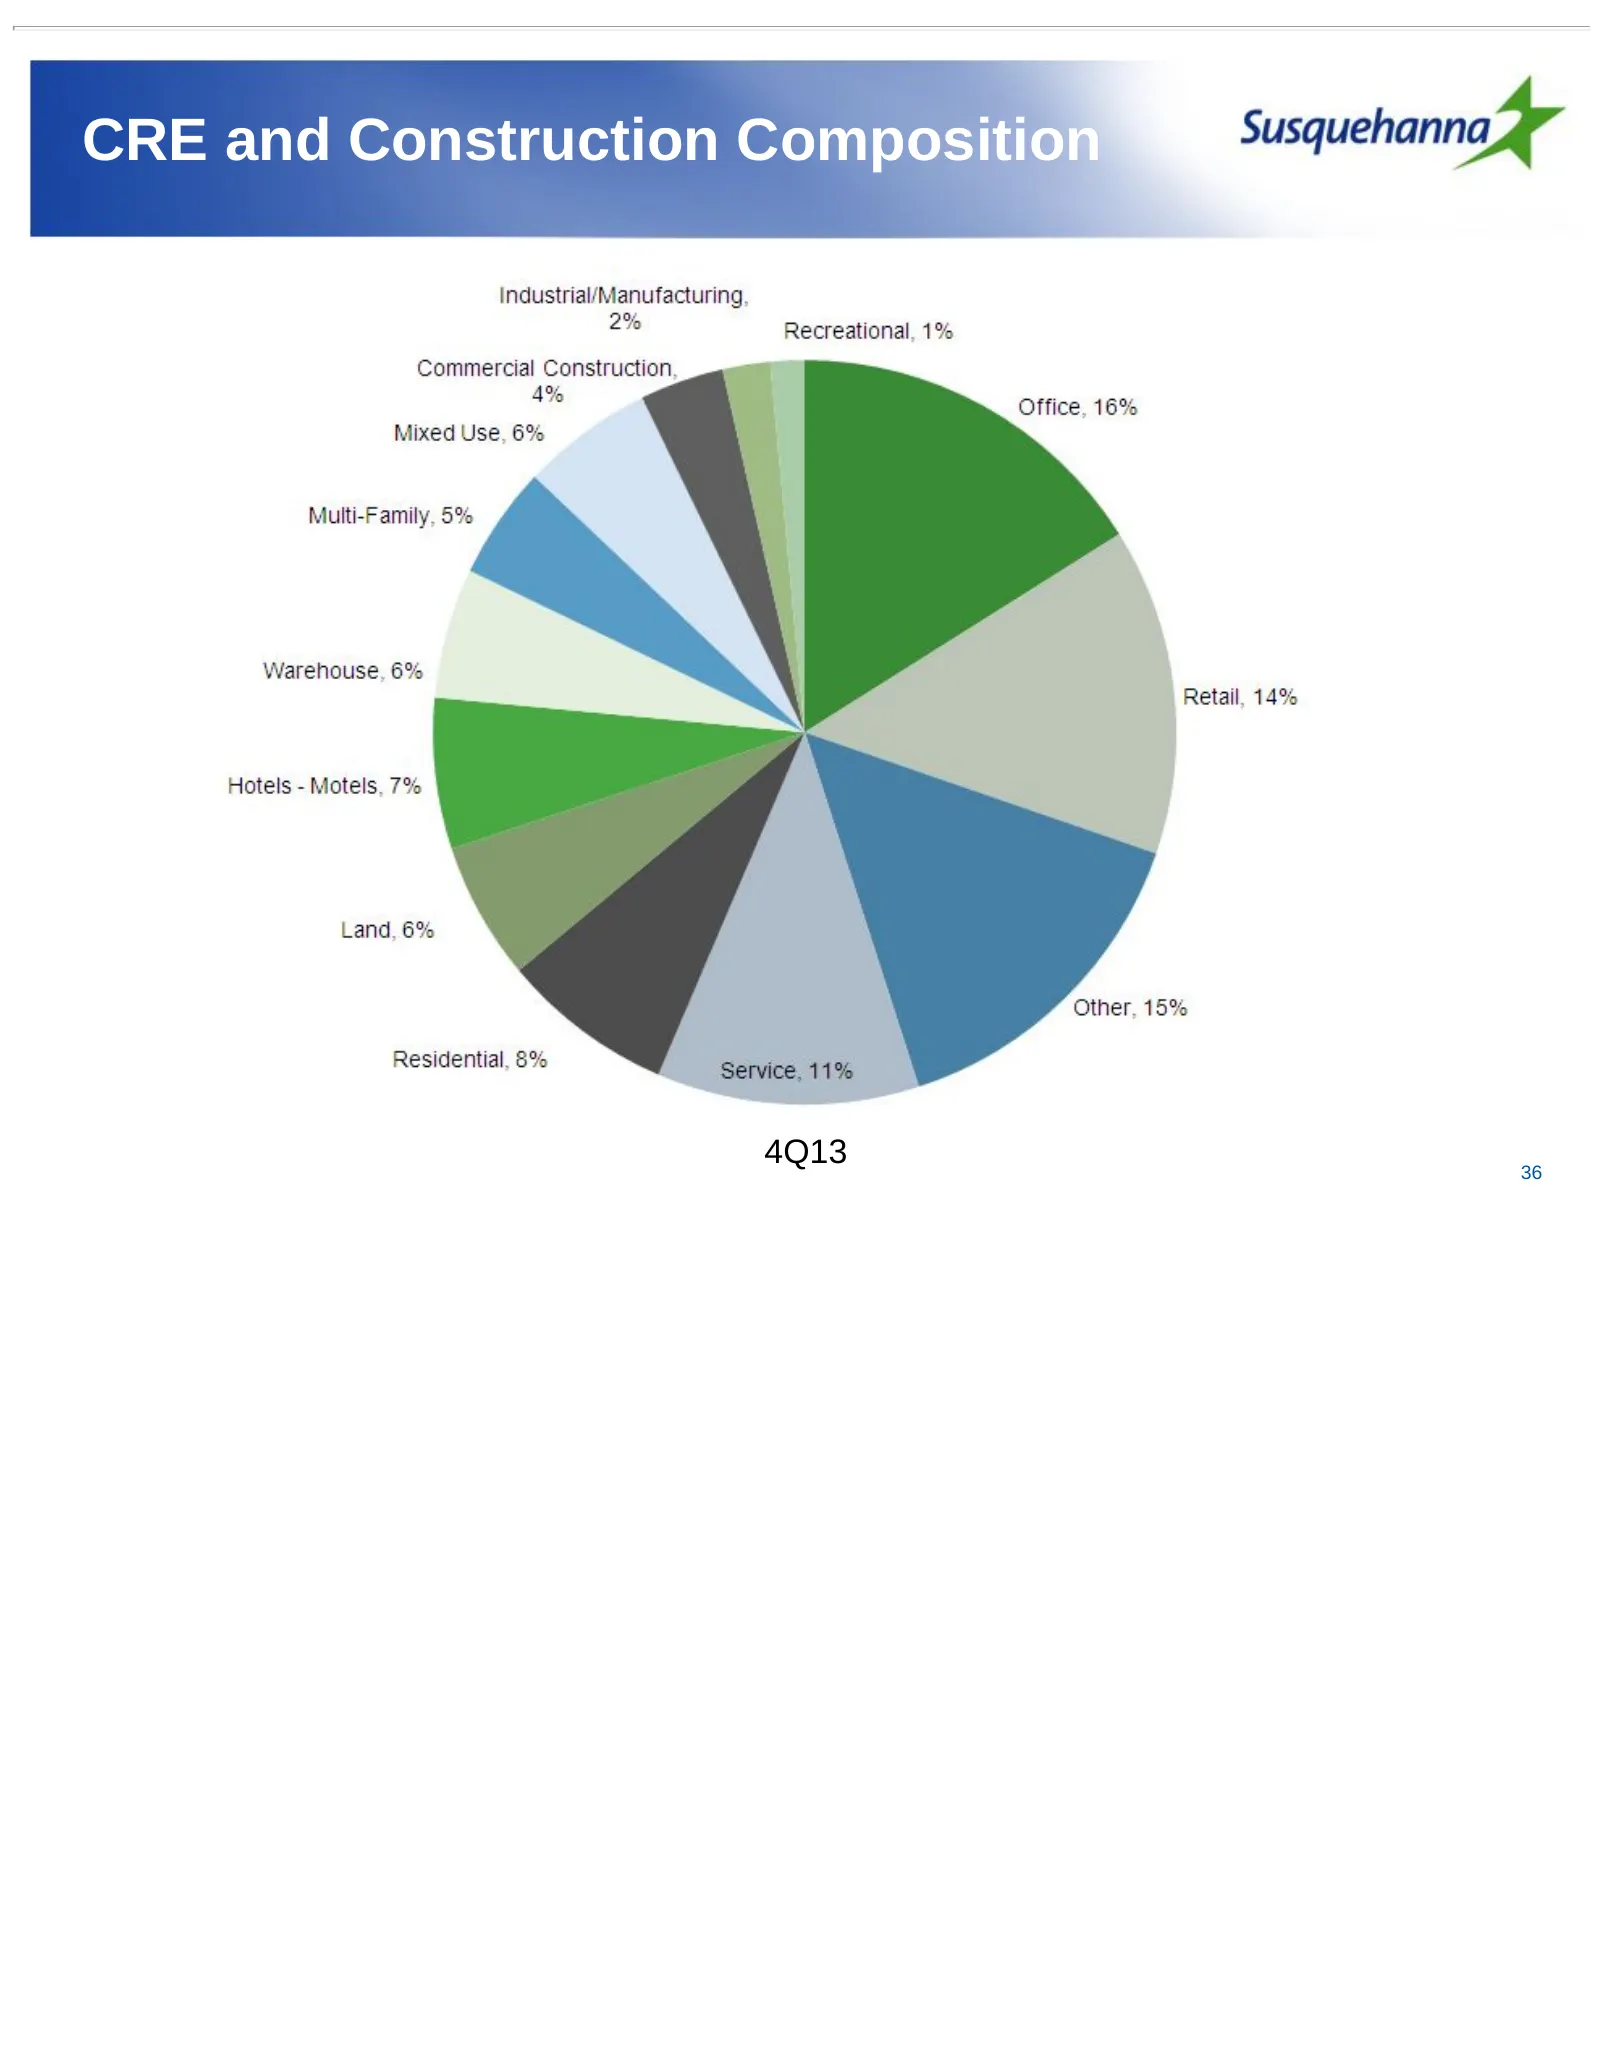
Slide 36: CRE and Construction Composition
CRE and Construction Composition 4Q13 36
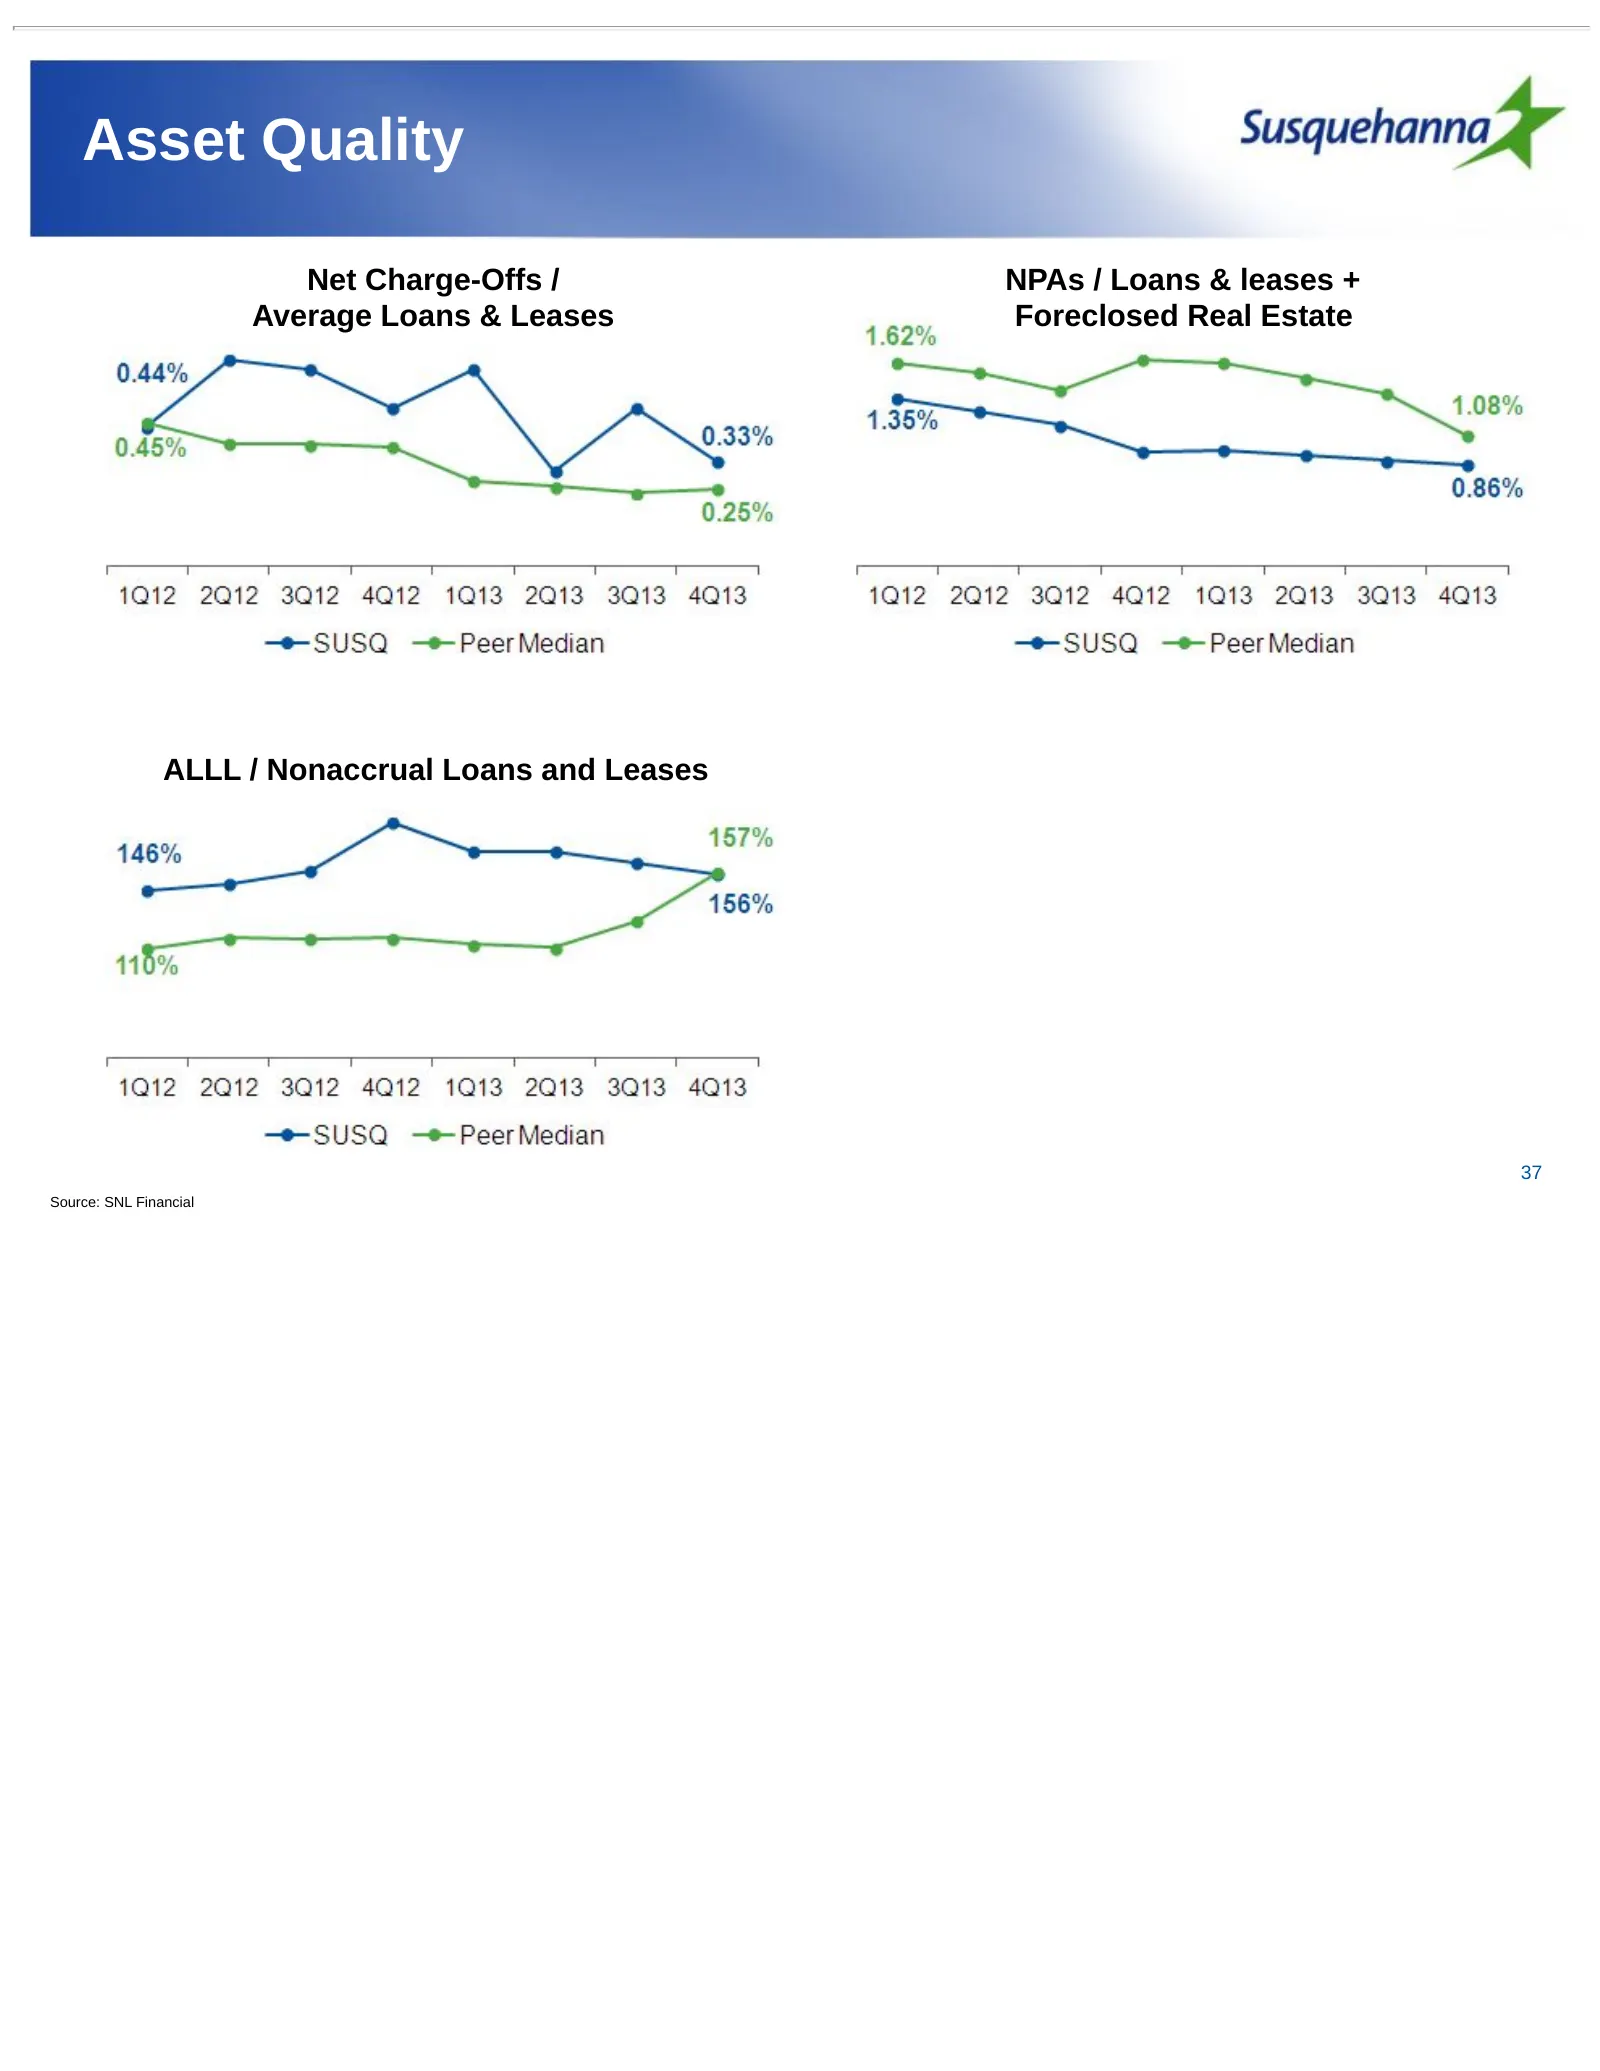
Slide 37: Asset Quality
Asset Quality Net Charge-Offs / NPAs / Loans & leases + Average Loans & Leases Foreclosed Real Estate ALLL / Nonaccrual Loans and Leases 37 Source: SNL Financial
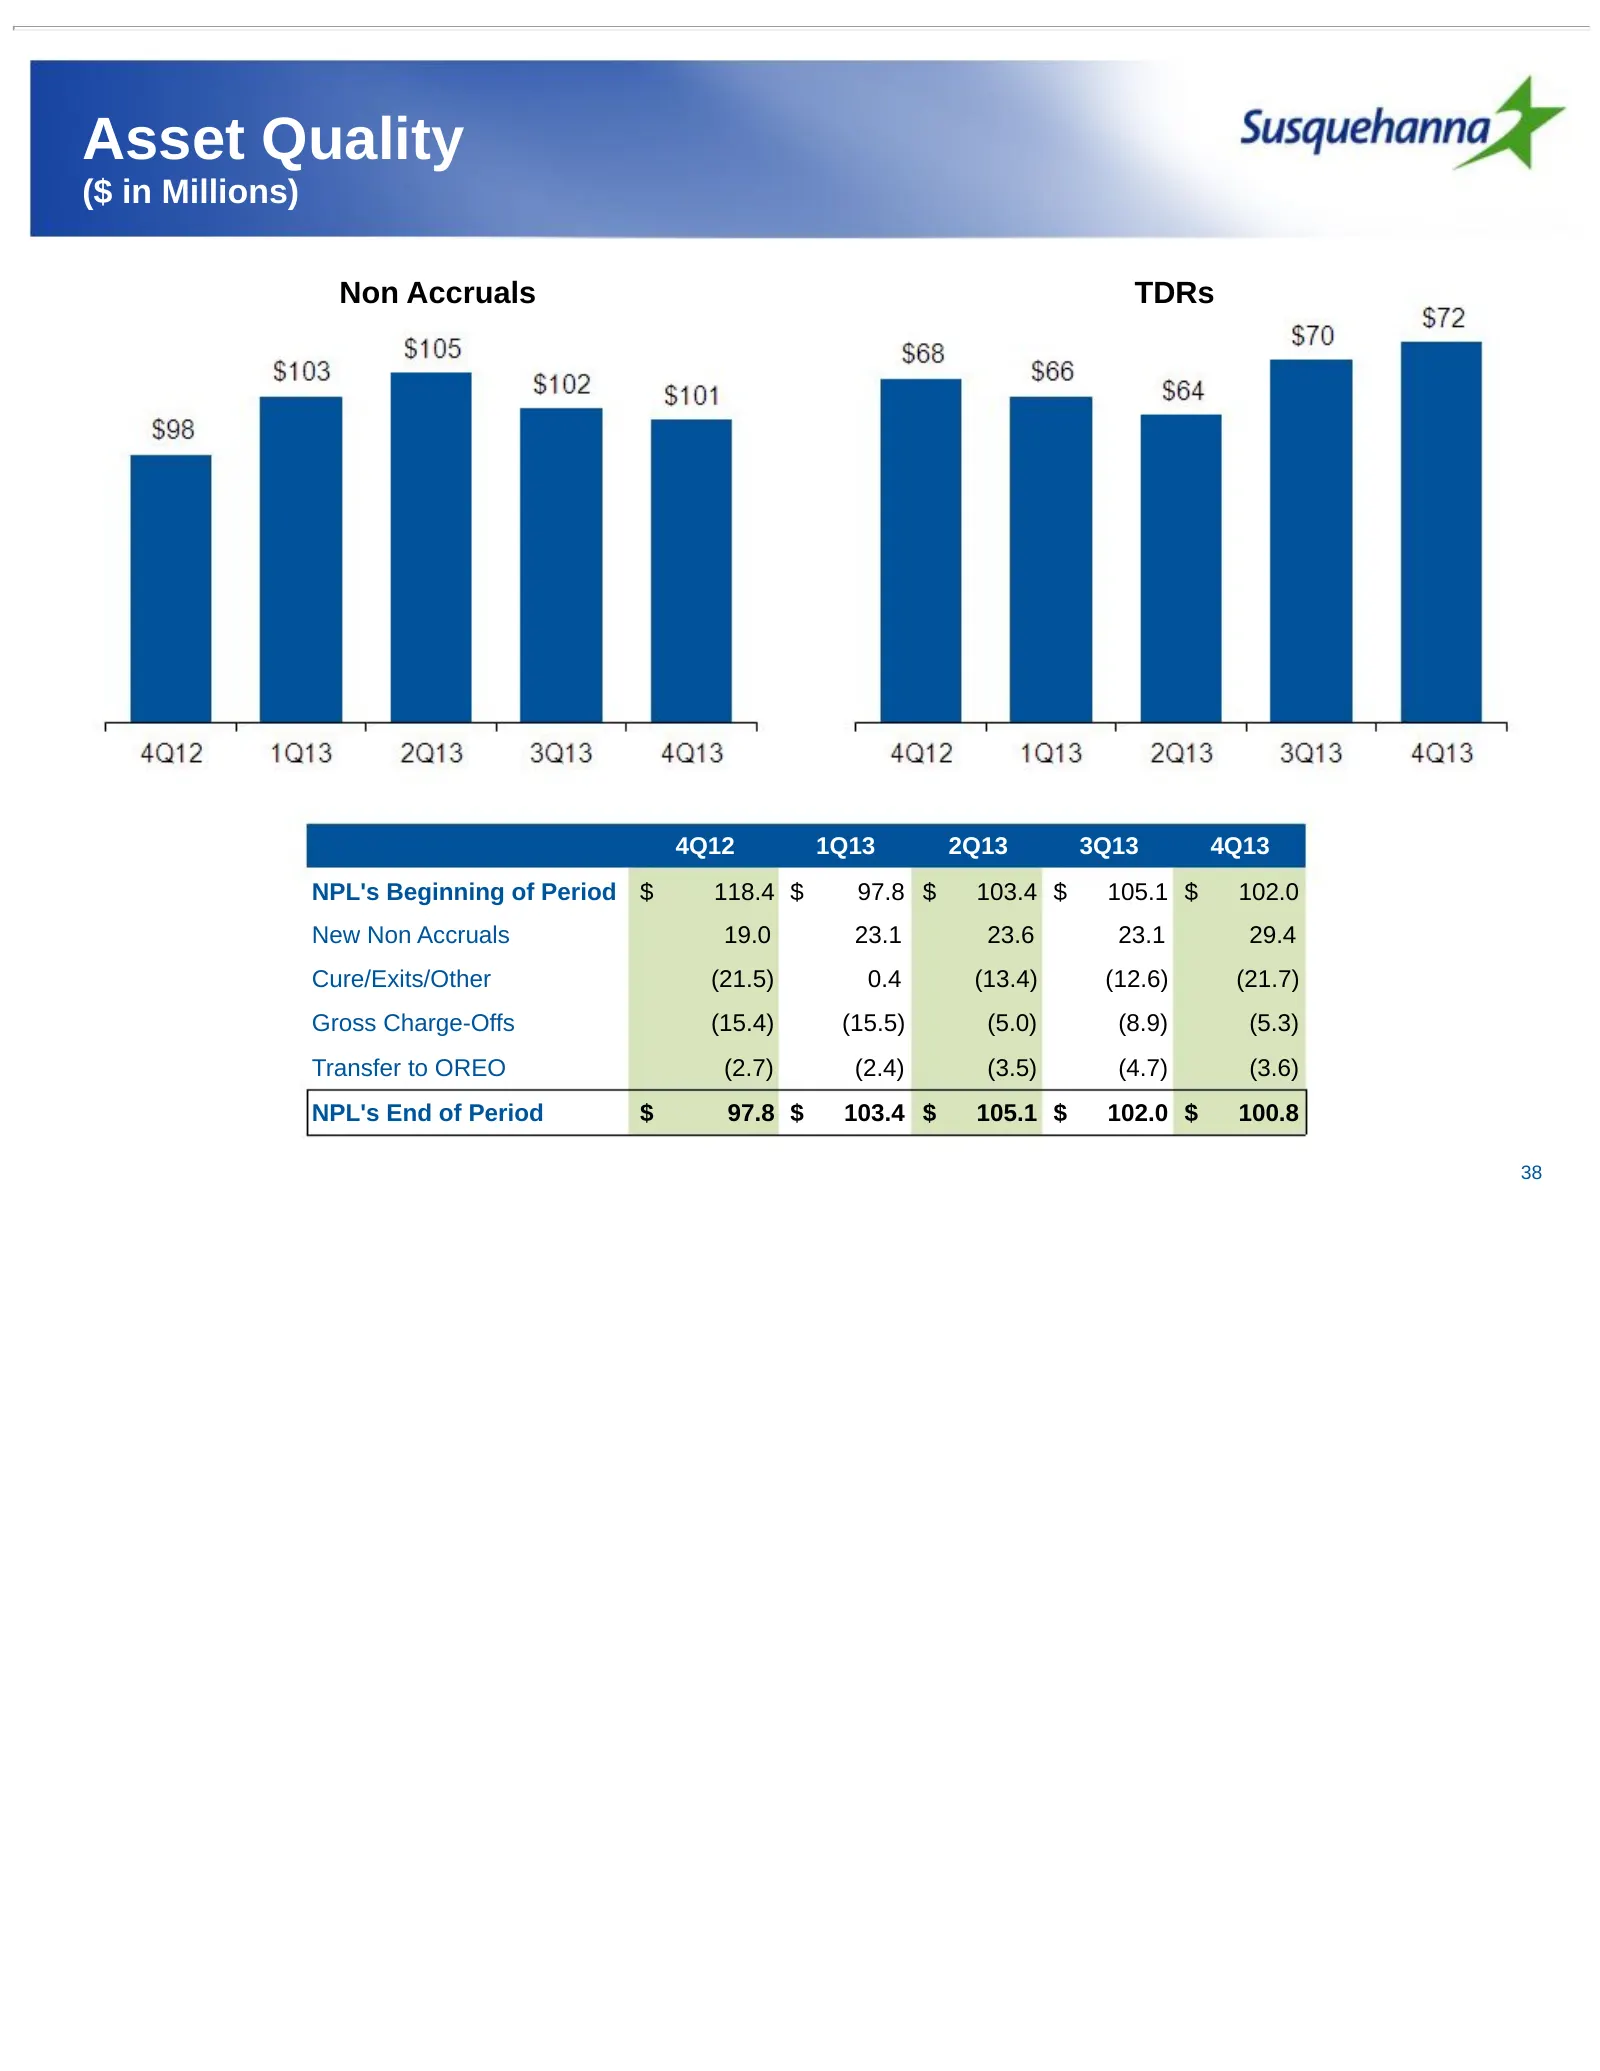
Slide 38: Asset Quality
Asset Quality ($ in Millions) Non Accruals TDRs 4Q12 1Q13 2Q13 3Q13 4Q13 NPL's Beginning of Period $ 118.4 $ 97.8 $ 103.4 $ 105.1 $ 102.0 New Non Accruals 19.0 23.1 23.6 23.1 29.4 Cure/Exits/Other (21.5) 0.4 (13.4) (12.6) (21.7) Gross Charge-Offs (15.4) (15.5) (5.0) (8.9) (5.3) Transfer to OREO (2.7
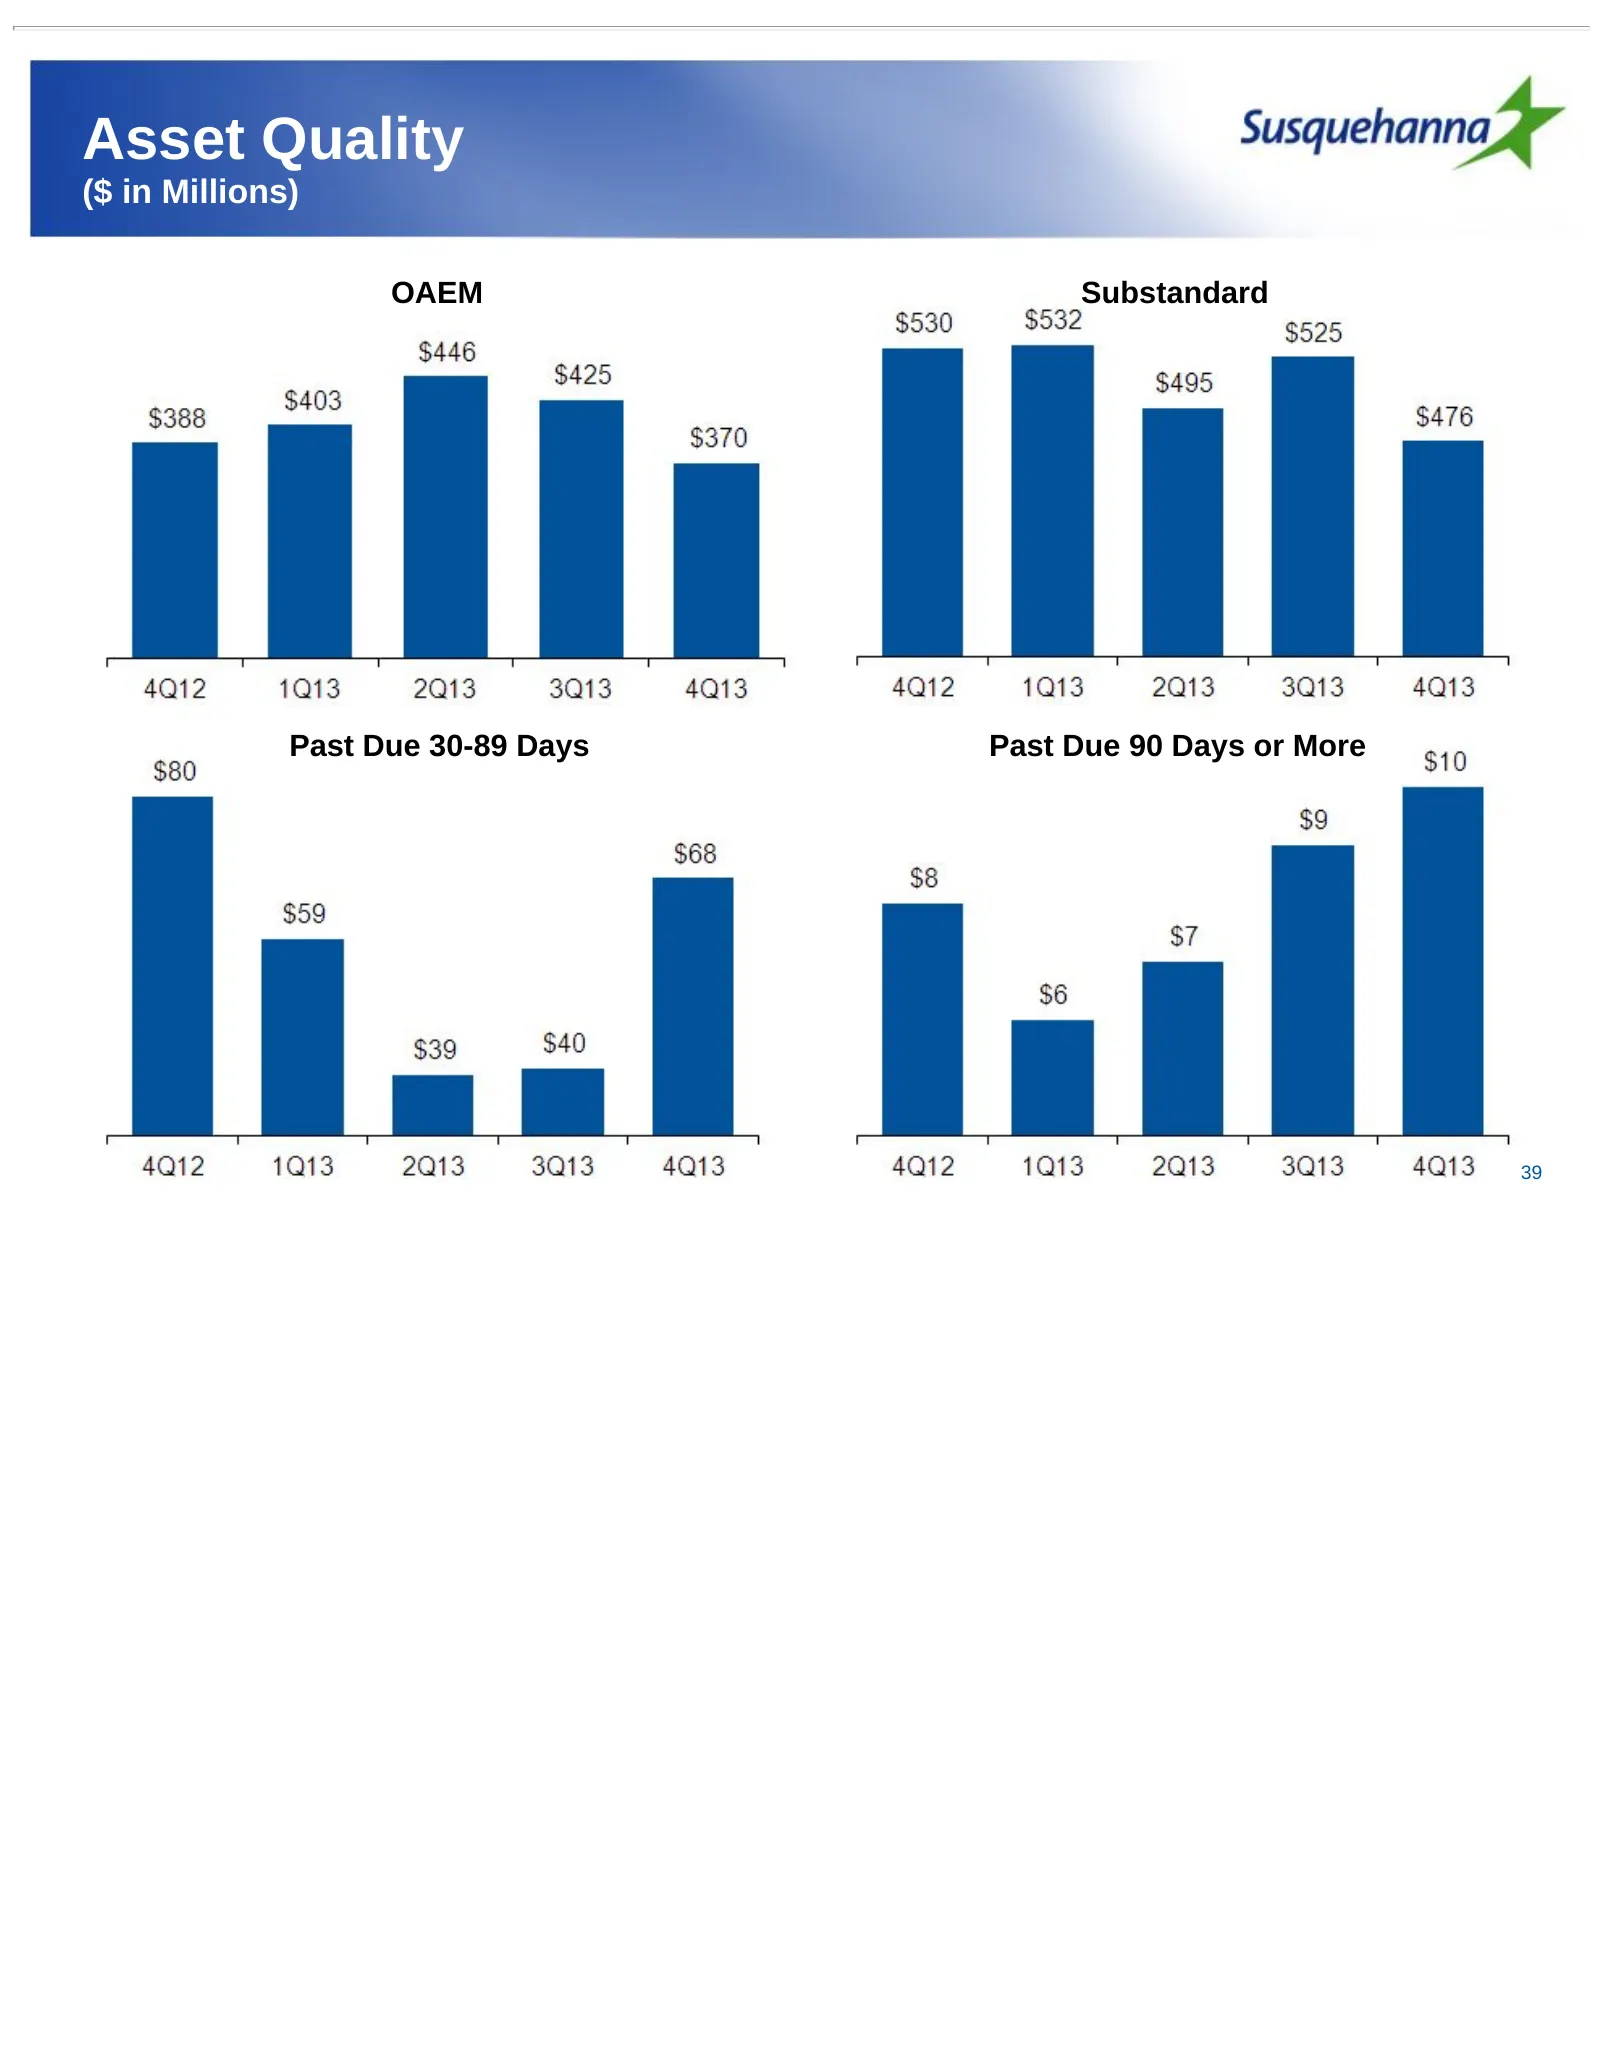
Slide 39: Asset Quality
Asset Quality ($ in Millions) OAEM Substandard Past Due 30-89 Days Past Due 90 Days or More 39
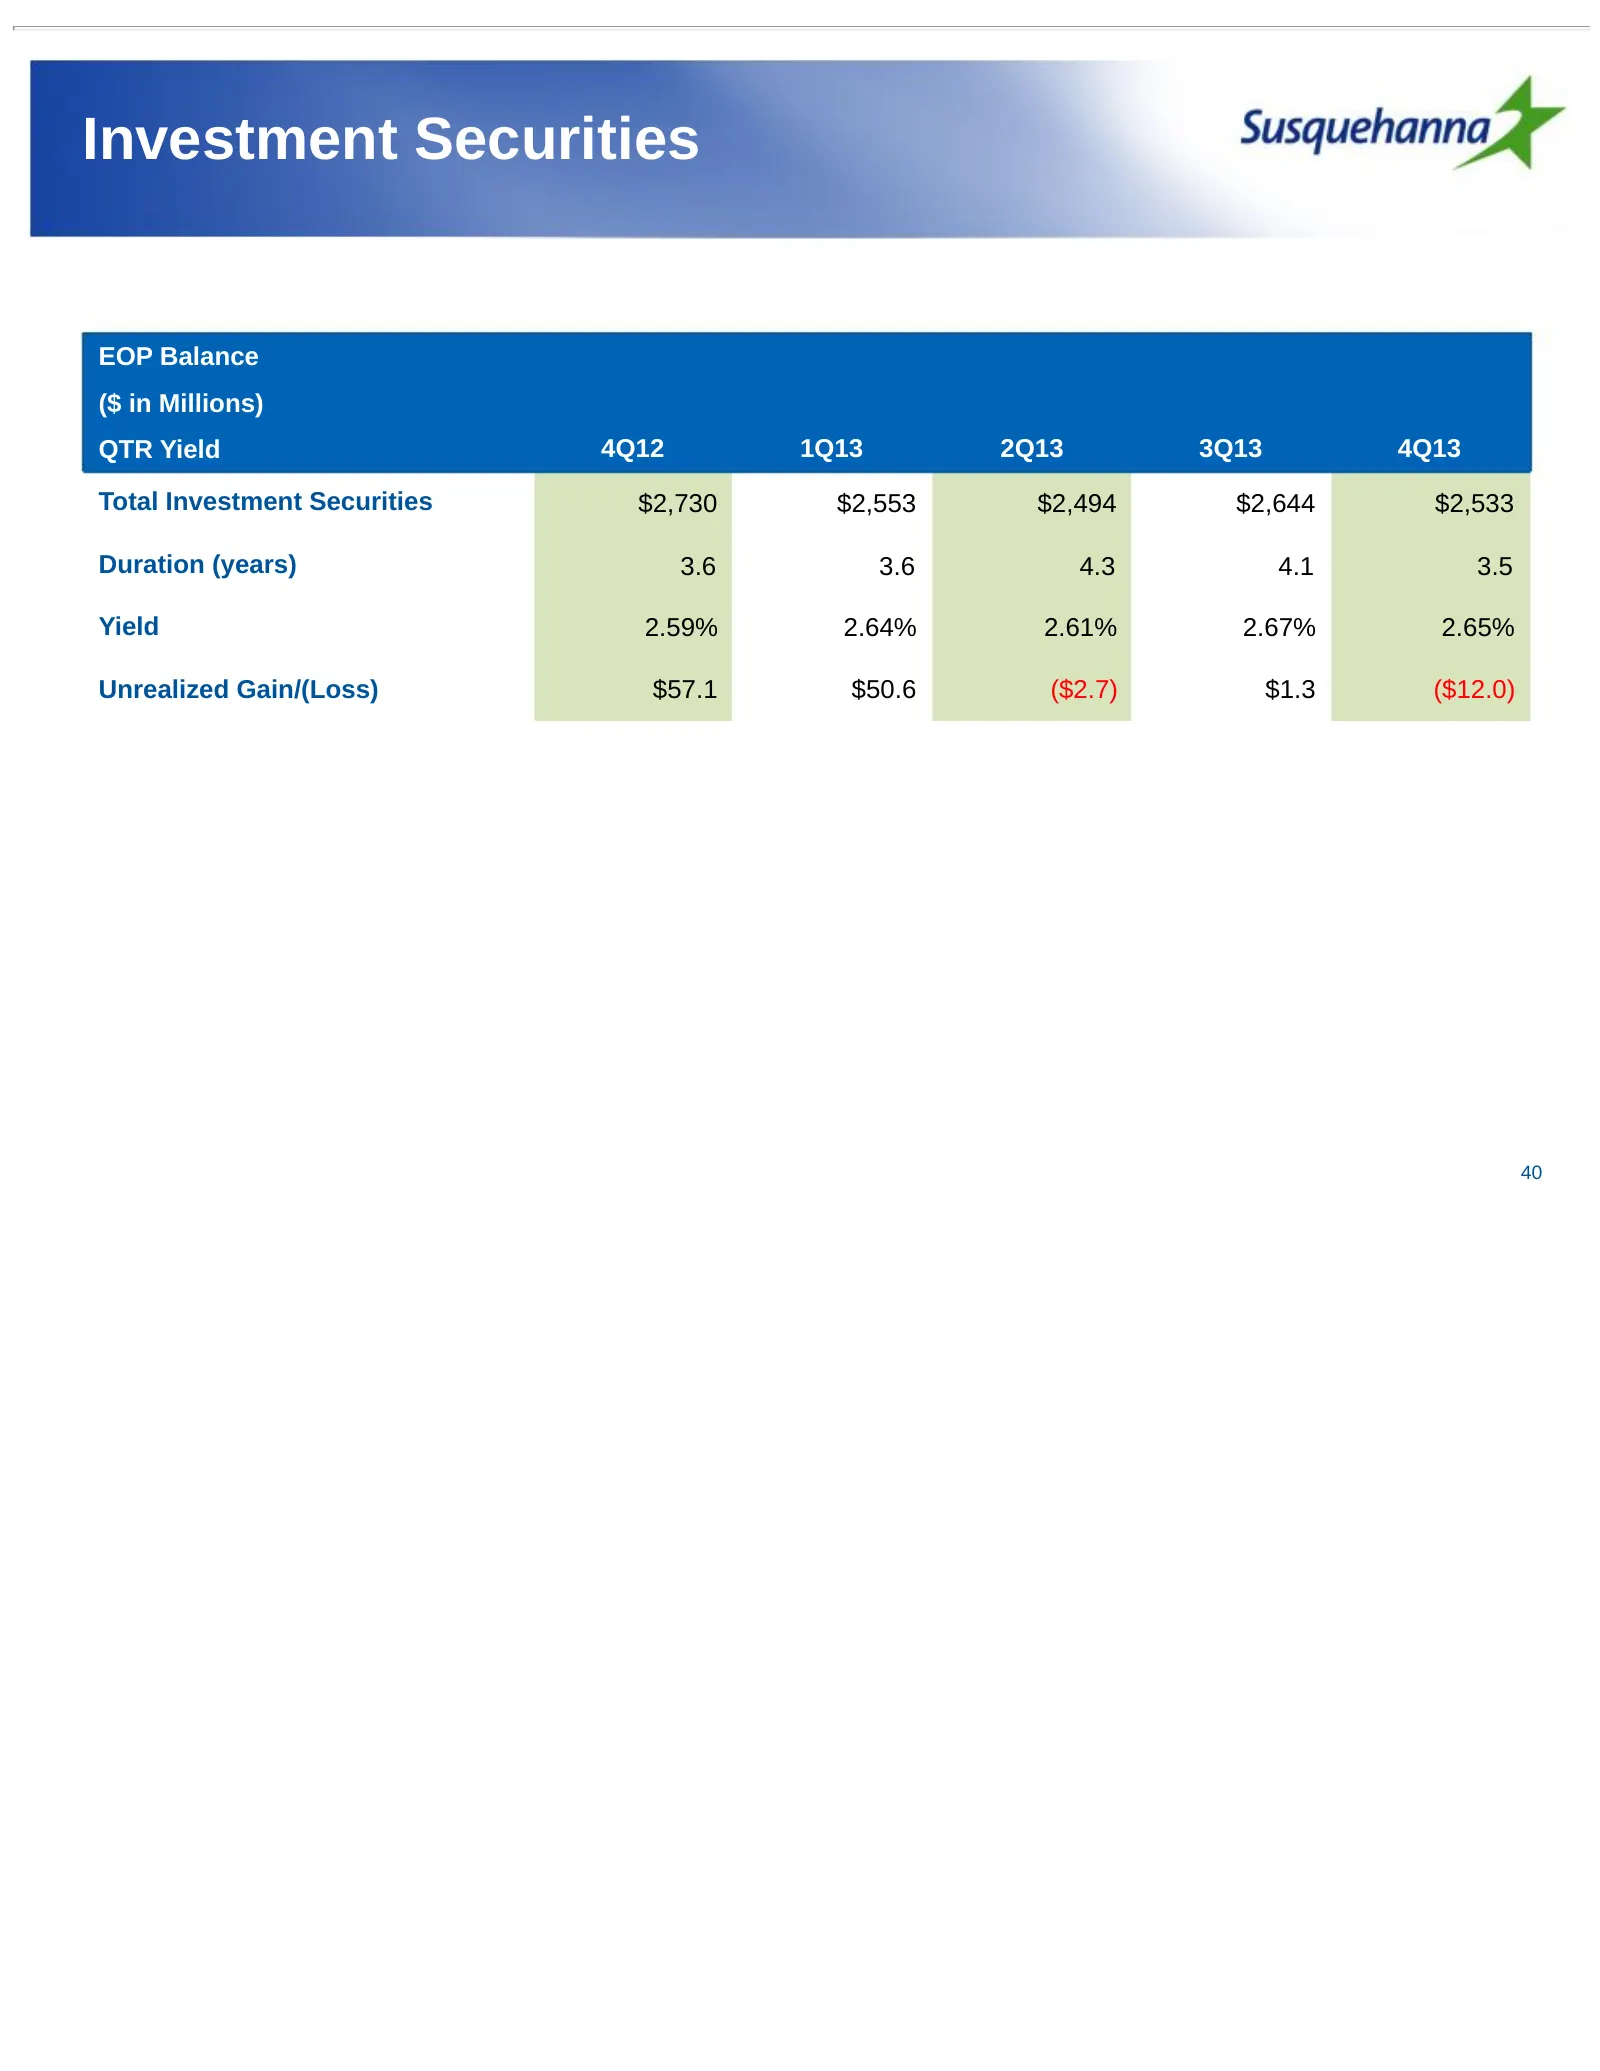
Slide 40: Investment Securities
Investment Securities EOP Balance ($ in Millions) QTR Yield 4Q12 1Q13 2Q13 3Q13 4Q13 Total Investment Securities $2,730 $2,553 $2,494 $2,644 $2,533 Duration (years) 3.6 3.6 4.3 4.1 3.5 Yield 2.59% 2.64% 2.61% 2.67% 2.65% Unrealized Gain/(Loss) $57.1 $50.6 ($2.7) $1.3 ($12.0) 40
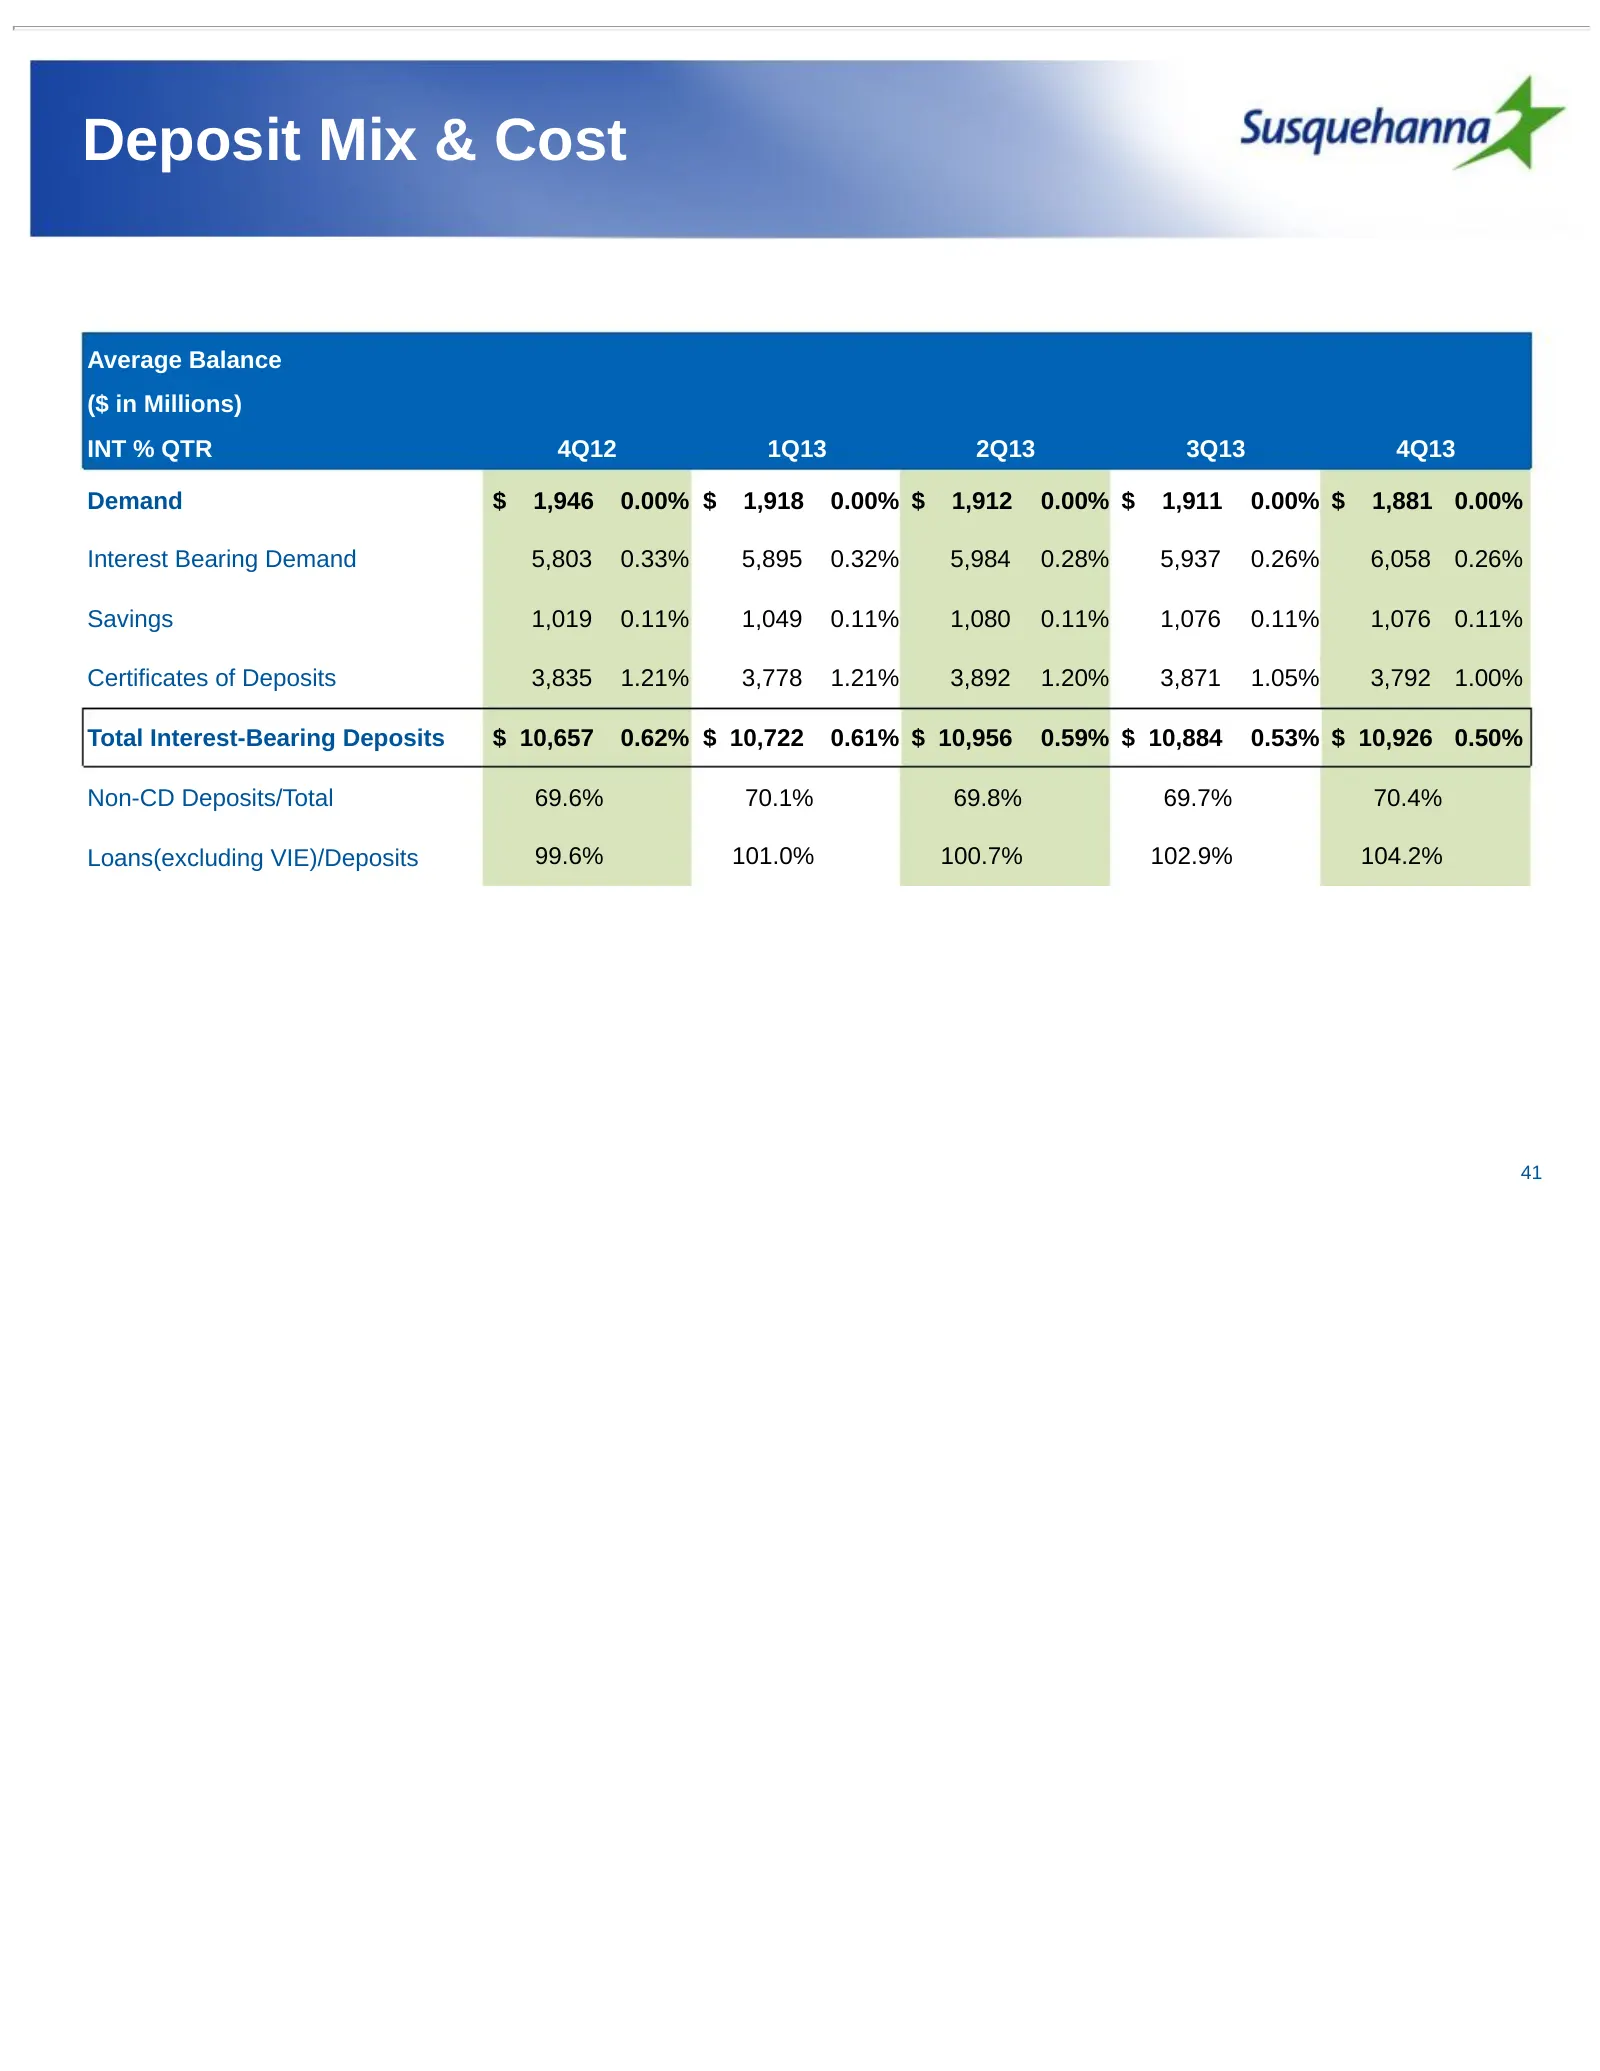
Slide 41: Deposit Mix & Cost
Deposit Mix & Cost Average Balance ($ in Millions) INT % QTR 4Q12 1Q13 2Q13 3Q13 4Q13 Demand $ 1,946 0.00% $ 1,918 0.00% $ 1,912 0.00% $ 1,911 0.00% $ 1,881 0.00% Interest Bearing Demand 5,803 0.33% 5,895 0.32% 5,984 0.28% 5,937 0.26% 6,058 0.26% Savings 1,019 0.11% 1,049 0.11% 1,080 0.11% 1,076 0.1
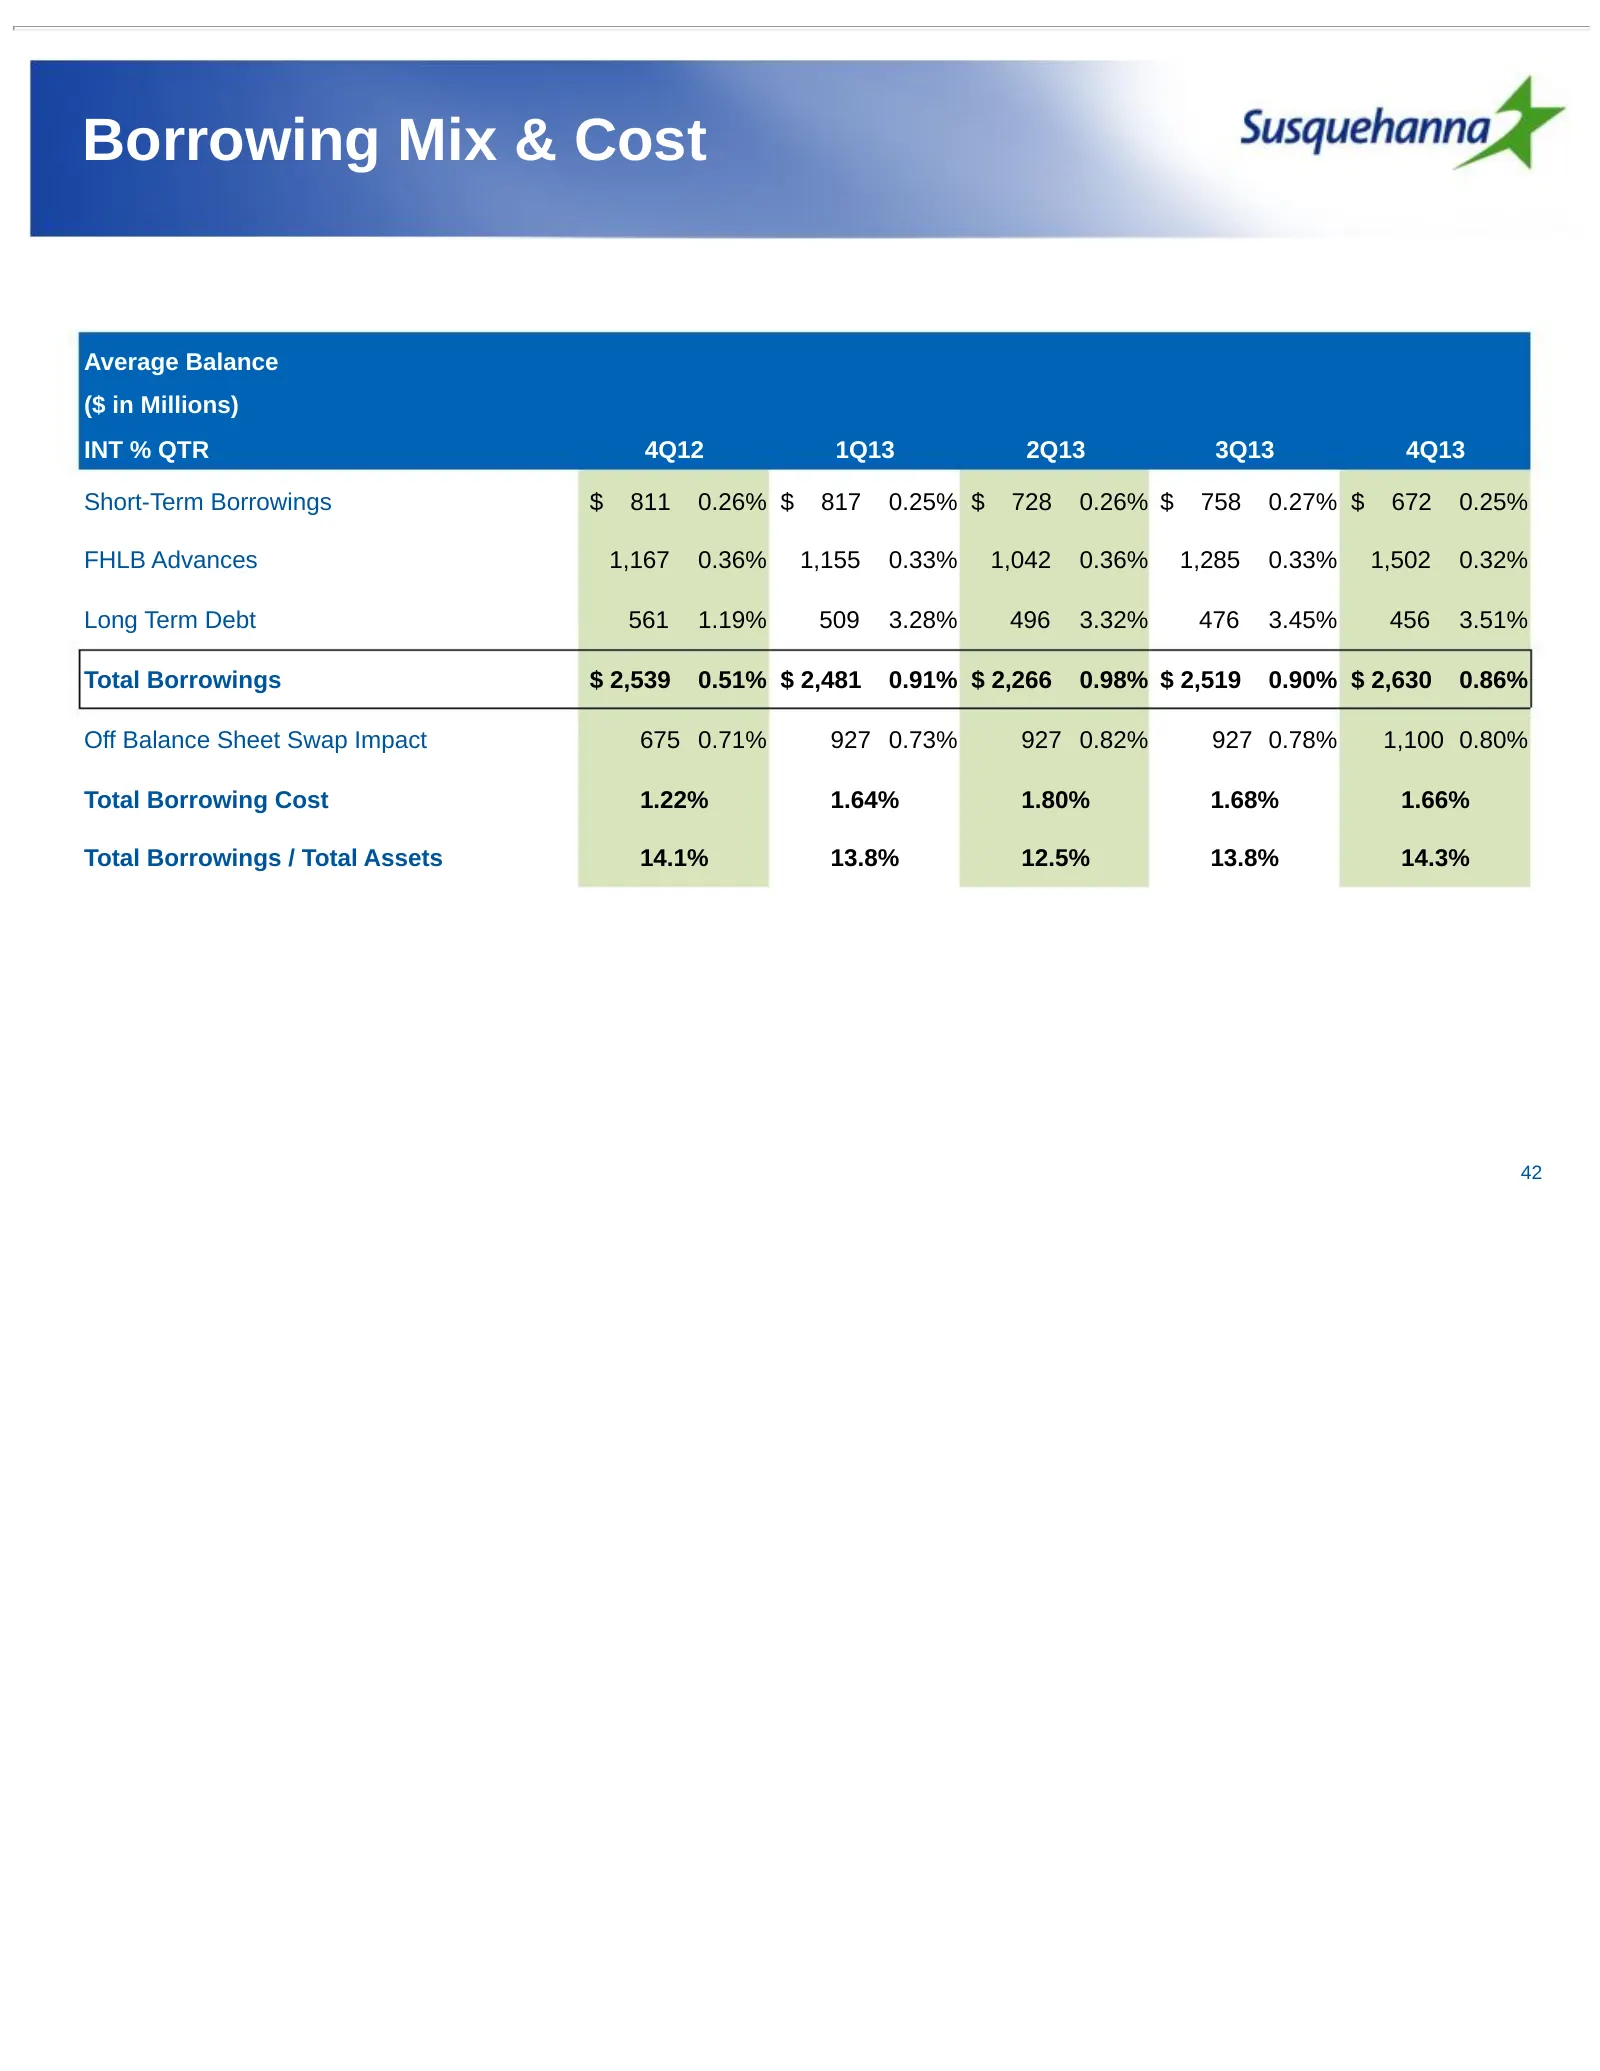
Slide 42: Borrowing Mix & Cost
Borrowing Mix & Cost Average Balance ($ in Millions) INT % QTR 4Q12 1Q13 2Q13 3Q13 4Q13 Short-Term Borrowings $ 811 0.26% $ 817 0.25% $ 728 0.26% $ 758 0.27% $ 672 0.25% FHLB Advances 1,167 0.36% 1,155 0.33% 1,042 0.36% 1,285 0.33% 1,502 0.32% Long Term Debt 561 1.19% 509 3.28% 496 3.32% 476 3.45% 4
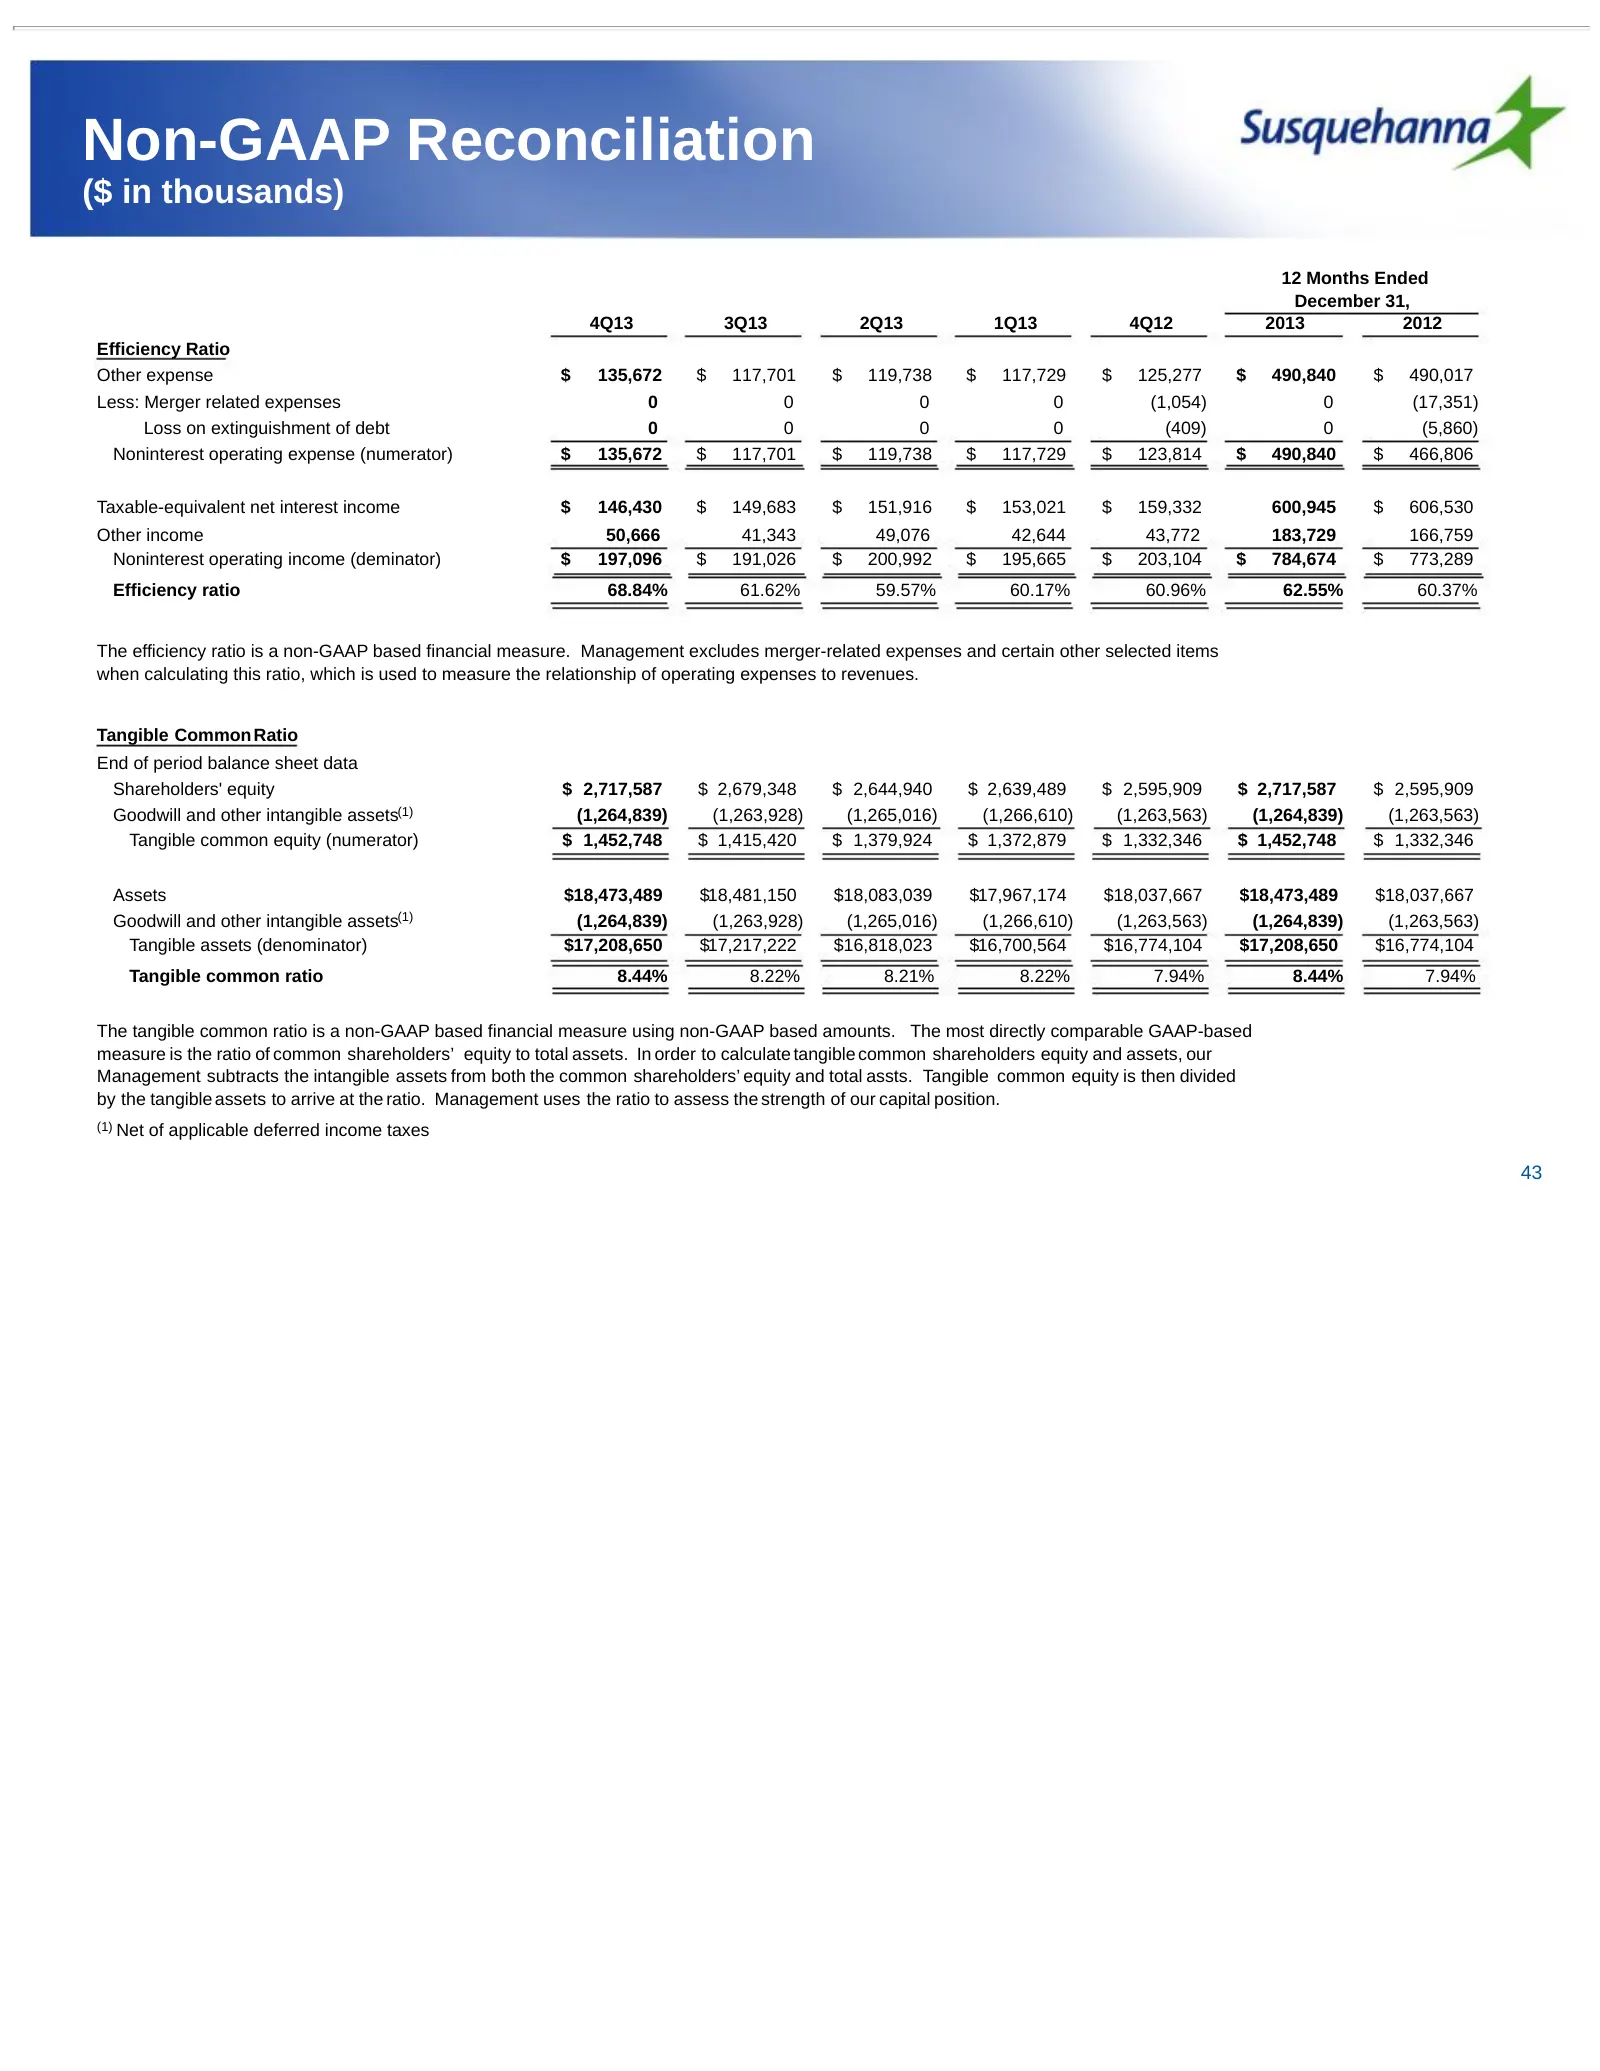
Slide 43: Non-GAAP Reconciliation
Non-GAAP Reconciliation ($ in thousands) 12 Months Ended December 31, 4Q13 3Q13 2Q13 1Q13 4Q12 2013 2012 Efficiency Ratio Other expense $ 135,672 $ 117,701 $ 119,738 $ 117,729 $ 125,277 $ 490,840 $ 490,017 Less: Merger related expenses 0 0 0 0 (1,054) 0 (17,351) Loss on extinguishment of debt 0 0 0
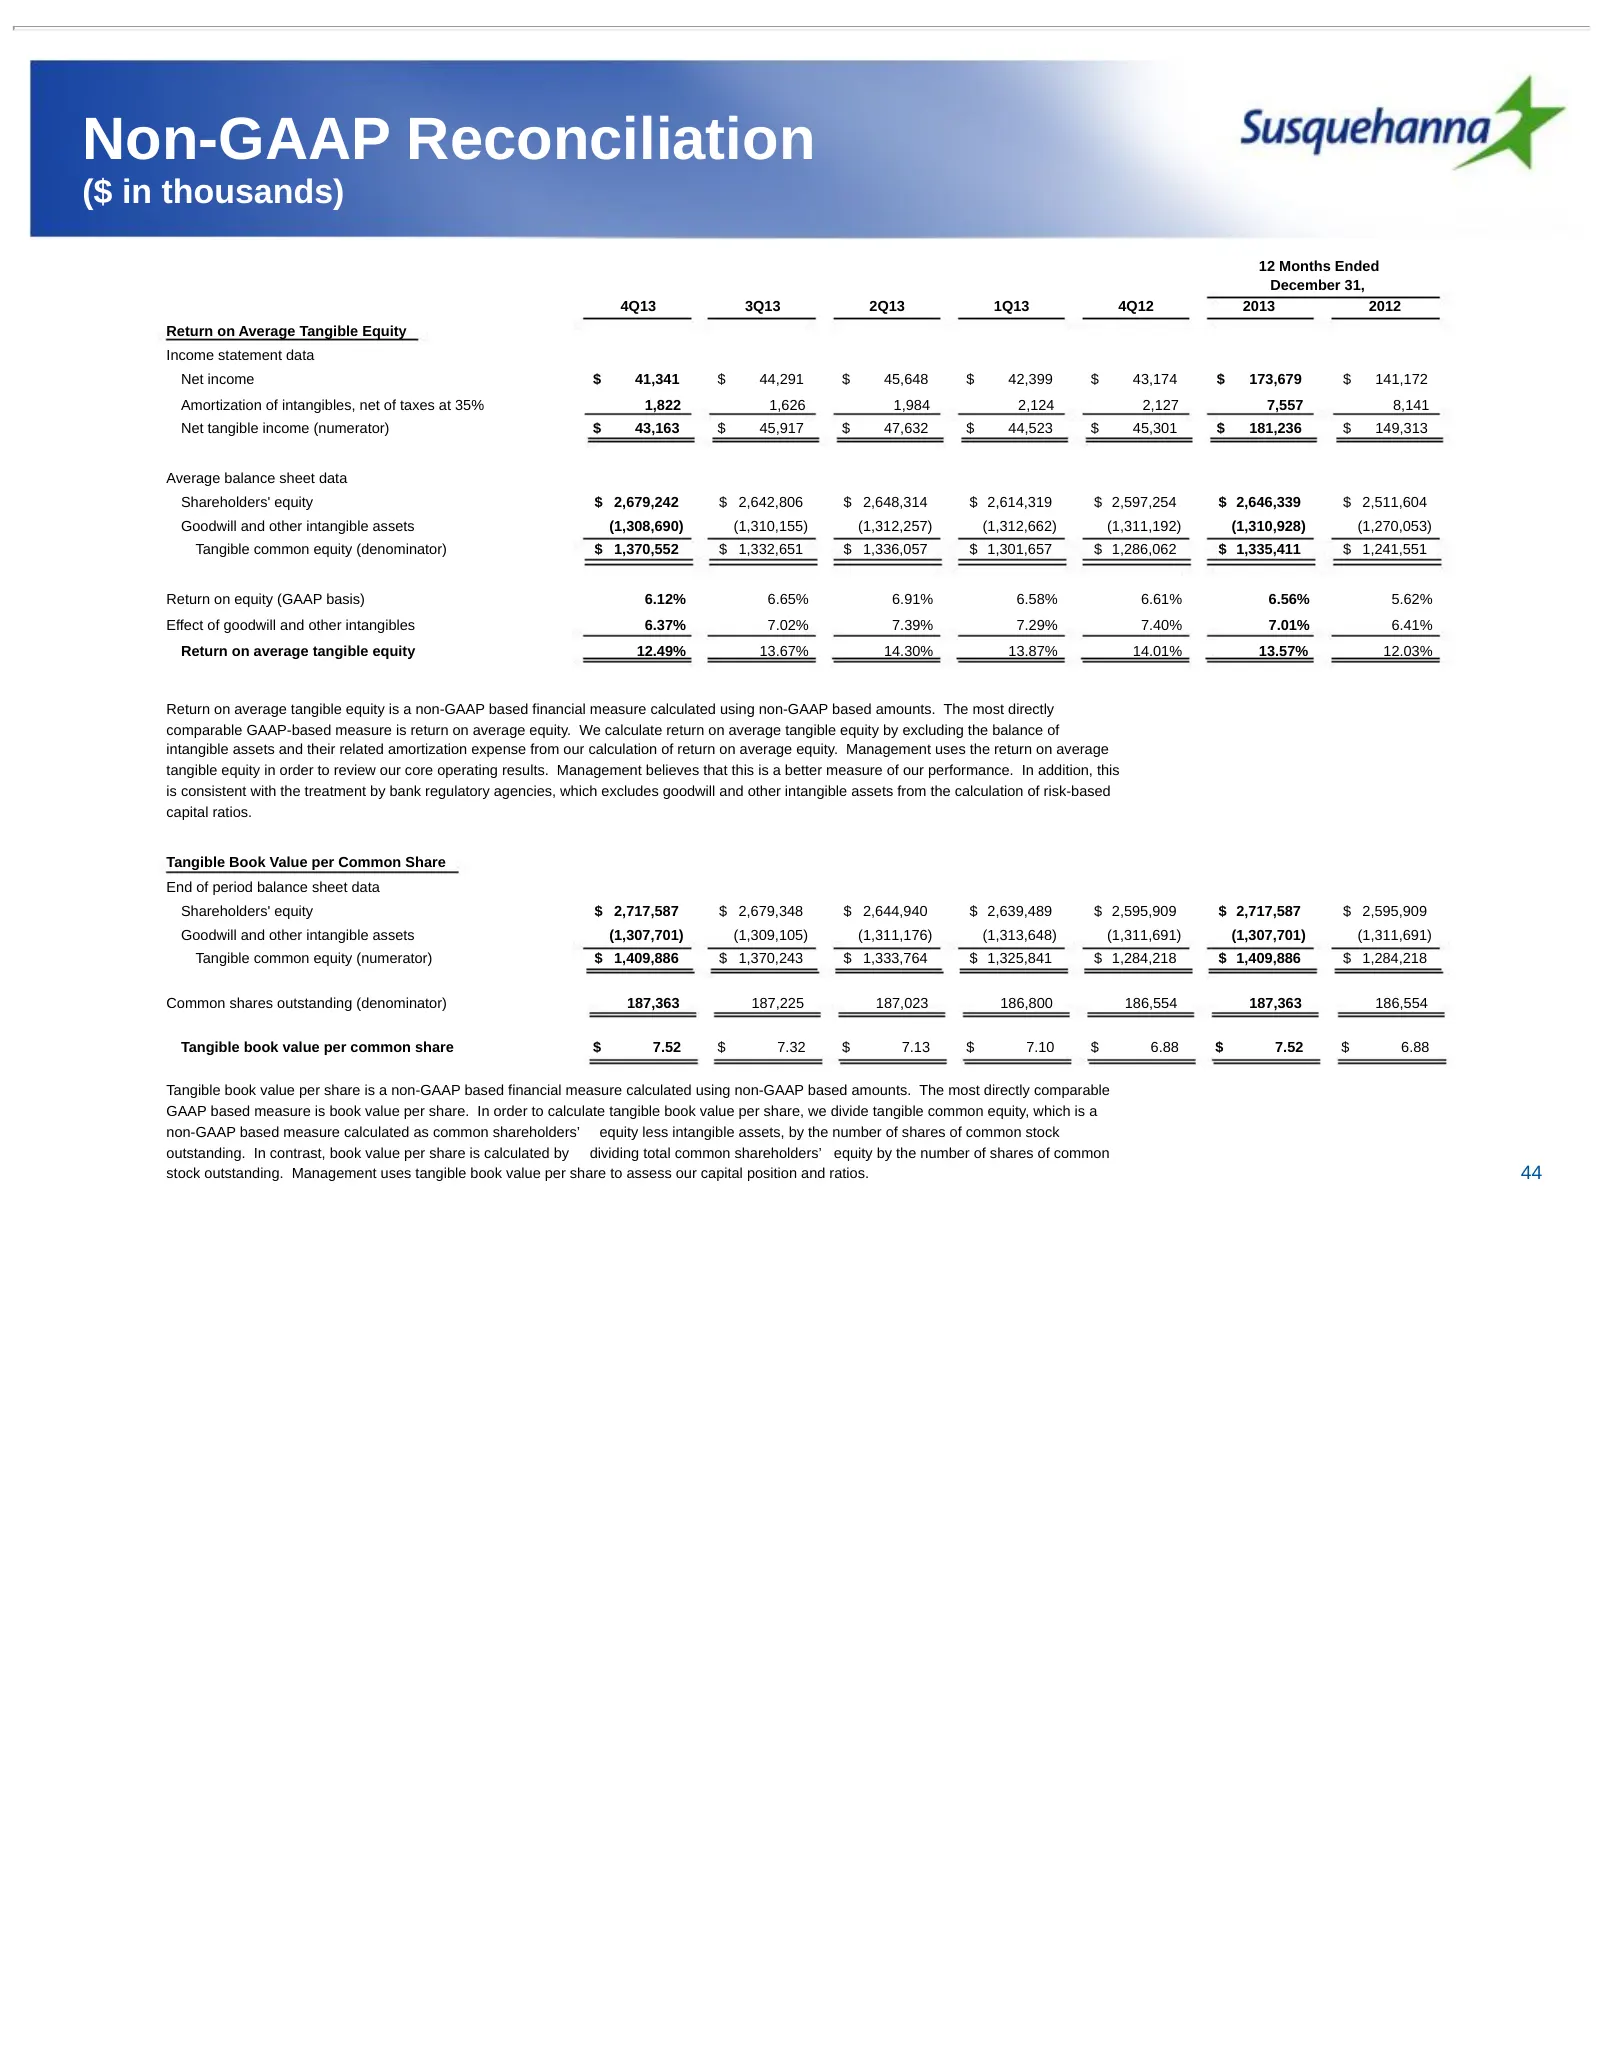
Slide 44: Non-GAAP Reconciliation
Non-GAAP Reconciliation ($ in thousands) 12 Months Ended December 31, 4Q13 3Q13 2Q13 1Q13 4Q12 2013 2012 Return on Average Tangible Equity Income statement data Net income $ 41,341 $ 44,291 $ 45,648 $ 42,399 $ 43,174 $ 173,679 $ 141,172 Amortization of intangibles, net of taxes at 35% 1,822 1,626 1,
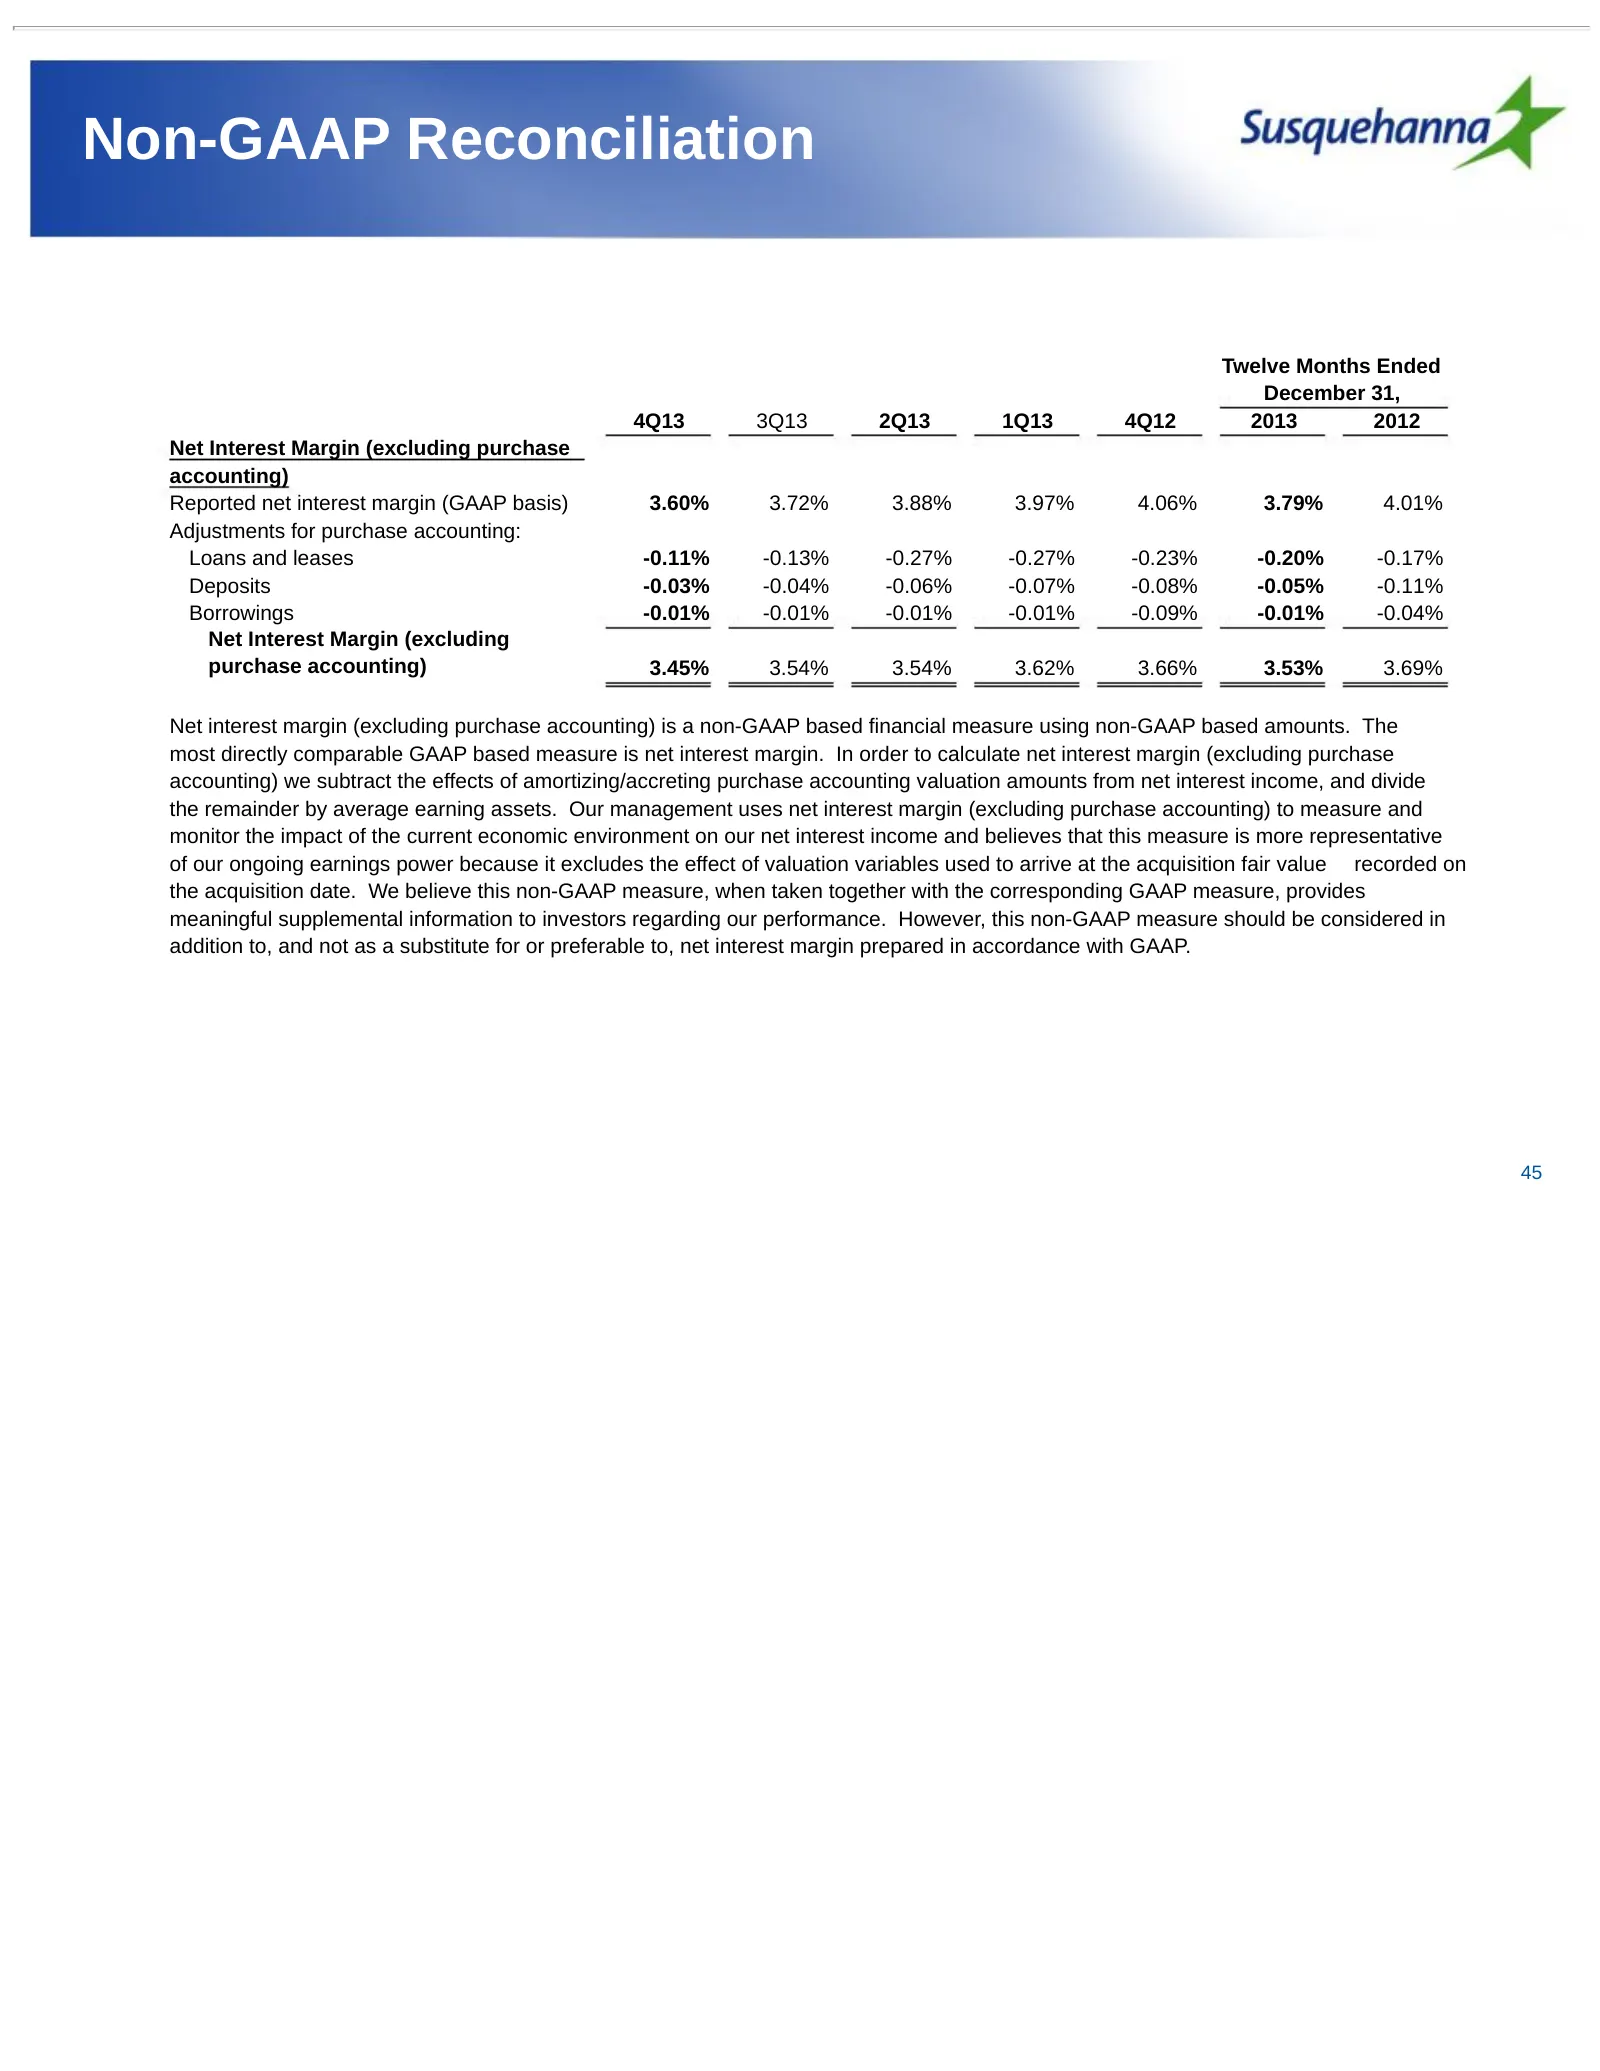
Slide 45: Non-GAAP Reconciliation
Non-GAAP Reconciliation Twelve Months Ended December 31, 4Q13 3Q13 2Q13 1Q13 4Q12 2013 2012 Net Interest Margin (excluding purchase accounting) Reported net interest margin (GAAP basis) 3.60% 3.72% 3.88% 3.97% 4.06% 3.79% 4.01% Adjustments for purchase accounting: Loans and leases -0.11% -0.13% -0.2
Source: SEC EDGAR · 8-K filed Feb 7, 2014
More decks from Susquehanna Bancshares Inc
 Investor Presentation (December 2014)51 slides · Dec 3, 2014
 Merger or Acquisition (November 2014)28 slides · Nov 17, 2014
 Merger or Acquisition (November 2014)13 slides · Nov 12, 2014
 Q2 2014 Earnings Presentation46 slides · Aug 11, 2014
 Investor Presentation (May 2014)44 slides · May 5, 2014
 Shareholder Meeting (May 2014)35 slides · May 2, 2014