Santander Consumer USA Holdings Inc
Santander Consumer USA — Q3 2017 Earnings Presentation
29 slides from Santander Consumer USA's earnings presentation, Oct 27, 2017

Slide 1: Santander Consumer USA Holdings Inc. Third Quarter 2017
10.27.2017 SANTANDER CONSUMER USA HOLDINGS INC. Third Quarter 2017
Slide 2: Important Information: Forward-Looking Statements
2IMPORTANT INFORMATION Forward-Looking Statements This presentation contains forward-looking statements within the meaning of the Private Securities Litigation Reform Act of 1995. Any statements about our expectations, beliefs, plans, predictions, forecasts, objectives, assumptions, or future events
Slide 3: Q3 2017 Highlights
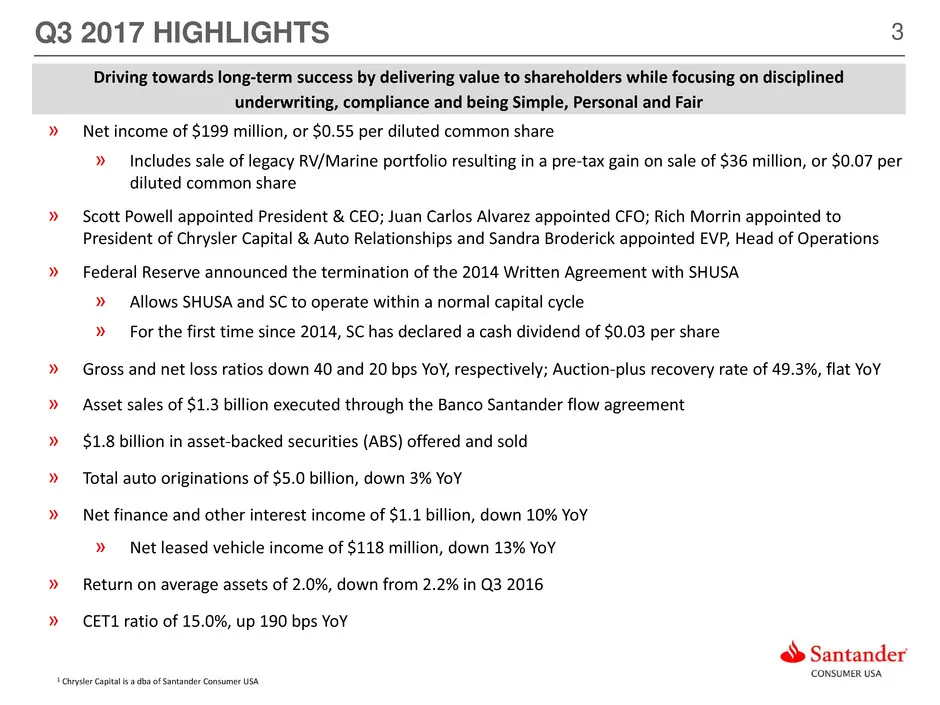
3 » Net income of $199 million, or $0.55 per diluted common share » Includes sale of legacy RV/Marine portfolio resulting in a pre-tax gain on sale of $36 million, or $0.07 per diluted common share » Scott Powell appointed President & CEO; Juan Carlos Alvarez appointed CFO; Rich Morrin appointed to
Slide 4: Economic Indicators
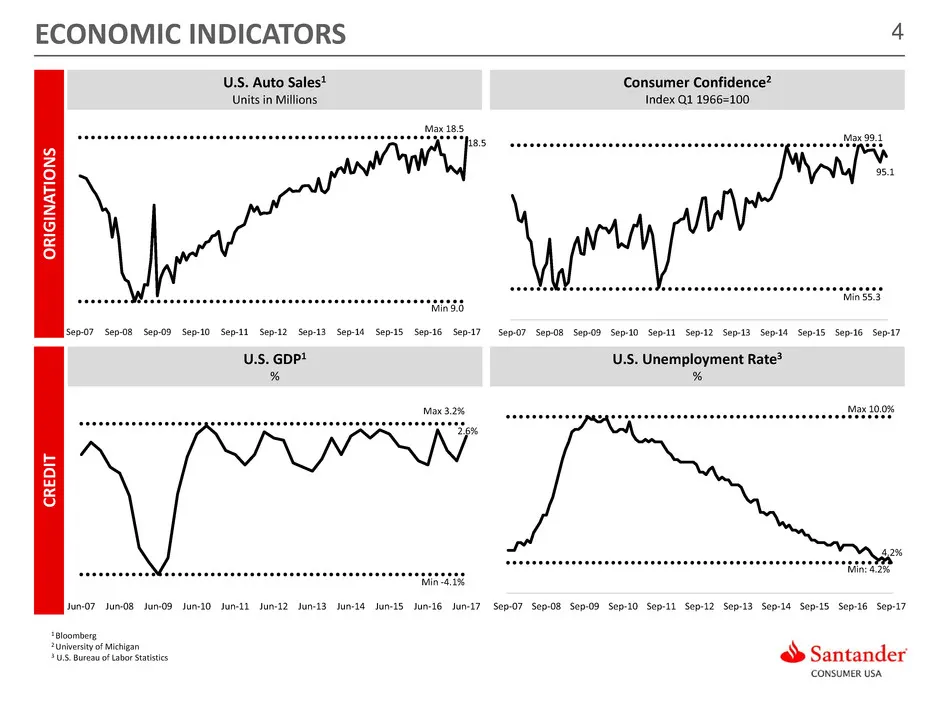
4ECONOMIC INDICATORS U.S. Auto Sales1 Units in Millions 1 Bloomberg 2 University of Michigan 3 U.S. Bureau of Labor Statistics Consumer Confidence2 Index Q1 1966=100 U.S. GDP1 % U.S. Unemployment Rate3 % O R IG IN AT IO N S CR ED IT Max 18.5 18.5 Min 9.0 Sep-07 Sep-08 Sep-09 Sep-10 Sep-11 Sep-12 Sep
Slide 5: Auto Industry Analysis
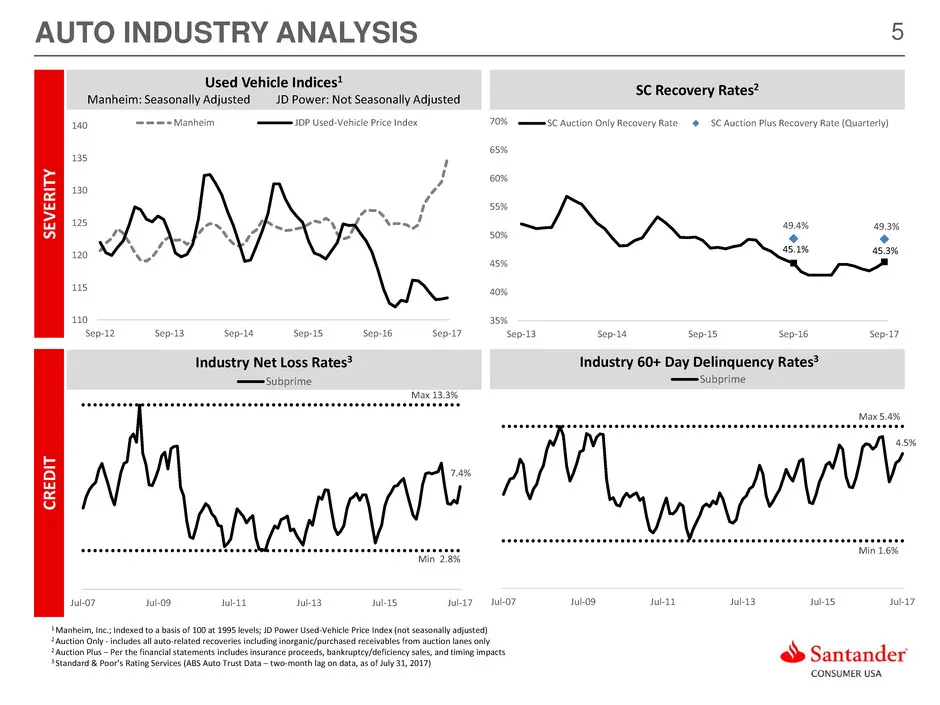
5 45.1% 45.3% 49.4% 49.3% 35% 40% 45% 50% 55% 60% 65% 70% Sep-13 Sep-14 Sep-15 Sep-16 Sep-17 SC Auction Only Recovery Rate SC Auction Plus Recovery Rate (Quarterly) 100 105 110 115 120 125 130 135 110 115 120 125 130 135 140 Sep-12 Sep-13 Sep-14 Sep-15 Sep-16 Sep-17 Manheim (Left Axis) JDP Used-Vehi
Slide 6: Vehicle Finance: Four Pillars of Our Focused Business Model
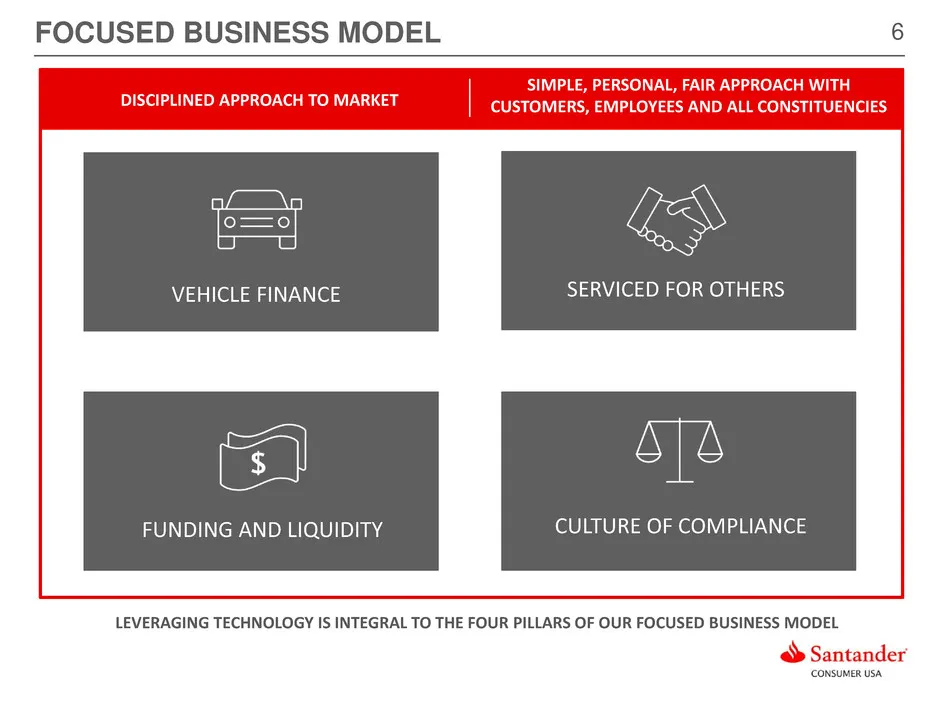
6 VEHICLE FINANCE LEVERAGING TECHNOLOGY IS INTEGRAL TO THE FOUR PILLARS OF OUR FOCUSED BUSINESS MODEL FOCUSED BUSINESS MODEL DISCIPLINED APPROACH TO MARKET SIMPLE, PERSONAL, FAIR APPROACH WITH CUSTOMERS, EMPLOYEES AND ALL CONSTITUENCIES SERVICED FOR OTHERS FUNDING AND LIQUIDITY CULTURE OF COMPLIANCE
Slide 7: Diversified Underwriting Across the Credit Spectrum
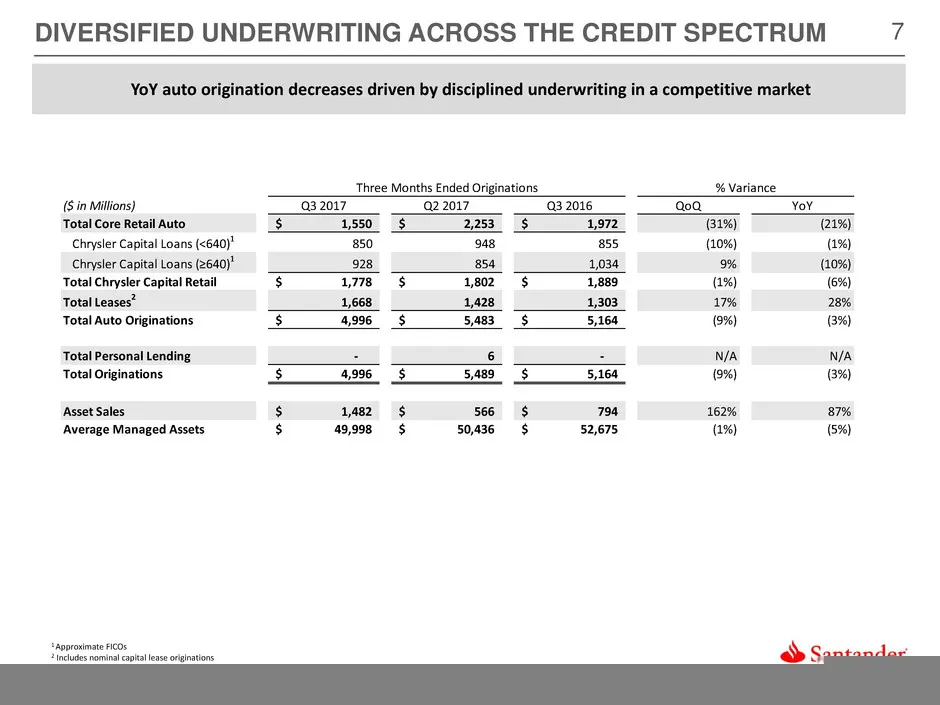
7DIVERSIFIED UNDERWRITING ACROSS THE CREDIT SPECTRUM YoY auto origination decreases driven by disciplined underwriting in a competitive market ($ in Millions) Q3 2017 Q2 2017 Q3 2016 QoQ YoY Total Core Retail Auto 1,550$ 2,253$ 1,972$ (31%) (21%) Chrysler Capital Loans (<640)1 850 948 855 (10%) (1%)
Slide 8: Diversified Underwriting Across Full Credit Spectrum
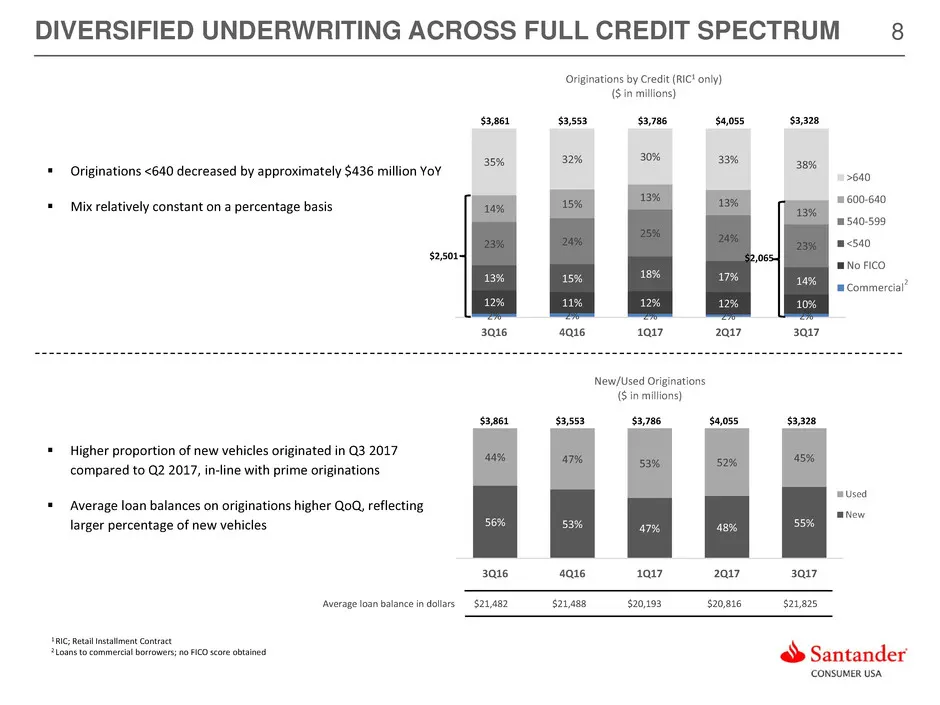
8 2% 2% 2% 2% 2% 12% 11% 12% 12% 10% 13% 15% 18% 17% 14% 23% 24% 25% 24% 23% 14% 15% 13% 13% 13% 35% 32% 30% 33% 38% 3Q16 4Q16 1Q17 2Q17 3Q17 Originations by Credit (RIC1 only) ($ in millions) >640 600-640 540-599 <540 No FICO Commercial 56% 53% 47% 48% 55% 44% 47% 53% 52% 45% 3Q16 4Q16 1Q17 2Q17 3Q
Slide 9: Chrysler Capital
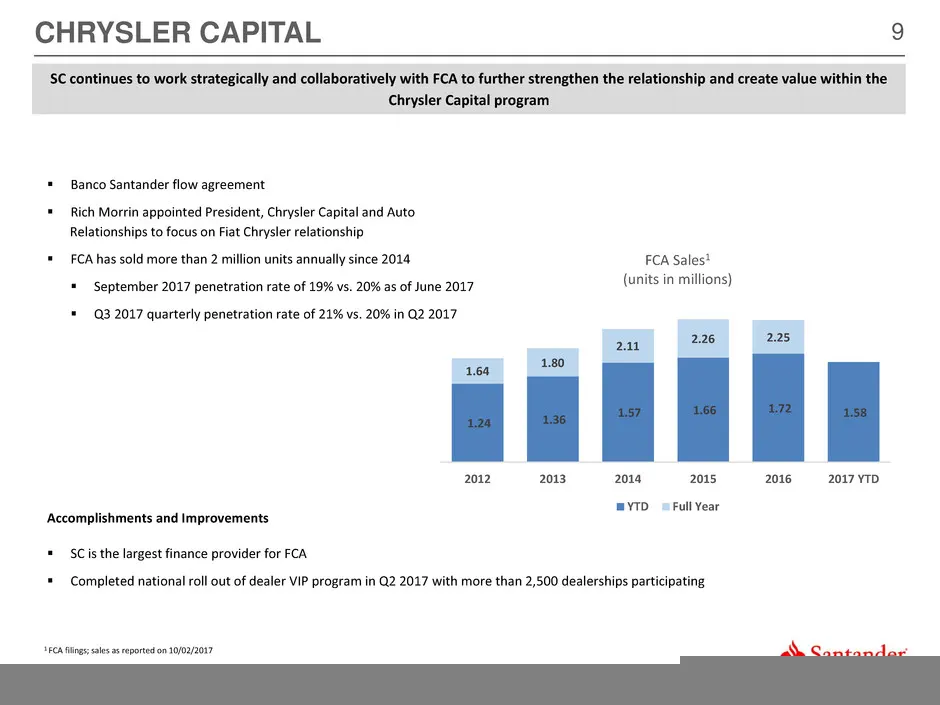
9 Banco Santander flow agreement Rich Morrin appointed President, Chrysler Capital and Auto Relationships to focus on Fiat Chrysler relationship FCA has sold more than 2 million units annually since 2014 September 2017 penetration rate of 19% vs. 20% as of June 2017 Q3 2017 quarterly penet
Slide 10: Serviced for Others (SFO) Platform
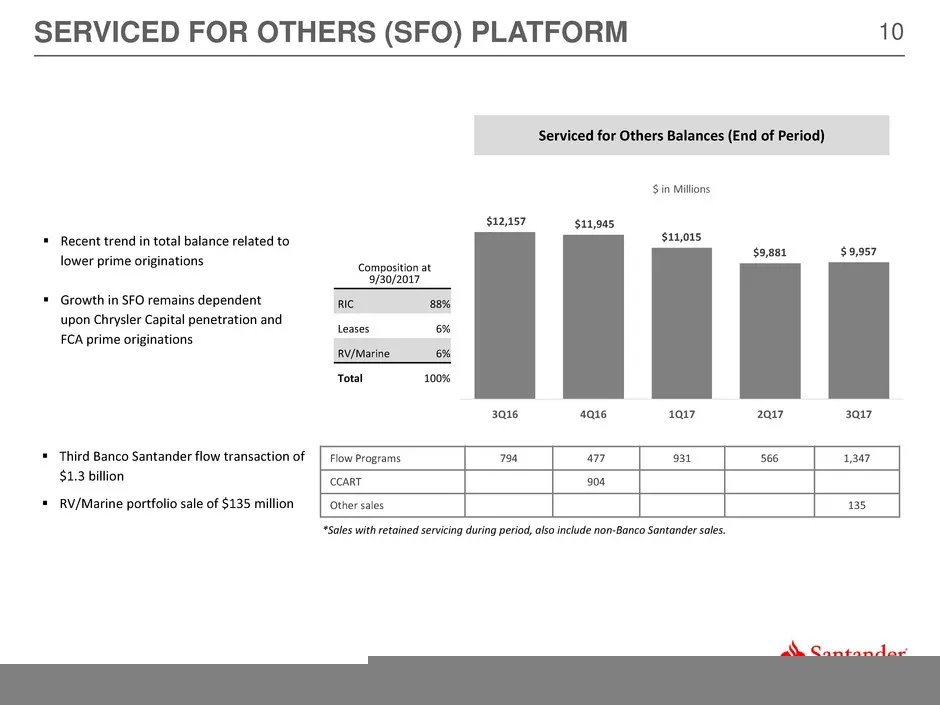
10 Flow Programs 794 477 931 566 1,347 CCART 904 Other sales 135 Recent trend in total balance related to lower prime originations Growth in SFO remains dependent upon Chrysler Capital penetration and FCA prime originations SERVICED FOR OTHERS (SFO) PLATFORM Composition at 9/30/2017 RIC 88% Leas
Slide 11: Income Statement Summary
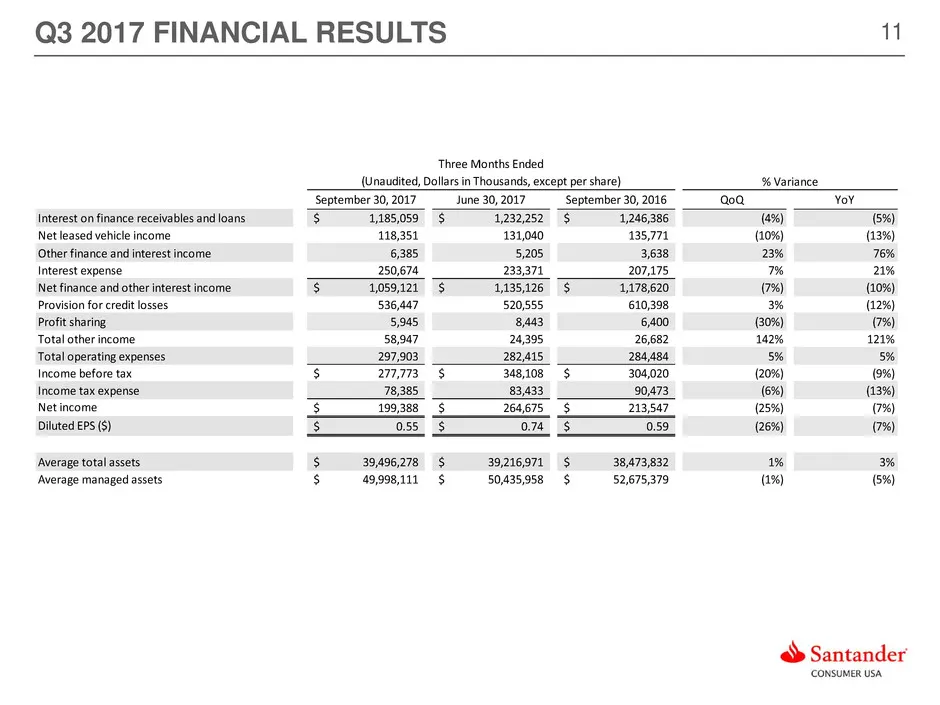
11 September 30, 2017 June 30, 2017 September 30, 2016 QoQ YoY Interest on finance receivables and loans 1,185,059$ 1,232,252$ 1,246,386$ (4%) (5%) Net leased vehicle income 118,351 131,040 135,771 (10%) (13%) Other finance and interest income 6,385 5,205 3,638 23% 76% Interest expense 250,674 233,3
Slide 12: Income Statement Excluding Personal Lending
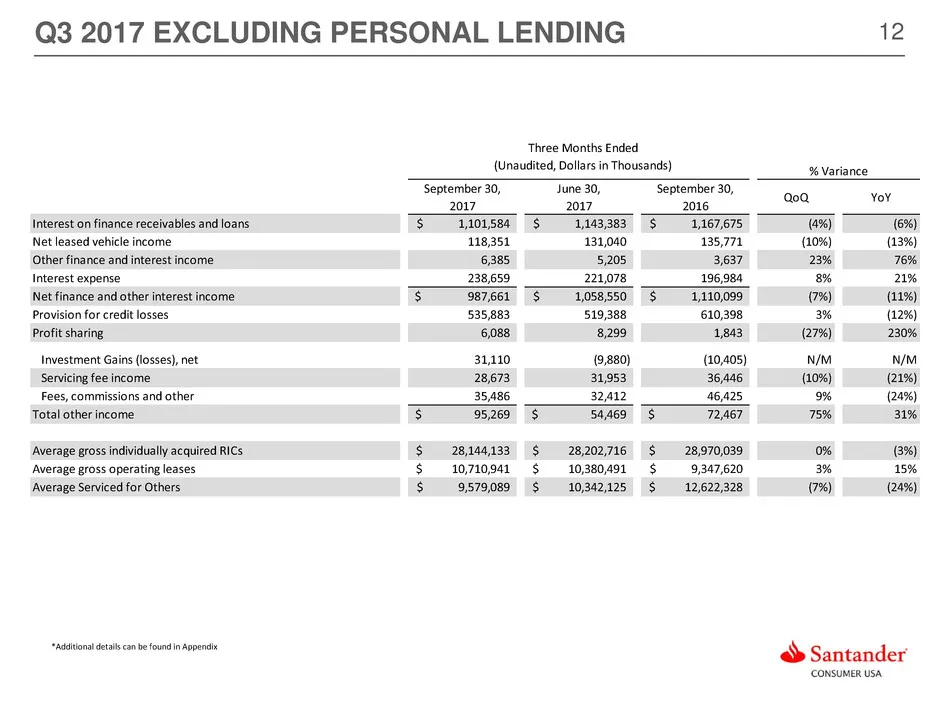
12 September 30, 2017 June 30, 2017 September 30, 2016 QoQ YoY Interest on finance receivables and loans 1,101,584$ 1,143,383$ 1,167,675$ (4%) (6%) Net leased vehicle income 118,351 131,040 135,771 (10%) (13%) Other finance and interest income 6,385 5,205 3,637 23% 76% Interest expense 238,659 221,0
Slide 13: Total Other Income
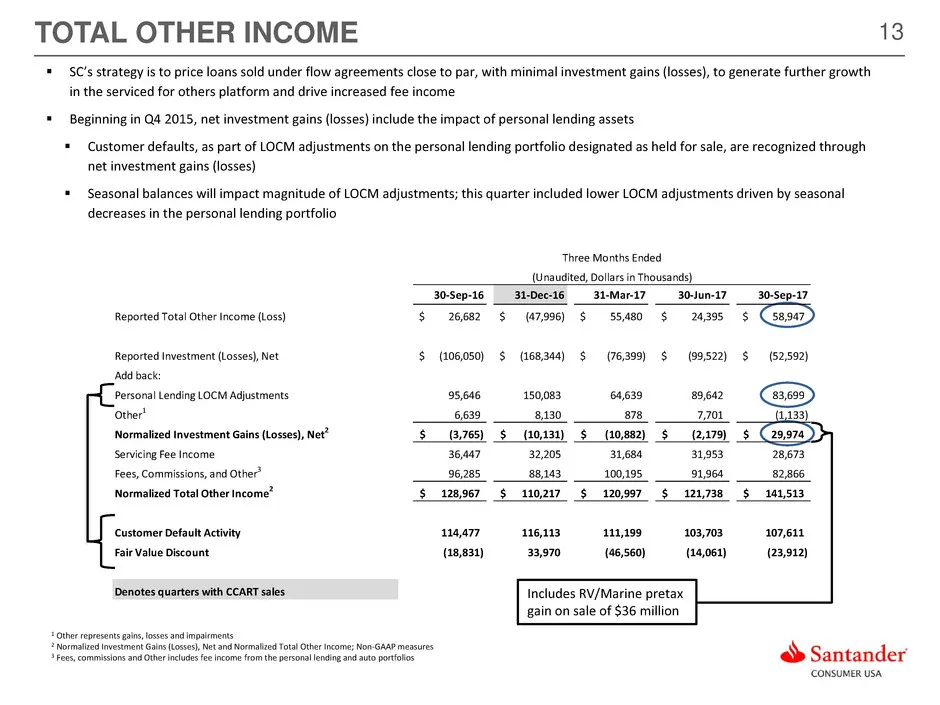
13TOTAL OTHER INCOME SC’s strategy is to price loans sold under flow agreements close to par, with minimal investment gains (losses), to generate further growth in the serviced for others platform and drive increased fee income Beginning in Q4 2015, net investment gains (losses) include the impa
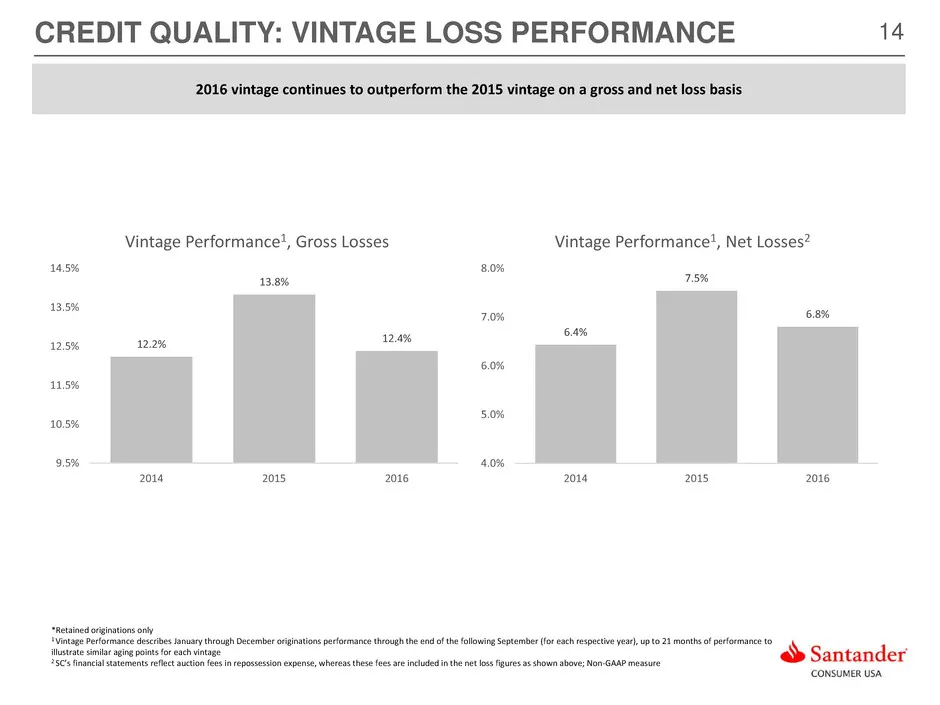
Slide 14: Credit Quality: Vintage Loss Performance
14CREDIT QUALITY: VINTAGE LOSS PERFORMANCE 2016 vintage continues to outperform the 2015 vintage on a gross and net loss basis *Retained originations only 1 Vintage Performance describes January through December originations performance through the end of the following September (for each respective
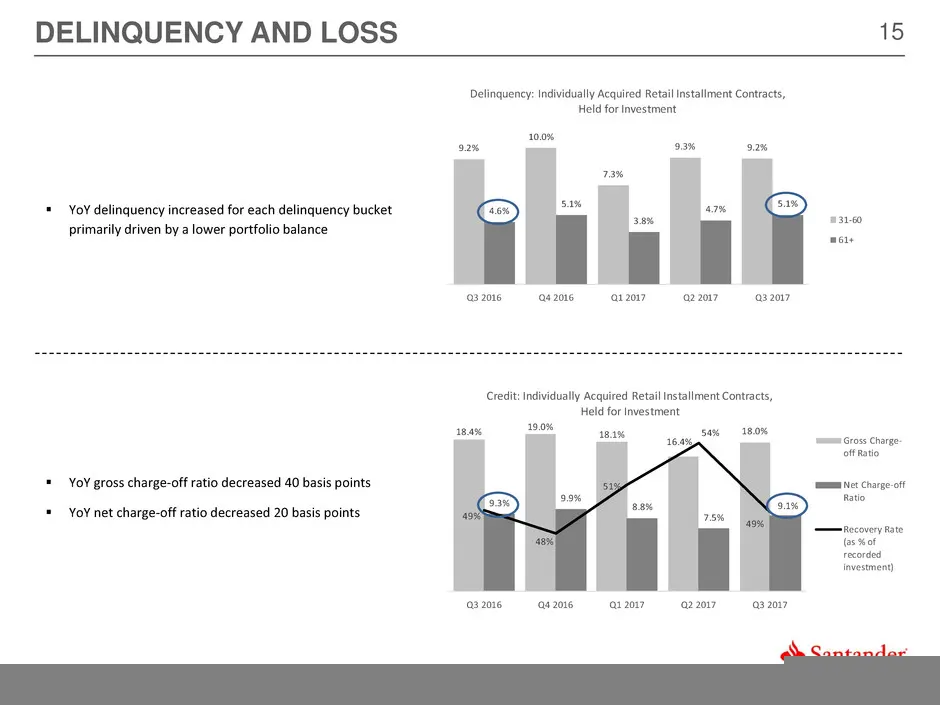
Slide 15: Delinquency and Loss
15 18.4% 19.0% 18.1% 16.4% 18.0% 9.3% 9.9% 8.8% 7.5% 9.1% 49% 48% 51% 54% 49% 44% 45% 46% 47% 48% 49% 50% 51% 52% 53% 54% 55% 0.0% 2.0% 4.0% 6.0% 8.0% 10.0% 12.0% 14.0% 16.0% 18.0% 20.0% Q3 2016 Q4 2016 Q1 2017 Q2 2017 Q3 2017 Credit: Individually Acquired Retail Installment Contracts, Held for Inve
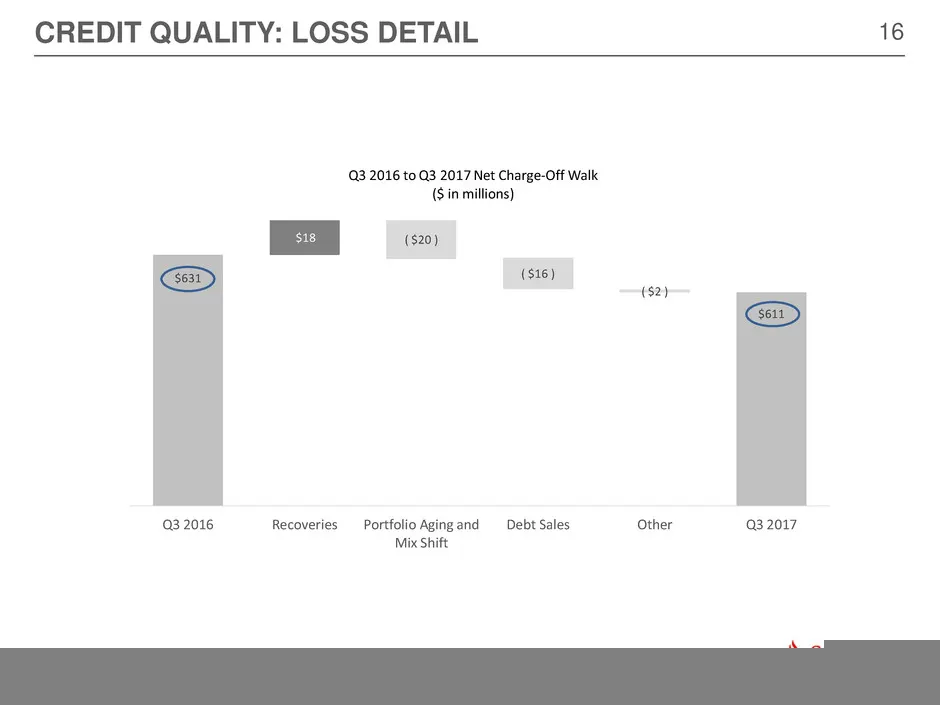
Slide 16: Credit Quality: Loss Detail
16 $631 $611 $18 ( $20 ) ( $16 ) ( $2 ) Q3 2016 Recoveries Portfolio Aging and Mix Shift Debt Sales Other Q3 2017 Q3 2016 to Q3 2017 Net Charge-Off Walk ($ in millions) CREDIT QUALITY: LOSS DETAIL
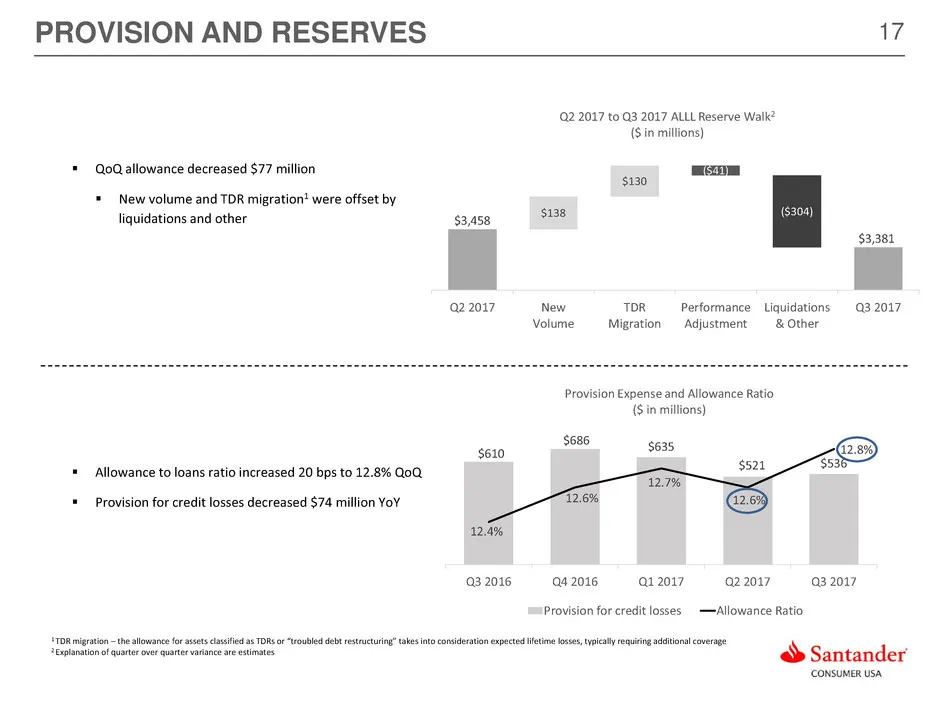
Slide 17: Provision and Reserves
17 $610 $686 $635 $521 $536 12.4% 12.6% 12.7% 12.6% 12.8% 12.2% 12.3% 12.4% 12.5% 12.6% 12.7% 12.8% 12.9% $0 $100 $200 $300 $400 $500 $600 $700 $800 Q3 2016 Q4 2016 Q1 2017 Q2 2017 Q3 2017 Provision Expense and Allowance Ratio ($ in millions) Provision for credit losses Allowance Ratio PROVISION AND
Slide 18: Expense Management
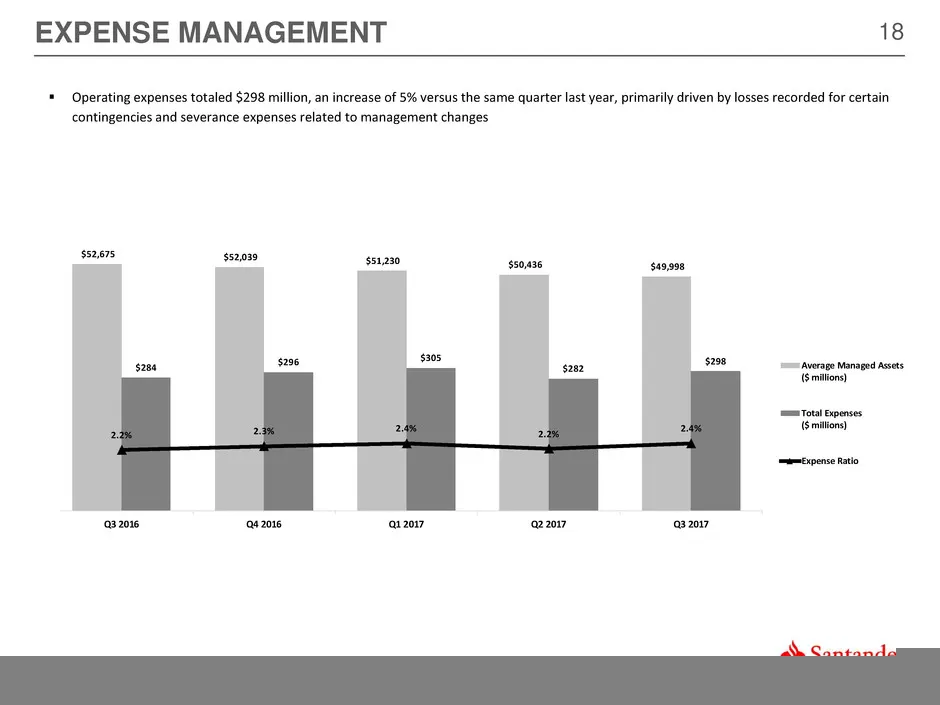
18 $52,675 $52,039 $51,230 $50,436 $49,998 $284 $296 $305 $282 $298 2.2% 2.3% 2.4% 2.2% 2.4% 0.0% 2.0% 4.0% 6.0% 8.0% 10.0% $2 $10,002 $20,002 $30,002 $40,002 $50,002 $60,002 Q3 2016 Q4 2016 Q1 2017 Q2 2017 Q3 2017 Average Managed Assets ($ millions) Total Expenses ($ millions) Expense Ratio EXPENSE
Slide 19: Funding and Liquidity
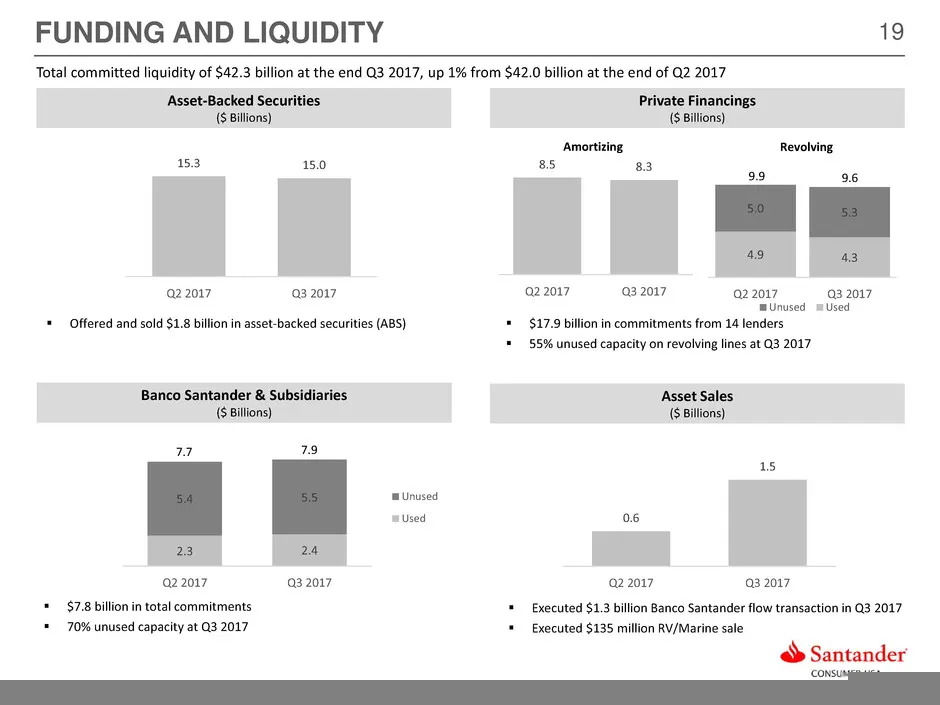
19 4.9 4.3 5.0 5.3 Q2 2017 Q3 2017 Unused Used 2.3 2.4 5.4 5.5 Q2 2017 Q3 2017 Unused Used $17.9 billion in commitments from 14 lenders 55% unused capacity on revolving lines at Q3 2017 FUNDING AND LIQUIDITY Total committed liquidity of $42.3 billion at the end Q3 2017, up 1% from $42.0 billion
Slide 20: Consistent Capital Generation
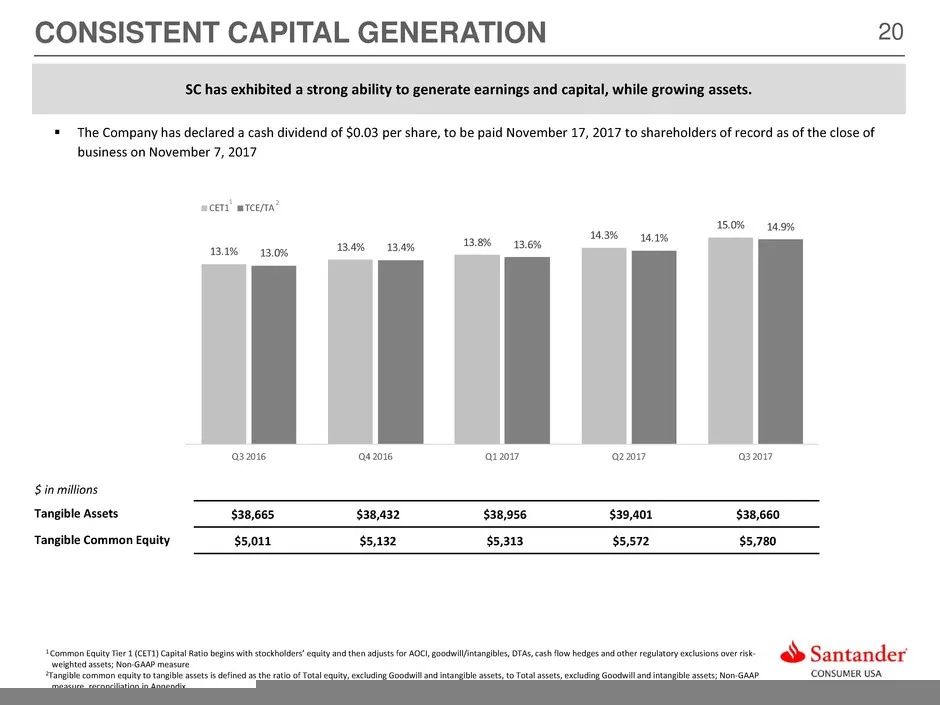
20 13.1% 13.4% 13.8% 14.3% 15.0% 13.0% 13.4% 13.6% 14.1% 14.9% Q3 2016 Q4 2016 Q1 2017 Q2 2017 Q3 2017 CET1 TCE/TA CONSISTENT CAPITAL GENERATION 1 Common Equity Tier 1 (CET1) Capital Ratio begins with stockholders’ equity and then adjusts for AOCI, goodwill/intangibles, DTAs, cash flow hedges and ot

Slide 21: Appendix
APPENDIX
Slide 22: Santander Consumer USA Holdings Inc.
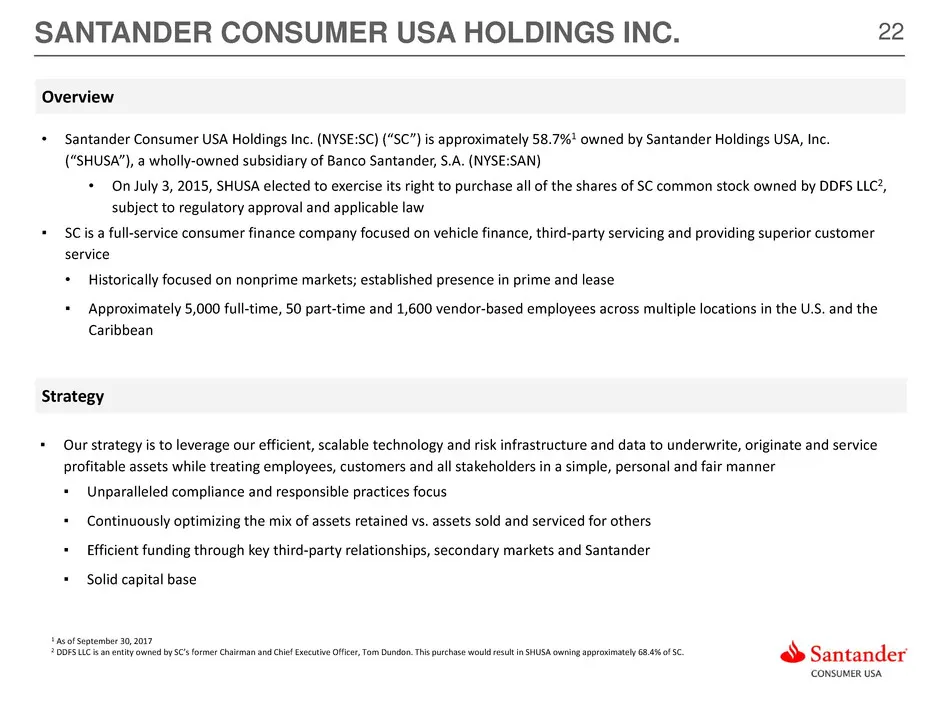
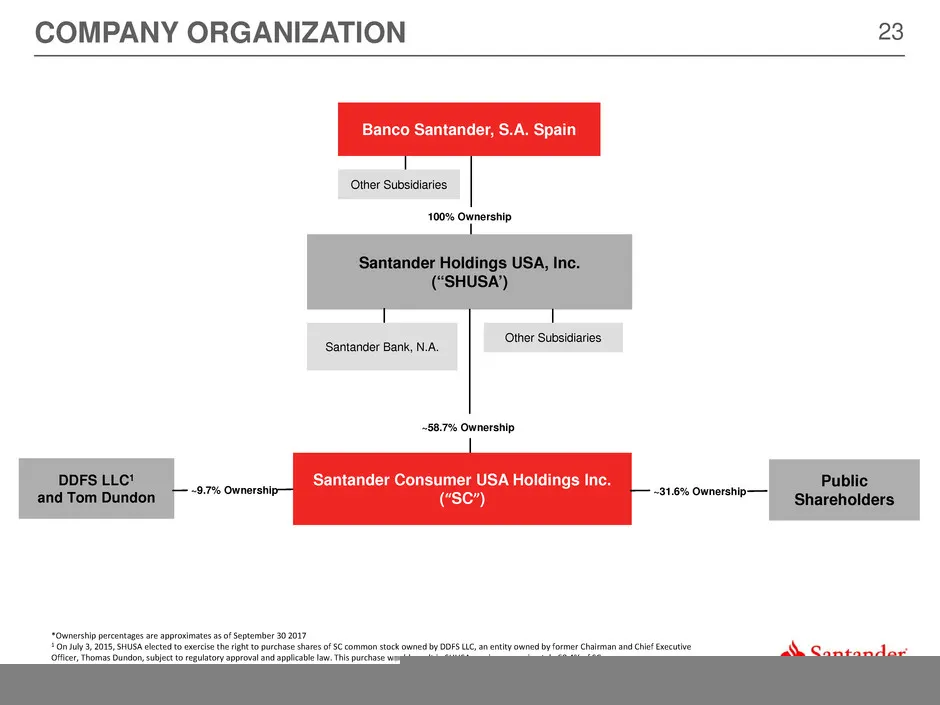
22SANTANDER CONSUMER USA HOLDINGS INC. • Santander Consumer USA Holdings Inc. (NYSE:SC) (“SC”) is approximately 58.7%1 owned by Santander Holdings USA, Inc. (“SHUSA”), a wholly-owned subsidiary of Banco Santander, S.A. (NYSE:SAN) • On July 3, 2015, SHUSA elected to exercise its right to purchase all
Slide 23: Company Organization
23 ~31.6% Ownership COMPANY ORGANIZATION Other Subsidiaries 100% Ownership Santander Holdings USA, Inc. (“SHUSA’) ~58.7% Ownership Santander Consumer USA Holdings Inc. (“SC”) Santander Bank, N.A. Other Subsidiaries ~9.7% Ownership DDFS LLC1 and Tom Dundon Public Shareholders Banco Santander, S.A. Sp
Slide 24: Q3 2017 Excluding Personal Lending Detail
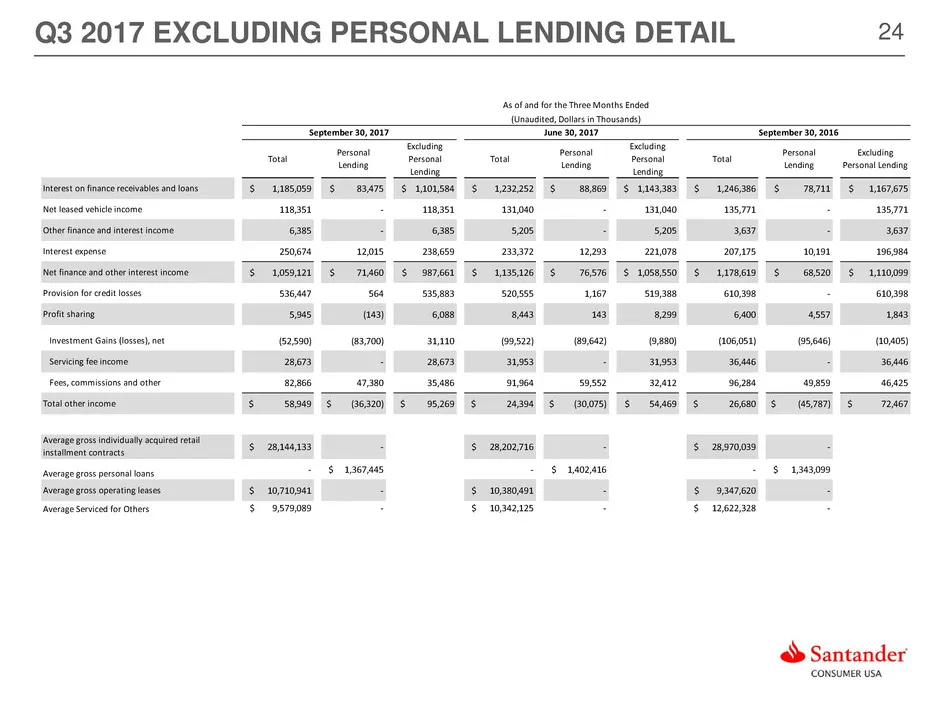
24Q3 2017 EXCLUDING PERSONAL LENDING DETAIL Total Personal Lending Excluding Personal Lending Total Personal Lending Excluding Personal Lending Total Personal Lending Excluding Personal Lending Interest on finance receivables and loans $ 1,185,059 $ 83,475 $ 1,101,584 $ 1,232,252 $ 88,869 $ 1,143,38
Slide 25: Held for Investment Credit Trends
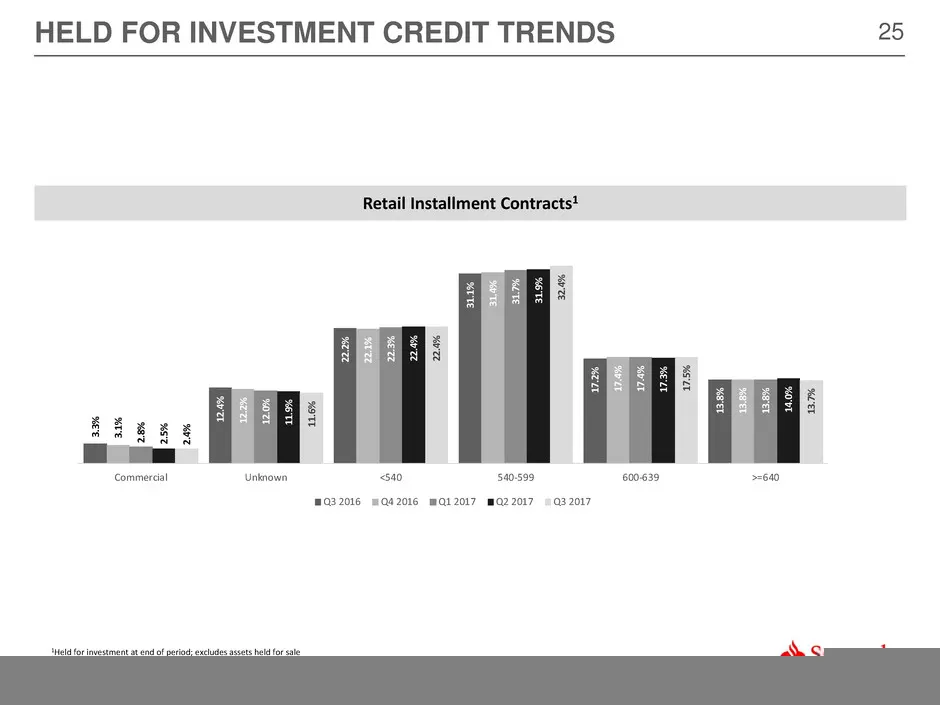
25HELD FOR INVESTMENT CREDIT TRENDS Retail Installment Contracts1 1Held for investment at end of period; excludes assets held for sale 3. 3% 12 .4 % 22 .2 % 31 .1 % 17 .2 % 13 .8 % 3. 1% 12 .2 % 22 .1 % 31 .4 % 17 .4 % 13 .8 % 2. 8% 12 .0 % 22 .3 % 31 .7 % 17 .4 % 13 .8 % 2. 5% 11 .9 % 22 .4 % 31 .9
Slide 26: Condensed Consolidated Balance Sheets
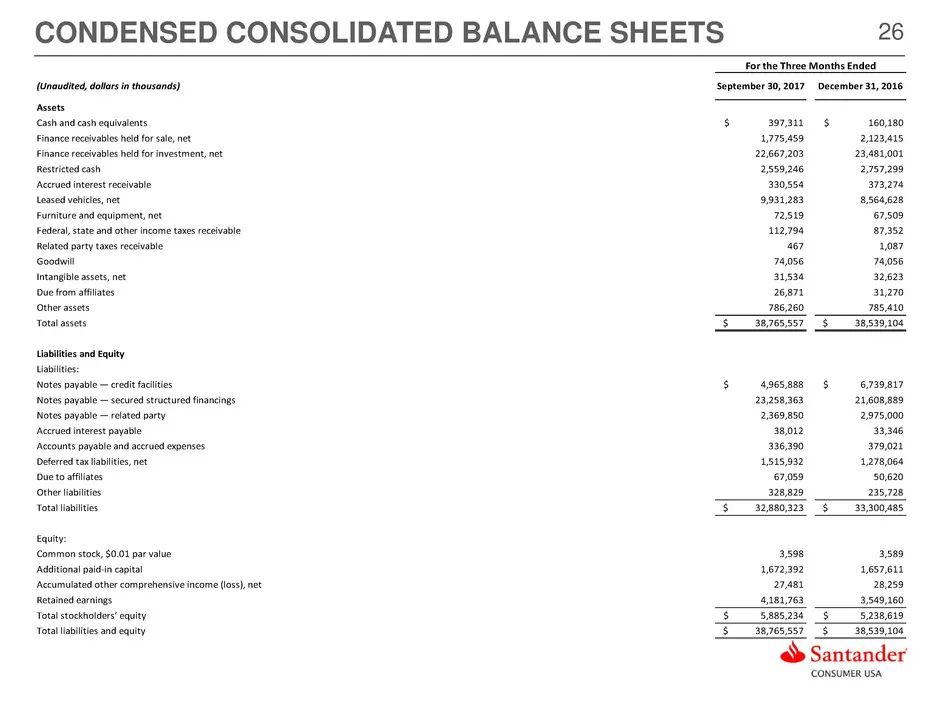
26CONDENSED CONSOLIDATED BALANCE SHEETS (Unaudited, dollars in thousands) September 30, 2017 December 31, 2016 Assets Cash and cash equivalents $ 397,311 $ 160,180 Finance receivables held for sale, net 1,775,459 2,123,415 Finance receivables held for investment, net 22,667,203 23,481,001 Restricted
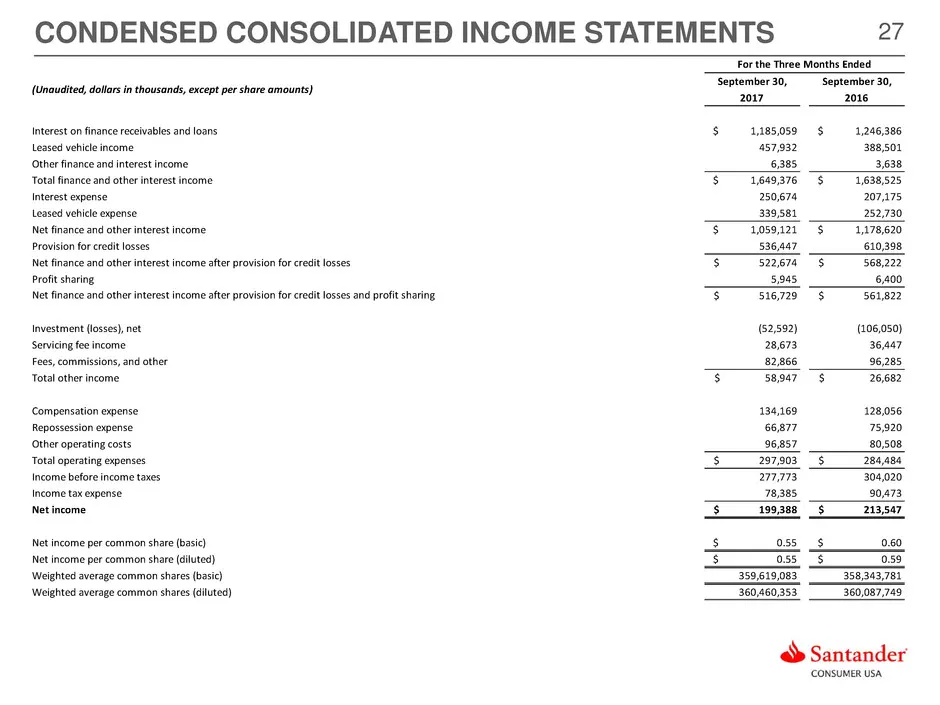
Slide 27: Condensed Consolidated Income Statements
27CONDENSED CONSOLIDATED INCOME STATEMENTS September 30, September 30, 2017 2016 Interest on finance receivables and loans $ 1,185,059 $ 1,246,386 Leased vehicle income 457,932 388,501 Other finance and interest income 6,385 3,638 Total finance and other interest income $ 1,649,376 $ 1,638,525 Inter
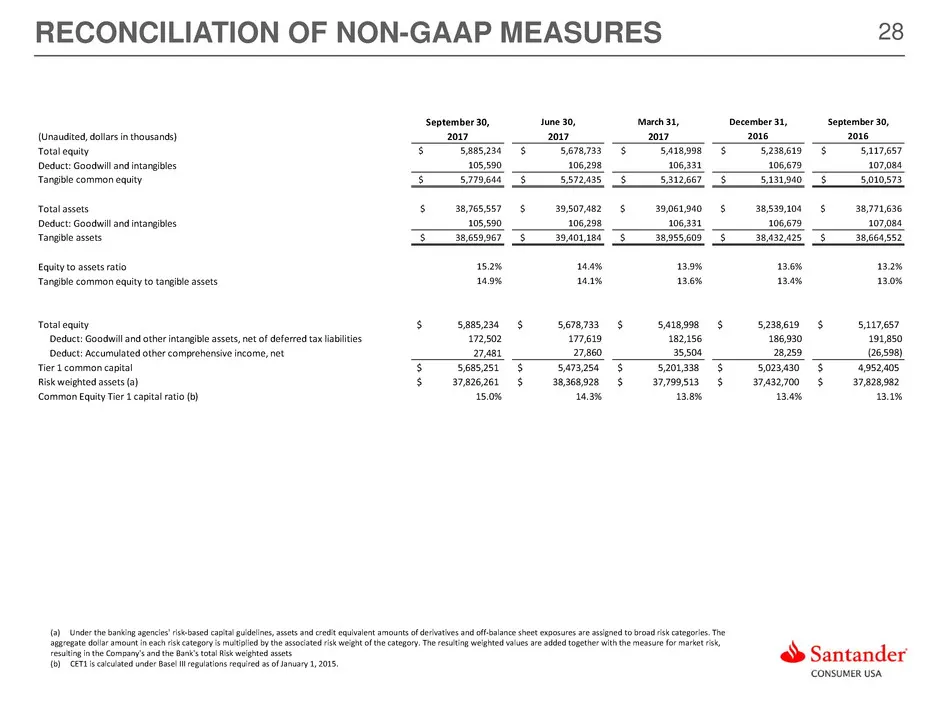
Slide 28: Reconciliation of Non-GAAP Measures
28RECONCILIATION OF NON-GAAP MEASURES September 30, June 30, March 31, December 31, September 30, 2017 2017 2017 2016 2016 Total equity $ 5,885,234 $ 5,678,733 $ 5,418,998 $ 5,238,619 $ 5,117,657 Deduct: Goodwill and intangibles 105,590 106,298 106,331 106,679 107,084 Tangible common equity $ 5,779,

Slide 29: Santander Consumer USA
CONSUMER USA
Source: SEC EDGAR · 8-K filed Oct 27, 2017
More decks from Santander Consumer USA Holdings Inc
 Q3 2021 Earnings Presentation24 slides · Oct 27, 2021
 Q2 2021 Earnings Presentation24 slides · Jul 28, 2021
 Q1 2021 Earnings Presentation24 slides · Apr 28, 2021
 FY2020 Earnings Presentation28 slides · Feb 3, 2021
 Q3 2020 Earnings Presentation25 slides · Oct 28, 2020
 Q2 2020 Earnings Presentation26 slides · Jul 29, 2020