FB Financial Corporation · NYSE:FBK
FB Financial — Raymond James Conference 2024
35 slides from FB Financial's conference presentation, Sep 3, 2024
Slide 1: Third Quarter 2024 Investor Presentation
September 4, 2024 Third Quarter 2024 Investor Presentation
Slide 2: Forward-looking statements
1 Forward–looking statements Certain statements contained in this Presentation that are not historical in nature may be considered forward-looking statements within the meaning of the Private Securities Litigation Reform Act of 1995. These forward-looking statements include, without limitation, stat
Slide 3: Use of non-GAAP financial measures
2 Use of non-GAAP financial measures This Presentation contains certain financial measures that are not measures recognized under U.S. generally accepted accounting principles (“GAAP”) and therefore are considered non-GAAP financial measures. These non-GAAP financial measures may include, without li
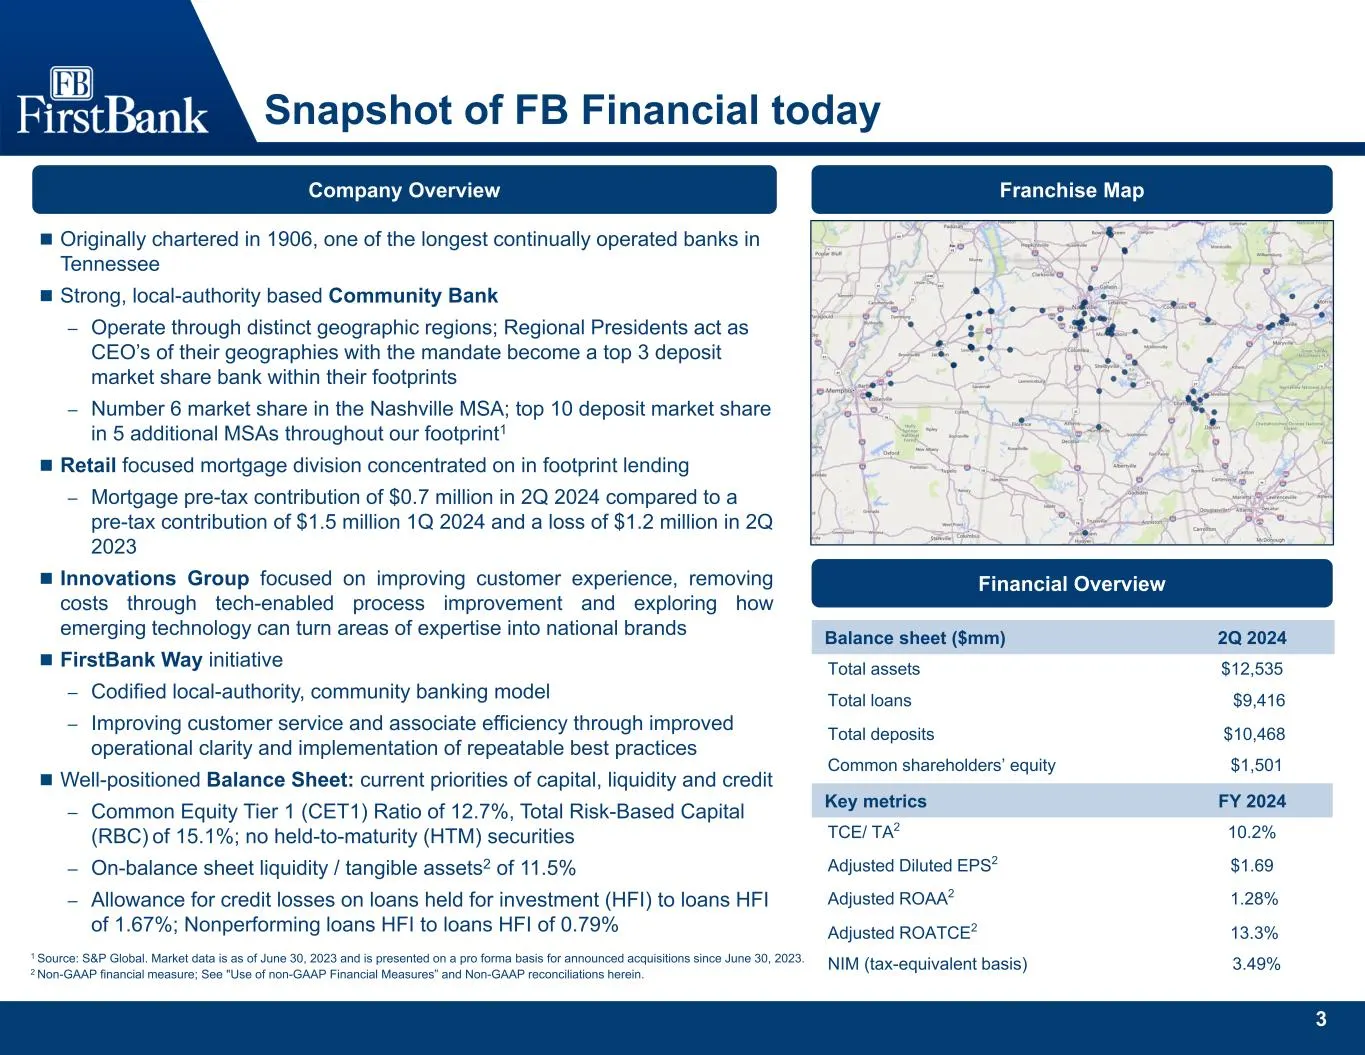
Slide 4: Snapshot of FB Financial today
3 Snapshot of FB Financial today 1 Source: S&P Global. Market data is as of June 30, 2023 and is presented on a pro forma basis for announced acquisitions since June 30, 2023. 2 Non-GAAP financial measure; See "Use of non-GAAP Financial Measures” and Non-GAAP reconciliations herein. Financial Overvi
Slide 5: Strategic drivers
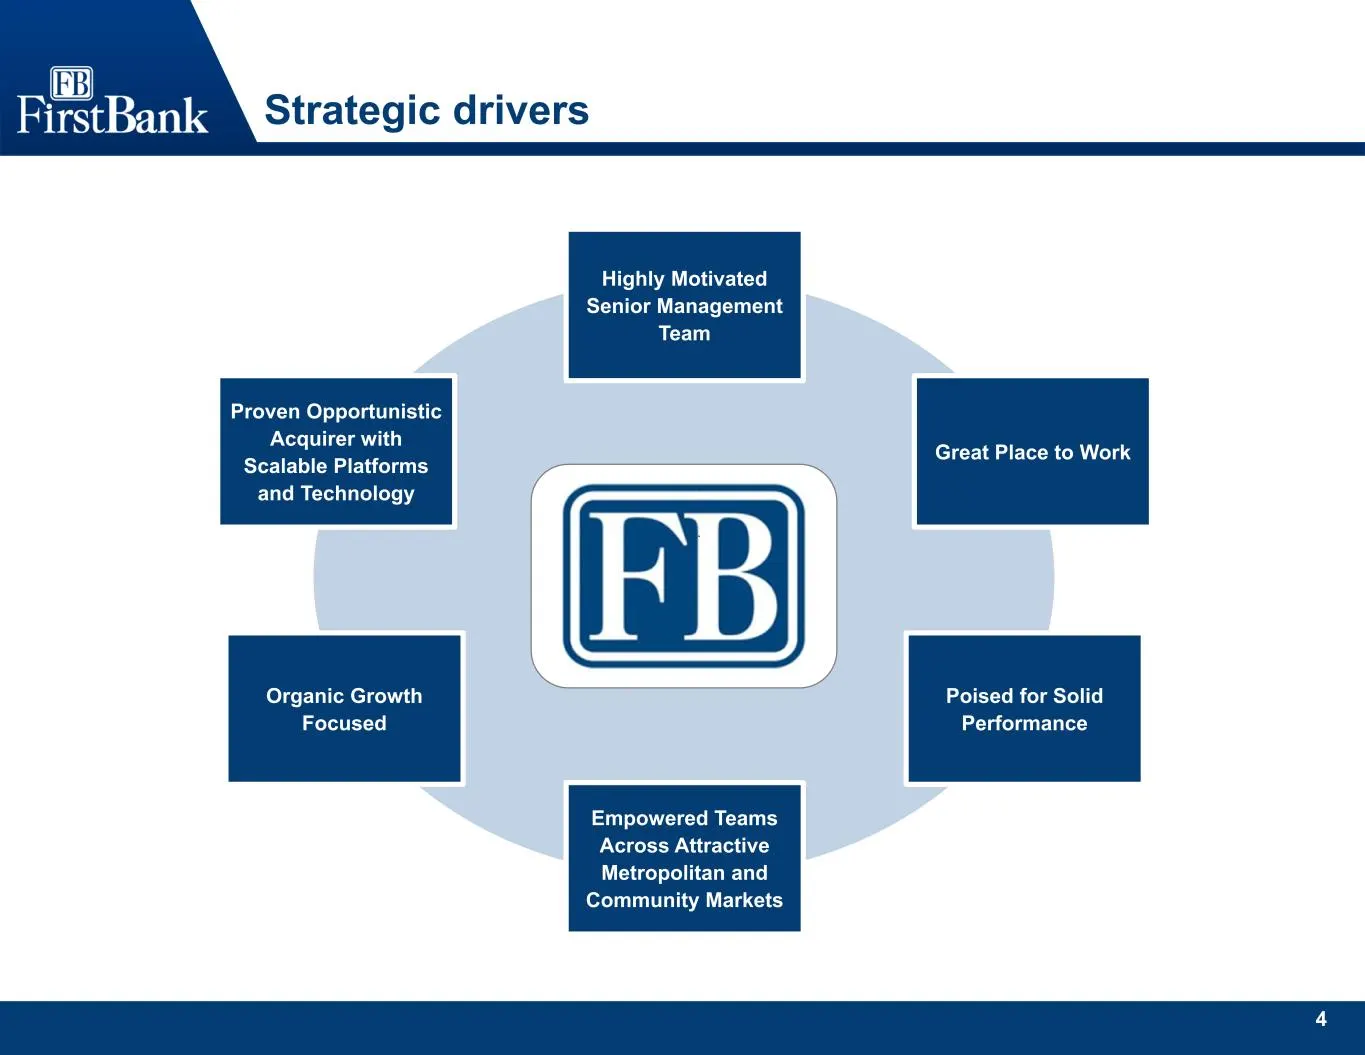
4 Strategic drivers Poised for Solid Performance Proven Opportunistic Acquirer with Scalable Platforms and Technology Highly Motivated Senior Management Team Great Place to Work Organic Growth Focused Empowered Teams Across Attractive Metropolitan and Community Markets
Slide 6: Recent corporate history
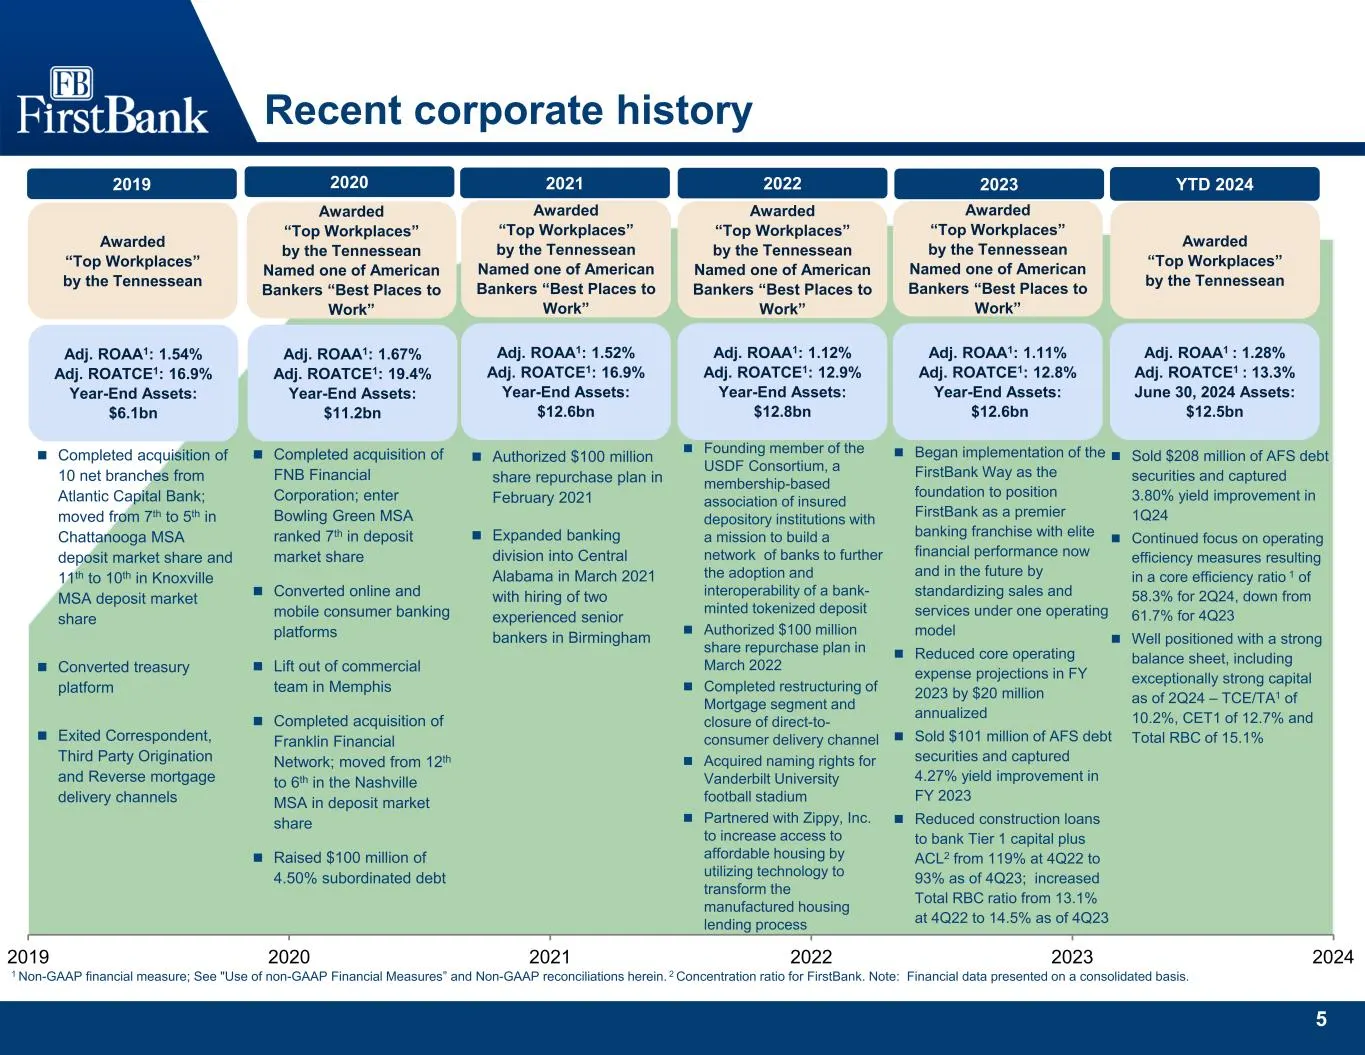
5 2019 2020 2021 2022 2023 2024 Recent corporate history 1 Non-GAAP financial measure; See "Use of non-GAAP Financial Measures” and Non-GAAP reconciliations herein. 2 Concentration ratio for FirstBank. Note: Financial data presented on a consolidated basis. 2020 Completed acquisition of 10 net bra
Slide 7: Well-positioned in high growth markets
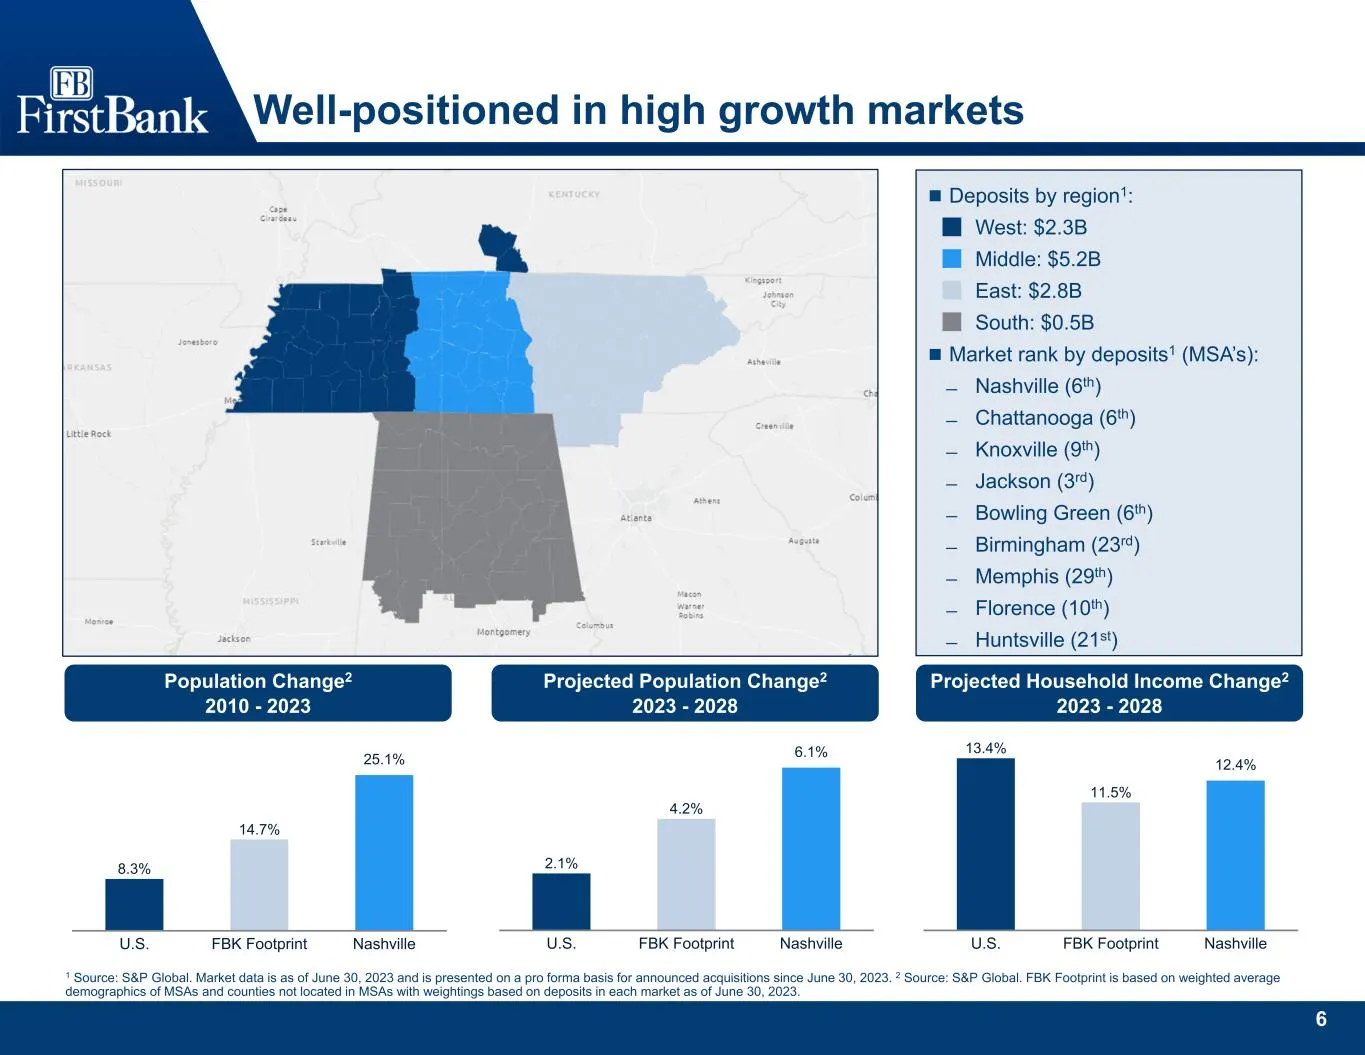
6 Well-positioned in high growth markets 1 Source: S&P Global. Market data is as of June 30, 2023 and is presented on a pro forma basis for announced acquisitions since June 30, 2023. 2 Source: S&P Global. FBK Footprint is based on weighted average demographics of MSAs and counties not located in MS
Slide 8: Driving shareholder value
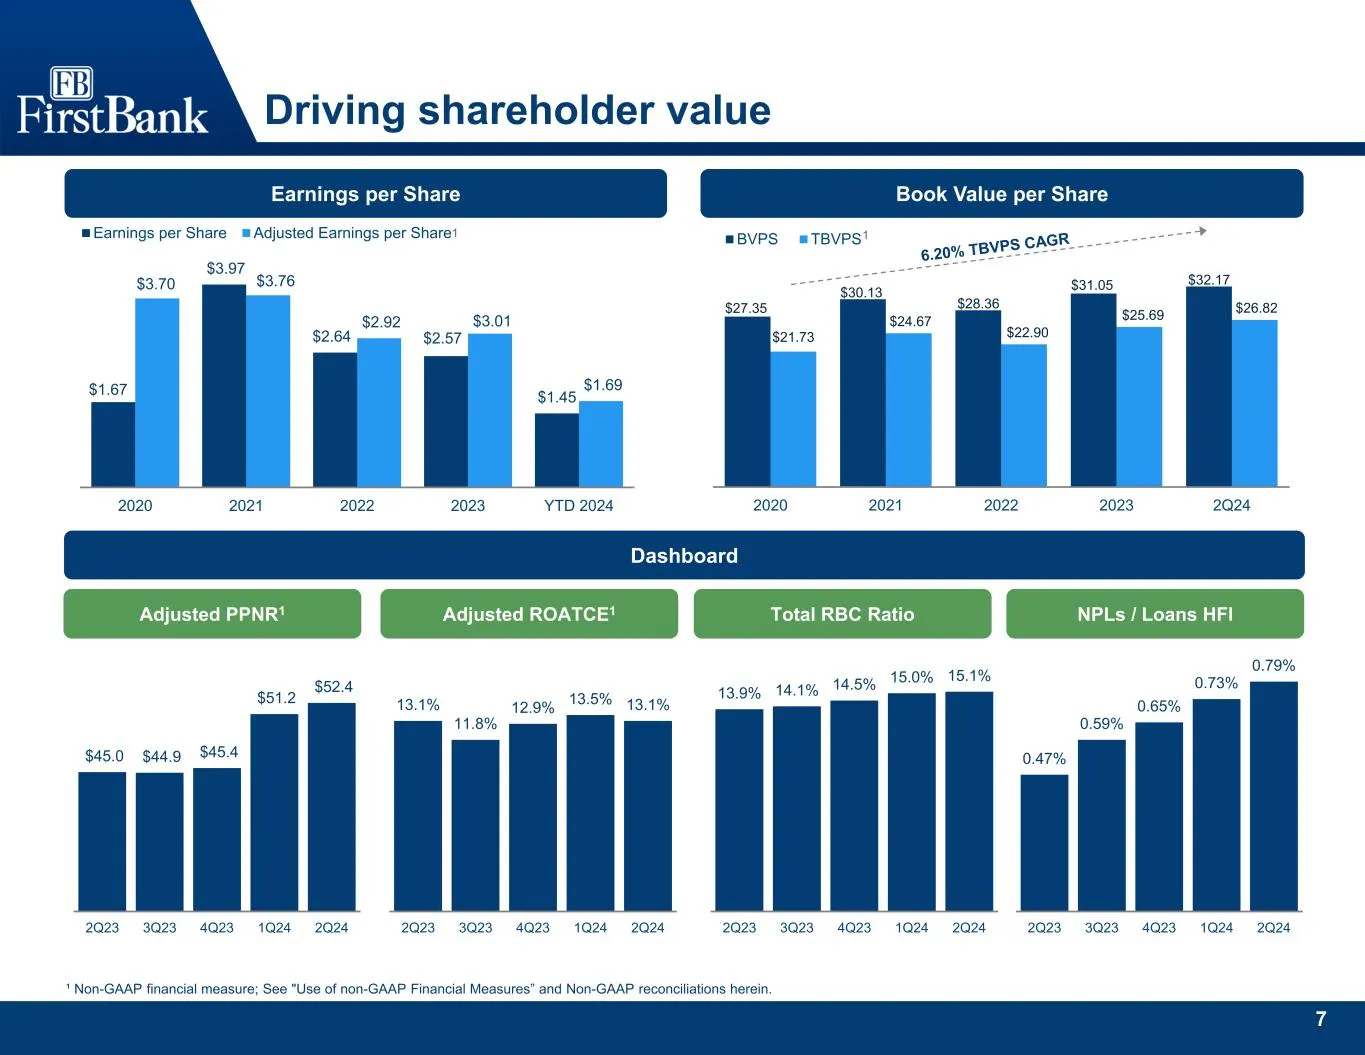
7 Driving shareholder value ¹ Non-GAAP financial measure; See "Use of non-GAAP Financial Measures” and Non-GAAP reconciliations herein. Earnings per Share $1.67 $3.97 $2.64 $2.57 $1.45 $3.70 $3.76 $2.92 $3.01 $1.69 2020 2021 2022 2023 YTD 2024 Earnings per Share Adjusted Earnings per Share1 Dashboar
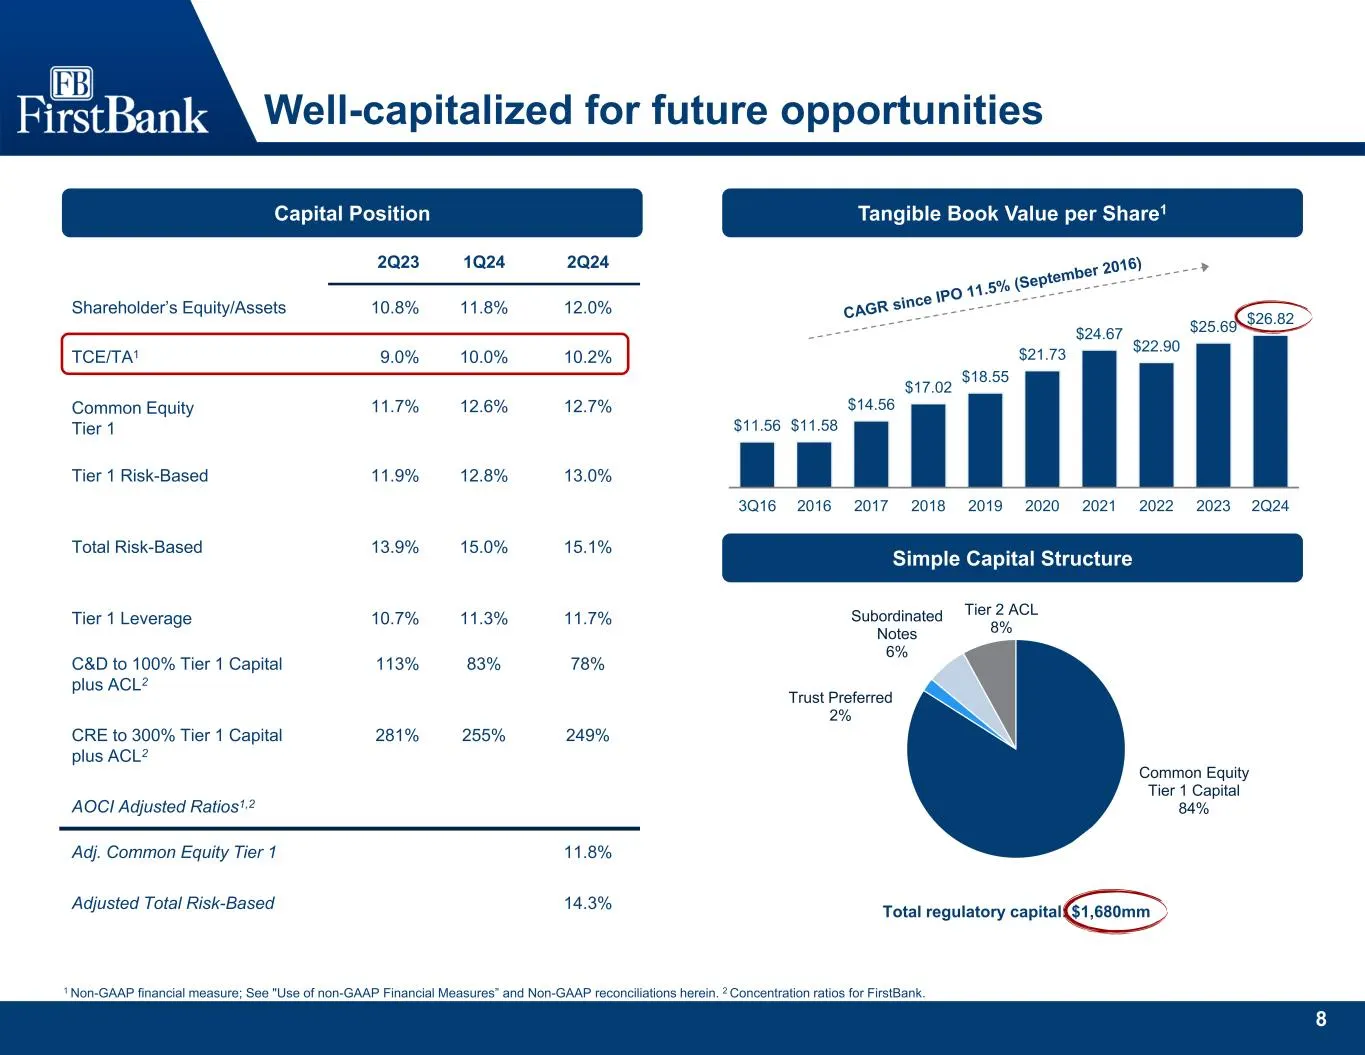
Slide 9: Well-capitalized for future opportunities
8 Well-capitalized for future opportunities Tangible Book Value per Share1 Simple Capital Structure Common Equity Tier 1 Capital 84% Trust Preferred 2% Subordinated Notes 6% Tier 2 ACL 8% Total regulatory capital: $1,680mm $11.56 $11.58 $14.56 $17.02 $18.55 $21.73 $24.67 $22.90 $25.69 $26.82 3Q16 20
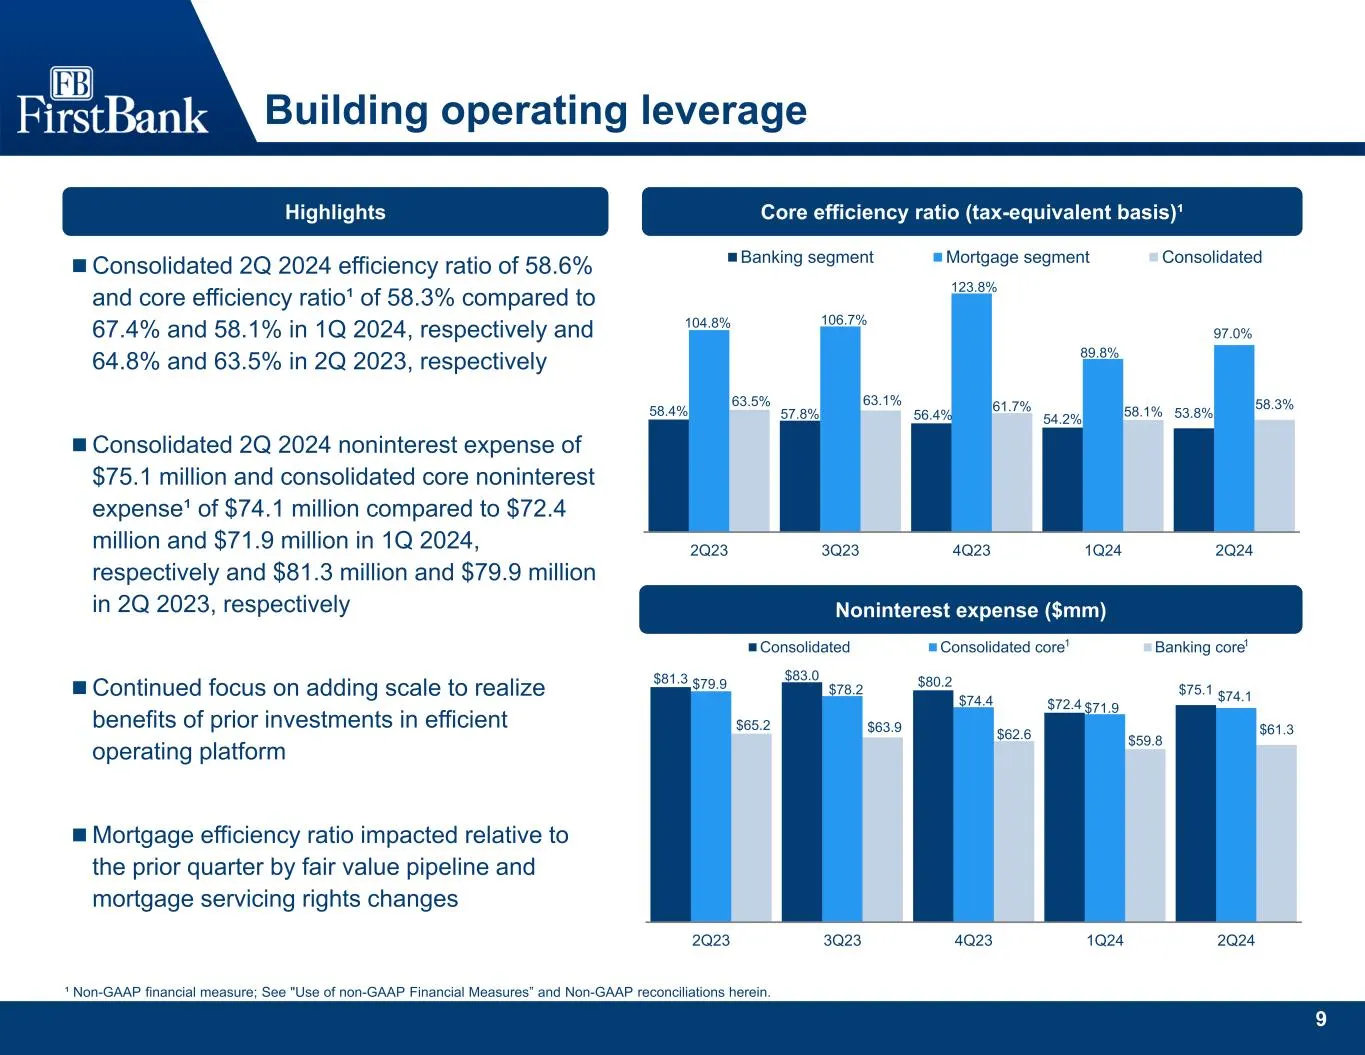
Slide 10: Building operating leverage
9 Building operating leverage Highlights ¹ Non-GAAP financial measure; See "Use of non-GAAP Financial Measures” and Non-GAAP reconciliations herein. Core efficiency ratio (tax-equivalent basis)¹ Noninterest expense ($mm) Consolidated 2Q 2024 efficiency ratio of 58.6% and core efficiency ratio¹ of 5
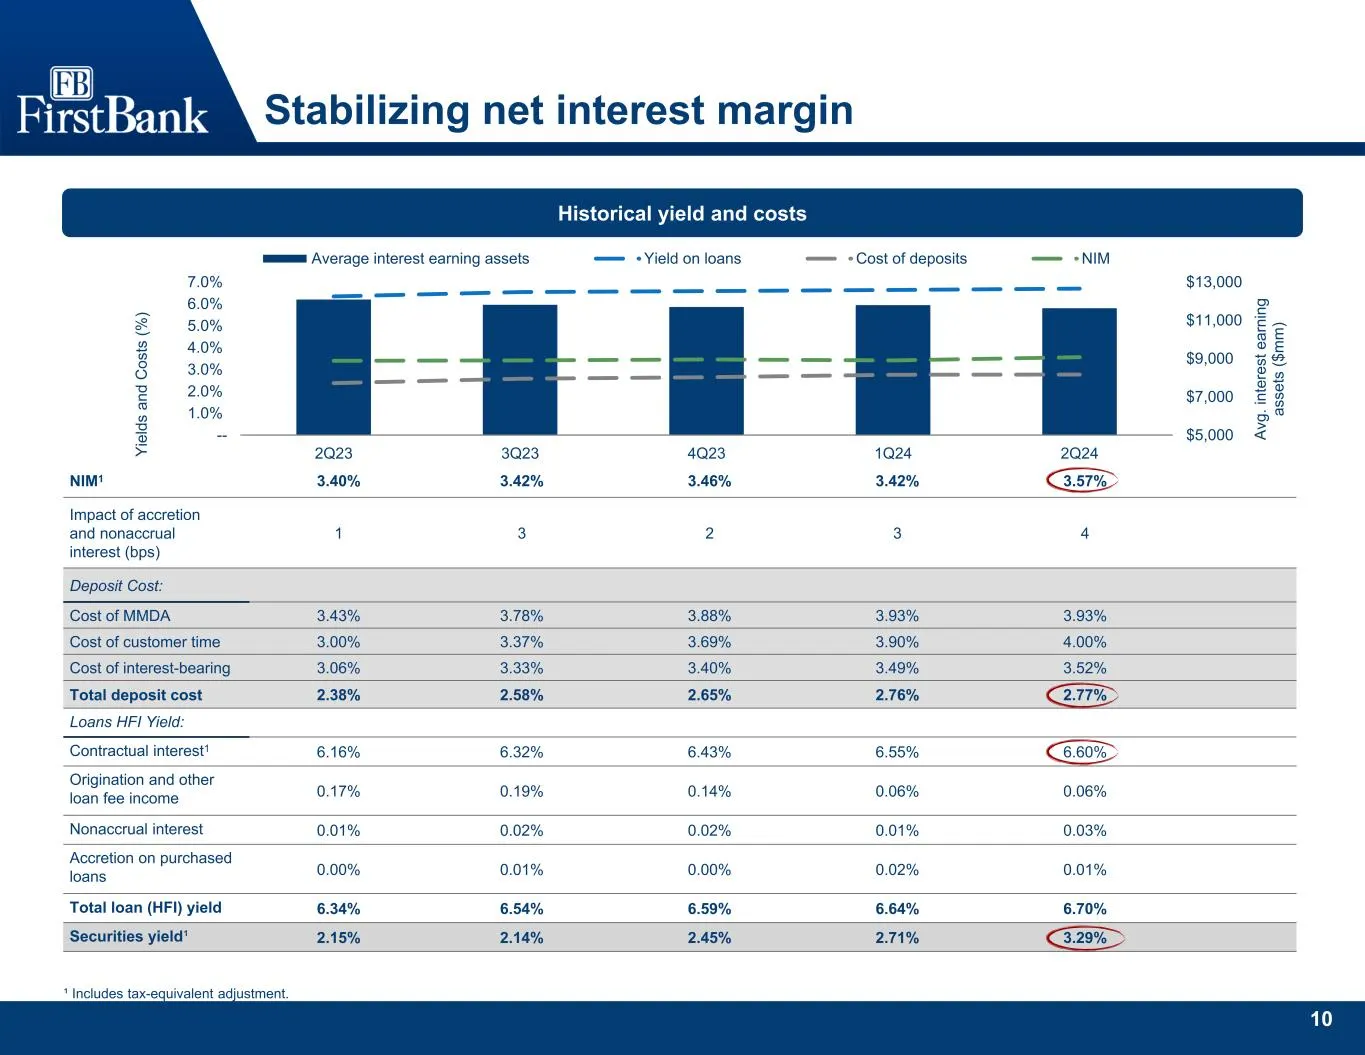
Slide 11: Stabilizing net interest margin
10 3.57%3.42%3.46%3.42%3.40%NIM1 43231 Impact of accretion and nonaccrual interest (bps) Deposit Cost: 3.93%3.93%3.88%3.78%3.43%Cost of MMDA 4.00%3.90%3.69%3.37%3.00%Cost of customer time 3.52%3.49%3.40%3.33%3.06%Cost of interest-bearing 2.77%2.76%2.65%2.58%2.38%Total deposit cost Loans HFI Yield: 6
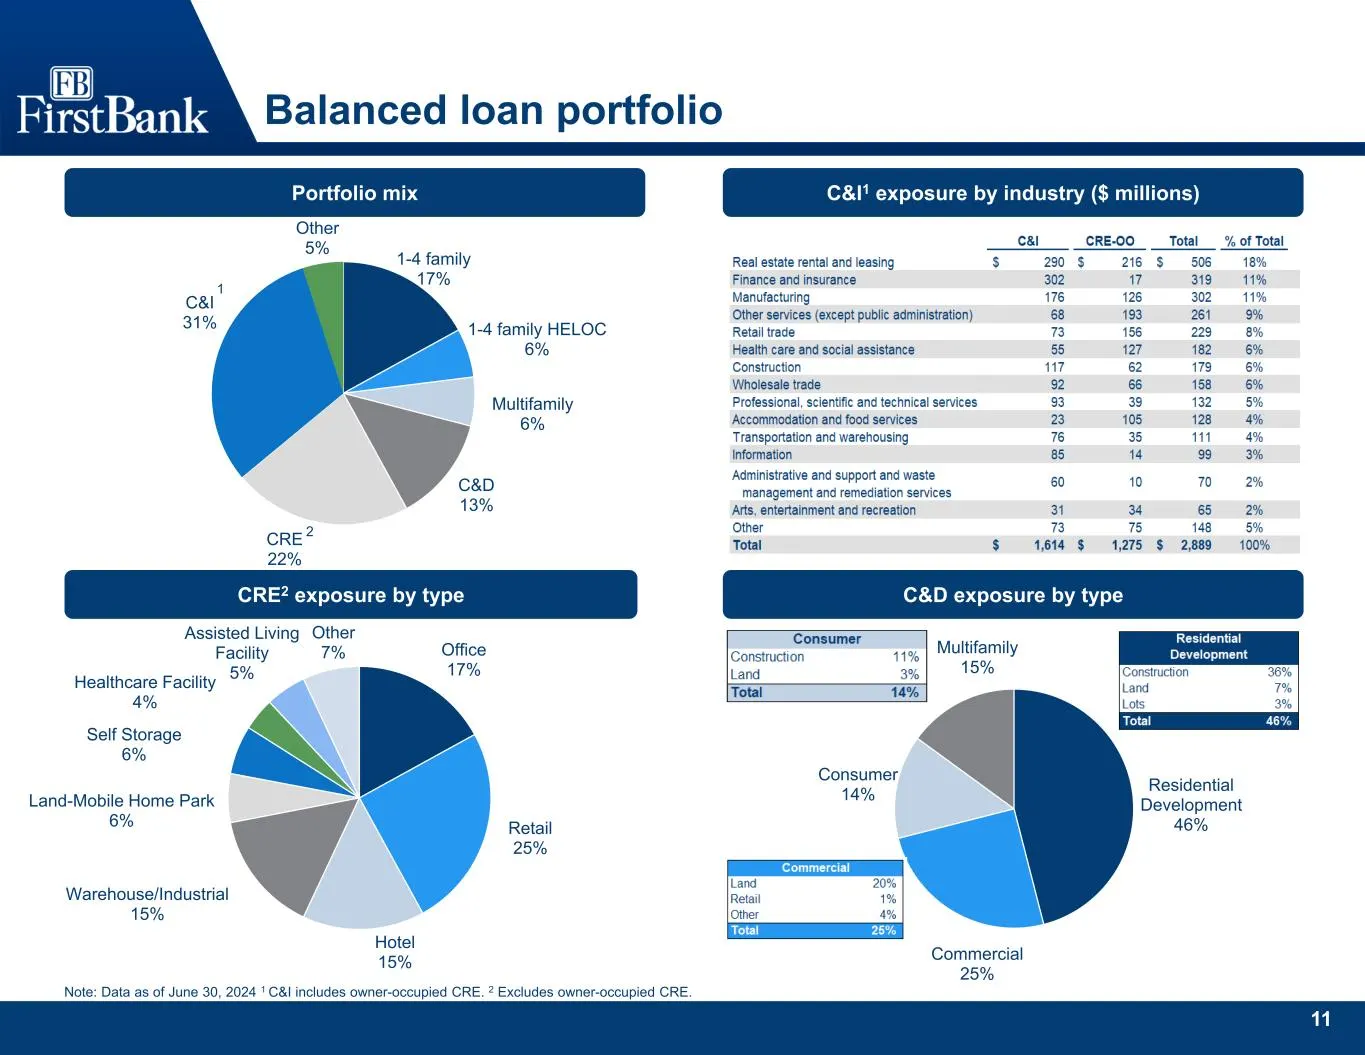
Slide 12: Balanced loan portfolio
11 1-4 family 17% 1-4 family HELOC 6% Multifamily 6% C&D 13% CRE 22% C&I 31% Other 5% Residential Development 46% Commercial 25% Consumer 14% Multifamily 15% Office 17% Retail 25% Hotel 15% Warehouse/Industrial 15% Land-Mobile Home Park 6% Self Storage 6% Healthcare Facility 4% Assisted Living Facil
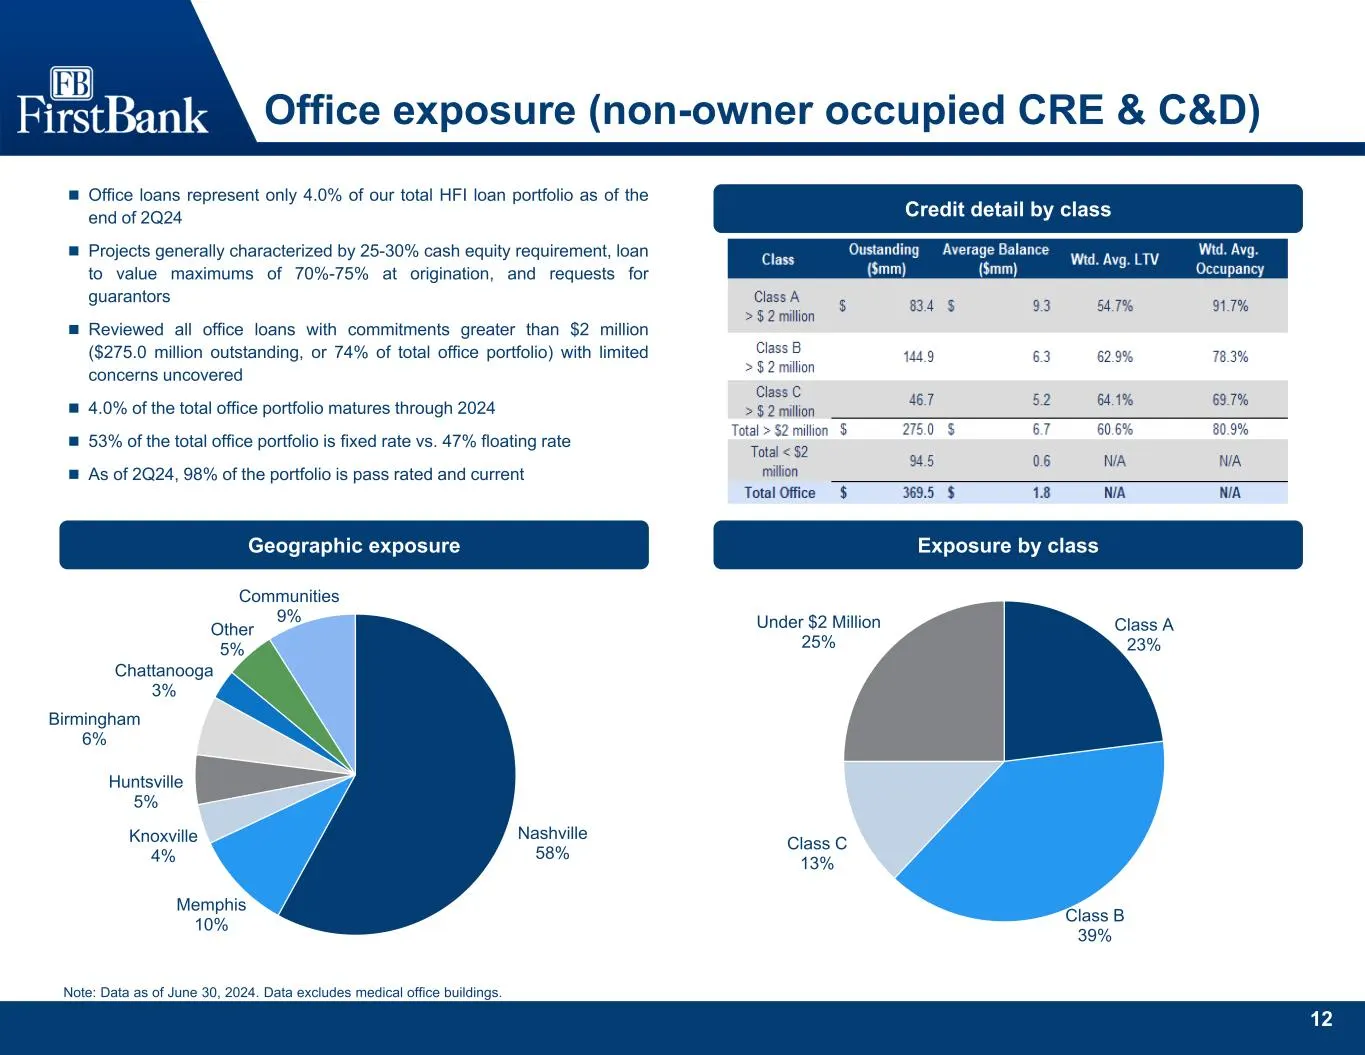
Slide 13: Office exposure and geographic exposure
12 Nashville 58% Memphis 10% Knoxville 4% Huntsville 5% Birmingham 6% Chattanooga 3% Other 5% Communities 9% Class A 23% Class B 39% Class C 13% Under $2 Million 25% Office exposure (non-owner occupied CRE & C&D) Office loans represent only 4.0% of our total HFI loan portfolio as of the end of 2Q2
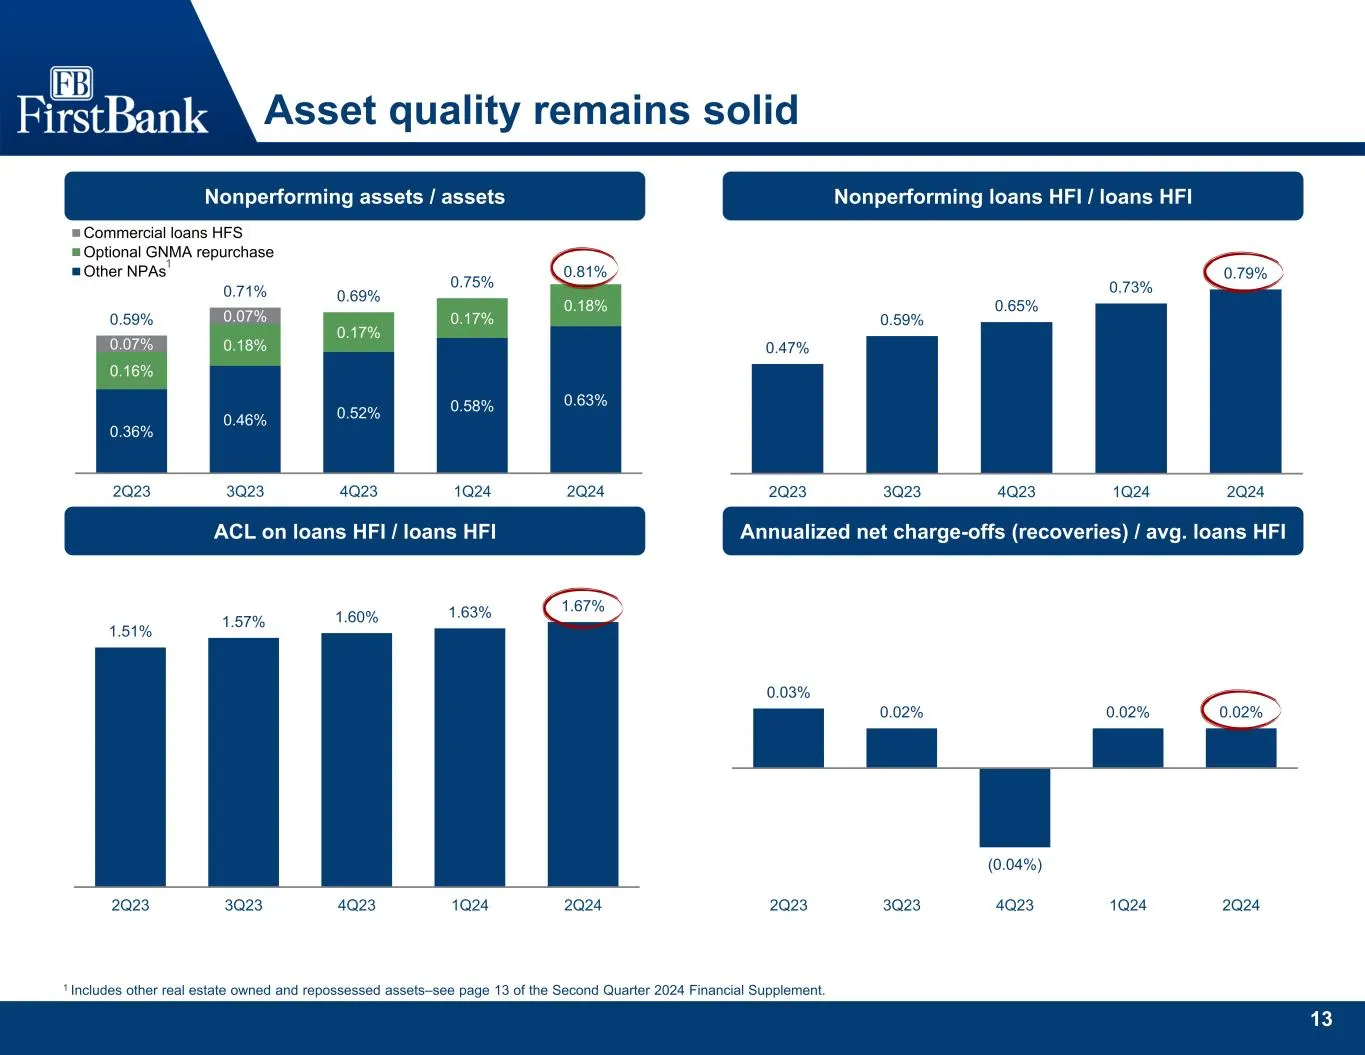
Slide 14: Asset quality remains solid
13 0.47% 0.59% 0.65% 0.73% 0.79% 2Q23 3Q23 4Q23 1Q24 2Q24 0.03% 0.02% (0.04%) 0.02% 0.02% 2Q23 3Q23 4Q23 1Q24 2Q24 0.36% 0.46% 0.52% 0.58% 0.63% 0.16% 0.18% 0.17% 0.17% 0.18% 0.07% 0.07%0.59% 0.71% 0.69% 0.75% 0.81% 2Q23 3Q23 4Q23 1Q24 2Q24 Commercial loans HFS Optional GNMA repurchase Other NPAs 1.
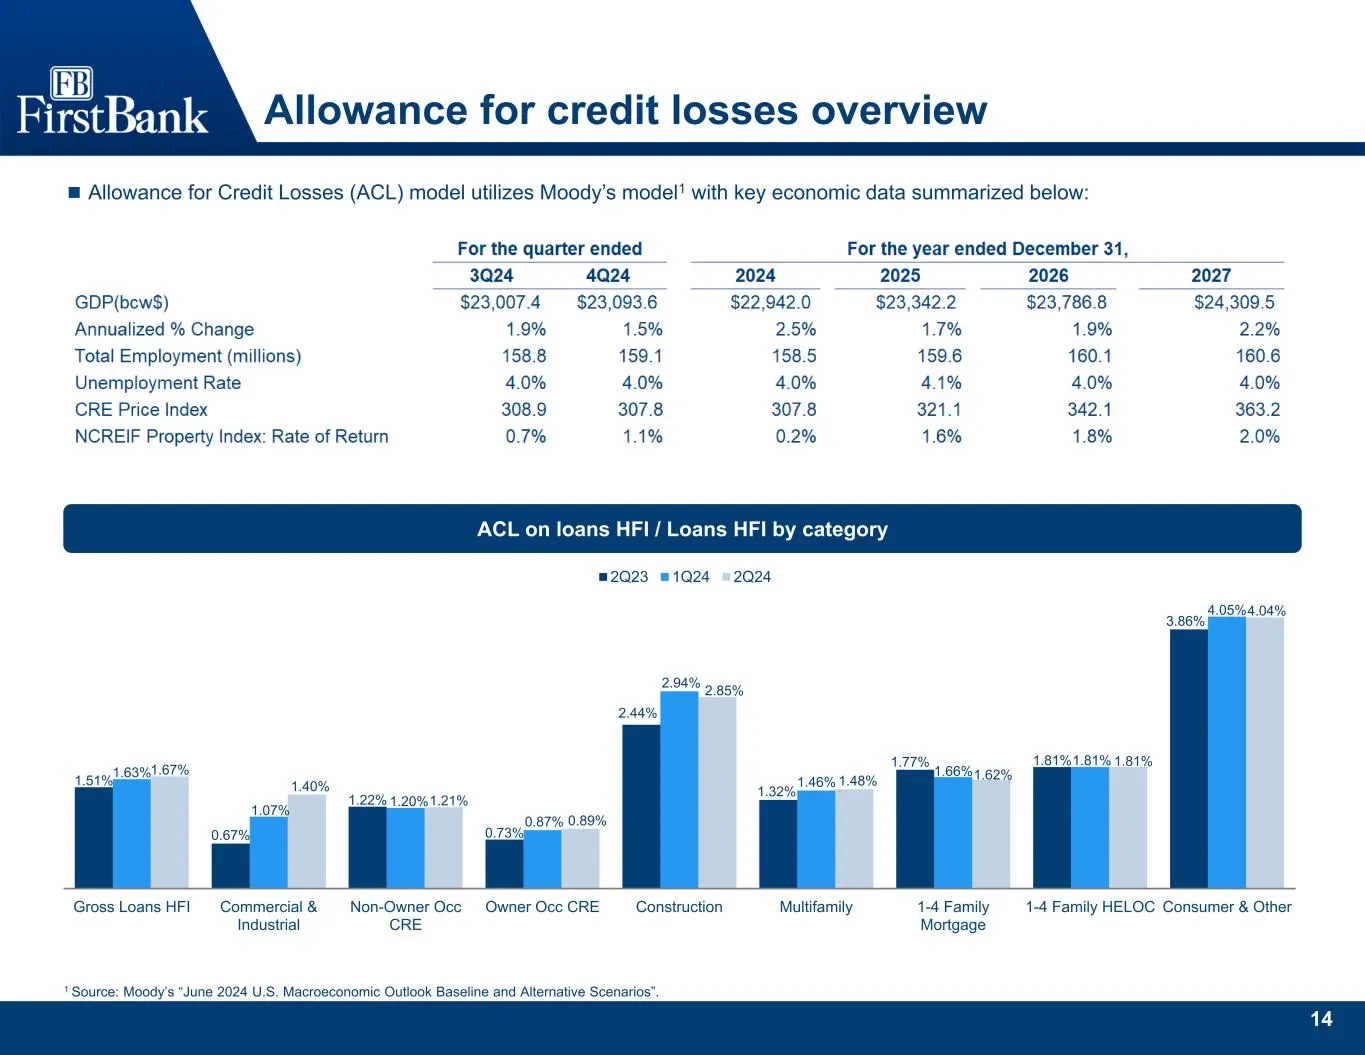
Slide 15: Allowance for credit losses overview
14 1.51% 0.67% 1.22% 0.73% 2.44% 1.32% 1.77% 1.81% 3.86% 1.63% 1.07% 1.20% 0.87% 2.94% 1.46% 1.66% 1.81% 4.05% 1.67% 1.40% 1.21% 0.89% 2.85% 1.48% 1.62% 1.81% 4.04% Gross Loans HFI Commercial & Industrial Non-Owner Occ CRE Owner Occ CRE Construction Multifamily 1-4 Family Mortgage 1-4 Family HELOC C
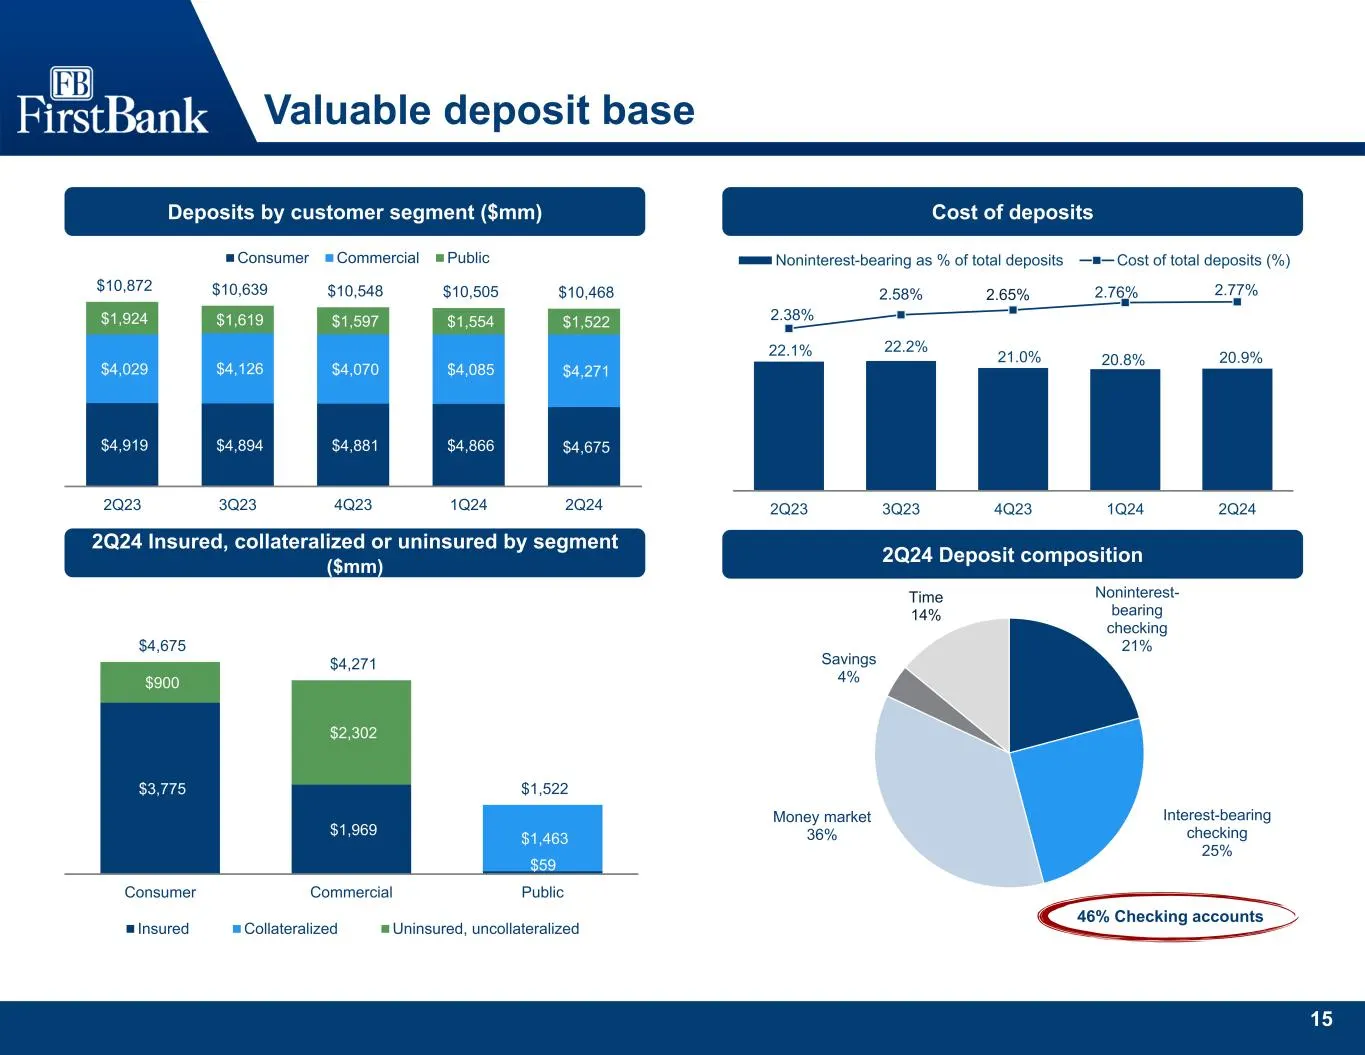
Slide 16: Valuable deposit base
15 Noninterest- bearing checking 21% Interest-bearing checking 25% Money market 36% Savings 4% Time 14% 46% Checking accounts Valuable deposit base Cost of deposits 2Q24 Deposit composition 22.1% 22.2% 21.0% 20.8% 20.9% 2.38% 2.58% 2.65% 2.76% 2.77% 0.00% 0.50% 1.00% 1.50% 2.00% 2.50% 3.00% 0.0% 5.0
Slide 17: Strong liquidity position
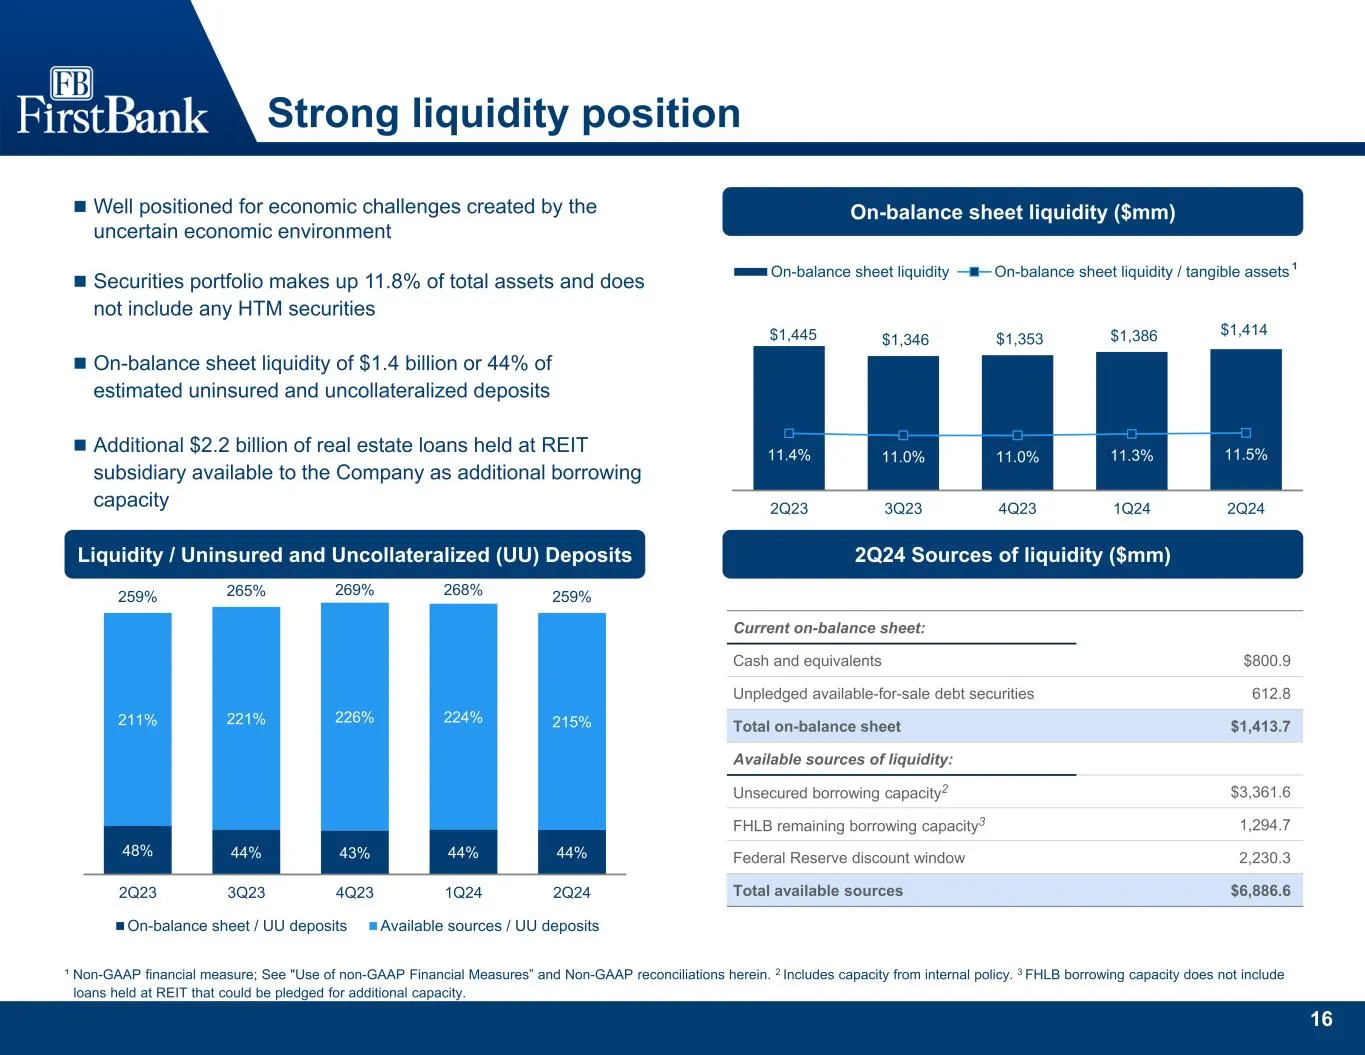
16 $1,445 $1,346 $1,353 $1,386 $1,414 11.4% 11.0% 11.0% 11.3% 11.5% 2Q23 3Q23 4Q23 1Q24 2Q24 On-balance sheet liquidity On-balance sheet liquidity / tangible assets Strong liquidity position On-balance sheet liquidity ($mm) Liquidity / Uninsured and Uncollateralized (UU) Deposits 2Q24 Sources of liq
Slide 18: Mortgage performance in 2Q 2024
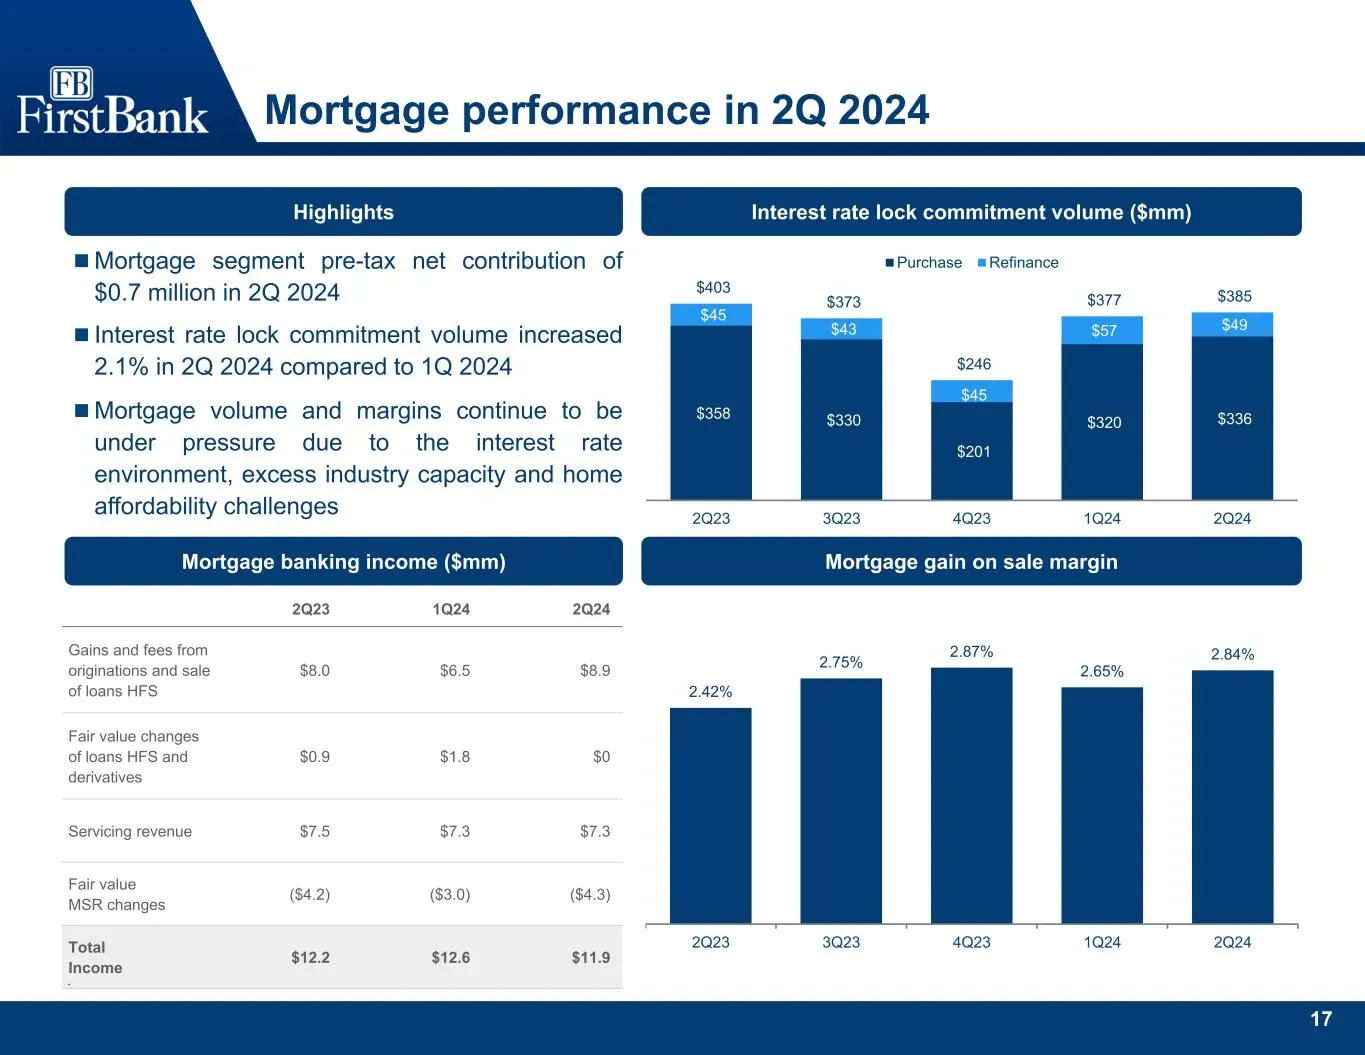
17 Mortgage performance in 2Q 2024 Highlights Mortgage segment pre-tax net contribution of $0.7 million in 2Q 2024 Interest rate lock commitment volume increased 2.1% in 2Q 2024 compared to 1Q 2024 Mortgage volume and margins continue to be under pressure due to the interest rate environment, ex
Slide 19: Appendix
18 Appendix
Slide 20: Adjusted net income and diluted earnings per share
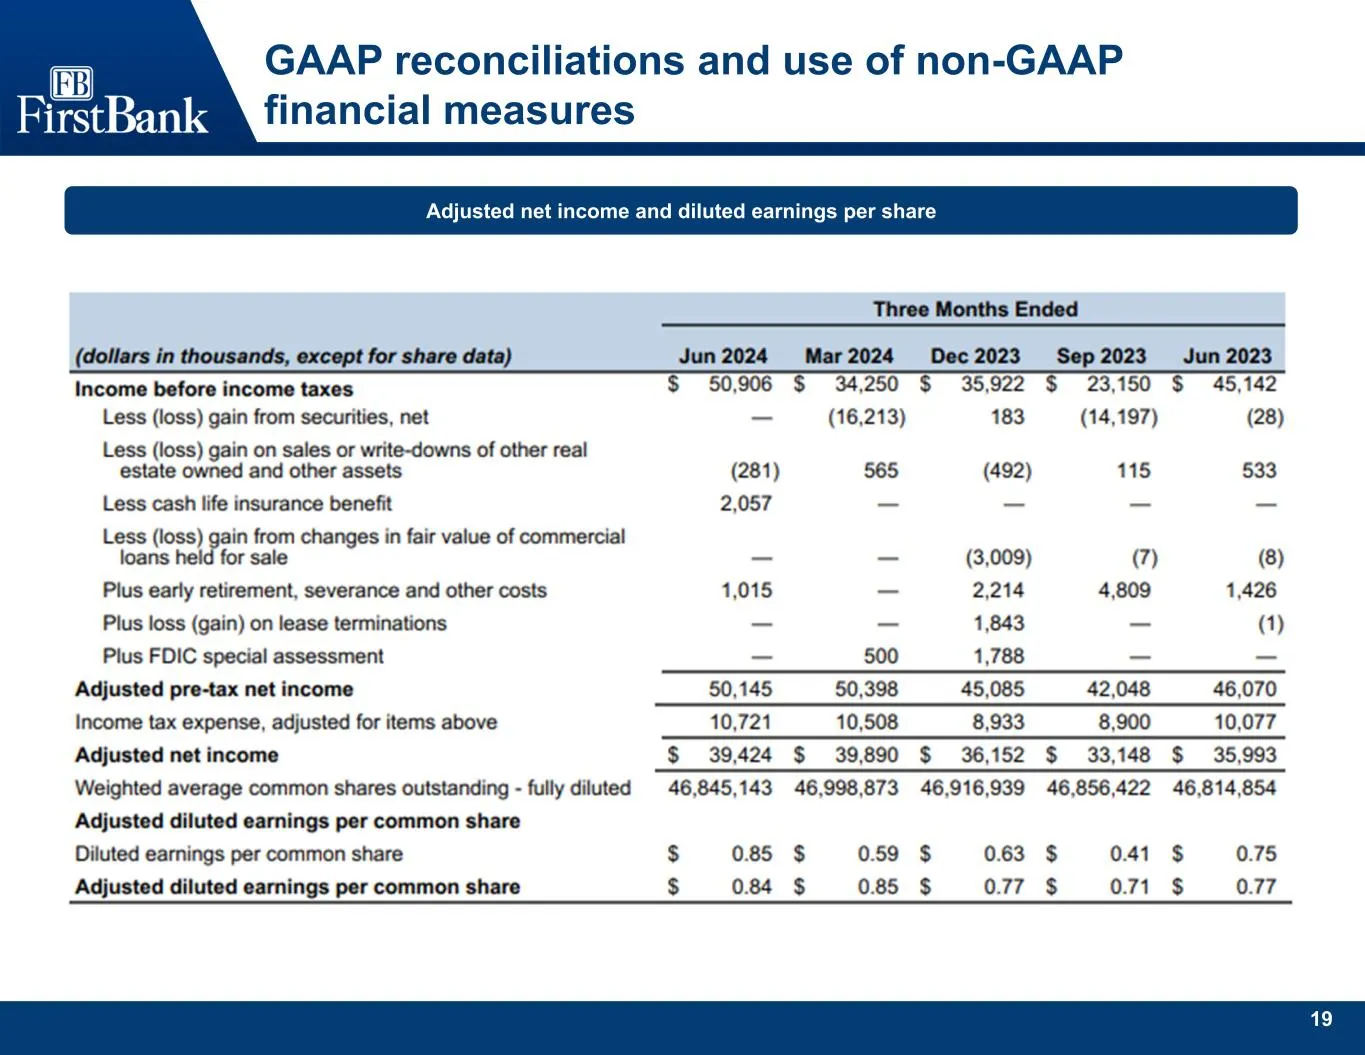
19 GAAP reconciliations and use of non-GAAP financial measures Adjusted net income and diluted earnings per share
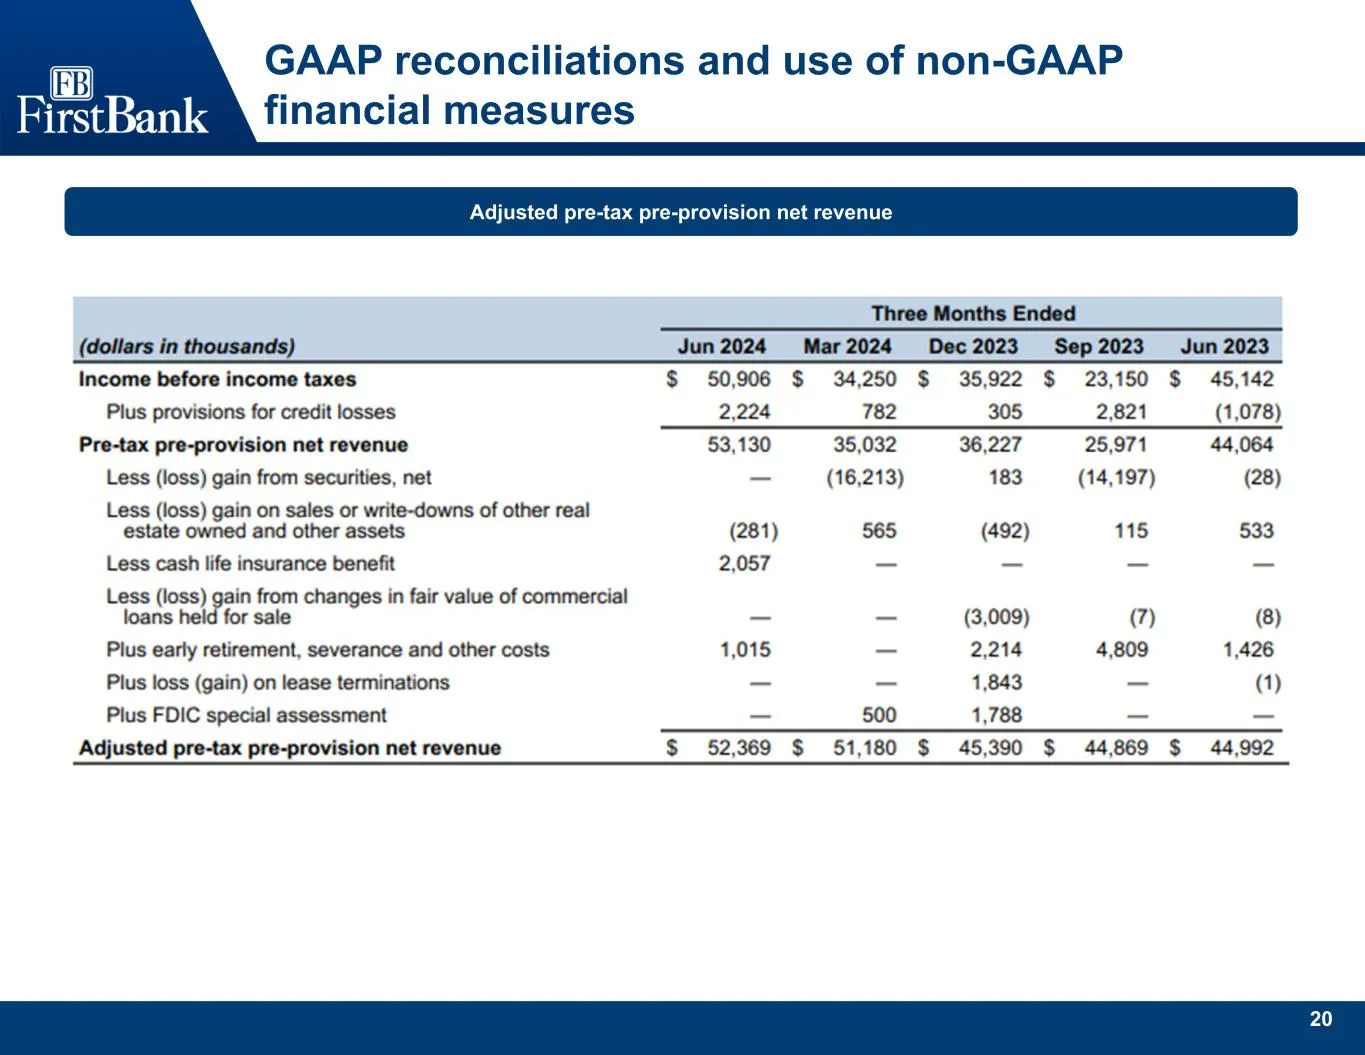
Slide 21: Adjusted pre-tax pre-provision net revenue
20 GAAP reconciliations and use of non-GAAP financial measures Adjusted pre-tax pre-provision net revenue
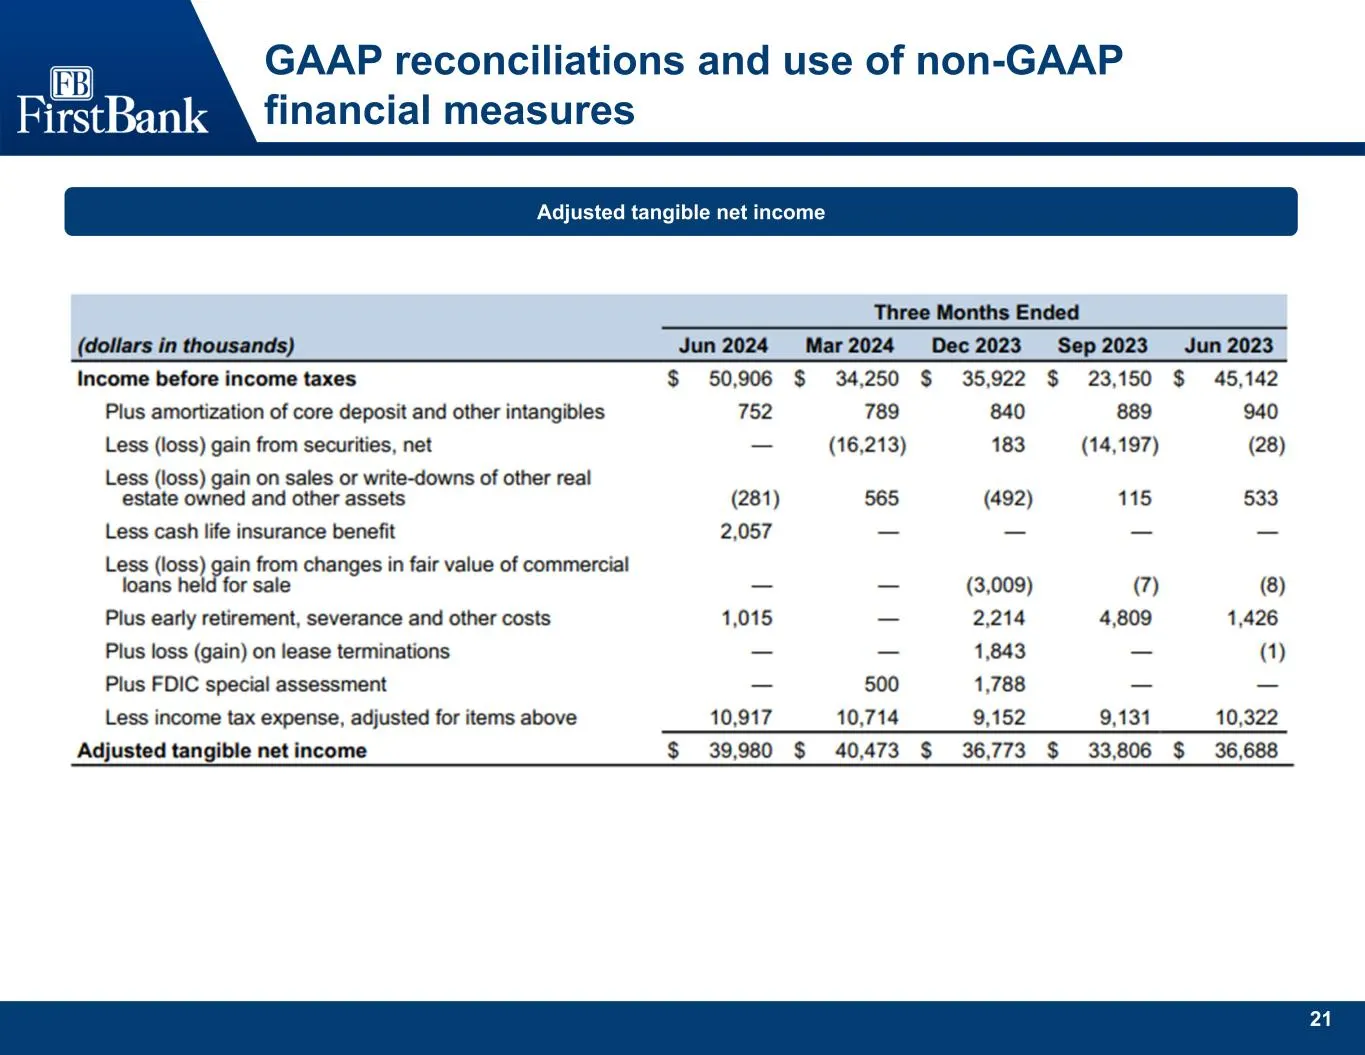
Slide 22: Adjusted tangible net income
21 GAAP reconciliations and use of non-GAAP financial measures Adjusted tangible net income
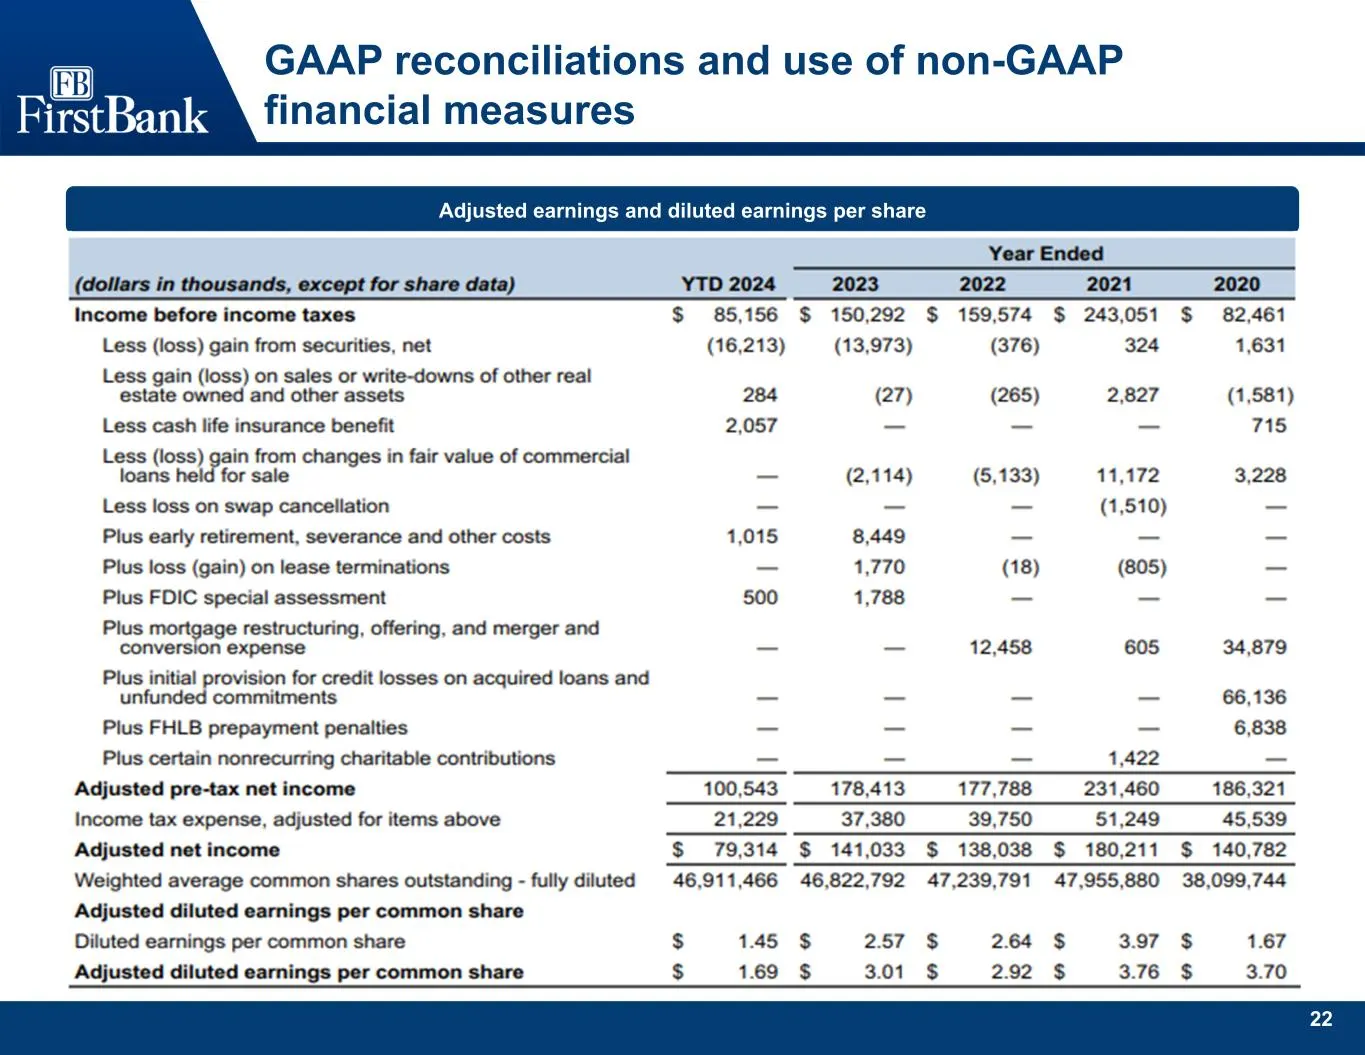
Slide 23: Adjusted earnings and diluted earnings per share
22 GAAP reconciliations and use of non-GAAP financial measures Adjusted earnings and diluted earnings per share
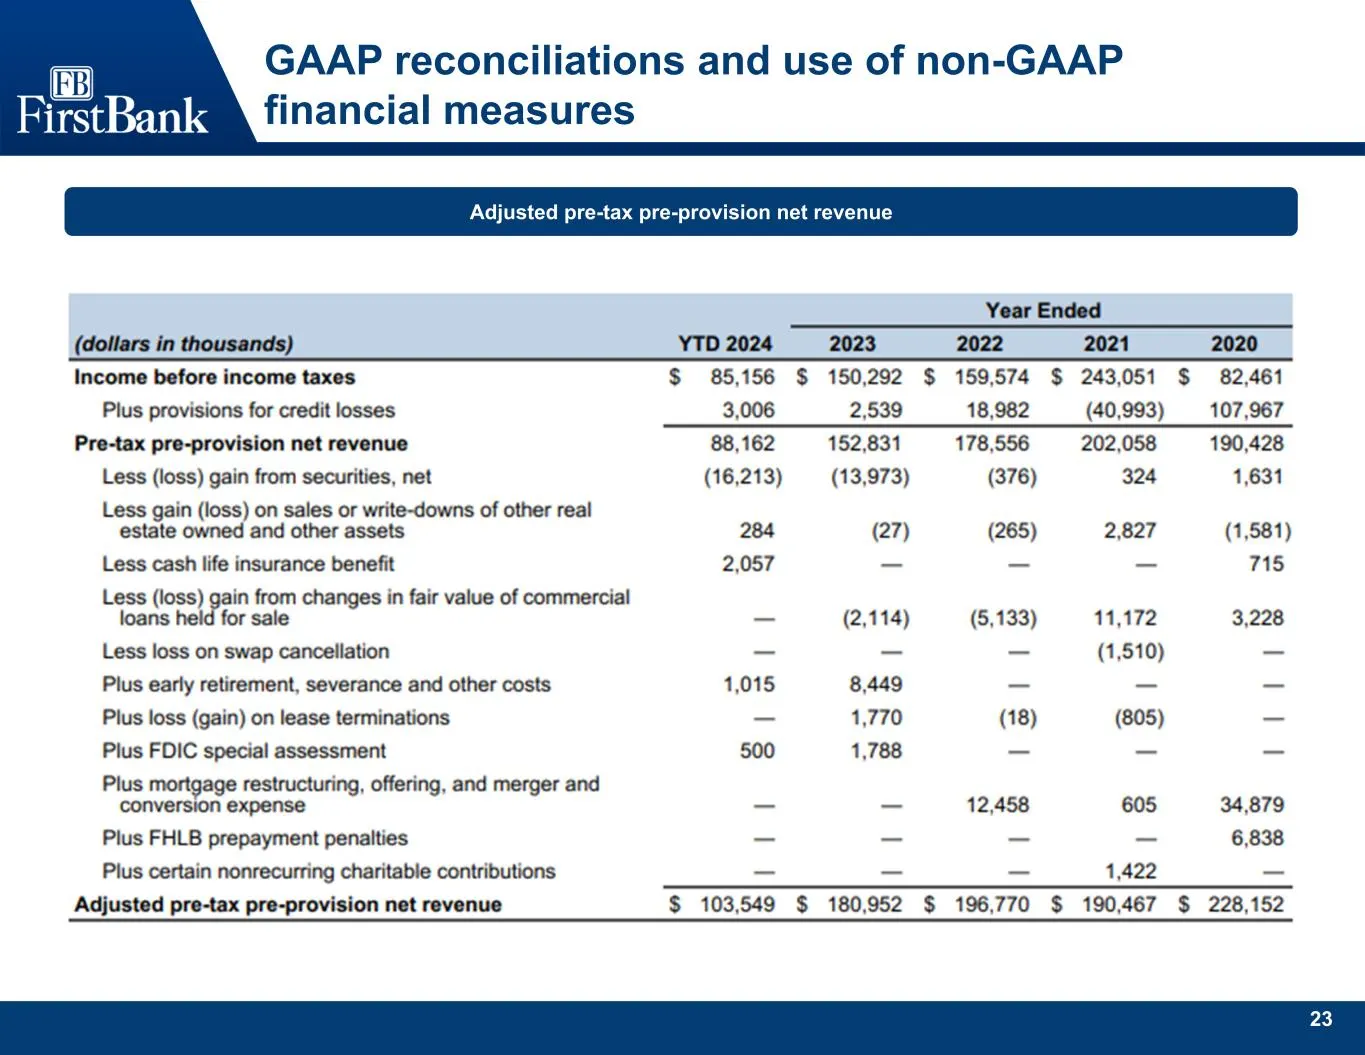
Slide 24: Adjusted pre-tax pre-provision net revenue
23 GAAP reconciliations and use of non-GAAP financial measures Adjusted pre-tax pre-provision net revenue
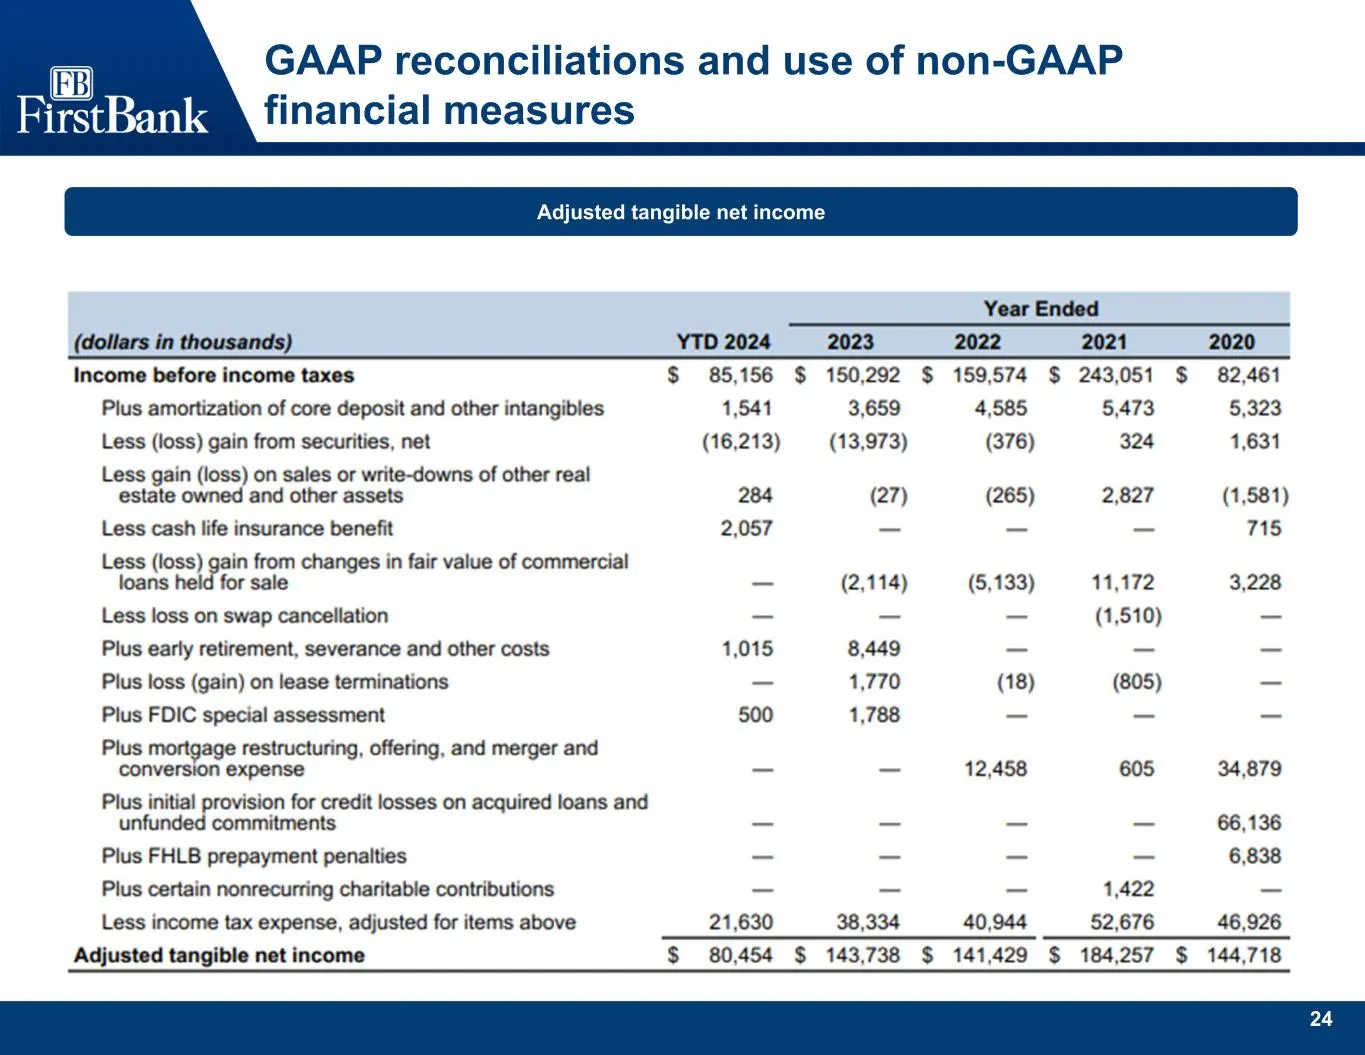
Slide 25: Adjusted tangible net income
24 GAAP reconciliations and use of non-GAAP financial measures Adjusted tangible net income
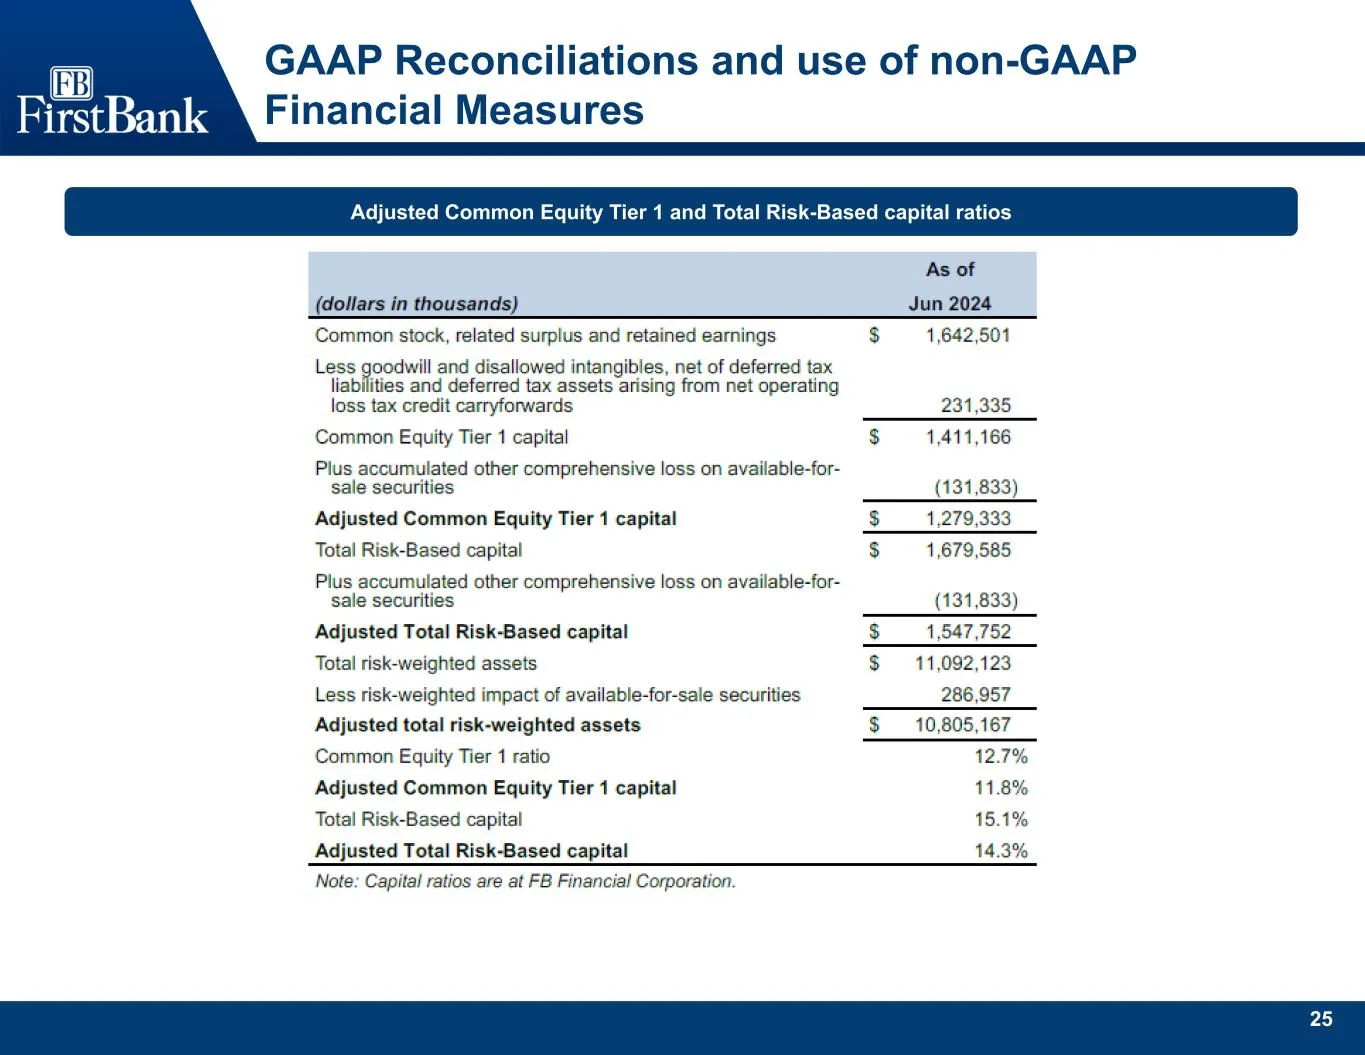
Slide 26: Adjusted Common Equity Tier 1 and Total Risk-Based capital ratios
25 GAAP Reconciliations and use of non-GAAP Financial Measures Adjusted Common Equity Tier 1 and Total Risk-Based capital ratios
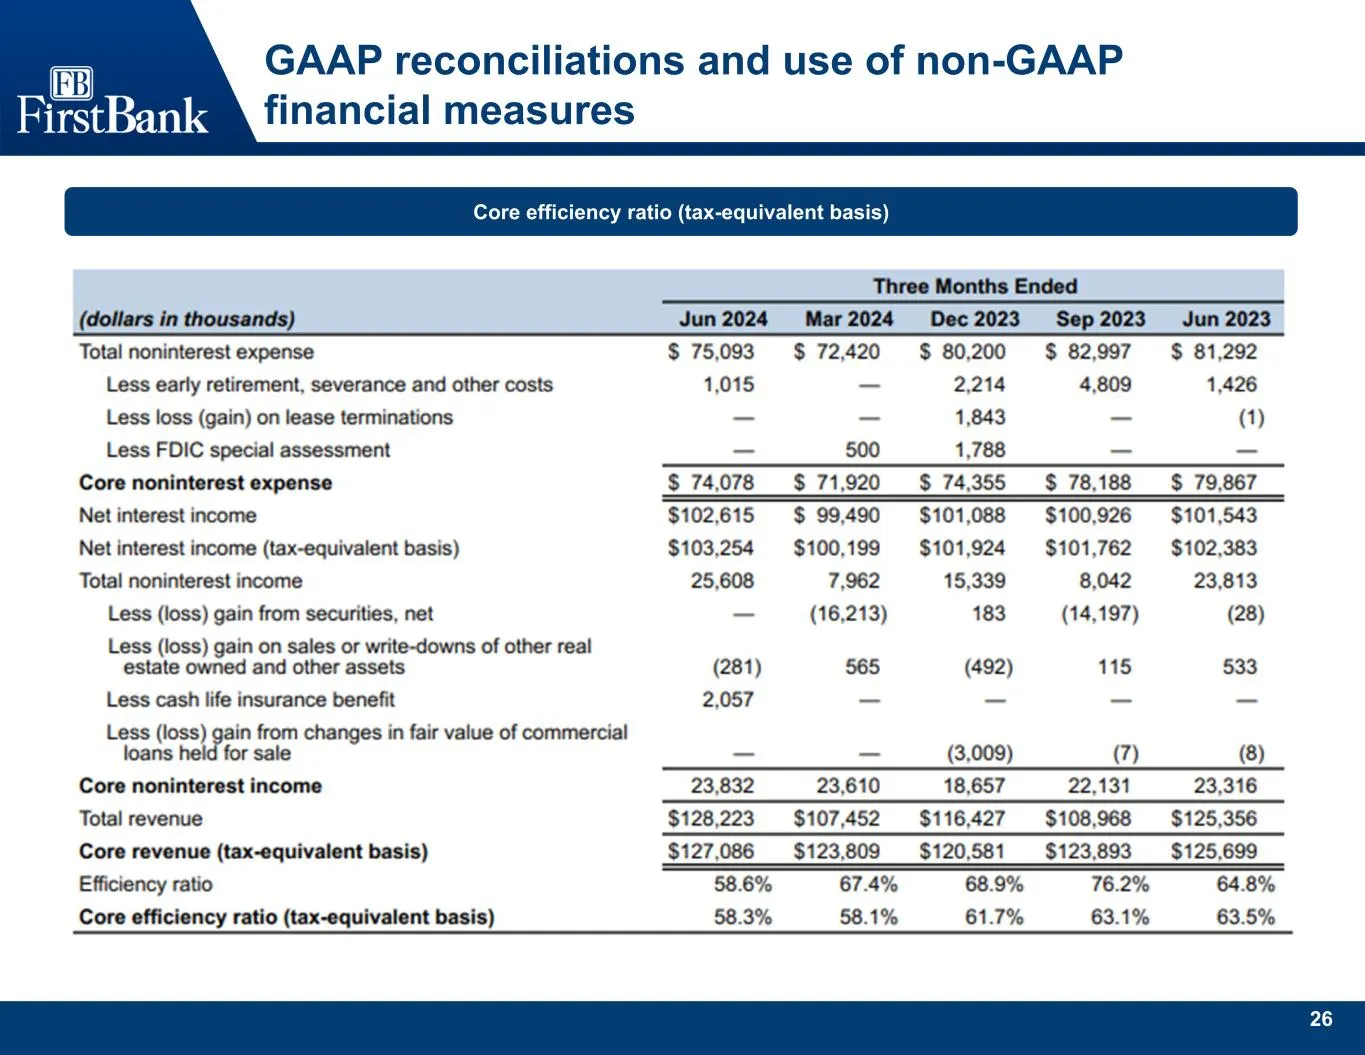
Slide 27: Core efficiency ratio (tax-equivalent basis)
26 GAAP reconciliations and use of non-GAAP financial measures Core efficiency ratio (tax-equivalent basis)
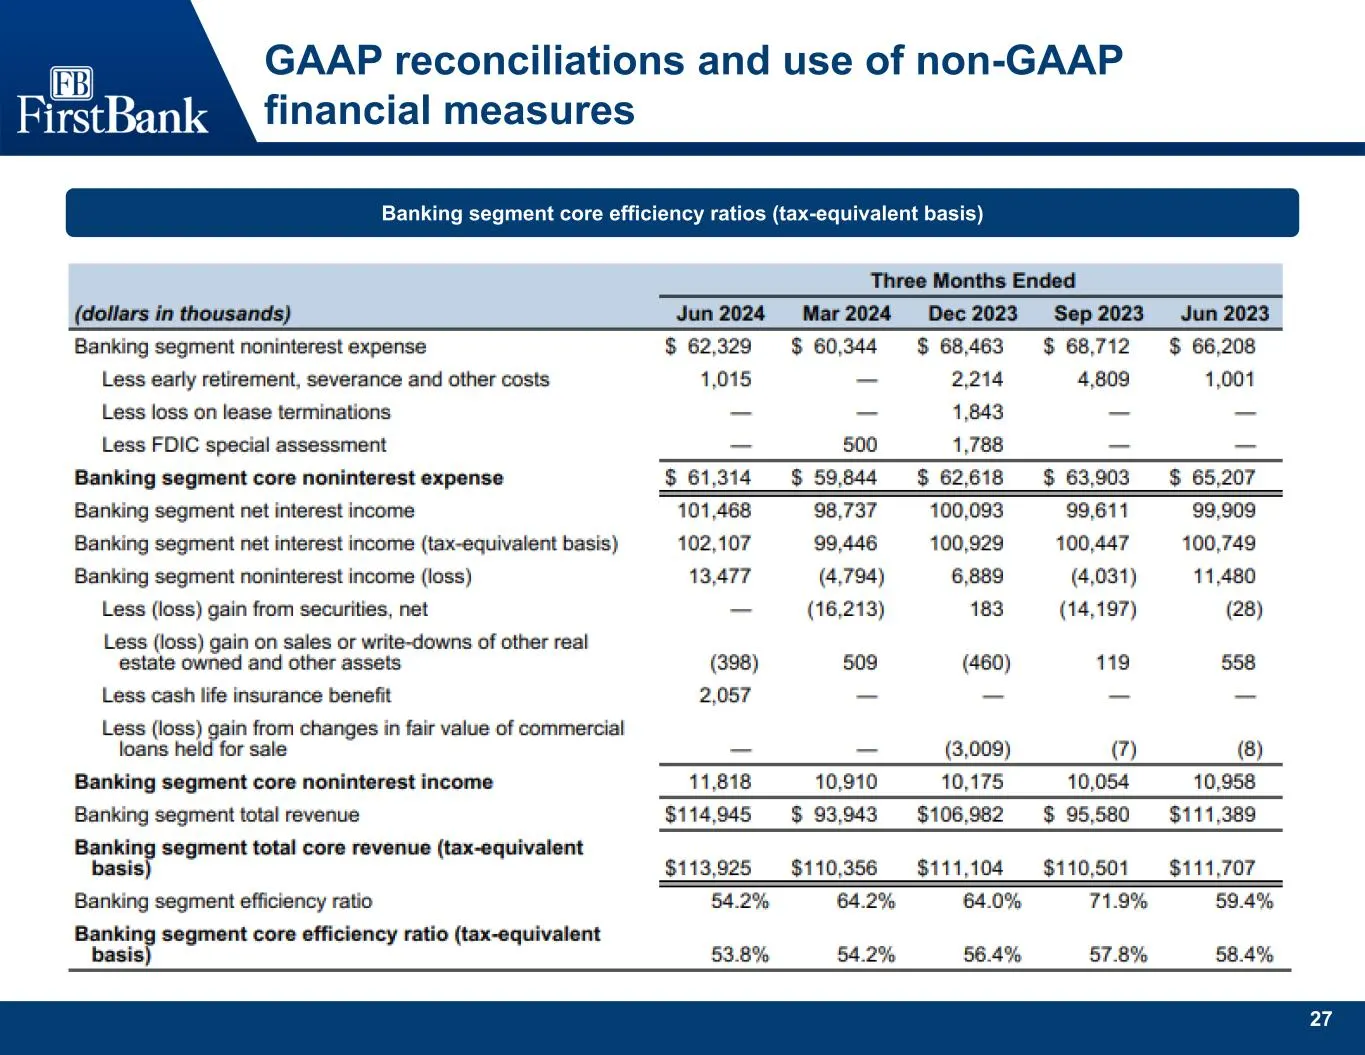
Slide 28: Banking segment core efficiency ratios (tax-equivalent basis)
27 GAAP reconciliations and use of non-GAAP financial measures Banking segment core efficiency ratios (tax-equivalent basis)
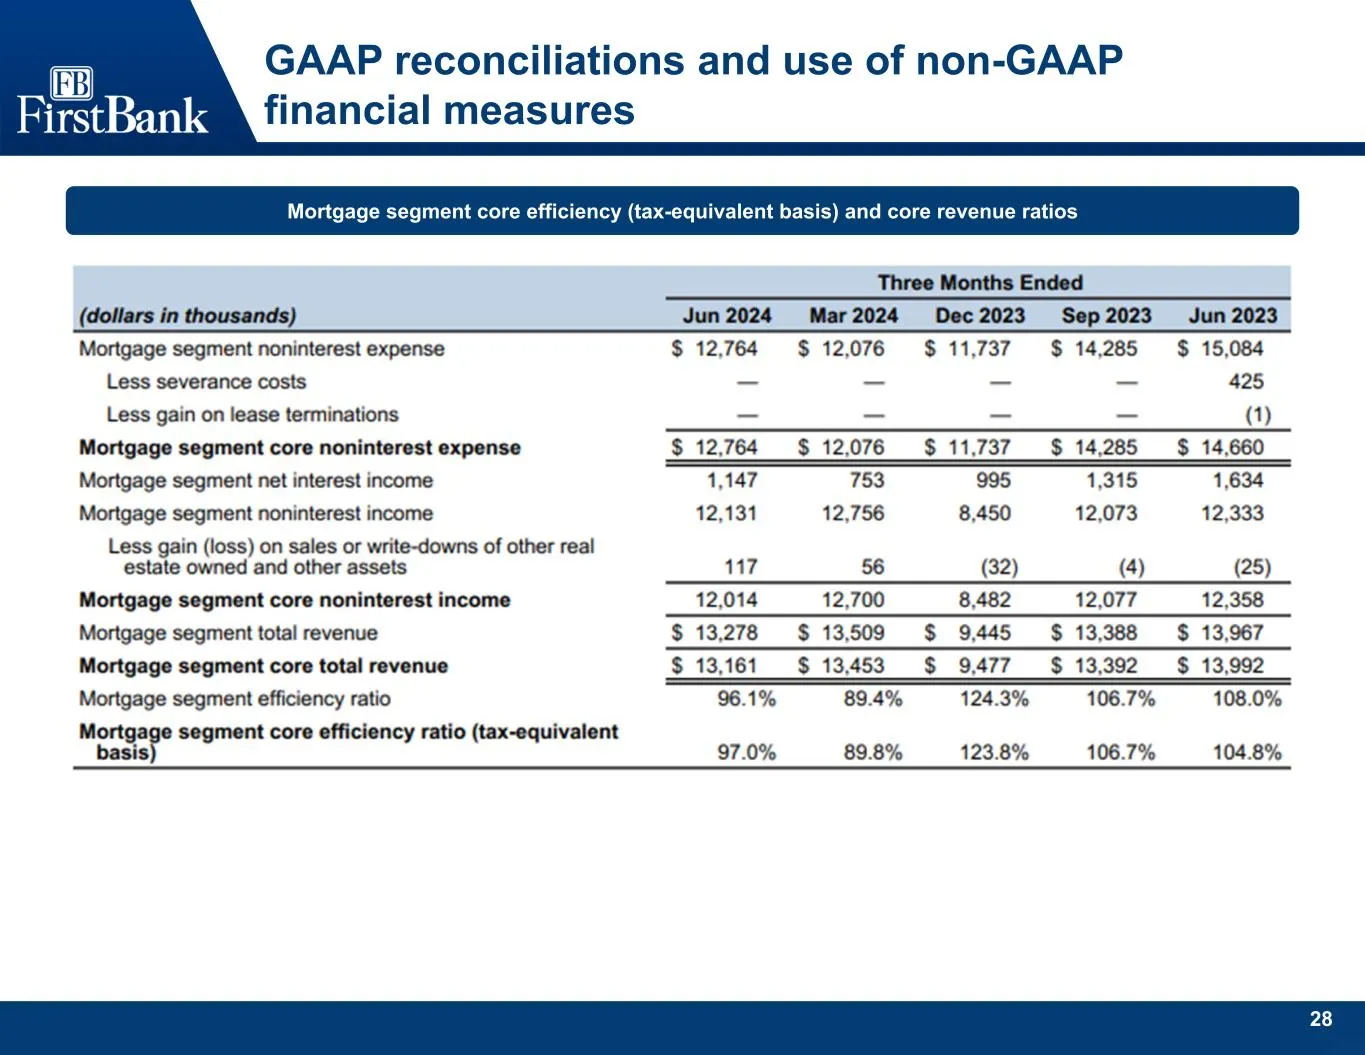
Slide 29: Mortgage segment core efficiency and core revenue ratios
28 GAAP reconciliations and use of non-GAAP financial measures Mortgage segment core efficiency (tax-equivalent basis) and core revenue ratios
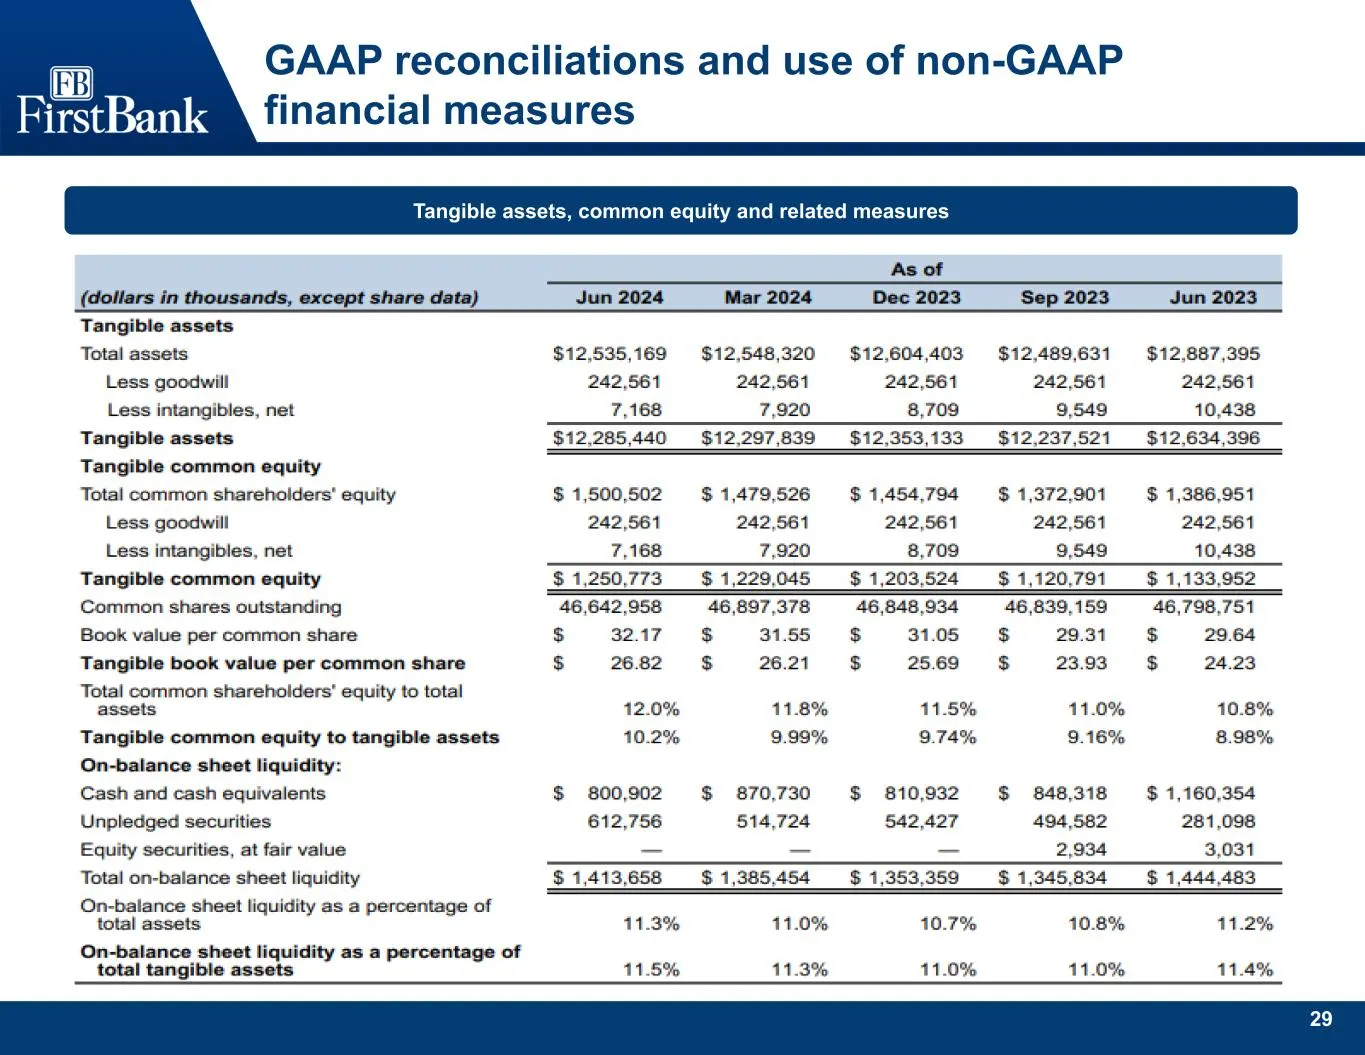
Slide 30: Tangible assets, common equity and related measures
29 GAAP reconciliations and use of non-GAAP financial measures Tangible assets, common equity and related measures
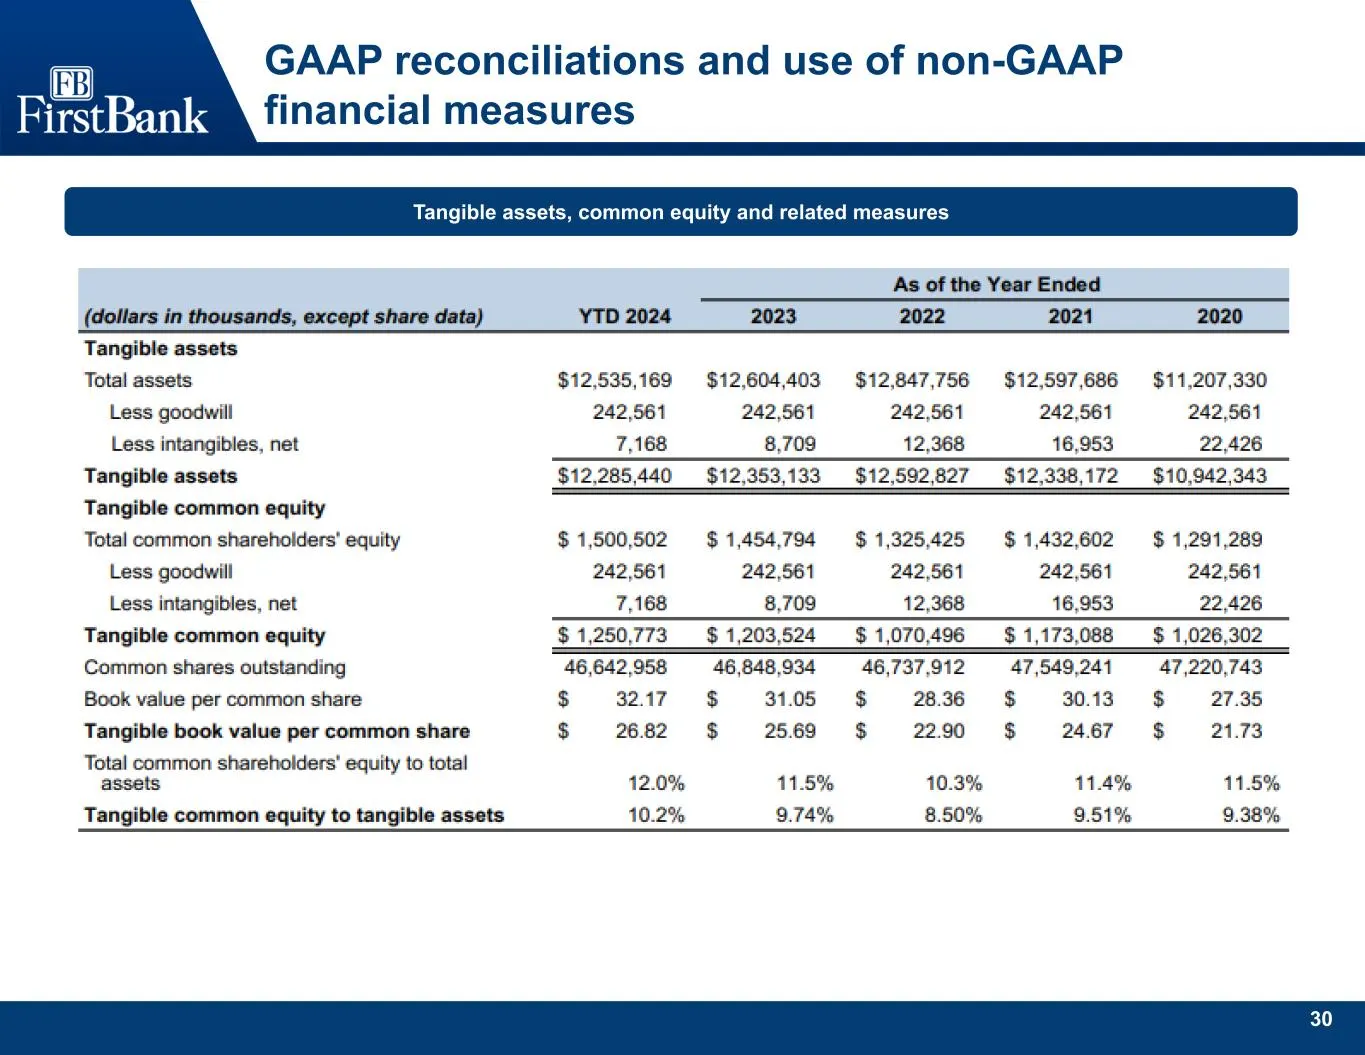
Slide 31: Tangible assets, common equity and related measures
30 GAAP reconciliations and use of non-GAAP financial measures Tangible assets, common equity and related measures
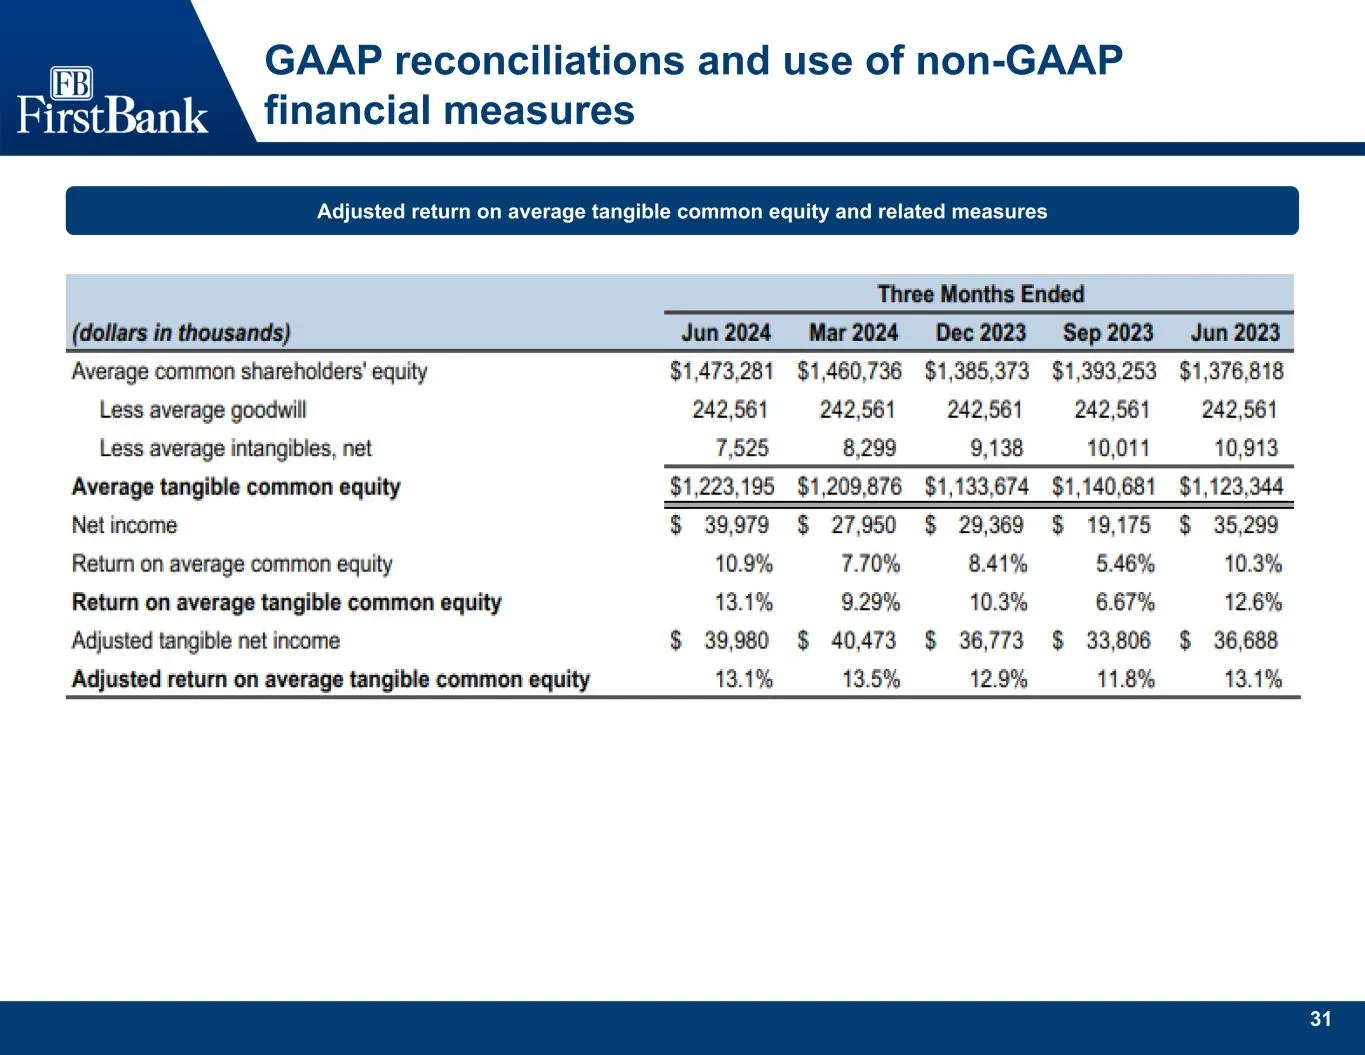
Slide 32: Adjusted return on average tangible common equity and related measures
31 GAAP reconciliations and use of non-GAAP financial measures Adjusted return on average tangible common equity and related measures
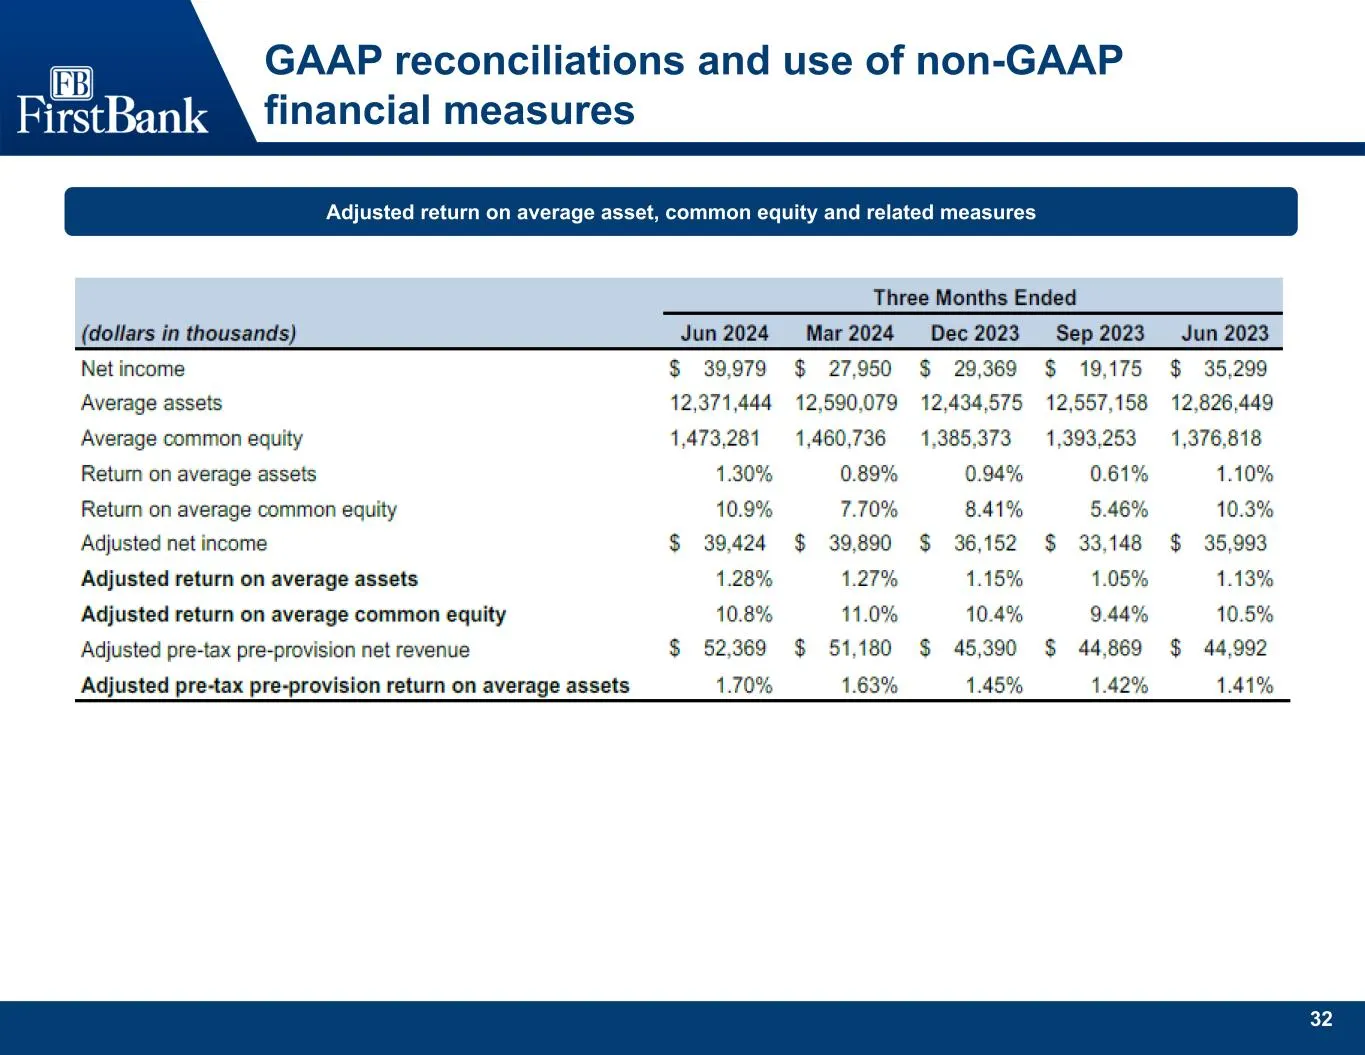
Slide 33: Adjusted return on average asset, common equity and related measures
32 GAAP reconciliations and use of non-GAAP financial measures Adjusted return on average asset, common equity and related measures
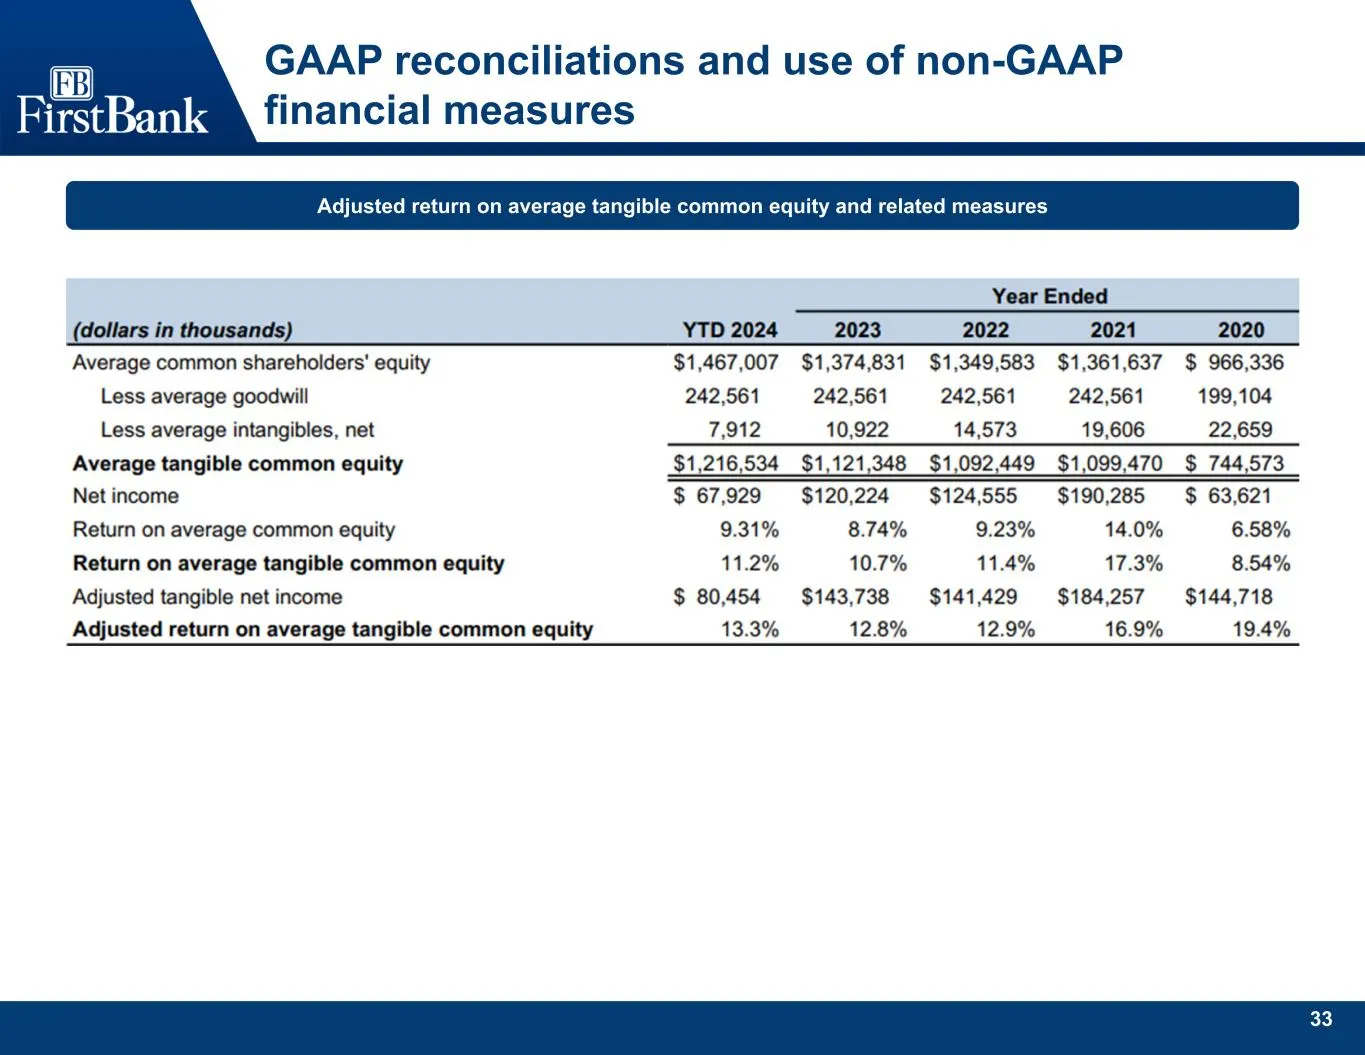
Slide 34: Adjusted return on average tangible common equity and related measures
33 GAAP reconciliations and use of non-GAAP financial measures Adjusted return on average tangible common equity and related measures
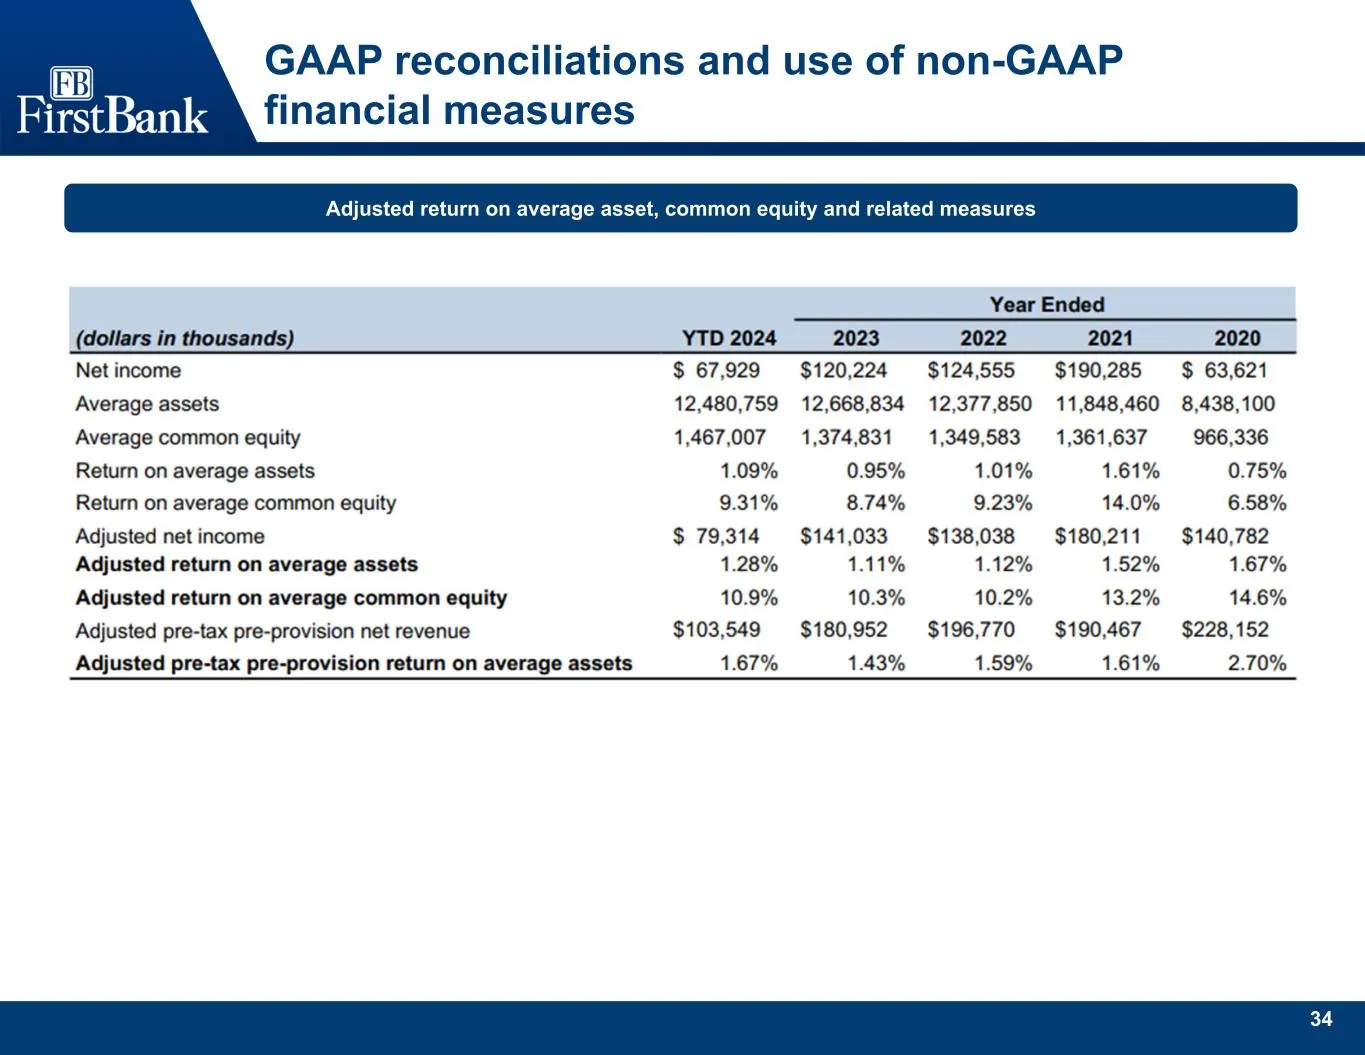
Slide 35: Adjusted return on average asset, common equity and related measures
34 GAAP reconciliations and use of non-GAAP financial measures Adjusted return on average asset, common equity and related measures
Source: SEC EDGAR · 8-K filed Sep 3, 2024
More decks from FB Financial Corporation
 Q3 2026 Earnings Presentation39 slides · Nov 16, 2026
 Q3 2026 Earnings Presentation36 slides · Oct 13, 2026
 IPO Roadshow (September 2026)42 slides · Sep 21, 2026
 Debt Investor Presentation (September 2026)40 slides · Sep 17, 2026
 Q2 2026 Earnings Presentation37 slides · Jul 27, 2026
 Q2 2026 Earnings Presentation34 slides · Jul 14, 2026