FB Financial Corporation · NYSE:FBK
FB Financial — Q3 2026 Earnings Presentation
39 slides from FB Financial's earnings presentation, Nov 16, 2026
Slide 1: 2026 Fourth Quarter Investor Presentation
November 17, 2026 2026 Fourth Quarter Investor Presentation
Slide 2: Forward-looking statements
1 Forward–looking statements Certain statements contained in this Presentation that are not historical in nature may be considered forward-looking statements within the meaning of the Private Securities Litigation Reform Act of 1995. Forward-looking statements represent the Company’s current expecta
Slide 3: Use of non-GAAP financial measures
2 Use of non-GAAP financial measures This Presentation contains certain financial measures that are not measures recognized under U.S. generally accepted accounting principles (“GAAP”) and therefore are considered non-GAAP financial measures. These non-GAAP financial measures may include, without li
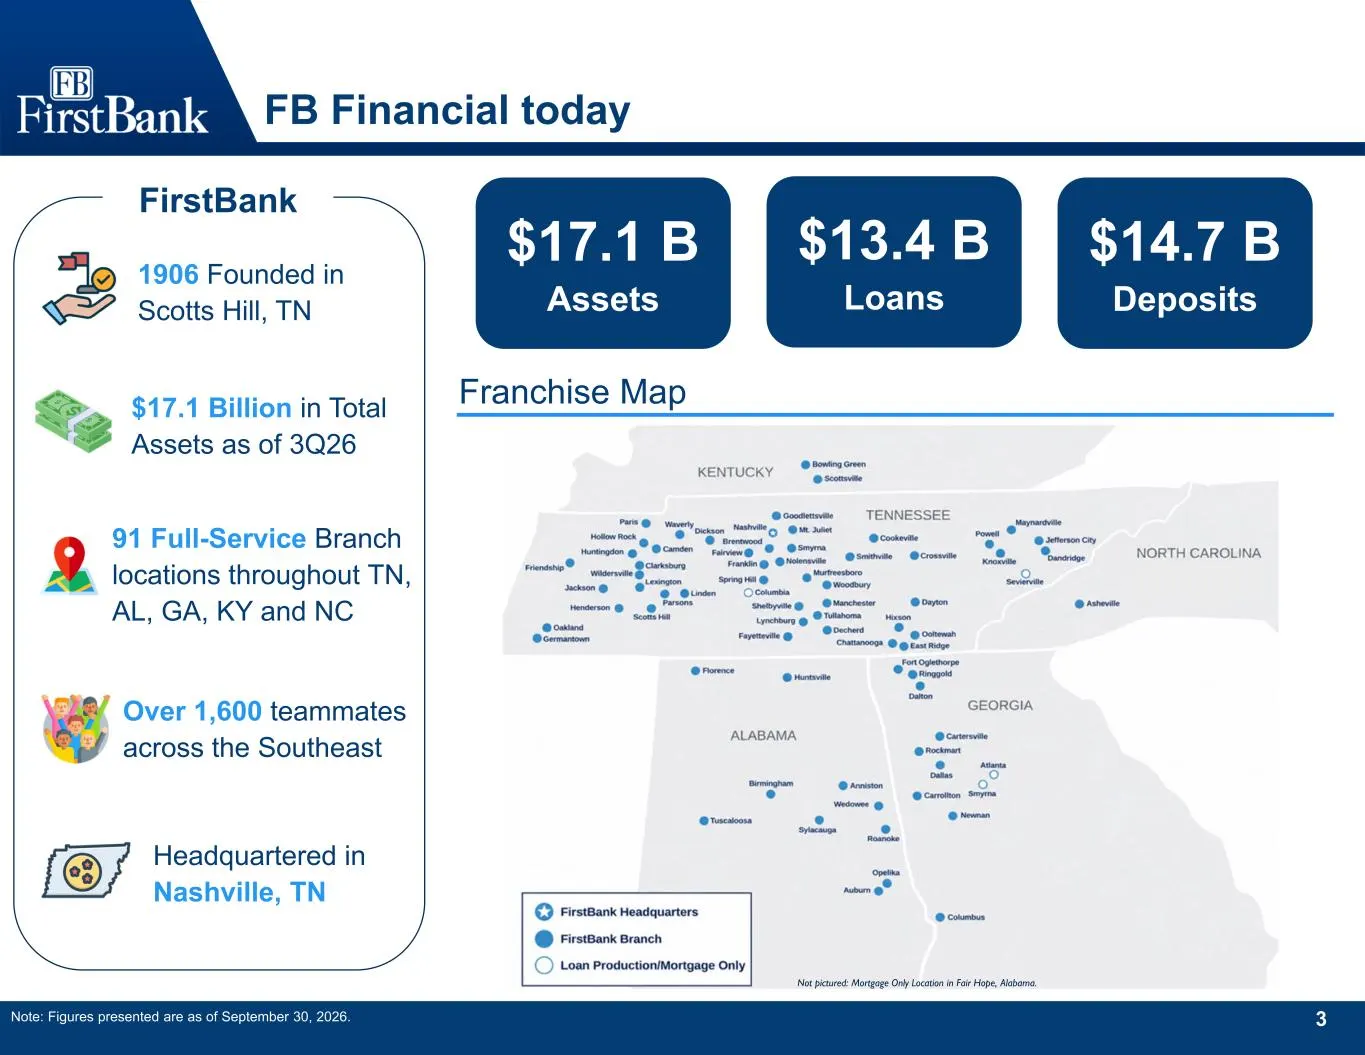
Slide 4: FB Financial today
3 FB Financial today Note: Figures presented are as of September 30, 2026. FirstBank Franchise Map 1906 Founded in Scotts Hill, TN $17.1 Billion in Total Assets as of 3Q26 91 Full-Service Branch locations throughout TN, AL, GA, KY and NC Headquartered in Nashville, TN Over 1,600 teammates across the
Slide 5: Company Overview
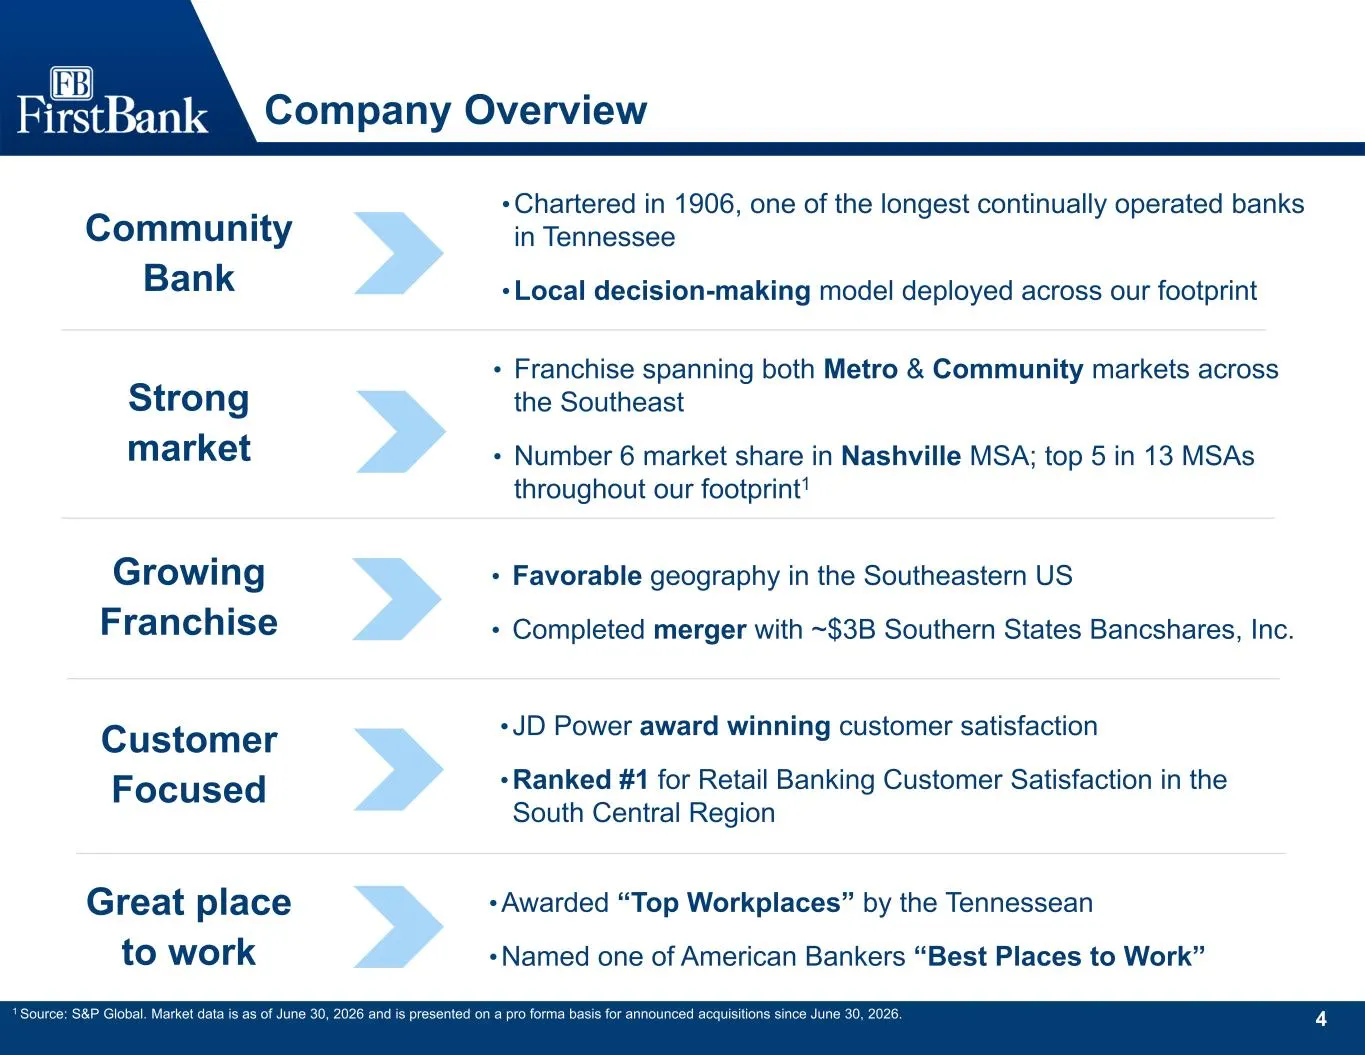
4 Company Overview Community Bank •Chartered in 1906, one of the longest continually operated banks in Tennessee •Local decision-making model deployed across our footprint Strong market • Franchise spanning both Metro & Community markets across the Southeast • Number 6 market share in Nashville MSA;
Slide 6: Strategic drivers
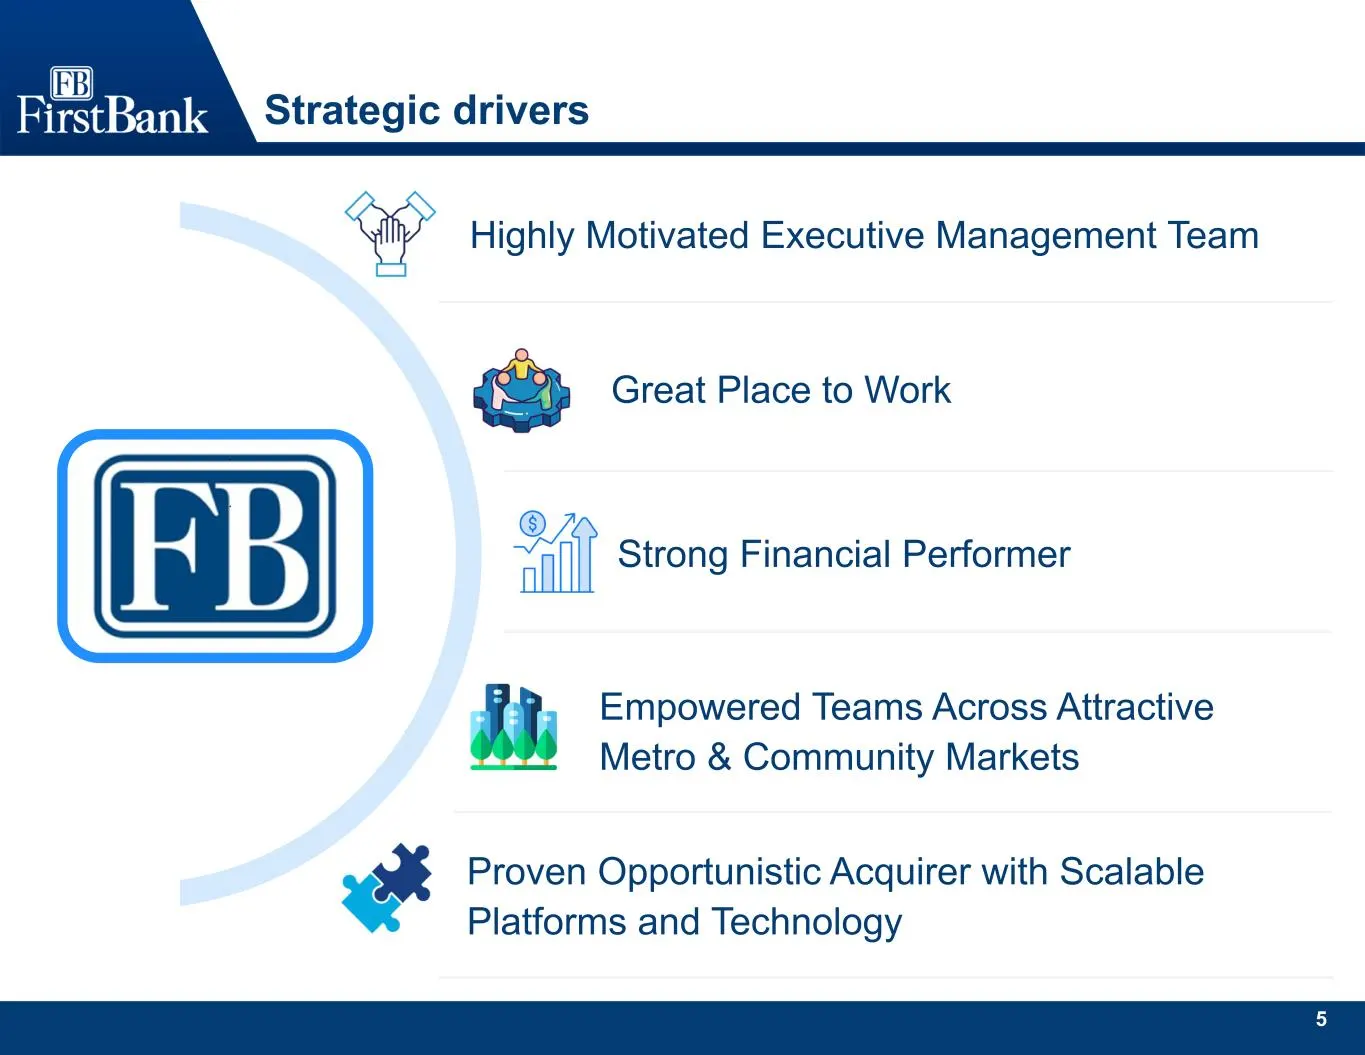
5 Strategic drivers Highly Motivated Executive Management Team Great Place to Work Strong Financial Performer Empowered Teams Across Attractive Metro & Community Markets Proven Opportunistic Acquirer with Scalable Platforms and Technology
Slide 7: Recent Corporate History
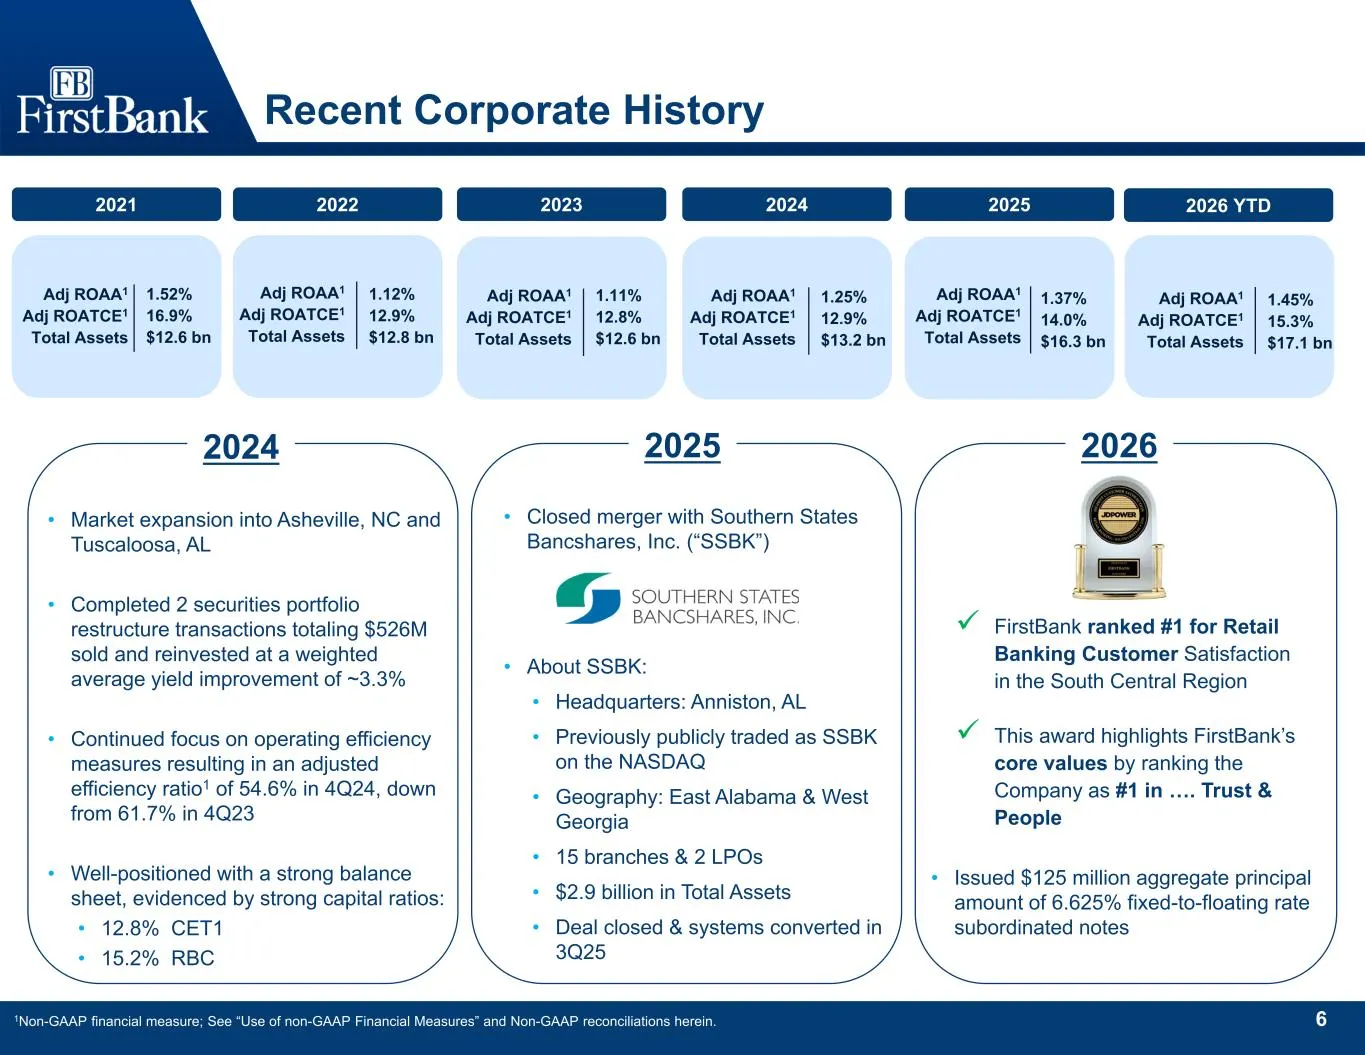
6 Recent Corporate History • Market expansion into Asheville, NC and Tuscaloosa, AL • Completed 2 securities portfolio restructure transactions totaling $526M sold and reinvested at a weighted average yield improvement of ~3.3% • Continued focus on operating efficiency measures resulting in an adjus
Slide 8: Strong deposit market share
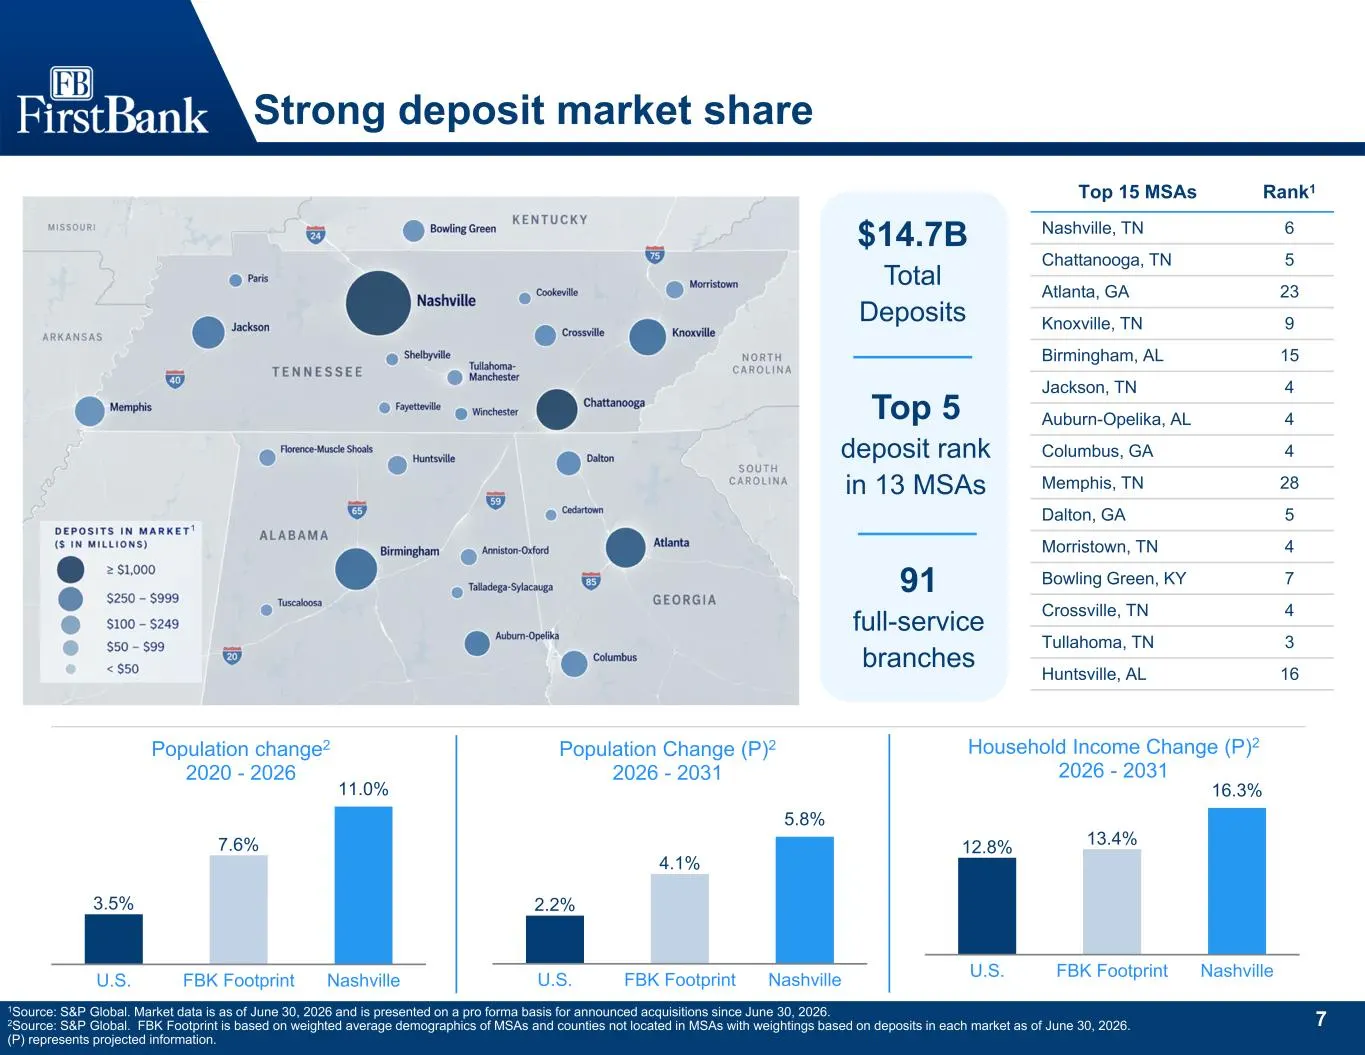
7 Strong deposit market share 1Source: S&P Global. Market data is as of June 30, 2026 and is presented on a pro forma basis for announced acquisitions since June 30, 2026. 2Source: S&P Global. FBK Footprint is based on weighted average demographics of MSAs and counties not located in MSAs with weigh
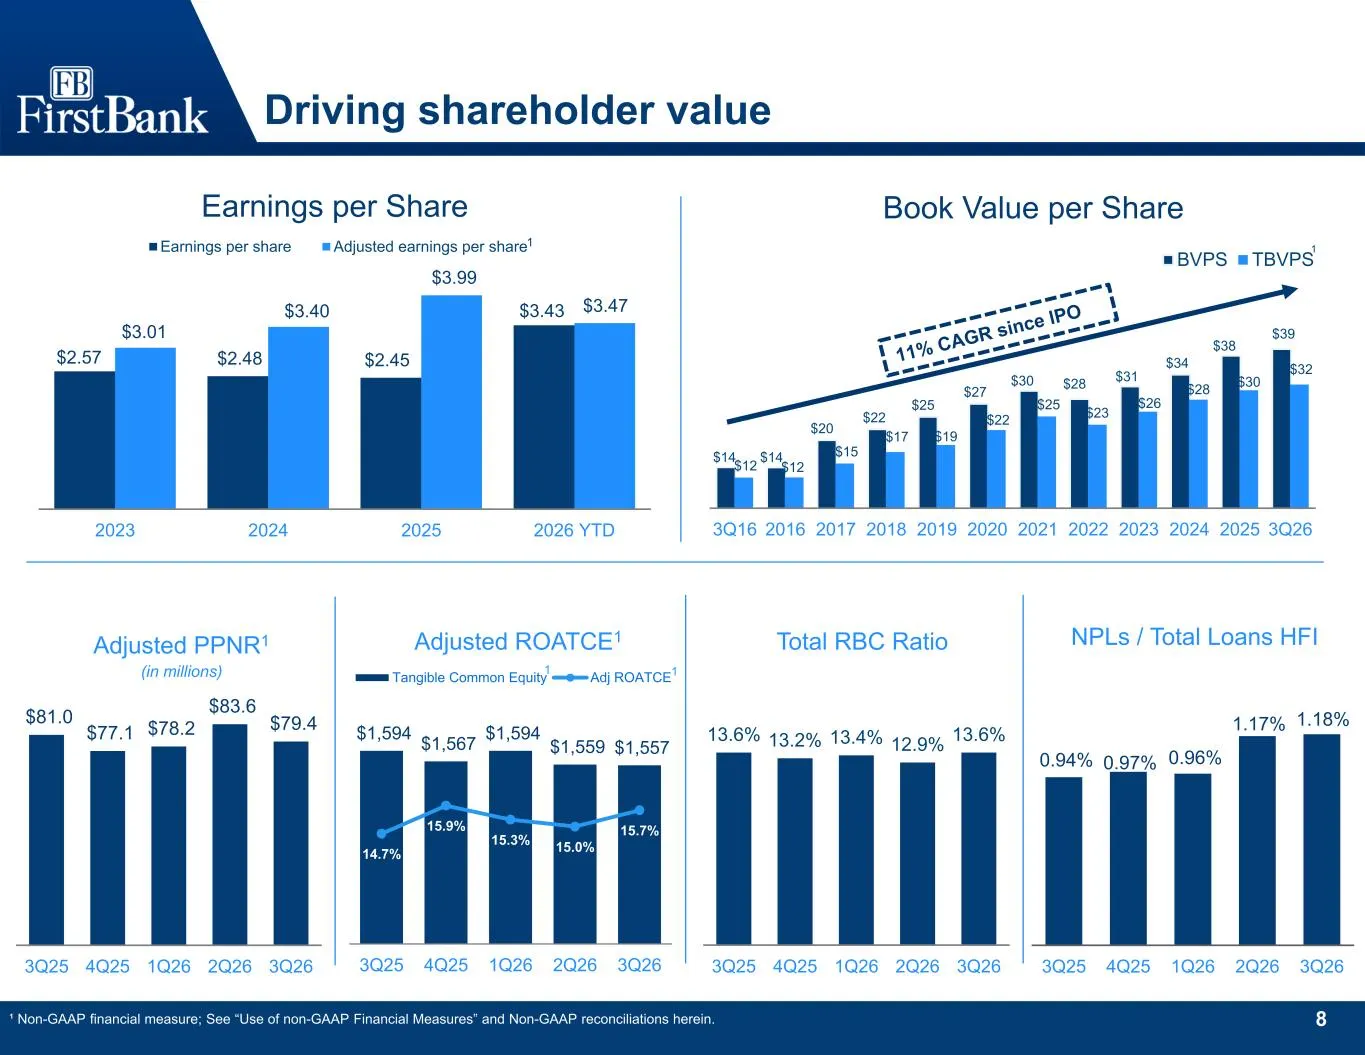
Slide 9: Driving shareholder value
8 Driving shareholder value ¹ Non-GAAP financial measure; See “Use of non-GAAP Financial Measures” and Non-GAAP reconciliations herein. $2.57 $2.48 $2.45 $3.43 $3.01 $3.40 $3.99 $3.47 2023 2024 2025 2026 YTD Earnings per share Adjusted earnings per share Earnings per Share $14 $14 $20 $22 $25 $27 $3
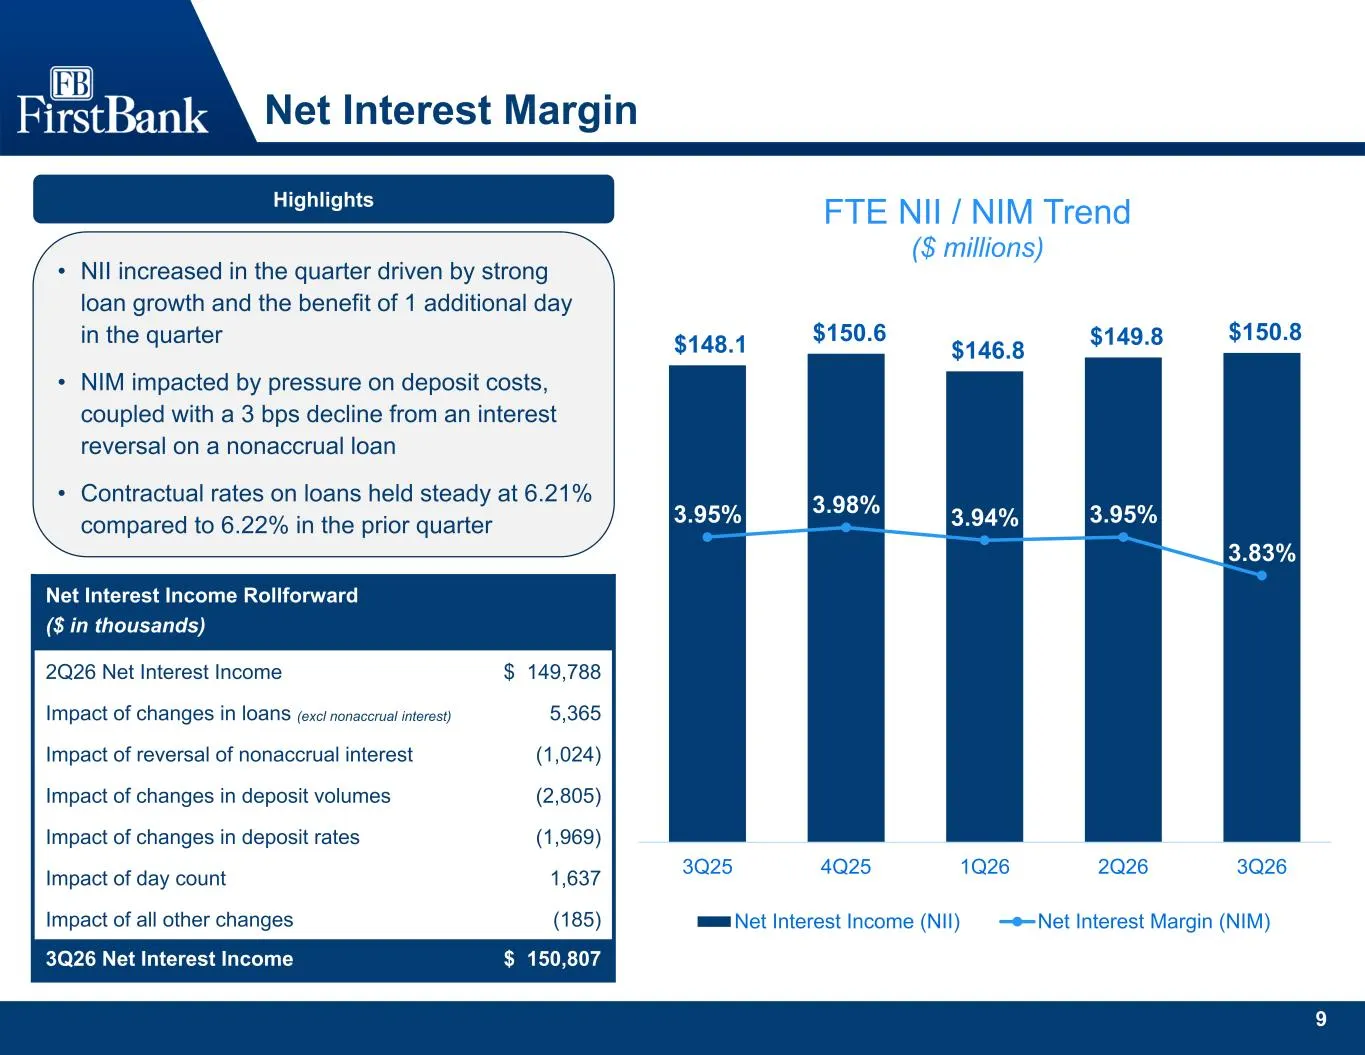
Slide 10: Net Interest Margin
9 Net Interest Margin $148.1 $150.6 $146.8 $149.8 $150.8 3.95% 3.98% 3.94% 3.95% 3.83% 3Q25 4Q25 1Q26 2Q26 3Q26 FTE NII / NIM Trend ($ millions) Net Interest Income (NII) Net Interest Margin (NIM) Highlights Net Interest Income Rollforward ($ in thousands) $ 149,7882Q26 Net Interest Income 5,365Impa
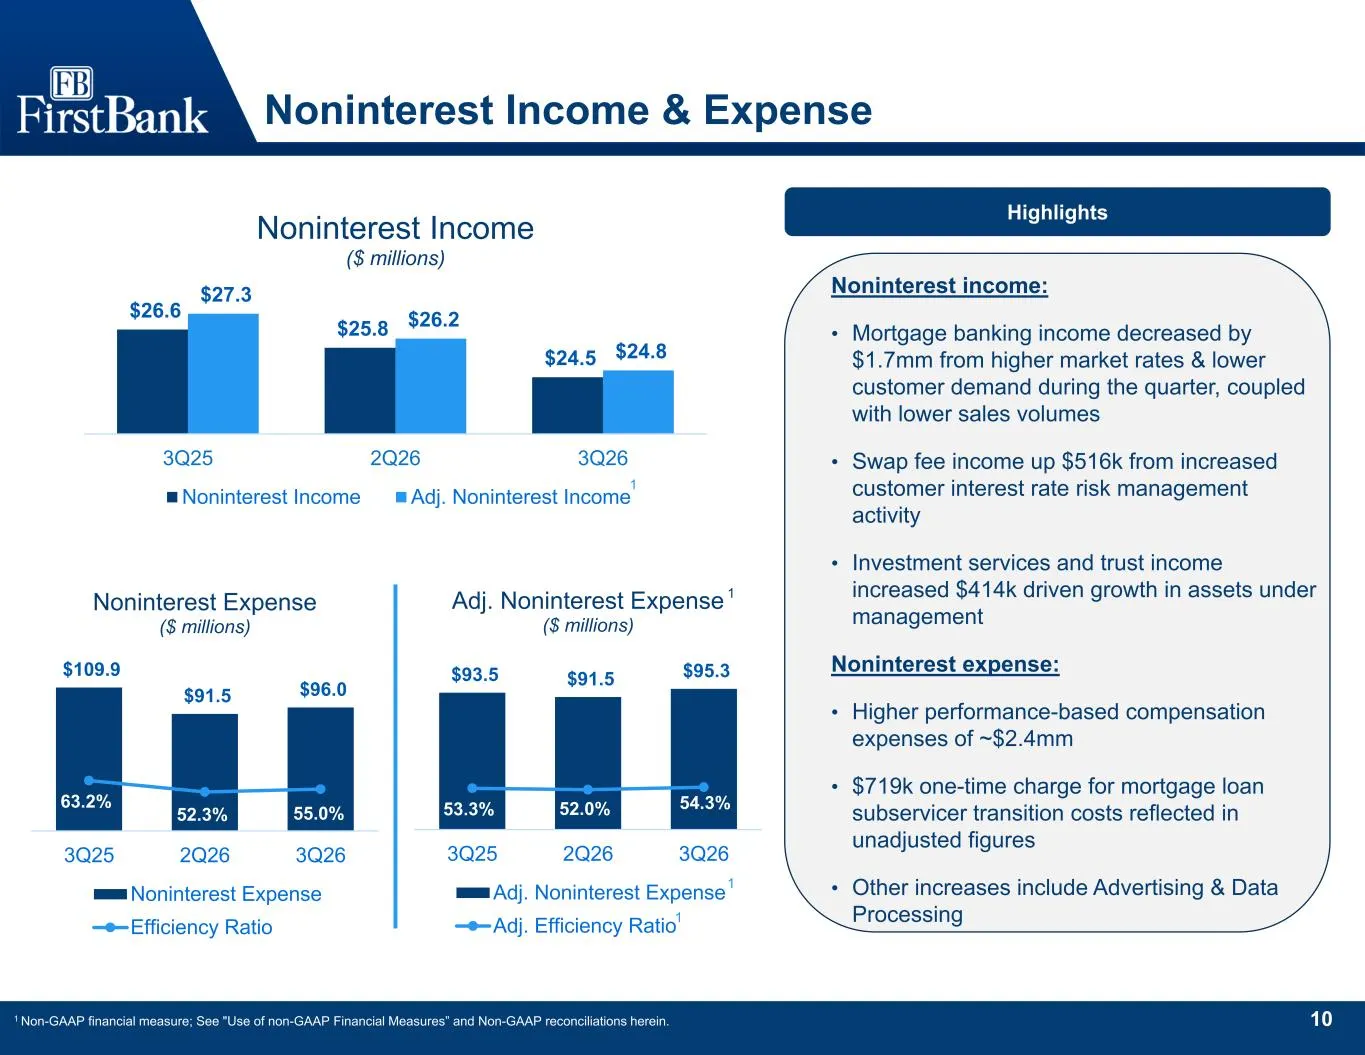
Slide 11: Noninterest Income & Expense
10 Noninterest Income & Expense $109.9 $91.5 $96.0 63.2% 52.3% 55.0% 3Q25 2Q26 3Q26 Noninterest Expense ($ millions) Noninterest Expense Efficiency Ratio $93.5 $91.5 $95.3 53.3% 52.0% 54.3% 3Q25 2Q26 3Q26 Adj. Noninterest Expense ($ millions) Adj. Noninterest Expense Adj. Efficiency Ratio $26.6 $25.
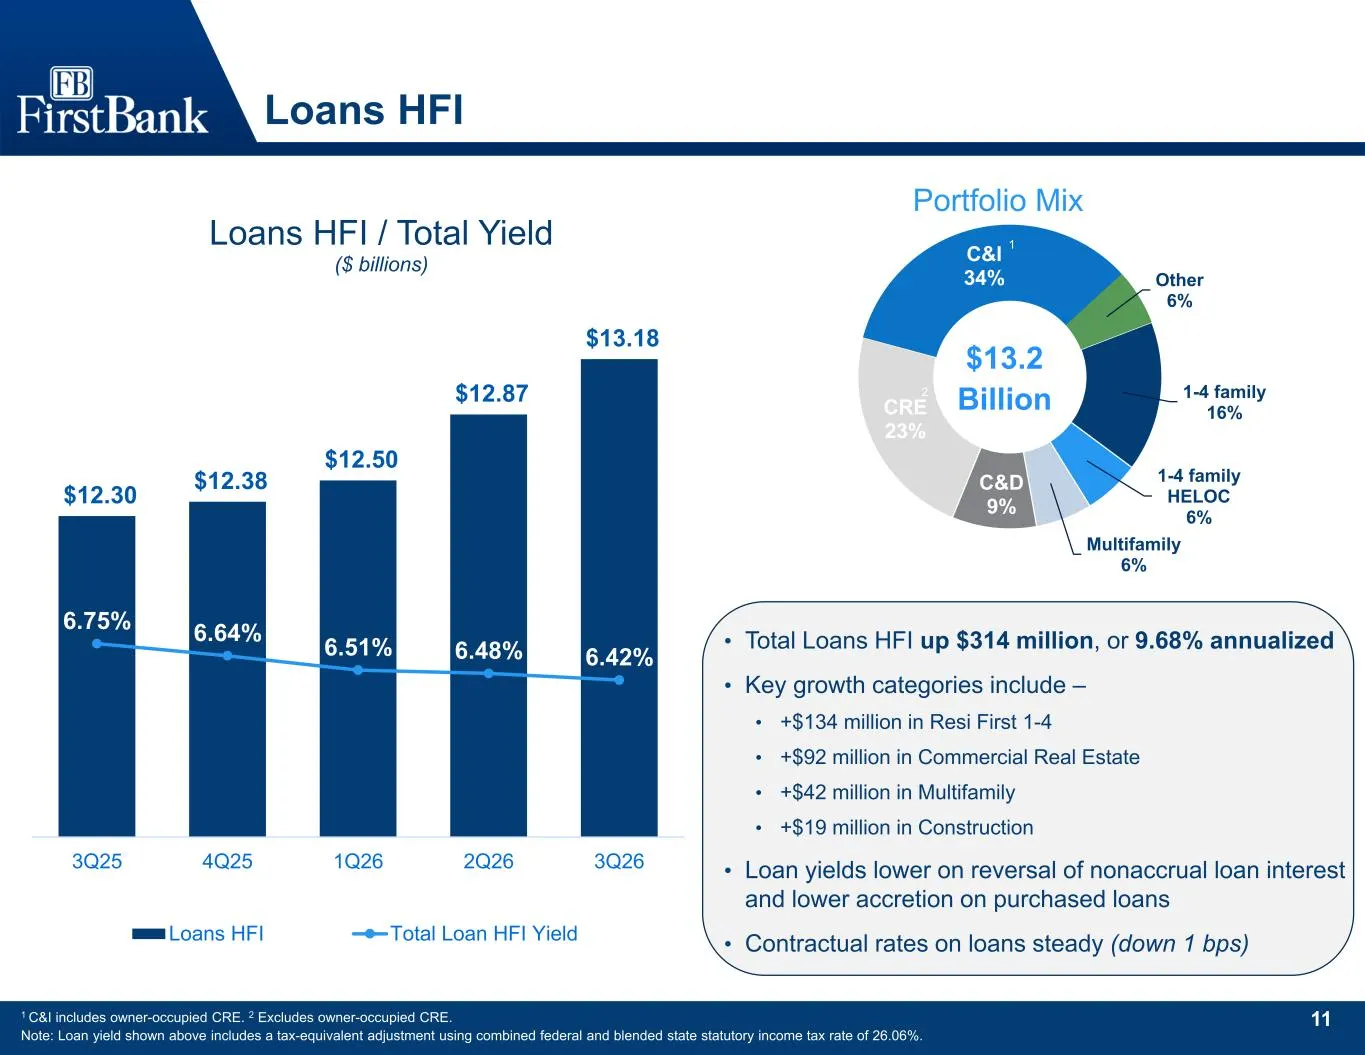
Slide 12: Loans HFI
11 Loans HFI $12.30 $12.38 $12.50 $12.87 $13.18 6.75% 6.64% 6.51% 6.48% 6.42% 3Q25 4Q25 1Q26 2Q26 3Q26 Loans HFI / Total Yield ($ billions) Loans HFI Total Loan HFI Yield 1-4 family 16% 1-4 family HELOC 6% Multifamily 6% C&D 9% CRE 23% C&I 34% Other 6% Portfolio Mix $13.2 Billion 1 C&I includes owne
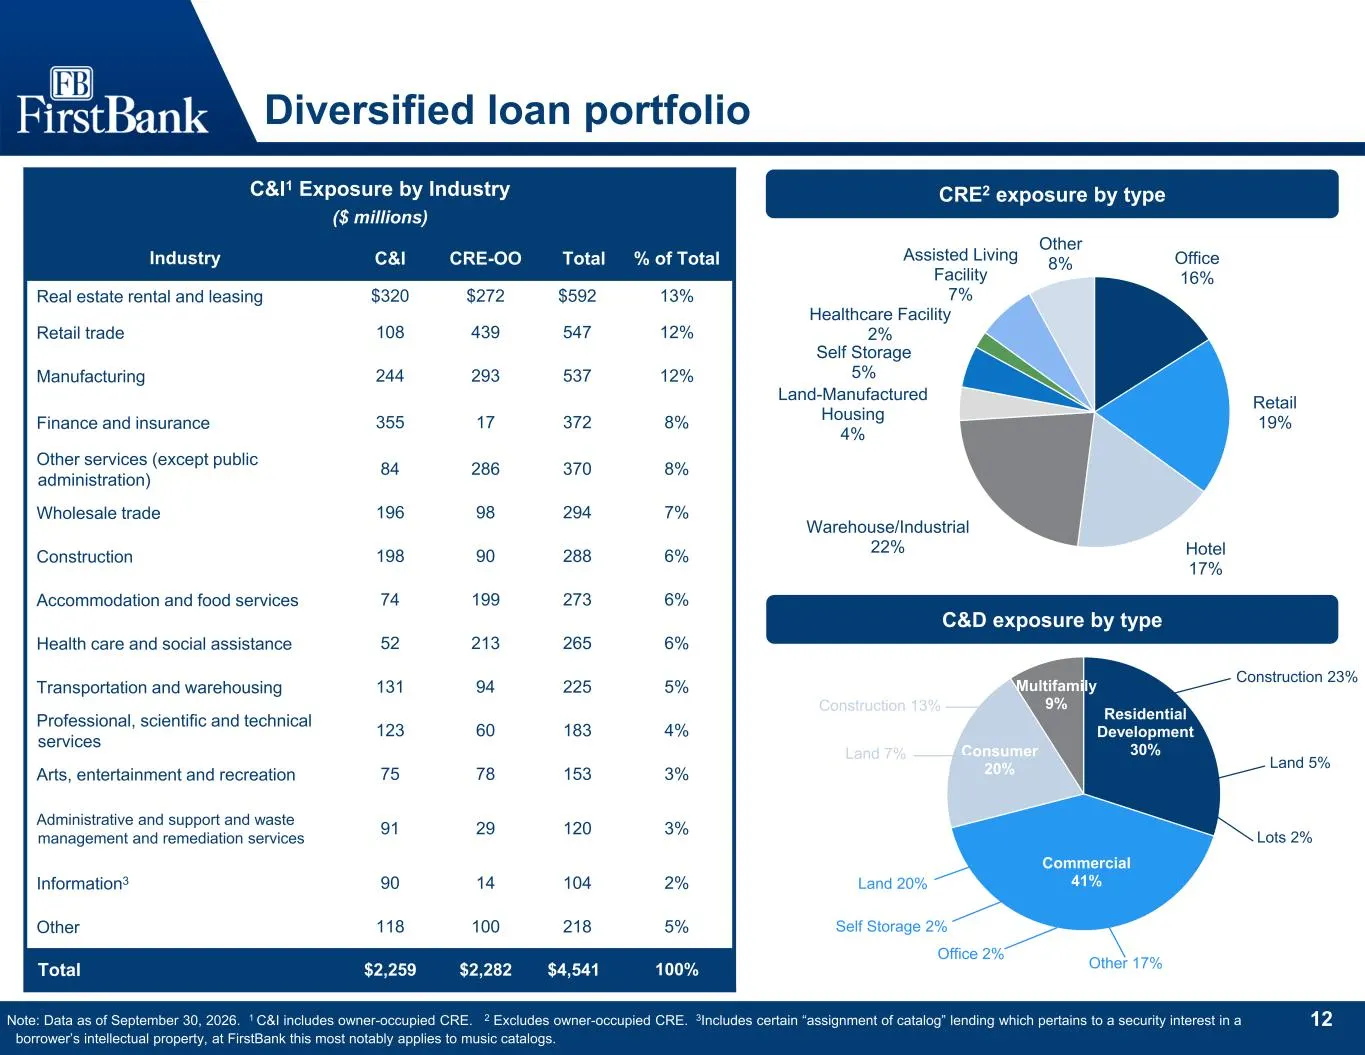
Slide 13: Diversified loan portfolio
12 Office 16% Retail 19% Hotel 17% Warehouse/Industrial 22% Land-Manufactured Housing 4% Self Storage 5% Healthcare Facility 2% Assisted Living Facility 7% Other 8% Residential Development 30% Commercial 41% Consumer 20% Multifamily 9% Construction 23% Land 5% Lots 2% Diversified loan portfolio CRE2
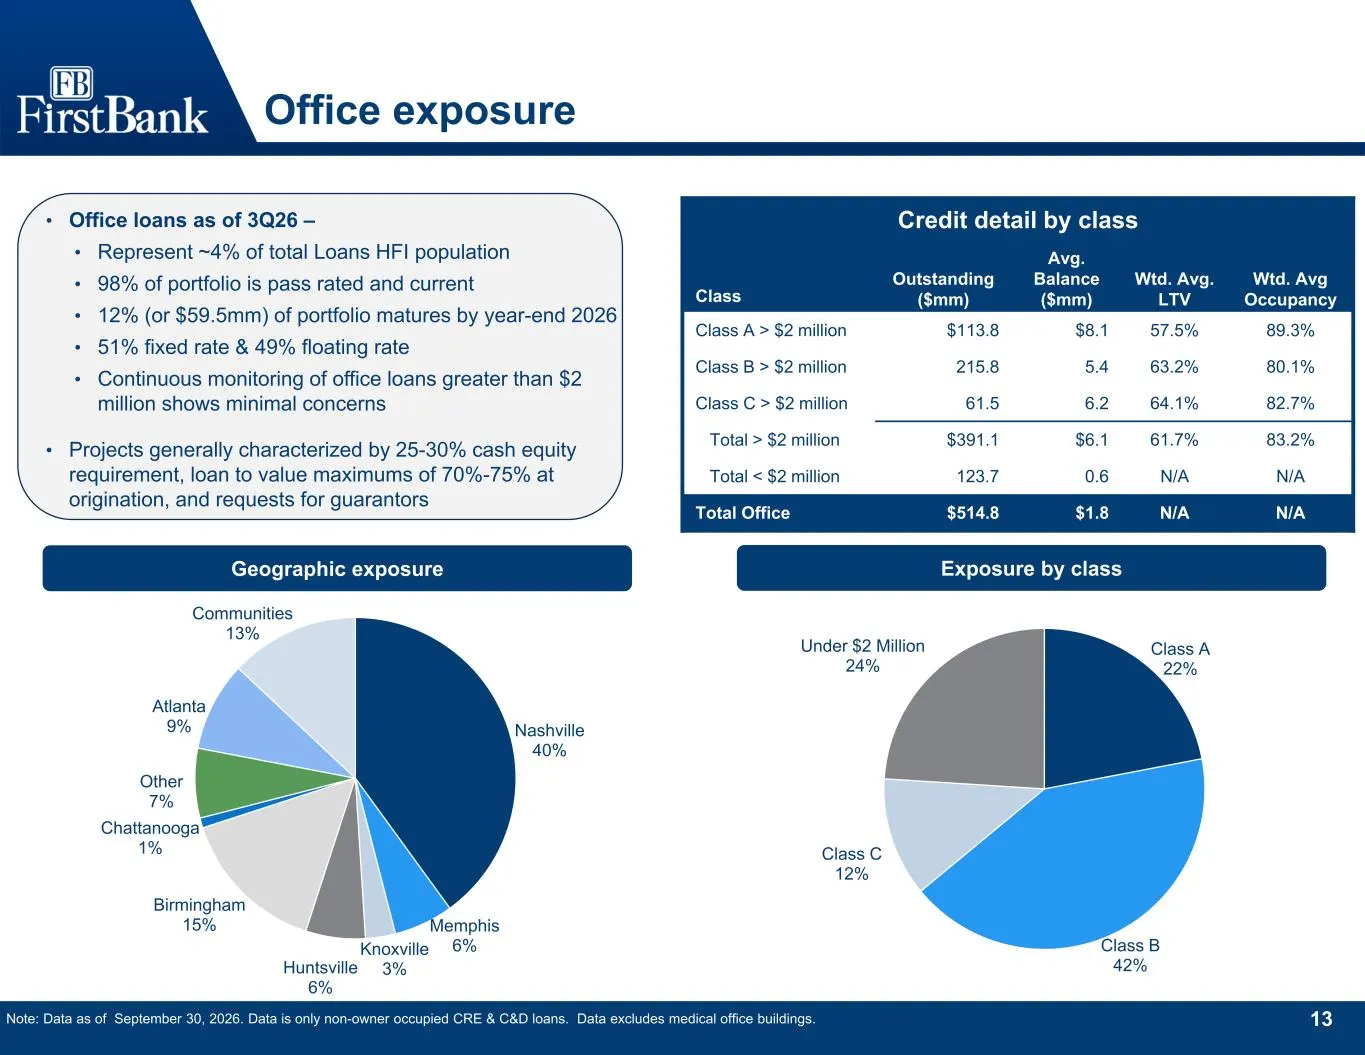
Slide 14: Office and geographic exposure
13 Nashville 40% Memphis 6%Knoxville 3%Huntsville 6% Birmingham 15% Chattanooga 1% Other 7% Atlanta 9% Communities 13% Class A 22% Class B 42% Class C 12% Under $2 Million 24% Office exposure Geographic exposure Note: Data as of September 30, 2026. Data is only non-owner occupied CRE & C&D loans. Da
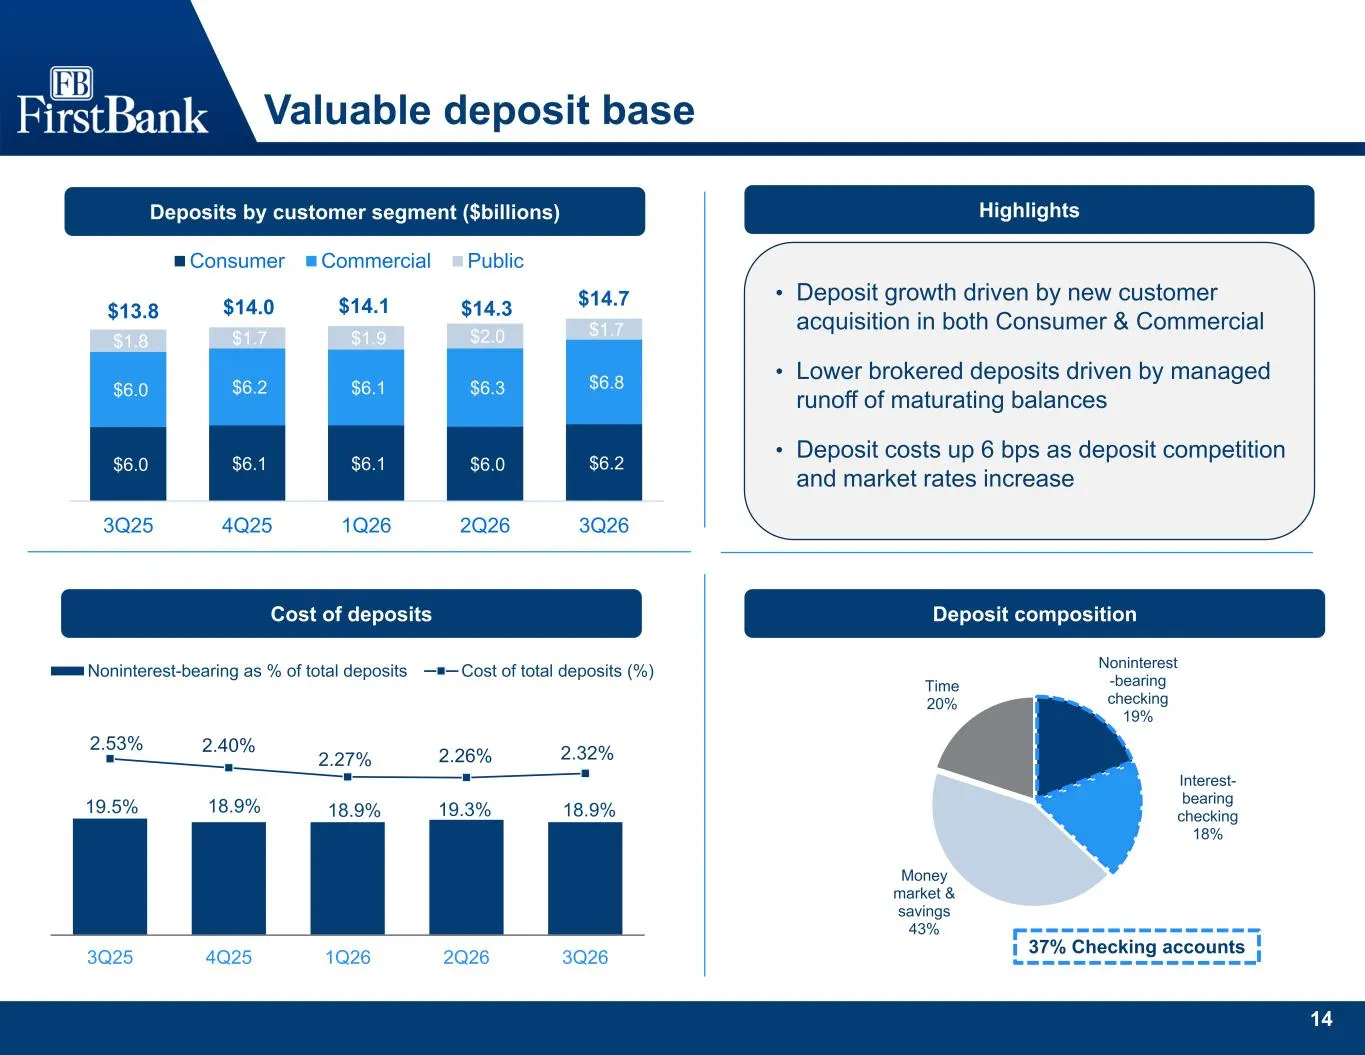
Slide 15: Valuable deposit base
14 Valuable deposit base Cost of deposits 19.5% 18.9% 18.9% 19.3% 18.9% 2.53% 2.40% 2.27% 2.26% 2.32% 0.00% 0.50% 1.00% 1.50% 2.00% 2.50% 3.00% 0.0% 5.0% 10.0% 15.0% 20.0% 25.0% 30.0% 35.0% 3Q25 4Q25 1Q26 2Q26 3Q26 Noninterest-bearing as % of total deposits Cost of total deposits (%) Deposits by cus
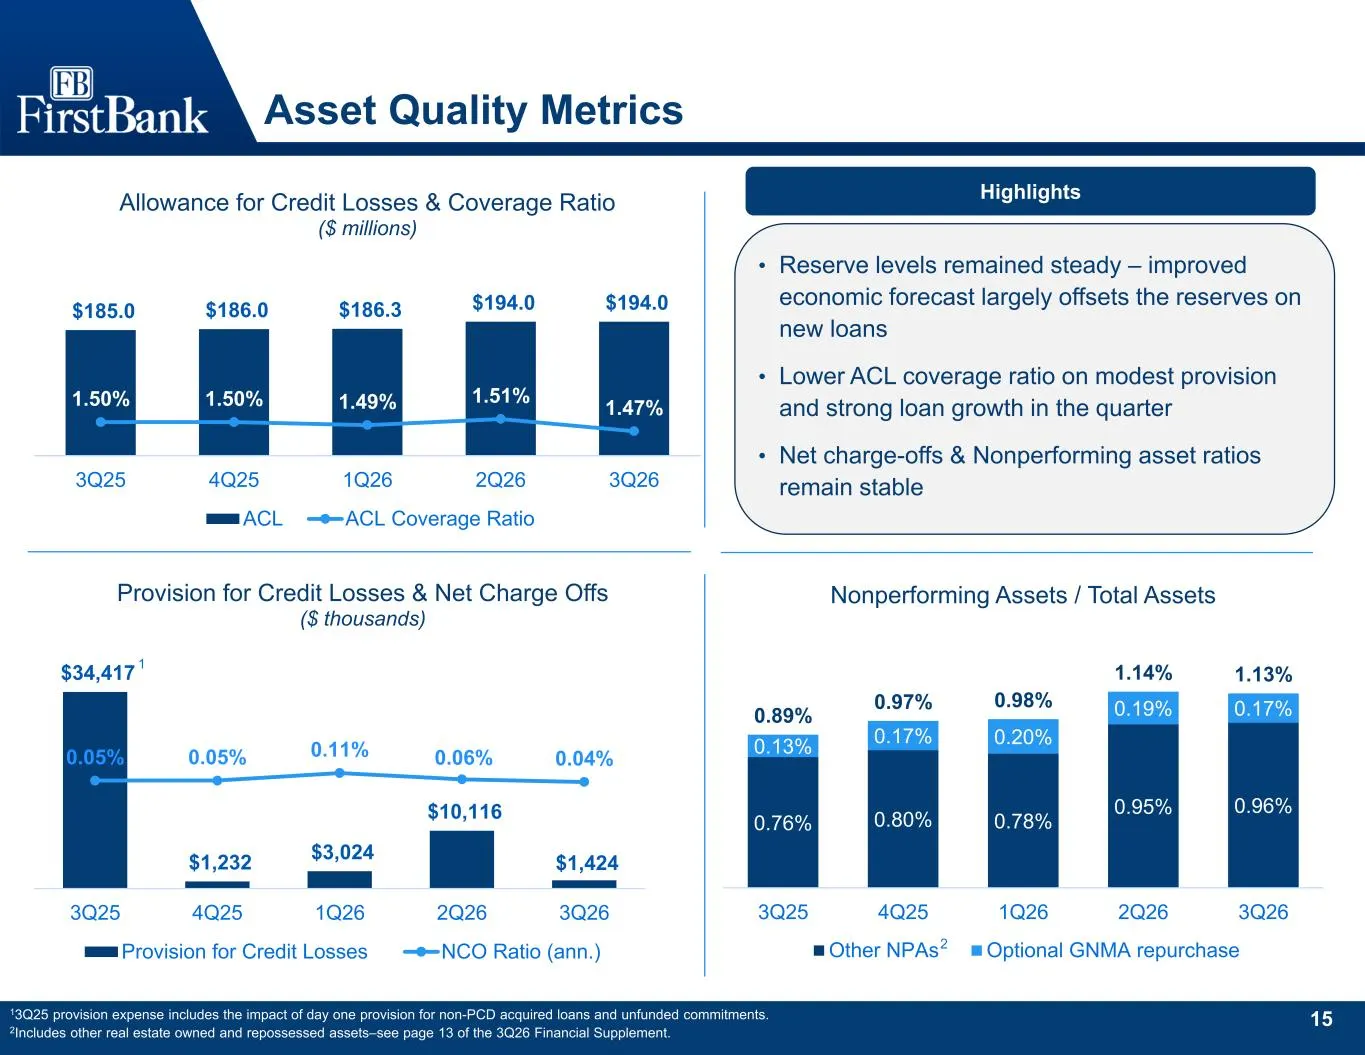
Slide 16: Provision for Credit Losses & Asset Quality
15 $34,417 $1,232 $3,024 $10,116 $1,424 0.05% 0.05% 0.11% 0.06% 0.04% 3Q25 4Q25 1Q26 2Q26 3Q26 Provision for Credit Losses & Net Charge Offs ($ thousands) Provision for Credit Losses NCO Ratio (ann.) Asset Quality Metrics • Reserve levels remained steady – improved economic forecast largely offsets
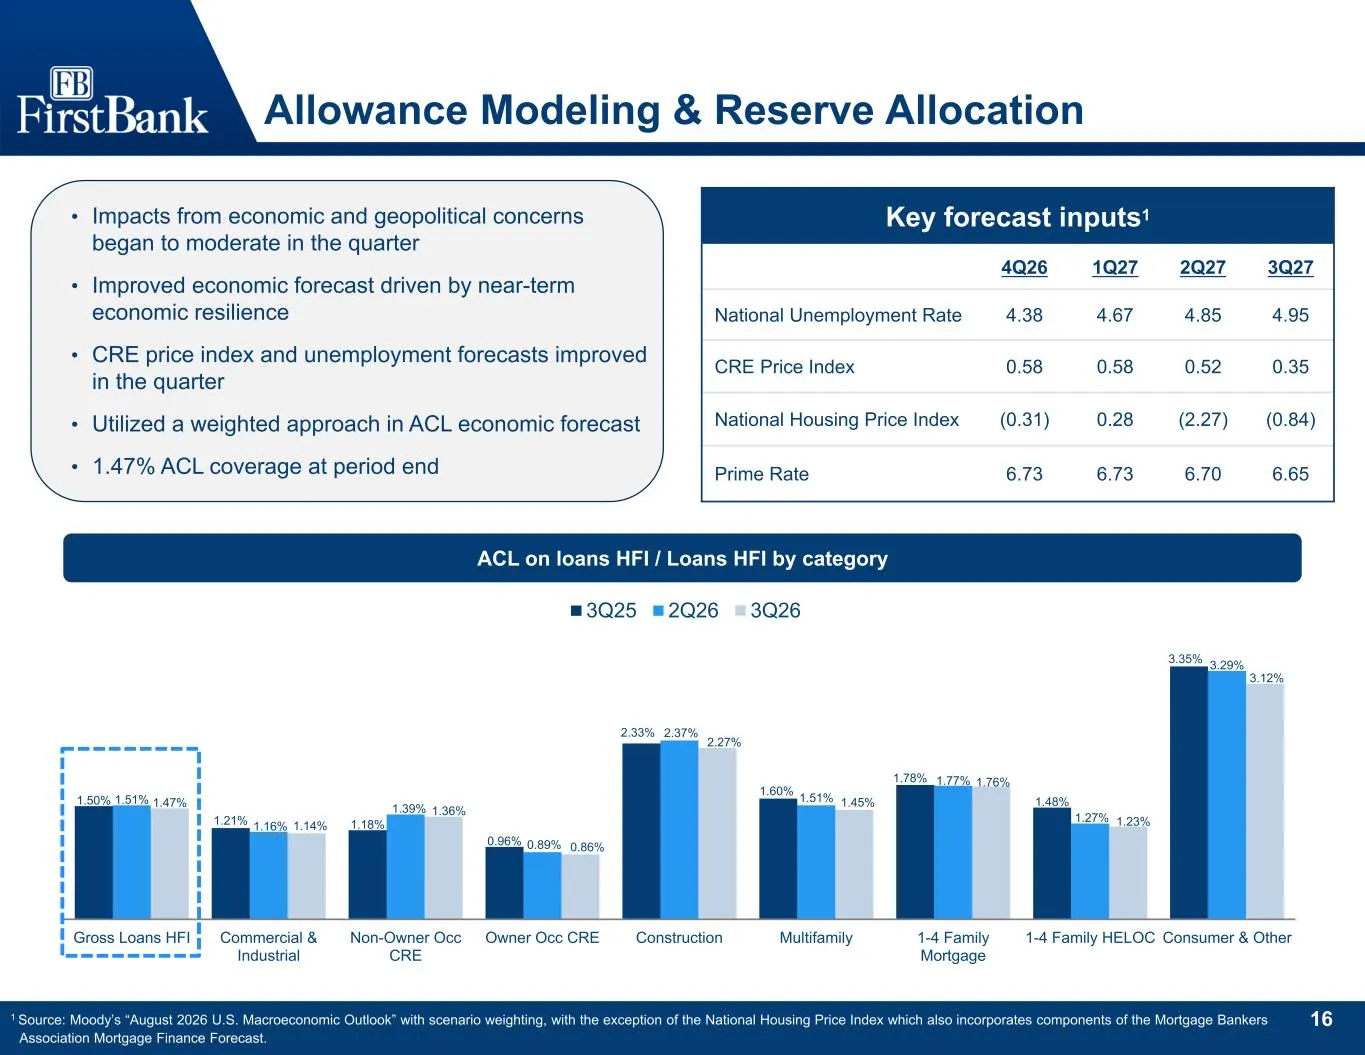
Slide 17: Allowance Modeling & Reserve Allocation
16 1.50% 1.21% 1.18% 0.96% 2.33% 1.60% 1.78% 1.48% 3.35% 1.51% 1.16% 1.39% 0.89% 2.37% 1.51% 1.77% 1.27% 3.29% 1.47% 1.14% 1.36% 0.86% 2.27% 1.45% 1.76% 1.23% 3.12% Gross Loans HFI Commercial & Industrial Non-Owner Occ CRE Owner Occ CRE Construction Multifamily 1-4 Family Mortgage 1-4 Family HELOC C
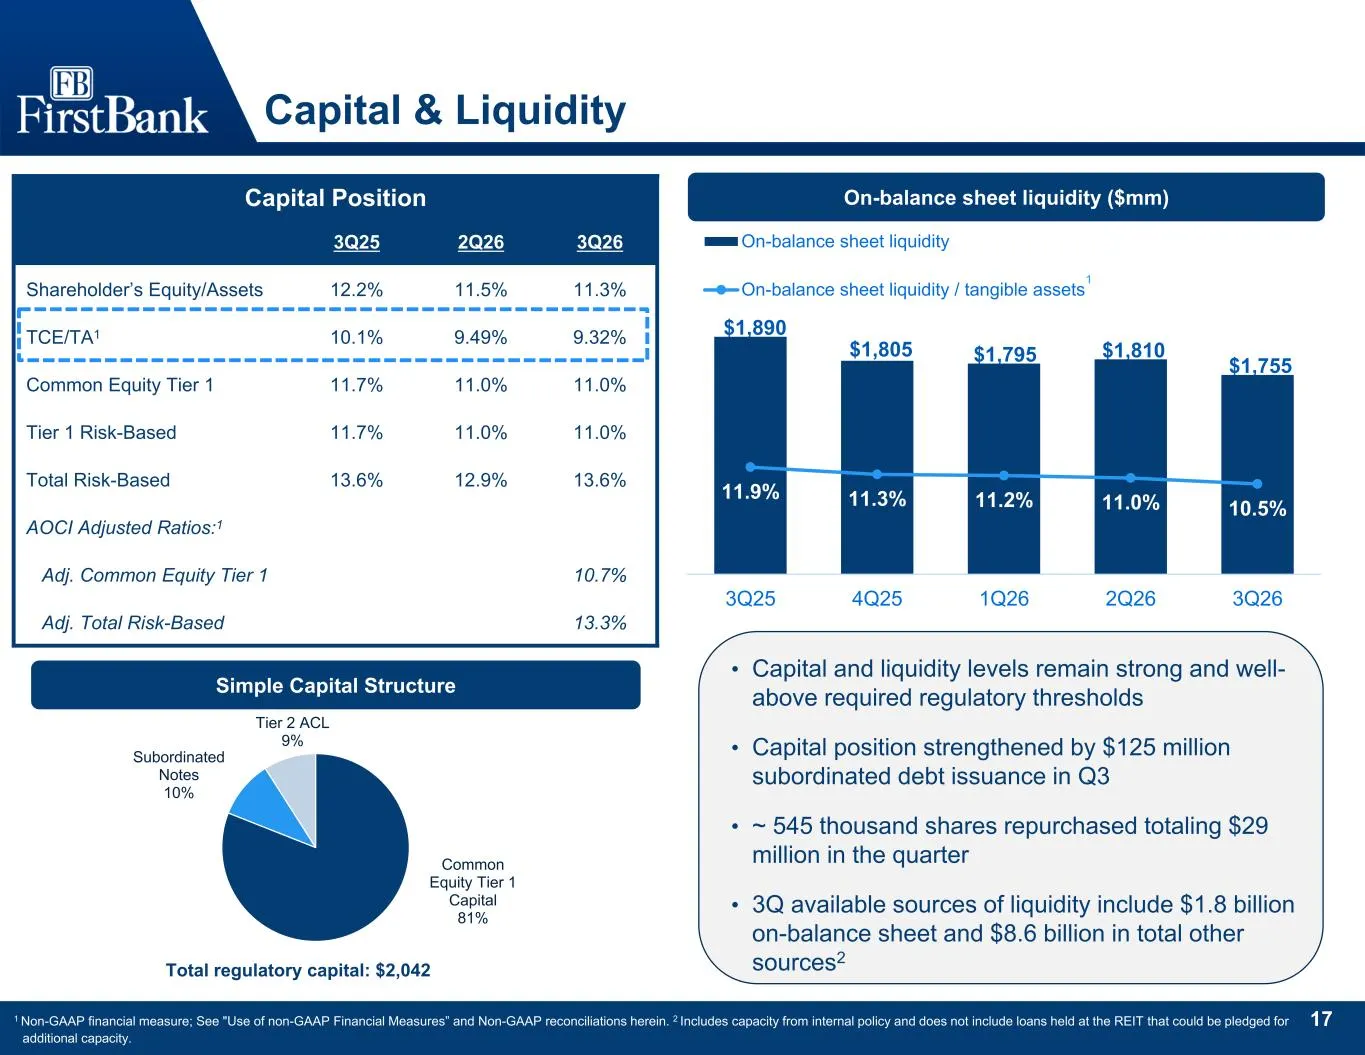
Slide 18: Capital & Liquidity
17 Capital & Liquidity Simple Capital Structure Common Equity Tier 1 Capital 81% Subordinated Notes 10% Tier 2 ACL 9% Total regulatory capital: $2,042 1 Non-GAAP financial measure; See "Use of non-GAAP Financial Measures” and Non-GAAP reconciliations herein. 2 Includes capacity from internal policy
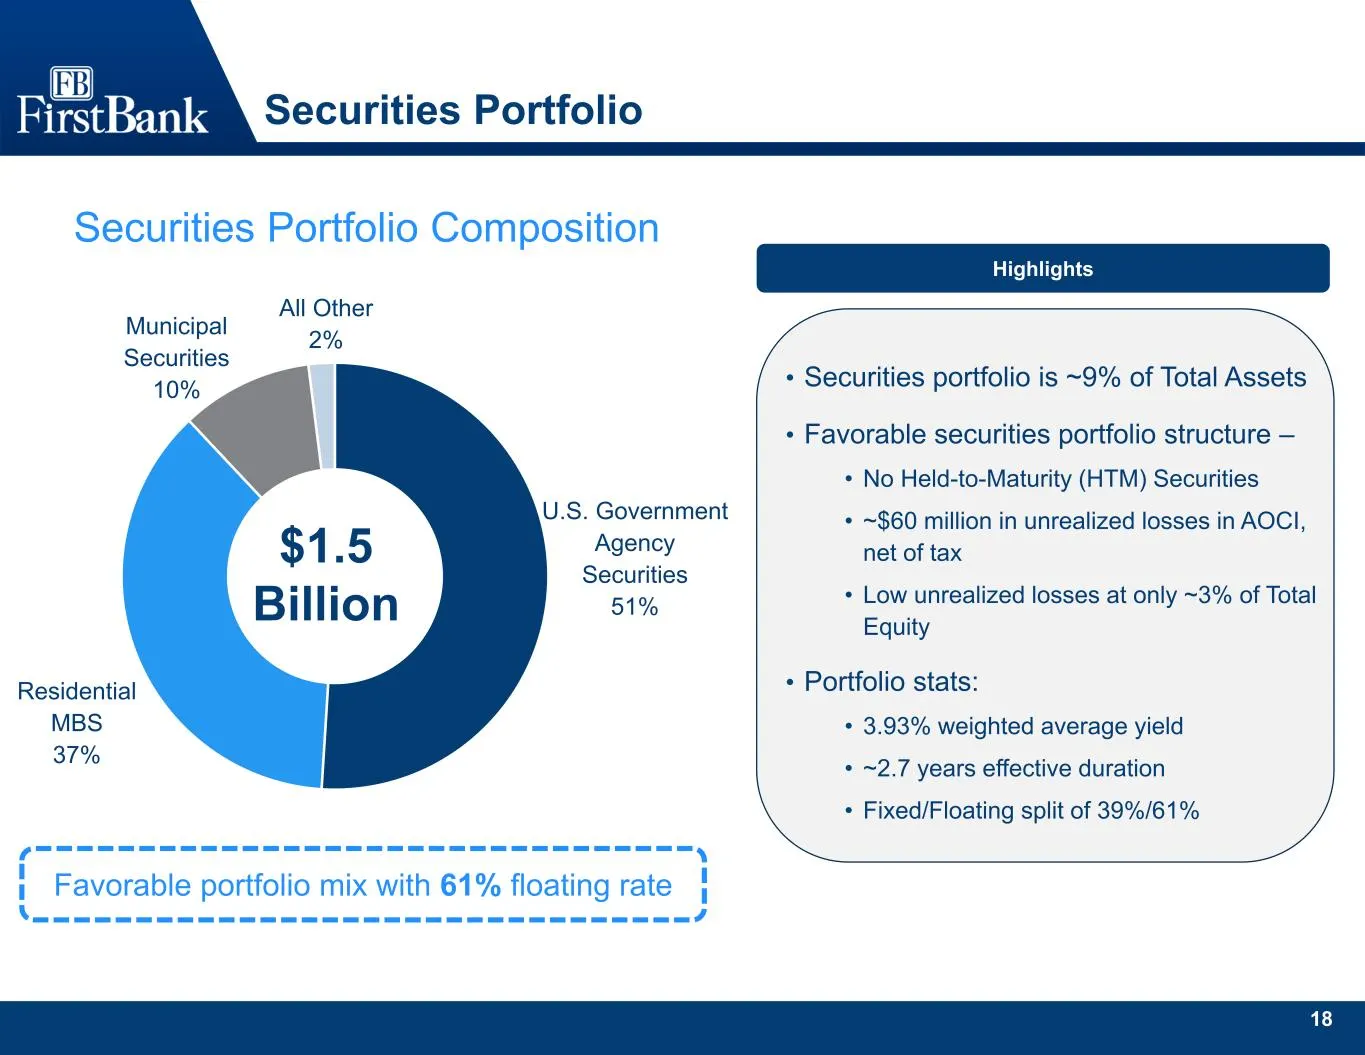
Slide 19: Securities Portfolio
18 Securities Portfolio • Securities portfolio is ~9% of Total Assets • Favorable securities portfolio structure – • No Held-to-Maturity (HTM) Securities • ~$60 million in unrealized losses in AOCI, net of tax • Low unrealized losses at only ~3% of Total Equity • Portfolio stats: • 3.93% weighted av
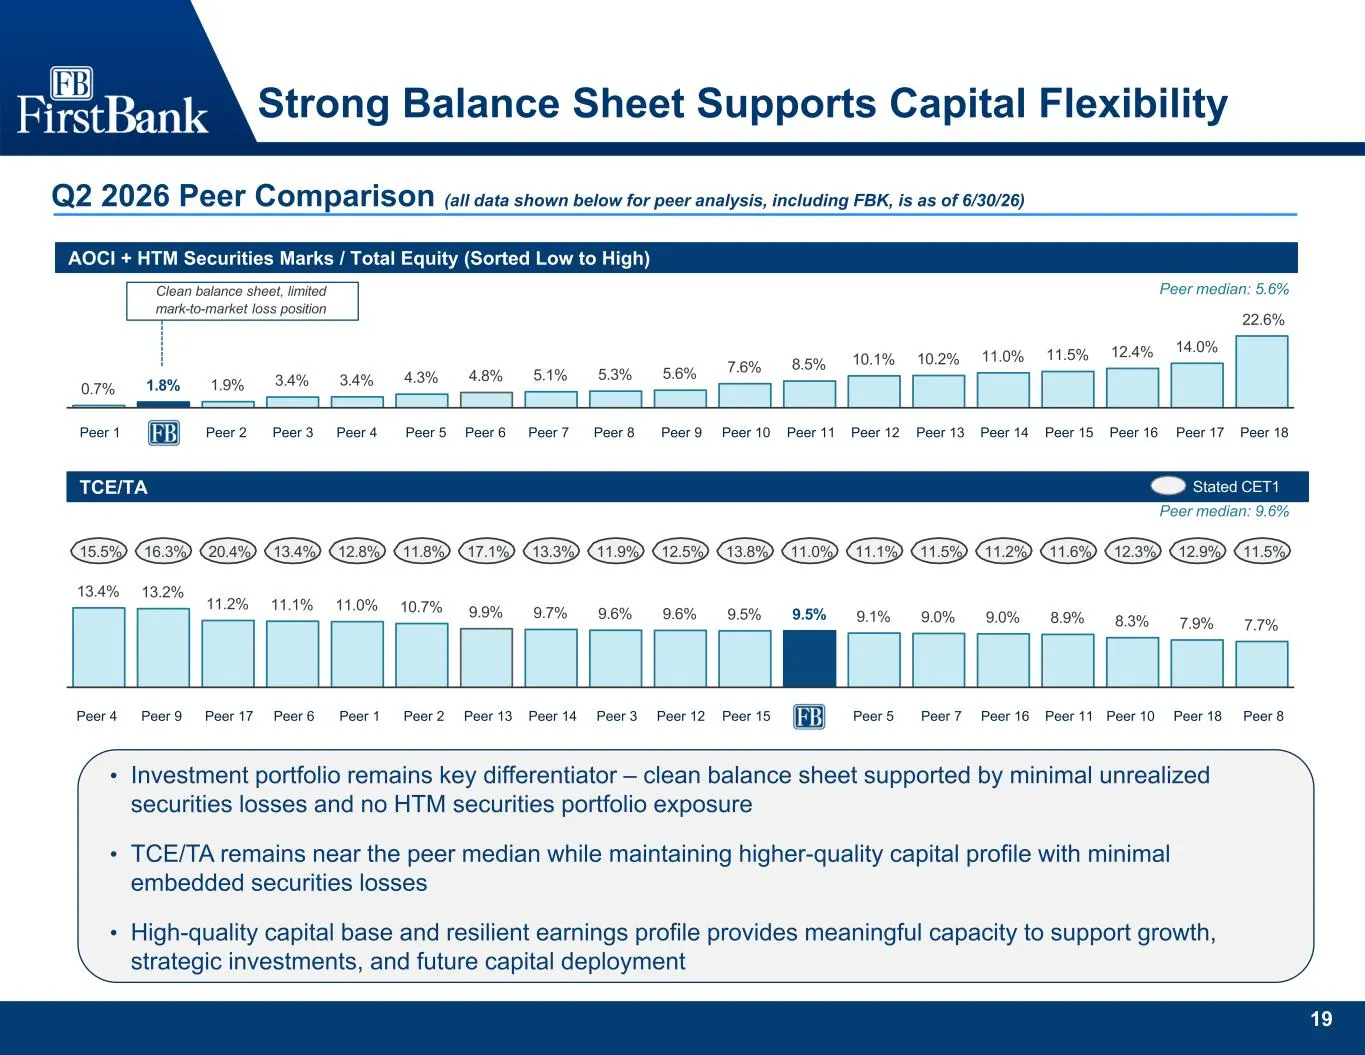
Slide 20: Strong Balance Sheet Supports Capital Flexibility
19 TCE/TA 13.4% 13.2% 11.2% 11.1% 11.0% 10.7% 9.9% 9.7% 9.6% 9.6% 9.5% 9.5% 9.1% 9.0% 9.0% 8.9% 8.3% 7.9% 7.7% Stated CET1 Peer median: 9.6% 15.5% 16.3% 20.4% 13.4% 12.8% 11.8% 17.1% 13.3% 11.9% 12.5% 13.8% 11.0% 11.1% 11.5% 11.2% 11.6% 12.3% 12.9% 11.5% AOCI + HTM SECURITIES MARKS / TOTAL EQUITY (S
Slide 21: Mortgage results
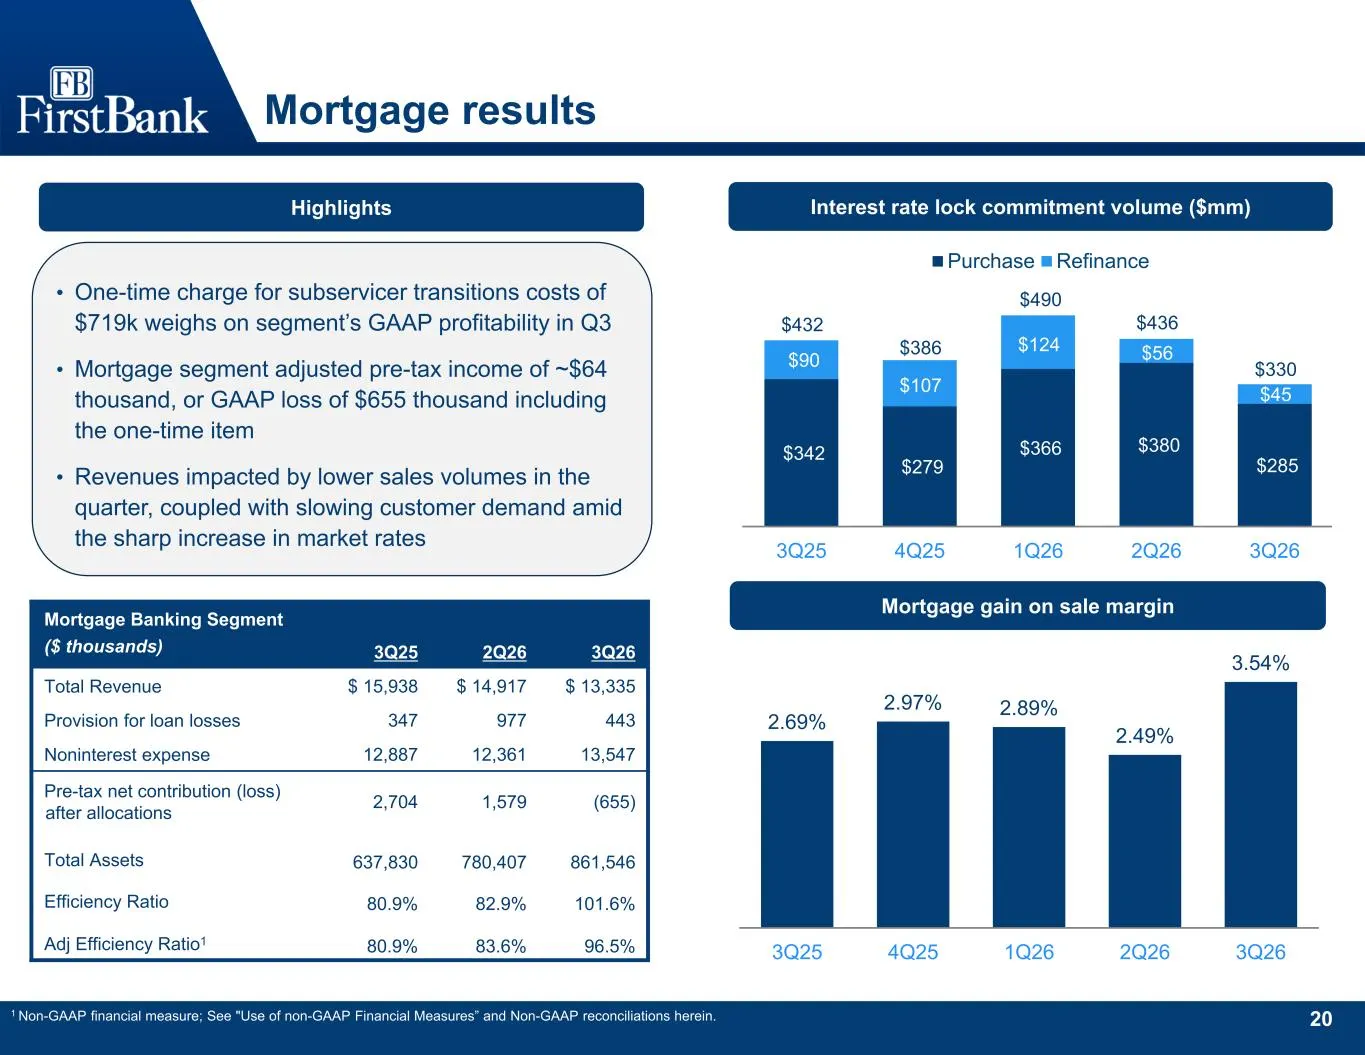
20 Mortgage results • One-time charge for subservicer transitions costs of $719k weighs on segment’s GAAP profitability in Q3 • Mortgage segment adjusted pre-tax income of ~$64 thousand, or GAAP loss of $655 thousand including the one-time item • Revenues impacted by lower sales volumes in the quart
Slide 22: Appendix
21 Appendix
Slide 23: Adjusted net income and diluted earnings per share
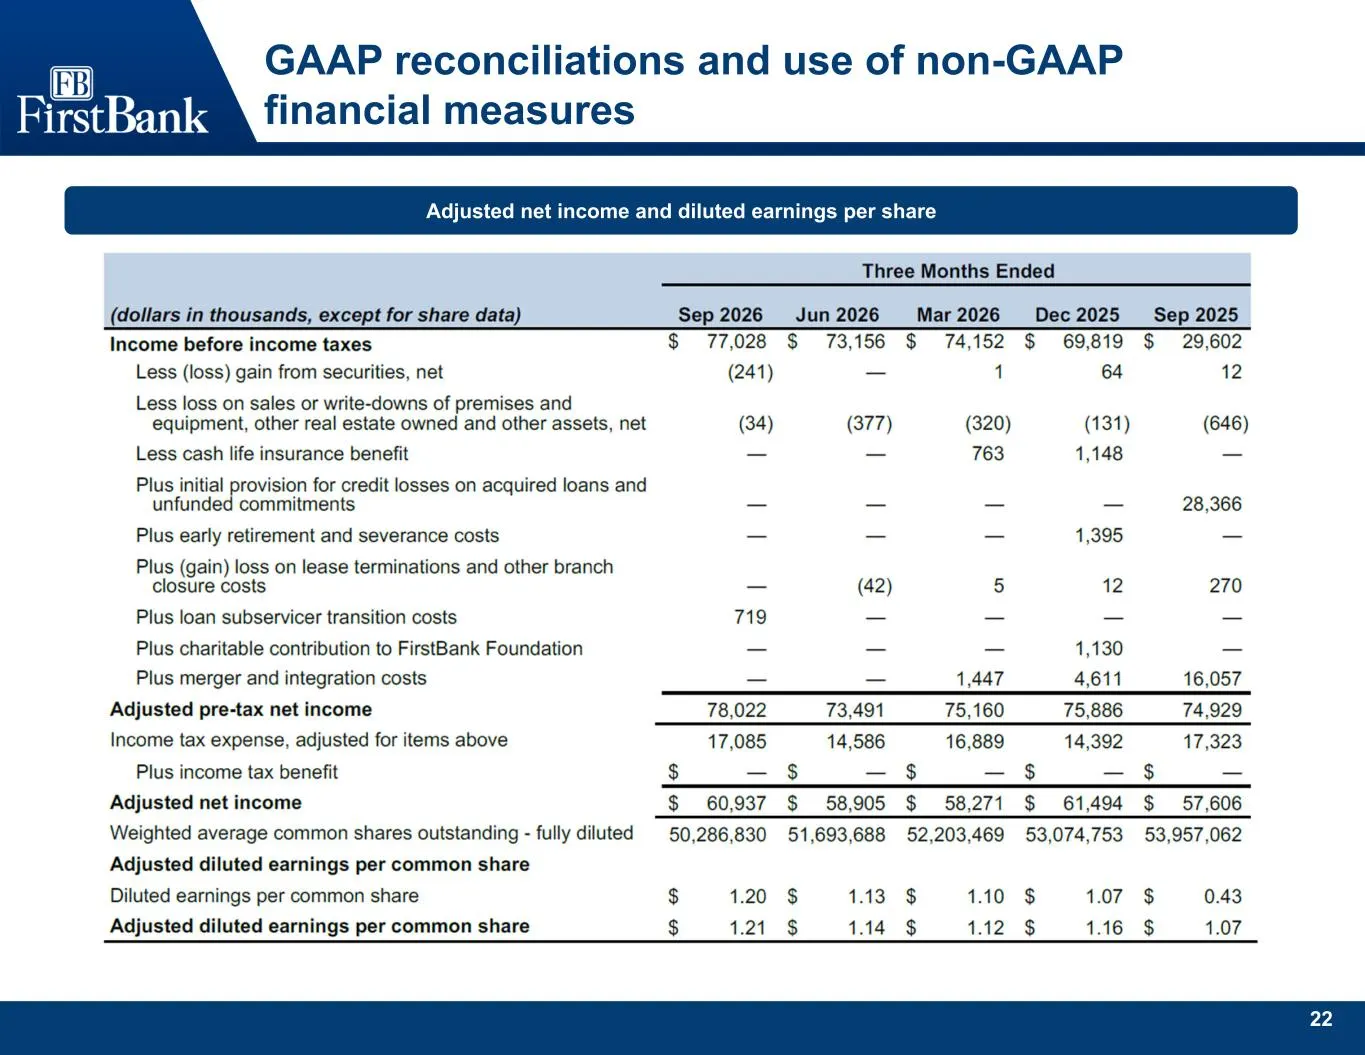
22 GAAP reconciliations and use of non-GAAP financial measures Adjusted net income and diluted earnings per share
Slide 24: Adjusted net income and diluted earnings per share
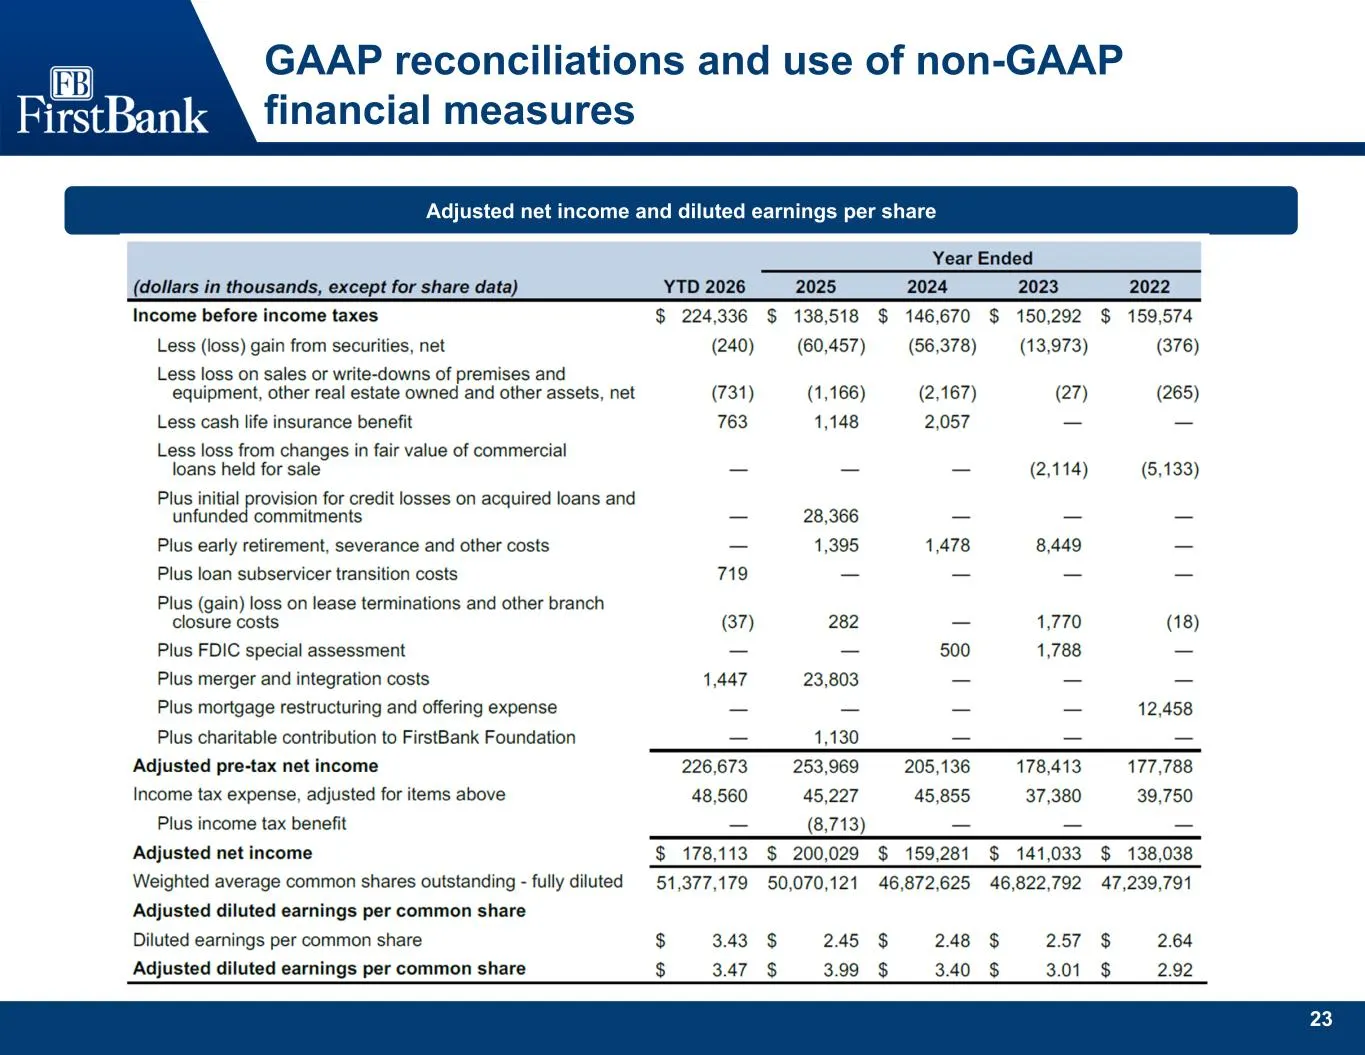
23 GAAP reconciliations and use of non-GAAP financial measures Adjusted net income and diluted earnings per share
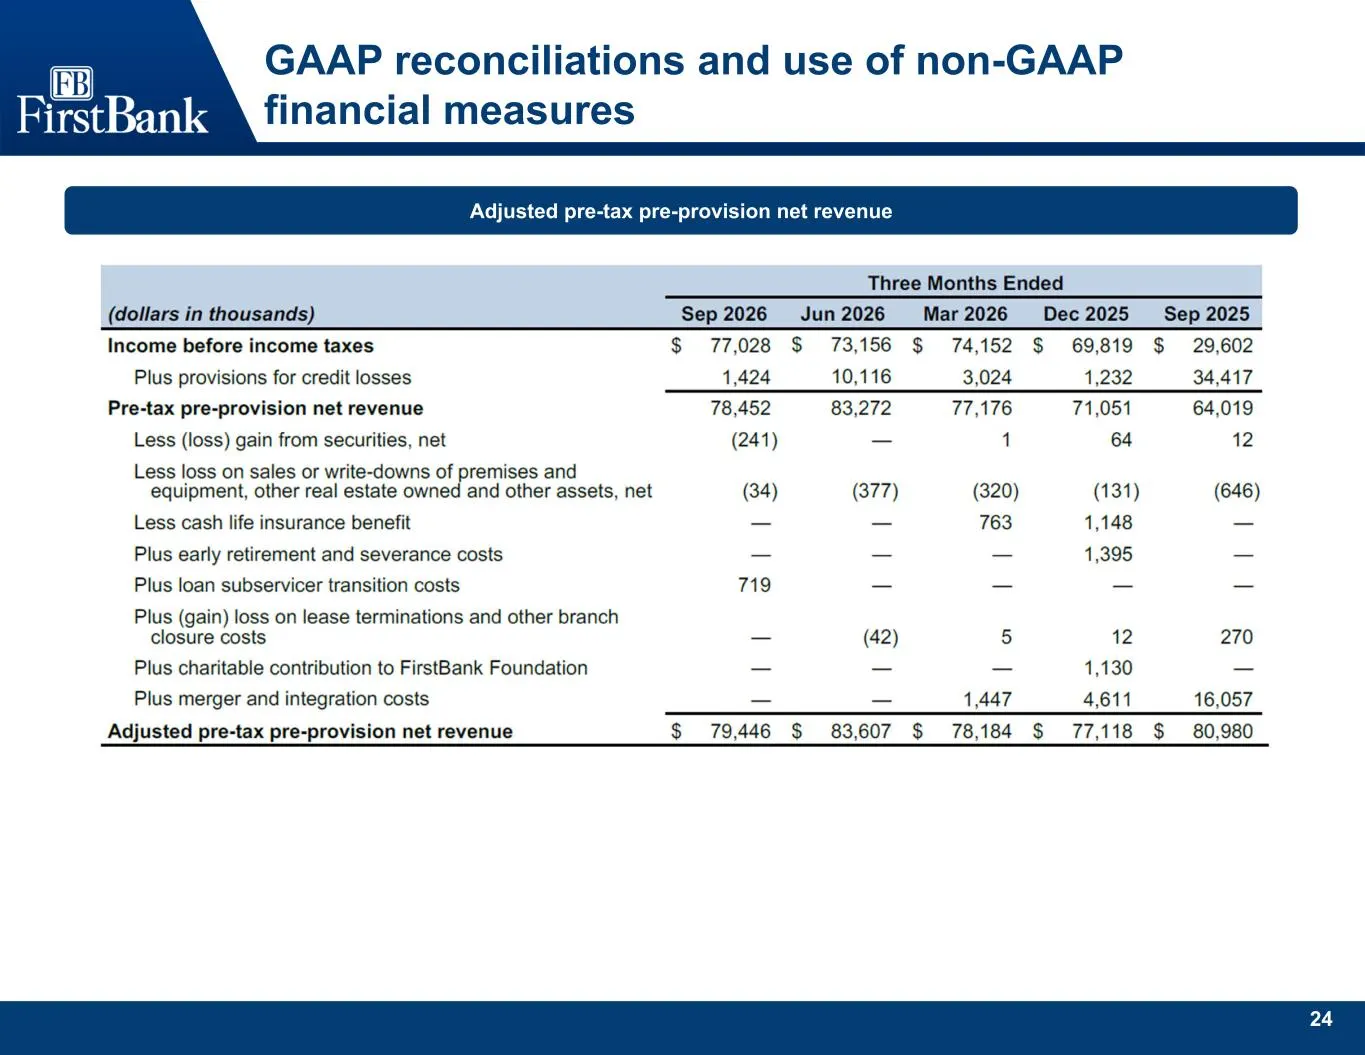
Slide 25: Adjusted pre-tax pre-provision net revenue
24 GAAP reconciliations and use of non-GAAP financial measures Adjusted pre-tax pre-provision net revenue
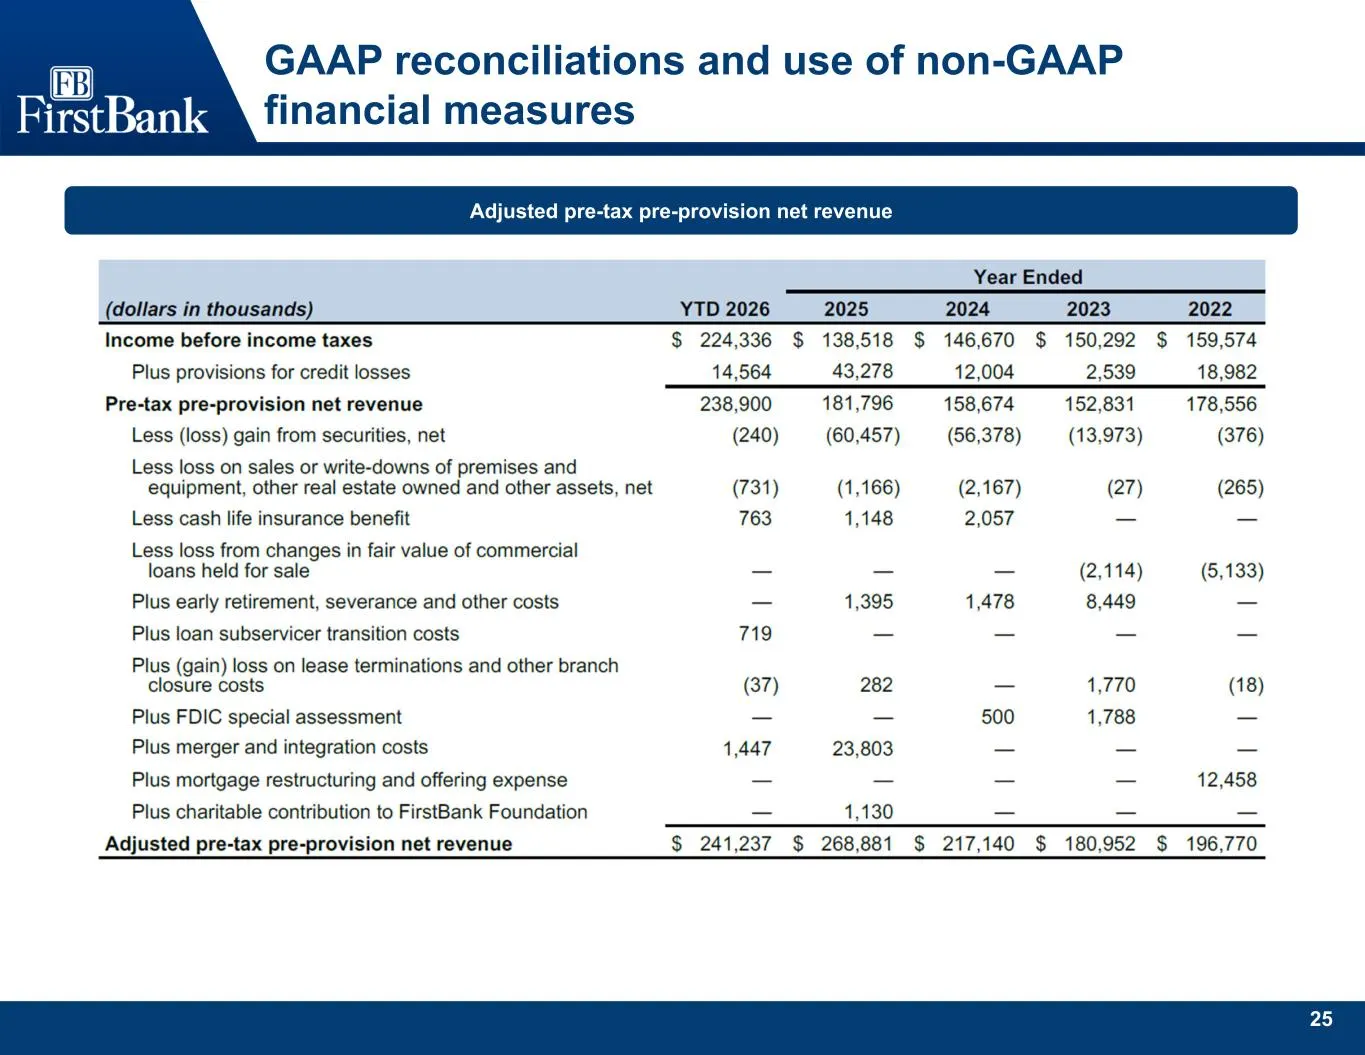
Slide 26: Adjusted pre-tax pre-provision net revenue
25 GAAP reconciliations and use of non-GAAP financial measures Adjusted pre-tax pre-provision net revenue
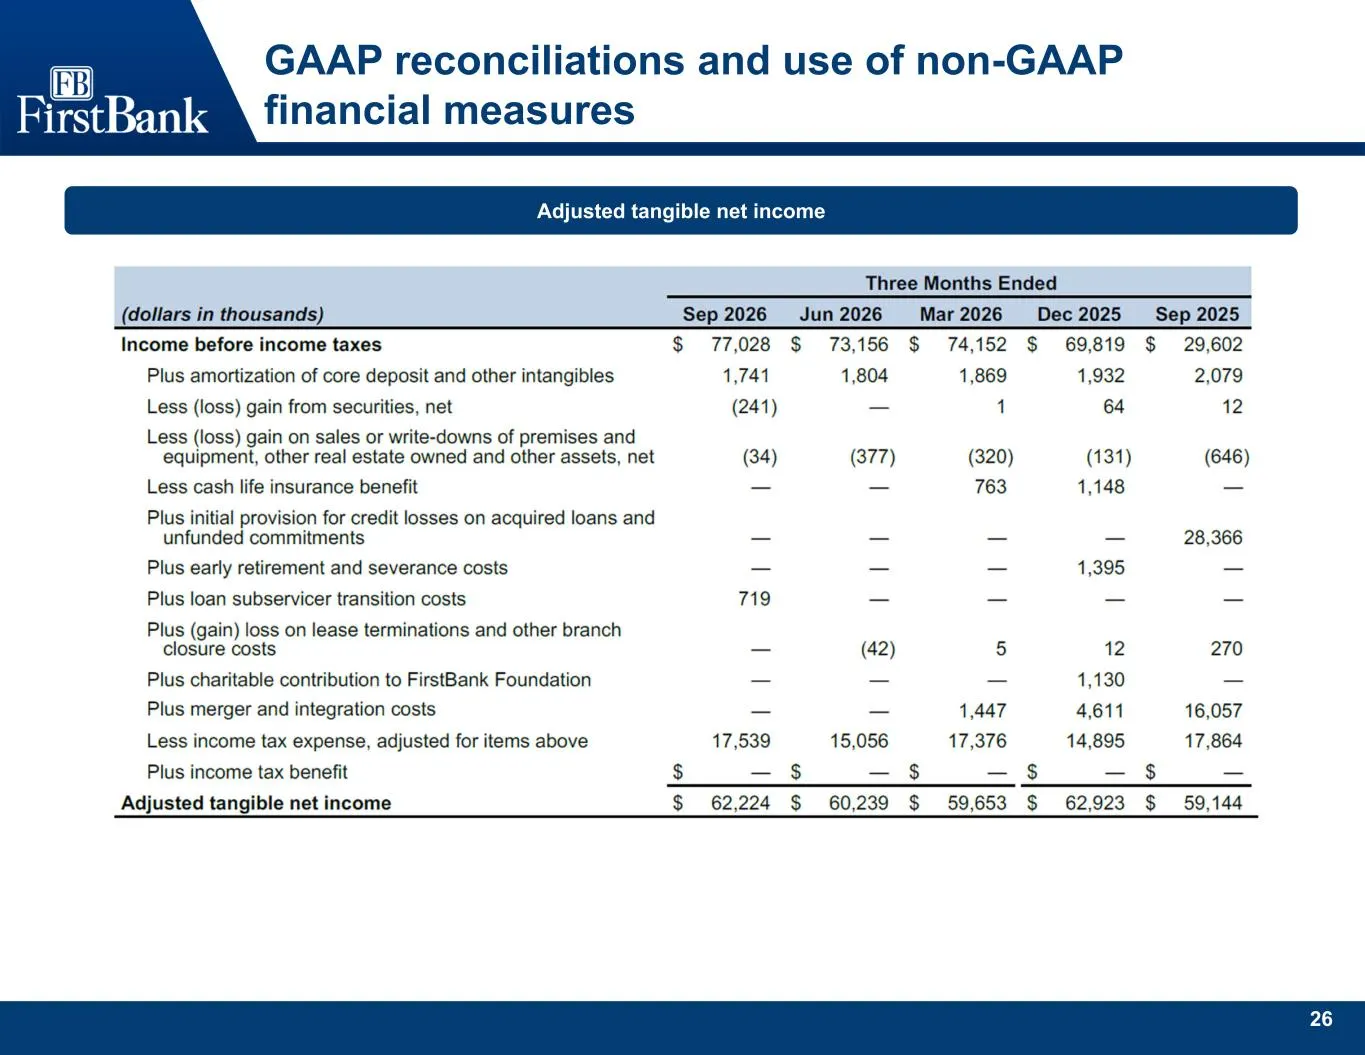
Slide 27: Adjusted tangible net income
26 GAAP reconciliations and use of non-GAAP financial measures Adjusted tangible net income
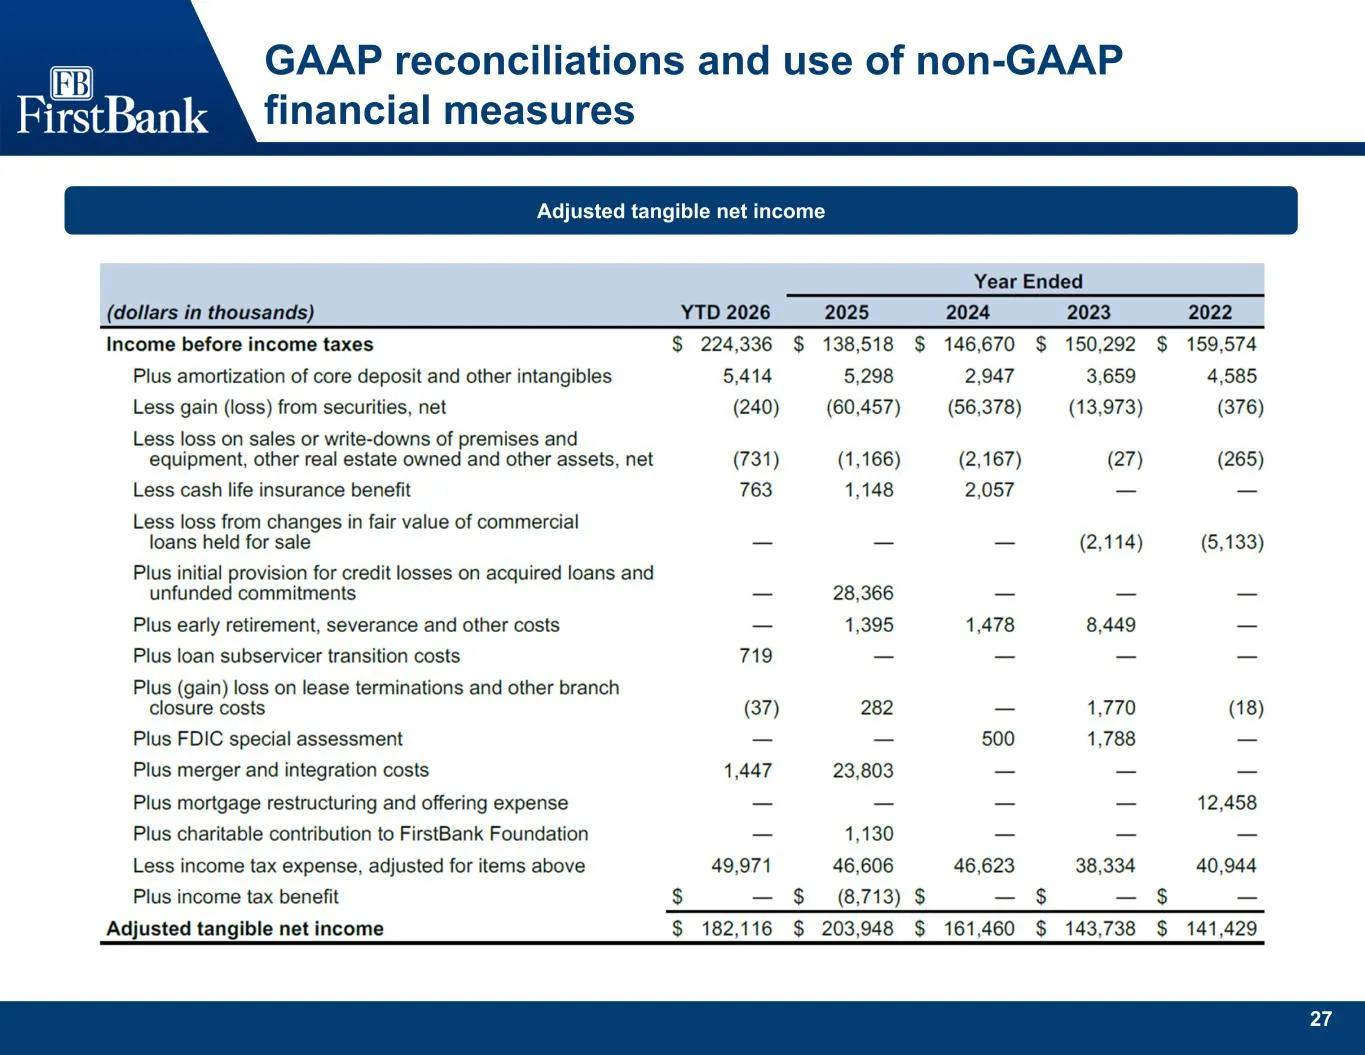
Slide 28: Adjusted tangible net income
27 GAAP reconciliations and use of non-GAAP financial measures Adjusted tangible net income
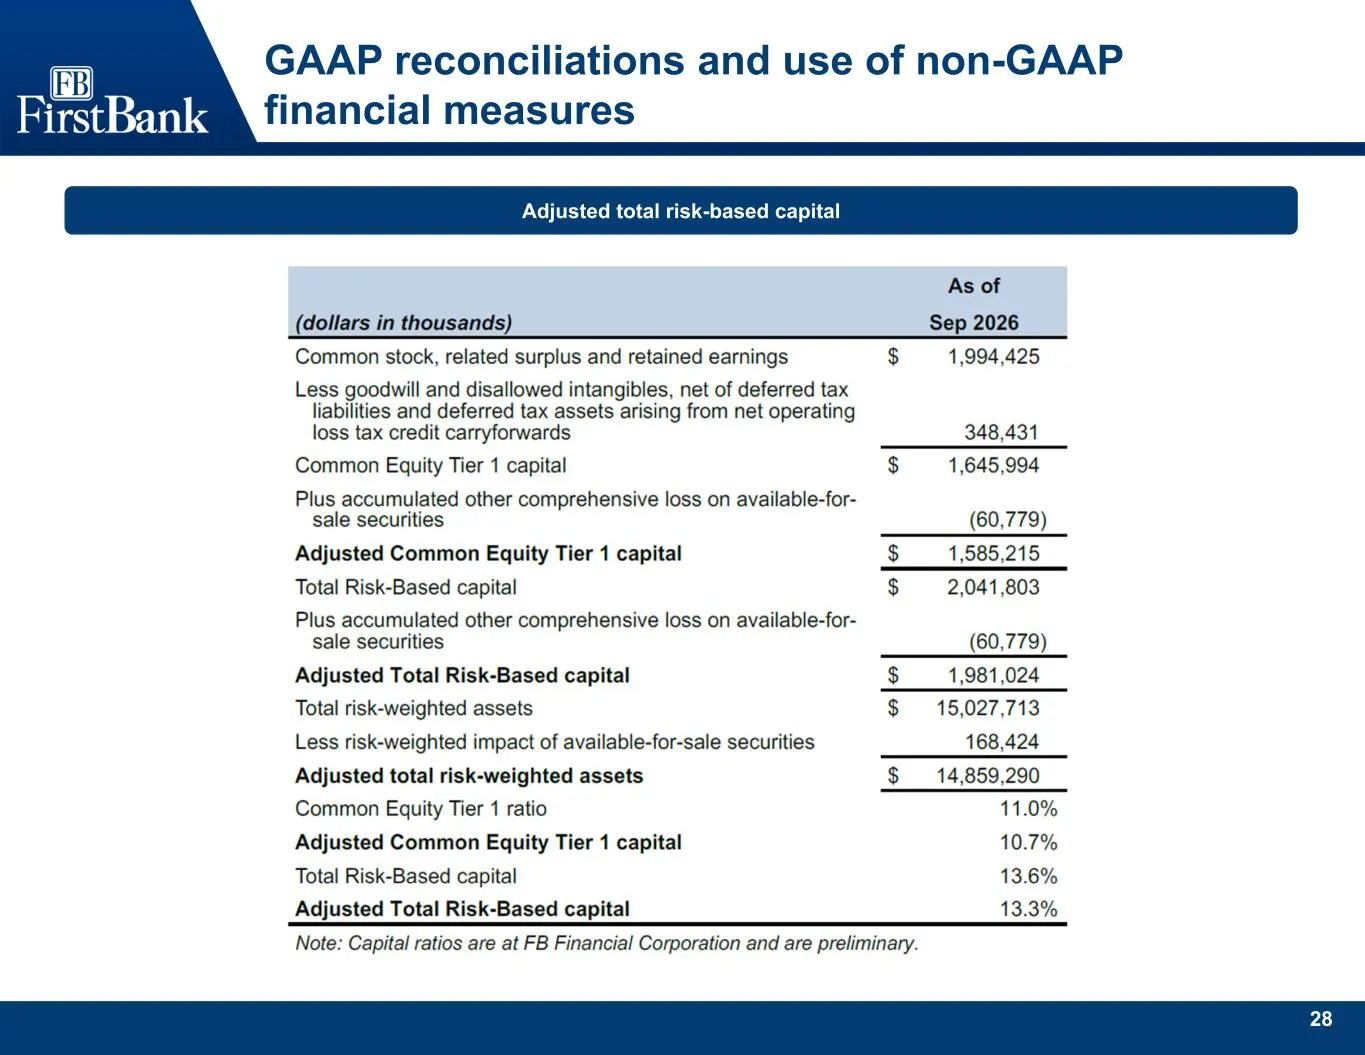
Slide 29: Adjusted total risk-based capital
28 GAAP reconciliations and use of non-GAAP financial measures Adjusted total risk-based capital
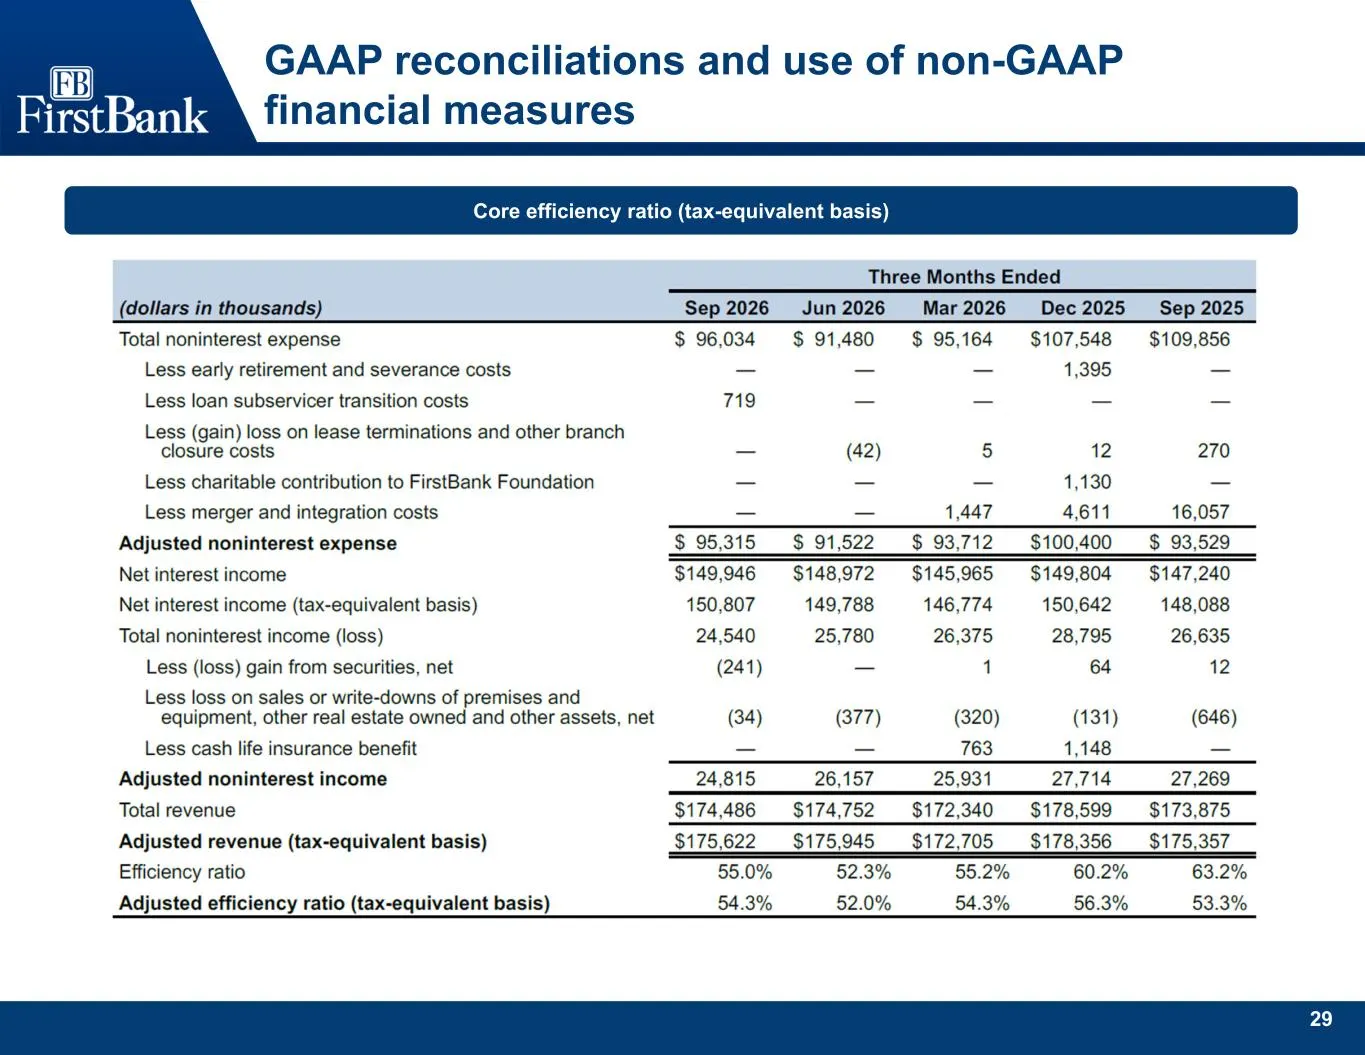
Slide 30: Core efficiency ratio (tax-equivalent basis)
29 GAAP reconciliations and use of non-GAAP financial measures Core efficiency ratio (tax-equivalent basis)
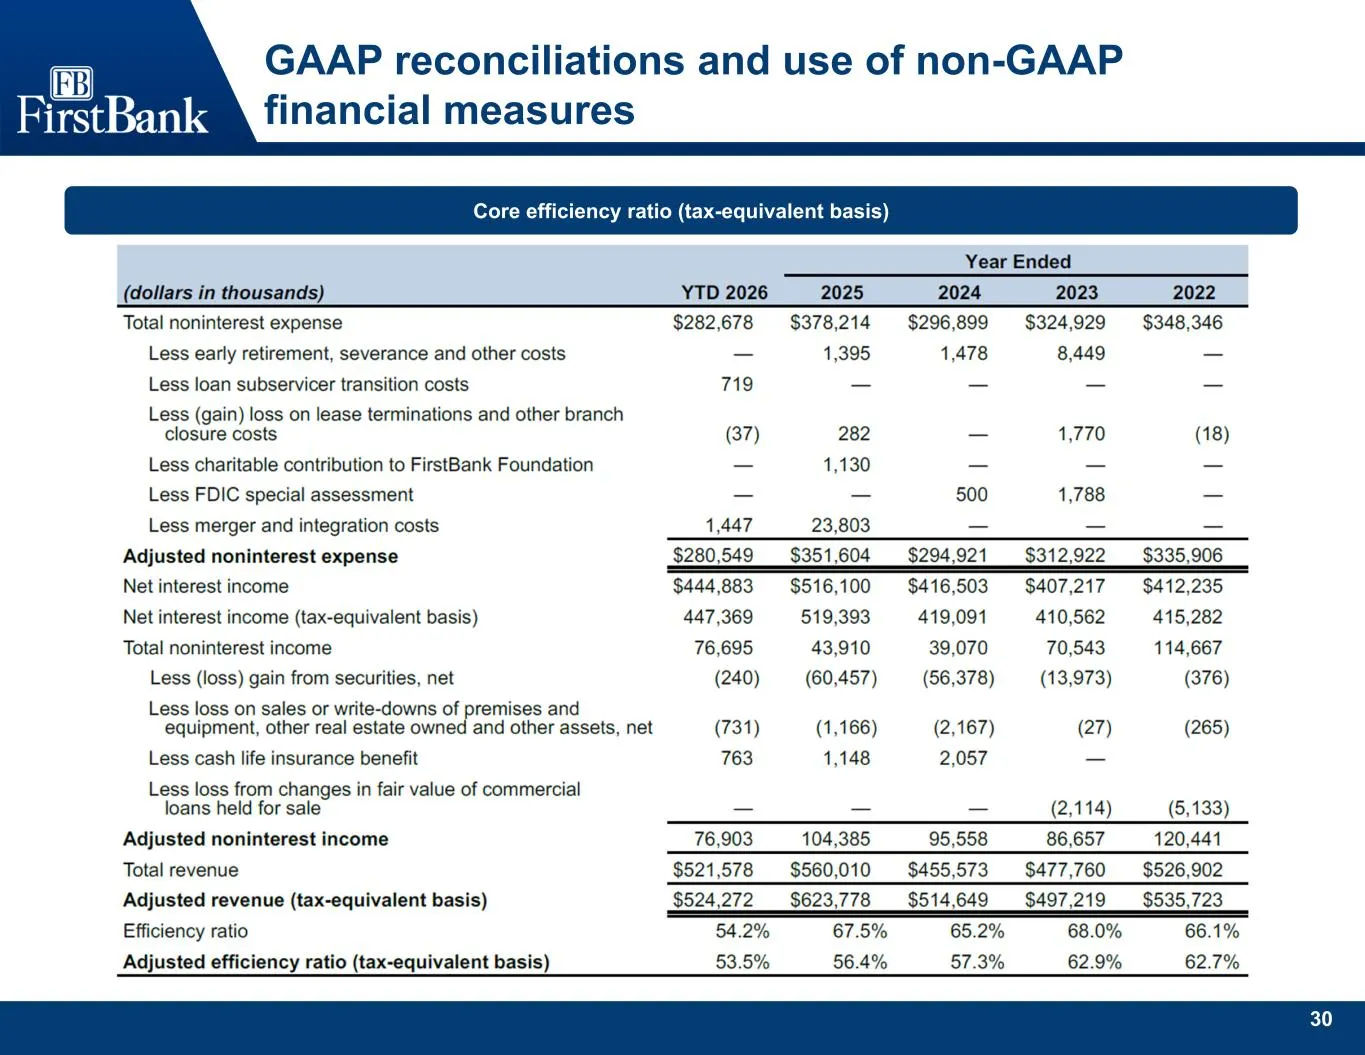
Slide 31: Core efficiency ratio (tax-equivalent basis)
30 GAAP reconciliations and use of non-GAAP financial measures Core efficiency ratio (tax-equivalent basis)
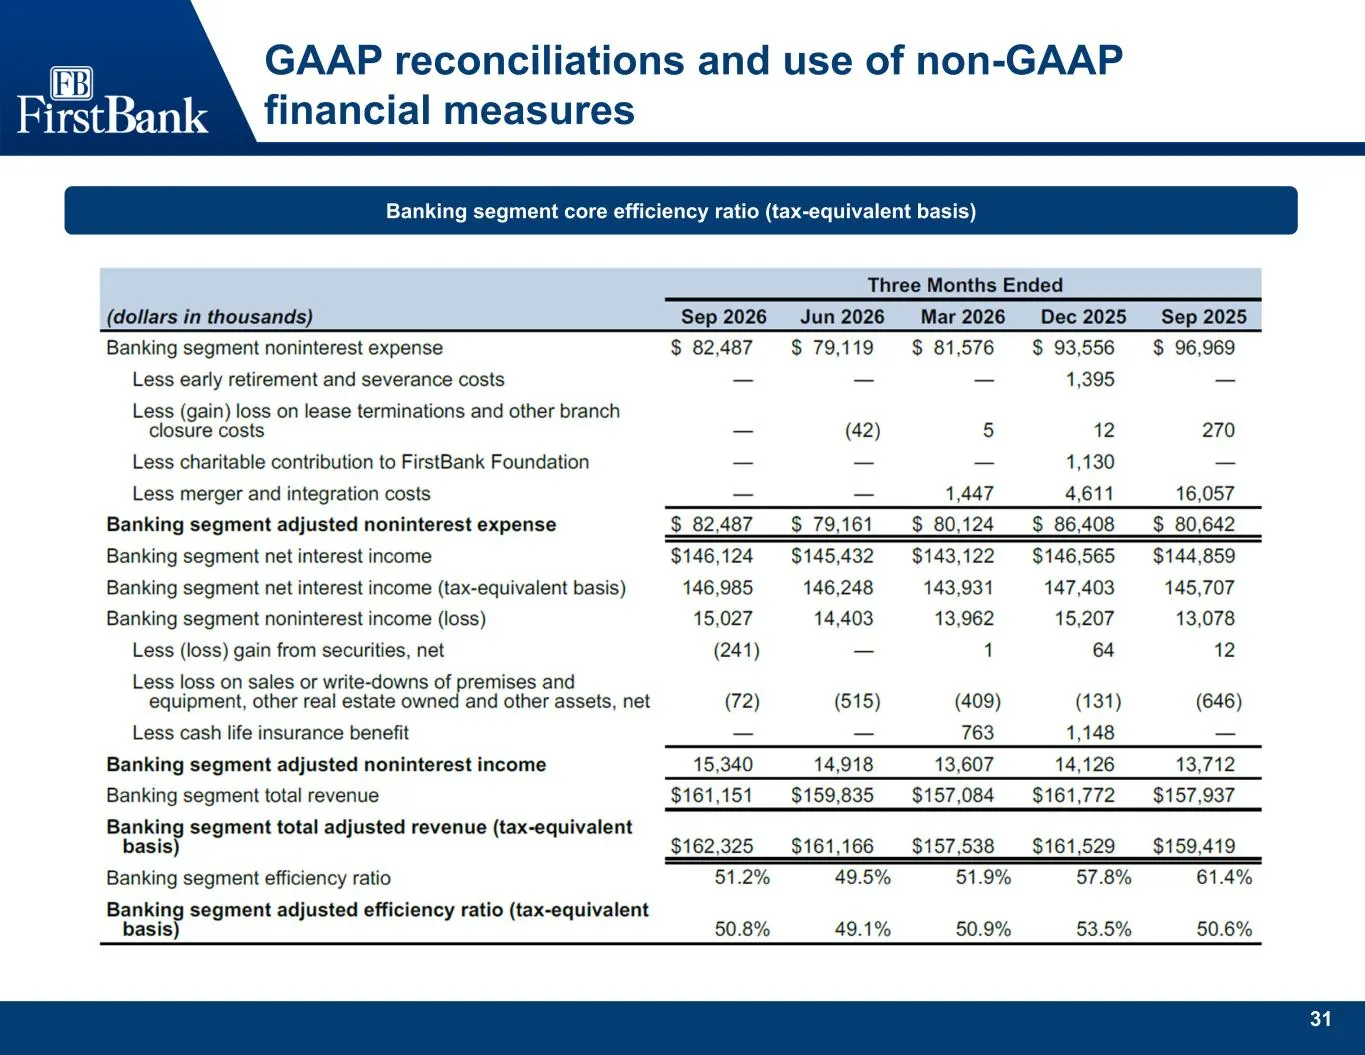
Slide 32: Banking segment core efficiency ratio (tax-equivalent basis)
31 GAAP reconciliations and use of non-GAAP financial measures Banking segment core efficiency ratio (tax-equivalent basis)
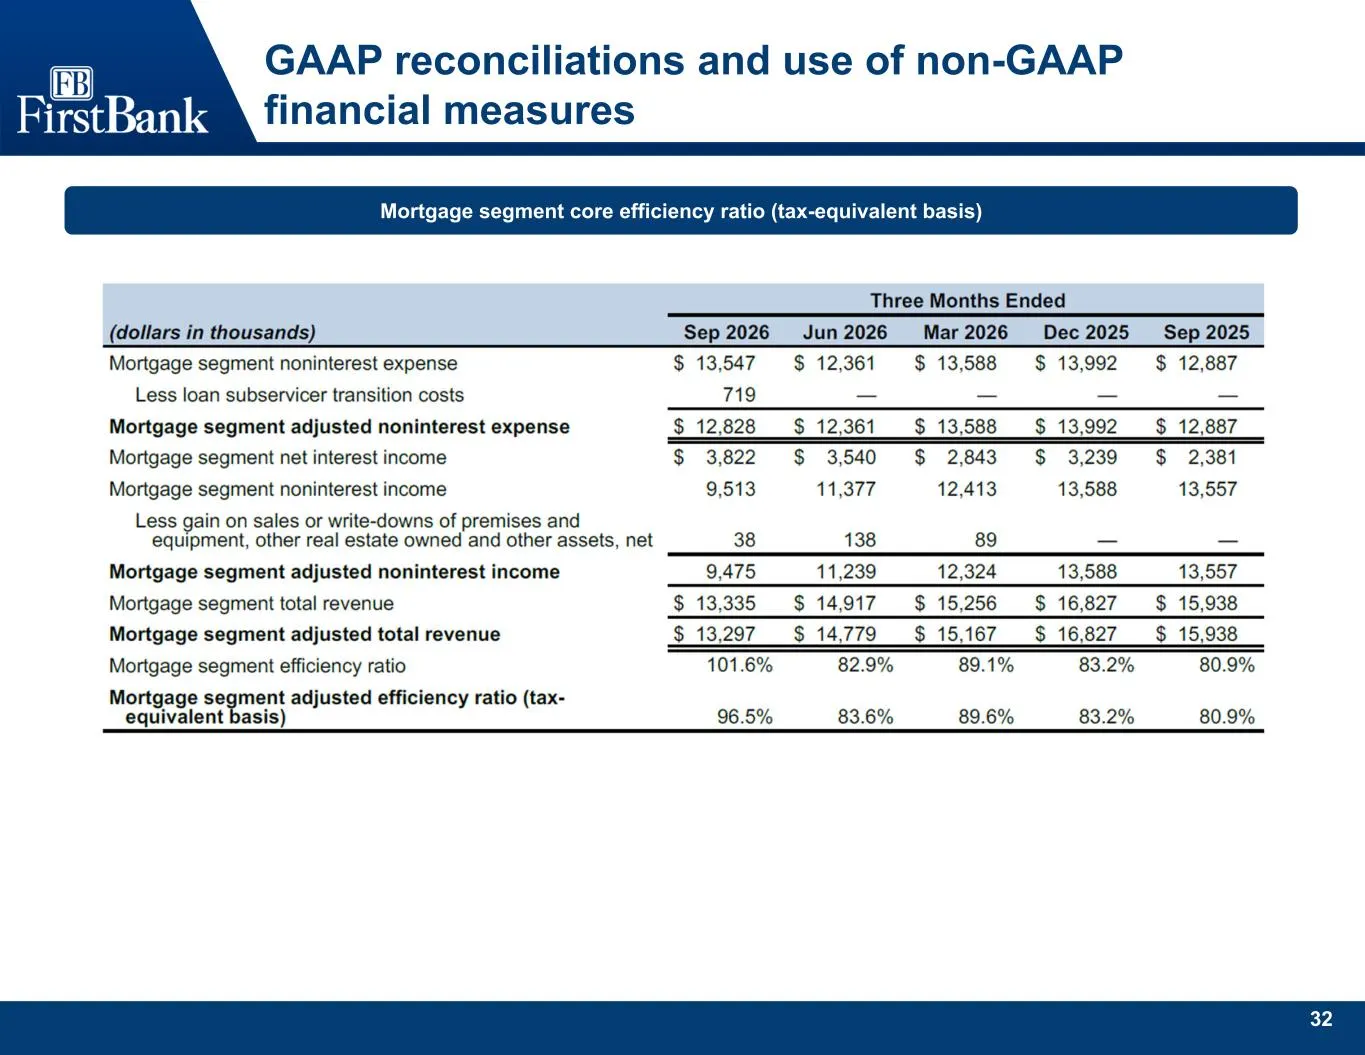
Slide 33: Mortgage segment core efficiency ratio (tax-equivalent basis)
32 GAAP reconciliations and use of non-GAAP financial measures Mortgage segment core efficiency ratio (tax-equivalent basis)
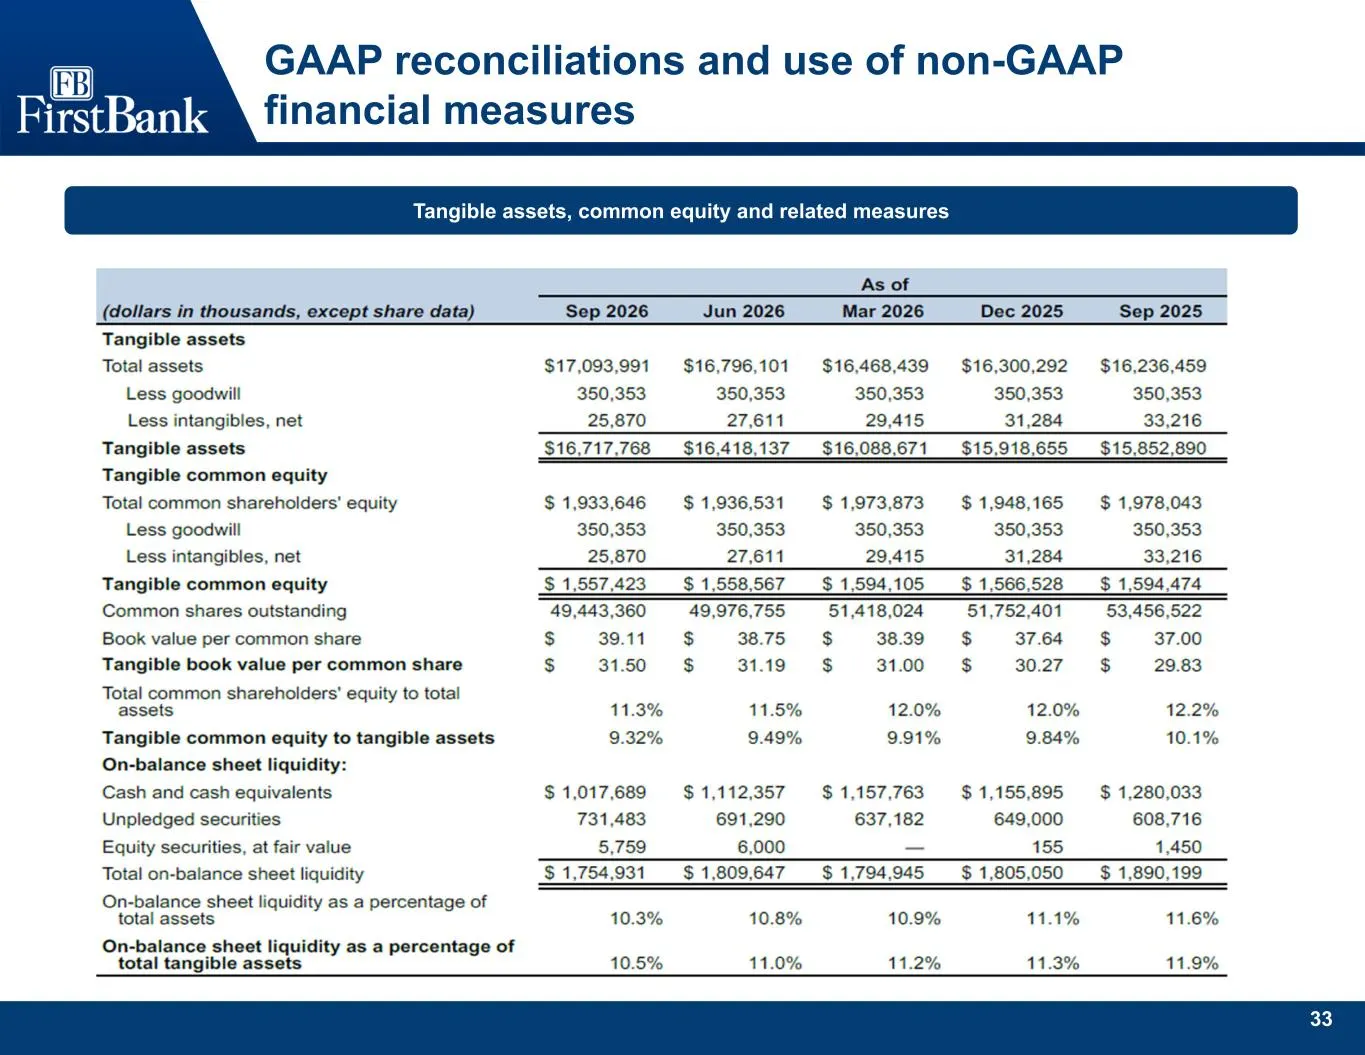
Slide 34: Tangible assets, common equity and related measures
33 GAAP reconciliations and use of non-GAAP financial measures Tangible assets, common equity and related measures
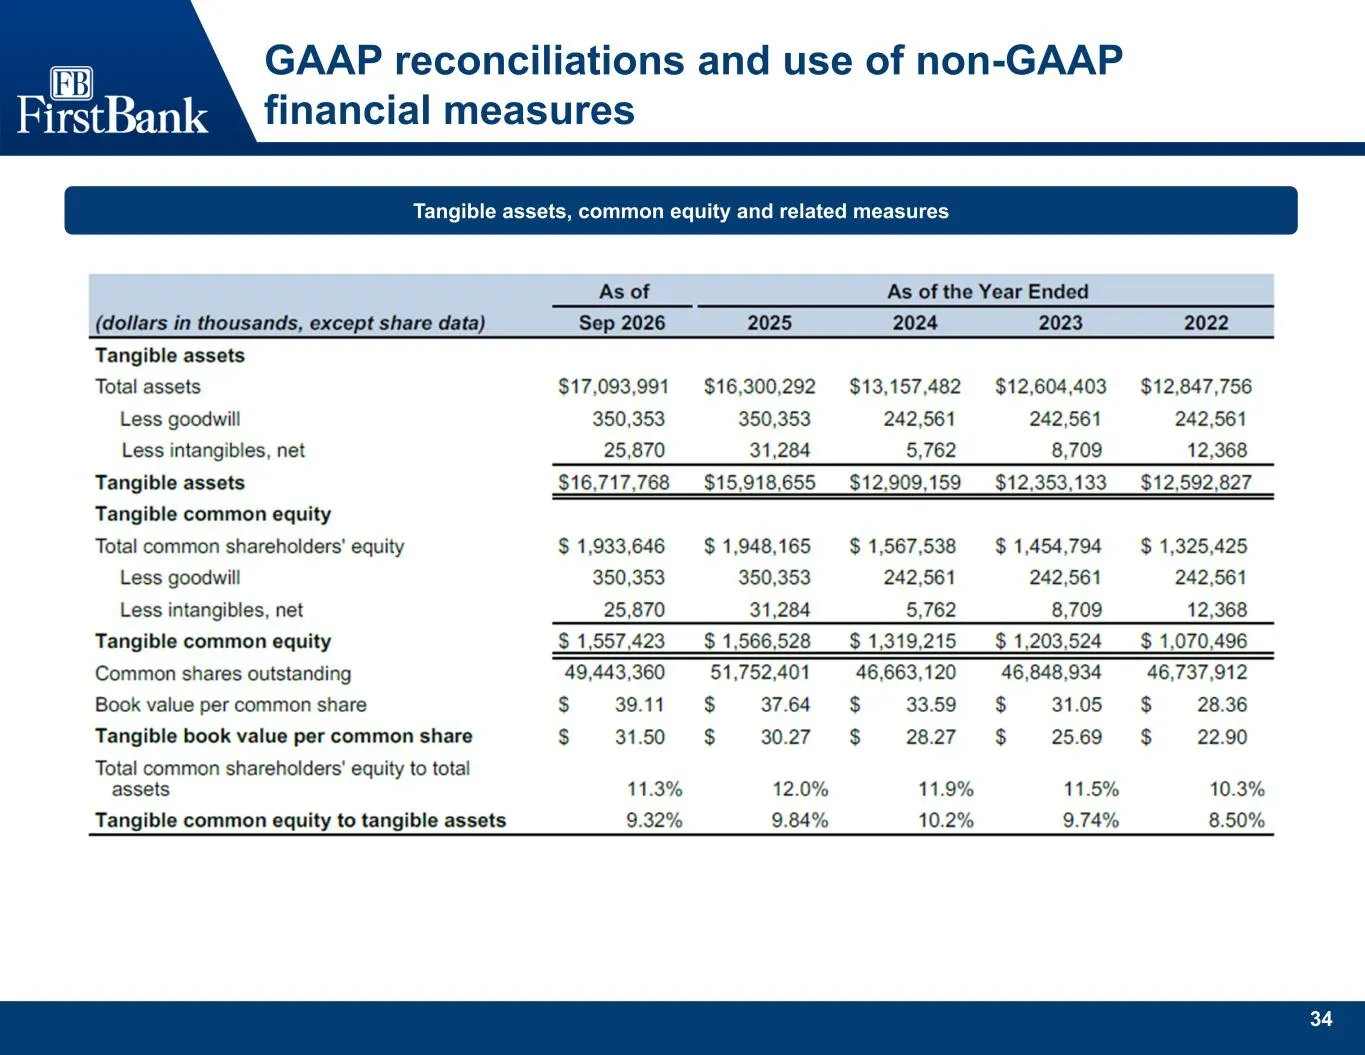
Slide 35: Tangible assets, common equity and related measures
34 GAAP reconciliations and use of non-GAAP financial measures Tangible assets, common equity and related measures
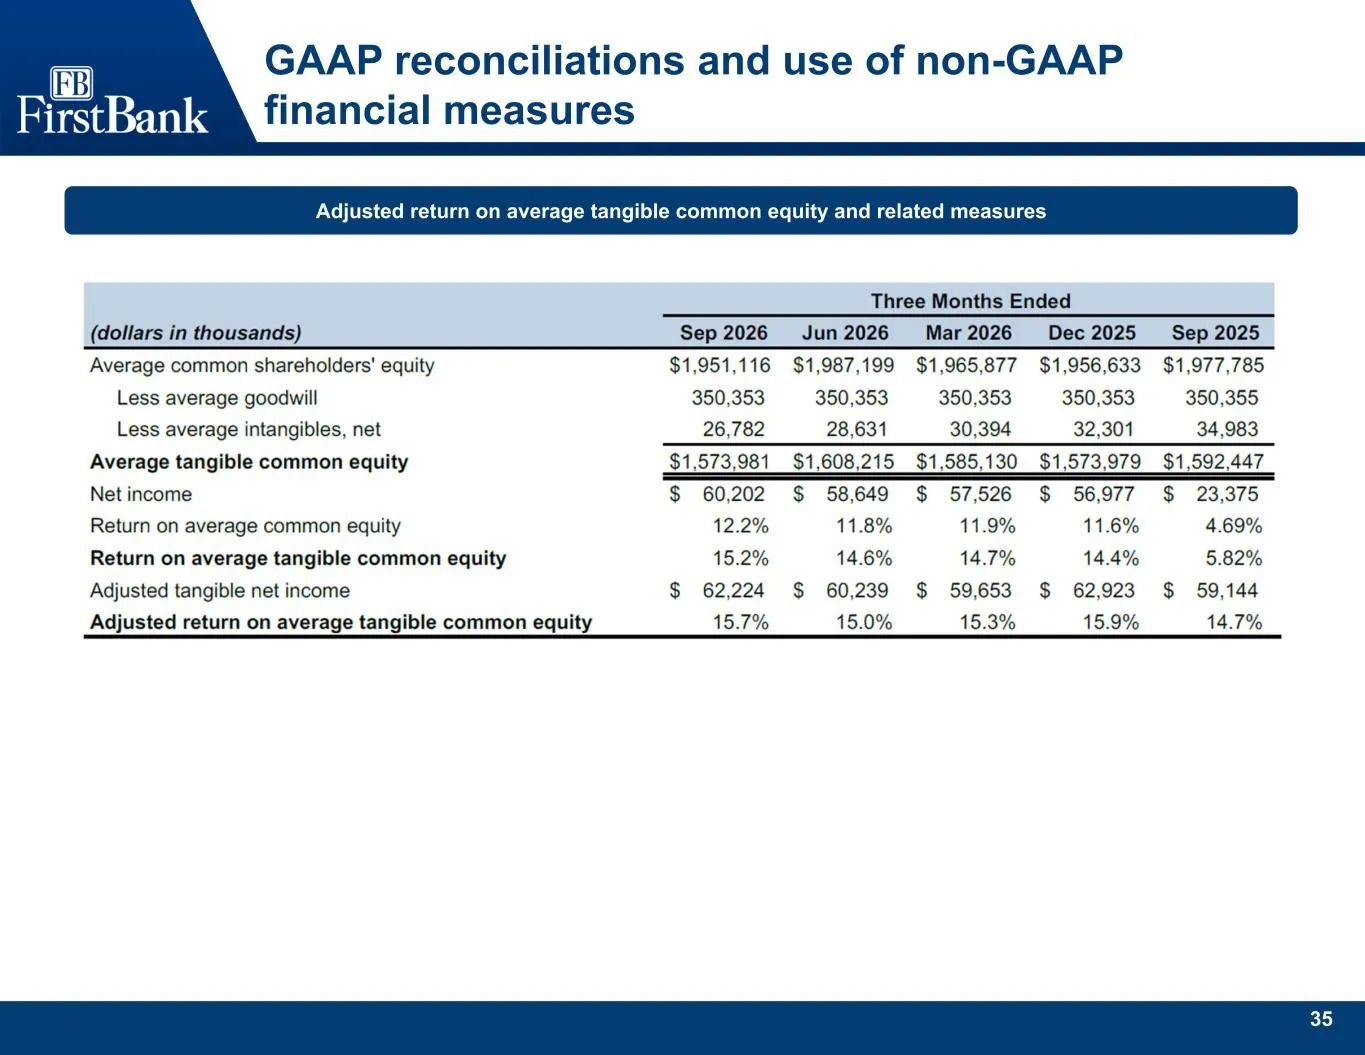
Slide 36: Adjusted return on average tangible common equity and related measures
35 GAAP reconciliations and use of non-GAAP financial measures Adjusted return on average tangible common equity and related measures
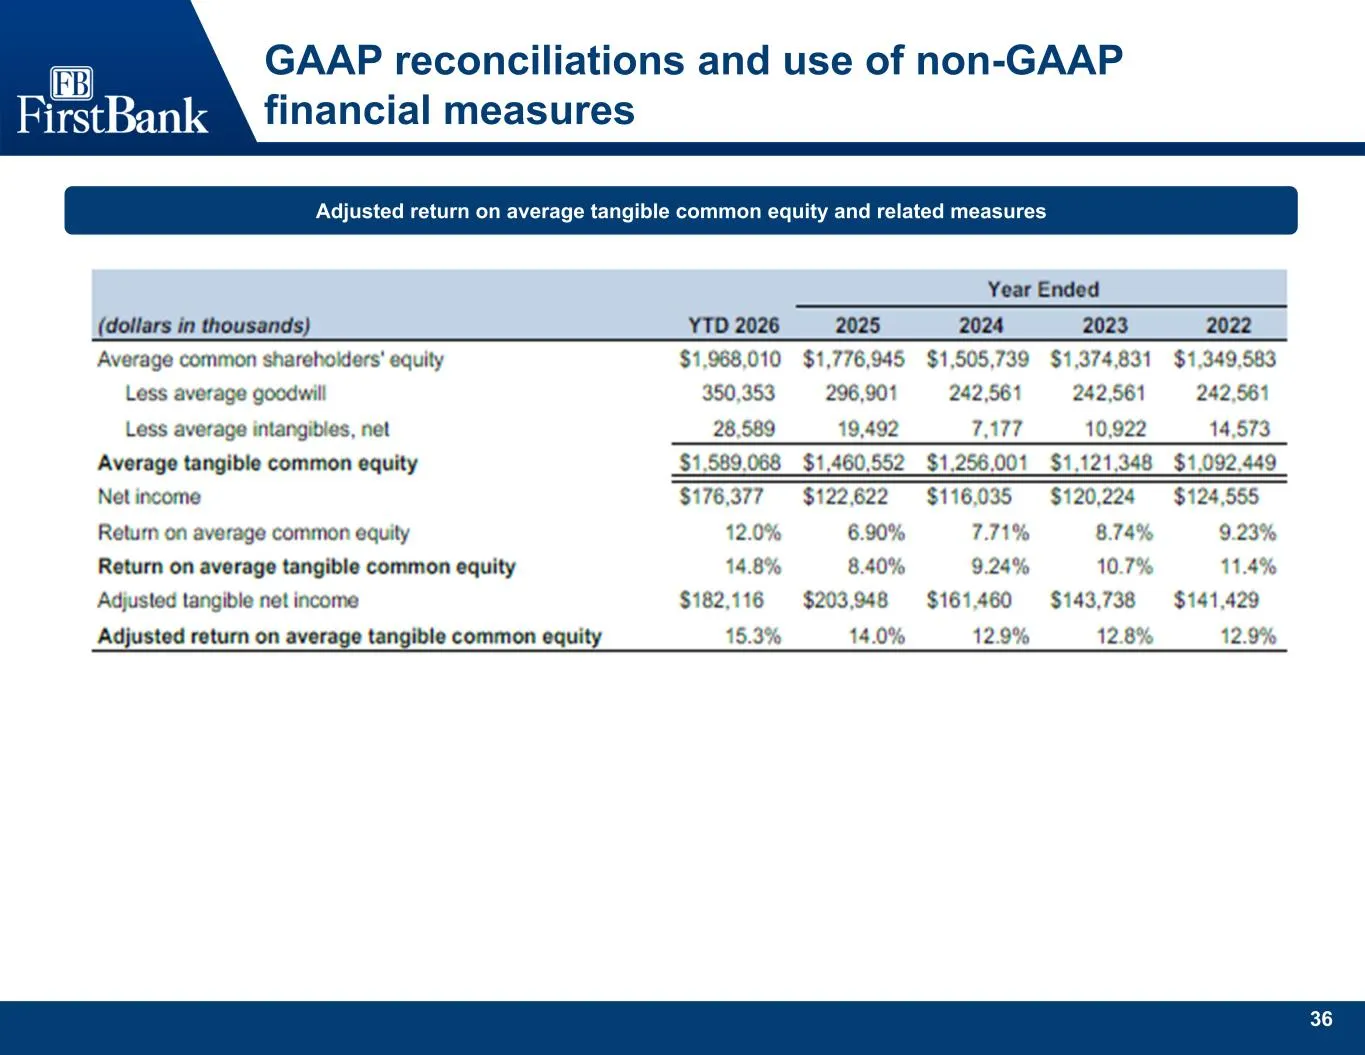
Slide 37: Adjusted return on average tangible common equity and related measures
36 GAAP reconciliations and use of non-GAAP financial measures Adjusted return on average tangible common equity and related measures
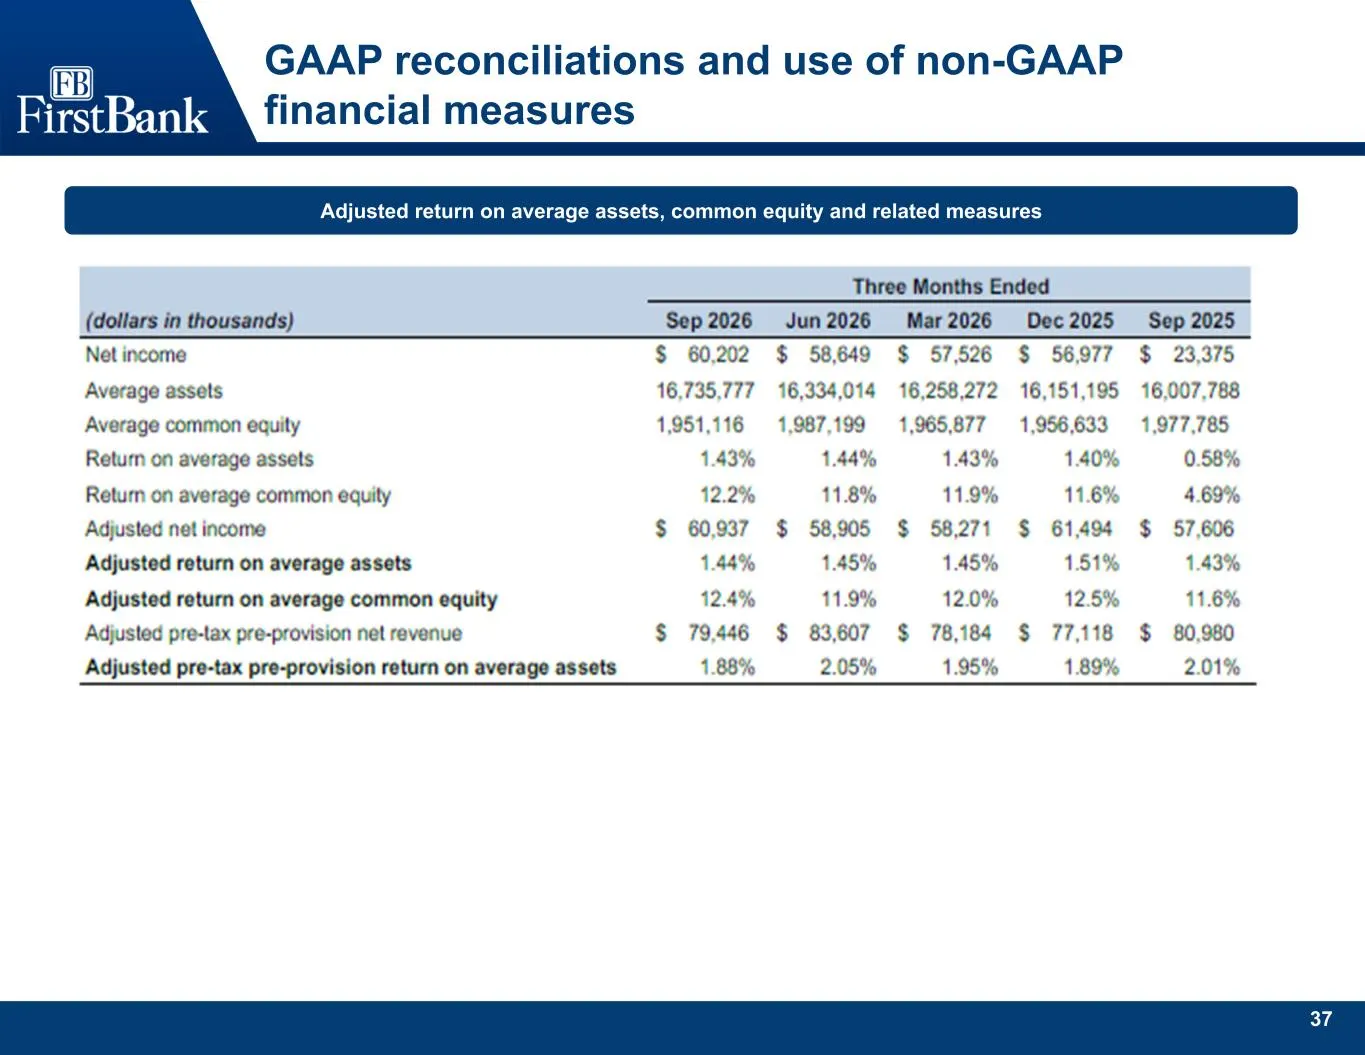
Slide 38: Adjusted return on average assets, common equity and related measures
37 GAAP reconciliations and use of non-GAAP financial measures Adjusted return on average assets, common equity and related measures
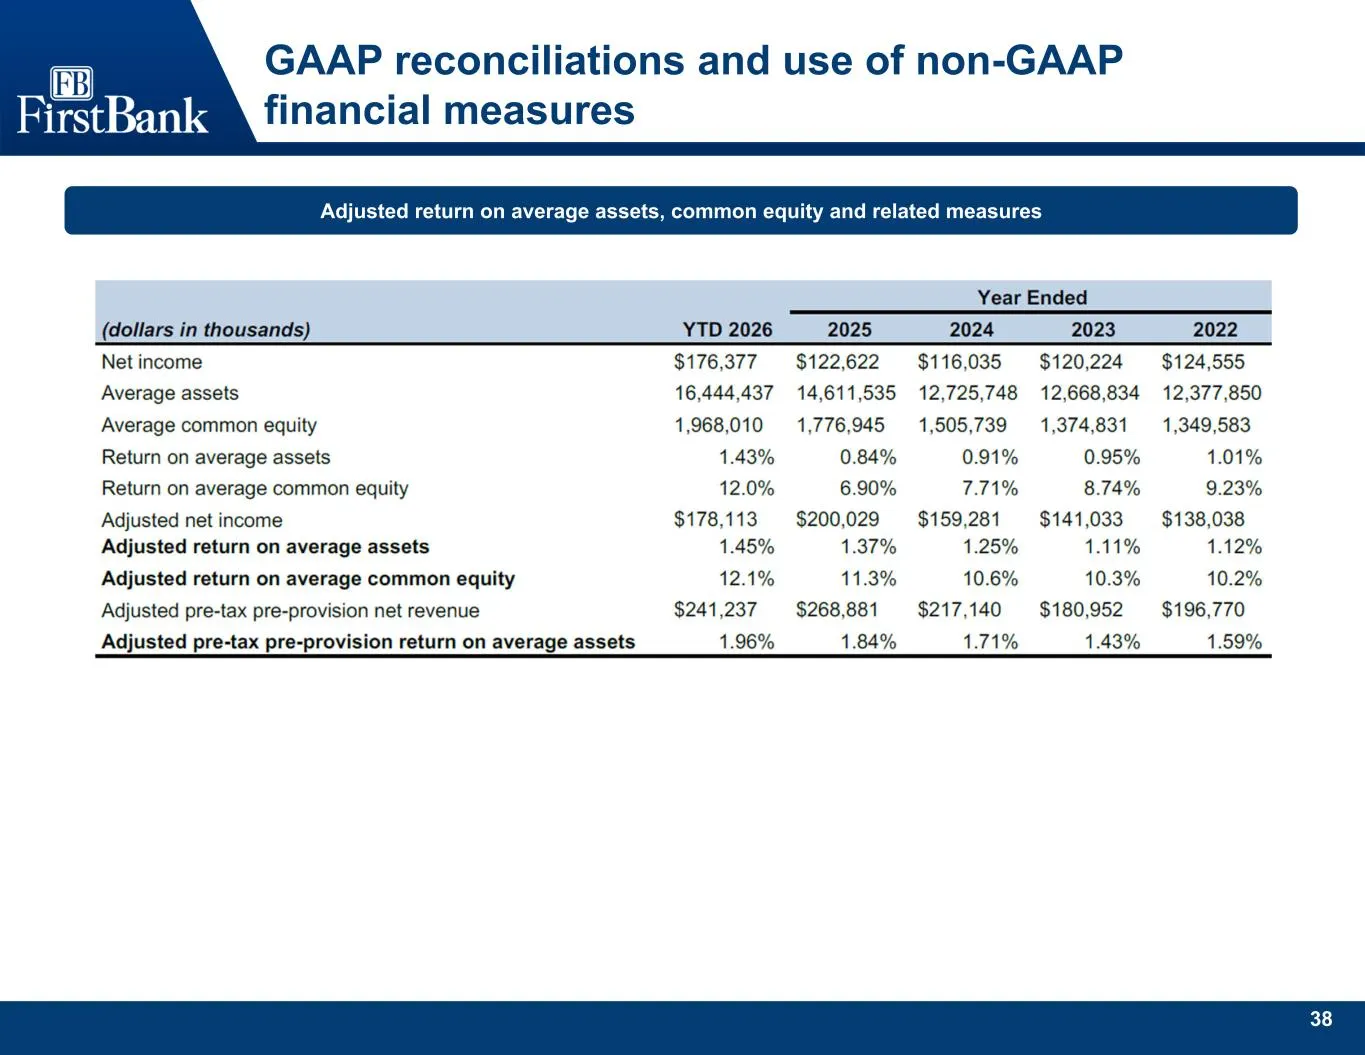
Slide 39: Adjusted return on average assets, common equity and related measures
38 GAAP reconciliations and use of non-GAAP financial measures Adjusted return on average assets, common equity and related measures
Source: SEC EDGAR · 8-K filed Nov 16, 2026
More decks from FB Financial Corporation
 Q3 2026 Earnings Presentation36 slides · Oct 13, 2026
 IPO Roadshow (September 2026)42 slides · Sep 21, 2026
 Debt Investor Presentation (September 2026)40 slides · Sep 17, 2026
 Q2 2026 Earnings Presentation37 slides · Jul 27, 2026
 Q2 2026 Earnings Presentation34 slides · Jul 14, 2026
 Q1 2026 Earnings Presentation38 slides · May 13, 2026