ScanSource, Inc. · NASDAQ:SCSC
ScanSource — Investor Presentation (September 2024)
32 slides from ScanSource's investor presentation, September 2024

Slide 1: Investor Presentation
Investor Presentation September 2024
Slide 2: Safe Harbor and Non-GAAP
SAFE HARBOR AND NON-GAAP Safe Harbor Statement Non-GAAP Financial Information This presentation contains “forward-looking” statements, including our FY25 outlook, mid- In addition to disclosing results that are determined in accordance with United States term goals, market growth rates through 2027,
Slide 3: ScanSource – A Transformed Company
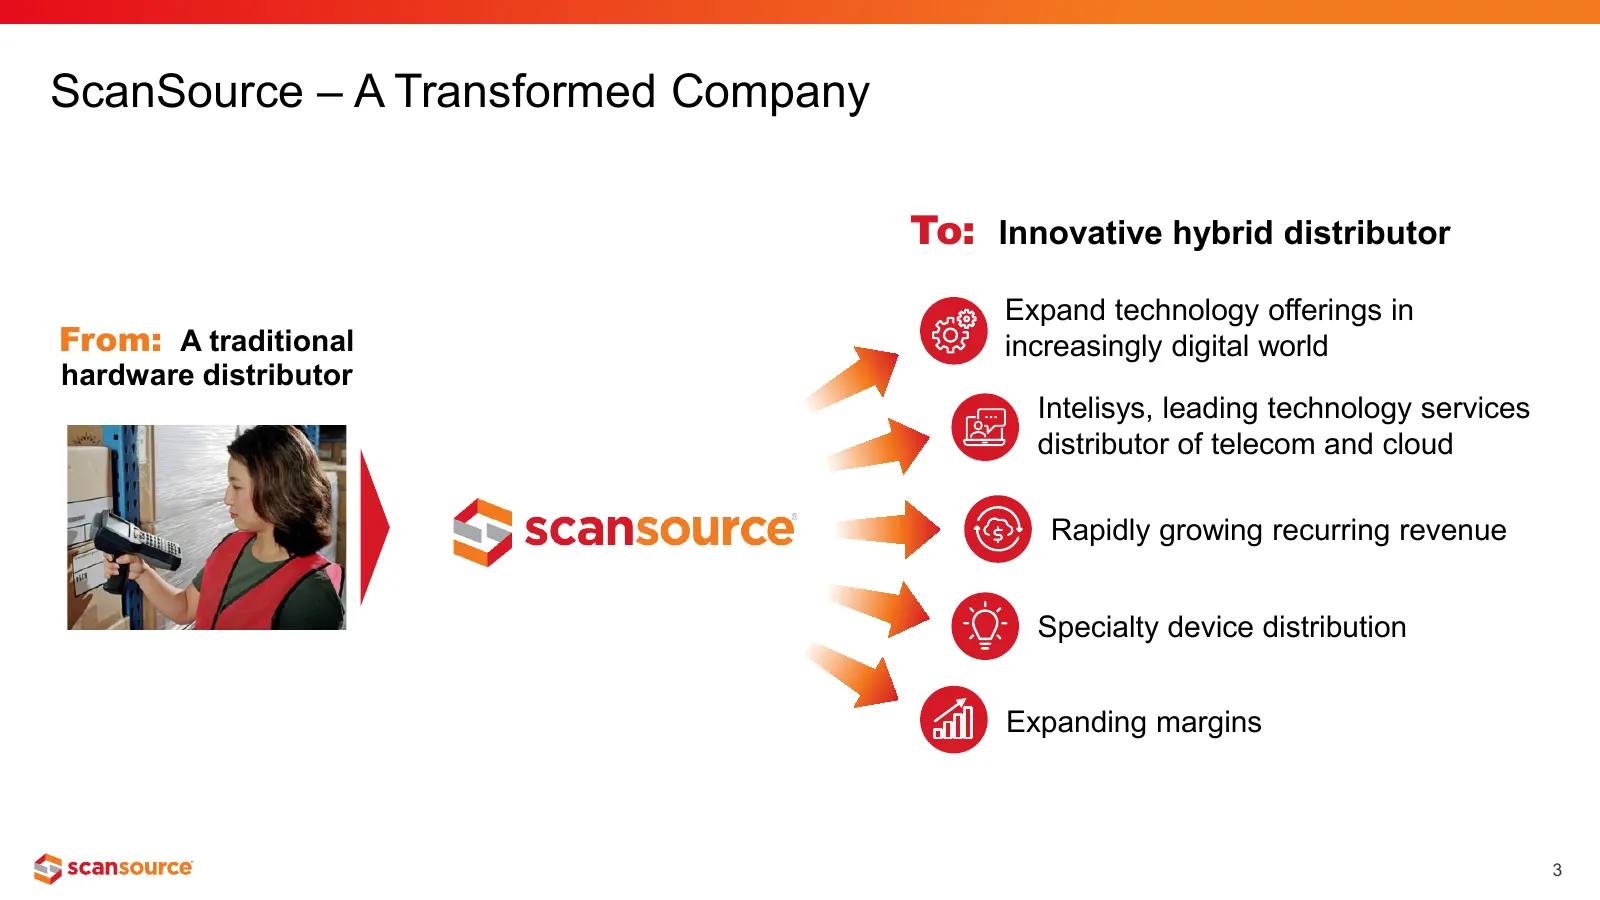
ScanSource – A Transformed Company To: Innovative hybrid distributor Expand technology offerings in From: A traditional increasingly digital world hardware distributor Intelisys, leading technology services distributor of telecom and cloud Rapidly growing recurring revenue Specialty device distribut
Slide 4: Leading Hybrid Distributor. Expanding Value for Partners.
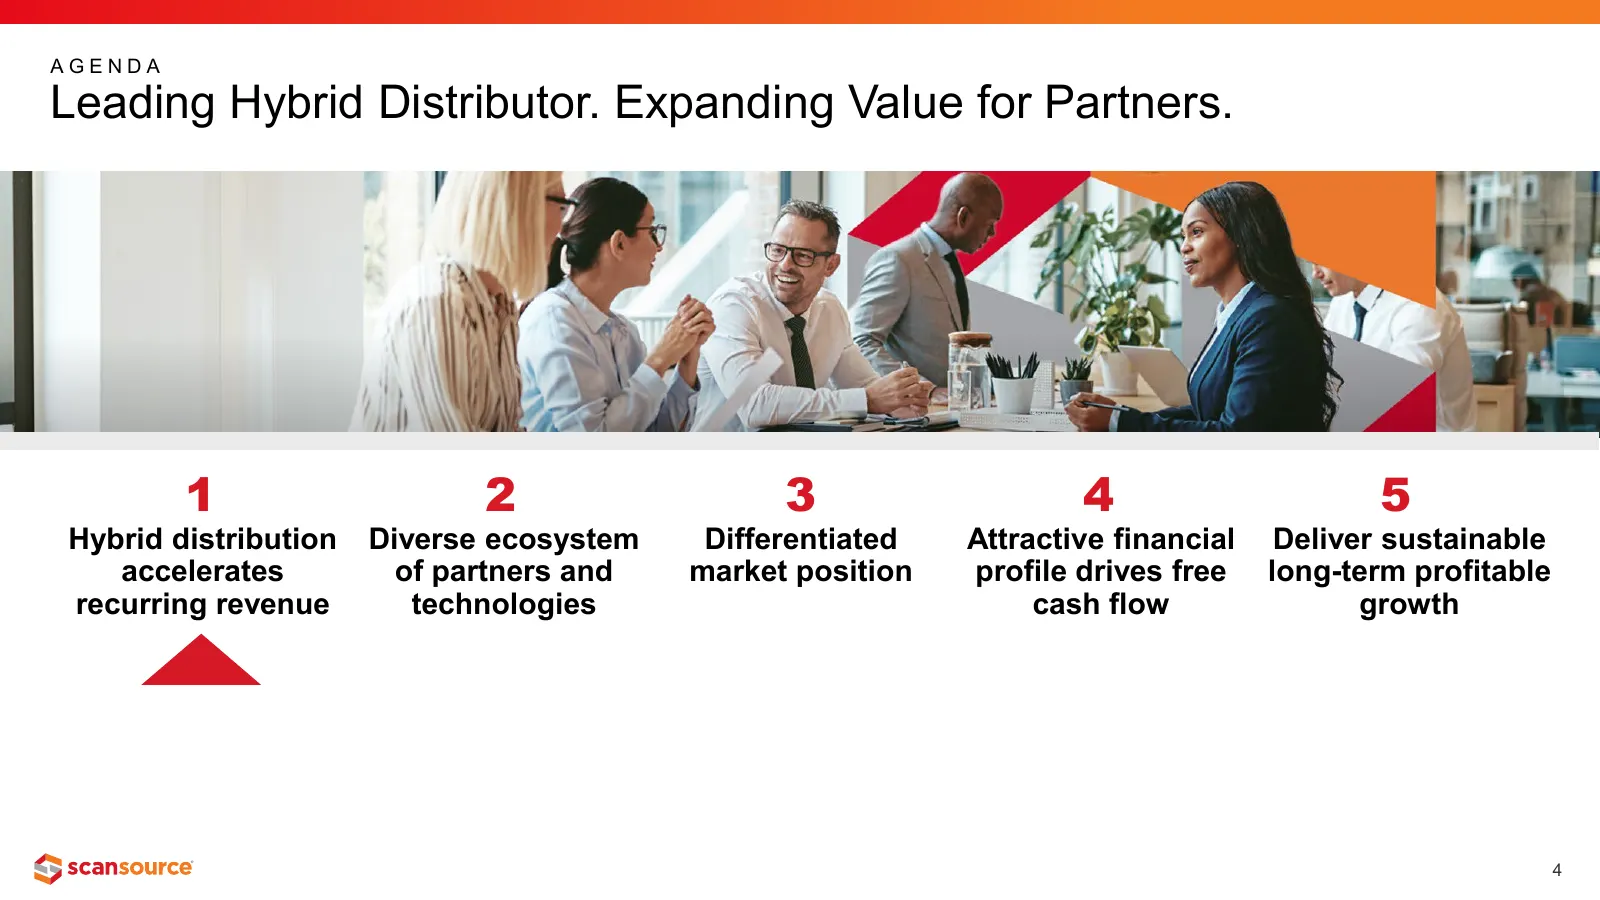
AGENDA Leading Hybrid Distributor. Expanding Value for Partners. 1 2 3 4 5 Hybrid distribution Diverse ecosystem Differentiated Attractive financial Deliver sustainable accelerates of partners and market position profile drives free long-term profitable recurring revenue technologies cash flow growt
Slide 5: ScanSource At-a-Glance – Leading Hybrid Distributor
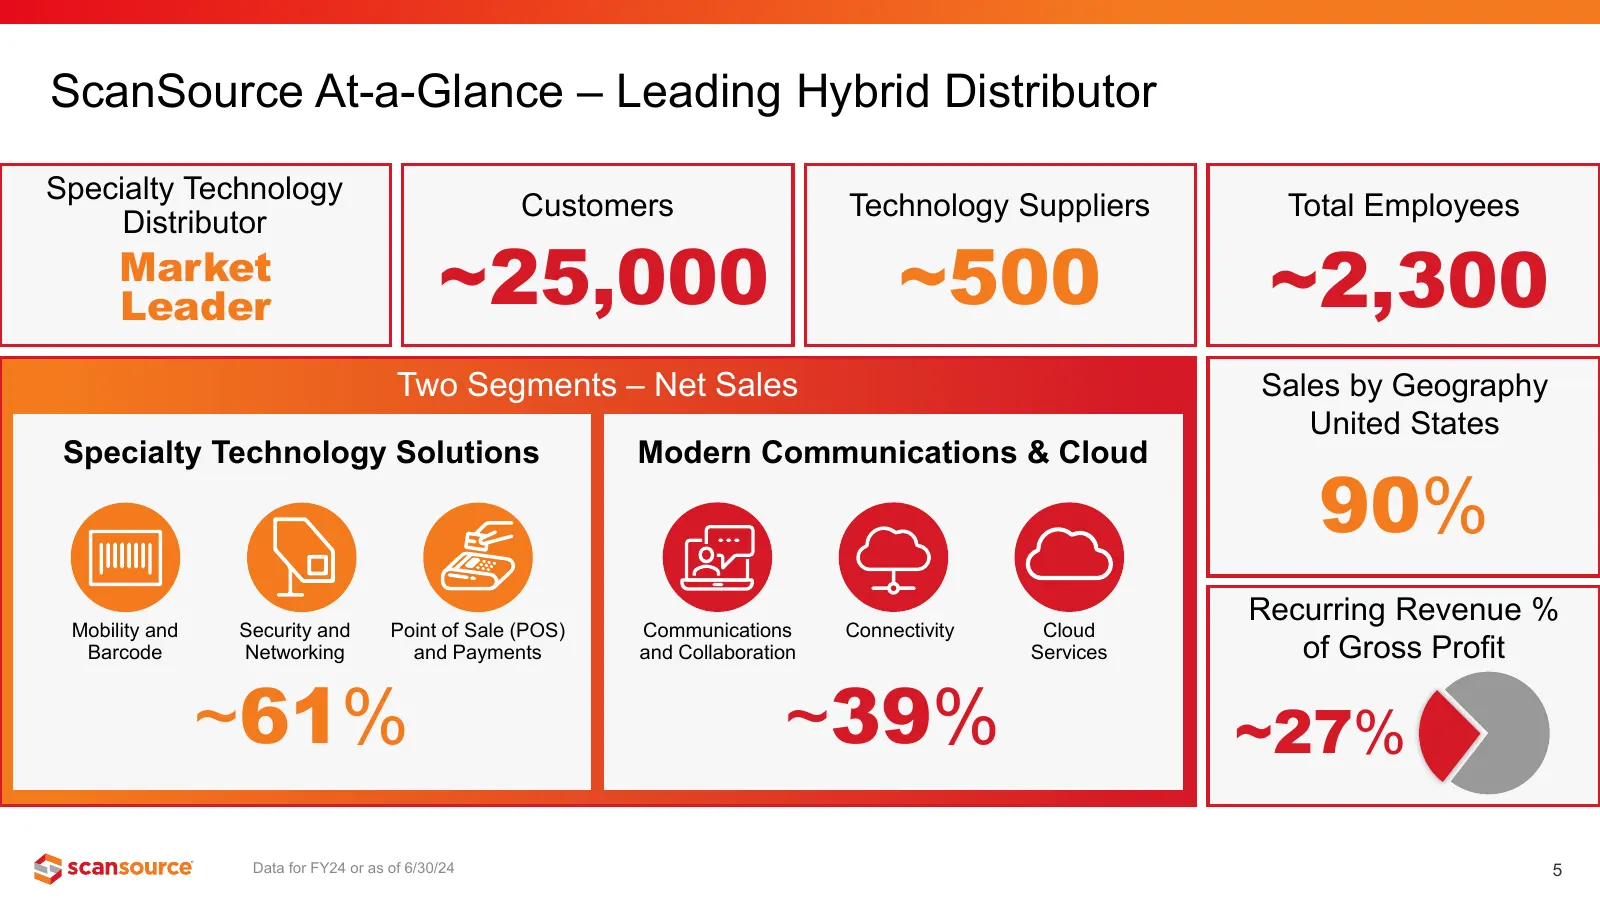
ScanSource At-a-Glance – Leading Hybrid Distributor Specialty Technology Customers Technology Suppliers Total Employees Distributor Market Leader ~25,000 ~500 ~2,300 Two Segments – Net Sales Sales by Geography United States Specialty Technology Solutions Modern Communications & Cloud 90% Recurring R
Slide 6: Clear Evidence of a Transformed Business Model
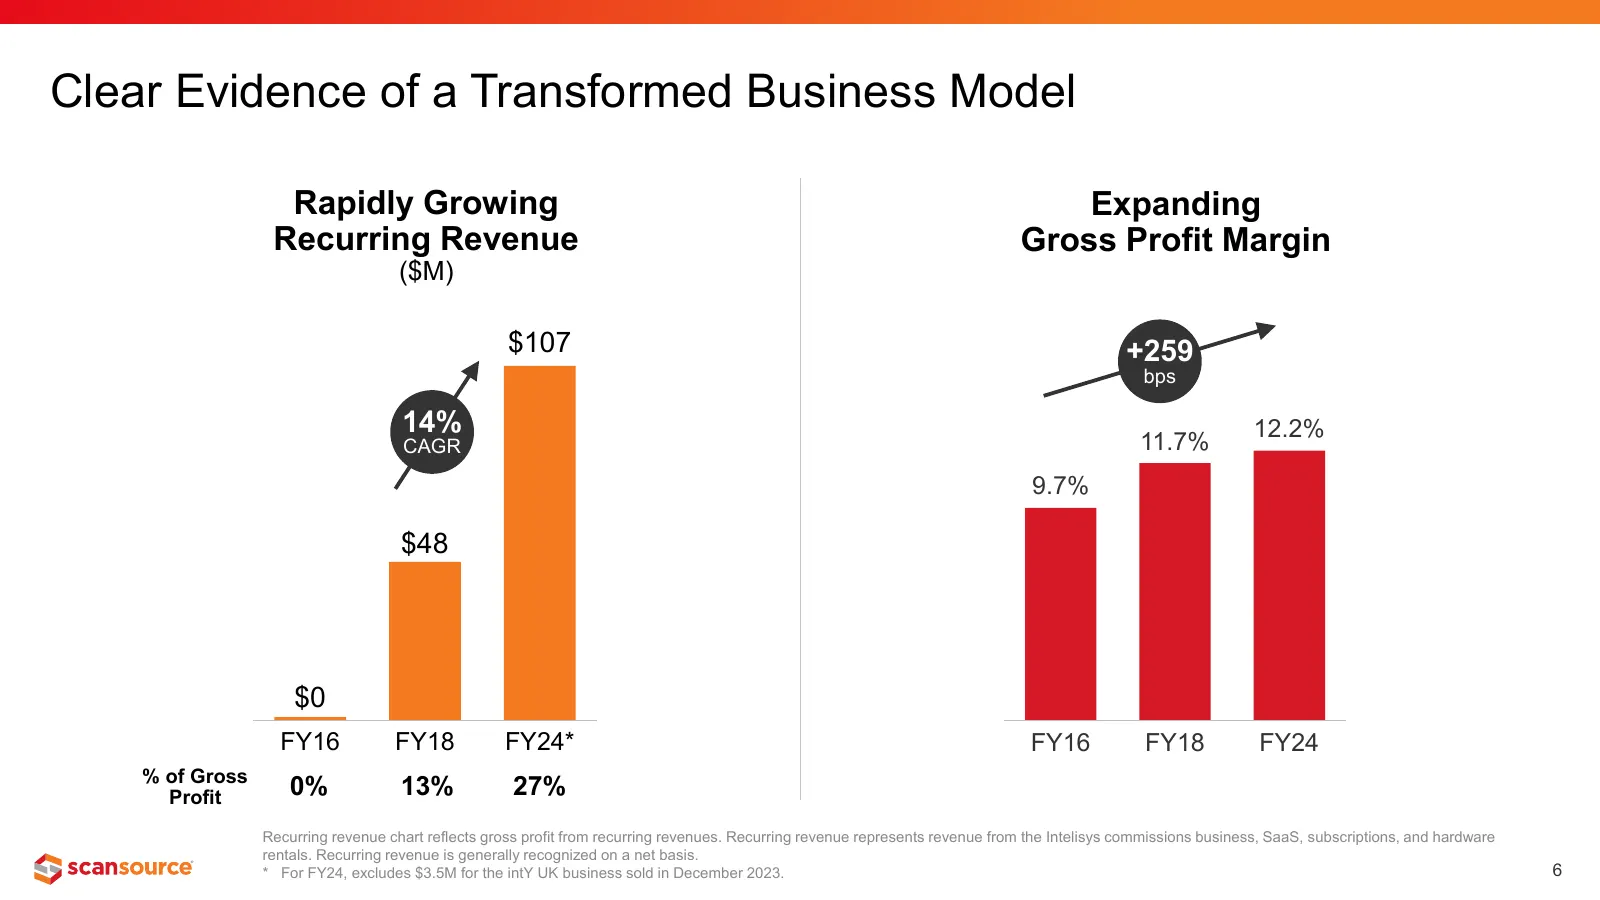
Clear Evidence of a Transformed Business Model Rapidly Growing Expanding Recurring Revenue Gross Profit Margin ($M) $107 +259 bps 14% 12.2% CAGR 11.7% 9.7% $48 $0 FY16 FY18 FY24* FY16 FY18 FY24 % of Gross Profit 0% 13% 27% Recurring revenue chart reflects gross profit from recurring revenues. Recurr
Slide 7: ScanSource Plays a Pivotal Role Accelerating Growth for Our Customers
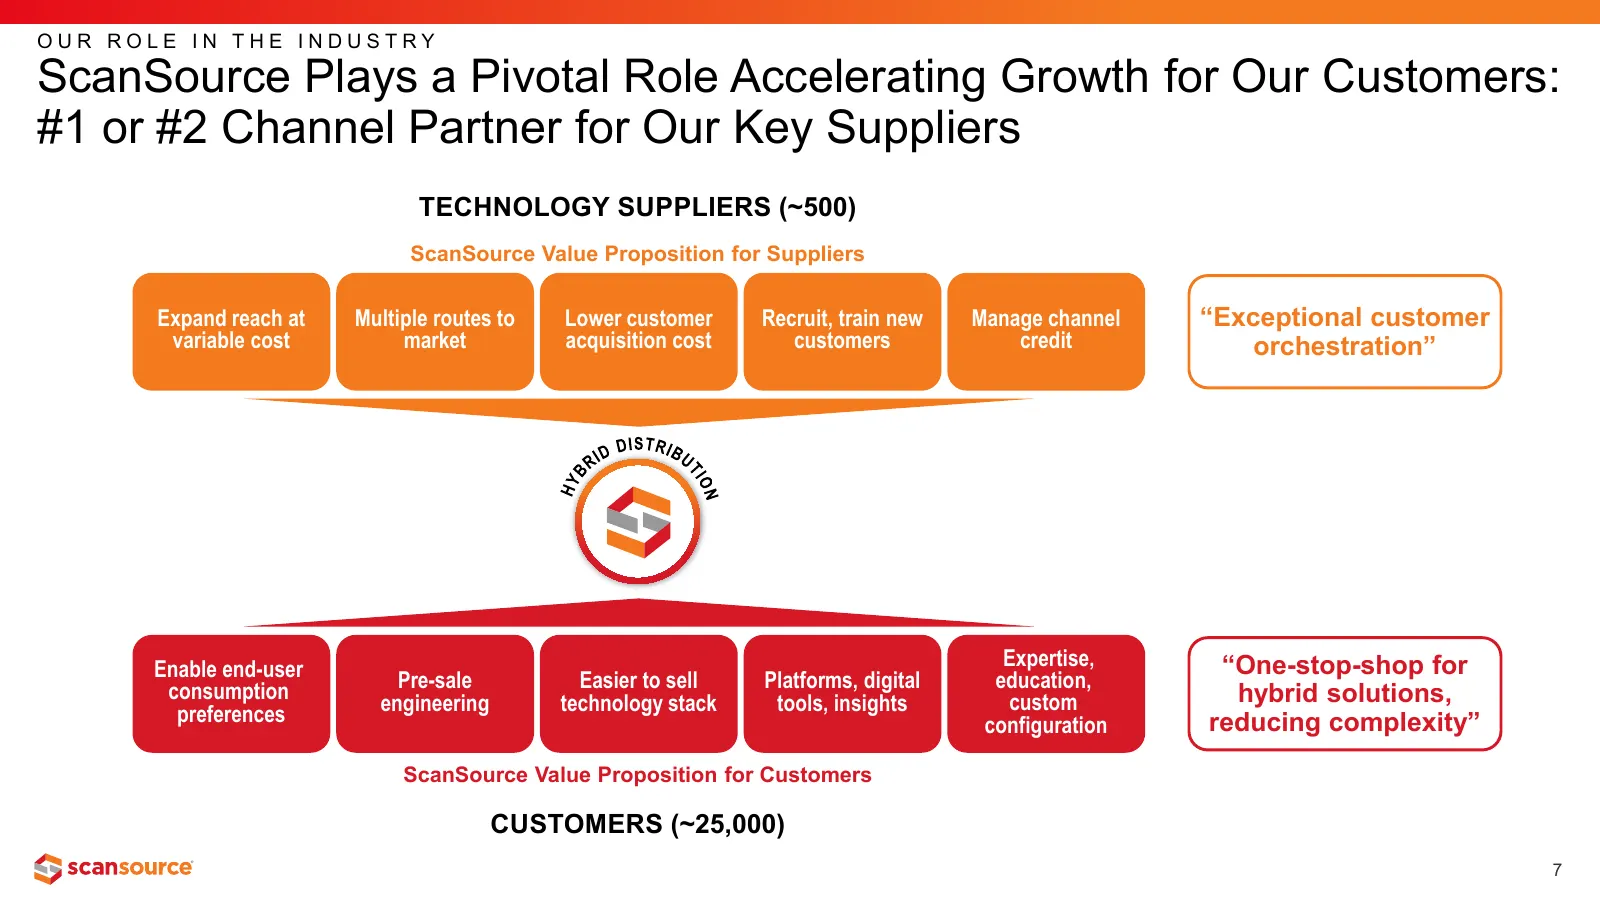
OUR ROLE IN THE INDUSTRY ScanSource Plays a Pivotal Role Accelerating Growth for Our Customers: #1 or #2 Channel Partner for Our Key Suppliers TECHNOLOGY SUPPLIERS (~500) ScanSource Value Proposition for Suppliers Expand reach at Multiple routes to Lower customer Recruit, train new Manage channel “E

Slide 8: Our Mission
OUR MISSION Drive sustainable profitable growth by orchestrating hybrid technology solutions through a rapidly growing ecosystem of suppliers and customers leveraging our people, processes, and tools. 8
Slide 9: Leading Hybrid Distributor. Expanding Value for Partners.
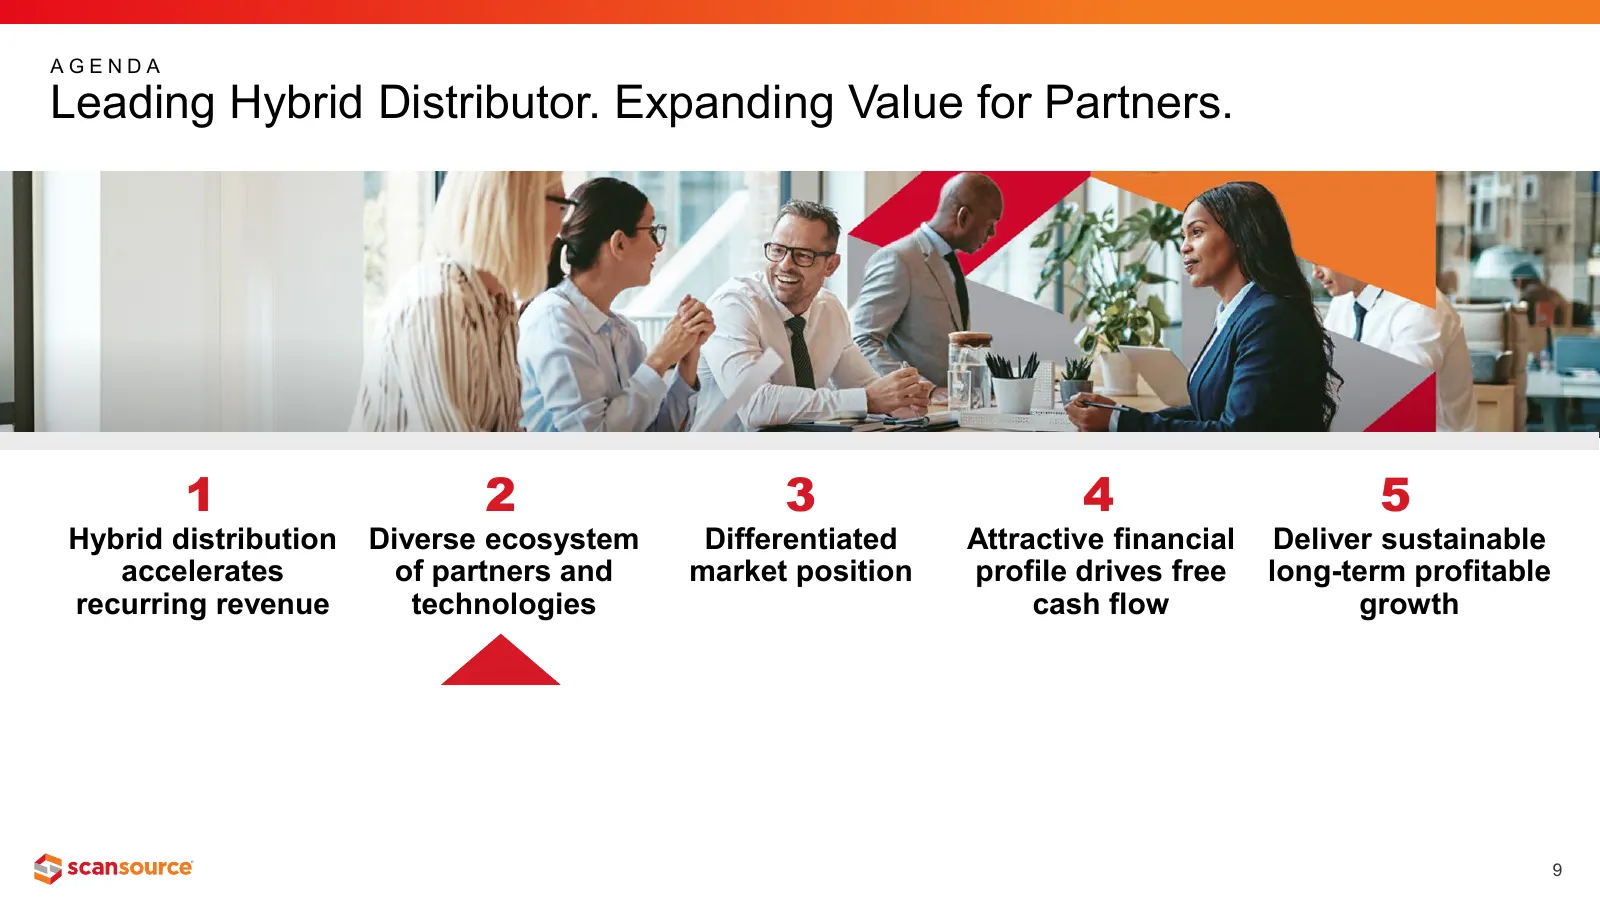
AGENDA Leading Hybrid Distributor. Expanding Value for Partners. 1 2 3 4 5 Hybrid distribution Diverse ecosystem Differentiated Attractive financial Deliver sustainable accelerates of partners and market position profile drives free long-term profitable recurring revenue technologies cash flow growt
Slide 10: Building On Specialized Technologies – Two Segments
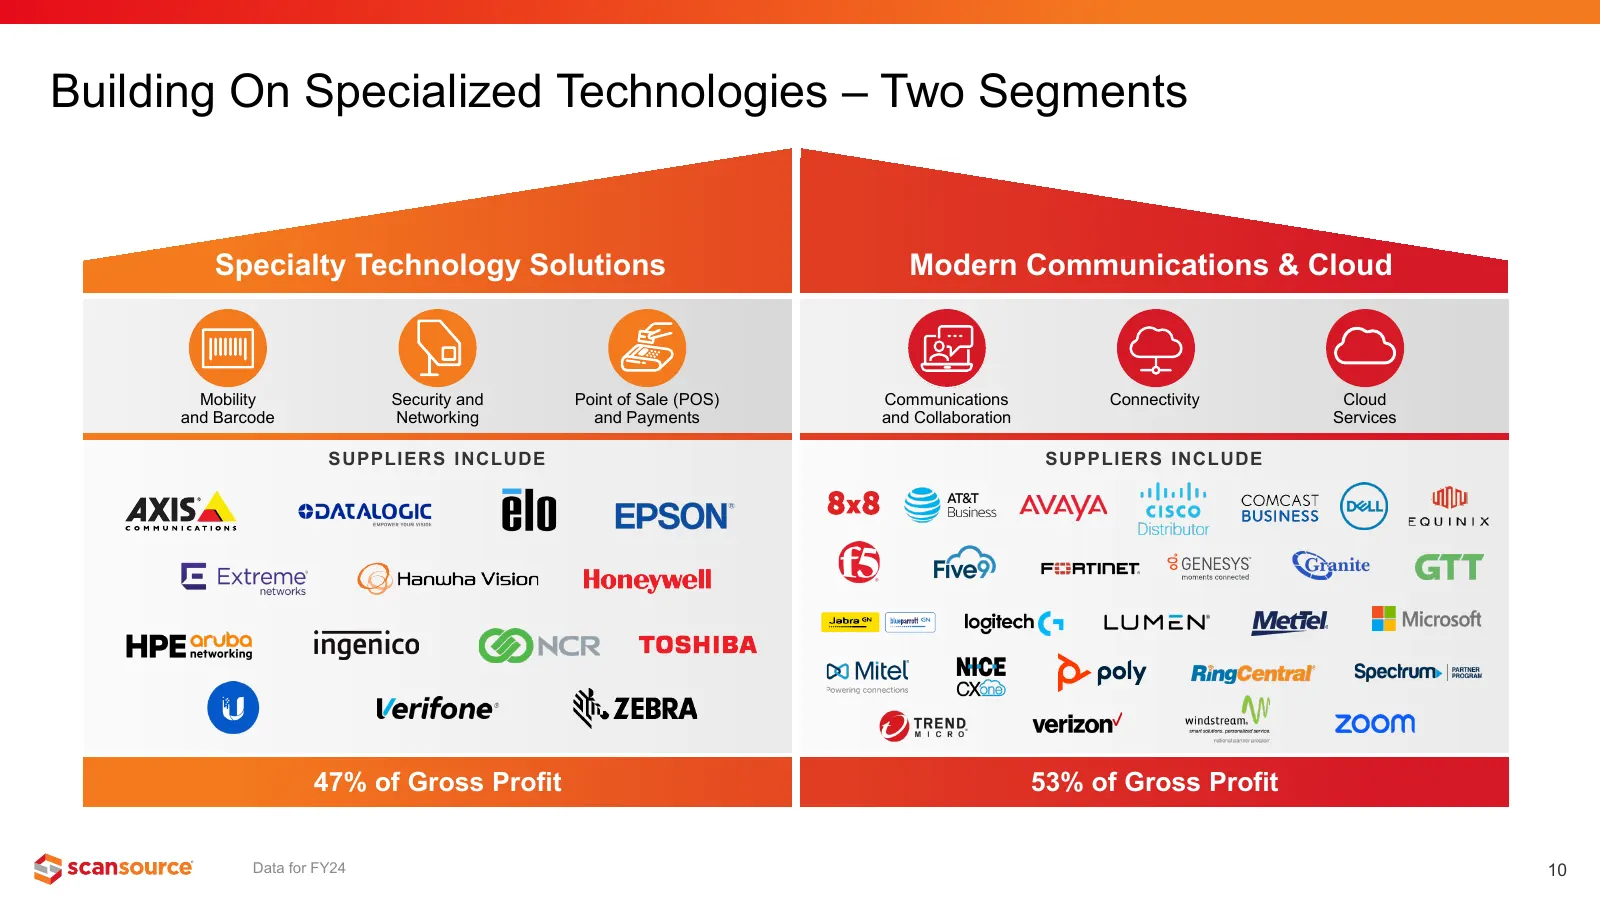
Building On Specialized Technologies – Two Segments Specialty Technology Solutions Modern Communications & Cloud Mobility Security and Point of Sale (POS) Communications Connectivity Cloud and Barcode Networking and Payments and Collaboration Services SUPPLIERS INCLUDE SUPPLIERS INCLUDE 47% of Gross
Slide 11: Setting the Hardware Business Up to Deliver Sustainable Profitable Growth
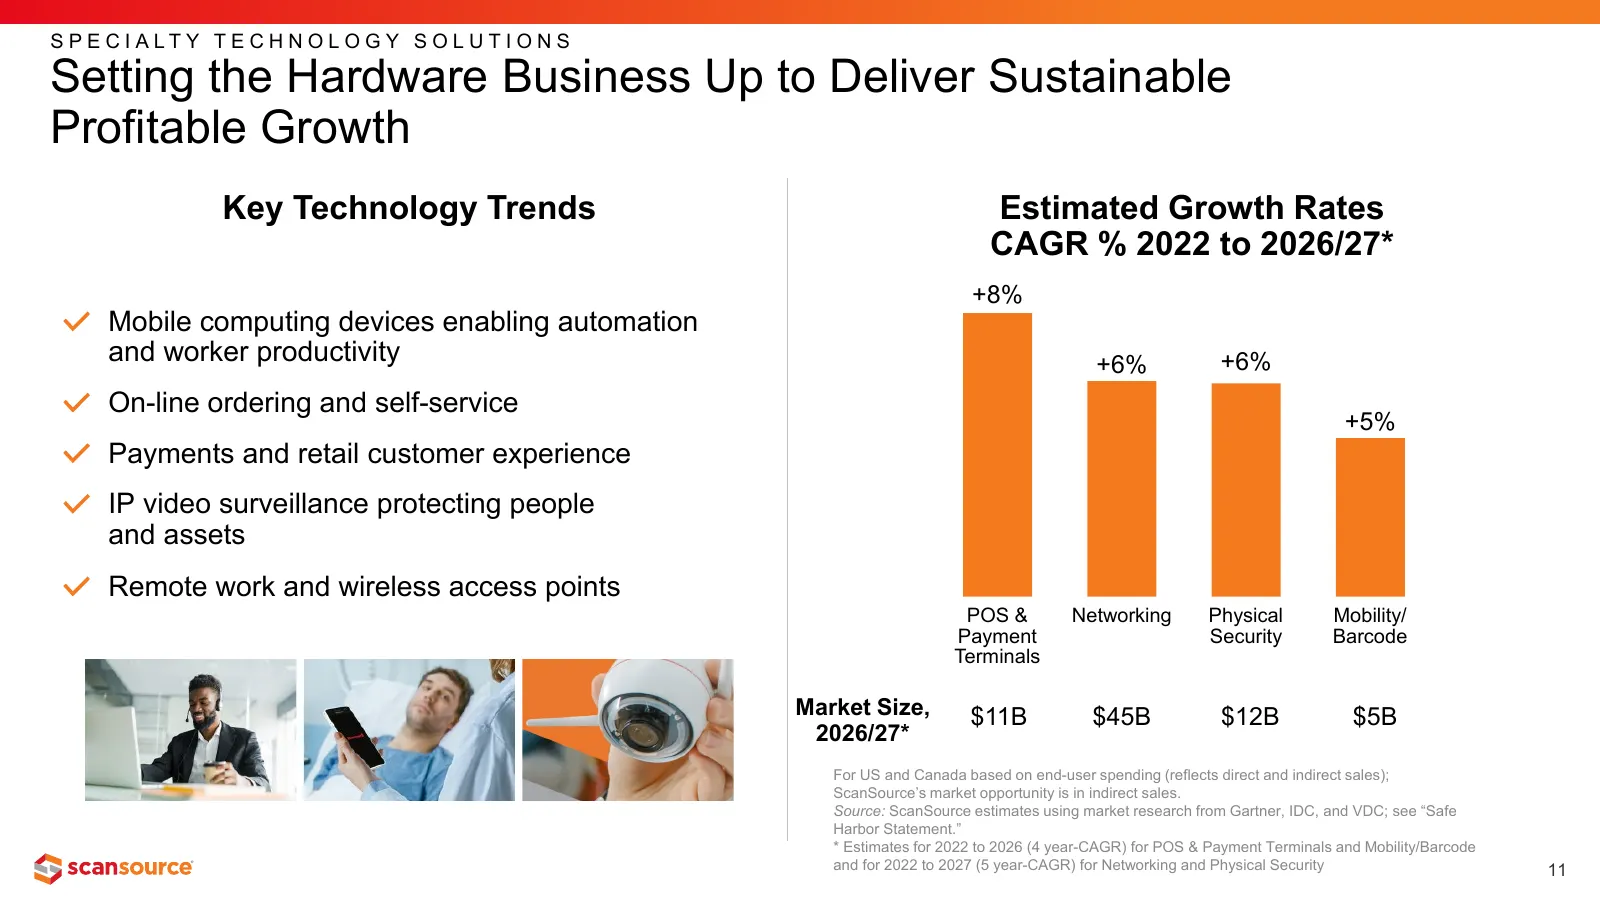
S P E C I A LT Y T E C H N O L O G Y S O L U T I O N S Setting the Hardware Business Up to Deliver Sustainable Profitable Growth Key Technology Trends Estimated Growth Rates CAGR % 2022 to 2026/27* +8% Mobile computing devices enabling automation and worker productivity +6% +6% On-line ordering and
Slide 12: Positioned in High Growth Cloud Markets
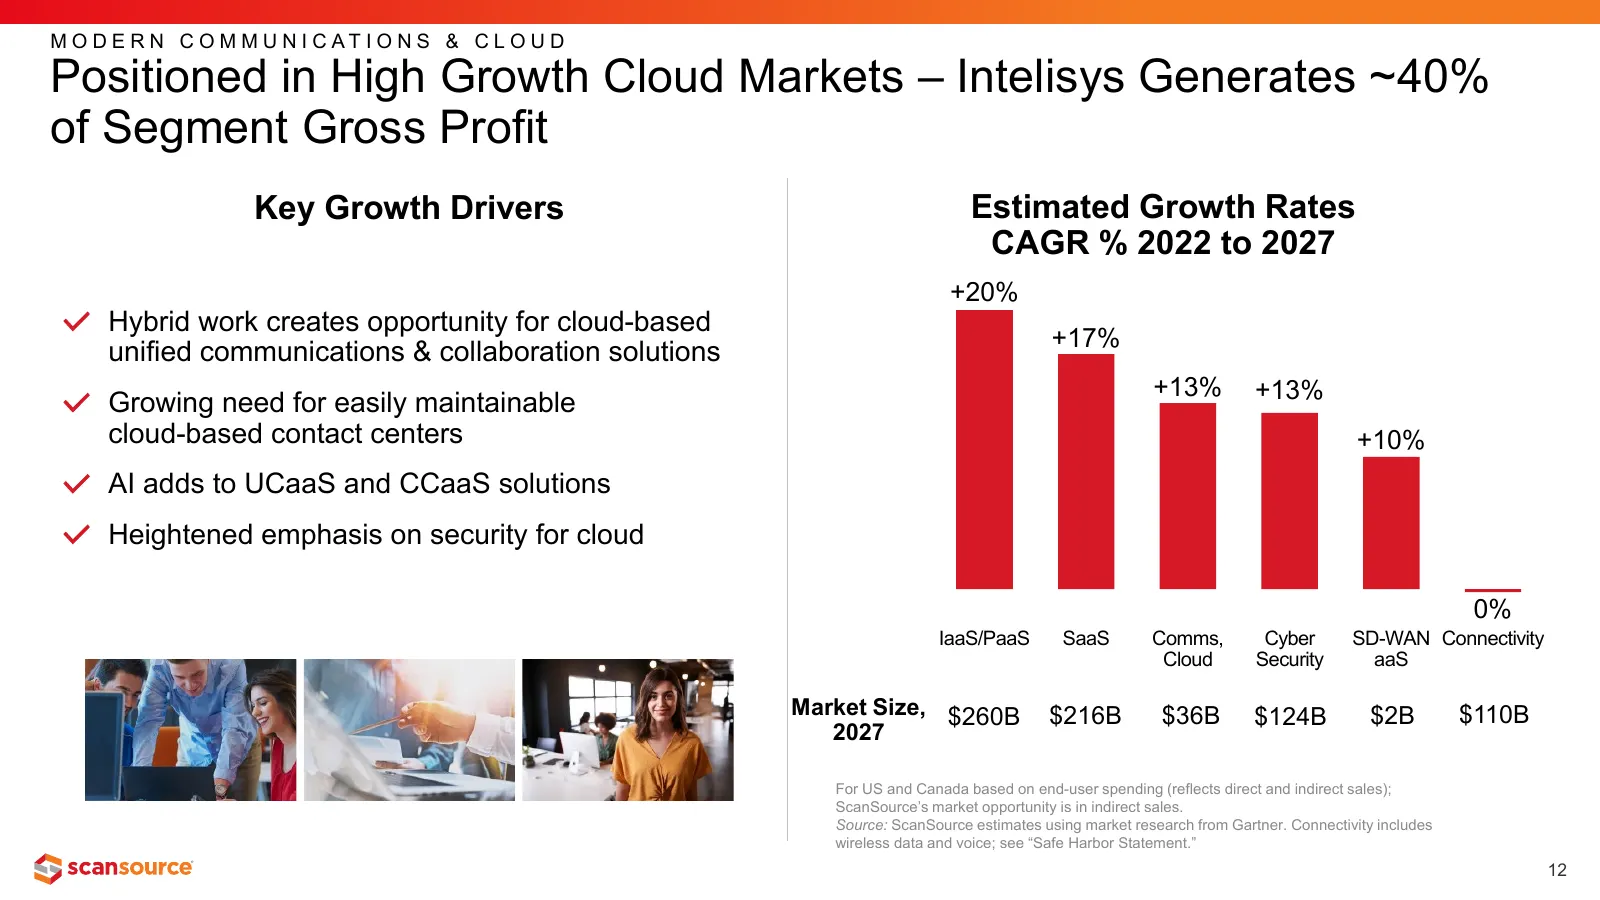
M O D E R N C O M M U N I C AT I O N S & C L O U D Positioned in High Growth Cloud Markets – Intelisys Generates ~40% of Segment Gross Profit Key Growth Drivers Estimated Growth Rates CAGR % 2022 to 2027 +20% Hybrid work creates opportunity for cloud-based +17% unified communications & collaboration
Slide 13: Intelisys A Key Driver of Gross Profit Growth
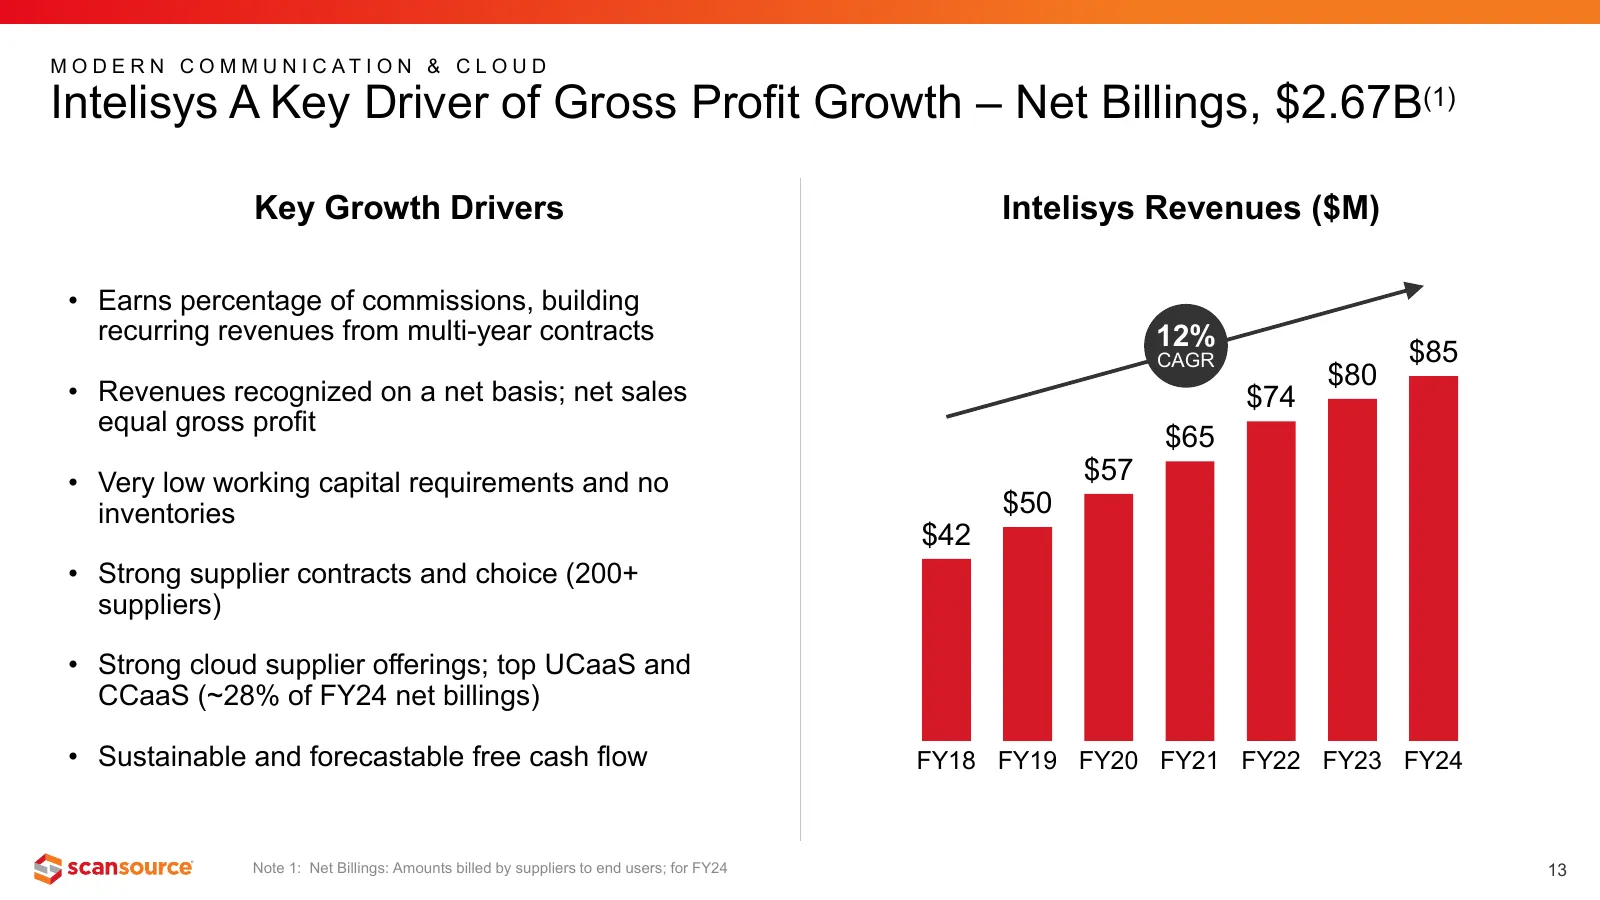
M O D E R N C O M M U N I C AT I O N & C L O U D Intelisys A Key Driver of Gross Profit Growth – Net Billings, $2.67B(1) Key Growth Drivers Intelisys Revenues ($M) • Earns percentage of commissions, building recurring revenues from multi-year contracts 12% CAGR $85 $80 • Revenues recognized on a net
Slide 14: Leading Hybrid Distributor. Expanding Value for Partners.
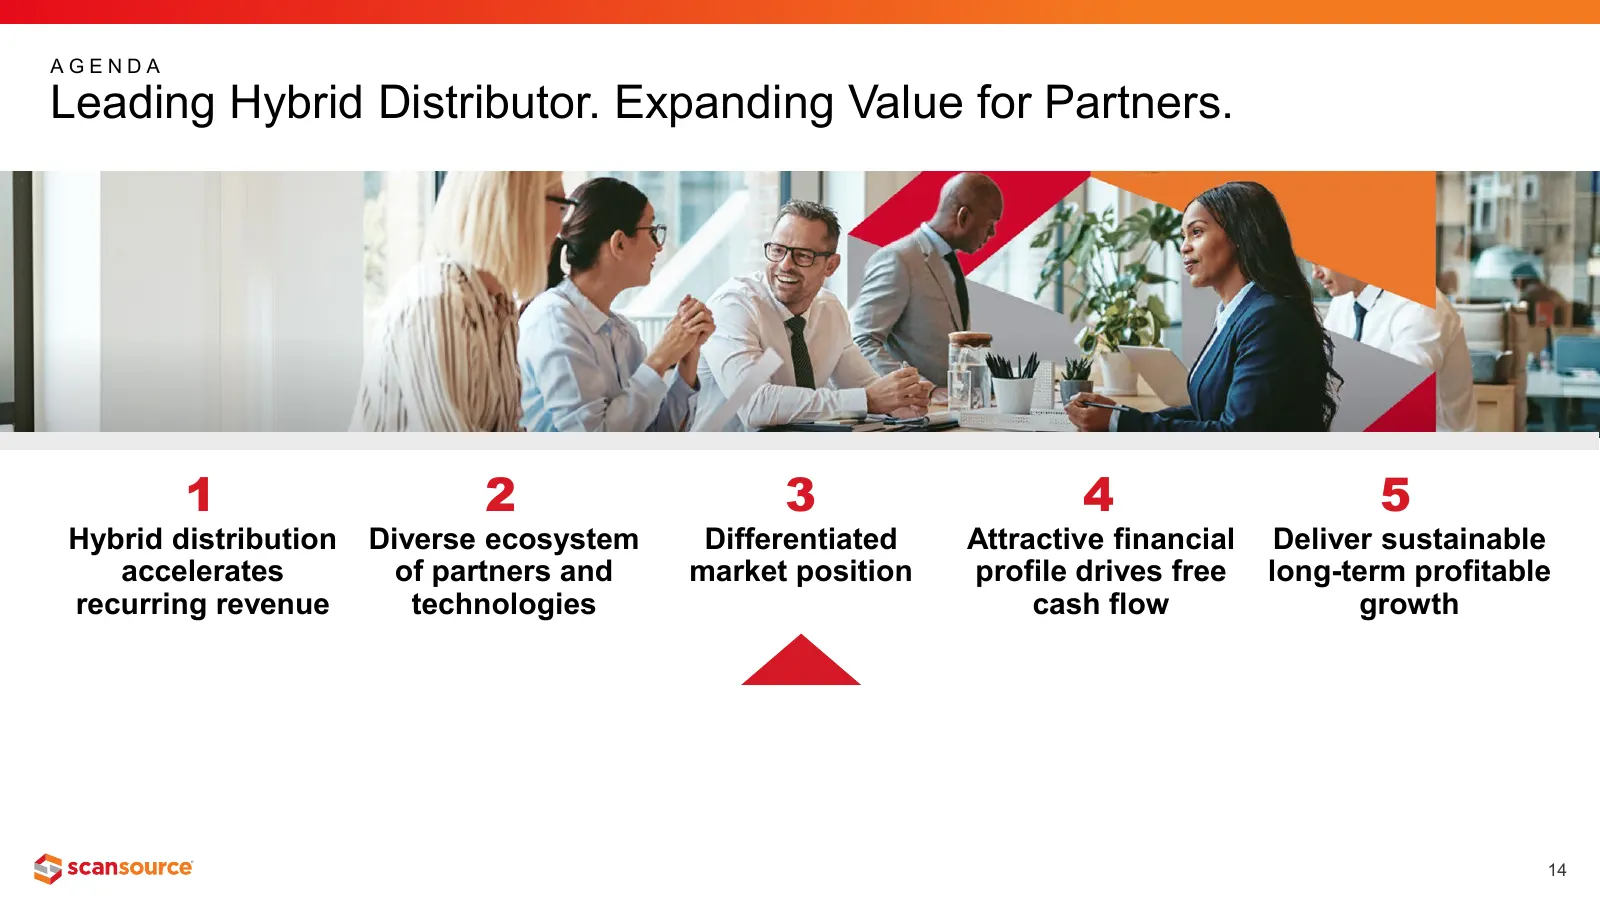
AGENDA Leading Hybrid Distributor. Expanding Value for Partners. 1 2 3 4 5 Hybrid distribution Diverse ecosystem Differentiated Attractive financial Deliver sustainable accelerates of partners and market position profile drives free long-term profitable recurring revenue technologies cash flow growt
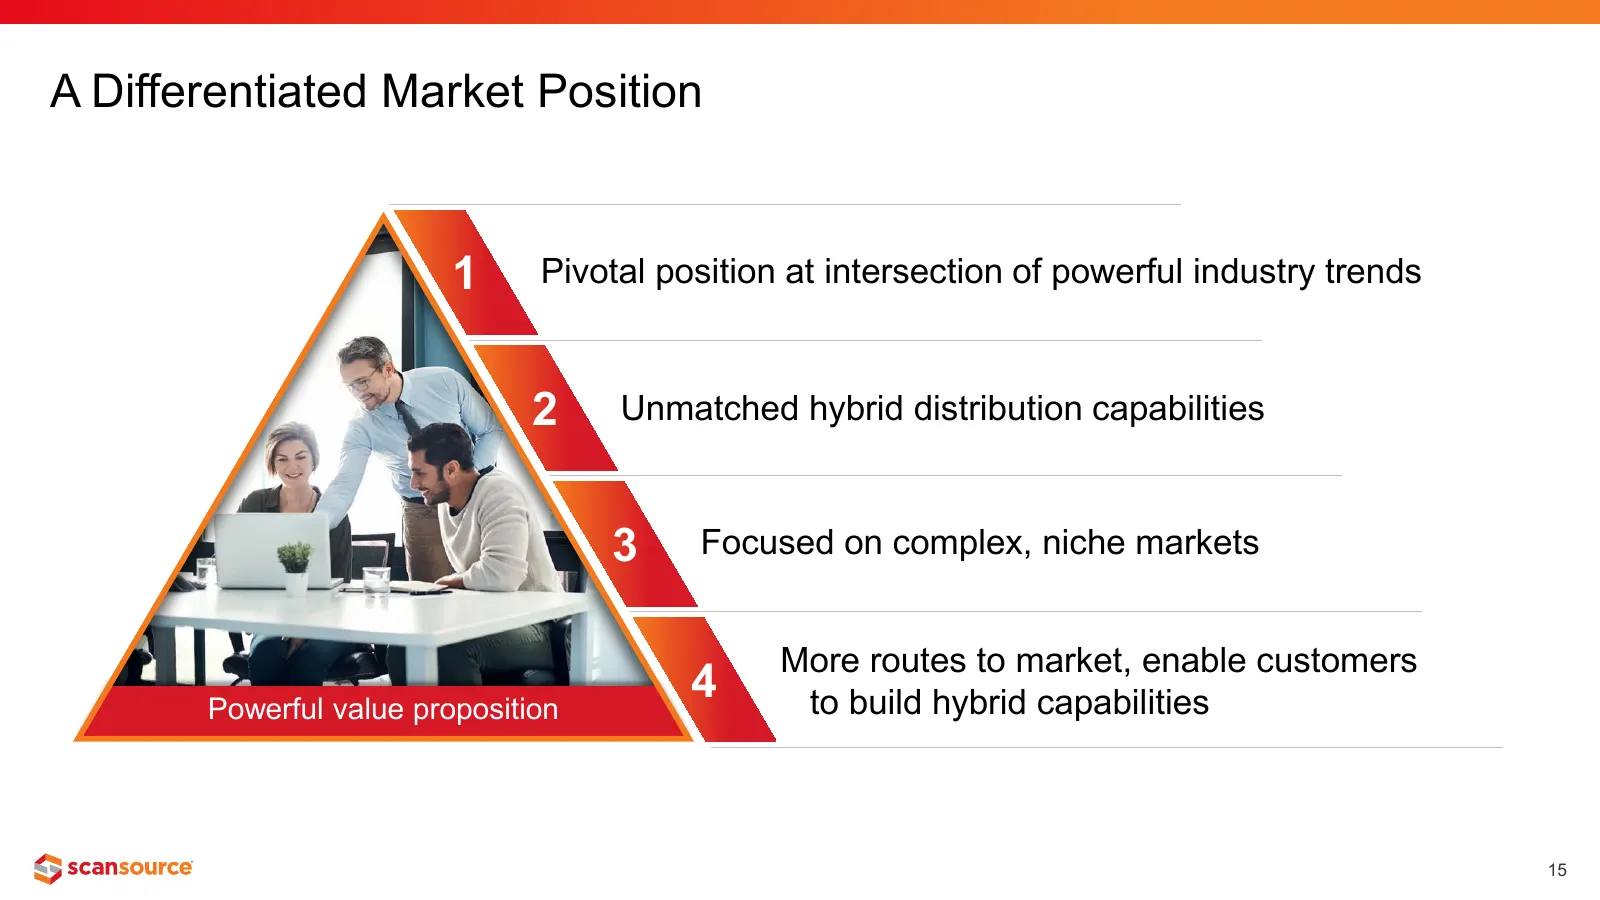
Slide 15: A Differentiated Market Position
A Differentiated Market Position 1 Pivotal position at intersection of powerful industry trends 2 Unmatched hybrid distribution capabilities 3 Focused on complex, niche markets More routes to market, enable customers Powerful value proposition 4 to build hybrid capabilities 15
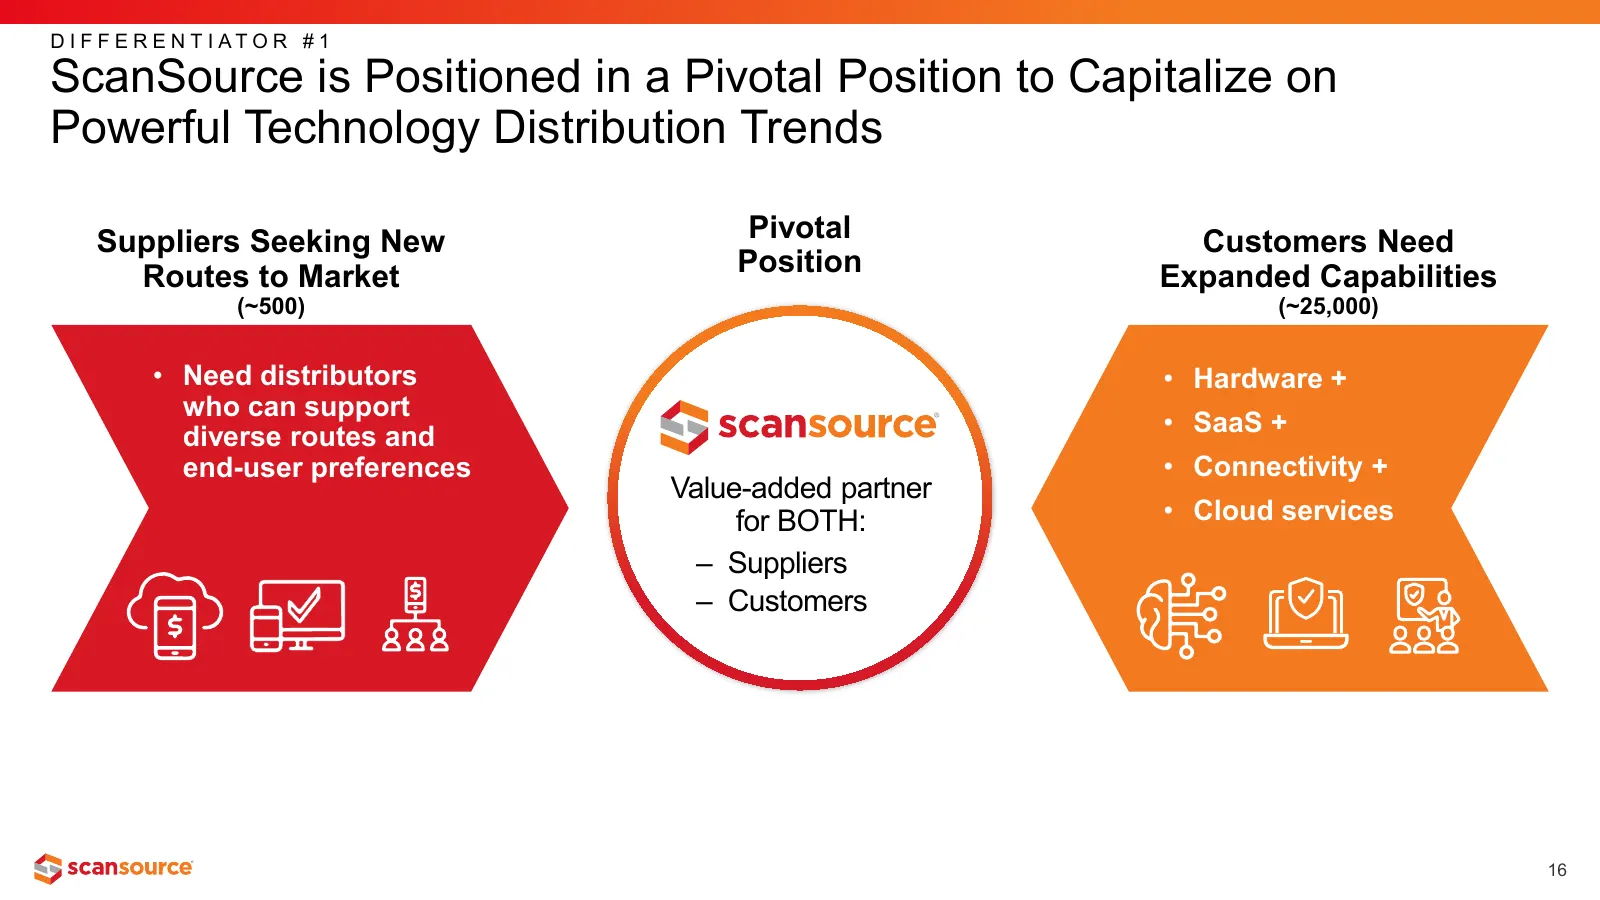
Slide 16: Positioned to Capitalize on Powerful Technology Distribution Trends
D I F F E R E N T I AT O R # 1 ScanSource is Positioned in a Pivotal Position to Capitalize on Powerful Technology Distribution Trends Suppliers Seeking New Pivotal Customers Need Routes to Market Position Expanded Capabilities (~500) (~25,000) • Need distributors • Hardware + who can support divers
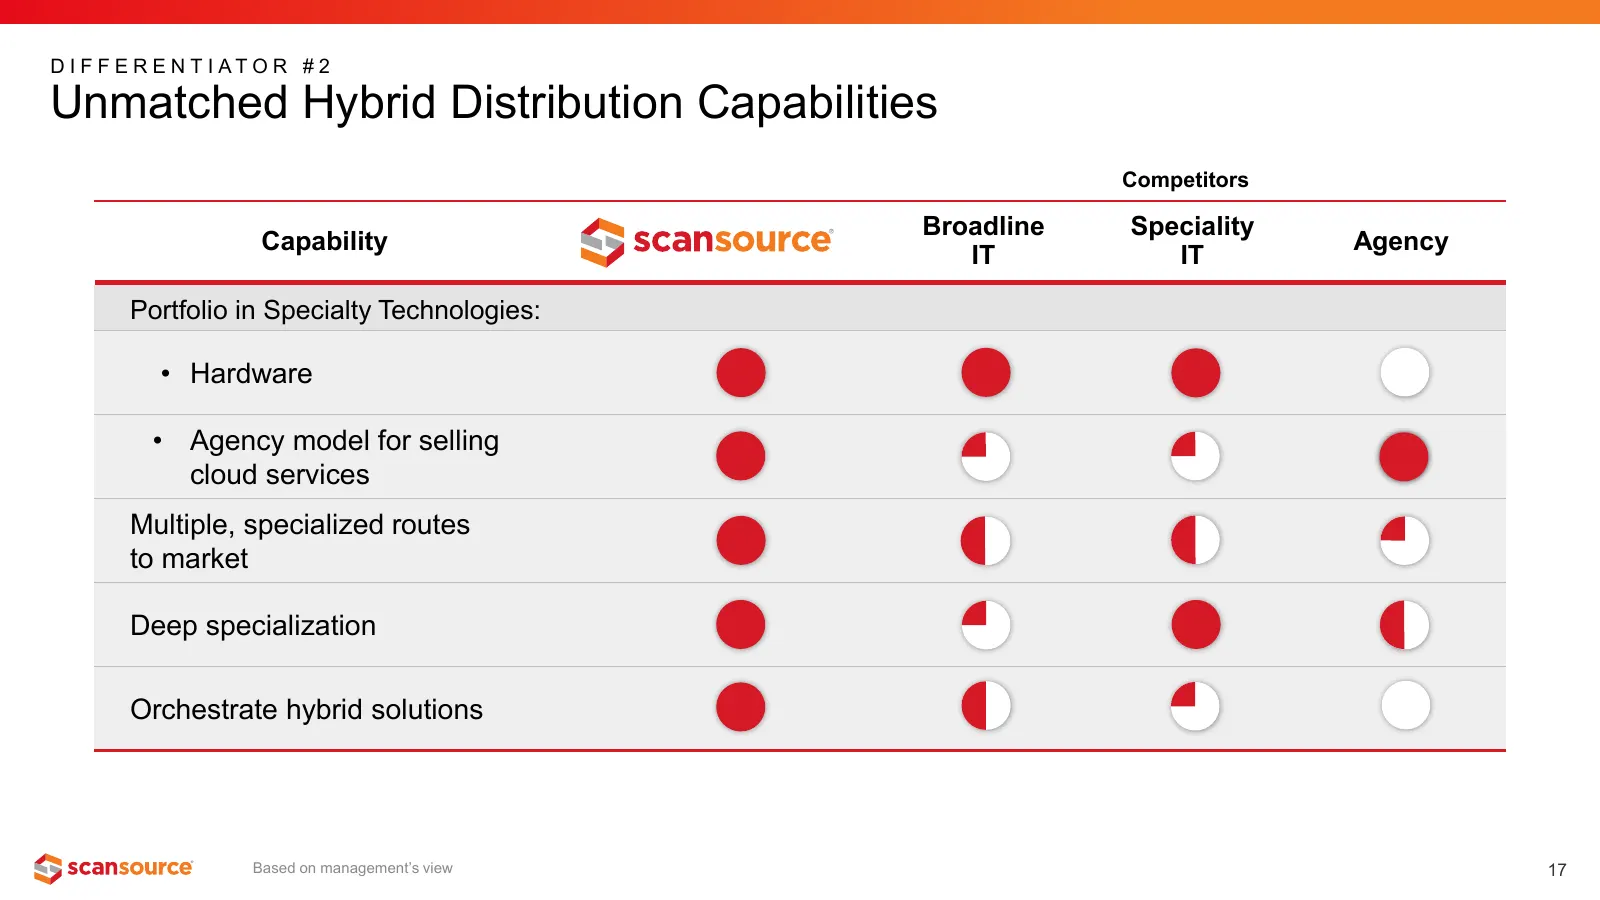
Slide 17: Unmatched Hybrid Distribution Capabilities
D I F F E R E N T I AT O R # 2 Unmatched Hybrid Distribution Capabilities Competitors Broadline Speciality Capability Agency IT IT Portfolio in Specialty Technologies: • Hardware • Agency model for selling cloud services Multiple, specialized routes to market Deep specialization Orchestrate hybrid s
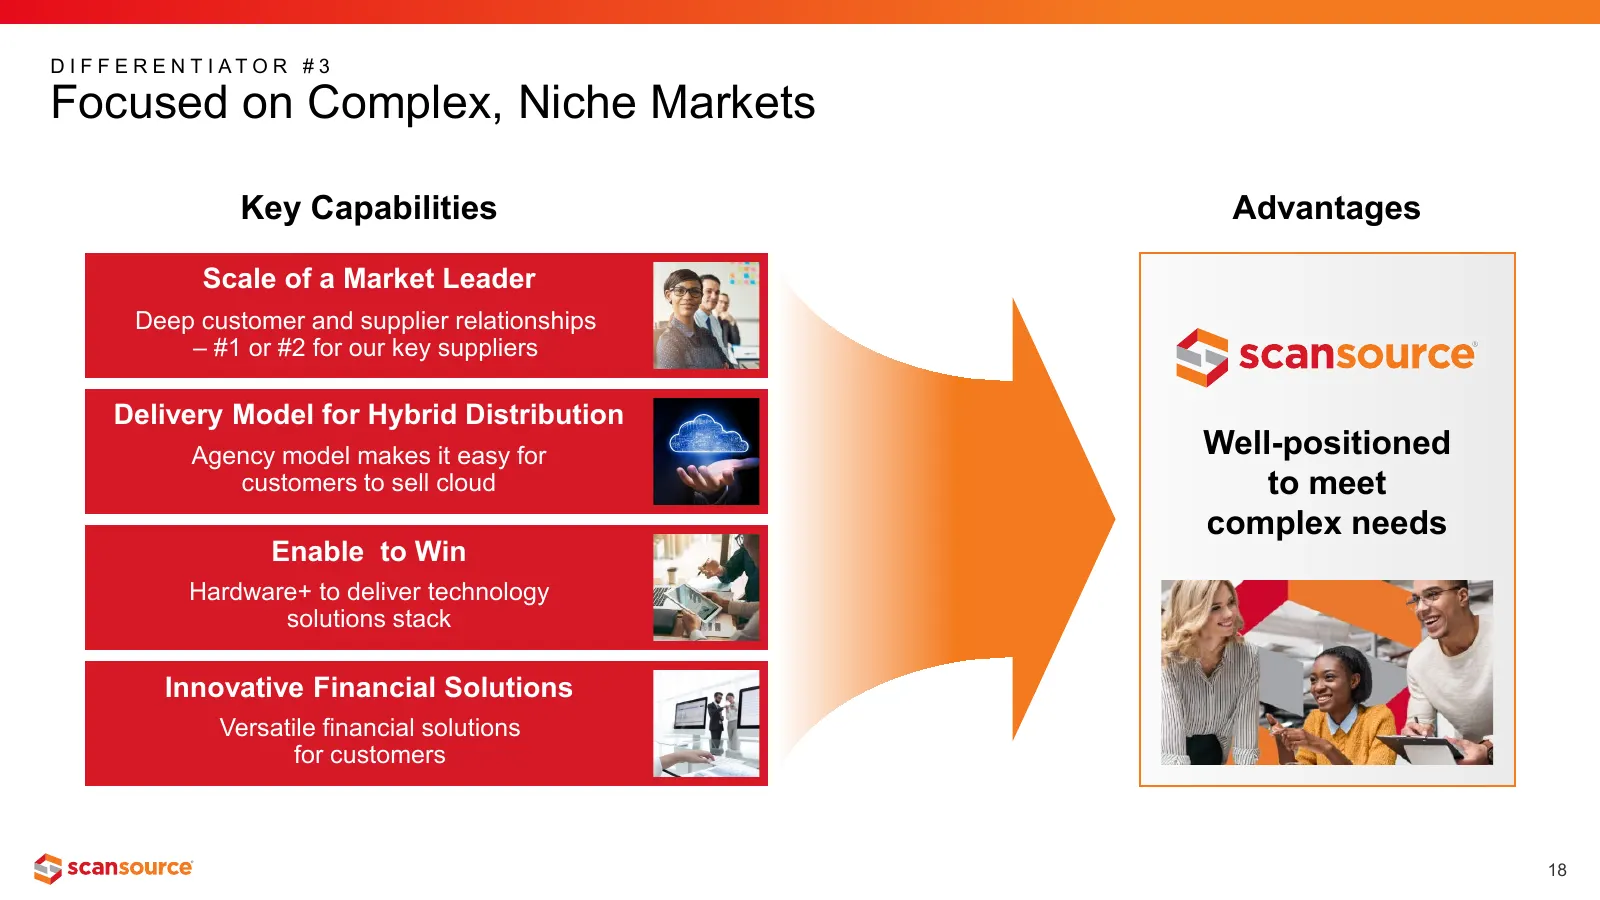
Slide 18: Focused on Complex, Niche Markets
D I F F E R E N T I AT O R # 3 Focused on Complex, Niche Markets Key Capabilities Advantages Scale of a Market Leader Deep customer and supplier relationships – #1 or #2 for our key suppliers Delivery Model for Hybrid Distribution Agency model makes it easy for Well-positioned customers to sell clou
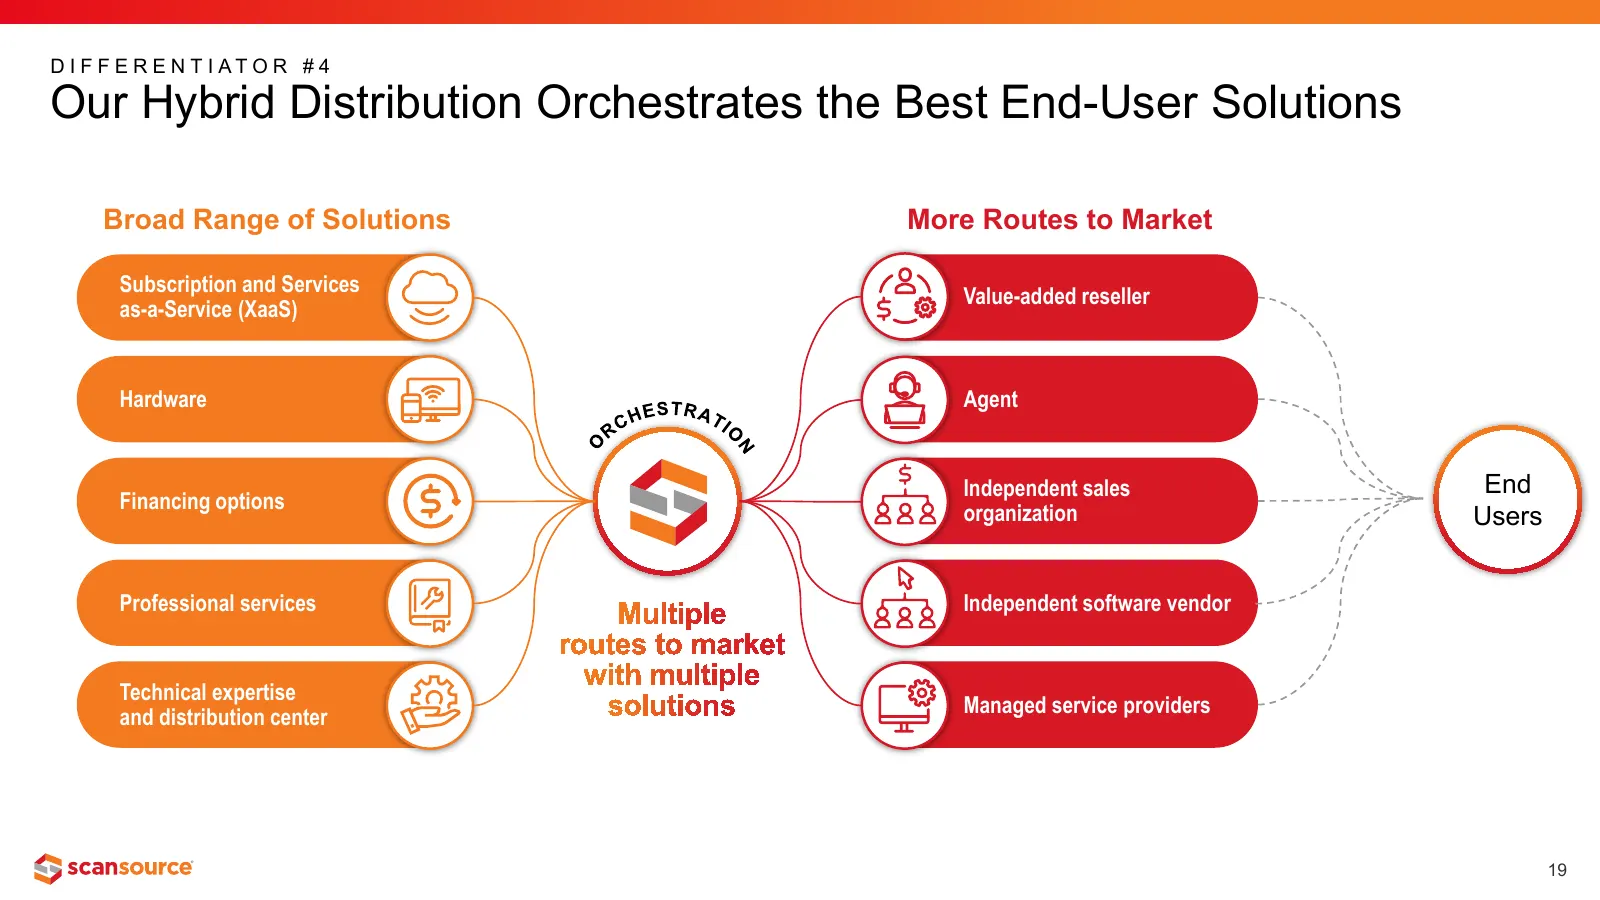
Slide 19: Our Hybrid Distribution Orchestrates the Best End-User Solutions
D I F F E R E N T I AT O R # 4 Our Hybrid Distribution Orchestrates the Best End-User Solutions Broad Range of Solutions More Routes to Market Subscription and Services Value-added reseller as-a-Service (XaaS) Hardware Agent Independent sales End Financing options organization Users Professional ser
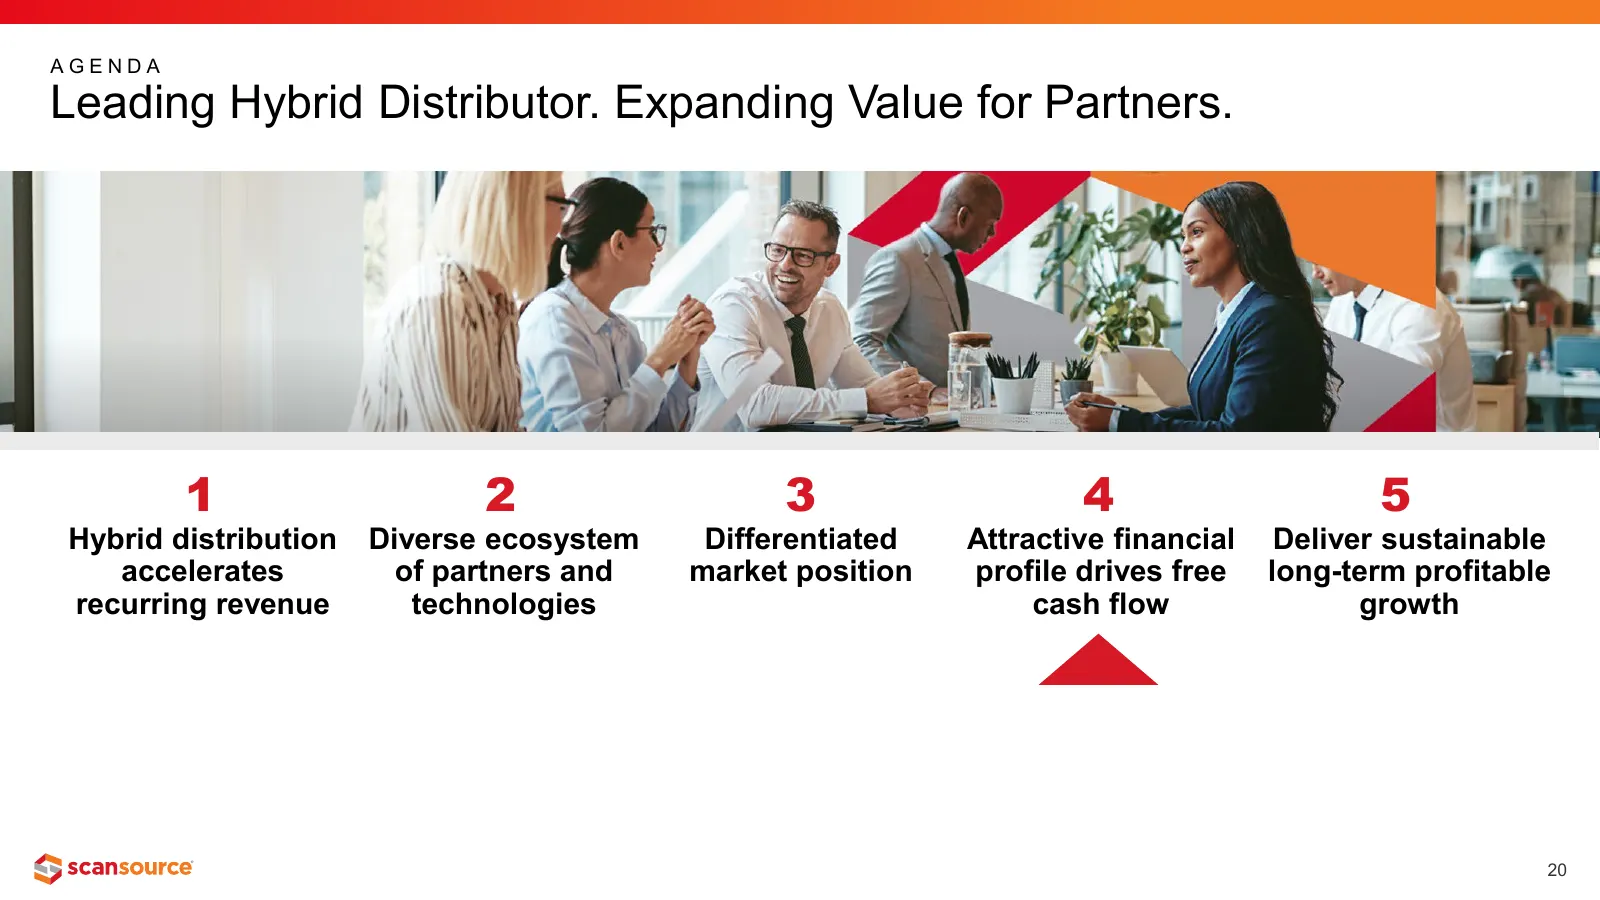
Slide 20: Leading Hybrid Distributor. Expanding Value for Partners.
AGENDA Leading Hybrid Distributor. Expanding Value for Partners. 1 2 3 4 5 Hybrid distribution Diverse ecosystem Differentiated Attractive financial Deliver sustainable accelerates of partners and market position profile drives free long-term profitable recurring revenue technologies cash flow growt
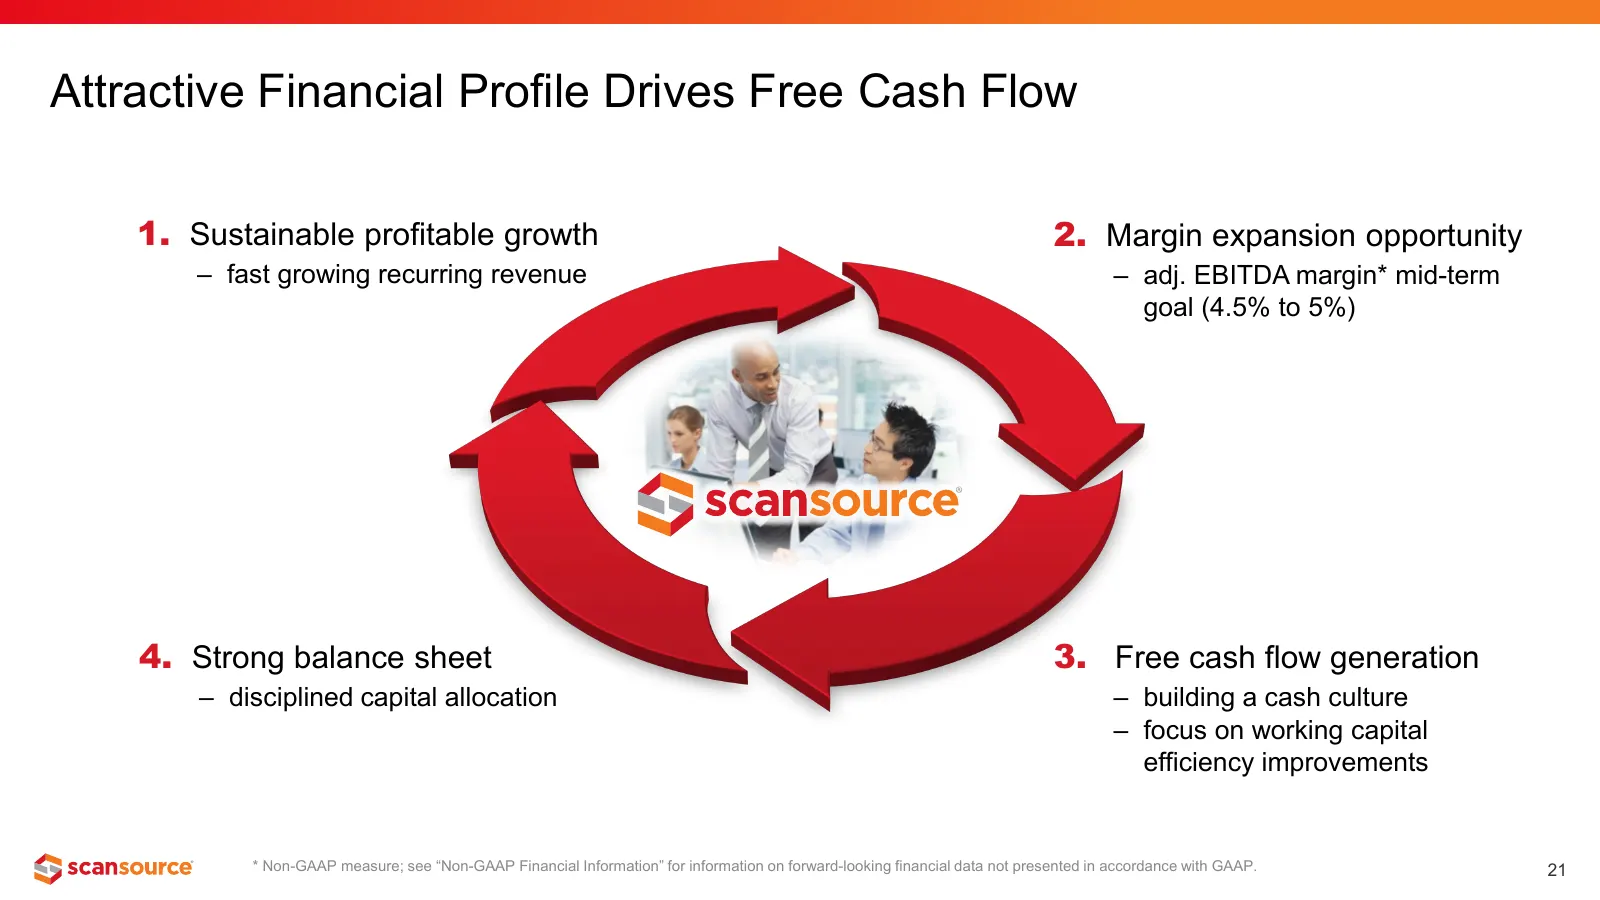
Slide 21: Attractive Financial Profile Drives Free Cash Flow
Attractive Financial Profile Drives Free Cash Flow 1. Sustainable profitable growth 2. Margin expansion opportunity – fast growing recurring revenue – adj. EBITDA margin* mid-term goal (4.5% to 5%) 4. Strong balance sheet 3. Free cash flow generation – disciplined capital allocation – building a cas
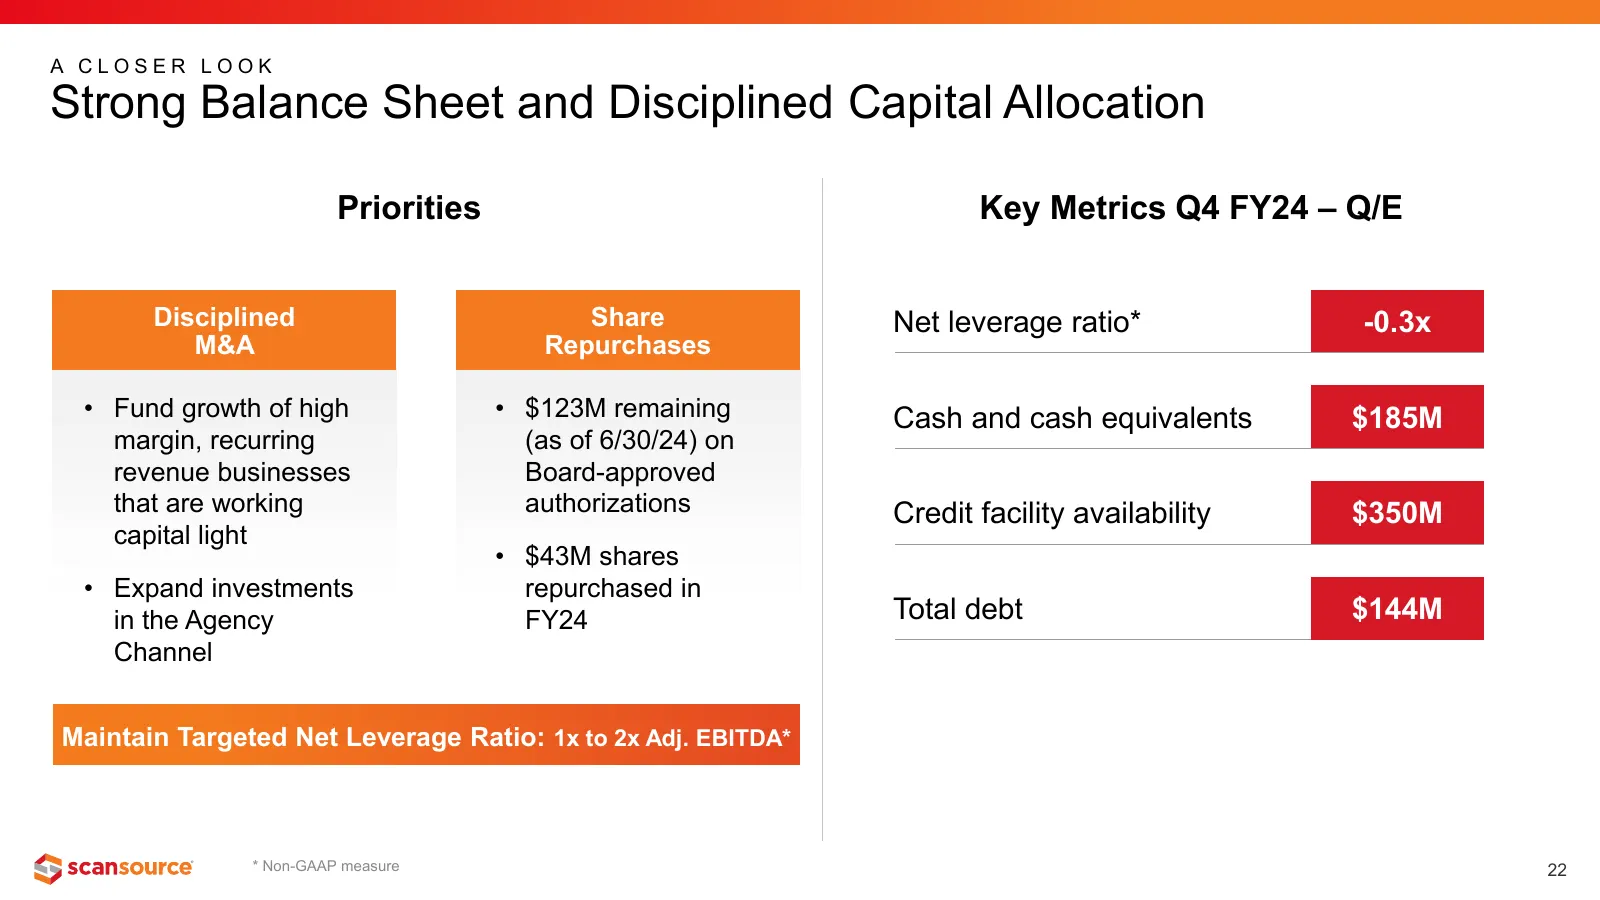
Slide 22: Strong Balance Sheet and Disciplined Capital Allocation
A CLOSER LOOK Strong Balance Sheet and Disciplined Capital Allocation Priorities Key Metrics Q4 FY24 – Q/E Disciplined Share Net leverage ratio* -0.3x M&A Repurchases • Fund growth of high • $123M remaining Cash and cash equivalents $185M margin, recurring (as of 6/30/24) on revenue businesses Board
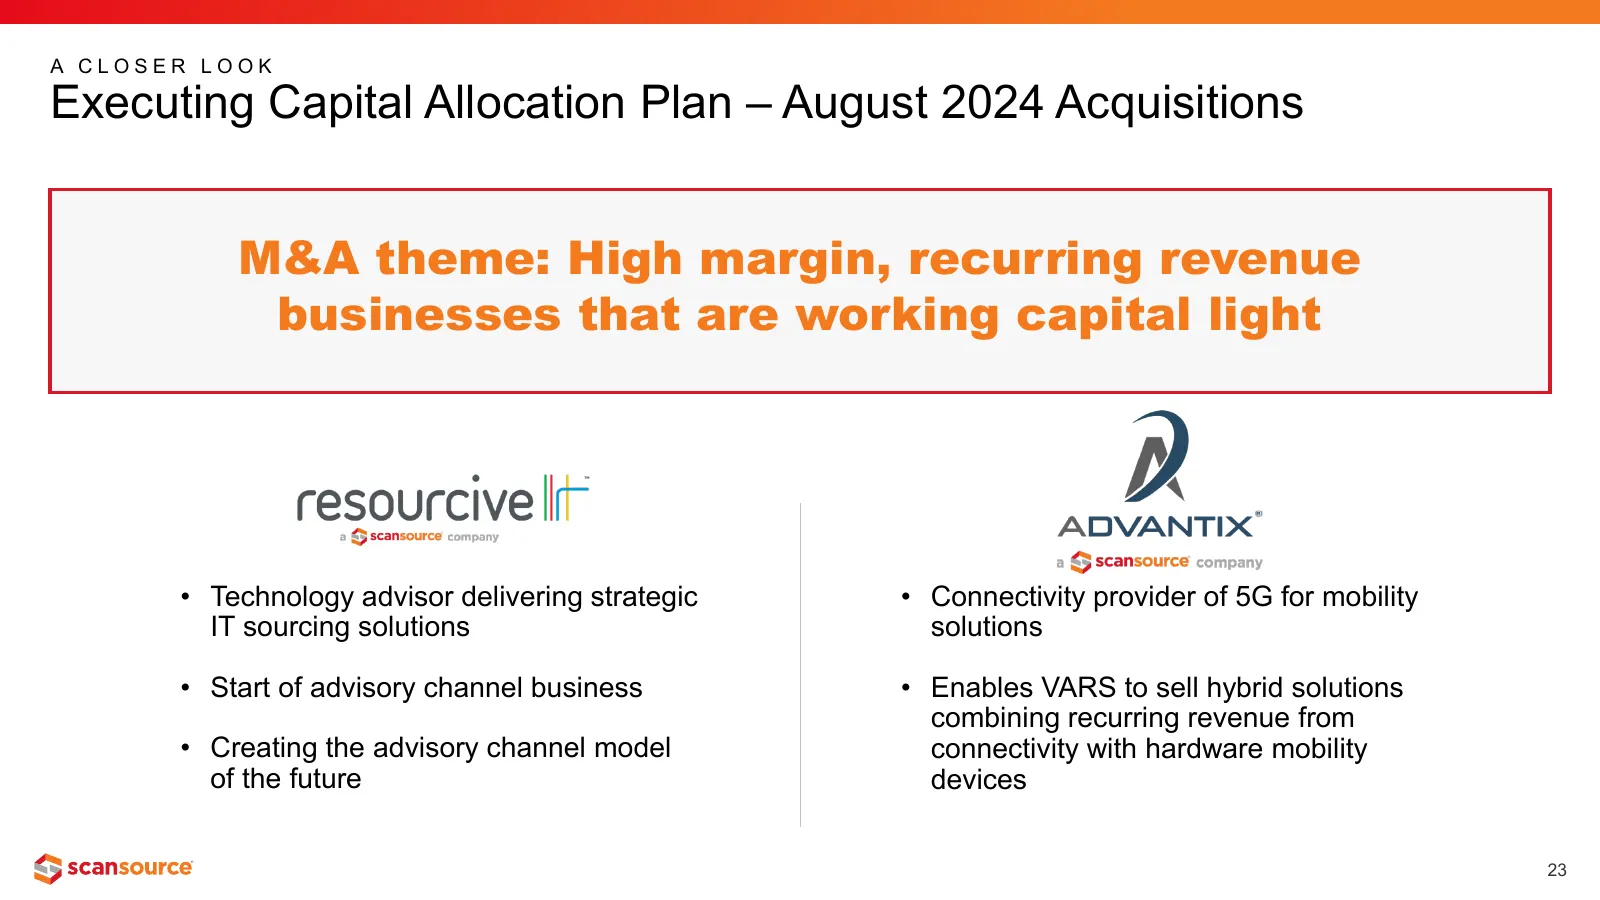
Slide 23: Executing Capital Allocation Plan – August 2024 Acquisitions
A CLOSER LOOK Executing Capital Allocation Plan – August 2024 Acquisitions M&A theme: High margin, recurring revenue businesses that are working capital light • Technology advisor delivering strategic • Connectivity provider of 5G for mobility IT sourcing solutions solutions • Start of advisory chan
Slide 24: Leading Hybrid Distributor. Expanding Value for Partners.
AGENDA Leading Hybrid Distributor. Expanding Value for Partners. 1 2 3 4 5 Hybrid distribution Diverse ecosystem Differentiated Attractive financial Deliver sustainable accelerates of partners and market position profile drives free long-term profitable recurring revenue technologies cash flow growt
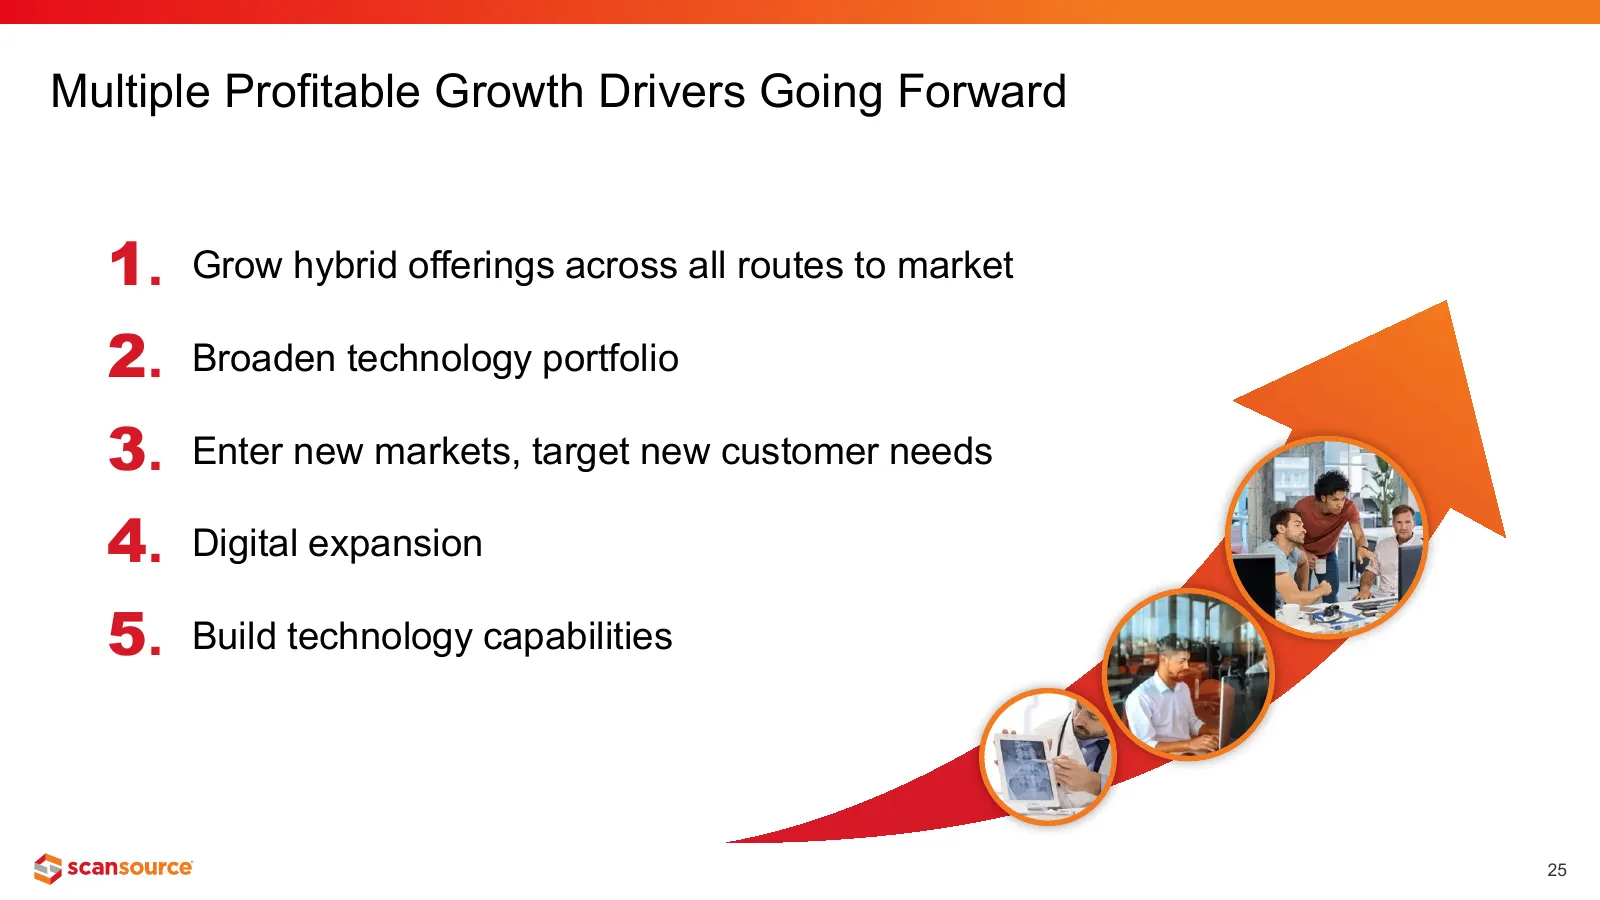
Slide 25: Multiple Profitable Growth Drivers Going Forward
Multiple Profitable Growth Drivers Going Forward 1. Grow hybrid offerings across all routes to market 2. Broaden technology portfolio 3. Enter new markets, target new customer needs 4. Digital expansion 5. Build technology capabilities 25
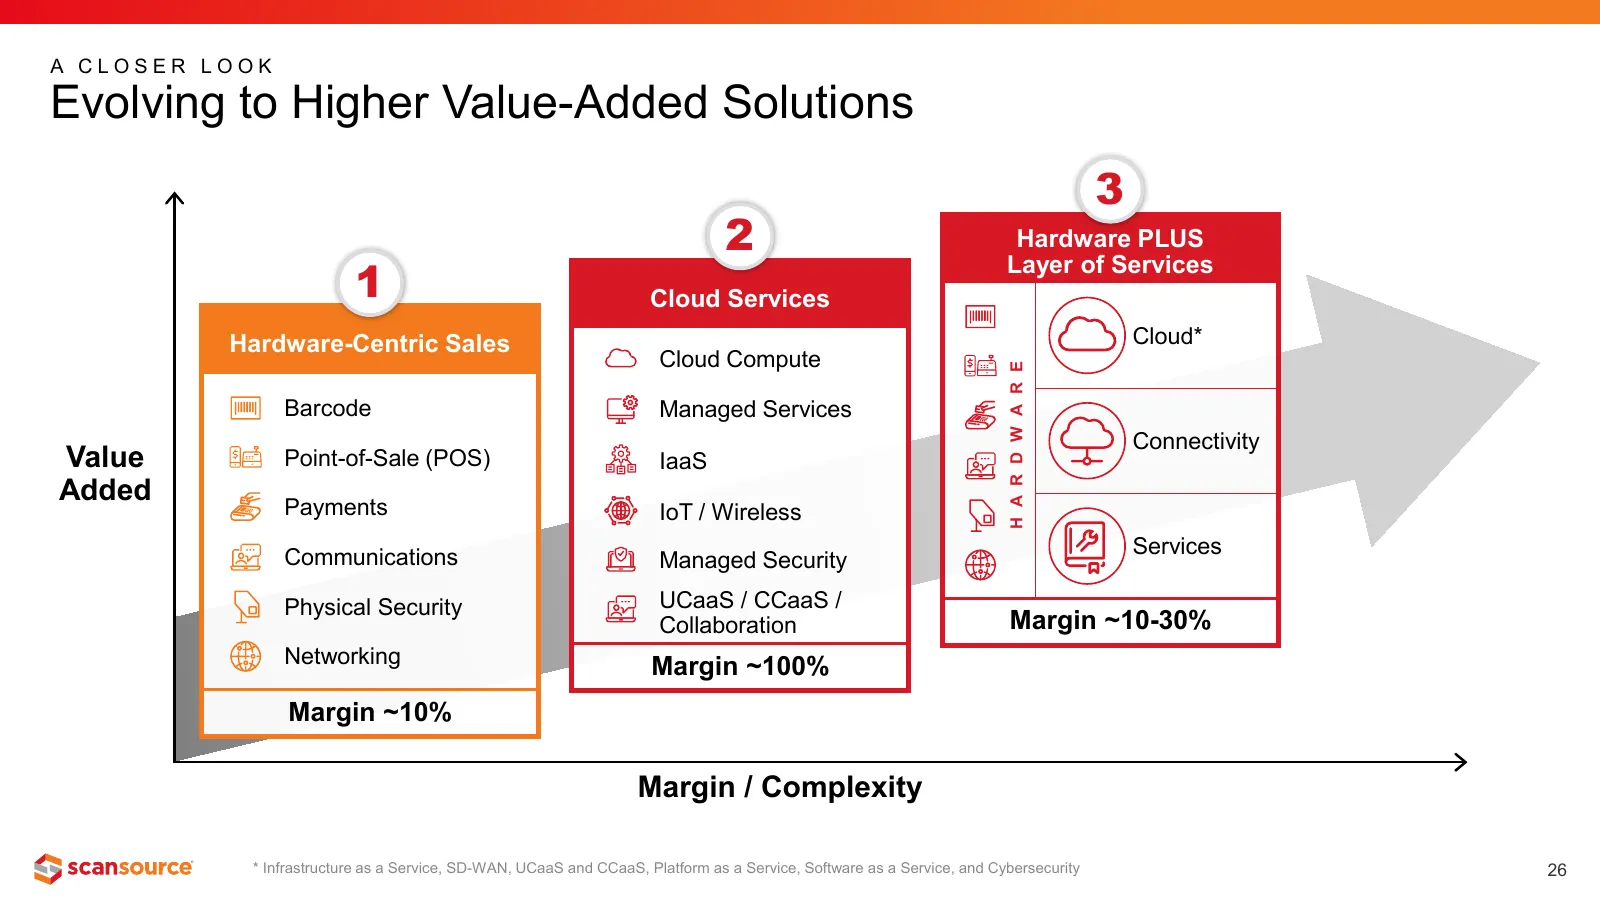
Slide 26: Evolving to Higher Value-Added Solutions
A CLOSER LOOK Evolving to Higher Value-Added Solutions 3 2 Hardware PLUS Layer of Services 1 Cloud Services Hardware-Centric Sales Cloud* Cloud Compute H A R D W A R E Barcode Managed Services Connectivity Value Point-of-Sale (POS) IaaS Added Payments IoT / Wireless Communications Services Managed S
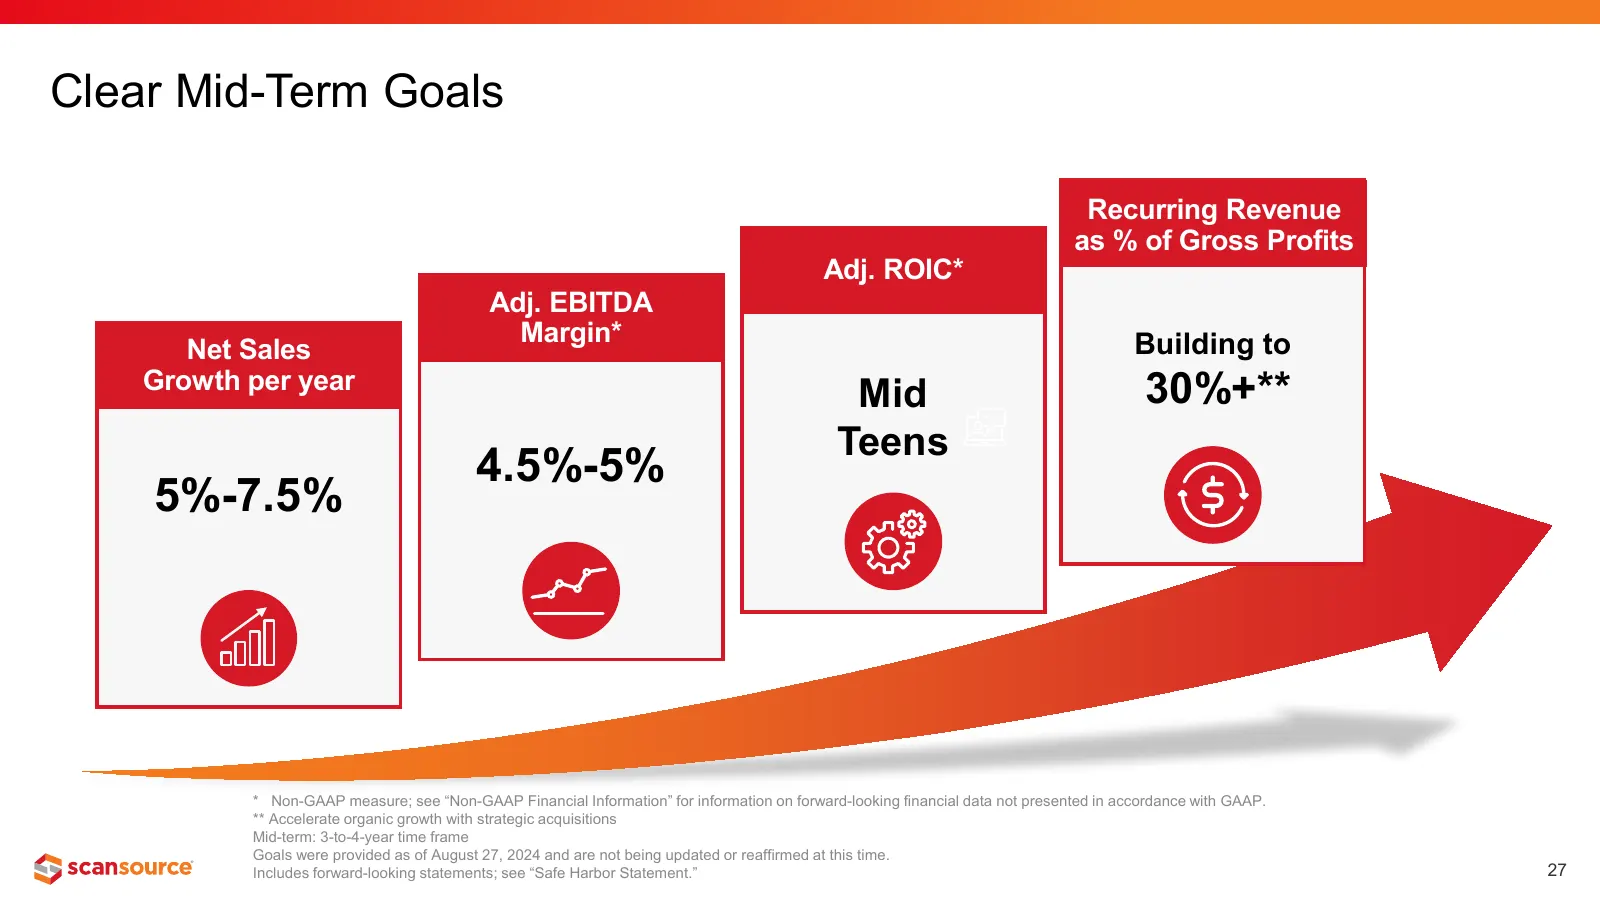
Slide 27: Clear Mid-Term Goals
Clear Mid-Term Goals Recurring Revenue as % of Gross Profits Adj. ROIC* Adj. EBITDA Margin* Building to Net Sales Growth per year Mid 30%+** Teens 4.5%-5% 5%-7.5% * Non-GAAP measure; see “Non-GAAP Financial Information” for information on forward-looking financial data not presented in accordance wi
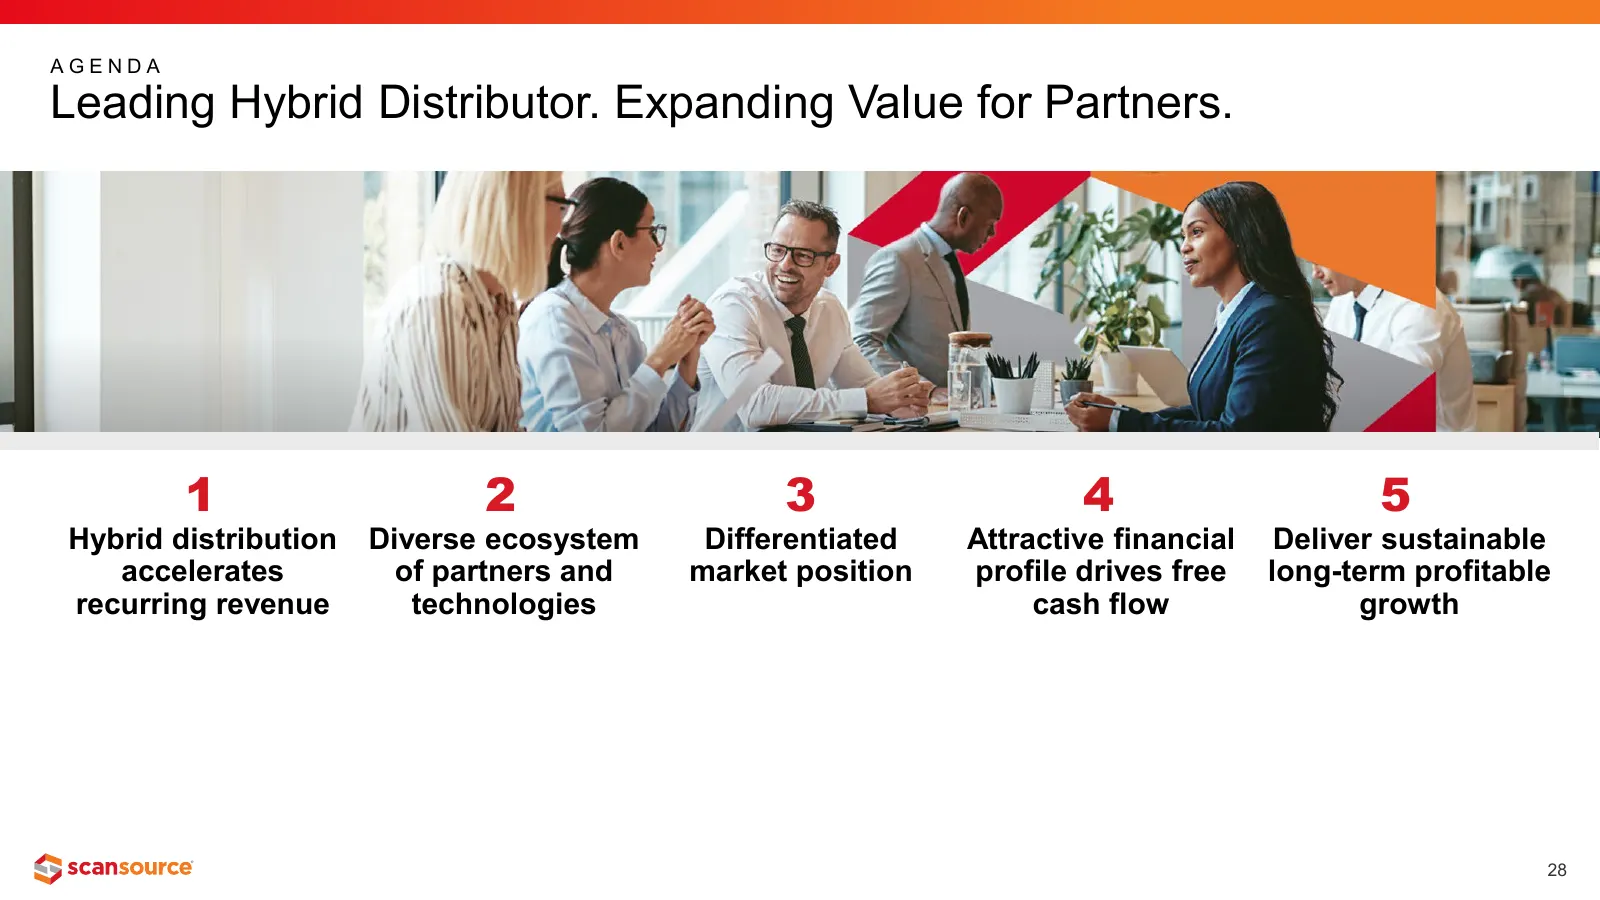
Slide 28: Leading Hybrid Distributor. Expanding Value for Partners.
AGENDA Leading Hybrid Distributor. Expanding Value for Partners. 1 2 3 4 5 Hybrid distribution Diverse ecosystem Differentiated Attractive financial Deliver sustainable accelerates of partners and market position profile drives free long-term profitable recurring revenue technologies cash flow growt
Slide 29: Appendix
a yy scansource Appendix 29
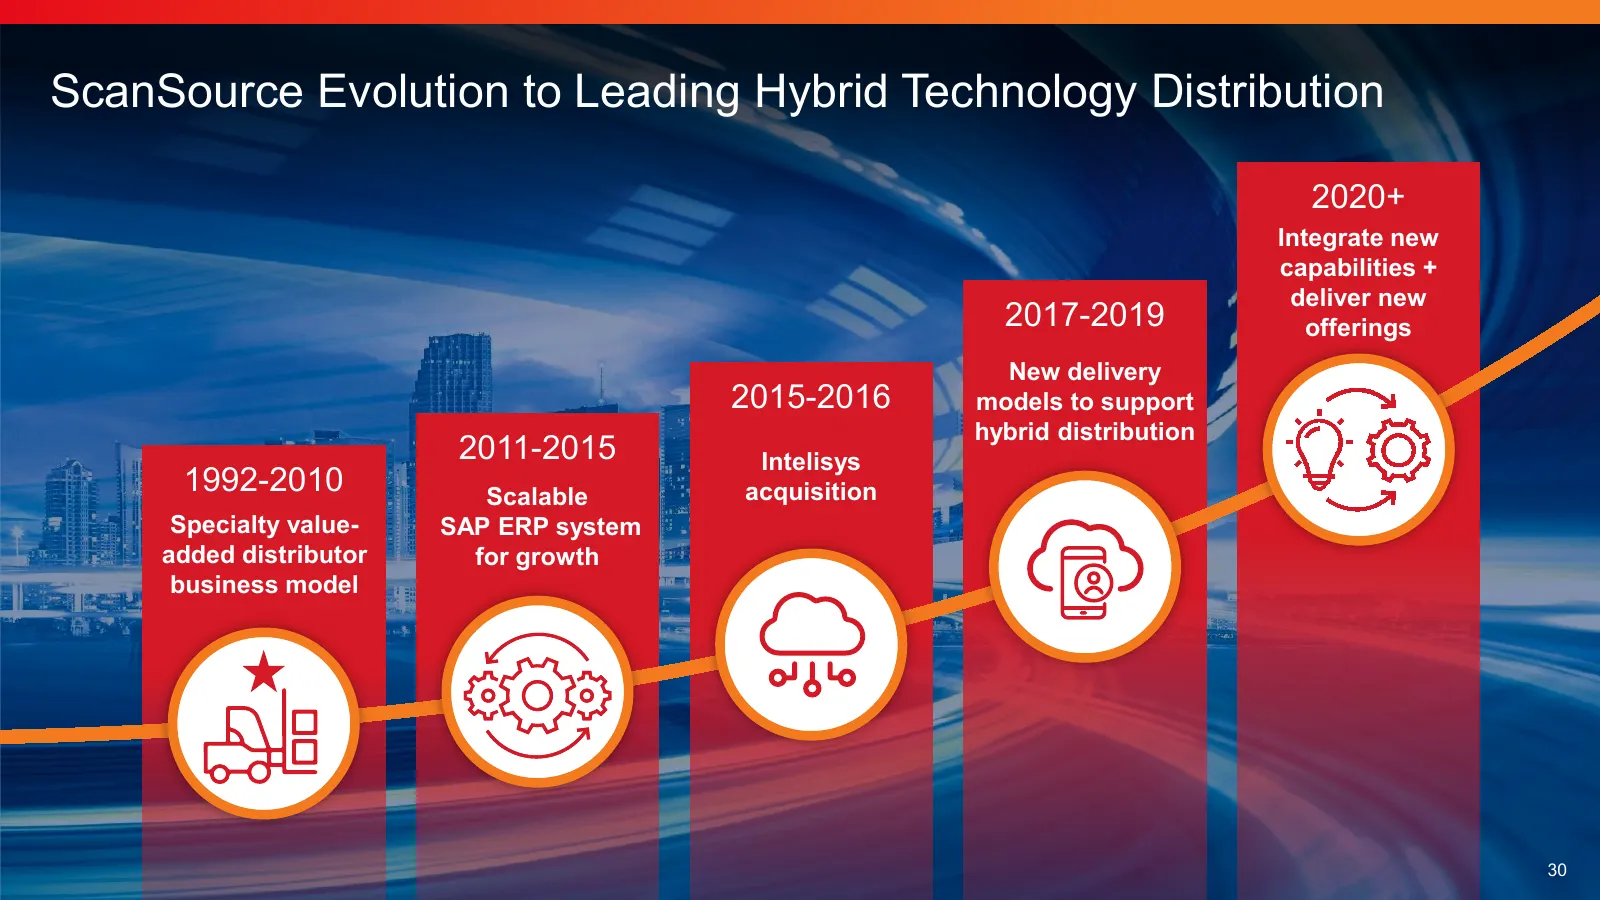
Slide 30: ScanSource Evolution to Leading Hybrid Technology Distribution
ScanSource Evolution to Leading Hybrid Technology Distribution 2020+ Integrate new capabilities + deliver new 2017-2019 offerings New delivery 2015-2016 models to support hybrid distribution 2011-2015 Intelisys 1992-2010 Scalable acquisition Specialty value- SAP ERP system added distributor for grow
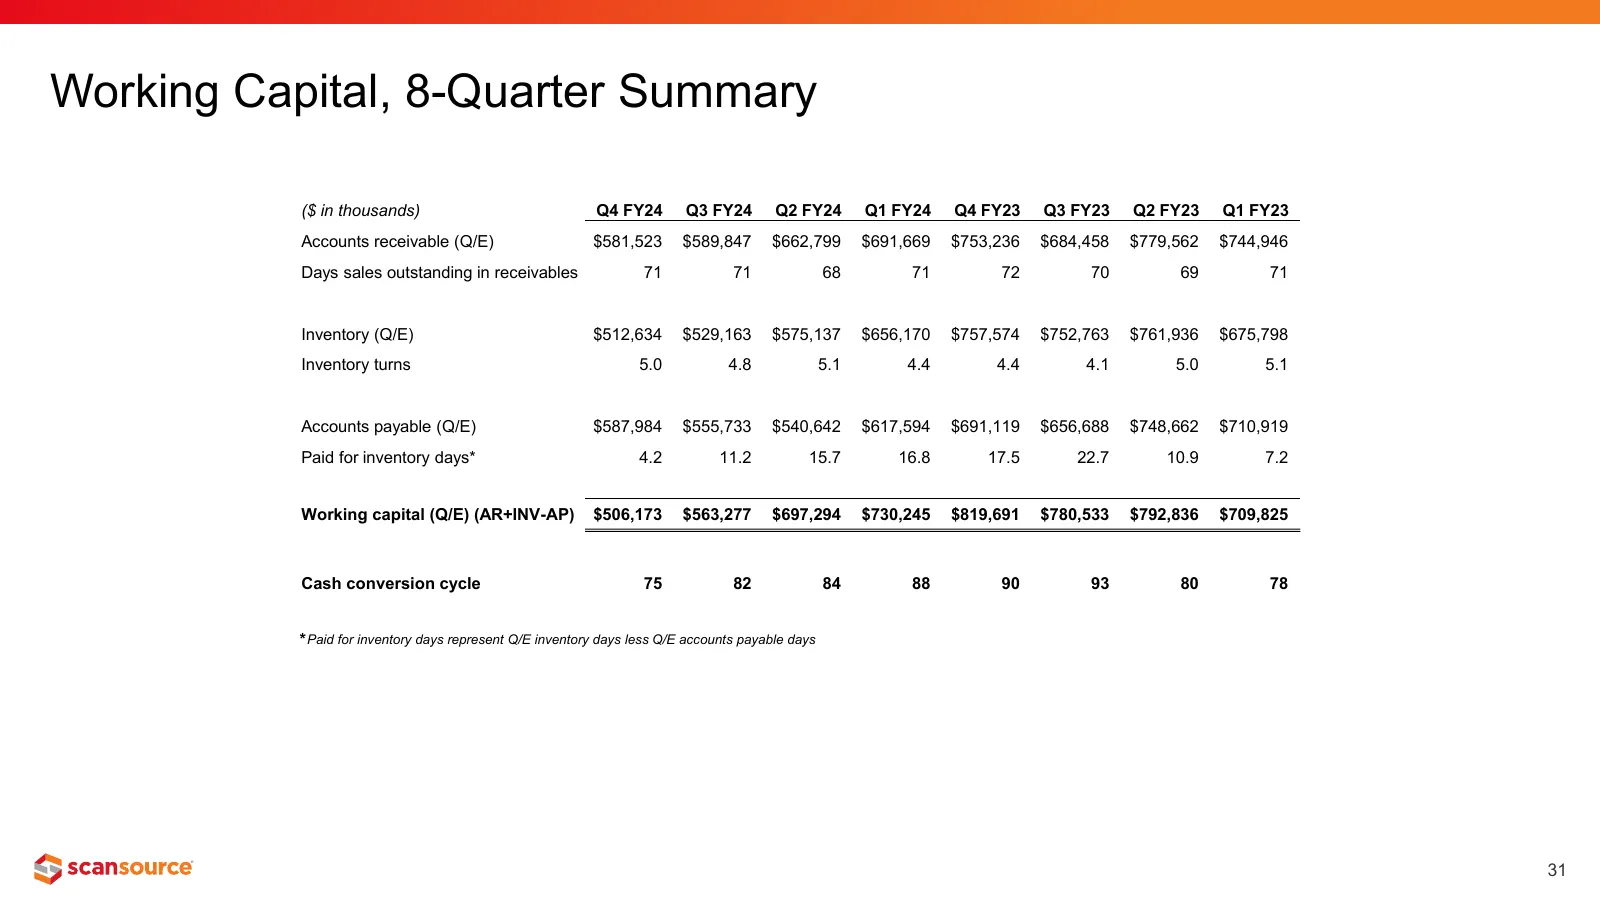
Slide 31: Working Capital, 8-Quarter Summary
Working Capital, 8-Quarter Summary ($ in thousands) Q4 FY24 Q3 FY24 Q2 FY24 Q1 FY24 Q4 FY23 Q3 FY23 Q2 FY23 Q1 FY23 Accounts receivable (Q/E) $581,523 $589,847 $662,799 $691,669 $753,236 $684,458 $779,562 $744,946 Days sales outstanding in receivables 71 71 68 71 72 70 69 71 Inventory (Q/E) $512,634
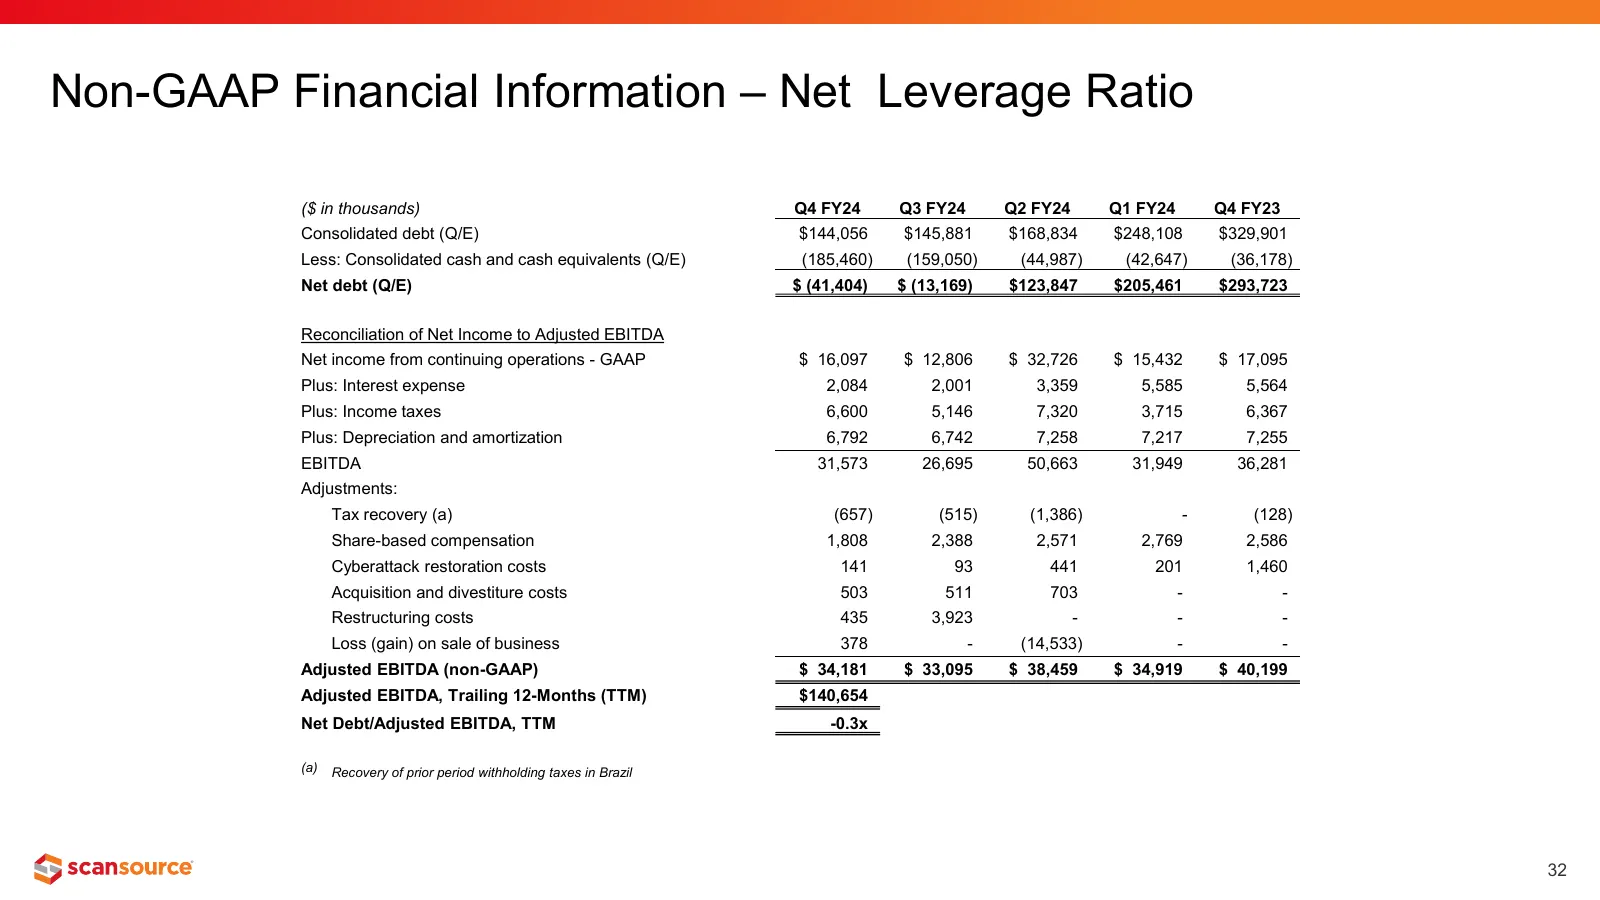
Slide 32: Non-GAAP Financial Information – Net Leverage Ratio
Non-GAAP Financial Information – Net Leverage Ratio ($ in thousands) Q4 FY24 Q3 FY24 Q2 FY24 Q1 FY24 Q4 FY23 Consolidated debt (Q/E) $144,056 $145,881 $168,834 $248,108 $329,901 Less: Consolidated cash and cash equivalents (Q/E) (185,460) (159,050) (44,987) (42,647) (36,178) Net debt (Q/E) $ (41,404
Source: Internet Archive copy of scansource.com
More decks from ScanSource, Inc.
 Investor Presentation (November 2026)33 slides · November 2026
 Investor Presentation (August 2026)34 slides · August 2026
 Investor Presentation (May 2026)37 slides · May 2026
 Investor Presentation (February 2026)36 slides · February 2026
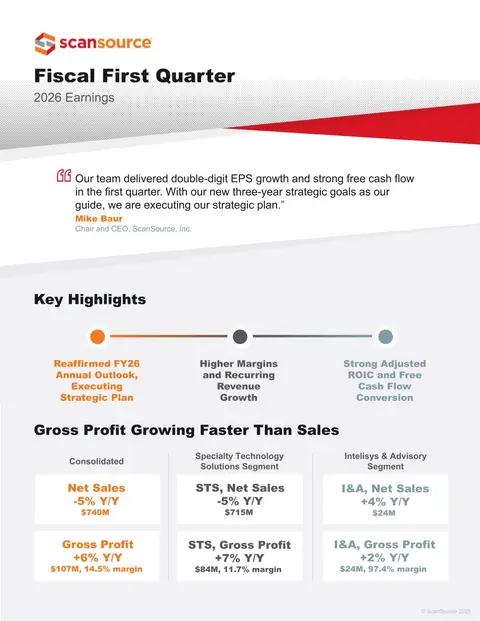 Q1 FY2026 Earnings Presentation16 slides · Nov 6, 2025
 Investor Presentation (November 2025)36 slides · November 2025