Vertex Energy — Q1 2019 Earnings Presentation
18 slides from Vertex Energy's earnings presentation, May 8, 2019
Slide 1: 1Q19 Results Conference Call
1Q19 Results Conference Call May 8, 2019
Slide 2: Disclaimer
Disclaimer This document may contain forward - looking statements including words such as “may,” “can,” “could,” “should,” “predict,” “aim,” “potential,” “continue,” “opportunity,” “intend,” “goal,” “estimate,” “expect,” “expectations,” “project,” “projections,” “plans,” “anticipates,” “believe,” “t
Slide 3: Executive Summary First Quarter 2019
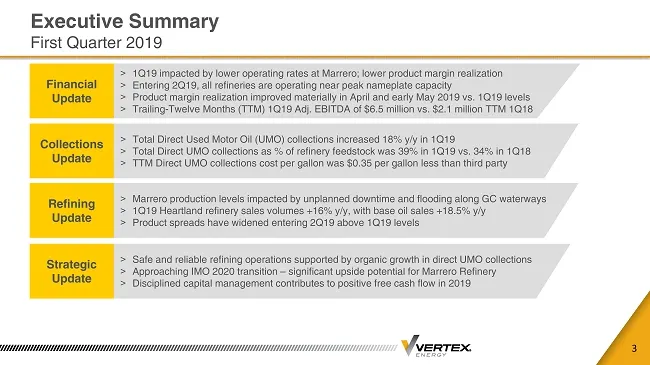
Executive Summary First Quarter 2019 3 > 1Q19 impacted by lower operating rates at Marrero; lower product margin realization > Entering 2Q19, all refineries are operating near peak nameplate capacity > Product margin realization improved materially in April and early May 2019 vs. 1Q19 levels > Trail
Slide 4: Key Financial Metrics TTM 1Q18 vs. TTM 1Q19
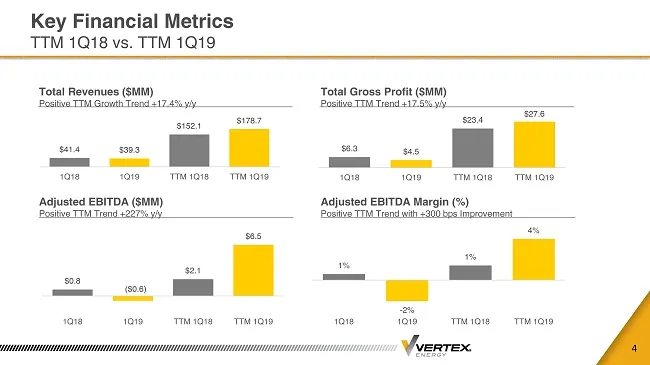
Key Financial Metrics TTM 1Q18 vs. TTM 1Q19 4 Total Revenues ($MM) Positive TTM Growth Trend +17.4% y/y Total Gross Profit ($MM) Positive TTM Trend +17.5% y/y Adjusted EBITDA ($MM) Positive TTM Trend +227% y/y Adjusted EBITDA Margin (%) Positive TTM Trend with +300 bps Improvement $41.4 $39.3 $152.1
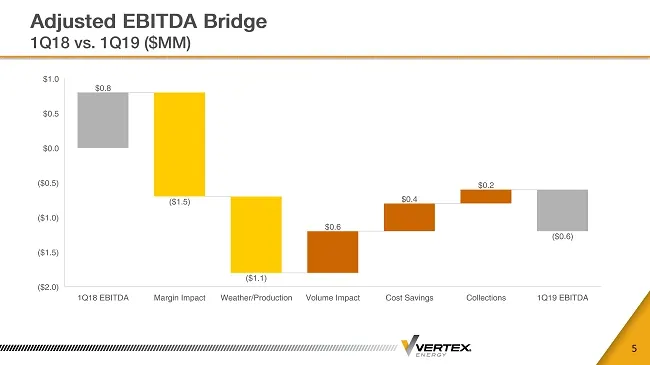
Slide 5: Adjusted EBITDA Bridge 1Q18 vs. 1Q19
Adjusted EBITDA Bridge 1Q18 vs. 1Q19 ($MM) 5
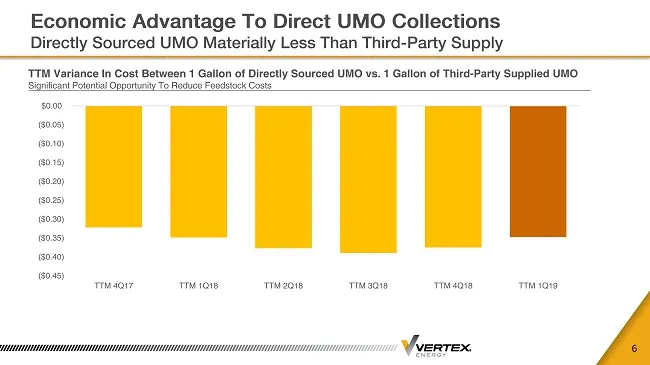
Slide 6: Economic Advantage To Direct UMO Collections
Economic Advantage To Direct UMO Collections Directly Sourced UMO Materially Less Than Third - Party Supply 6 TTM Variance In Cost Between 1 Gallon of Directly Sourced UMO vs. 1 Gallon of Third - Party Supplied UMO Significant Potential Opportunity To Reduce Feedstock Costs ($0.45) ($0.40) ($0.35) (
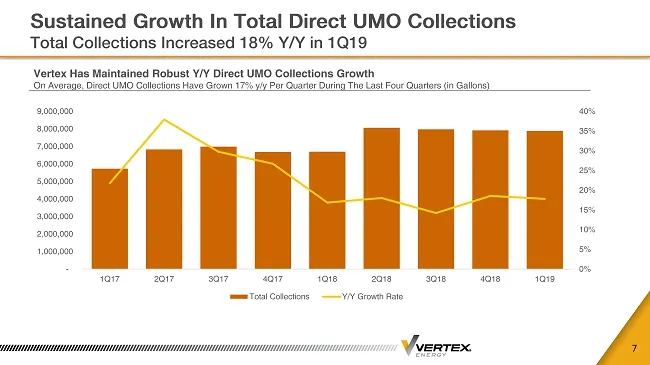
Slide 7: Sustained Growth In Total Direct UMO Collections
Sustained Growth In Total Direct UMO Collections Total Collections Increased 18% Y/Y in 1Q19 7 Vertex Has Maintained Robust Y/Y Direct UMO Collections Growth On Average, Direct UMO Collections Have Grown 17% y/y Per Quarter During The Last Four Quarters (in Gallons) 0% 5% 10% 15% 20% 25% 30% 35% 40%
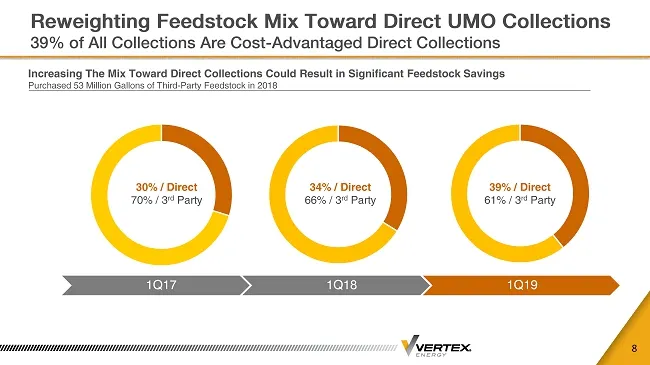
Slide 8: Reweighting Feedstock Mix Toward Direct UMO Collections
Reweighting Feedstock Mix Toward Direct UMO Collections 39% of All Collections Are Cost - Advantaged Direct Collections 8 Increasing The Mix Toward Direct Collections Could Result in Significant Feedstock Savings Purchased 53 Million Gallons of Third - Party Feedstock in 2018 1Q17 1Q18 1Q19 39% / Di
Slide 9: Margin Decline The Result of Higher Feedstock Costs
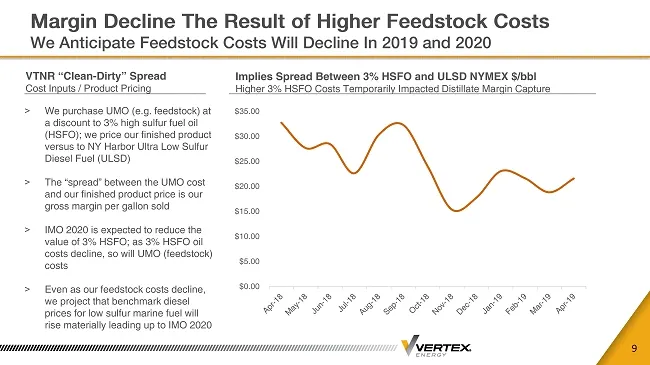
Margin Decline The Result of Higher Feedstock Costs We Anticipate Feedstock Costs Will Decline In 2019 and 2020 9 VTNR “Clean - Dirty” Spread Cost Inputs / Product Pricing > We purchase UMO (e.g. feedstock) at a discount to 3% high sulfur fuel oil (HSFO); we price our finished product versus to NY H
Slide 10: Future Strip Implies Material Improvement In VTNR Margins
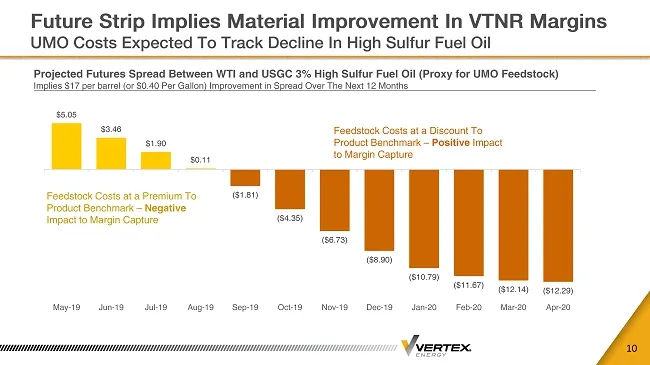
Future Strip Implies Material Improvement In VTNR Margins UMO Costs Expected To Track Decline In High Sulfur Fuel Oil 10 Projected Futures Spread Between WTI and USGC 3% High Sulfur Fuel Oil (Proxy for UMO Feedstock) Implies $17 per barrel (or $0.40 Per Gallon) Improvement in Spread Over The Next 12
Slide 11: Strategic Growth Opportunities
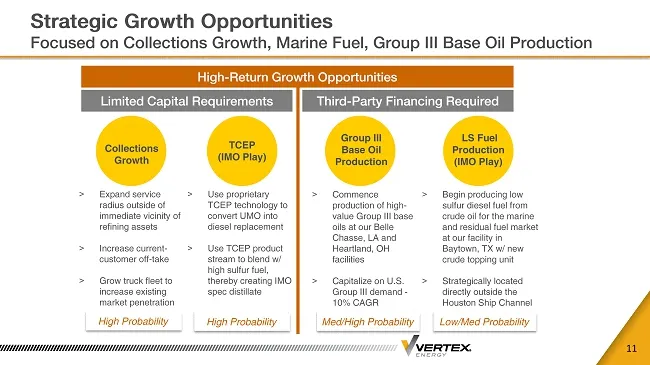
Strategic Growth Opportunities Focused on Collections Growth, Marine Fuel, Group III Base Oil Production 11 High - Return Growth Opportunities Limited Capital Requirements Third - Party Financing Required Collections Growth TCEP (IMO Play) Group III Base Oil Production LS Fuel Production (IMO Play)
Slide 12: Moving Up The Value Chain
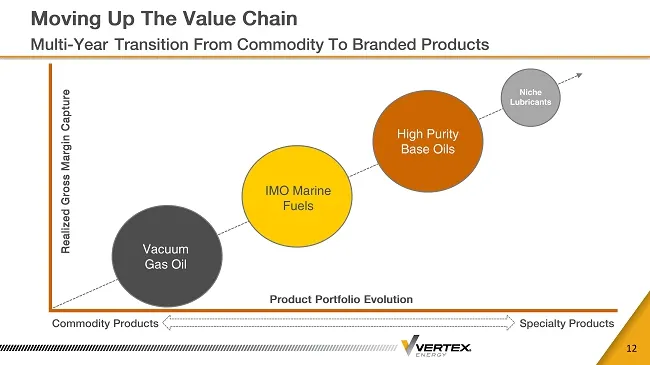
Moving Up The Value Chain Multi - Year Transition From Commodity To Branded Products 12 Realized Gross Margin Capture Product Portfolio Evolution Commodity Products Specialty Products Vacuum Gas Oil IMO Marine Fuels High Purity Base Oils Niche Lubricants
Slide 13: Positive TTM Margin Trend In Black Oil Segment
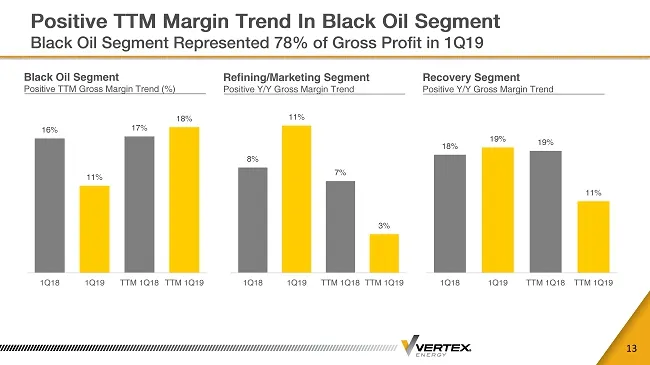
Positive TTM Margin Trend In Black Oil Segment Black Oil Segment Represented 78% of Gross Profit in 1Q19 13 Black Oil Segment Positive TTM Gross Margin Trend (%) Refining/Marketing Segment Positive Y/Y Gross Margin Trend Recovery Segment Positive Y/Y Gross Margin Trend 16% 11% 17% 18% 1Q18 1Q19 TTM
Slide 14: Operating a Safe, Reliable Refining System
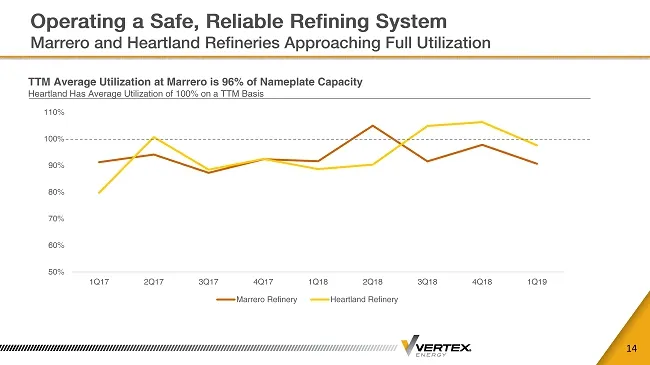
Operating a Safe, Reliable Refining System Marrero and Heartland Refineries Approaching Full Utilization 14 50% 60% 70% 80% 90% 100% 110% 1Q17 2Q17 3Q17 4Q17 1Q18 2Q18 3Q18 4Q18 1Q19 Marrero Refinery Heartland Refinery TTM Average Utilization at Marrero is 96% of Nameplate Capacity Heartland Has Ave
Slide 15: Marrero, Louisiana Refinery Update First Quarter 2019
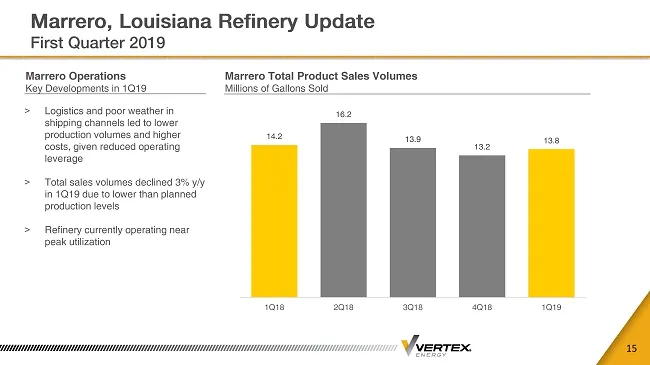
Marrero, Louisiana Refinery Update First Quarter 2019 15 Marrero Operations Key Developments in 1Q19 Marrero Total Product Sales Volumes Millions of Gallons Sold > Logistics and poor weather in shipping channels led to lower production volumes and higher costs, given reduced operating leverage > Tot
Slide 16: Heartland, Ohio Refinery Update First Quarter 2019
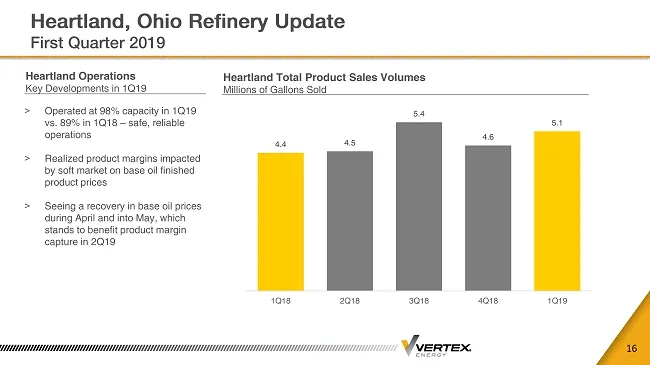
Heartland, Ohio Refinery Update First Quarter 2019 16 Heartland Operations Key Developments in 1Q19 Heartland Total Product Sales Volumes Millions of Gallons Sold > Operated at 98% capacity in 1Q19 vs. 89% in 1Q18 – safe, reliable operations > Realized product margins impacted by soft market on base
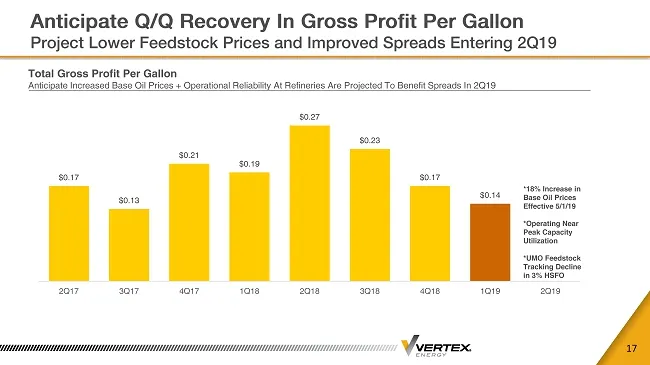
Slide 17: Anticipate Q/Q Recovery In Gross Profit Per Gallon
Anticipate Q/Q Recovery In Gross Profit Per Gallon Project Lower Feedstock Prices and Improved Spreads Entering 2Q19 17 Total Gross Profit Per Gallon Anticipate Increased Base Oil Prices + Operational Reliability At Refineries Are Projected To Benefit Spreads In 2Q19 $0.17 $0.13 $0.21 $0.19 $0.27 $0
Slide 18: Contact
Noel Ryan, IRC IR@VertexEnergy.com CONTACT
Source: SEC EDGAR · 8-K filed May 8, 2019
More decks from Vertex Energy Inc
 Q2 2024 Earnings Presentation21 slides · Aug 8, 2024
 Q1 2024 Earnings Presentation20 slides · May 9, 2024
 Q4 2023 Earnings Presentation29 slides · Feb 28, 2024
 Q3 2023 Earnings Presentation27 slides · Nov 7, 2023
 Q2 2023 Earnings Presentation26 slides · Aug 9, 2023
 Q1 2023 Earnings Presentation26 slides · May 9, 2023