Vertex Energy — Q2 2023 Earnings Presentation
26 slides from Vertex Energy's earnings presentation, Aug 9, 2023
Slide 1: Second Quarter 2023 Quarterly Results Summary Presentation
Second Quarter 2023 Quarterly Results Summary Presentation August 2023

Slide 2: Disclaimer: Forward-looking statements
DISCLAIMER Forward - looking statements 2 Certain of the matters discussed in this communication which are not statements of historical fact constitute forward - looking statements within the meaning of the securities laws, including the Private Securities Litigation Reform Act of 1995 , that involv
Slide 3: Non-GAAP financial measures
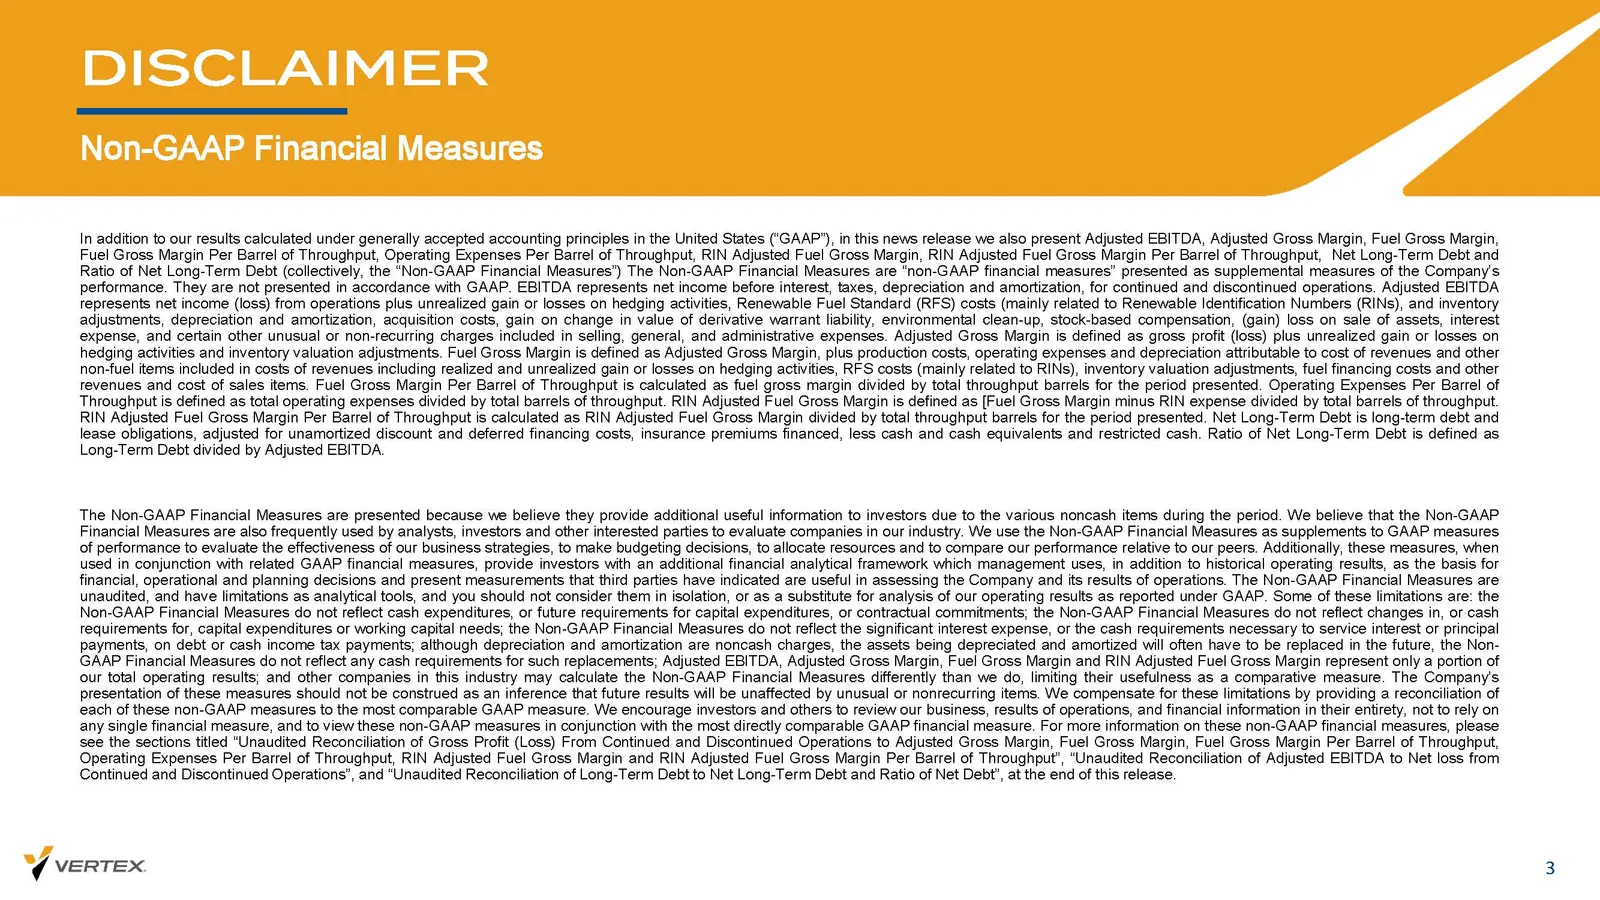
In addition to our results calculated under generally accepted accounting principles in the United States (“GAAP”), in this news release we also present Adjusted EBITDA, Adjusted Gross Margin, Fuel Gross Margin, Fuel Gross Margin Per Barrel of Throughput, Operating Expenses Per Barrel of Throughput,
Slide 4: Second Quarter 2023 Performance Summary
SECOND QUARTER 2023 Performance Summary
Slide 5: 2Q23 Performance Indicators
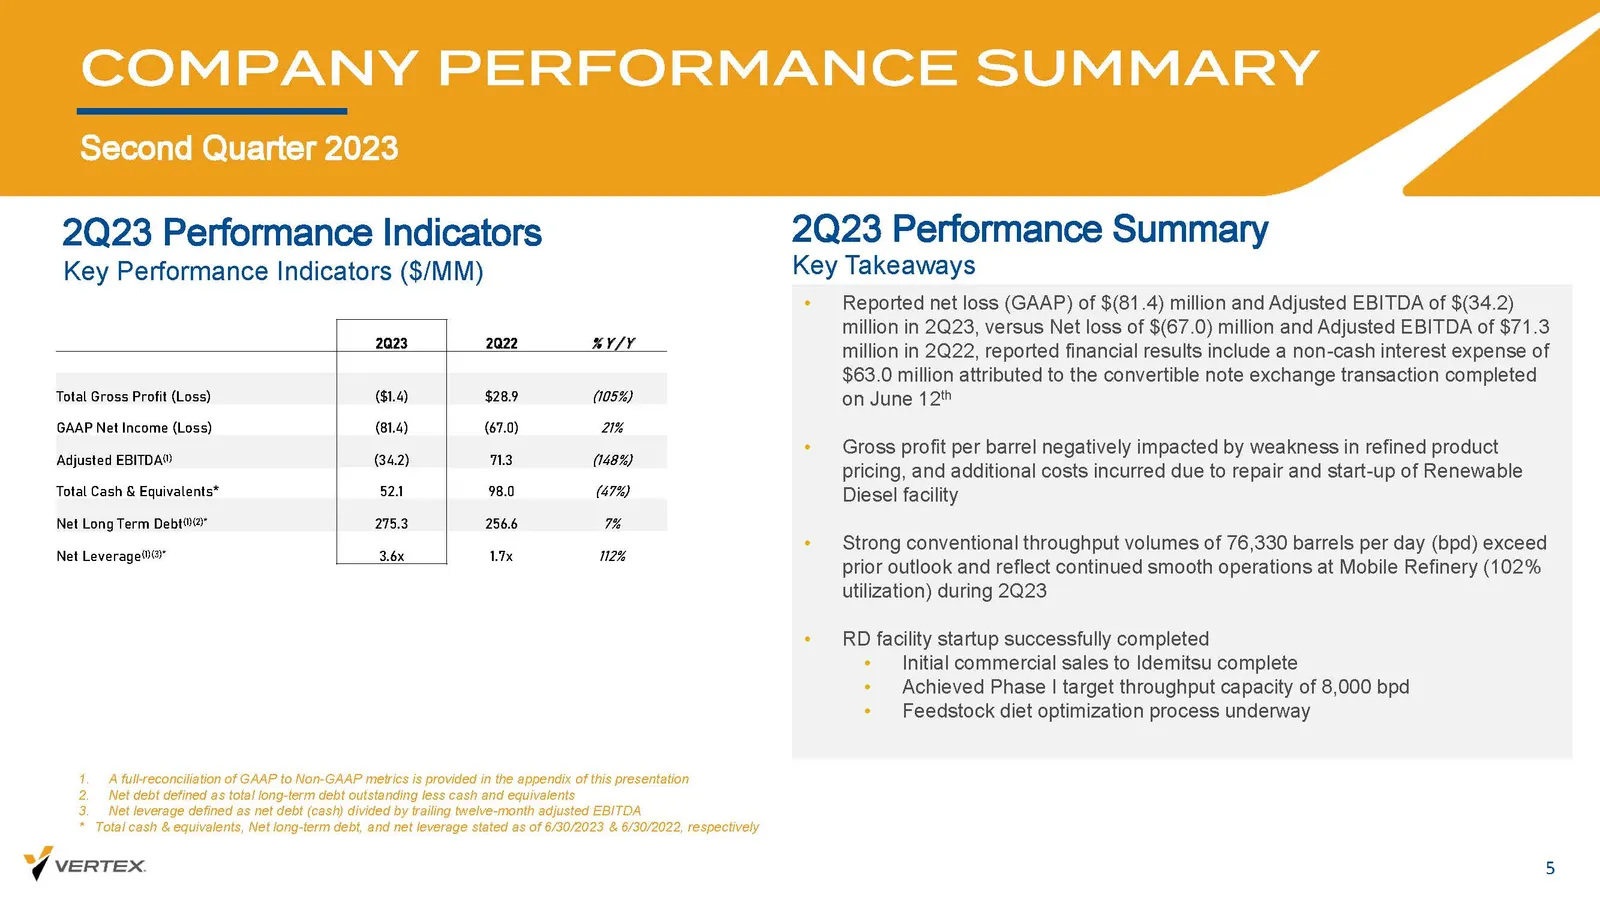
2Q23 Performance Indicators COMPANY PERFORMANCE SUMMARY Second Quarter 2023 5 1. A full - reconciliation of GAAP to Non - GAAP metrics is provided in the appendix of this presentation 2. Net debt defined as total long - term debt outstanding less cash and equivalents 3. Net leverage defined as net d
Slide 6: Mobile Refinery Performance Indicators
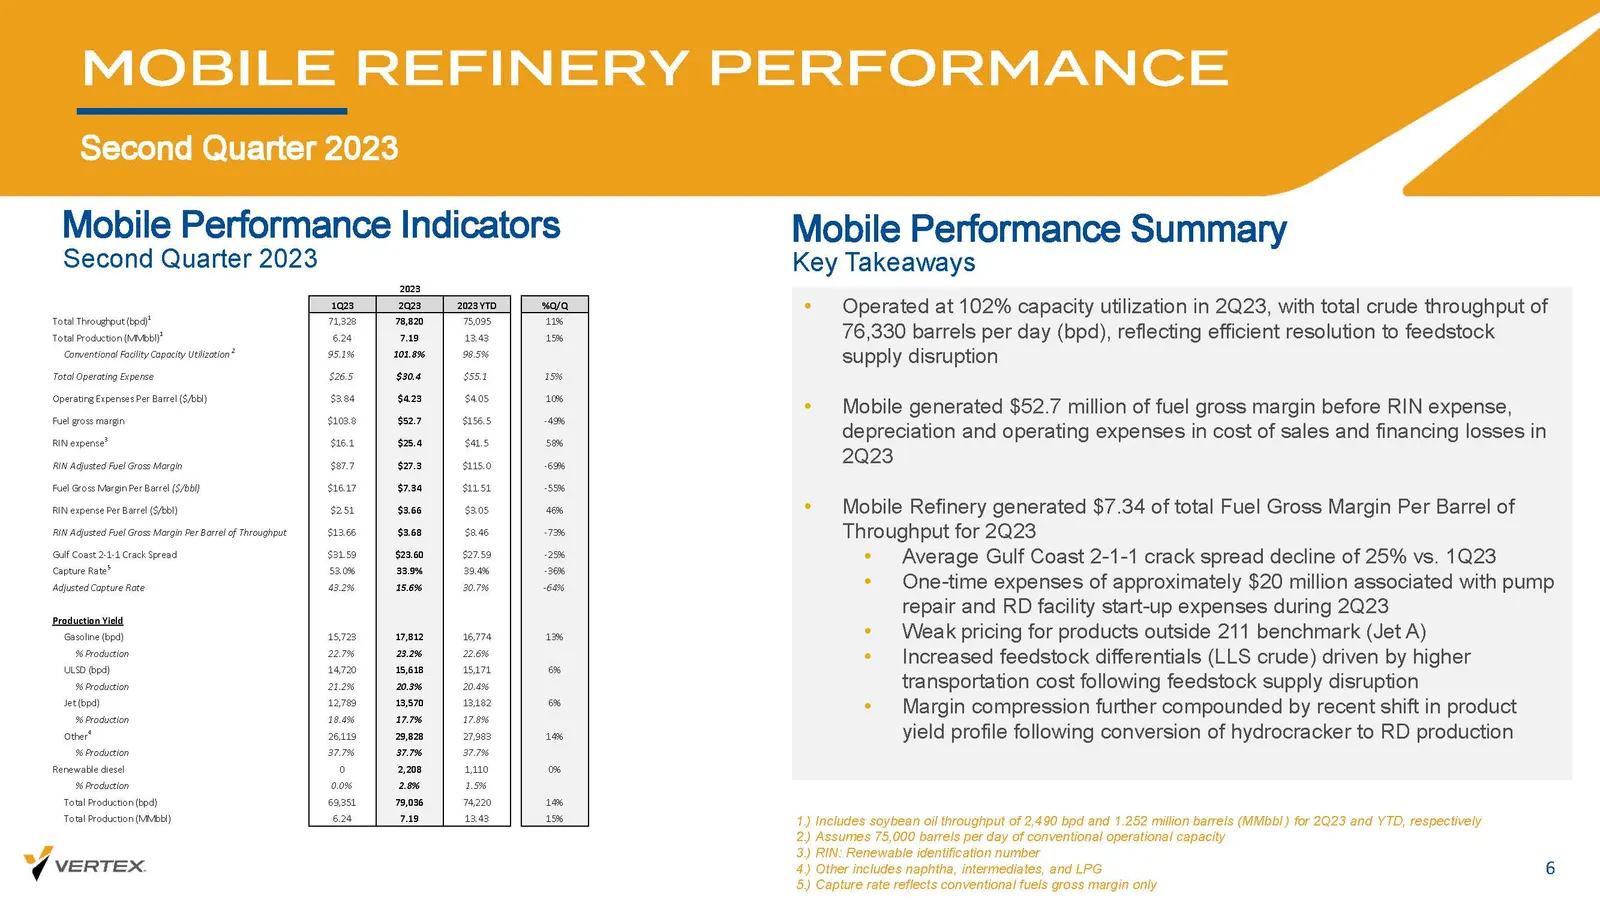
Mobile Performance Indicators MOBILE REFINERY PERFORMANCE Second Quarter 2023 6 • Operated at 102% capacity utilization in 2Q23, with total crude throughput of 76,330 barrels per day (bpd), reflecting efficient resolution to feedstock supply disruption • Mobile generated $52.7 million of fuel gross
Slide 7: Renewable Diesel Project Update
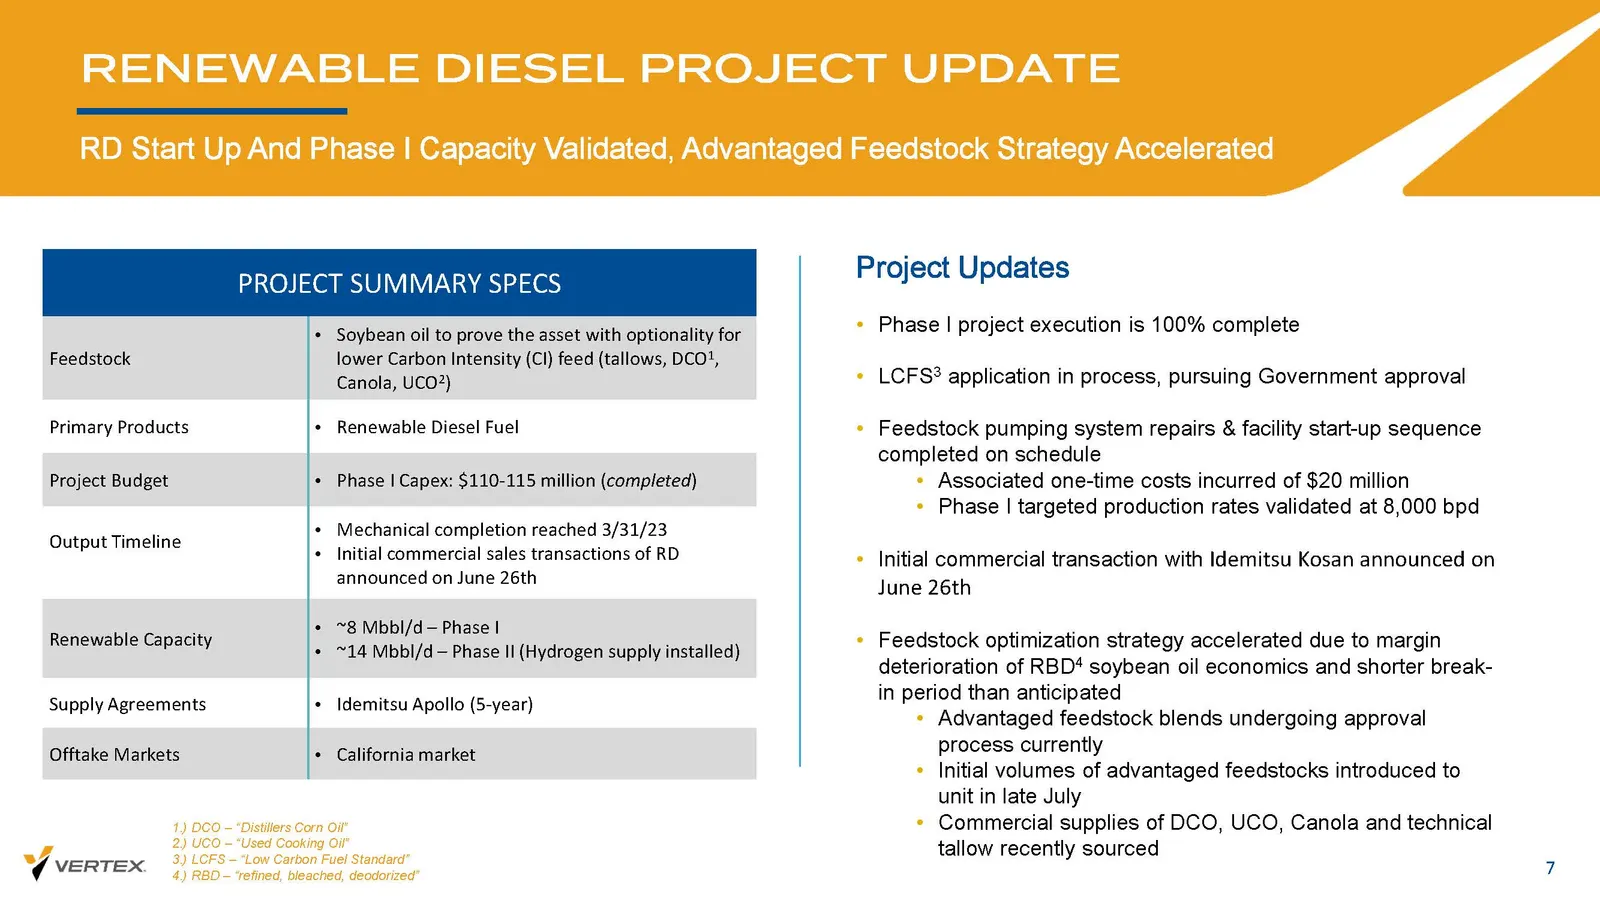
RENEWABLE DIESEL PROJECT UPDATE 7 RD Start Up And Phase I Capacity Validated, Advantaged Feedstock Strategy Accelerated • Soybean oil to prove the asset with optionality for lower Carbon Intensity (CI) feed (tallows, DCO 1 , Canola, UCO 2 ) Feedstock • Renewable Diesel Fuel Primary Products • Phase
Slide 8: Domestic Fuels Demand
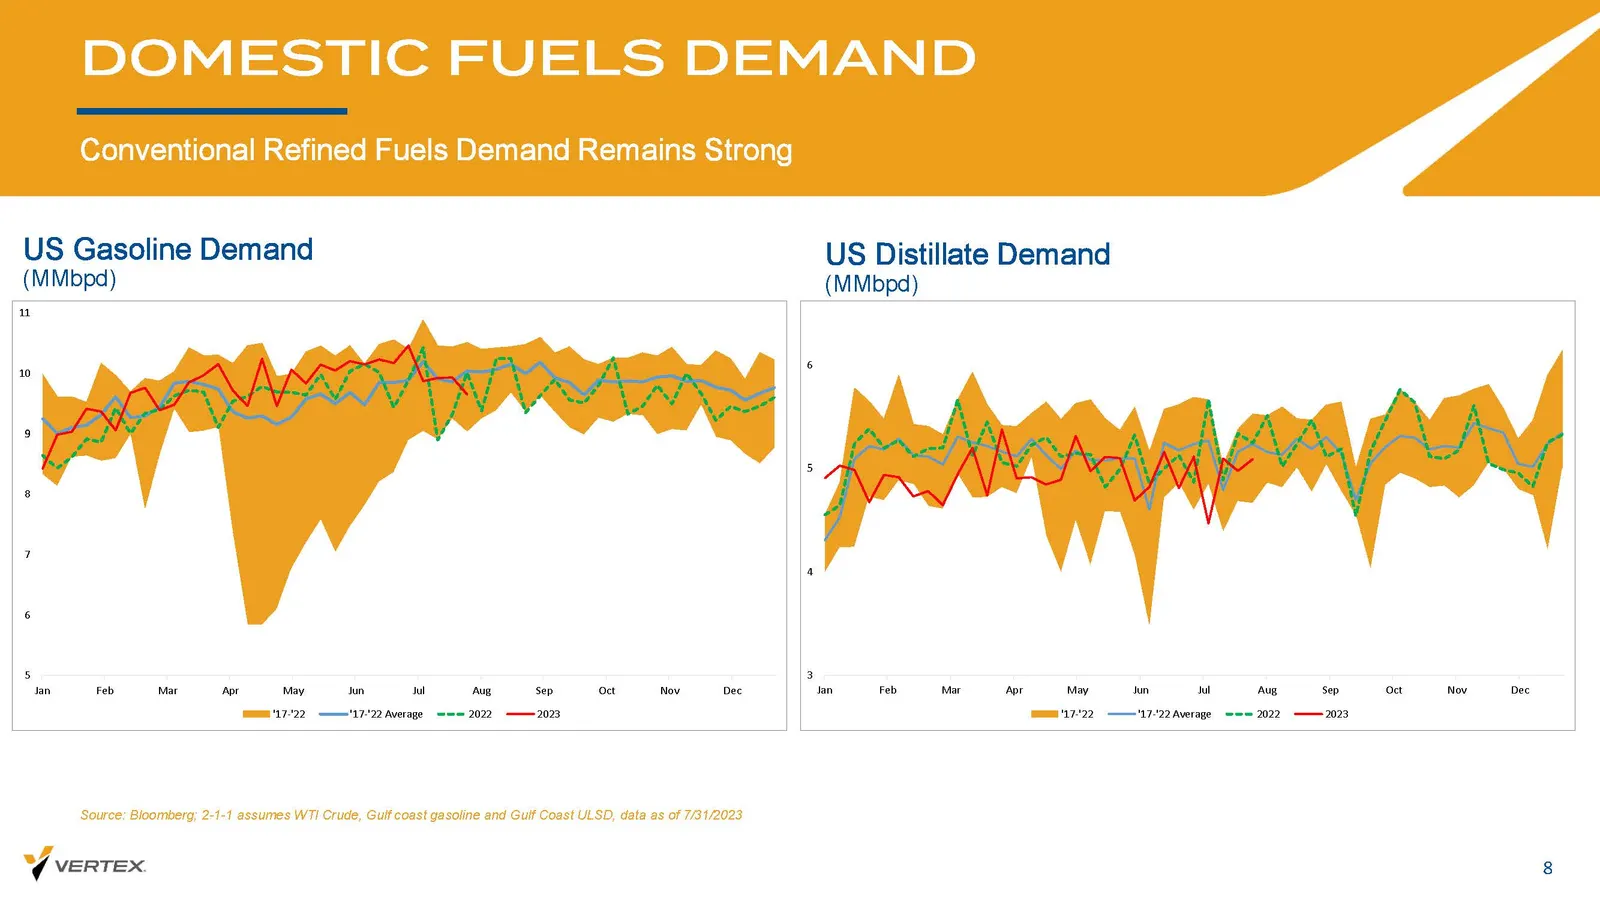
DOMESTIC FUELS DEMAND Conventional Refined Fuels Demand Remains Strong 8 US Gasoline Demand ( MMbpd ) US Distillate Demand ( MMbpd ) Source: Bloomberg; 2 - 1 - 1 assumes WTI Crude, Gulf coast gasoline and Gulf Coast ULSD, data as of 7/31/2023 5 6 7 8 9 10 11 Jan Feb Mar Apr May Jun Jul Aug Sep Oct N
Slide 9: Domestic Fuels Inventories Remain Tight
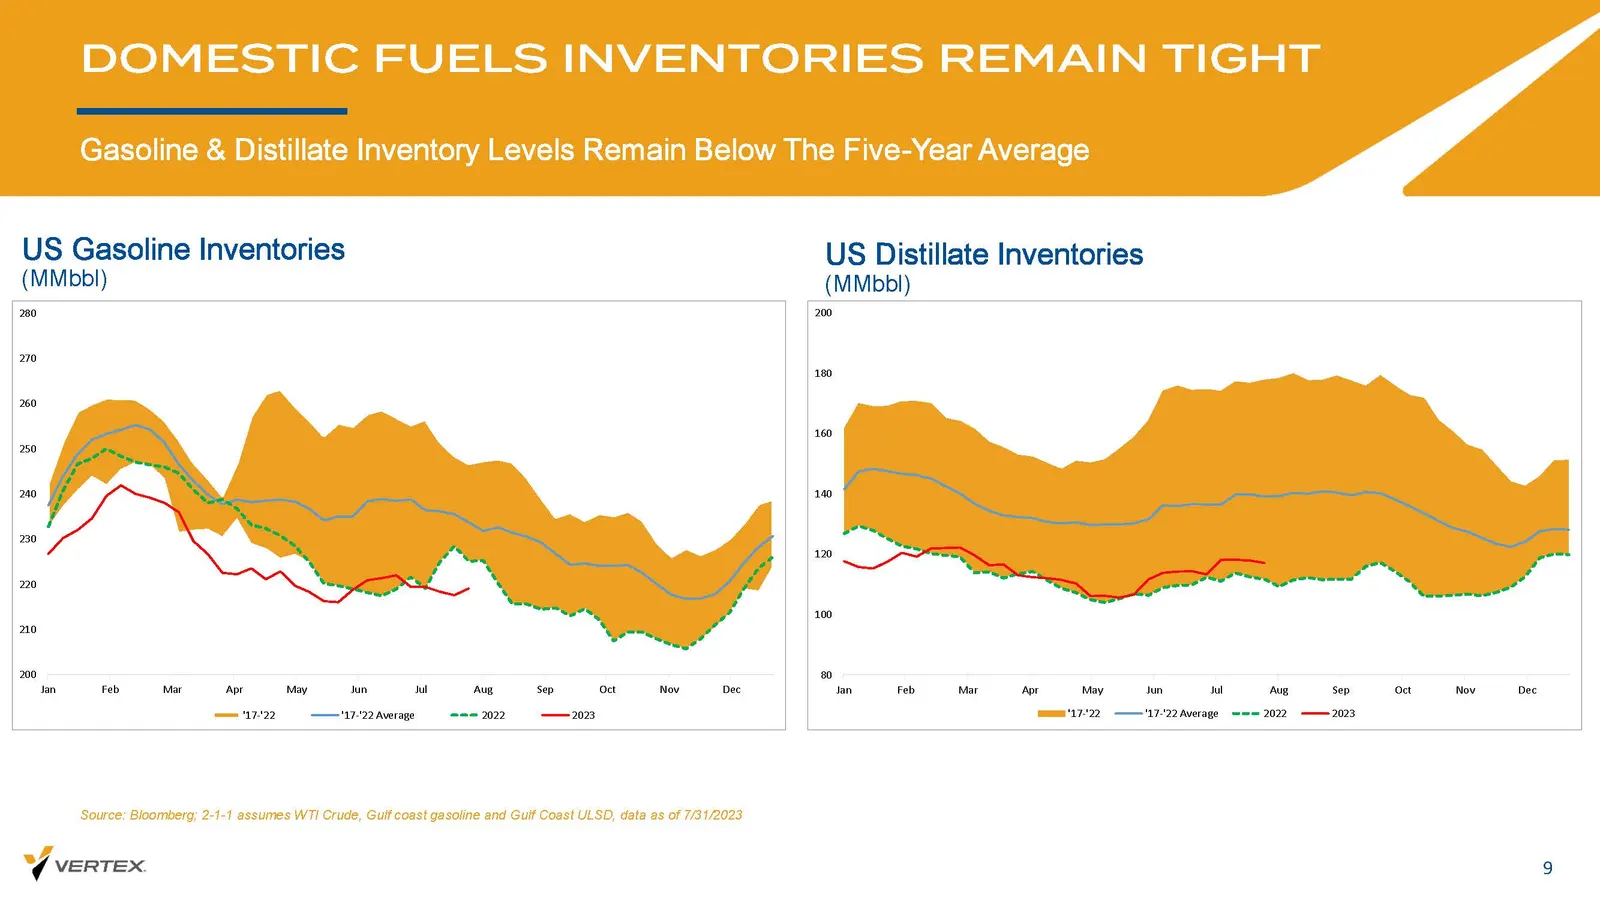
DOMESTIC FUELS INVENTORIES REMAIN TIGHT Gasoline & Distillate Inventory Levels Remain Below The Five - Year Average US Gasoline Inventories 9 ( MMbbl ) US Distillate Inventories ( MMbbl ) Source: Bloomberg; 2 - 1 - 1 assumes WTI Crude, Gulf coast gasoline and Gulf Coast ULSD, data as of 7/31/2023 80
Slide 10: Domestic Fuels Production Levels
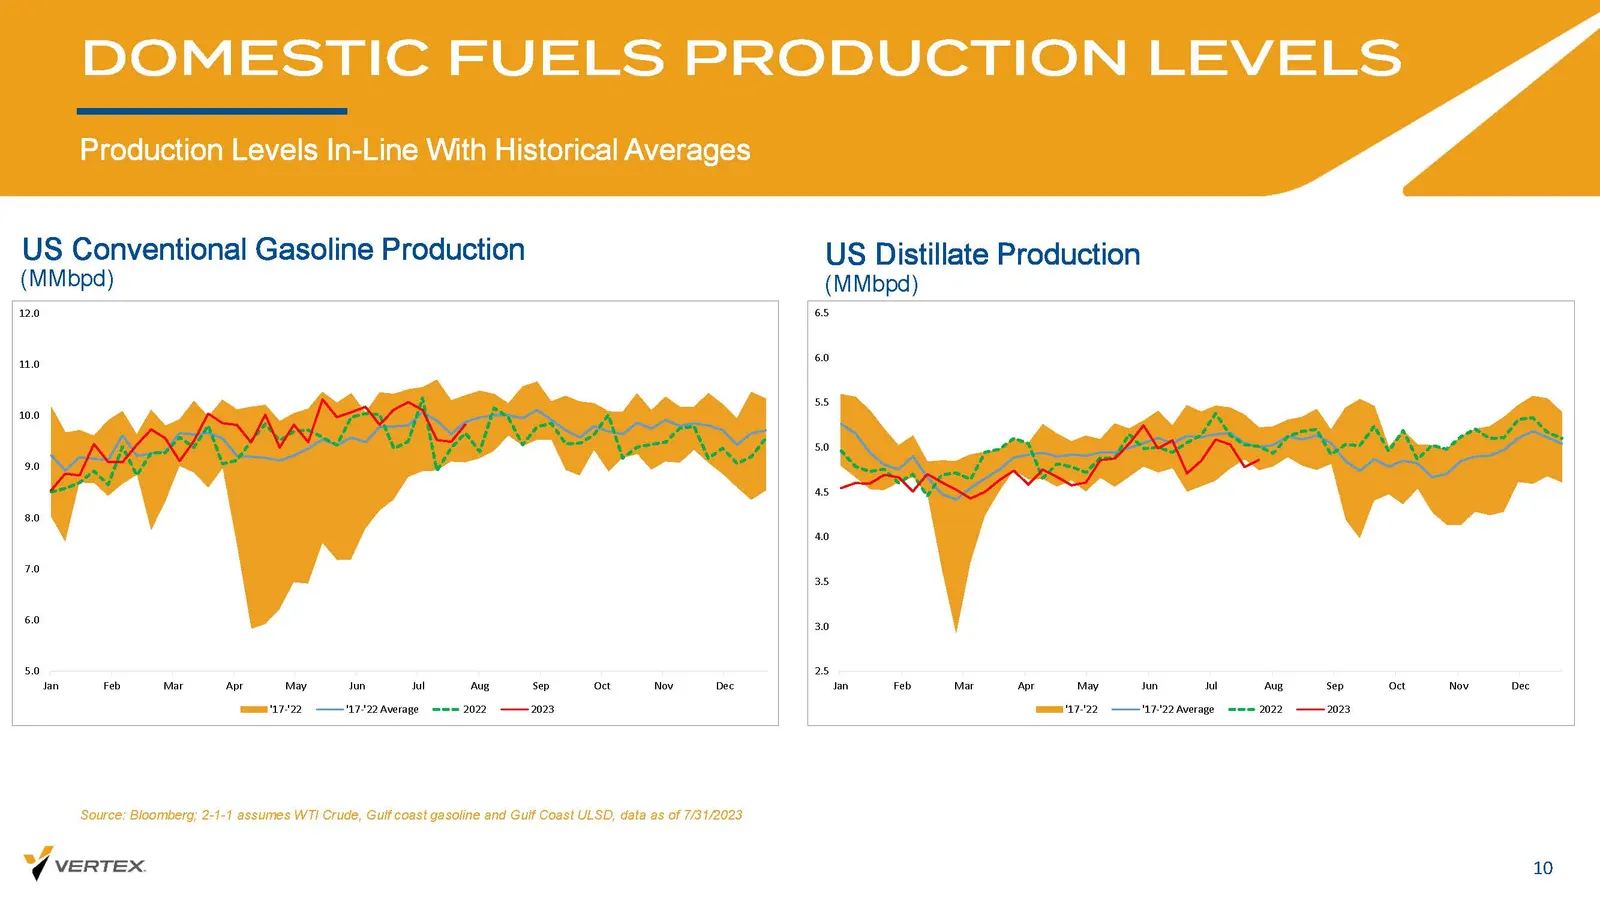
DOMESTIC FUELS PRODUCTION LEVELS Production Levels In - Line With Historical Averages US Conventional Gasoline Production 10 ( MMbpd ) US Distillate Production ( MMbpd ) Source: Bloomberg; 2 - 1 - 1 assumes WTI Crude, Gulf coast gasoline and Gulf Coast ULSD, data as of 7/31/2023 2.5 3.0 3.5 4.0 4.5
Slide 11: Refined Product Margins Retreating From Recent Highs
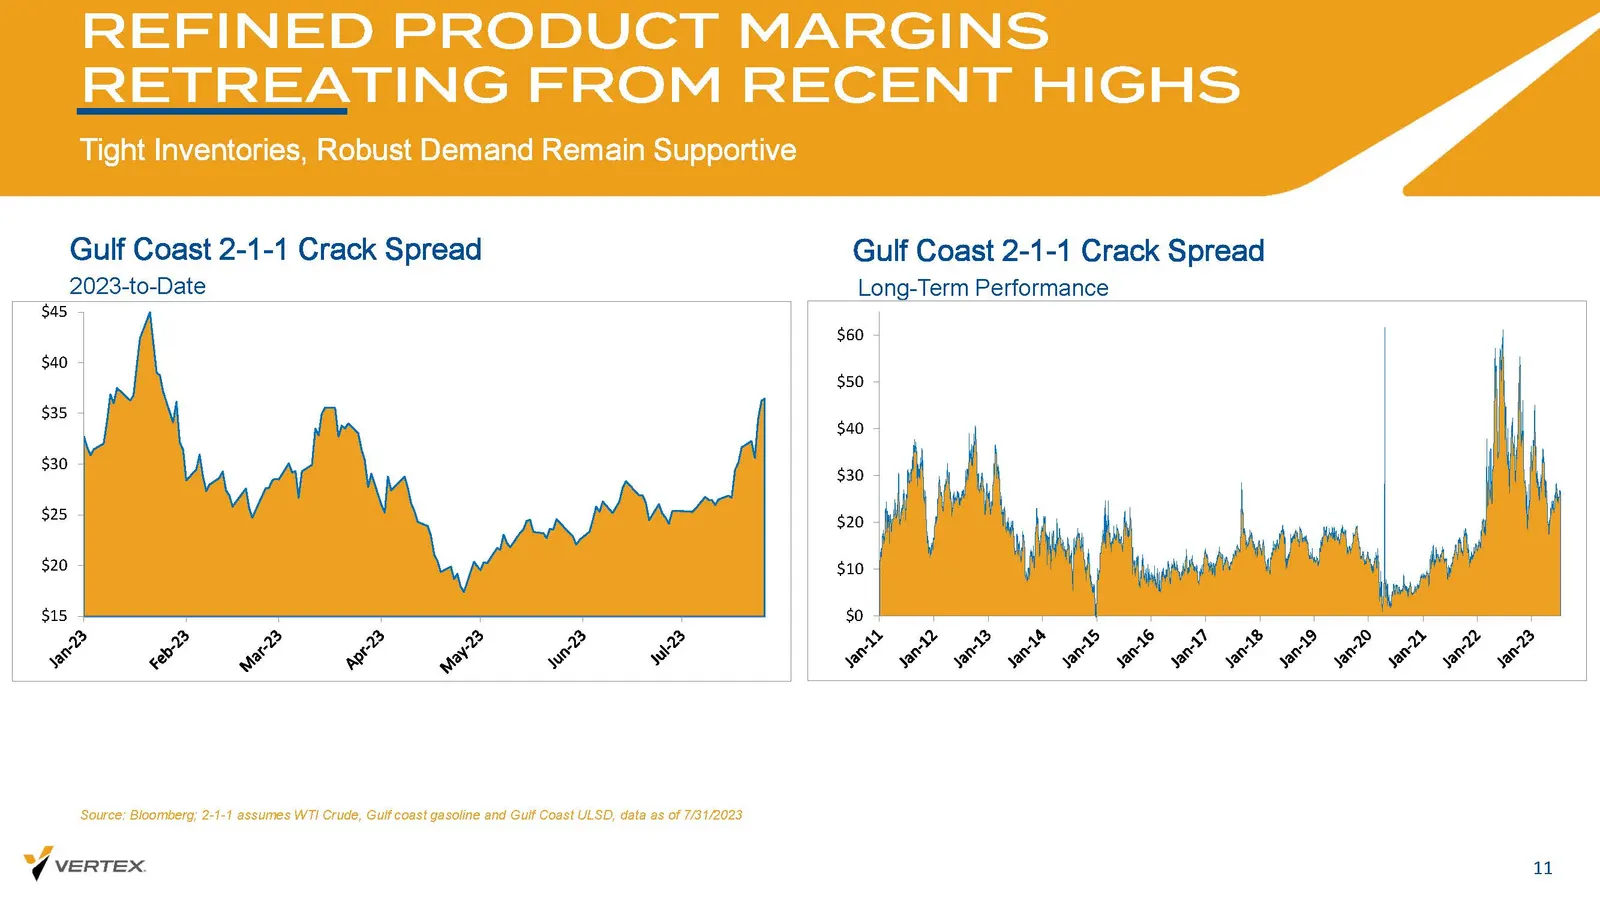
REFINED PRODUCT MARGINS RETREATING FROM RECENT HIGHS Tight Inventories, Robust Demand Remain Supportive 11 Gulf Coast 2 - 1 - 1 Crack Spread 2023 - to - Date Source: Bloomberg; 2 - 1 - 1 assumes WTI Crude, Gulf coast gasoline and Gulf Coast ULSD, data as of 7/31/2023 Gulf Coast 2 - 1 - 1 Crack Sprea
Slide 12: Commodities Futures Markets
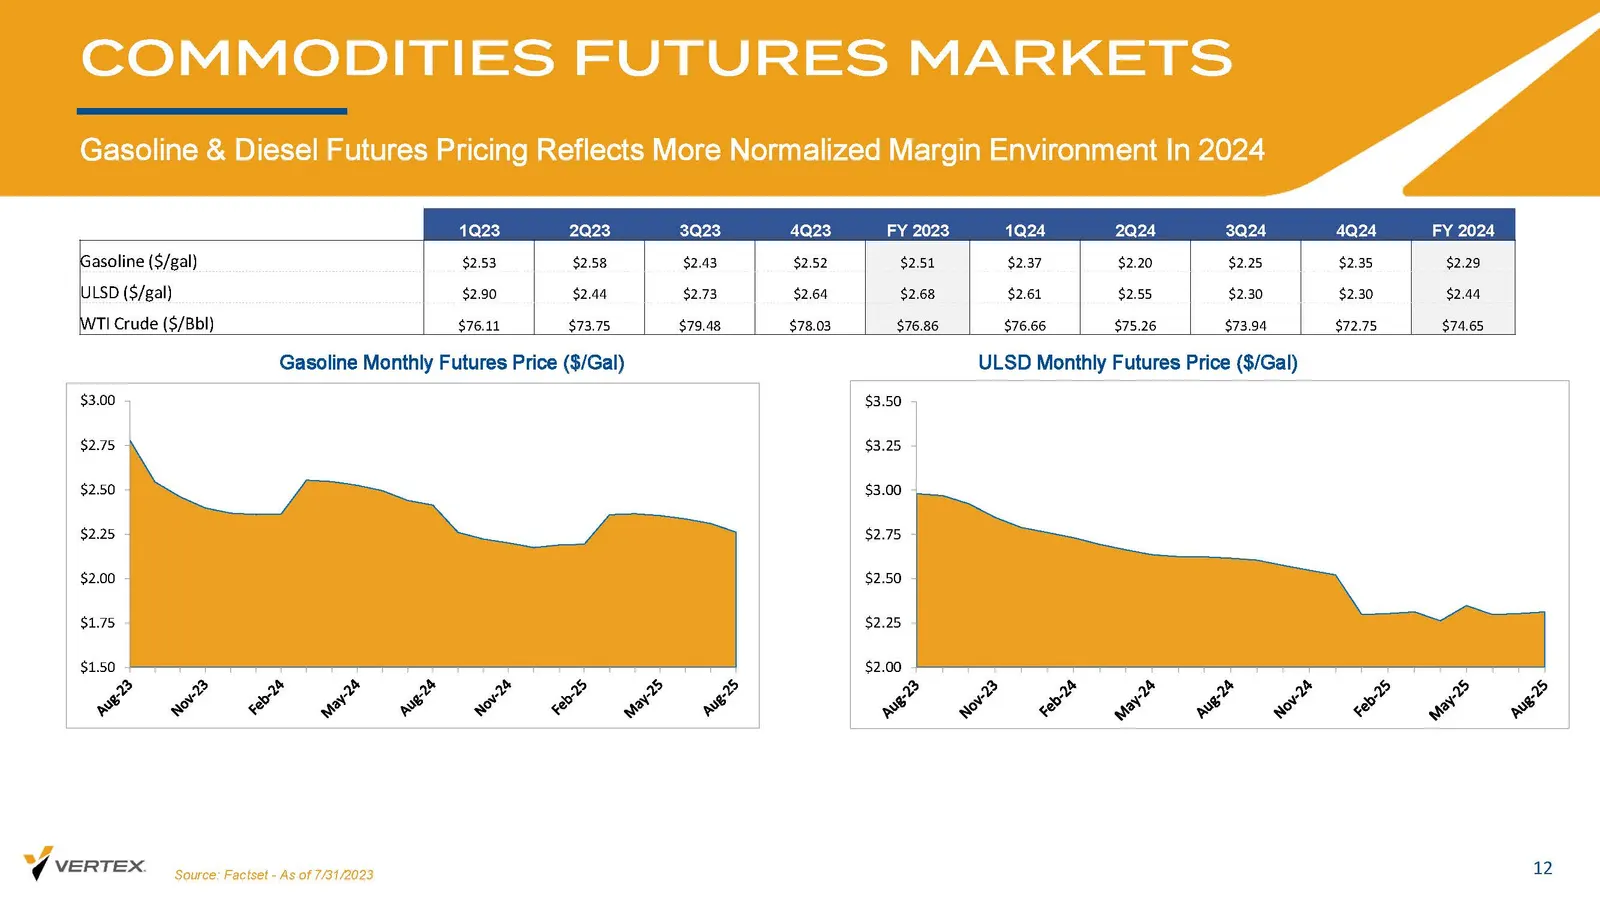
COMMODITIES FUTURES MARKETS Gasoline & Diesel Futures Pricing Reflects More Normalized Margin Environment In 2024 12 Gasoline Monthly Futures Price ($/Gal) ULSD Monthly Futures Price ($/Gal) Source: Factset - As of 7/31/2023 $1.50 $1.75 $2.00 $2.25 $2.50 $2.75 $3.00 $2.00 $2.25 $2.50 $2.75 $3.00 $3.
Slide 13: Crude Futures Curve Flattening
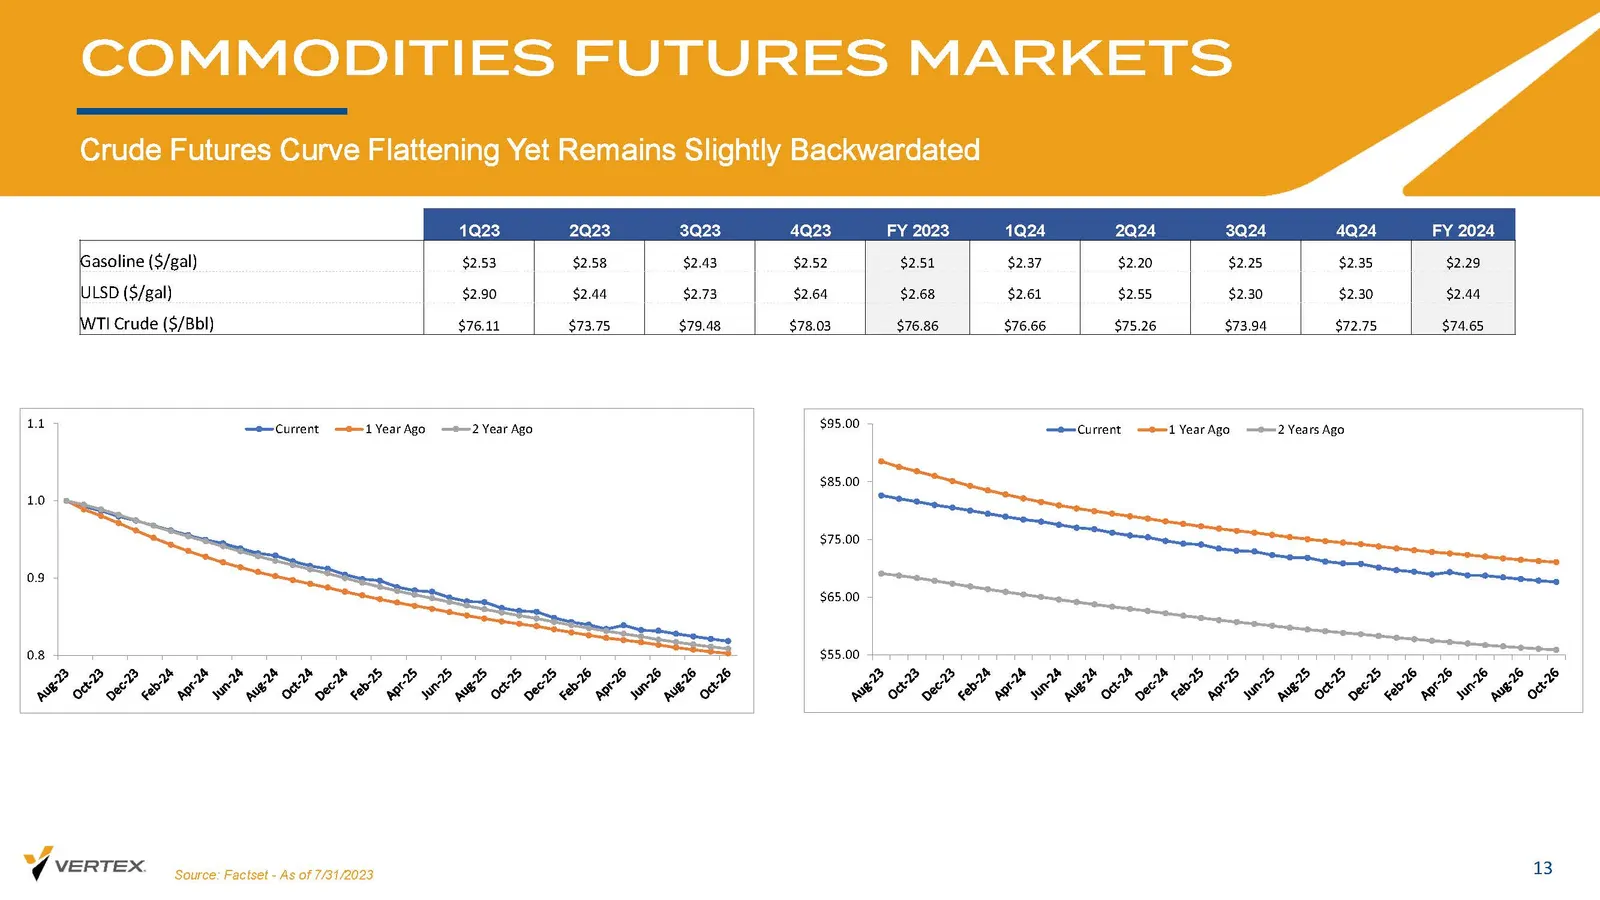
Crude Futures Curve Flattening Yet Remains Slightly Backwardated 13 COMMODITIES FUTURES MARKETS Source: Factset - As of 7/31/2023 0.8 0.9 1.0 1.1 Current 1 Year Ago 2 Year Ago $55.00 $65.00 $75.00 $85.00 $95.00 Current 1 Year Ago 2 Years Ago 1Q23 2Q23 3Q23 4Q23 FY 2023 1Q24 2Q24 3Q24 4Q24 FY 2024 Ga
Slide 14: Balance Sheet Update
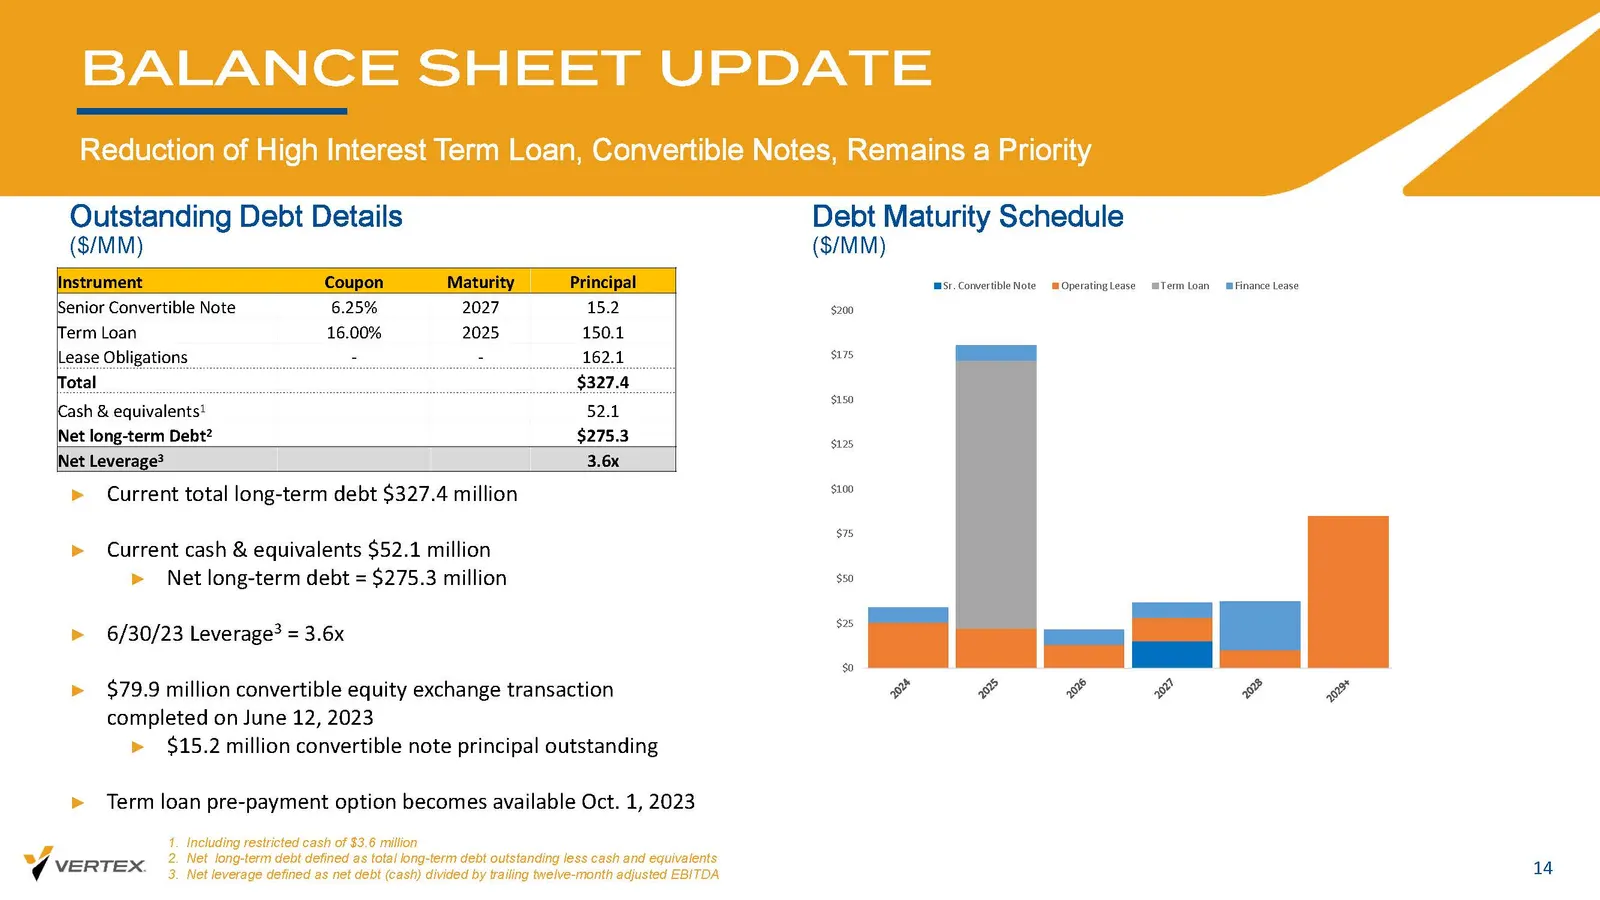
BALANCE SHEET UPDATE Reduction of High Interest Term Loan, Convertible Notes, Remains a Priority 14 Outstanding Debt Details ($/MM) Debt Maturity Schedule ($/MM) ► Current total long - term debt $327.4 million ► Current cash & equivalents $52.1 million ► Net long - term debt = $275.3 million ► 6/30/
Slide 15: Projected Financial Guidance: Third Quarter 2023 Outlook
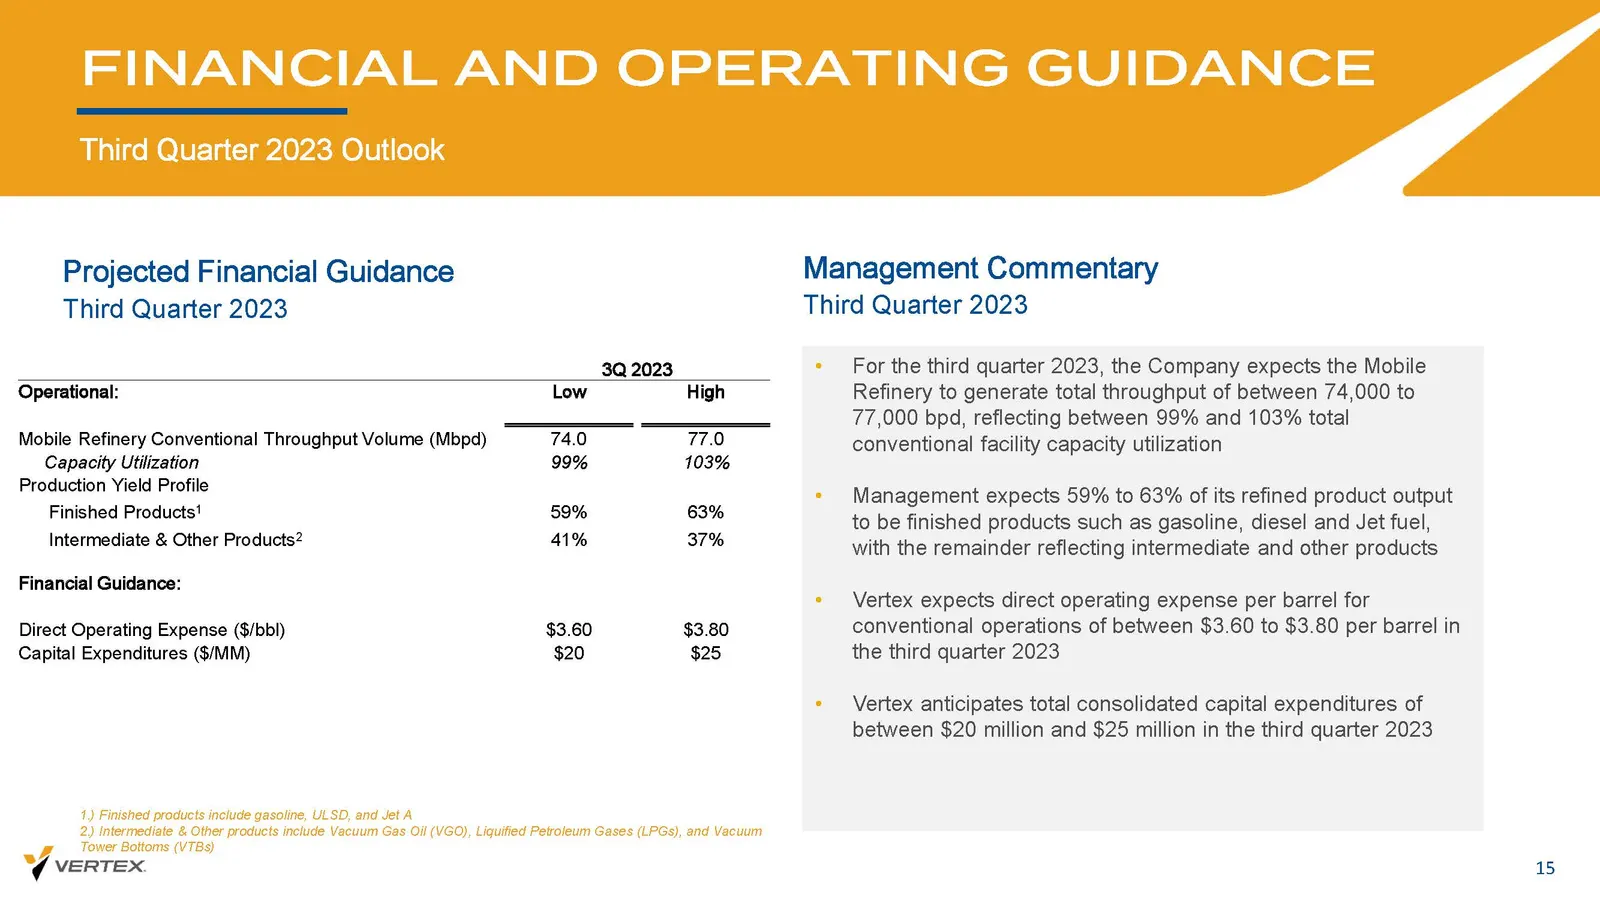
Projected Financial Guidance FINANCIAL AND OPERATING GUIDANCE Third Quarter 2023 Outlook 15 Management Commentary • For the third quarter 2023, the Company expects the Mobile Refinery to generate total throughput of between 74,000 to 77,000 bpd, reflecting between 99% and 103% total conventional fac
Slide 16: Our Strategic Focus
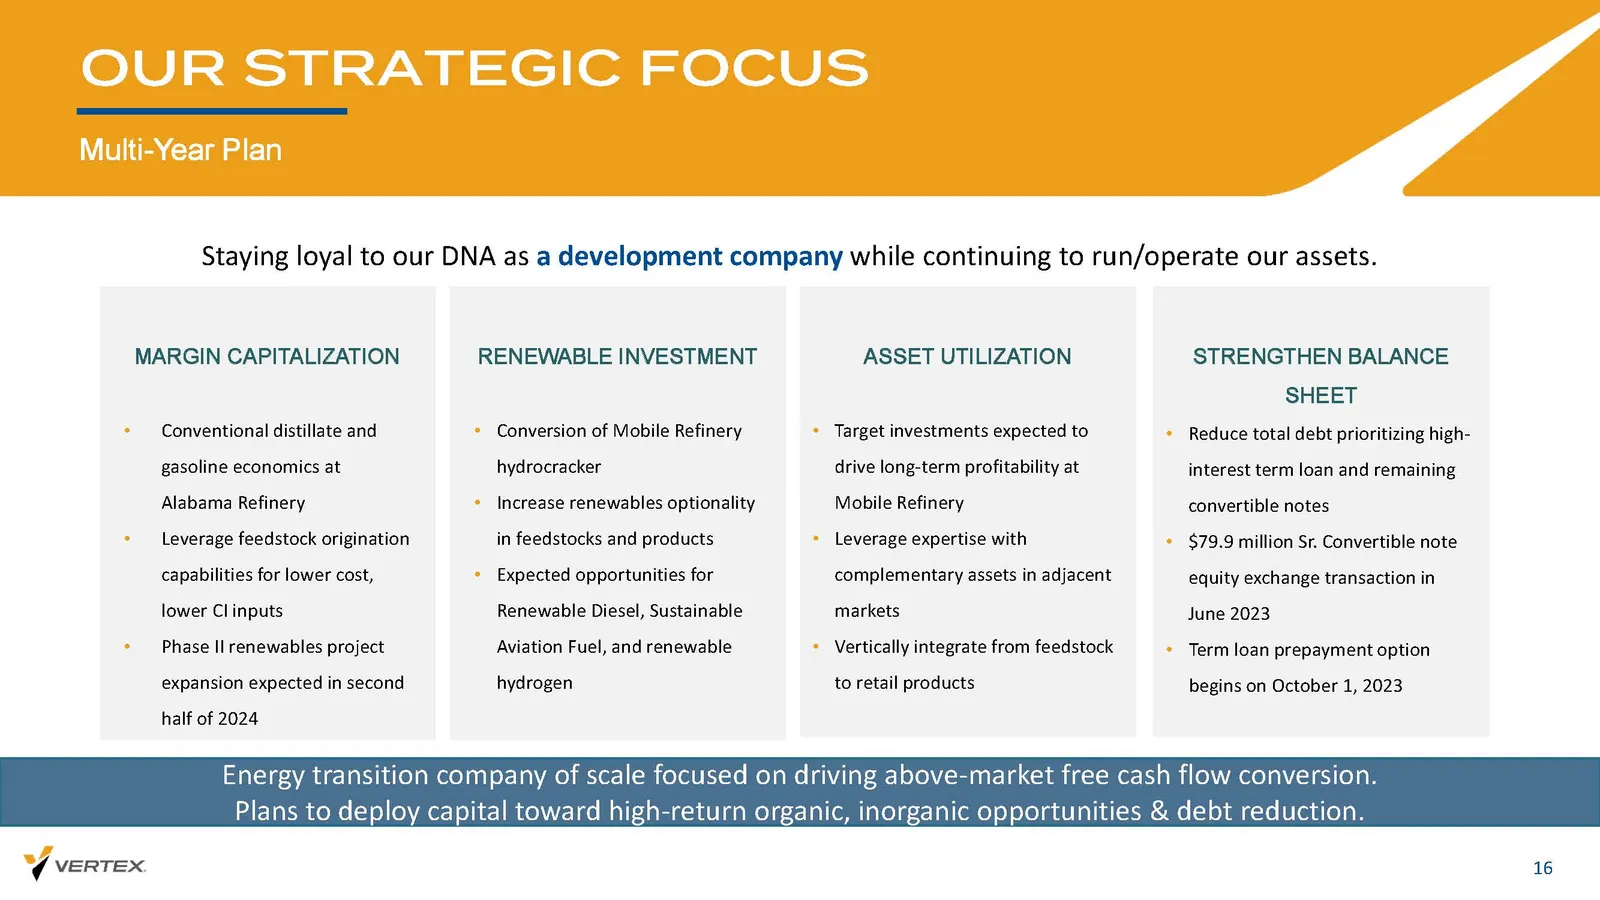
OUR STRATEGIC FOCUS Multi - Year Plan 16 ASSET UTILIZATION • Target investments expected to drive long - term profitability at Mobile Refinery • Leverage expertise with complementary assets in adjacent markets • Vertically integrate from feedstock to retail products MARGIN CAPITALIZATION • Conventio

Slide 17: Appendix
APPENDIX
Slide 18: Non-GAAP Reconciliation: Gross Profit to Adjusted Gross Margin
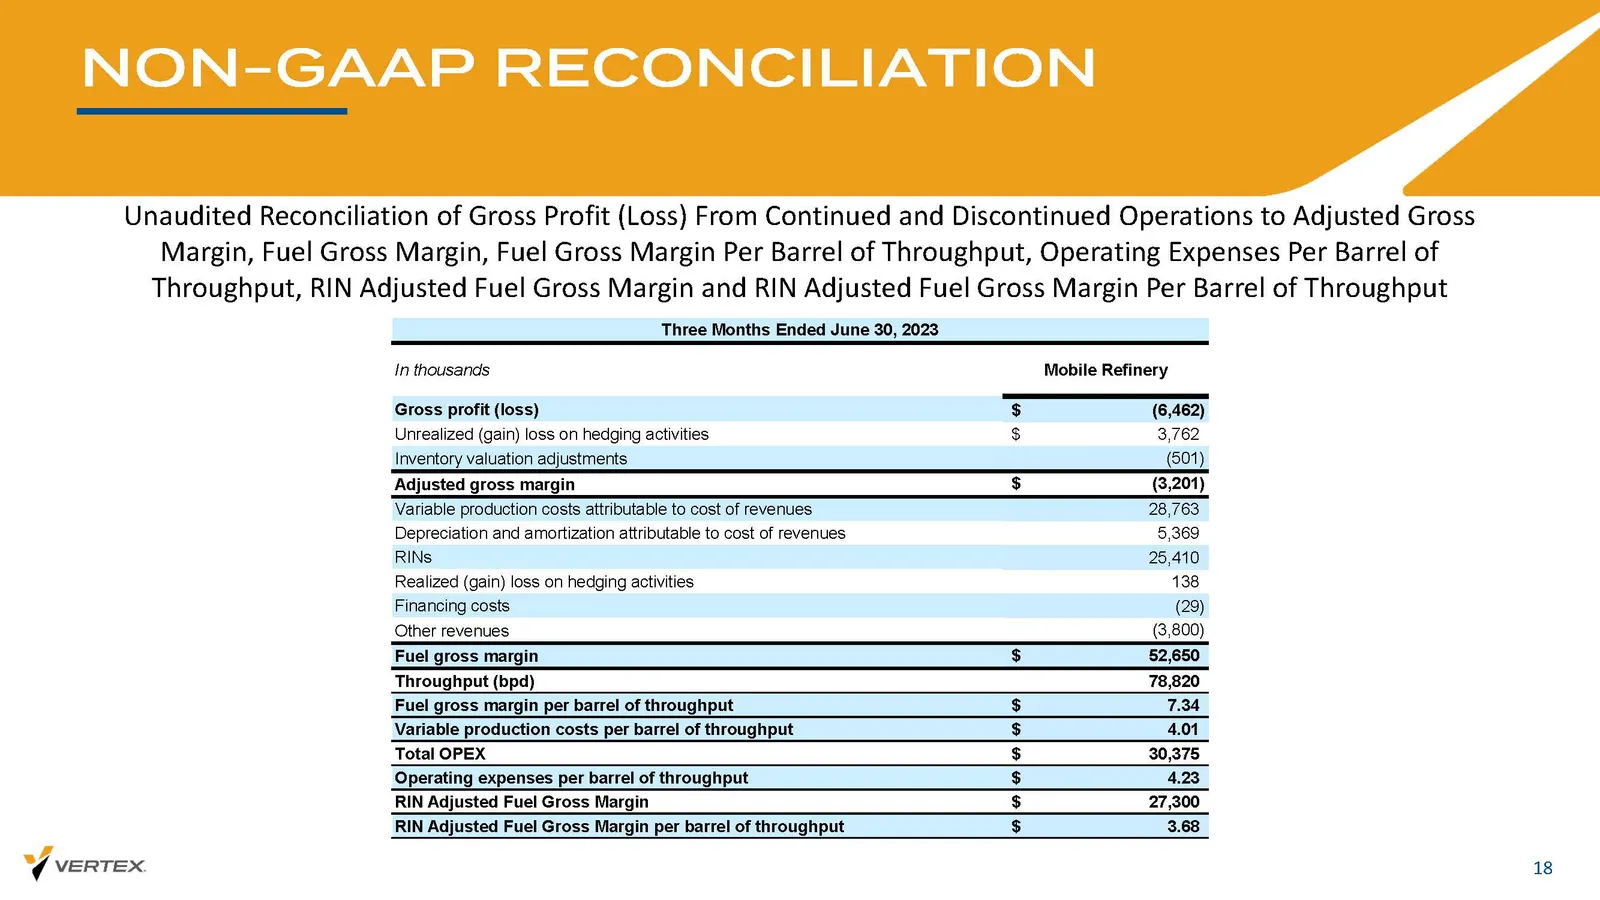
NON - GAAP RECONCILIATION 18 Unaudited Reconciliation of Gross Profit (Loss) From Continued and Discontinued Operations to Adjusted Gross Margin, Fuel Gross Margin, Fuel Gross Margin Per Barrel of Throughput, Operating Expenses Per Barrel of Throughput, RIN Adjusted Fuel Gross Margin and RIN Adjuste
Slide 19: Non-GAAP Reconciliation: Gross Profit to Adjusted Gross Margin
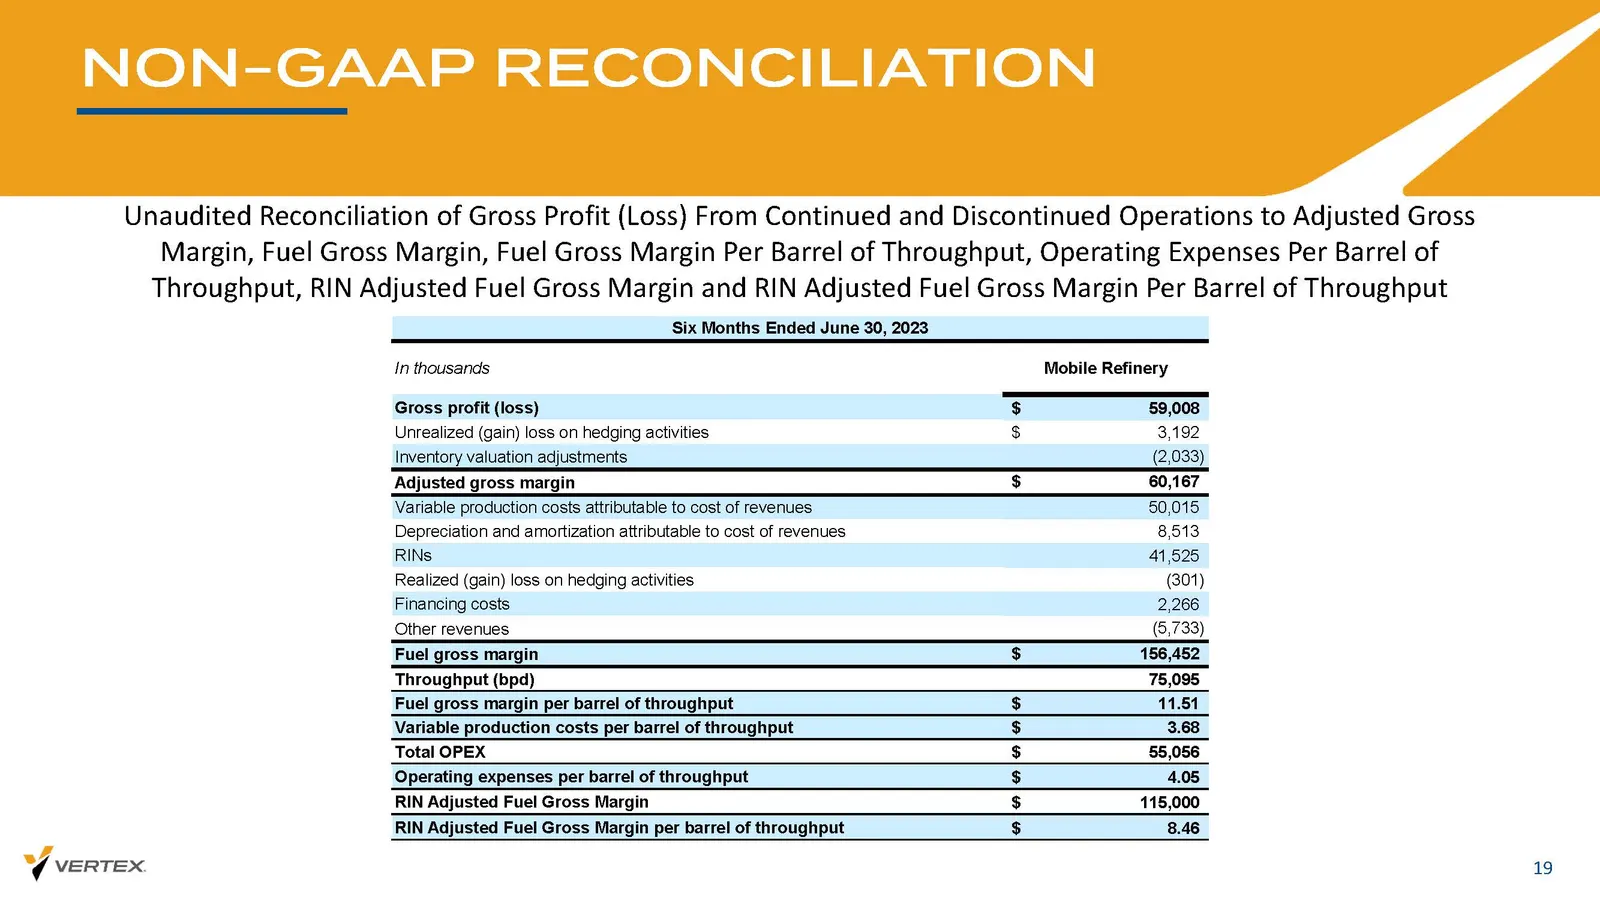
NON - GAAP RECONCILIATION 19 Unaudited Reconciliation of Gross Profit (Loss) From Continued and Discontinued Operations to Adjusted Gross Margin, Fuel Gross Margin, Fuel Gross Margin Per Barrel of Throughput, Operating Expenses Per Barrel of Throughput, RIN Adjusted Fuel Gross Margin and RIN Adjuste
Slide 20: Non-GAAP Reconciliation: Gross Profit to Adjusted Gross Margin
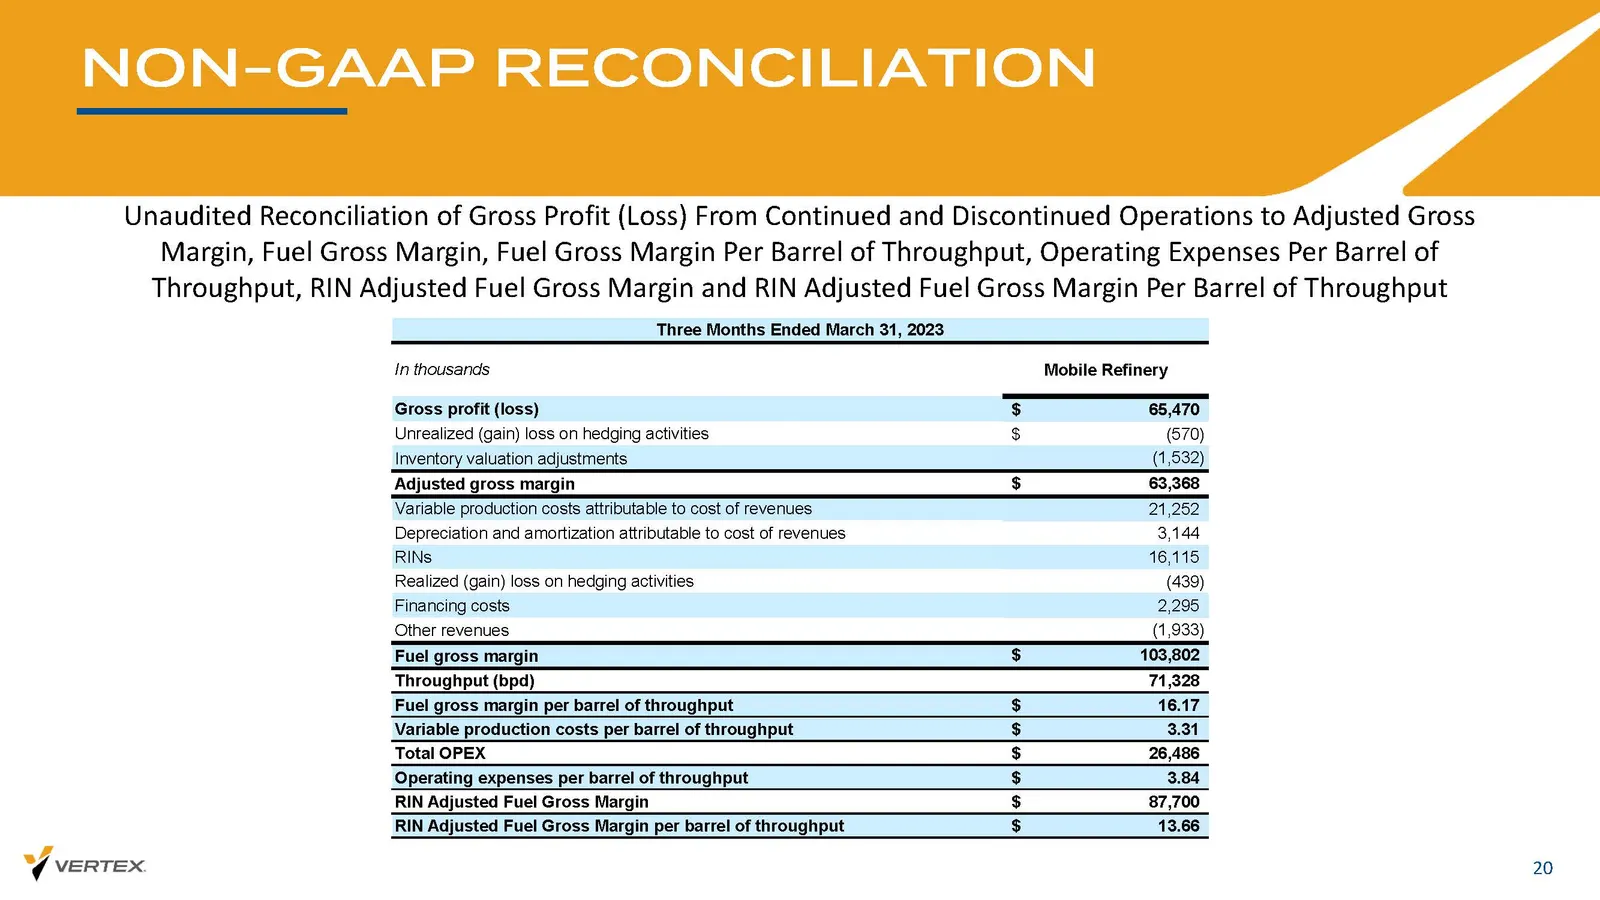
NON - GAAP RECONCILIATION 20 Unaudited Reconciliation of Gross Profit (Loss) From Continued and Discontinued Operations to Adjusted Gross Margin, Fuel Gross Margin, Fuel Gross Margin Per Barrel of Throughput, Operating Expenses Per Barrel of Throughput, RIN Adjusted Fuel Gross Margin and RIN Adjuste
Slide 21: Non-GAAP Reconciliation: EBITDA and Adjusted EBITDA
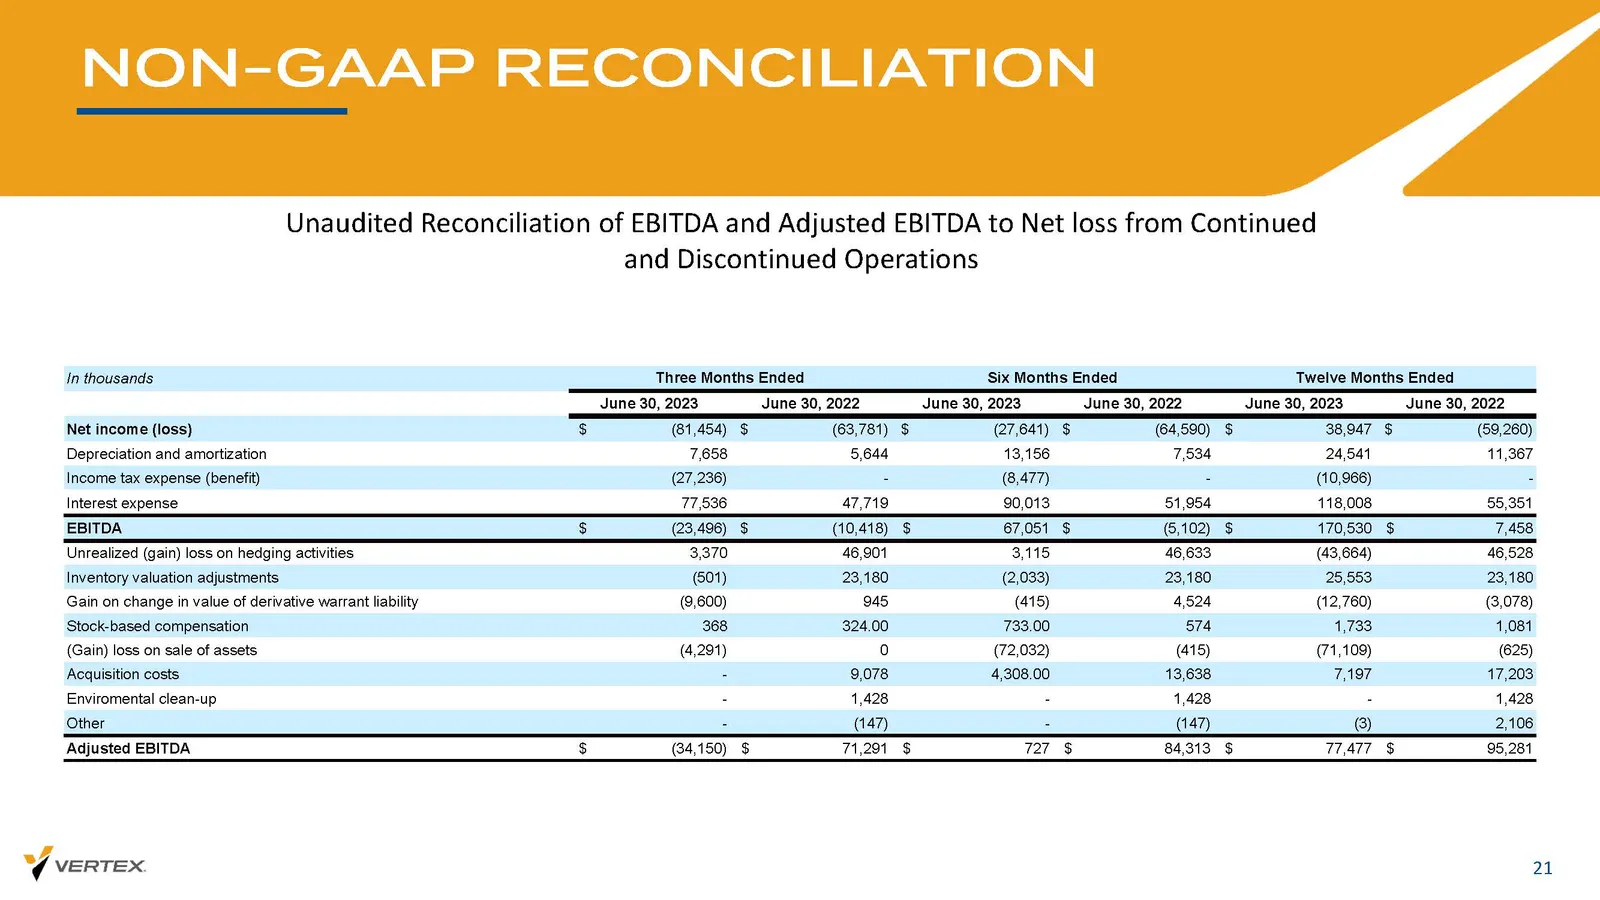
NON - GAAP RECONCILIATION 21 Unaudited Reconciliation of EBITDA and Adjusted EBITDA to Net loss from Continued and Discontinued Operations
Slide 22: Non-GAAP Reconciliation: EBITDA and Adjusted EBITDA
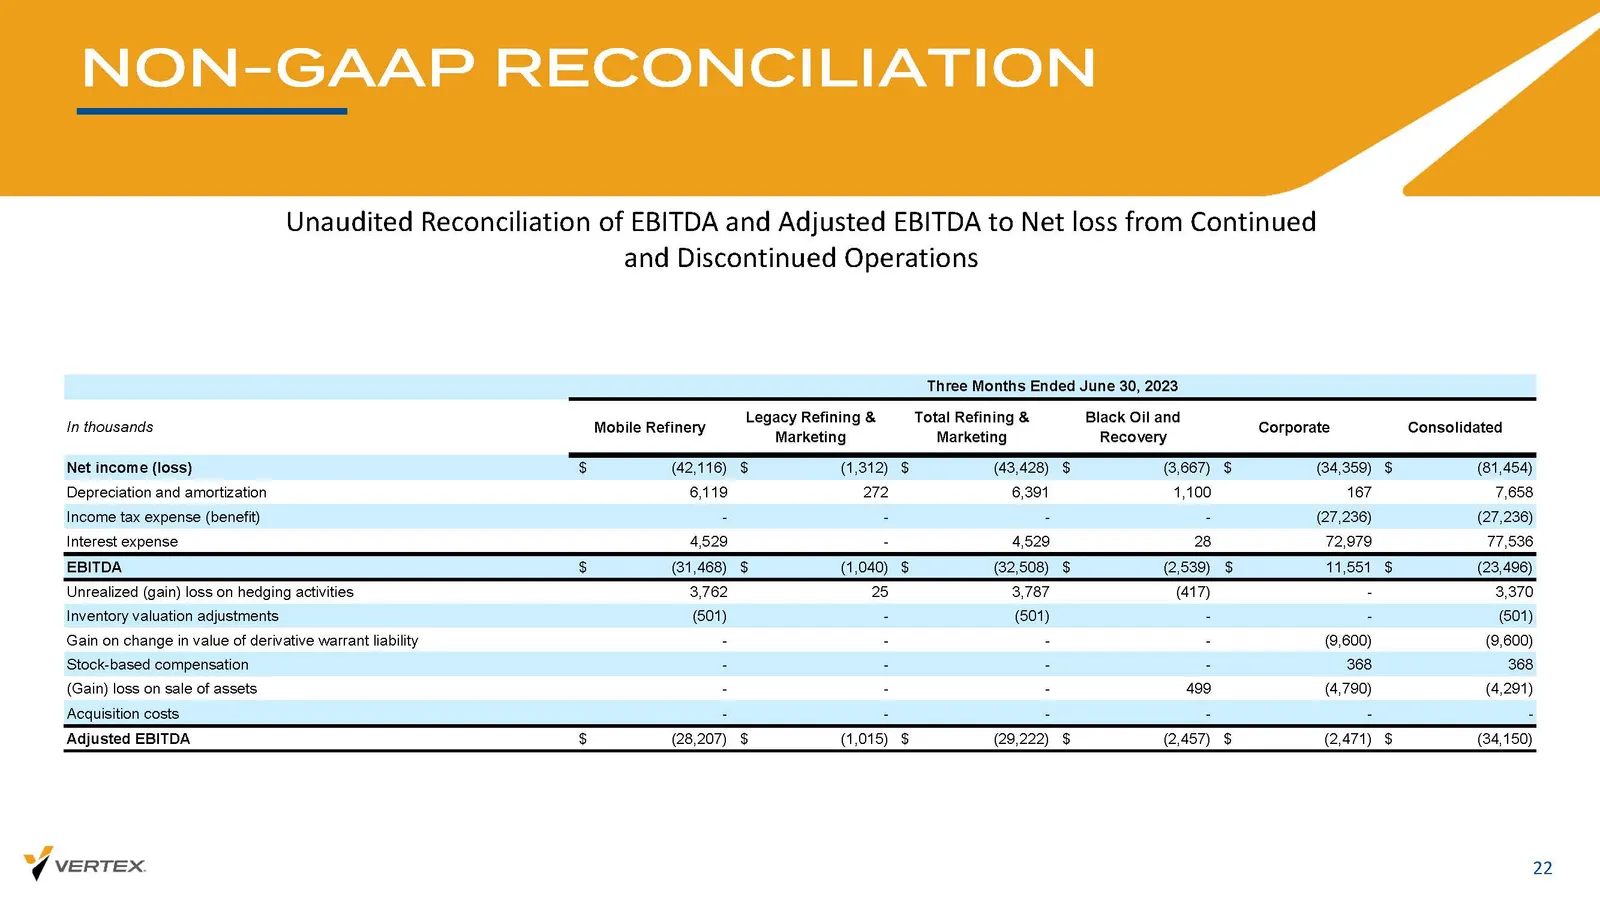
NON - GAAP RECONCILIATION 22 Unaudited Reconciliation of EBITDA and Adjusted EBITDA to Net loss from Continued and Discontinued Operations
Slide 23: Non-GAAP Reconciliation: EBITDA and Adjusted EBITDA
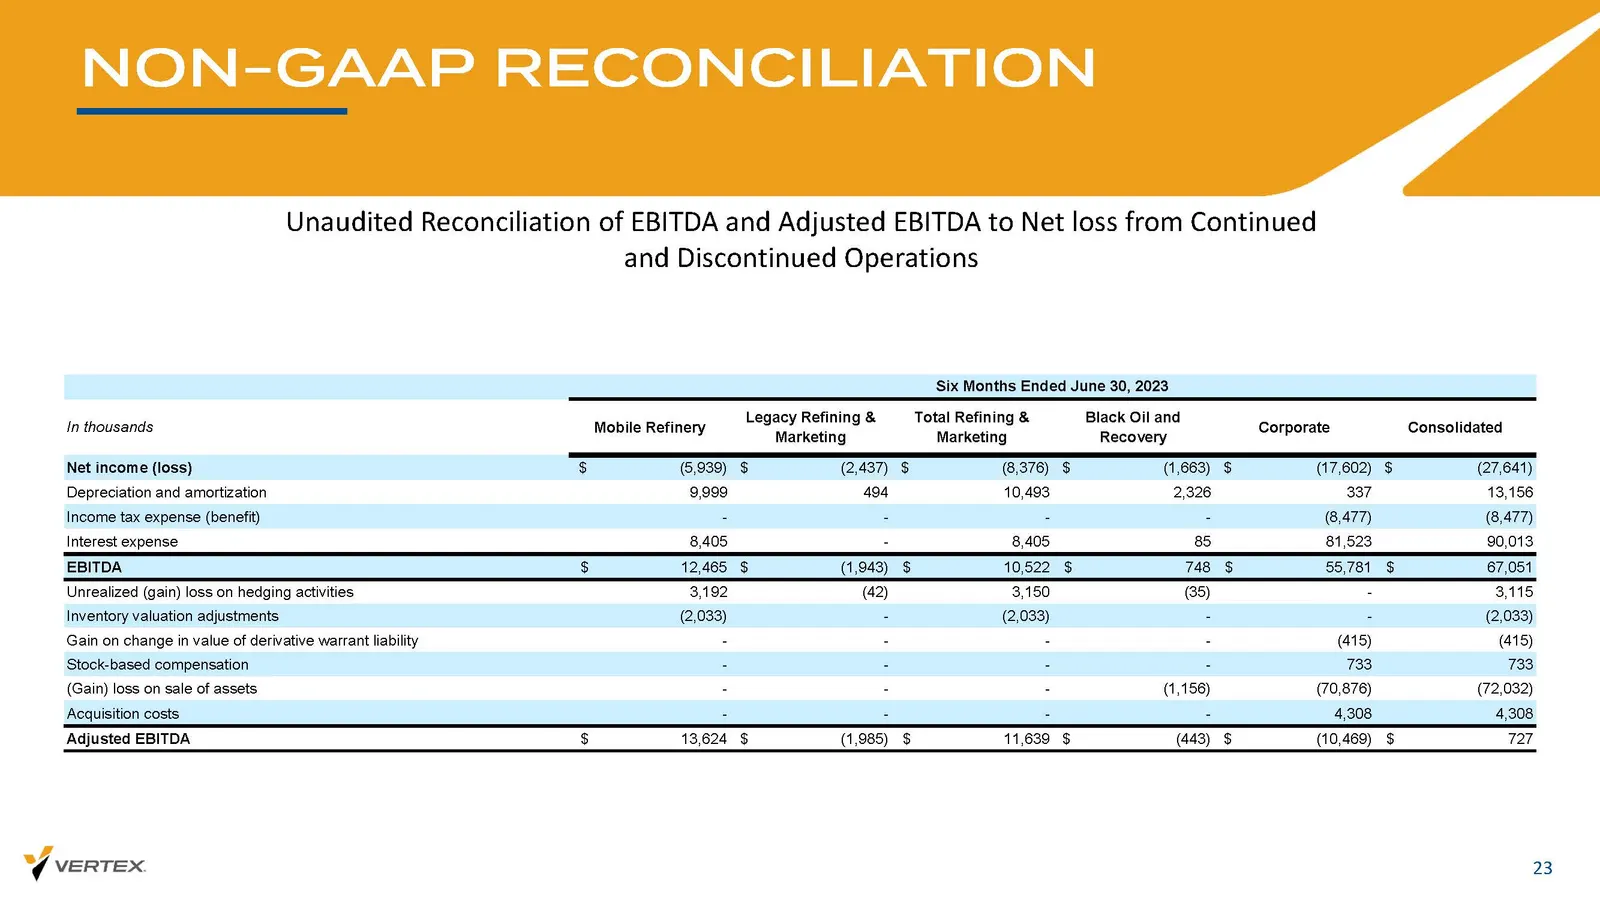
NON - GAAP RECONCILIATION 23 Unaudited Reconciliation of EBITDA and Adjusted EBITDA to Net loss from Continued and Discontinued Operations
Slide 24: Non-GAAP Reconciliation: EBITDA and Adjusted EBITDA
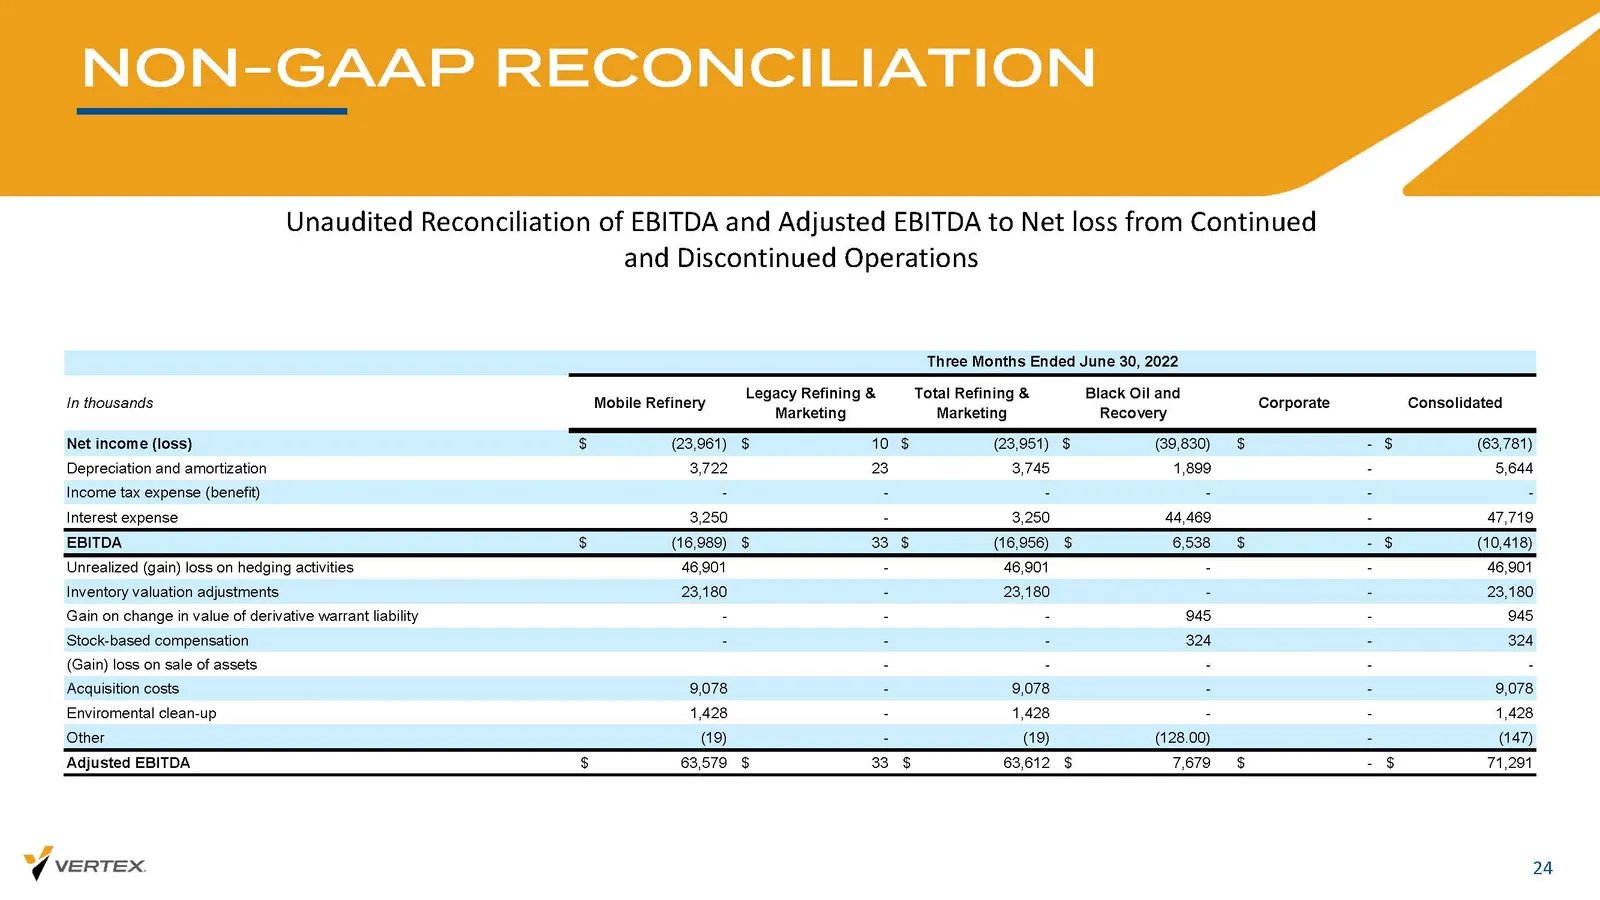
NON - GAAP RECONCILIATION 24 Unaudited Reconciliation of EBITDA and Adjusted EBITDA to Net loss from Continued and Discontinued Operations
Slide 25: Non-GAAP Reconciliation: EBITDA and Adjusted EBITDA
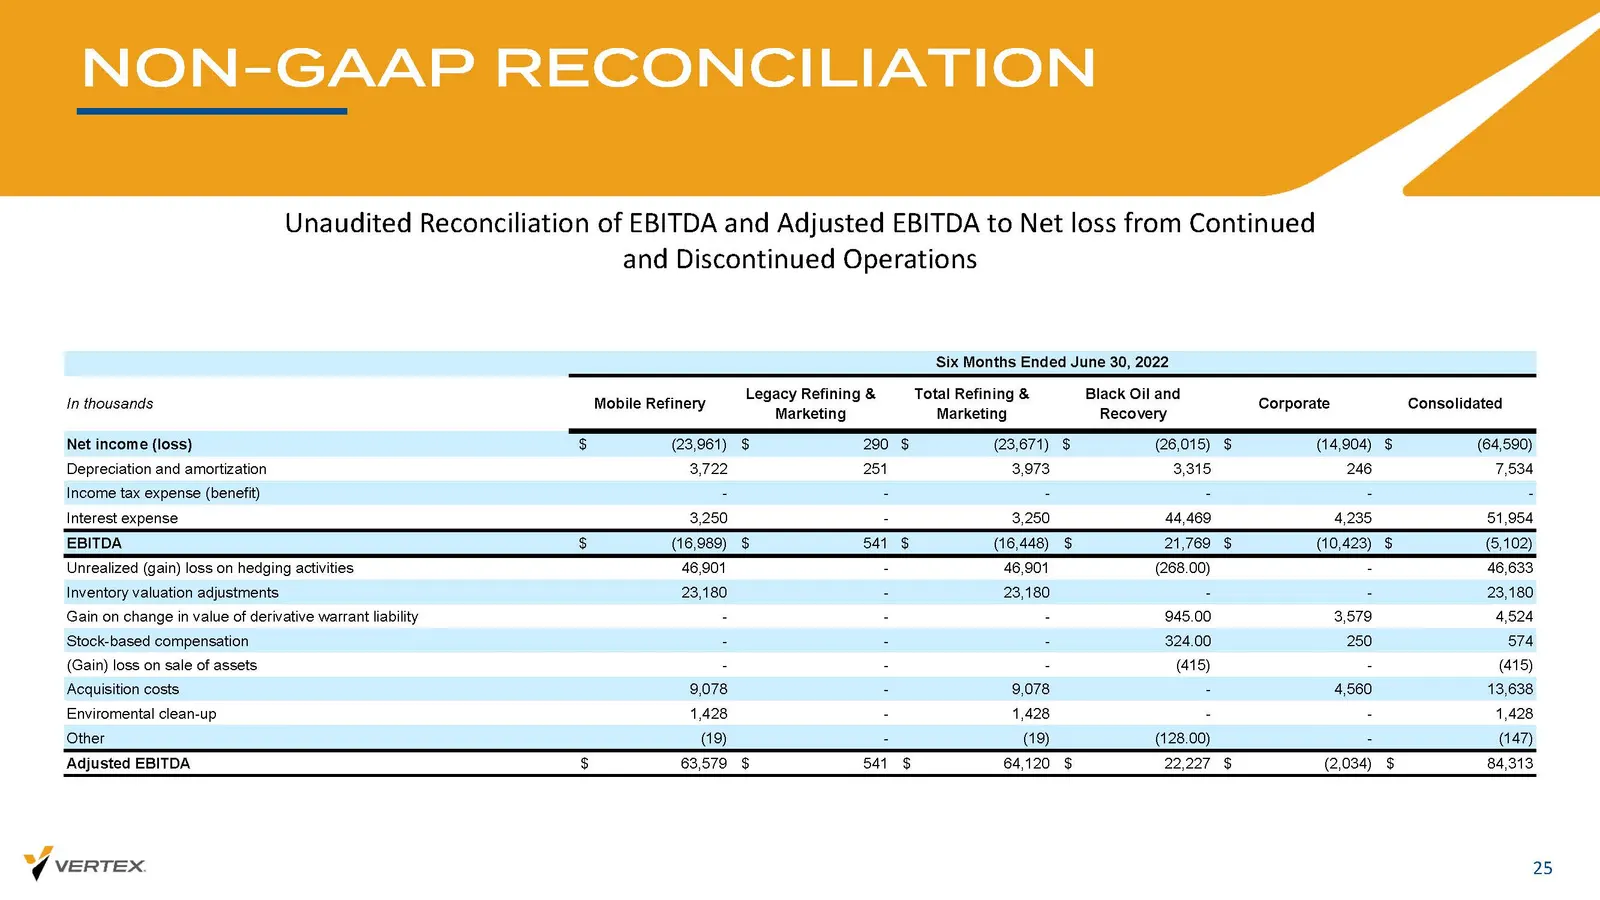
NON - GAAP RECONCILIATION 25 Unaudited Reconciliation of EBITDA and Adjusted EBITDA to Net loss from Continued and Discontinued Operations In thousands Mobile Refinery Legacy Refining & Marketing Total Refining & Marketing Black Oil and Recovery Corporate Consolidated Net income (loss) $ (23,961) $
Slide 26: Non-GAAP Reconciliation: Long-Term Debt to Net Long-Term Debt
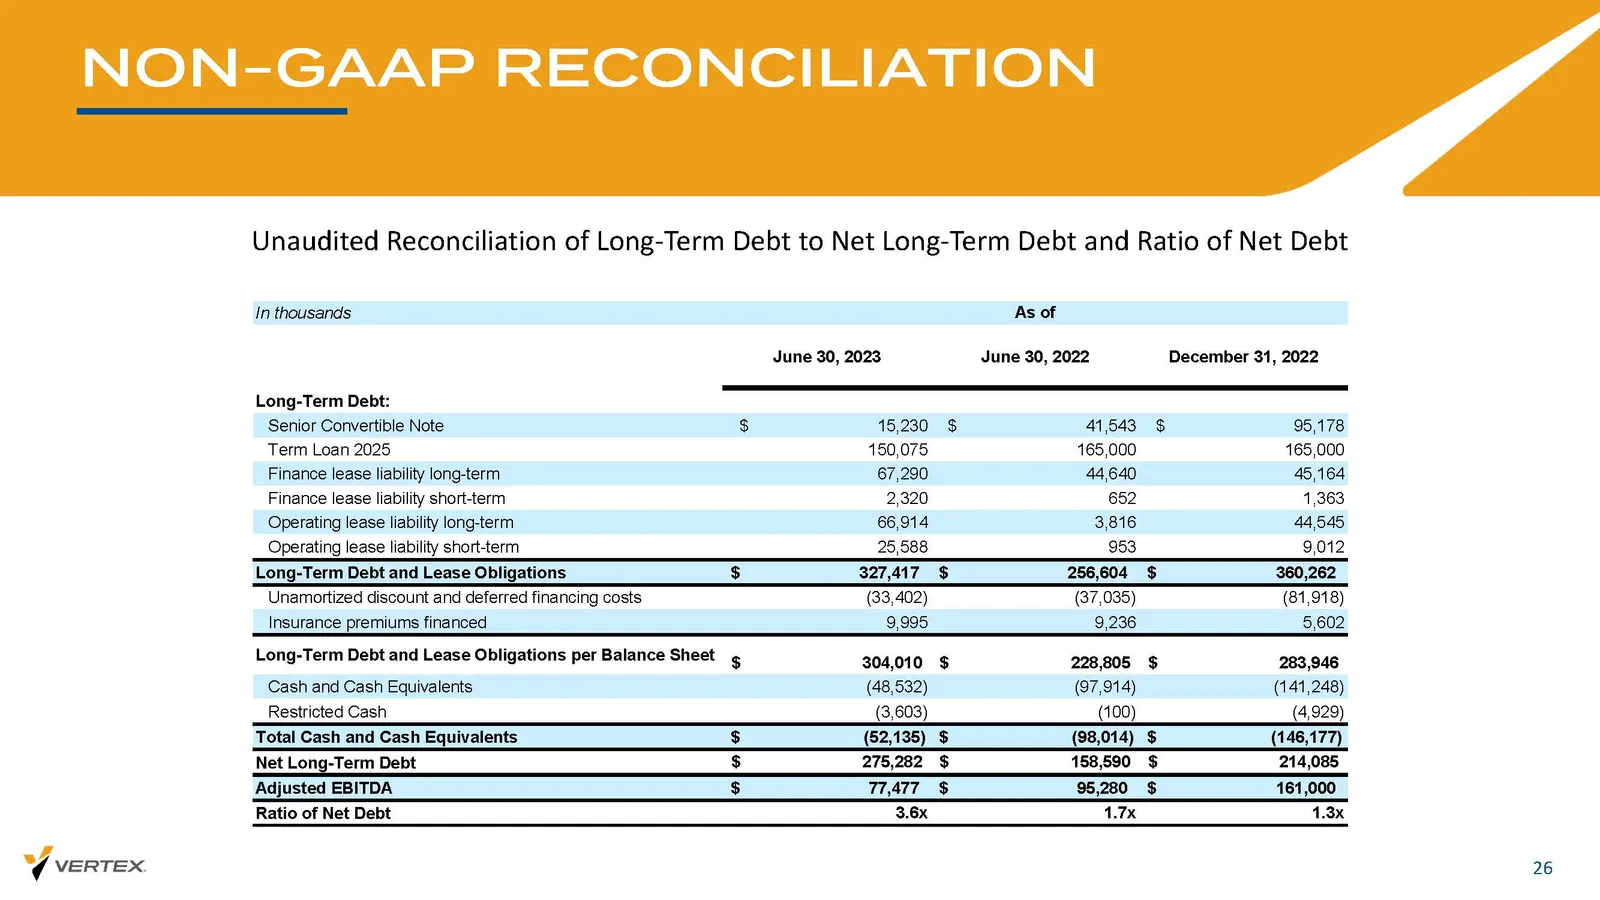
NON - GAAP RECONCILIATION 26 Unaudited Reconciliation of Long - Term Debt to Net Long - Term Debt and Ratio of Net Debt In thousands June 30, 2023 June 30, 2022 December 31, 2022 Long-Term Debt: Senior Convertible Note $ 15,230 $ 41,543 $ 95,178 Term Loan 2025 150,075 165,000 165,000 Finance lease l
Source: SEC EDGAR · 8-K filed Aug 9, 2023
More decks from Vertex Energy Inc
 Q2 2024 Earnings Presentation21 slides · Aug 8, 2024
 Q1 2024 Earnings Presentation20 slides · May 9, 2024
 Q4 2023 Earnings Presentation29 slides · Feb 28, 2024
 Q3 2023 Earnings Presentation27 slides · Nov 7, 2023
 Q1 2023 Earnings Presentation26 slides · May 9, 2023
 Investor Presentation (March 2023)35 slides · Mar 22, 2023