Dilip Buildcon Ltd. · NSE:DBL
Dilip Buildcon — Investor Presentation (October 2016)
37 slides from Dilip Buildcon's investor presentation, October 2016
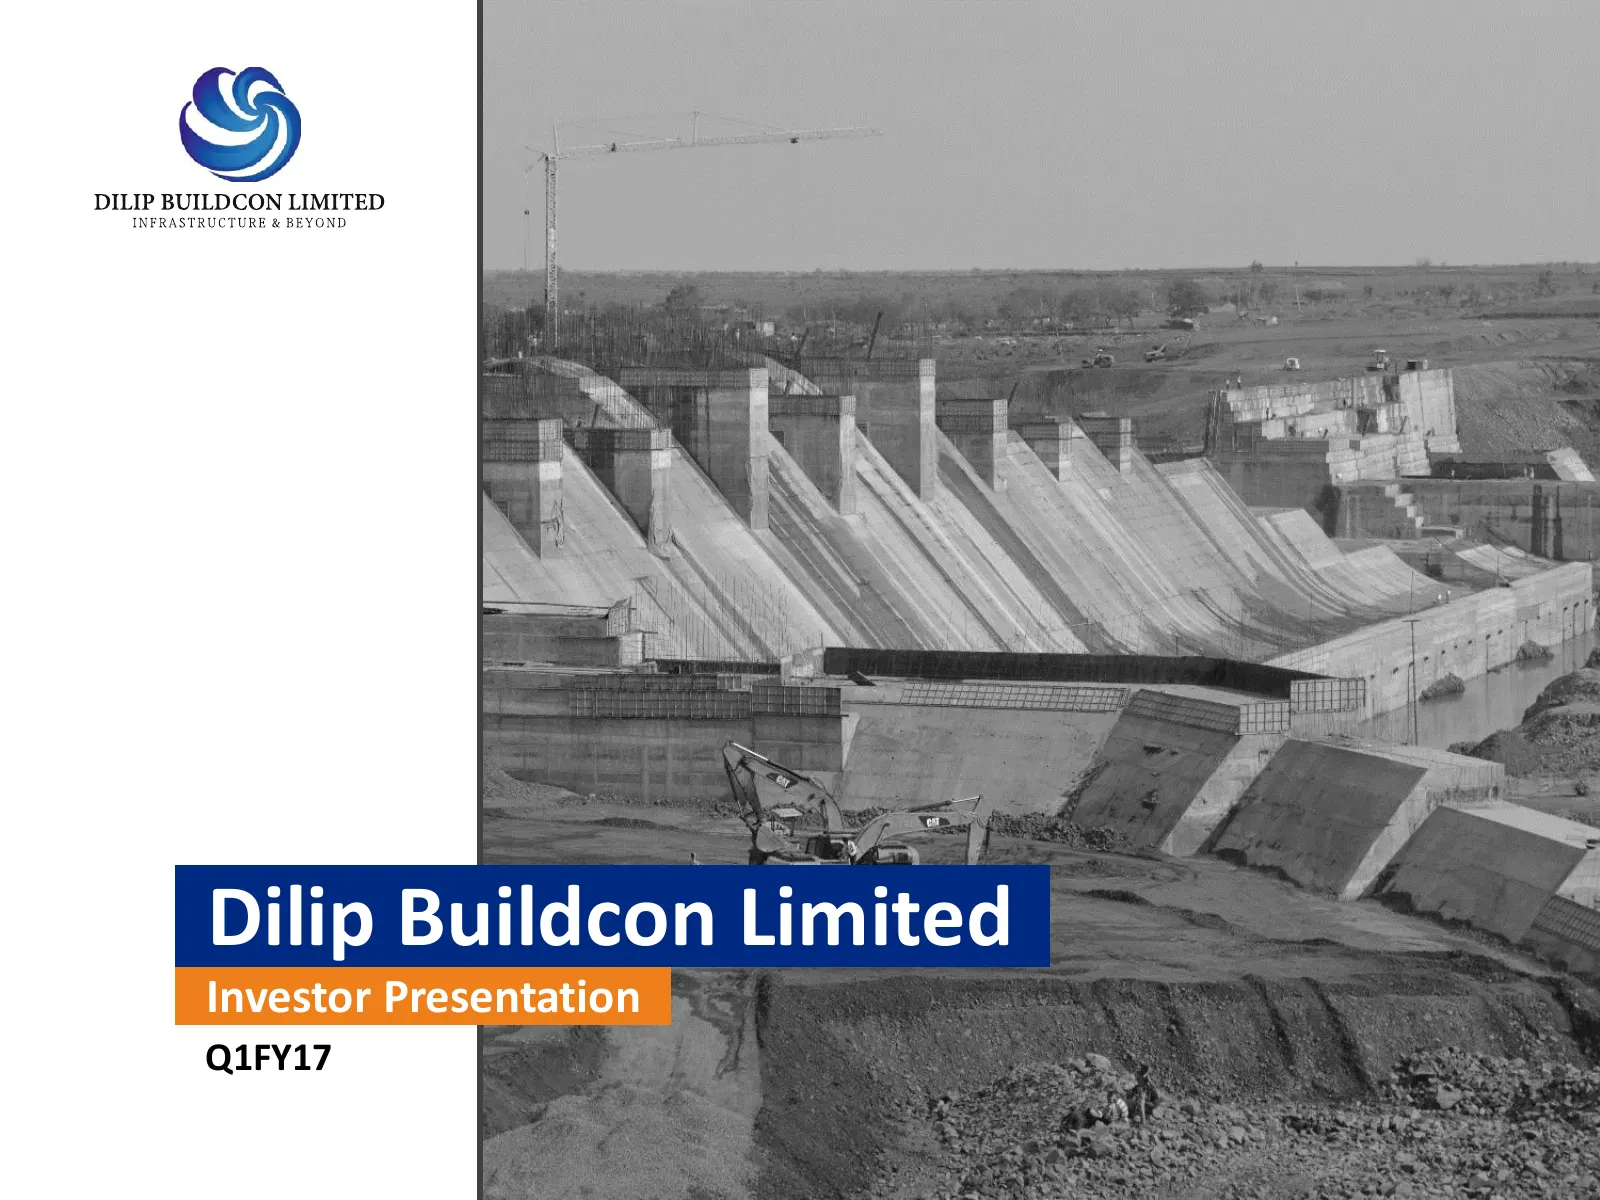
Slide 1: Dilip Buildcon Limited Investor Presentation Q1FY17
Dilip Buildcon Limited Investor Presentation Q1FY17
Slide 2: Safe Harbour
Safe Harbour All statements included or incorporated by reference in this presentation, other than statements or characterizations of historical fact, are forward-looking statements. These forward-looking statements are based on our current expectations, estimates and projections about our industry,
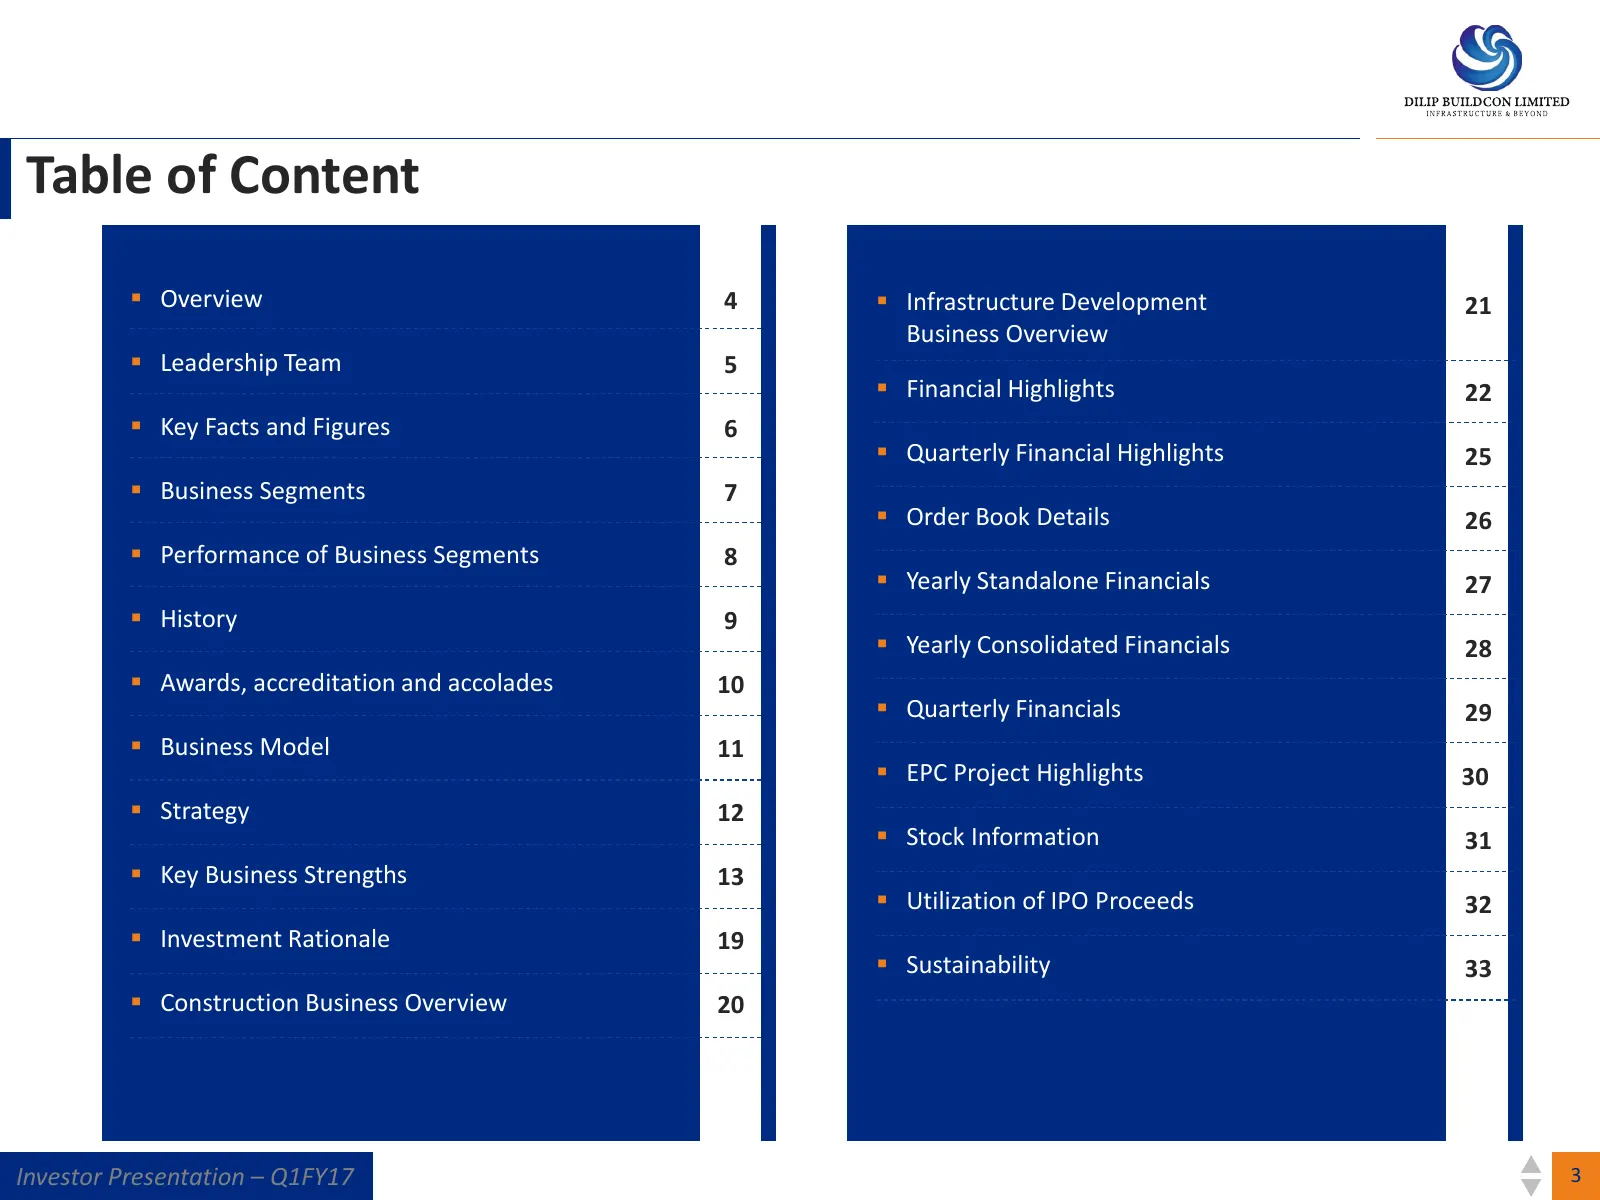
Slide 3: Table of Content
Table of Content Overview 4 Infrastructure Development 21 Business Overview Leadership Team 5 Financial Highlights 22 Key Facts and Figures 6 Quarterly Financial Highlights 25 Business Segments 7 Order Book Details 26 Performance of Business Segments 8 Yearly Standalone Financial
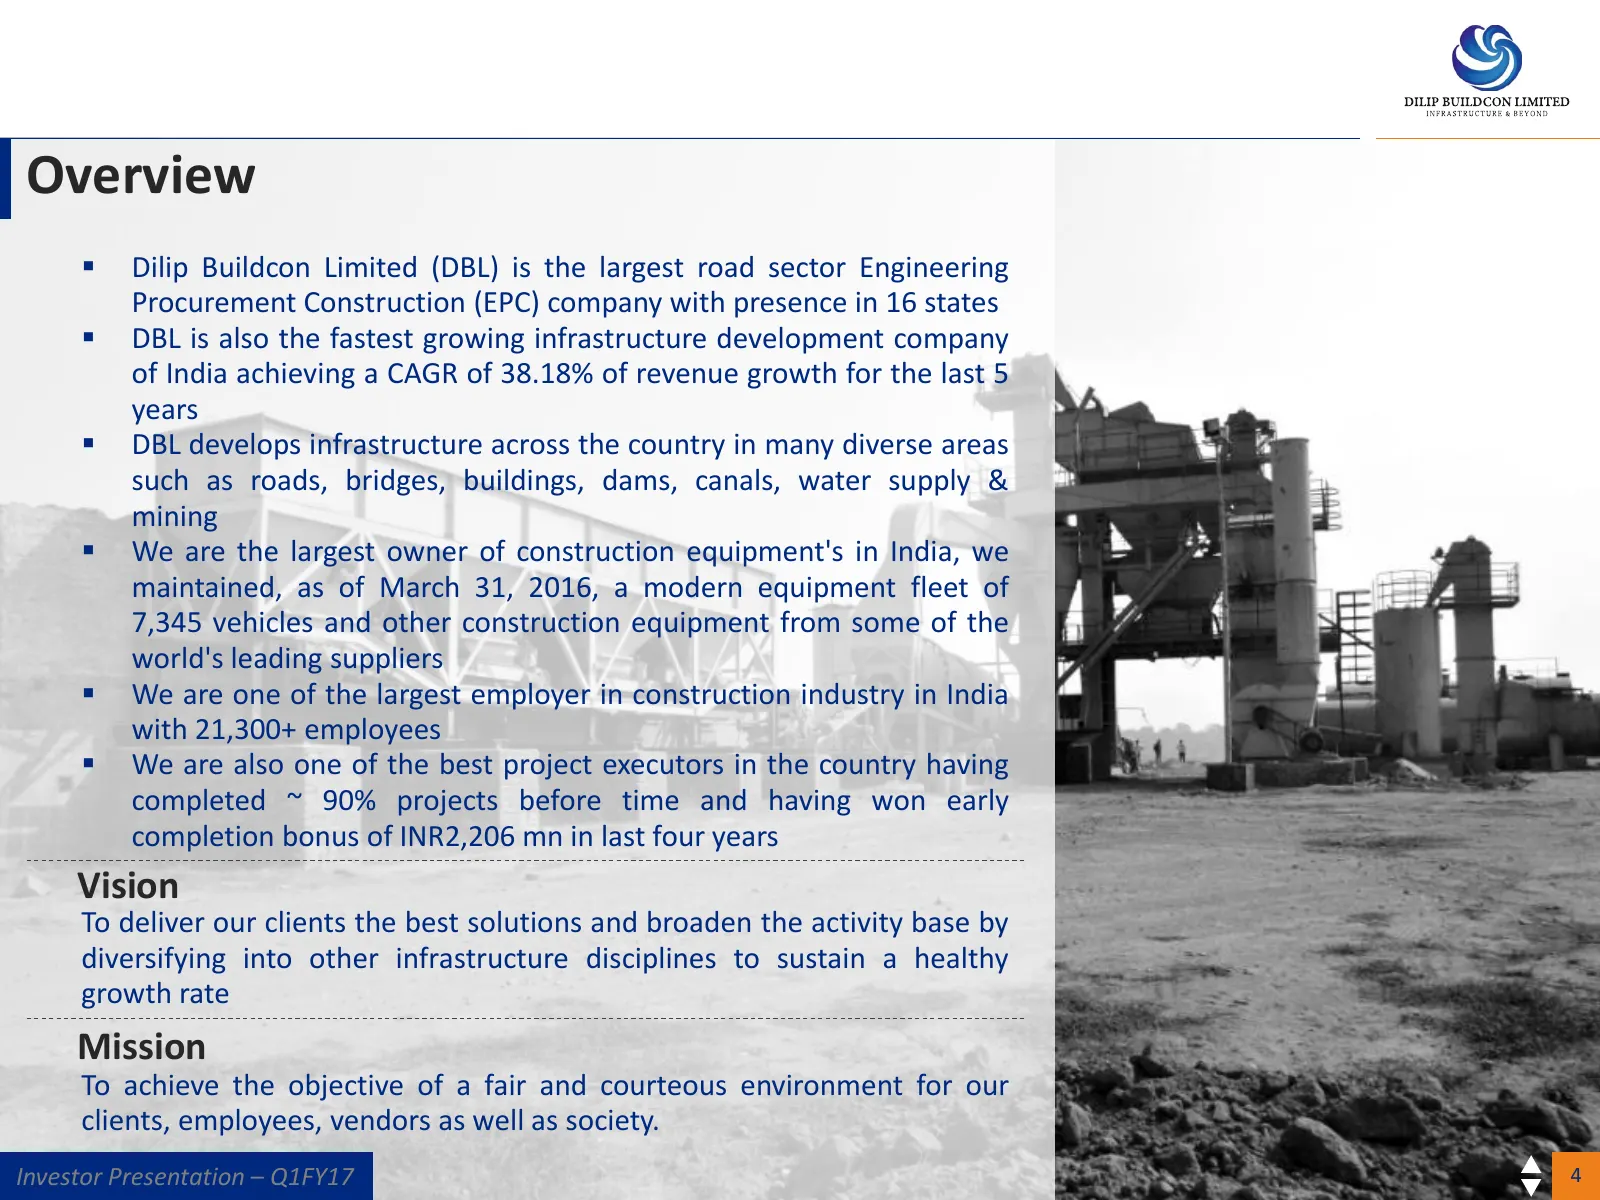
Slide 4: Overview
Overview Dilip Buildcon Limited (DBL) is the largest road sector Engineering Procurement Construction (EPC) company with presence in 16 states DBL is also the fastest growing infrastructure development company of India achieving a CAGR of 38.18% of revenue growth for the last 5 years DBL devel
Slide 5: Leadership team
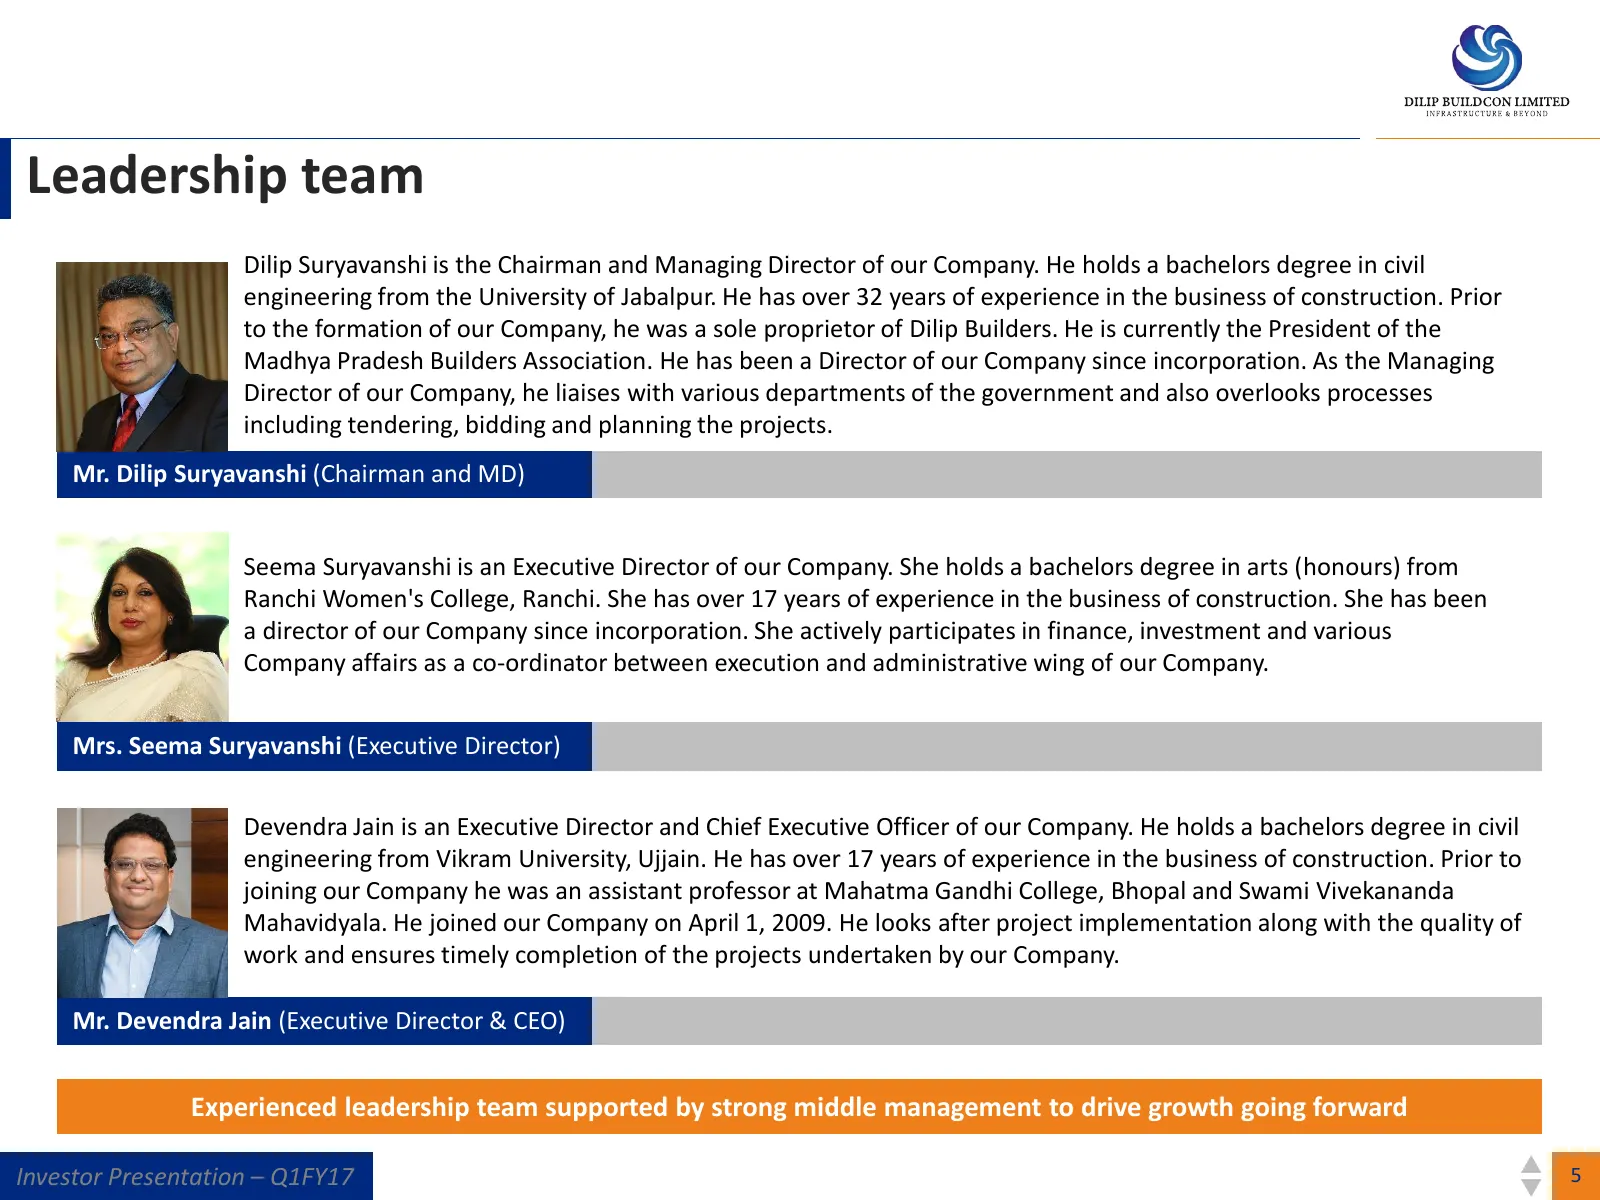
Leadership team Dilip Suryavanshi is the Chairman and Managing Director of our Company. He holds a bachelors degree in civil engineering from the University of Jabalpur. He has over 32 years of experience in the business of construction. Prior to the formation of our Company, he was a sole proprieto
Slide 6: FY16 Key Facts and Figures (INR)
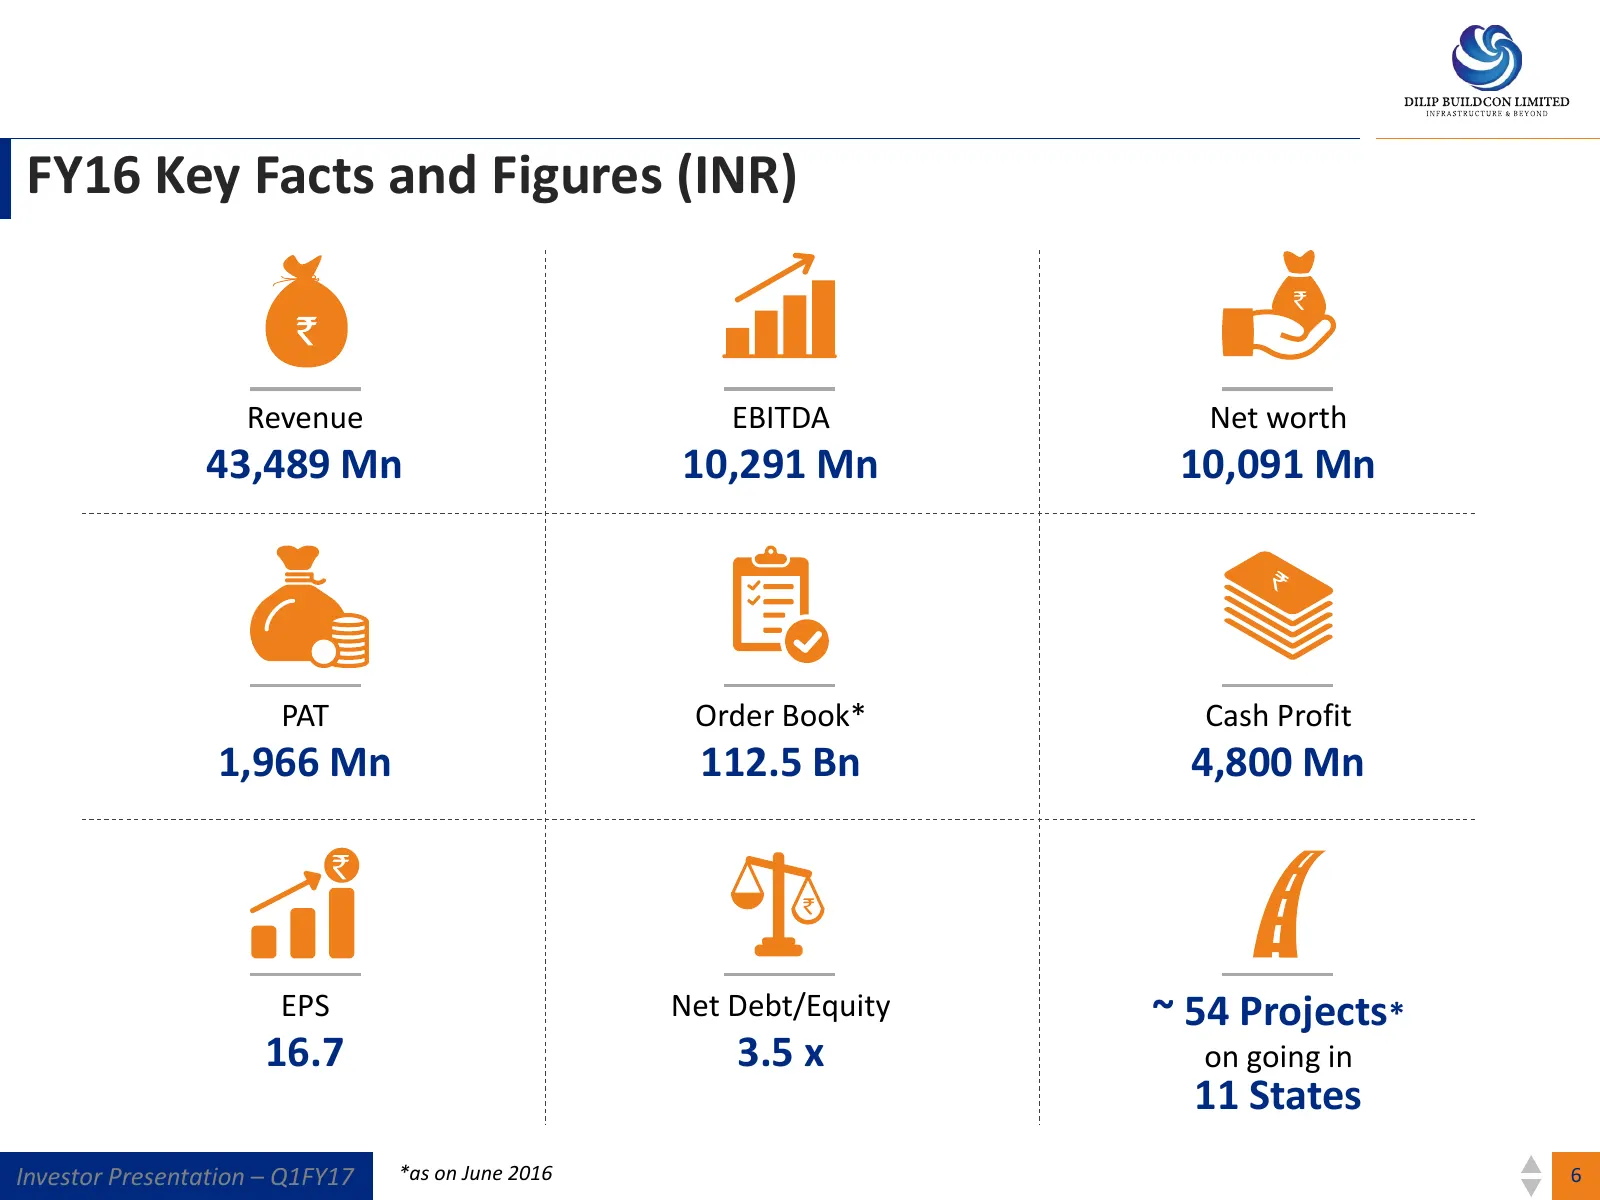
FY16 Key Facts and Figures (INR) Revenue EBITDA Net worth 43,489 Mn 10,291 Mn 10,091 Mn PAT Order Book* Cash Profit 1,966 Mn 112.5 Bn 4,800 Mn EPS Net Debt/Equity ~ 54 Projects* 16.7 3.5 x on going in 11 States Investor Presentation – Q1FY17 *as on June 2016 6
Slide 7: Business Segments
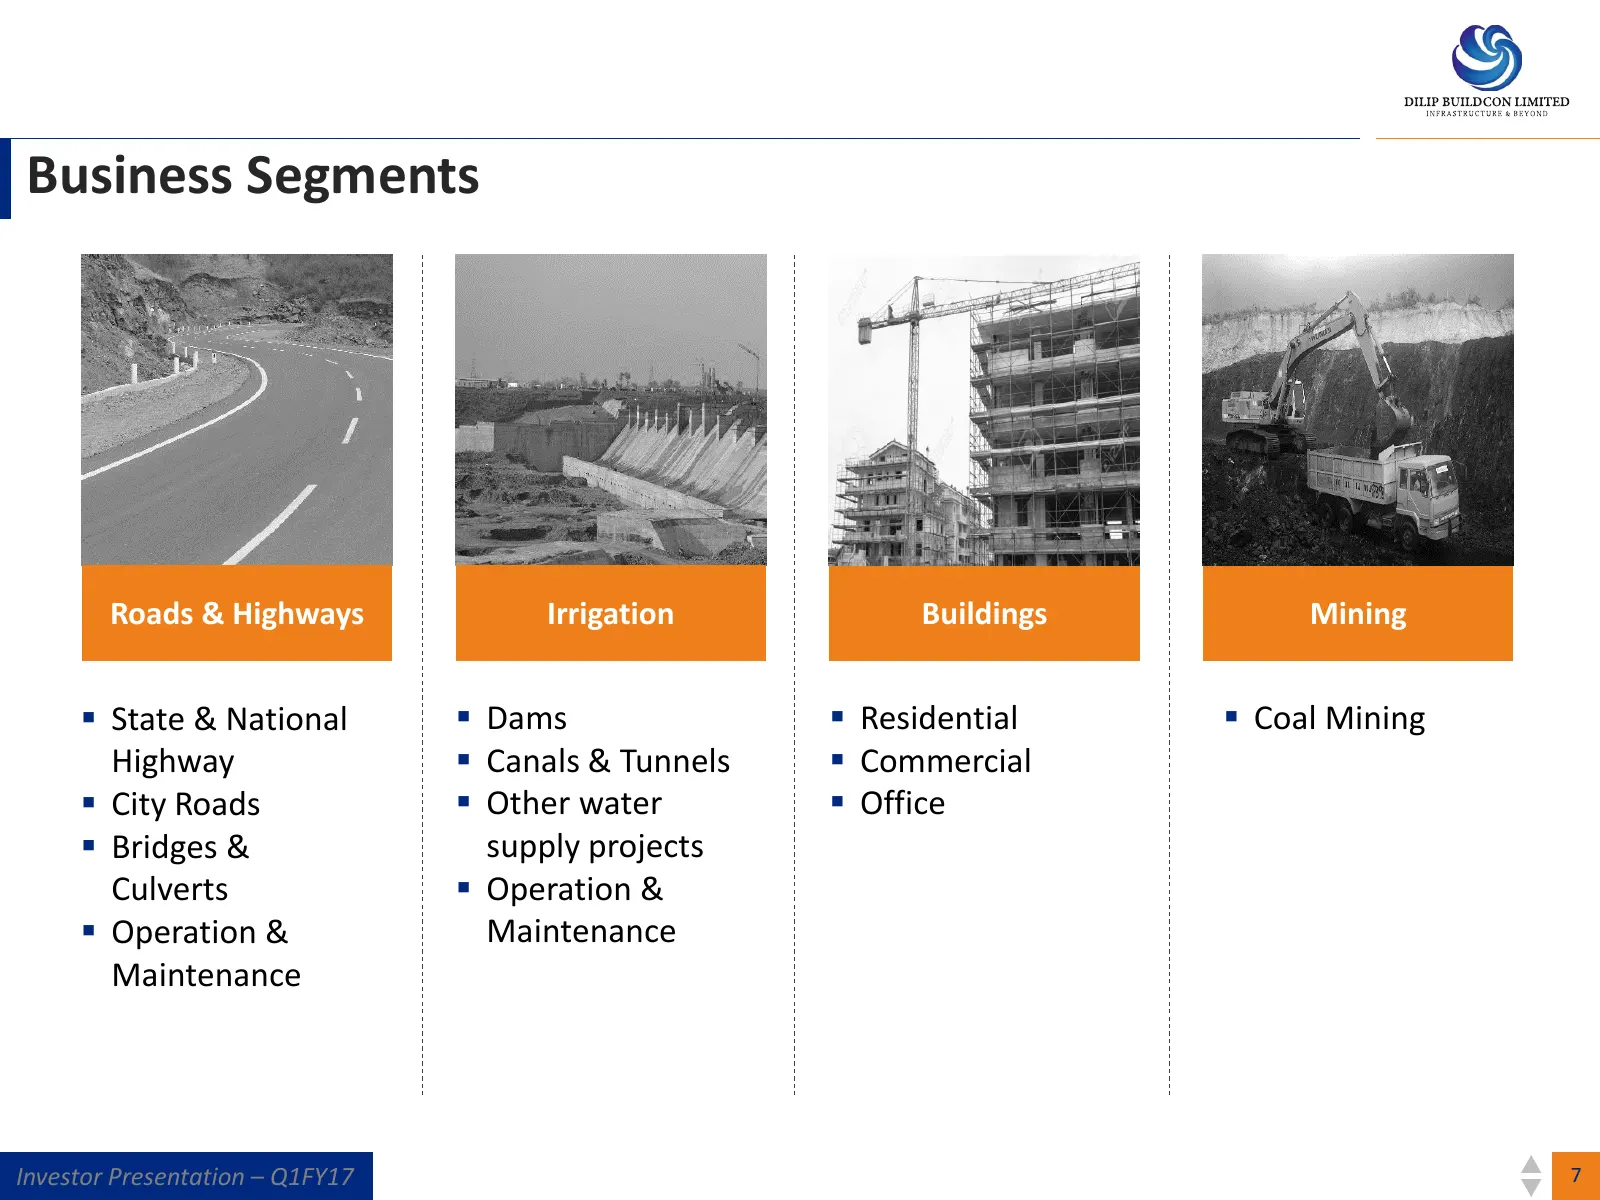
Business Segments Roads & Highways Irrigation Buildings Mining State & National Dams Residential Coal Mining Highway Canals & Tunnels Commercial City Roads Other water Office Bridges & supply projects Culverts Operation & Operation & Maintenance Maintenance Investor Presentat
Slide 8: FY16 Performance of Business Segments
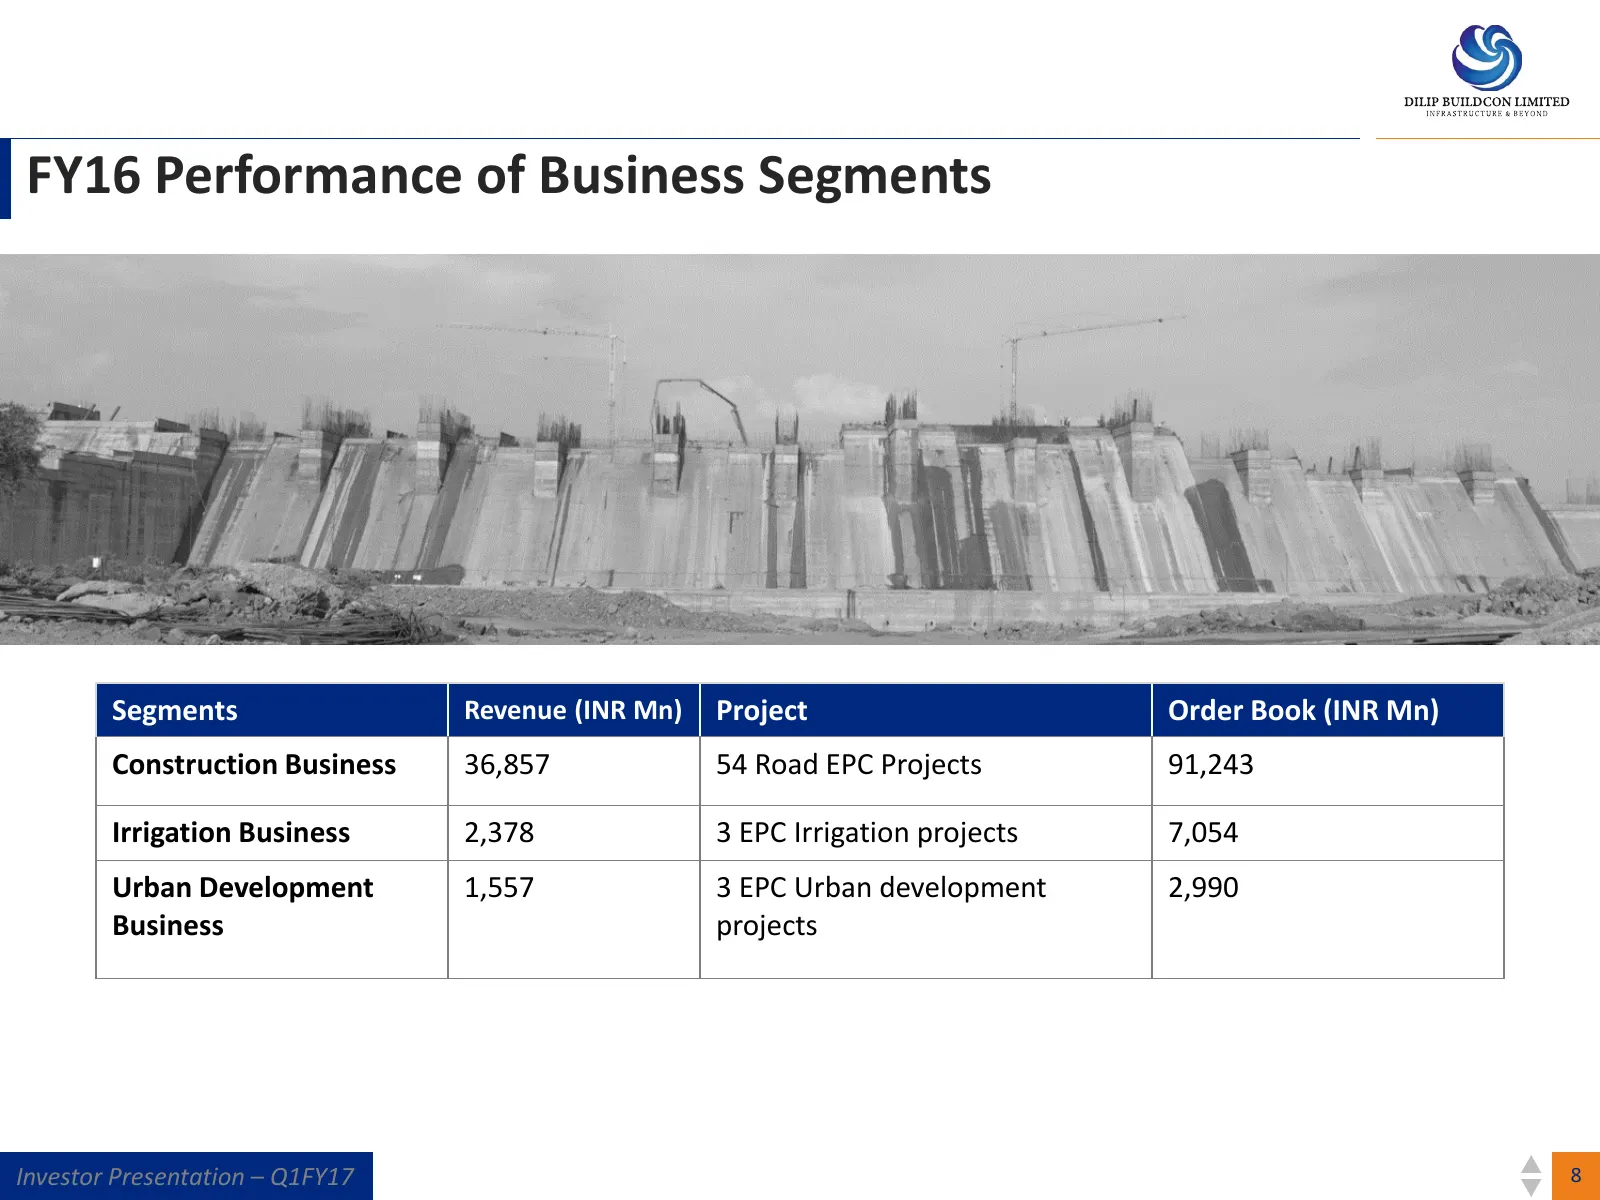
FY16 Performance of Business Segments Segments Revenue (INR Mn) Project Order Book (INR Mn) Construction Business 36,857 54 Road EPC Projects 91,243 Irrigation Business 2,378 3 EPC Irrigation projects 7,054 Urban Development 1,557 3 EPC Urban development 2,990 Business projects Investor Presentation
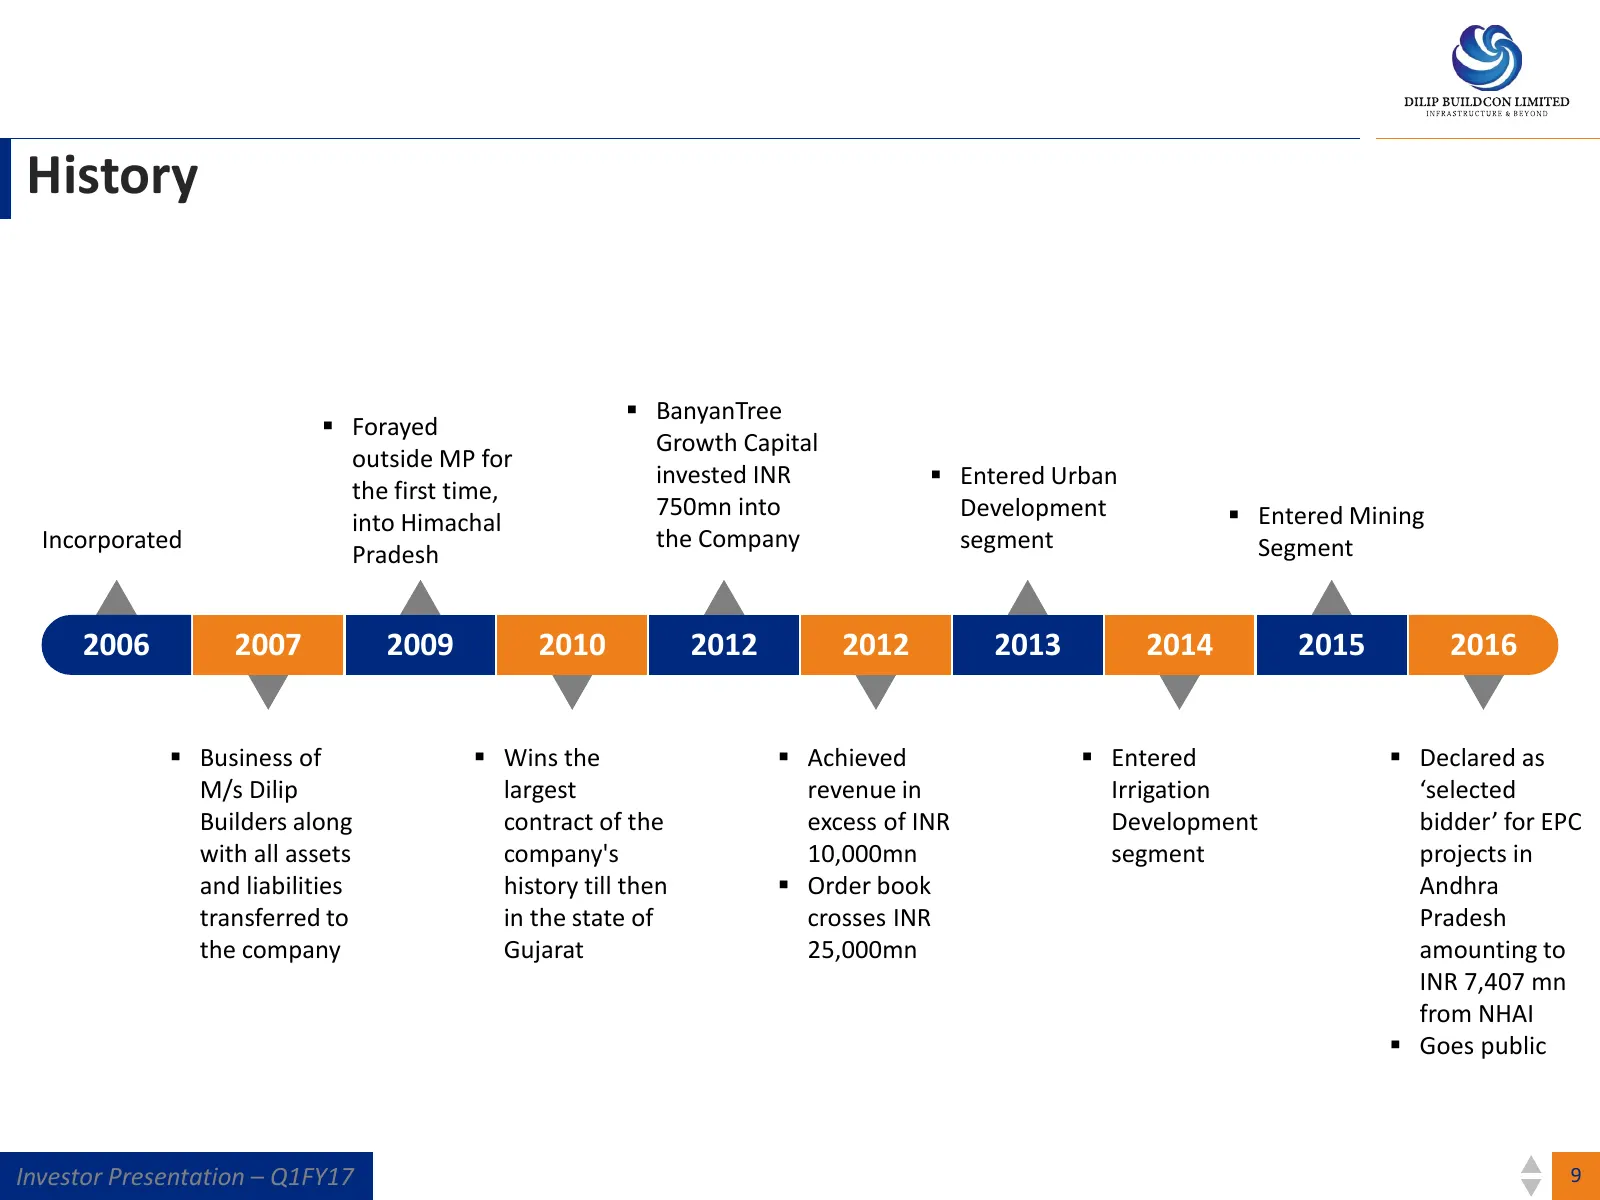
Slide 9: History
History BanyanTree Forayed Growth Capital outside MP for invested INR Entered Urban the first time, 750mn into Development Entered Mining into Himachal Incorporated the Company segment Segment Pradesh 2006 2007 2009 2010 2012 2012 2013 2014 2015 2016 Business of Wins the Achieved Ent
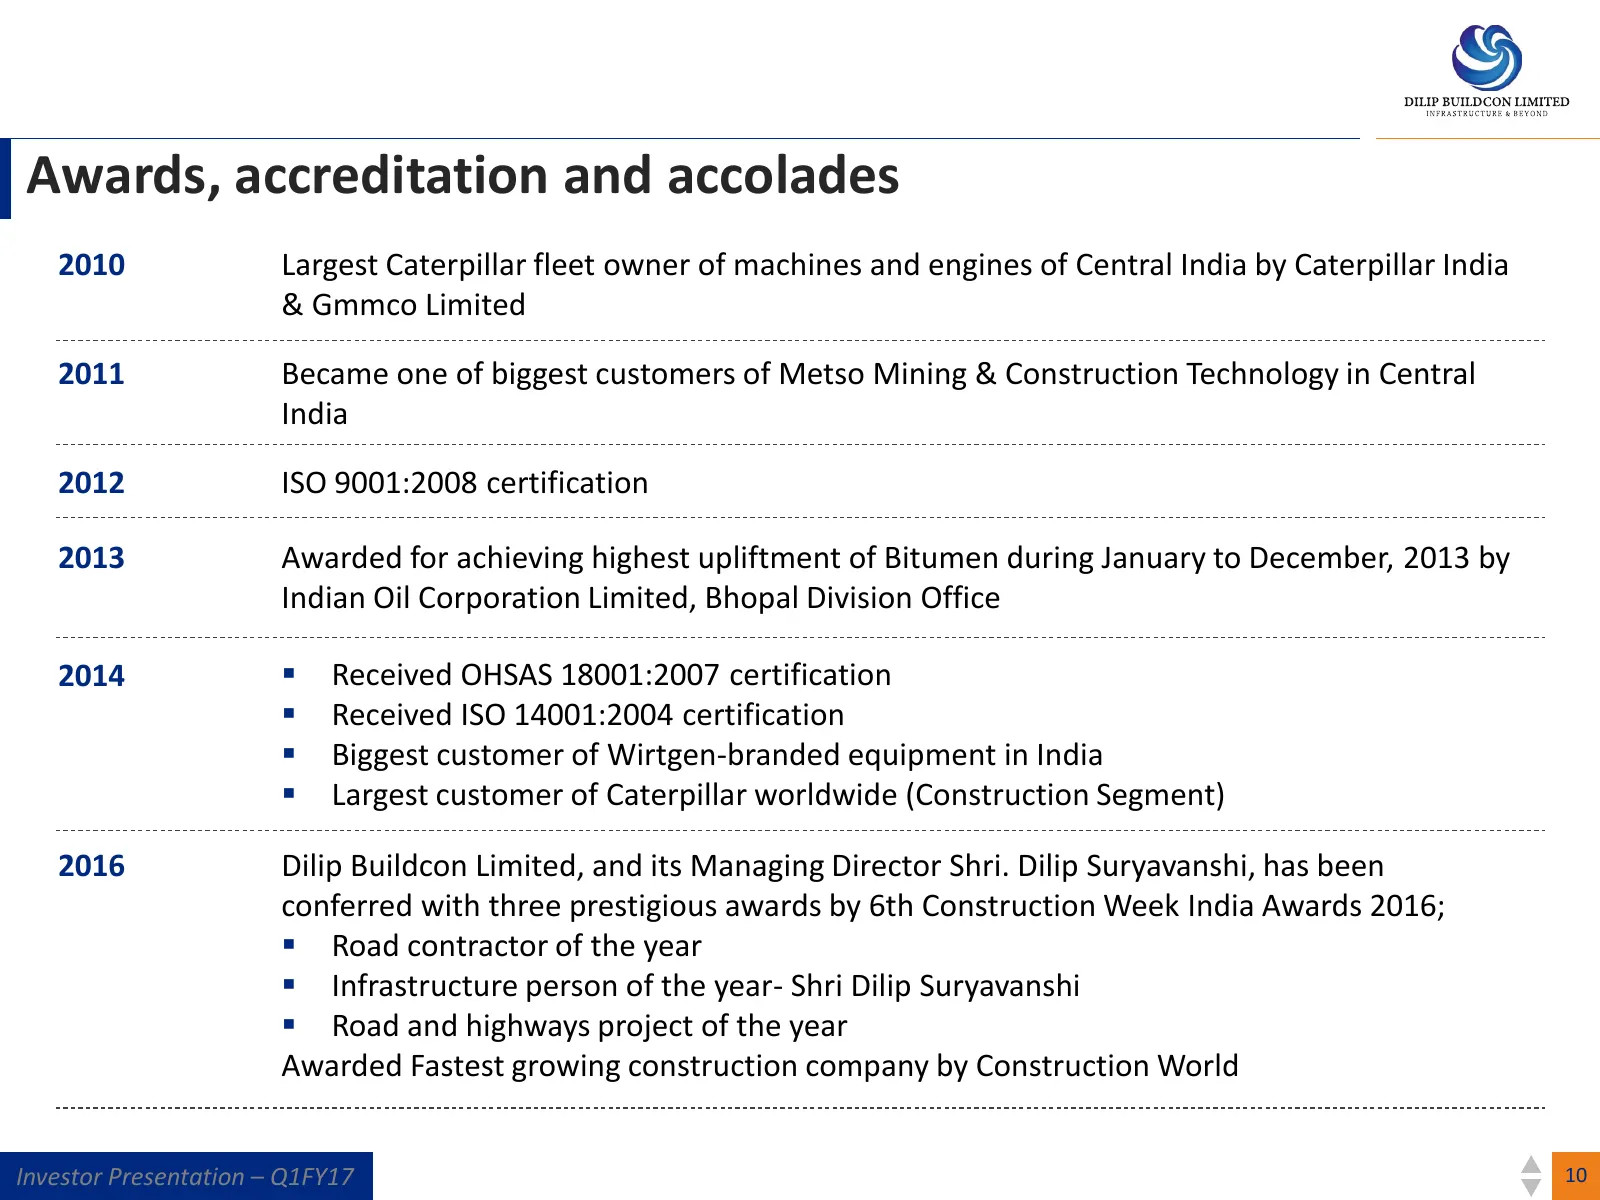
Slide 10: Awards, accreditation and accolades
Awards, accreditation and accolades 2010 Largest Caterpillar fleet owner of machines and engines of Central India by Caterpillar India & Gmmco Limited 2011 Became one of biggest customers of Metso Mining & Construction Technology in Central India 2012 ISO 9001:2008 certification 2013 Awarded for ach
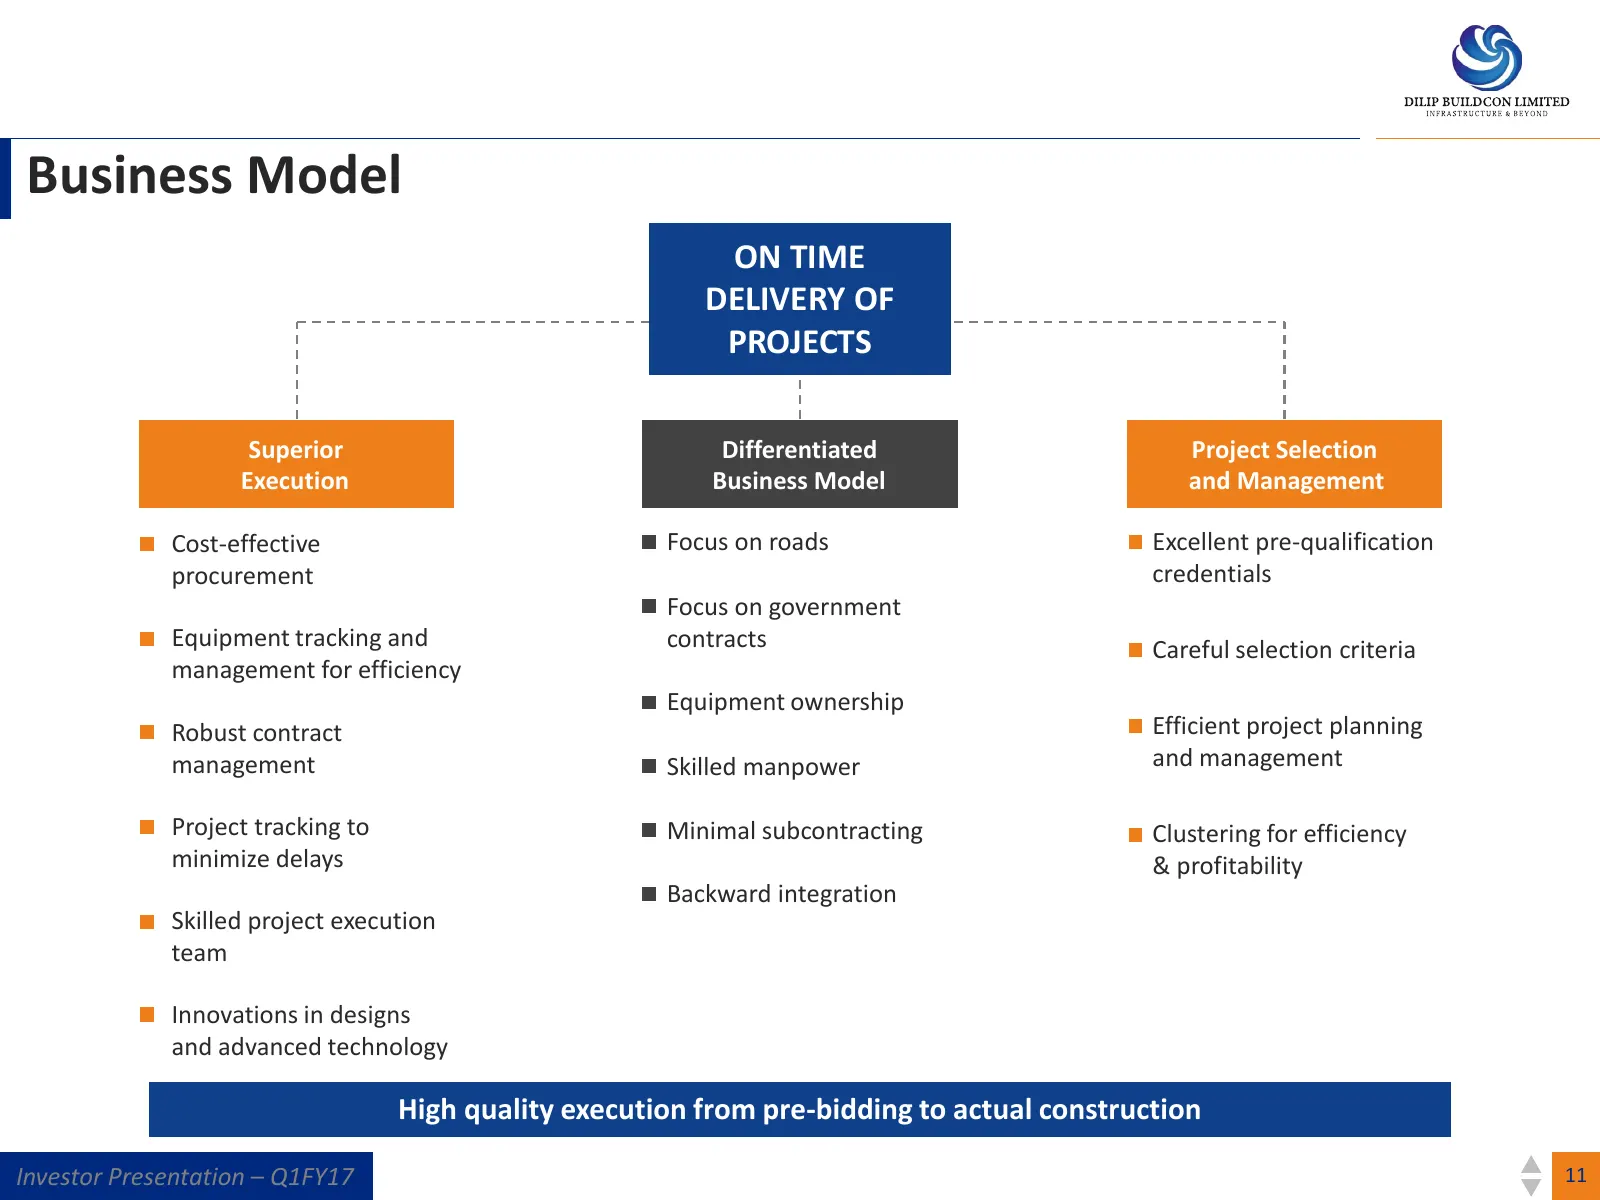
Slide 11: Business Model
Business Model ON TIME DELIVERY OF PROJECTS Superior Differentiated Project Selection Execution Business Model and Management Cost-effective Focus on roads Excellent pre-qualification procurement credentials Focus on government Equipment tracking and contracts Careful selection criteria management f
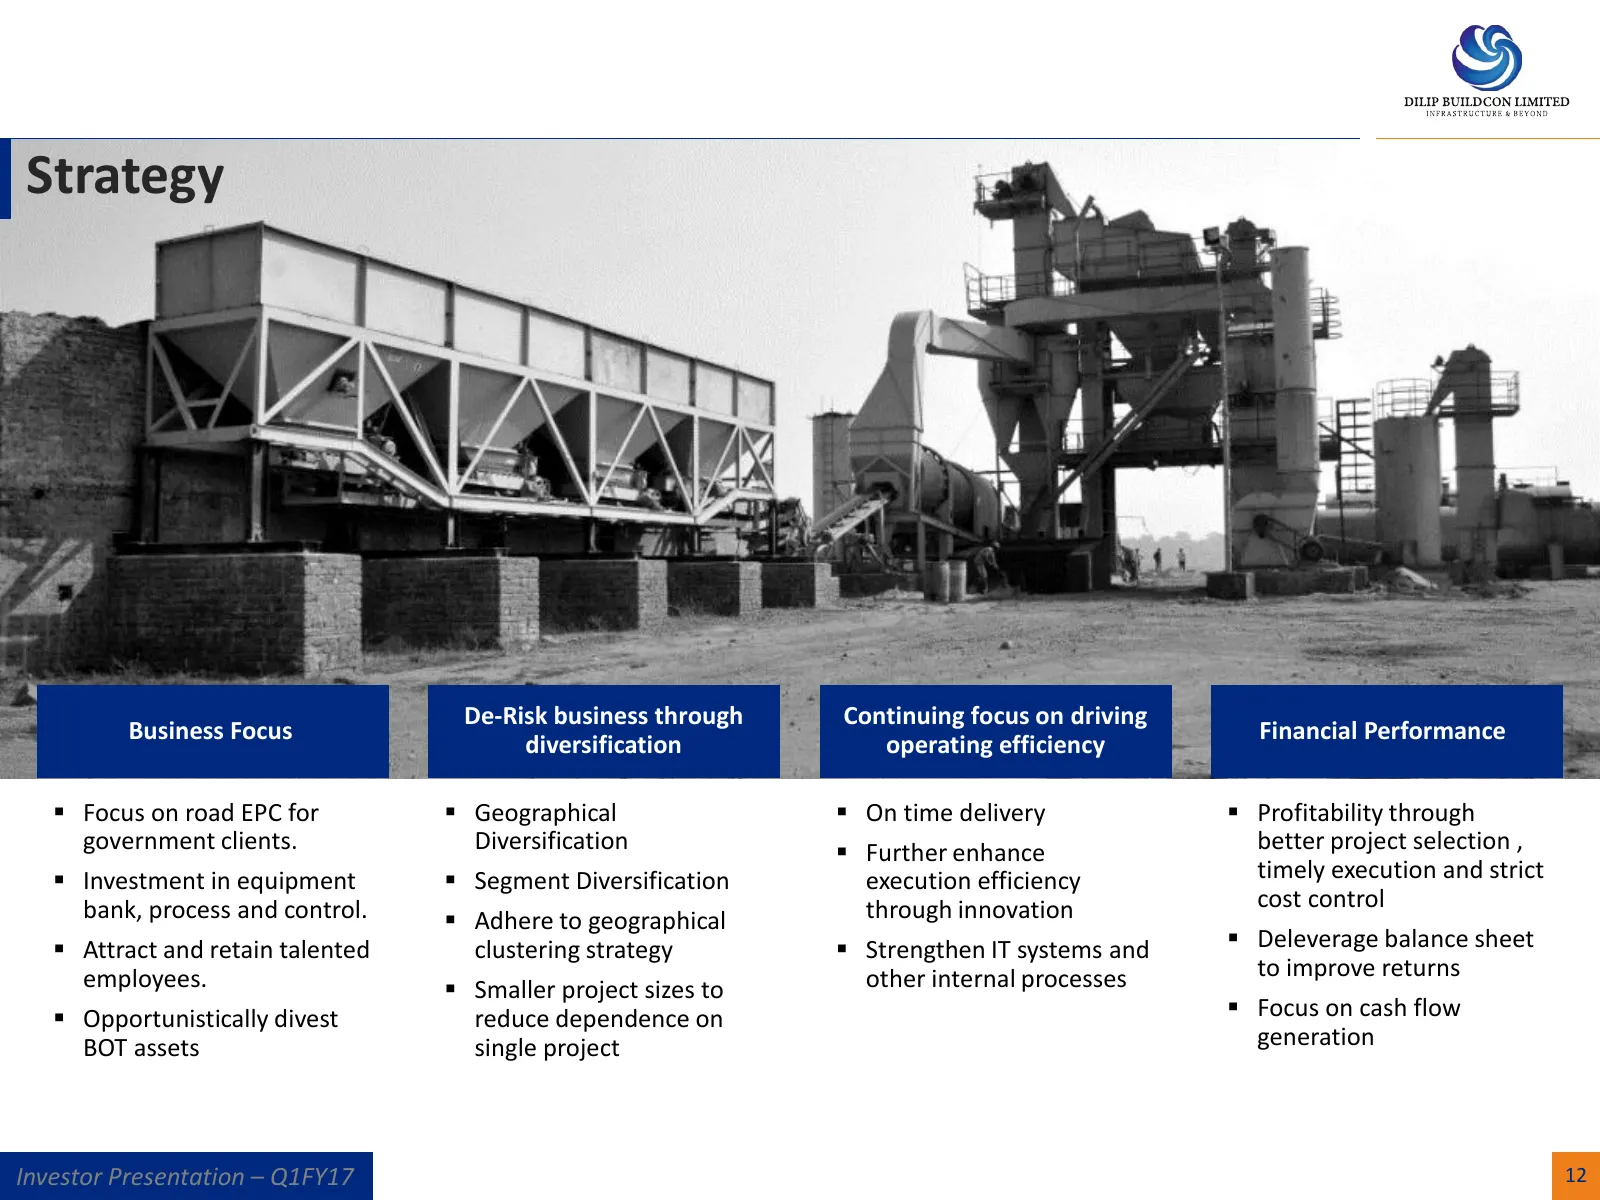
Slide 12: Strategy
Strategy De-Risk business through Continuing focus on driving Business Focus Financial Performance diversification operating efficiency Focus on road EPC for Geographical On time delivery Profitability through government clients. Diversification Further enhance better project selection ,
Slide 13: Key Business Strengths
ot Key Business Strengths |
Slide 14: 1. Project execution
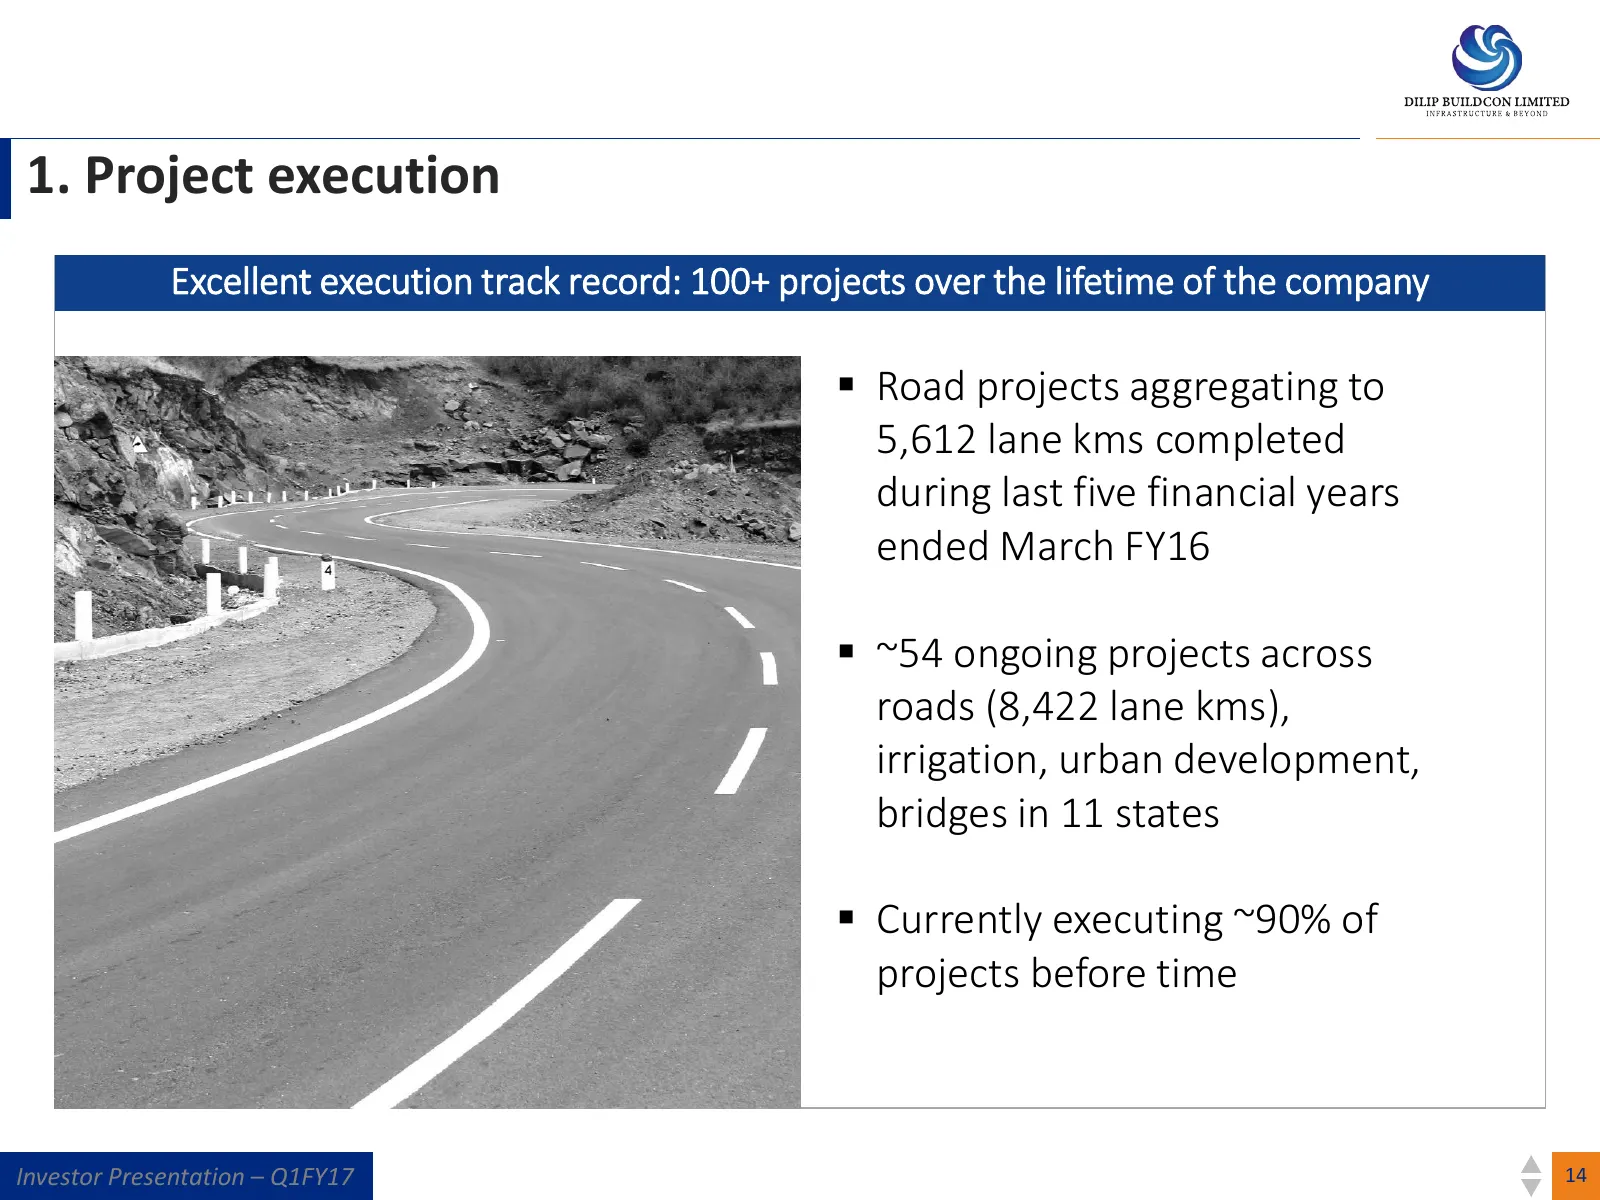
1. Project execution Excellent execution track record: 100+ projects over the lifetime of the company Road projects aggregating to 5,612 lane kms completed during last five financial years ended March FY16 ~54 ongoing projects across roads (8,422 lane kms), irrigation, urban development, bridges
Slide 15: Pan India Project Execution Capability
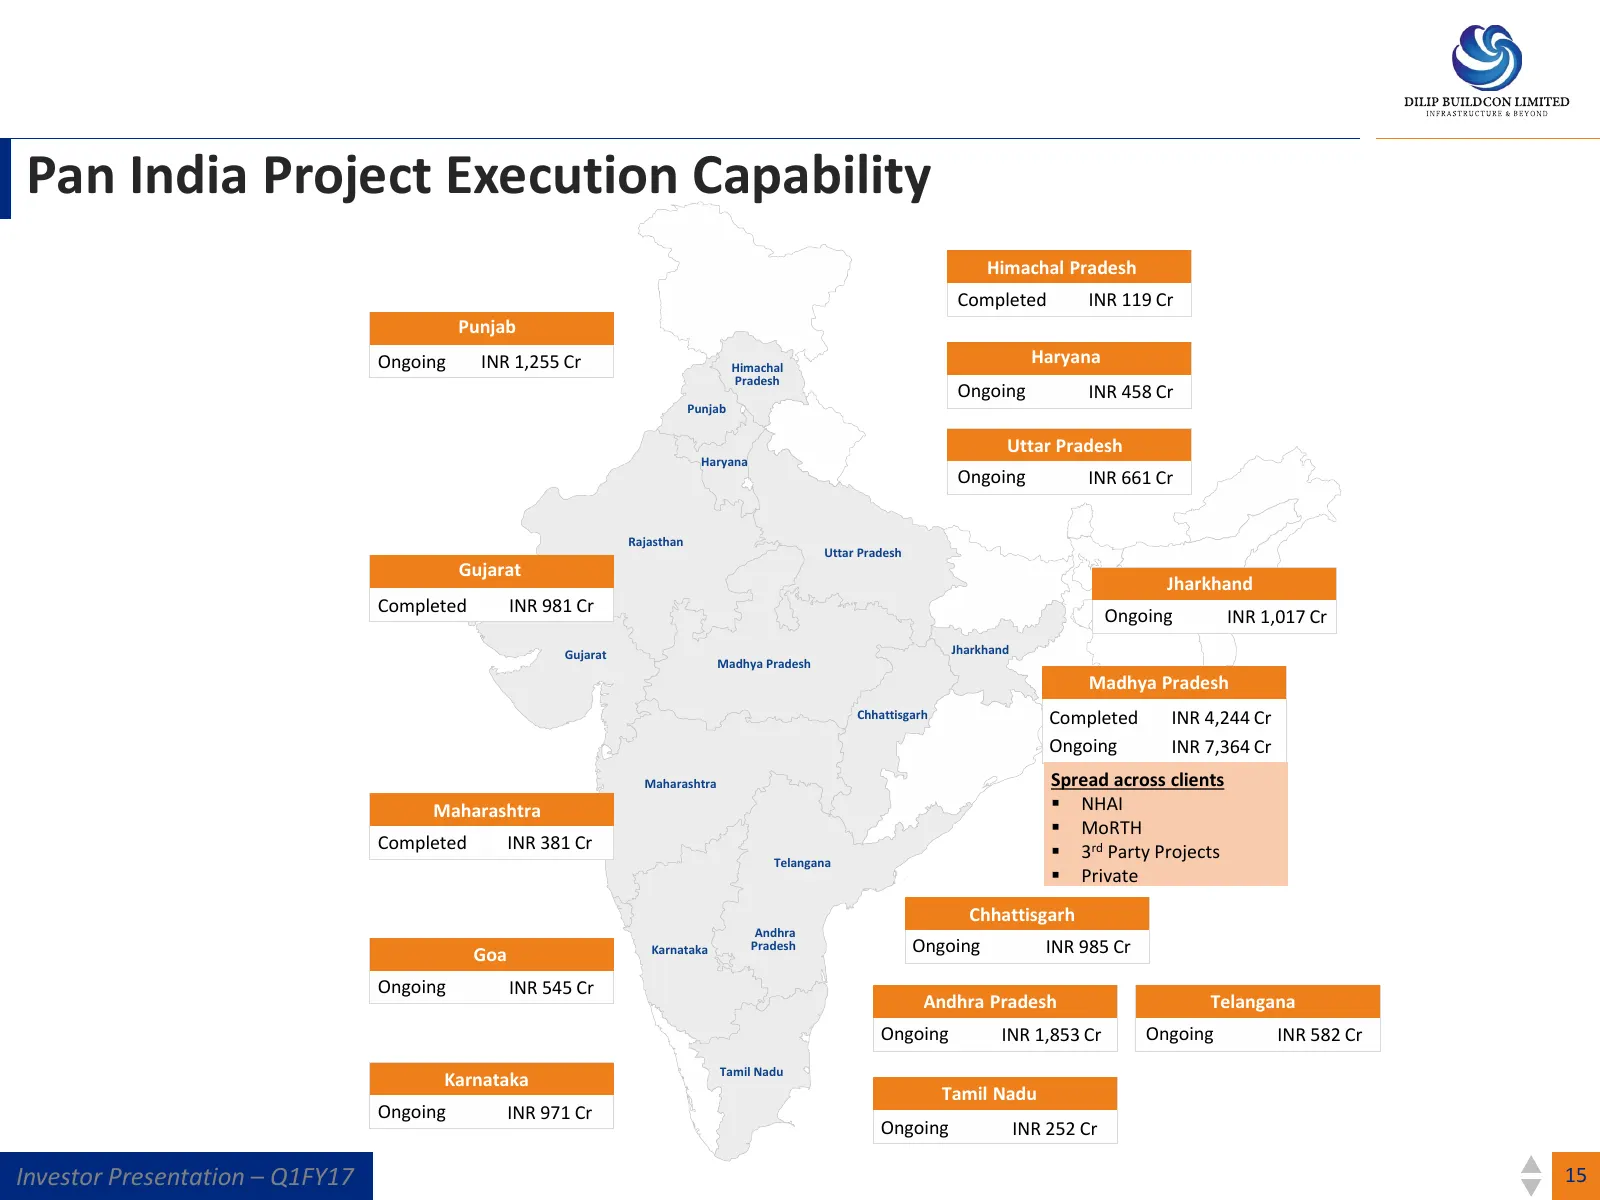
Pan India Project Execution Capability Himachal Pradesh Completed INR 119 Cr Punjab Ongoing INR 1,255 Cr Himachal Haryana Pradesh Ongoing INR 458 Cr Punjab Uttar Pradesh Haryana Ongoing INR 661 Cr Rajasthan Uttar Pradesh Gujarat Jharkhand Completed INR 981 Cr Ongoing INR 1,017 Cr Gujarat Jharkhand M
Slide 16: 2. Equipment ownership for better execution
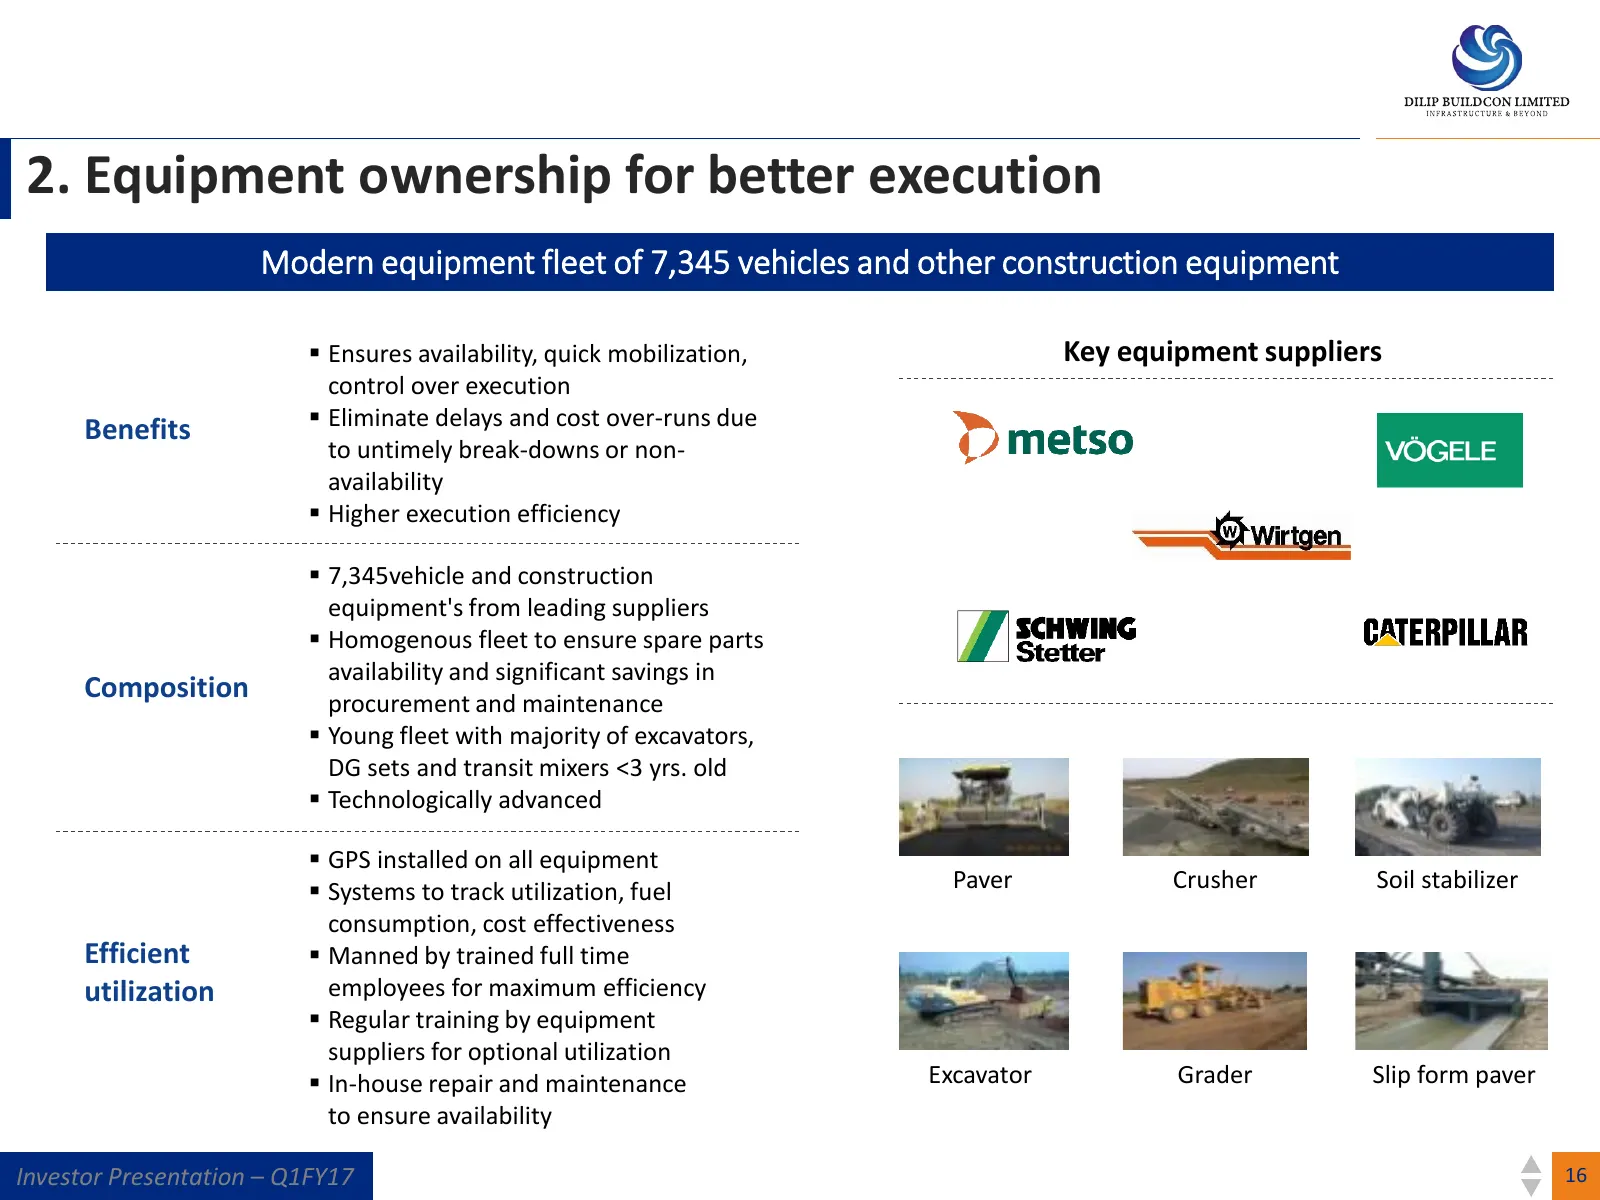
2. Equipment ownership for better execution Modern equipment fleet of 7,345 vehicles and other construction equipment Ensures availability, quick mobilization, Key equipment suppliers control over execution Benefits Eliminate delays and cost over-runs due to untimely break-downs or non- availabi
Slide 17: 3. In-house Execution Team
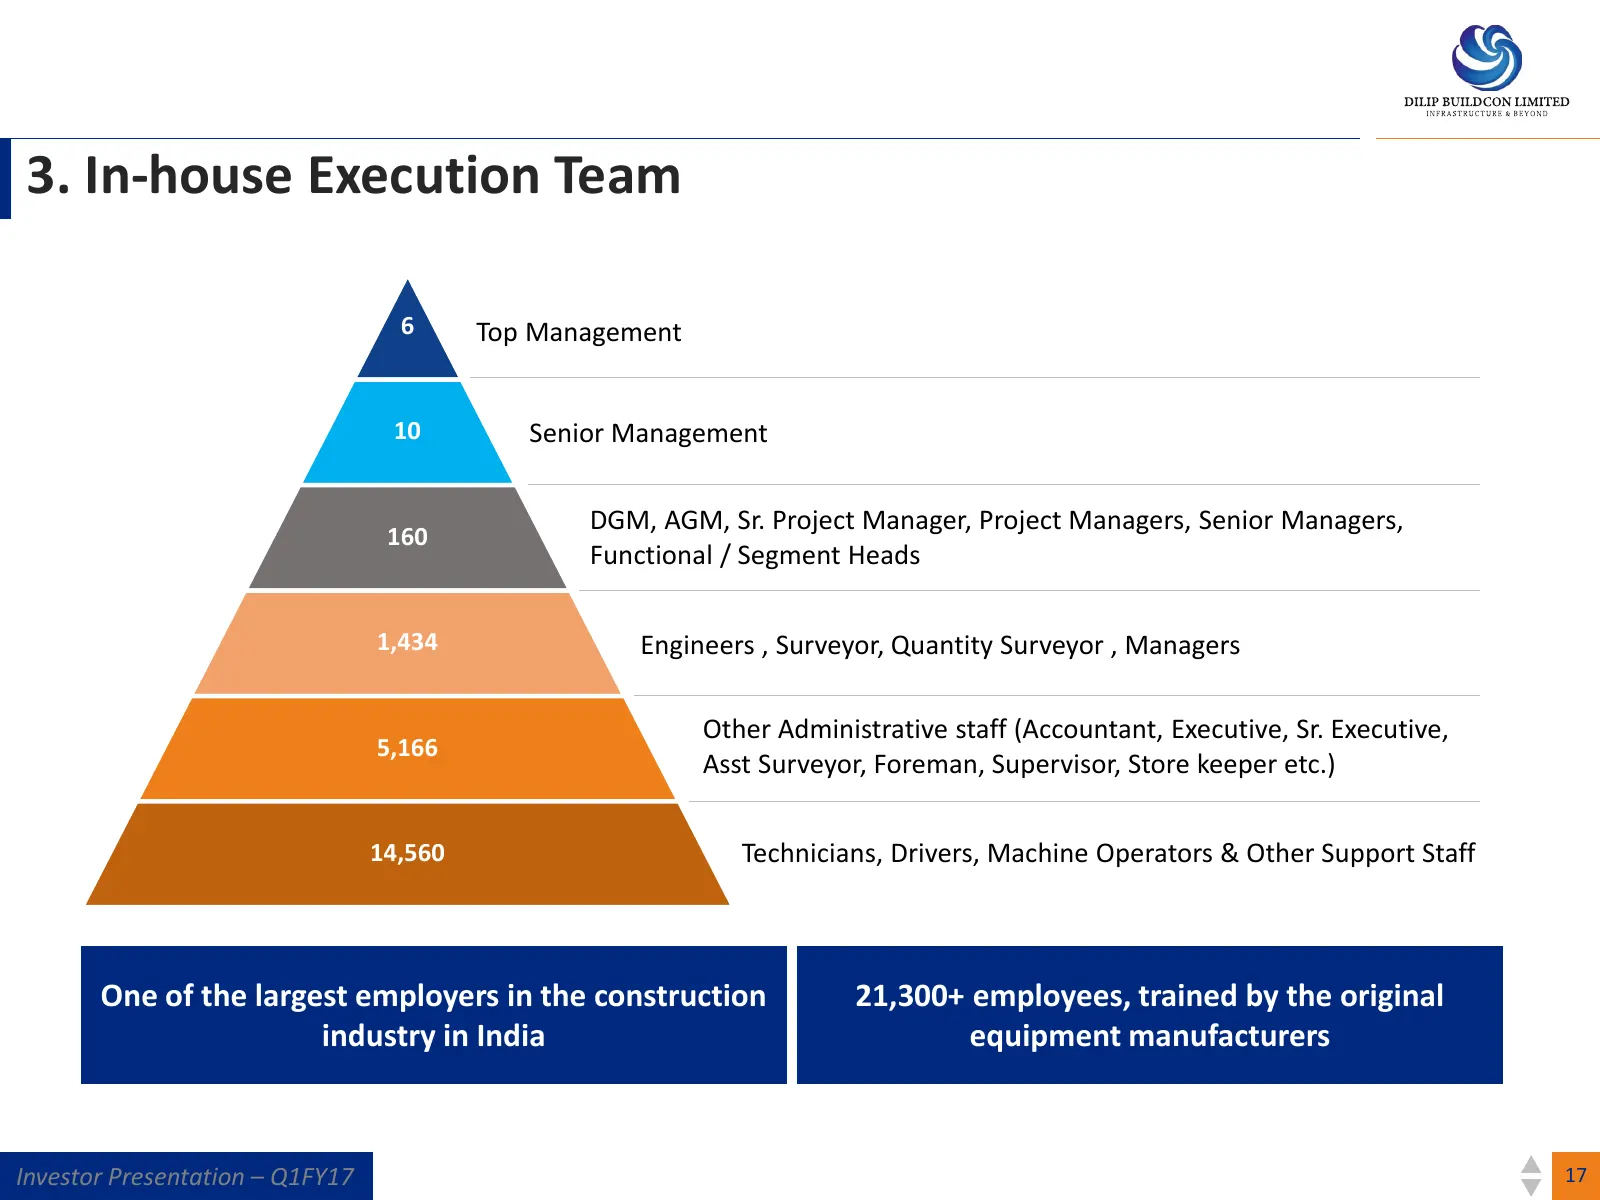
3. In-house Execution Team 6 Top Management 10 Senior Management DGM, AGM, Sr. Project Manager, Project Managers, Senior Managers, 160 Functional / Segment Heads 1,434 Engineers , Surveyor, Quantity Surveyor , Managers Other Administrative staff (Accountant, Executive, Sr. Executive, 5,166 Asst Surv
Slide 18: 4. Clients
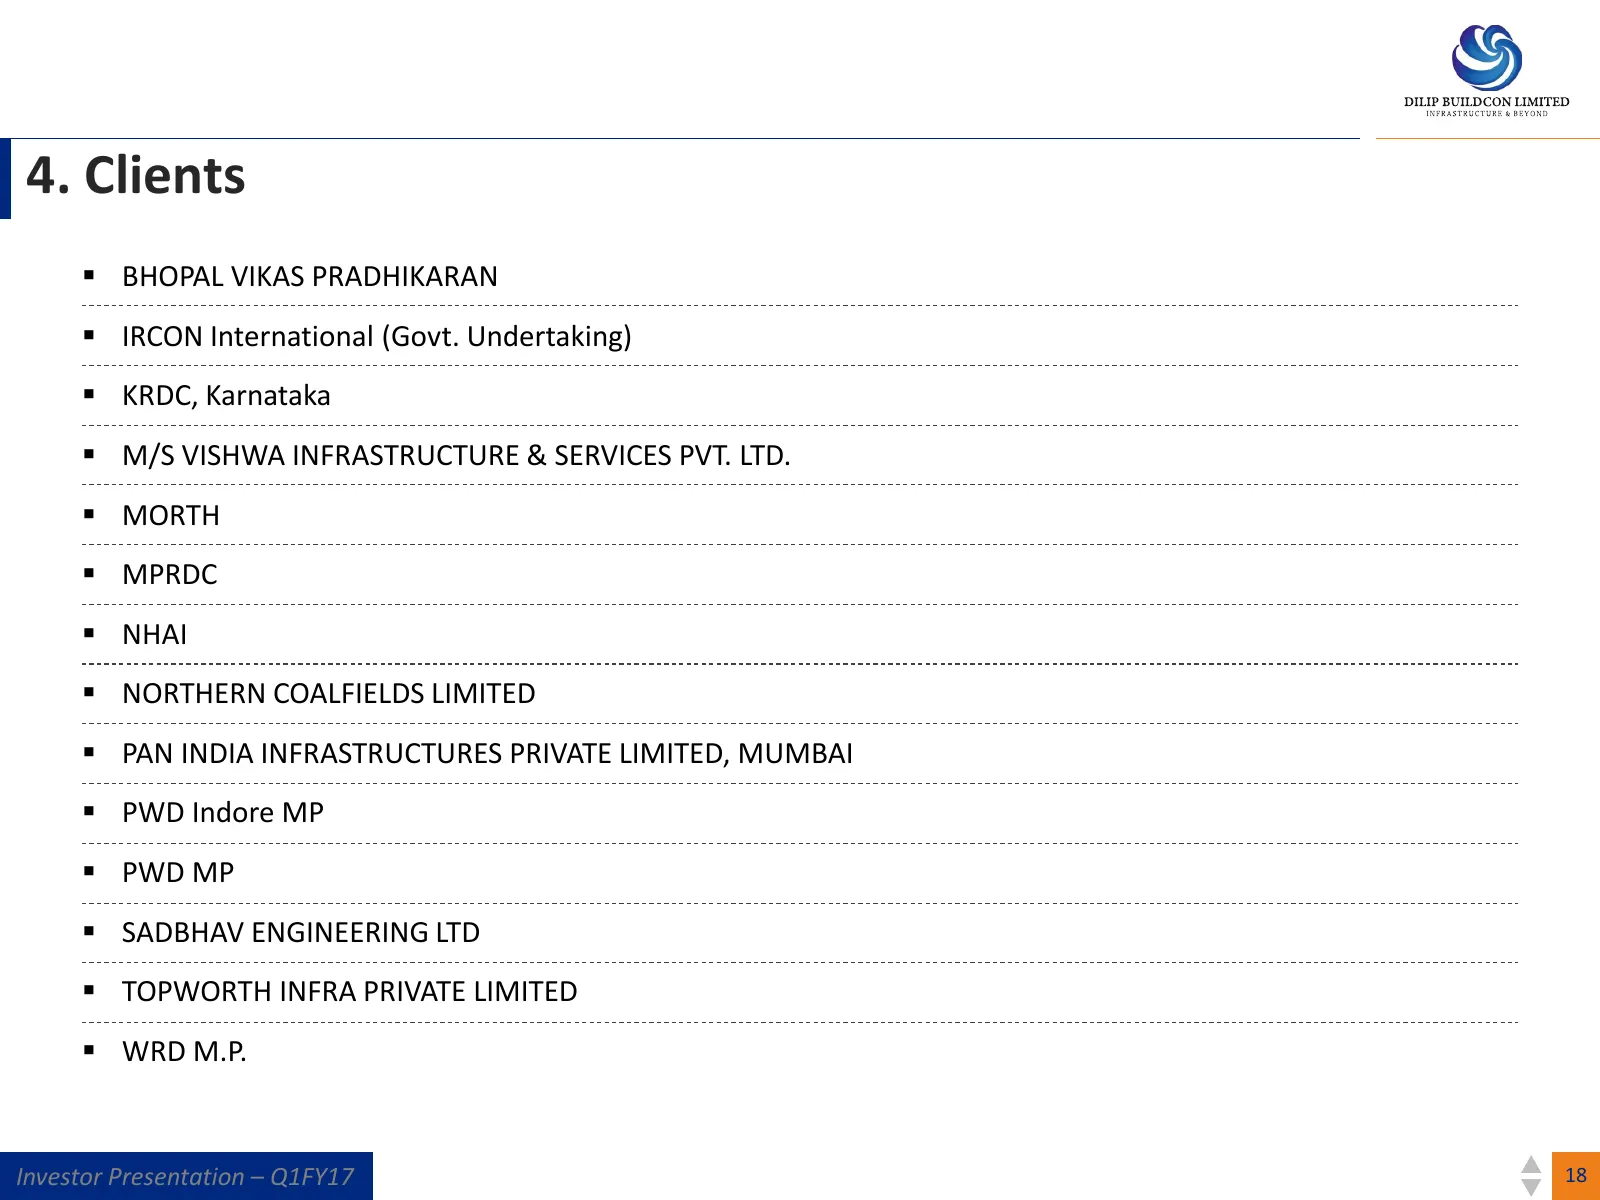
4. Clients BHOPAL VIKAS PRADHIKARAN IRCON International (Govt. Undertaking) KRDC, Karnataka M/S VISHWA INFRASTRUCTURE & SERVICES PVT. LTD. MORTH MPRDC NHAI NORTHERN COALFIELDS LIMITED PAN INDIA INFRASTRUCTURES PRIVATE LIMITED, MUMBAI PWD Indore MP PWD MP SADBHAV ENGINEERING L
Slide 19: Investment Rationale
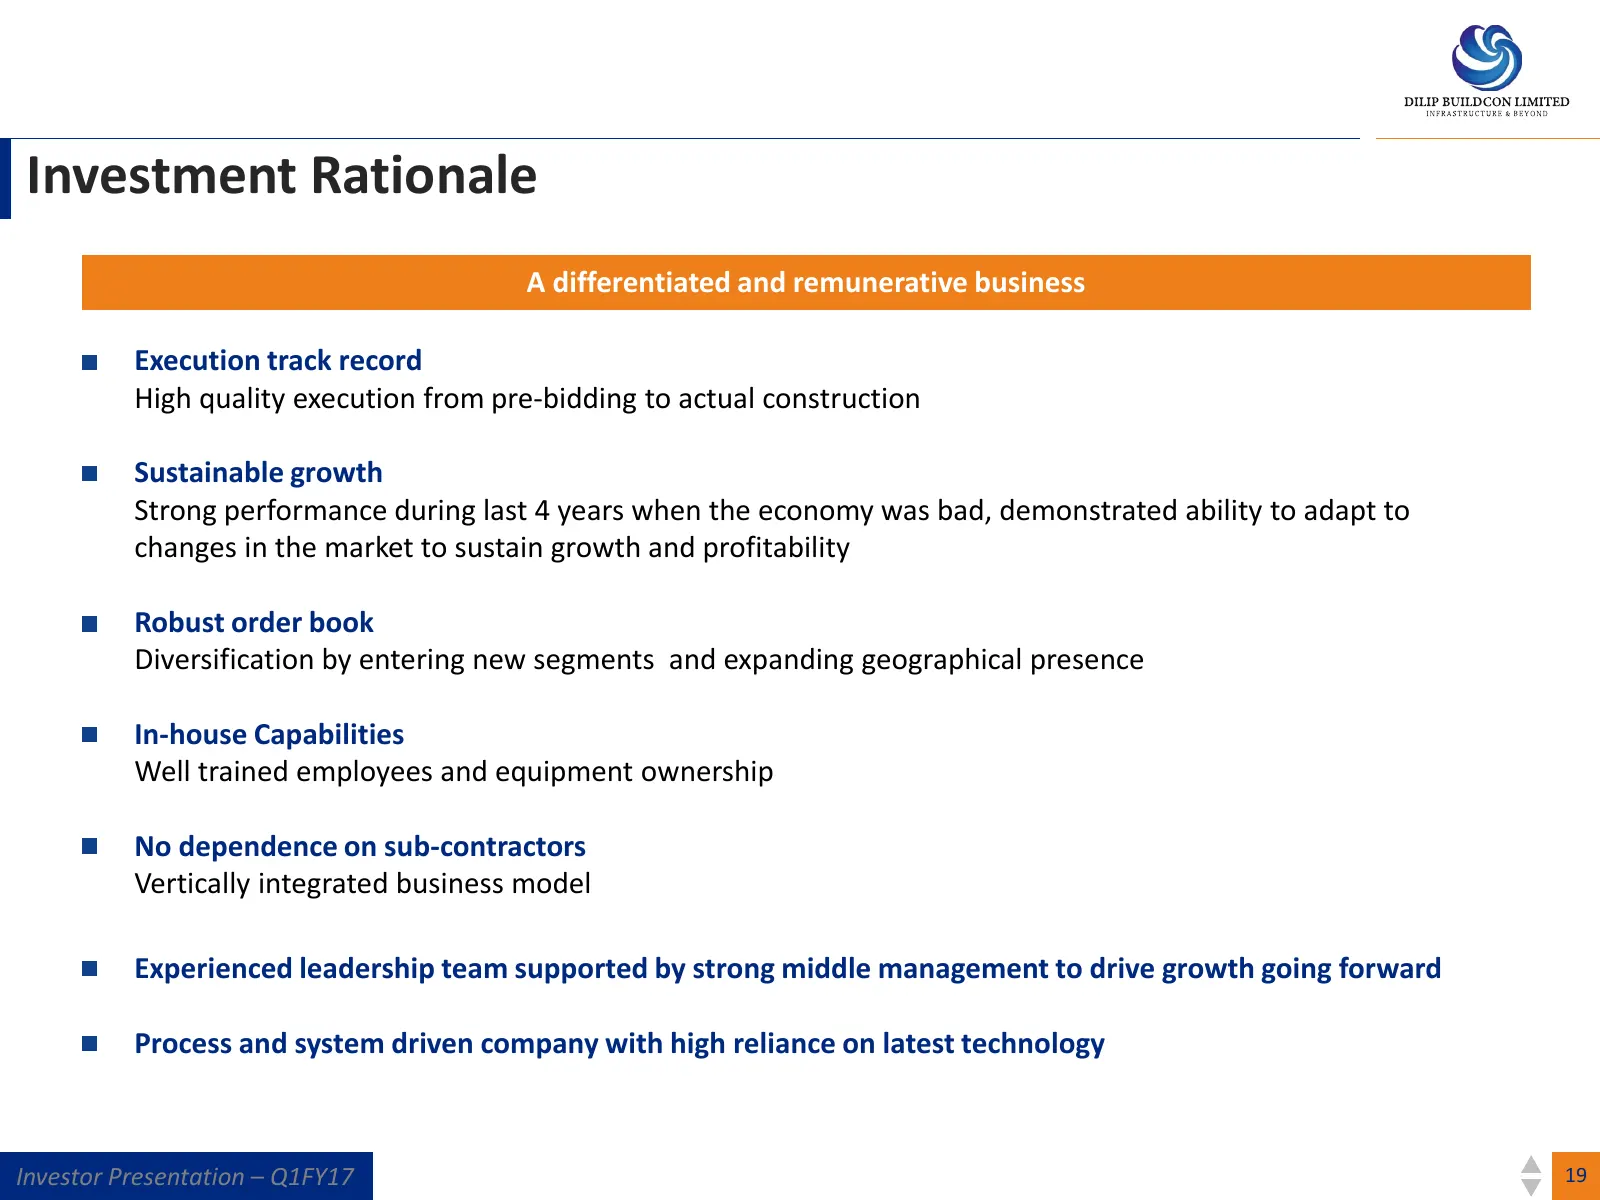
Investment Rationale A differentiated and remunerative business Execution track record High quality execution from pre-bidding to actual construction Sustainable growth Strong performance during last 4 years when the economy was bad, demonstrated ability to adapt to changes in the market to sustain
Slide 20: Construction Business
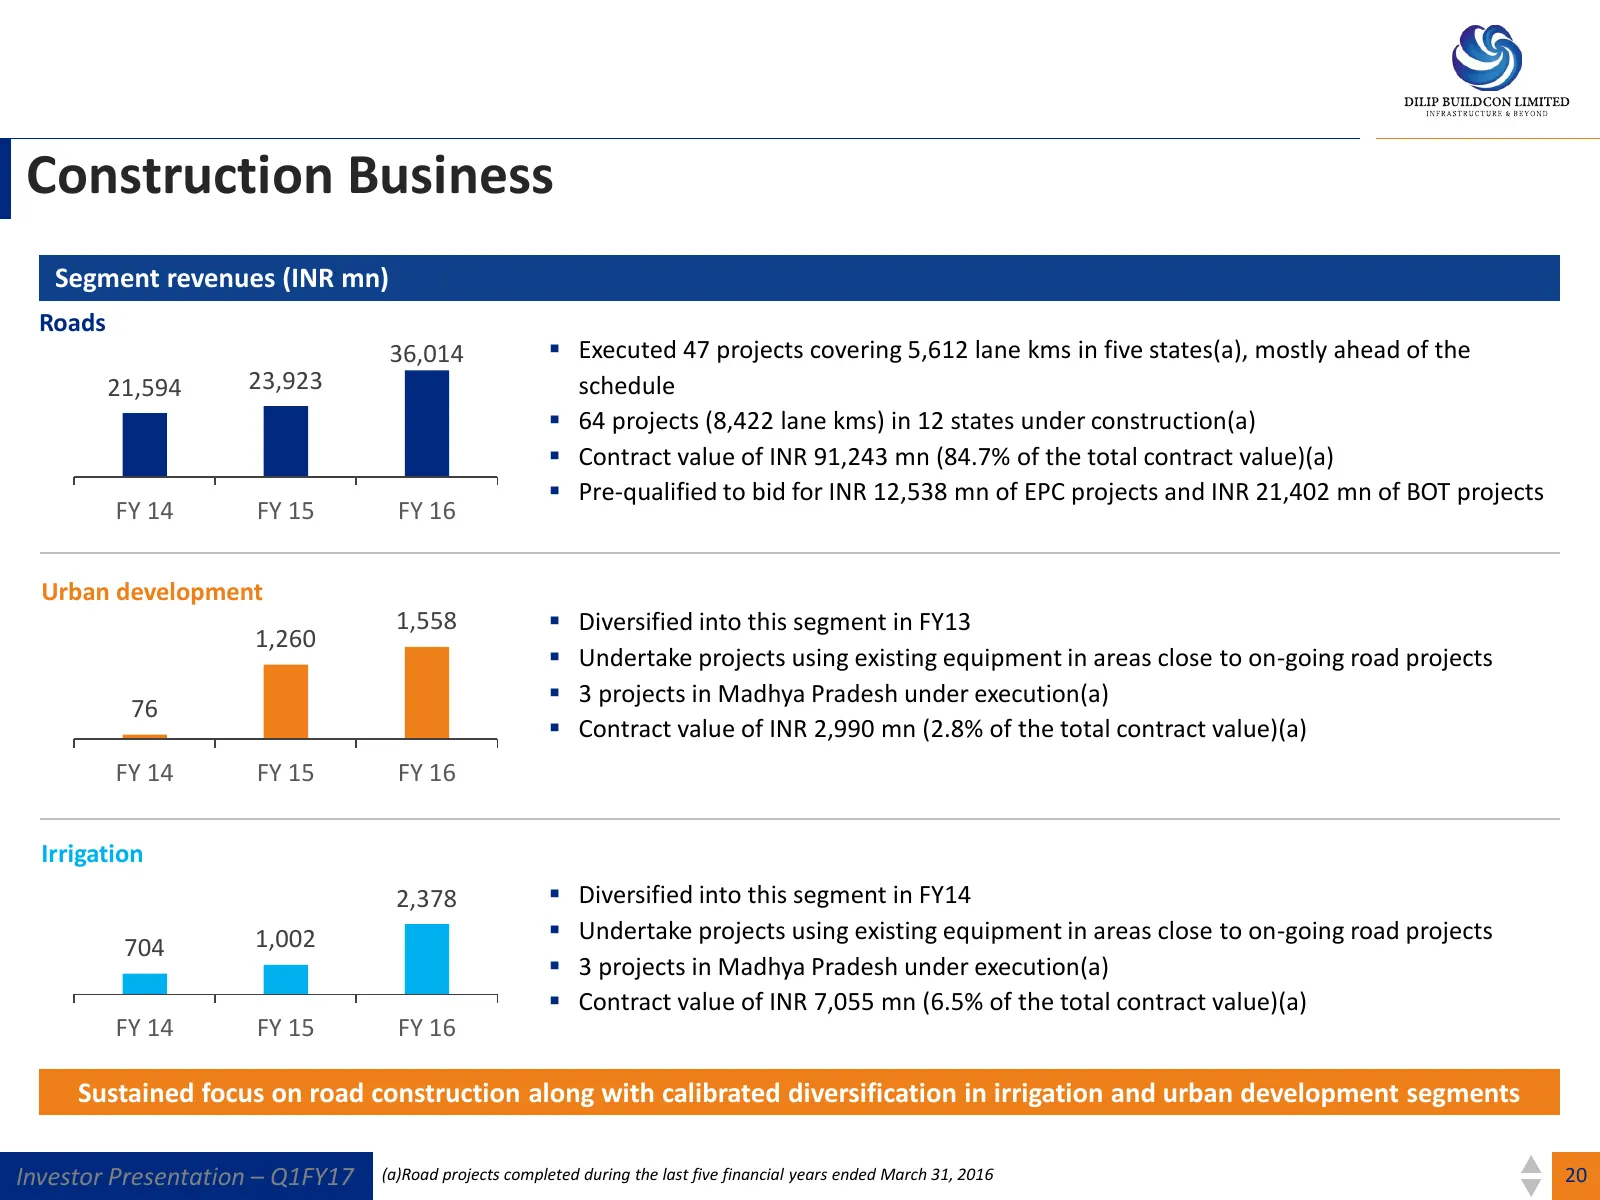
Construction Business Segment revenues (INR mn) Roads 36,014 Executed 47 projects covering 5,612 lane kms in five states(a), mostly ahead of the 21,594 23,923 schedule 64 projects (8,422 lane kms) in 12 states under construction(a) Contract value of INR 91,243 mn (84.7% of the total contract v
Slide 21: Infrastructure Development Business
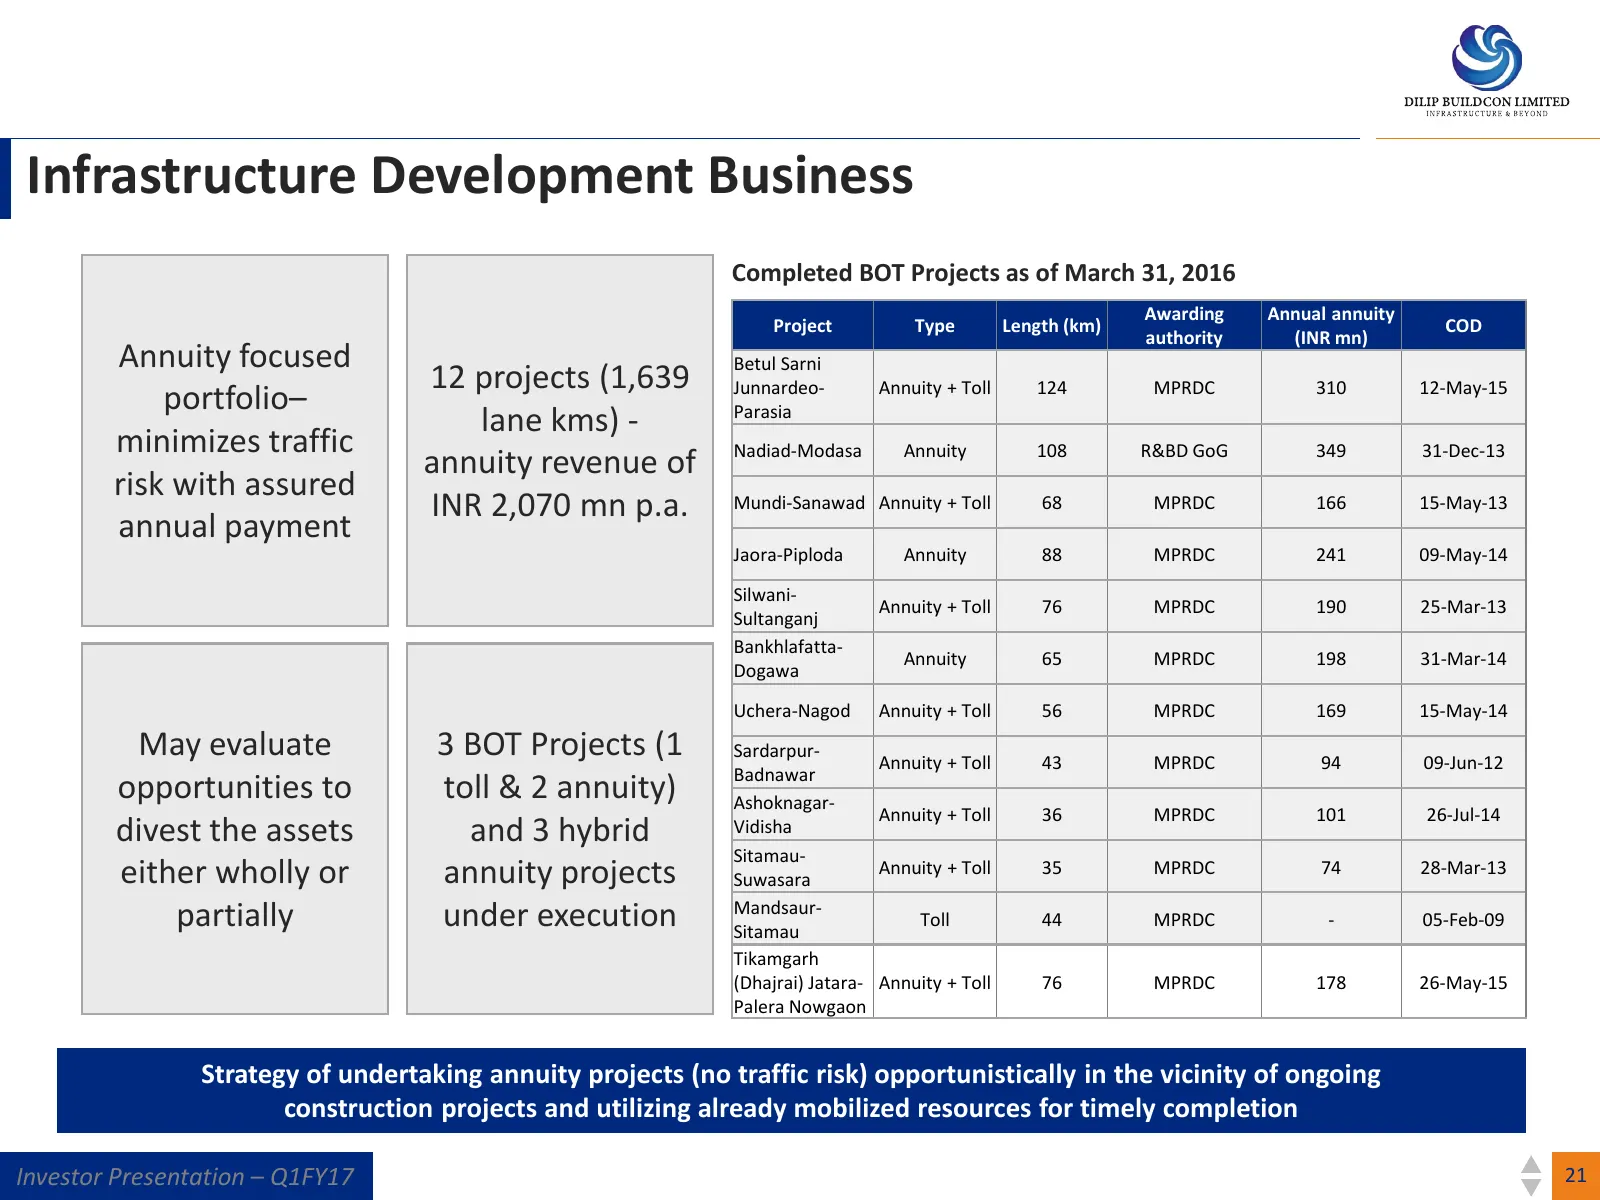
Infrastructure Development Business Completed BOT Projects as of March 31, 2016 Awarding Annual annuity Project Type Length (km) COD authority (INR mn) Annuity focused Betul Sarni 12 projects (1,639 Junnardeo- Annuity + Toll 124 MPRDC 310 12-May-15 portfolio– Parasia lane kms) - minimizes traffic Na
Slide 22: Yearly Financial Highlights
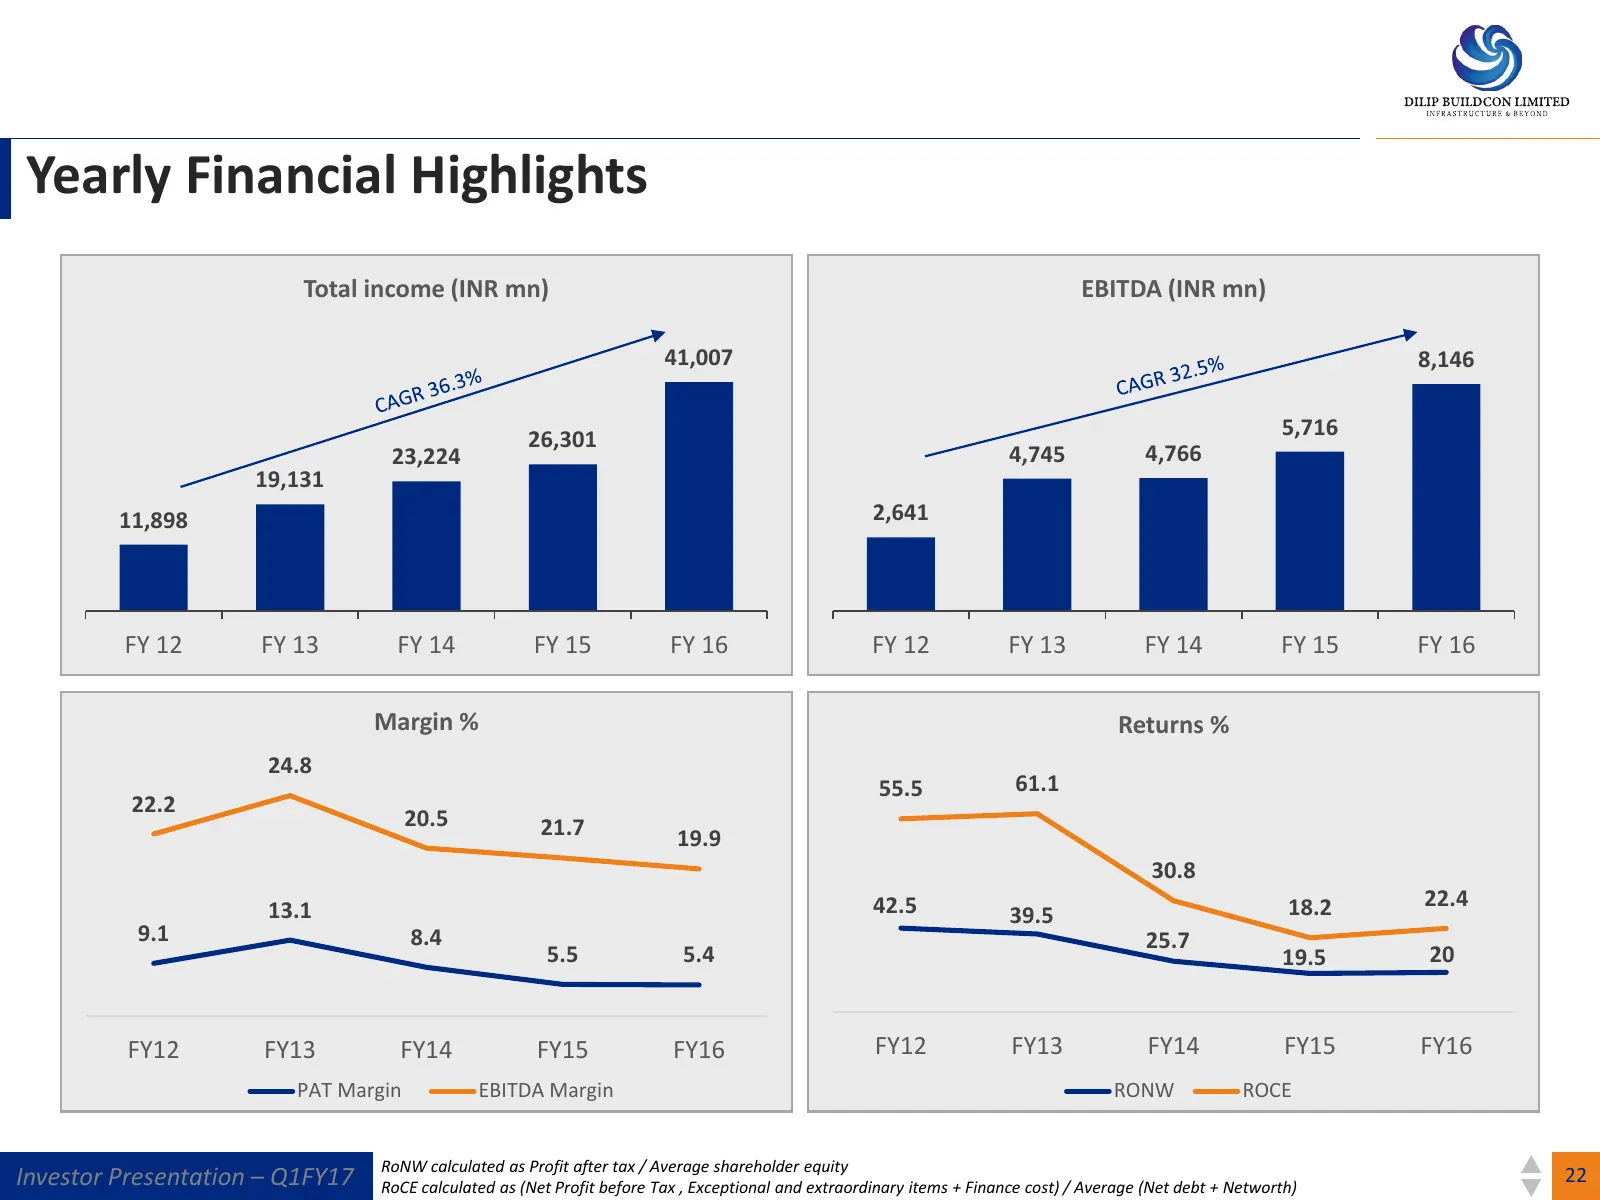
Yearly Financial Highlights Total income (INR mn) EBITDA (INR mn) 41,007 8,146 5,716 26,301 23,224 4,745 4,766 19,131 11,898 2,641 FY 12 FY 13 FY 14 FY 15 FY 16 FY 12 FY 13 FY 14 FY 15 FY 16 Margin % Returns % 24.8 55.5 61.1 22.2 20.5 21.7 19.9 30.8 13.1 42.5 18.2 22.4 39.5 9.1 8.4 25.7 5.5 5.4 19.5
Slide 23: Yearly Financial Highlights
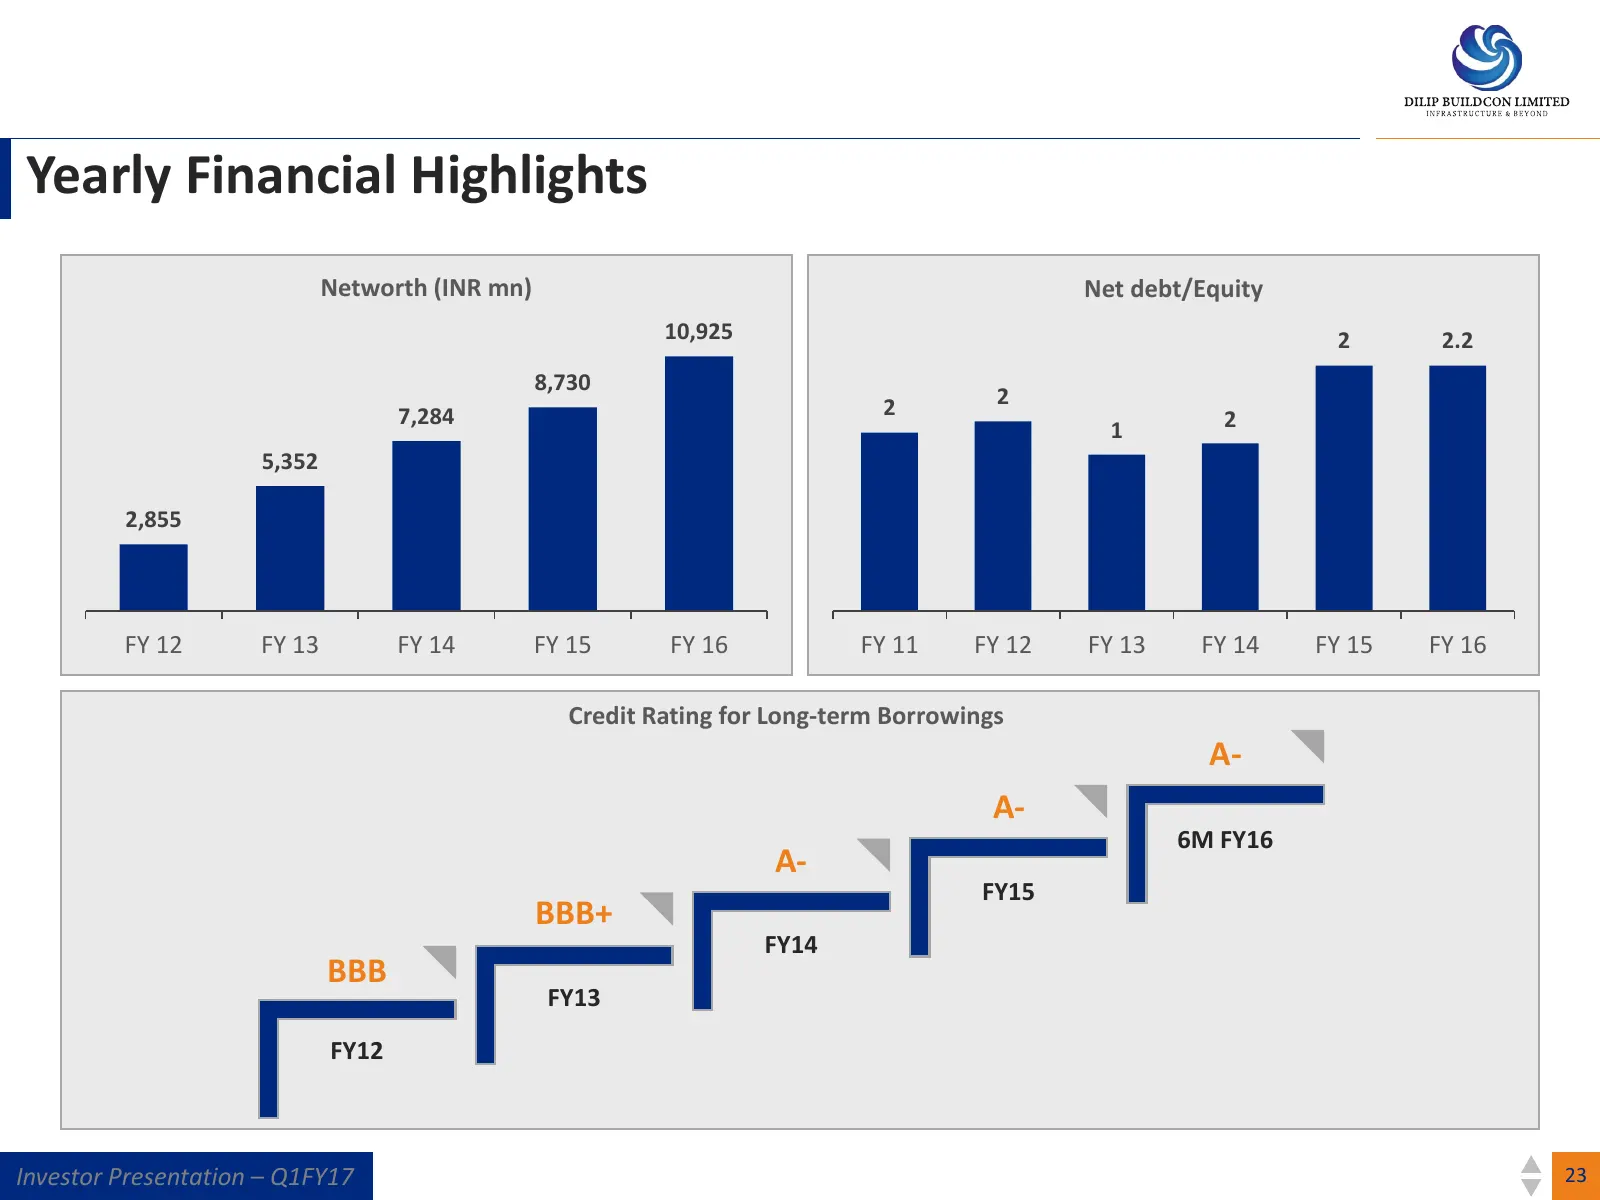
Yearly Financial Highlights Networth (INR mn) Net debt/Equity 10,925 2 2.2 8,730 2 2 7,284 2 1 5,352 2,855 FY 12 FY 13 FY 14 FY 15 FY 16 FY 11 FY 12 FY 13 FY 14 FY 15 FY 16 Credit Rating for Long-term Borrowings A- A- 6M FY16 A- FY15 BBB+ FY14 BBB FY13 FY12 Investor Presentation – Q1FY17 23
Slide 24: Standalone Financial Highlights
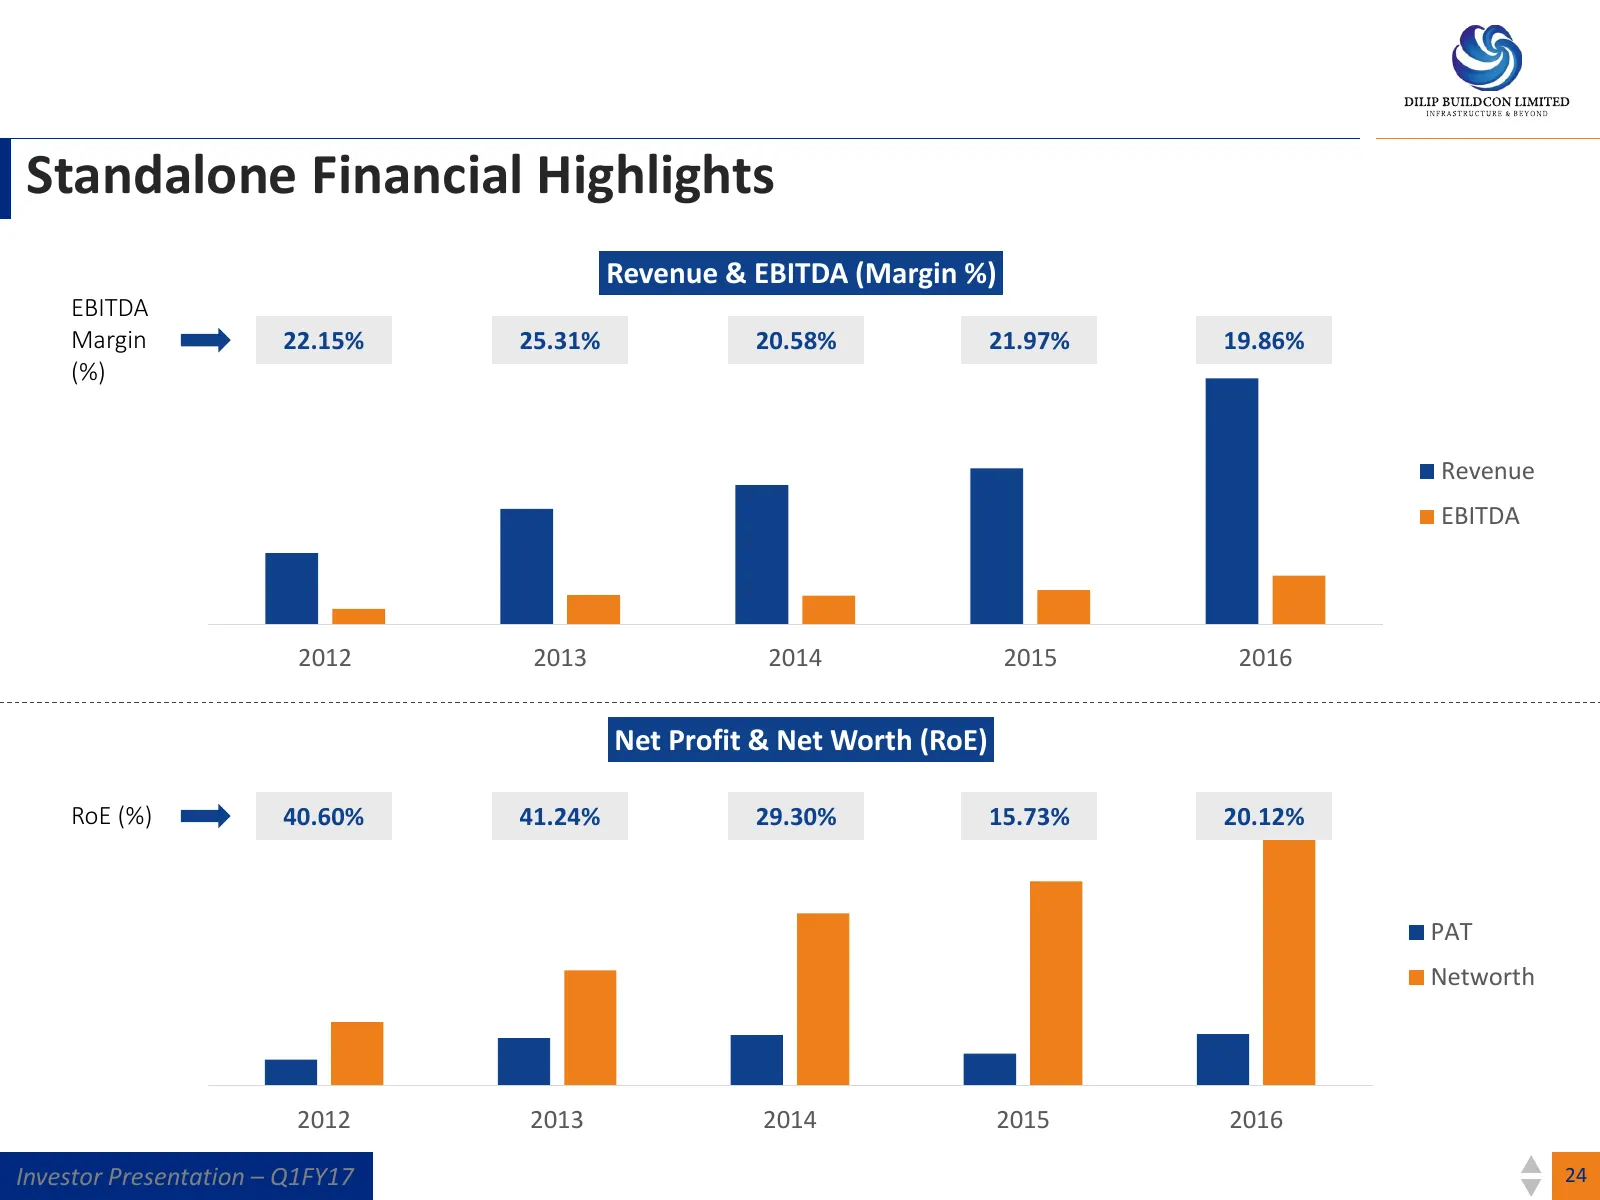
Standalone Financial Highlights Revenue & EBITDA (Margin %) EBITDA Margin 22.15% 25.31% 20.58% 21.97% 19.86% (%) Revenue EBITDA 2012 2013 2014 2015 2016 Net Profit & Net Worth (RoE) RoE (%) 40.60% 41.24% 29.30% 15.73% 20.12% PAT Networth 2012 2013 2014 2015 2016 Investor Presentation – Q1FY17 24
Slide 25: Quarterly Financial Highlights
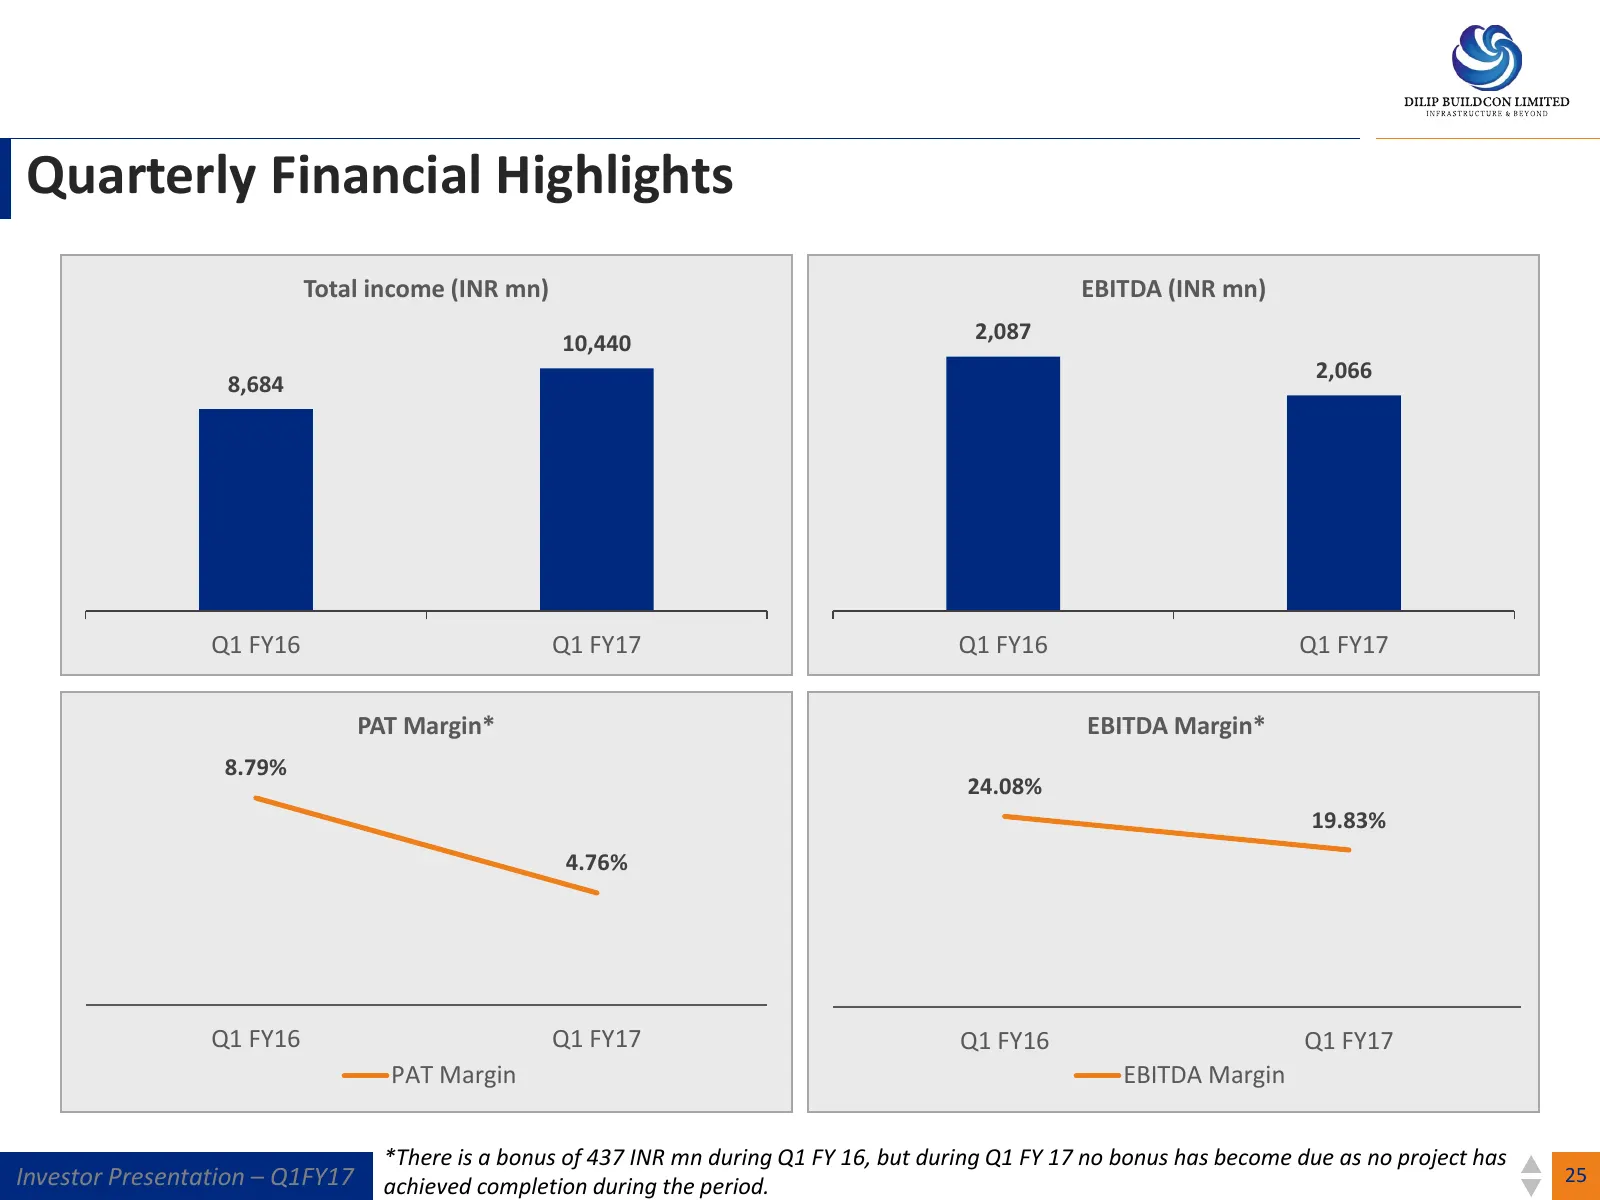
Quarterly Financial Highlights Total income (INR mn) EBITDA (INR mn) 10,440 2,087 2,066 8,684 Q1 FY16 Q1 FY17 Q1 FY16 Q1 FY17 PAT Margin* EBITDA Margin* 8.79% 24.08% 19.83% 4.76% Q1 FY16 Q1 FY17 Q1 FY16 Q1 FY17 PAT Margin EBITDA Margin *There is a bonus of 437 INR mn during Q1 FY 16, but during Q1 F
Slide 26: Robust Order Book
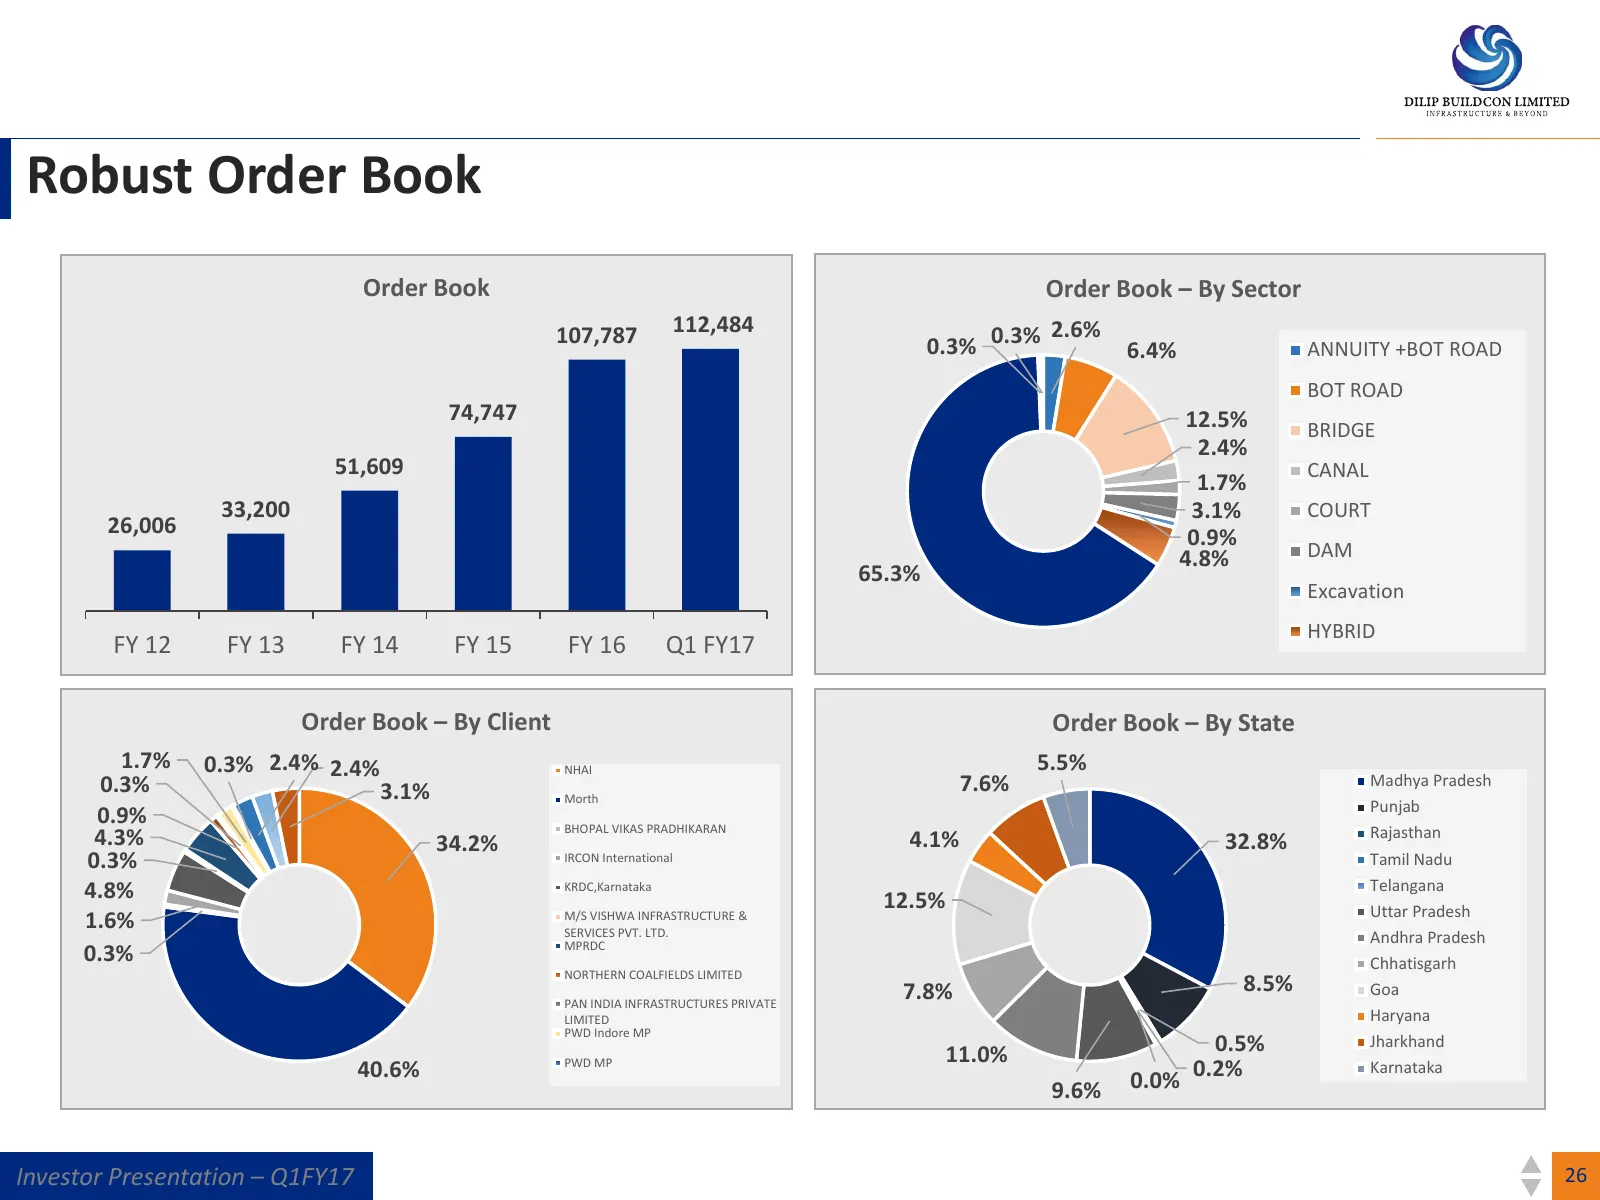
Robust Order Book Order Book Order Book – By Sector 107,787 112,484 2.6% 0.3% 0.3% 6.4% ANNUITY +BOT ROAD BOT ROAD 74,747 12.5% BRIDGE 2.4% 51,609 CANAL 1.7% 33,200 3.1% COURT 26,006 0.9% 4.8% DAM 65.3% Excavation HYBRID FY 12 FY 13 FY 14 FY 15 FY 16 Q1 FY17 Order Book – By Client Order Book – By St
Slide 27: Yearly Standalone Financials (INR mn)
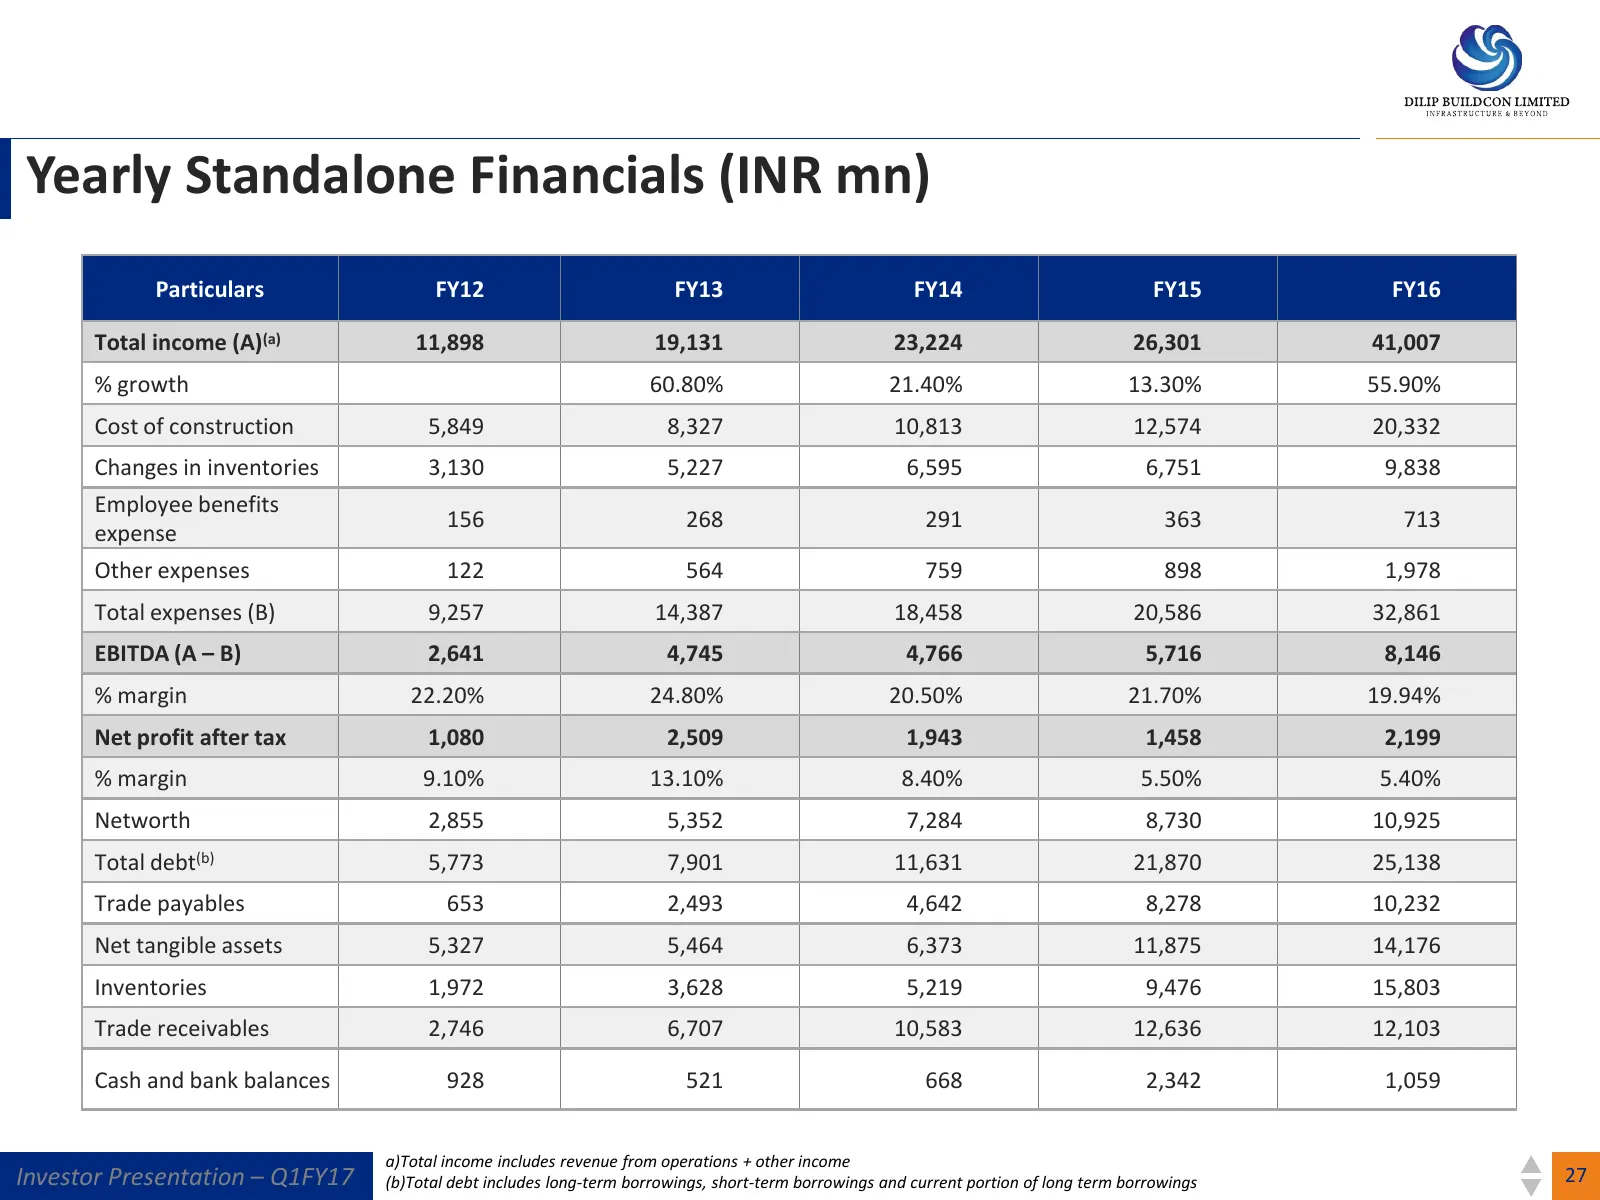
Yearly Standalone Financials (INR mn) Particulars FY12 FY13 FY14 FY15 FY16 Total income (A)(a) 11,898 19,131 23,224 26,301 41,007 % growth 60.80% 21.40% 13.30% 55.90% Cost of construction 5,849 8,327 10,813 12,574 20,332 Changes in inventories 3,130 5,227 6,595 6,751 9,838 Employee benefits 156 268
Slide 28: Yearly Consolidated Financials (INR mn)
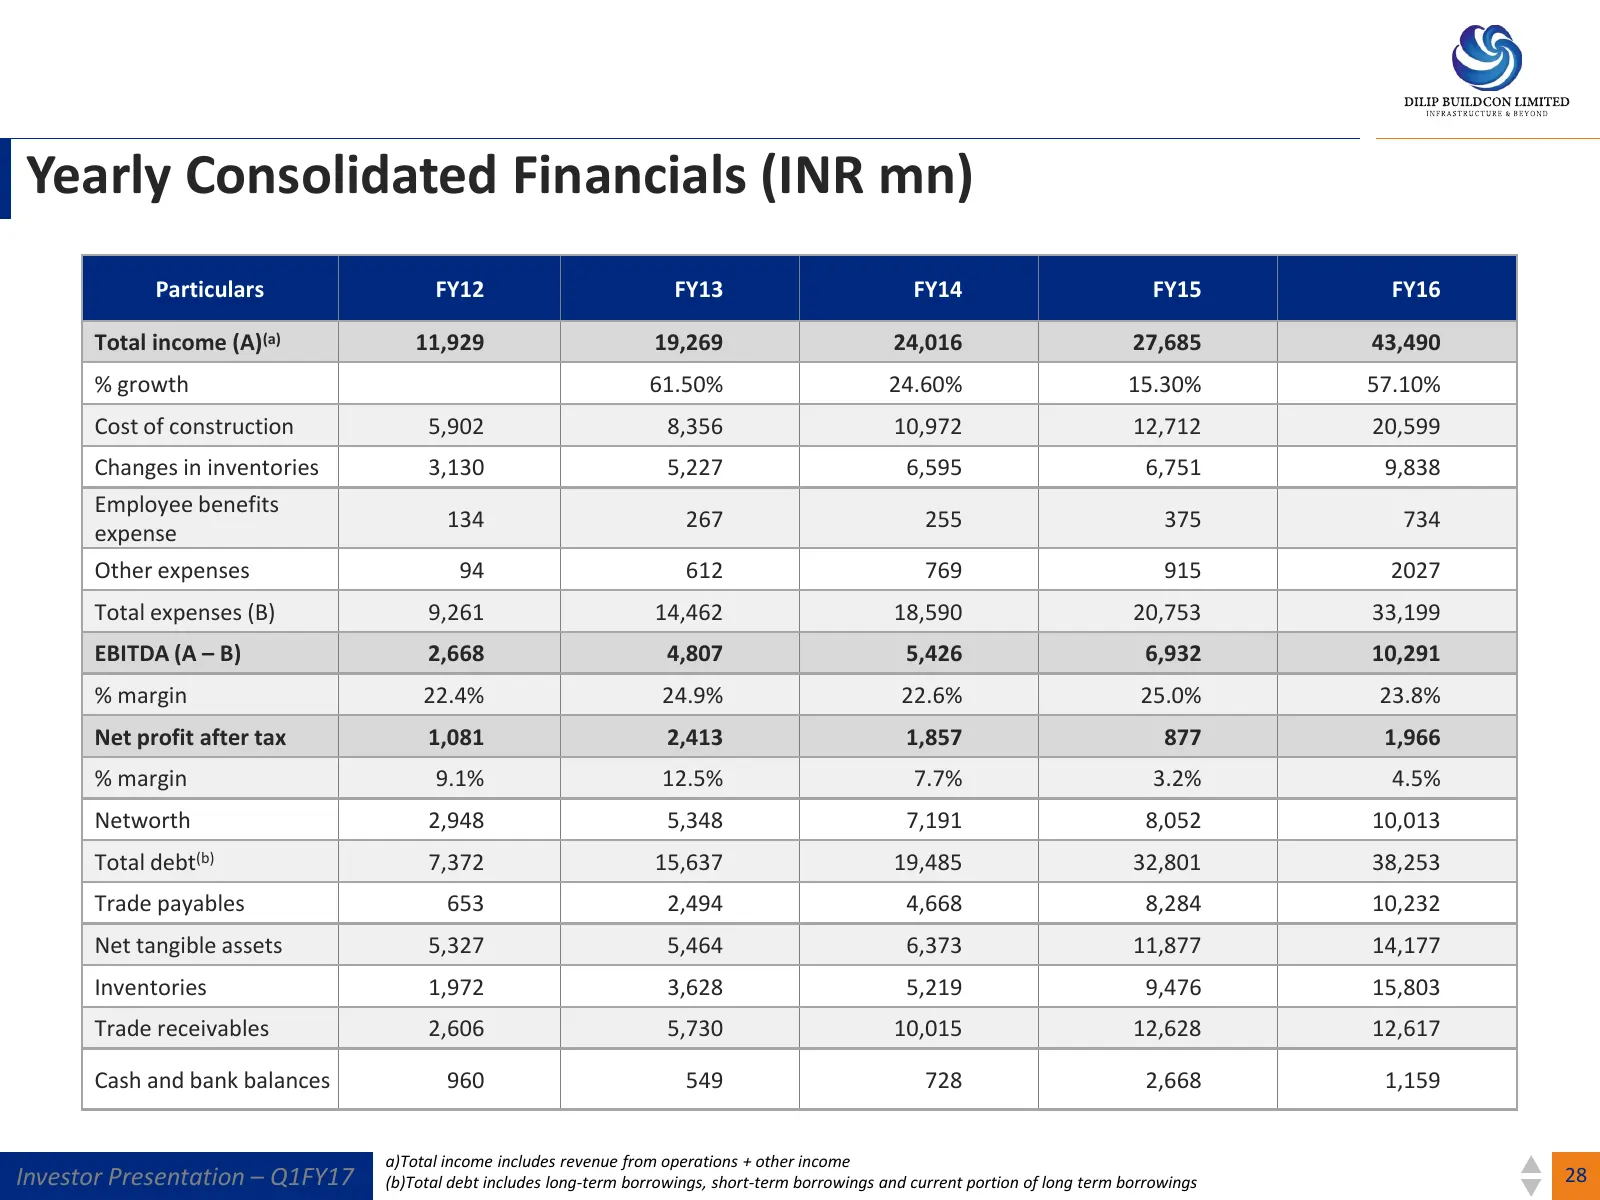
Yearly Consolidated Financials (INR mn) Particulars FY12 FY13 FY14 FY15 FY16 Total income (A)(a) 11,929 19,269 24,016 27,685 43,490 % growth 61.50% 24.60% 15.30% 57.10% Cost of construction 5,902 8,356 10,972 12,712 20,599 Changes in inventories 3,130 5,227 6,595 6,751 9,838 Employee benefits 134 26
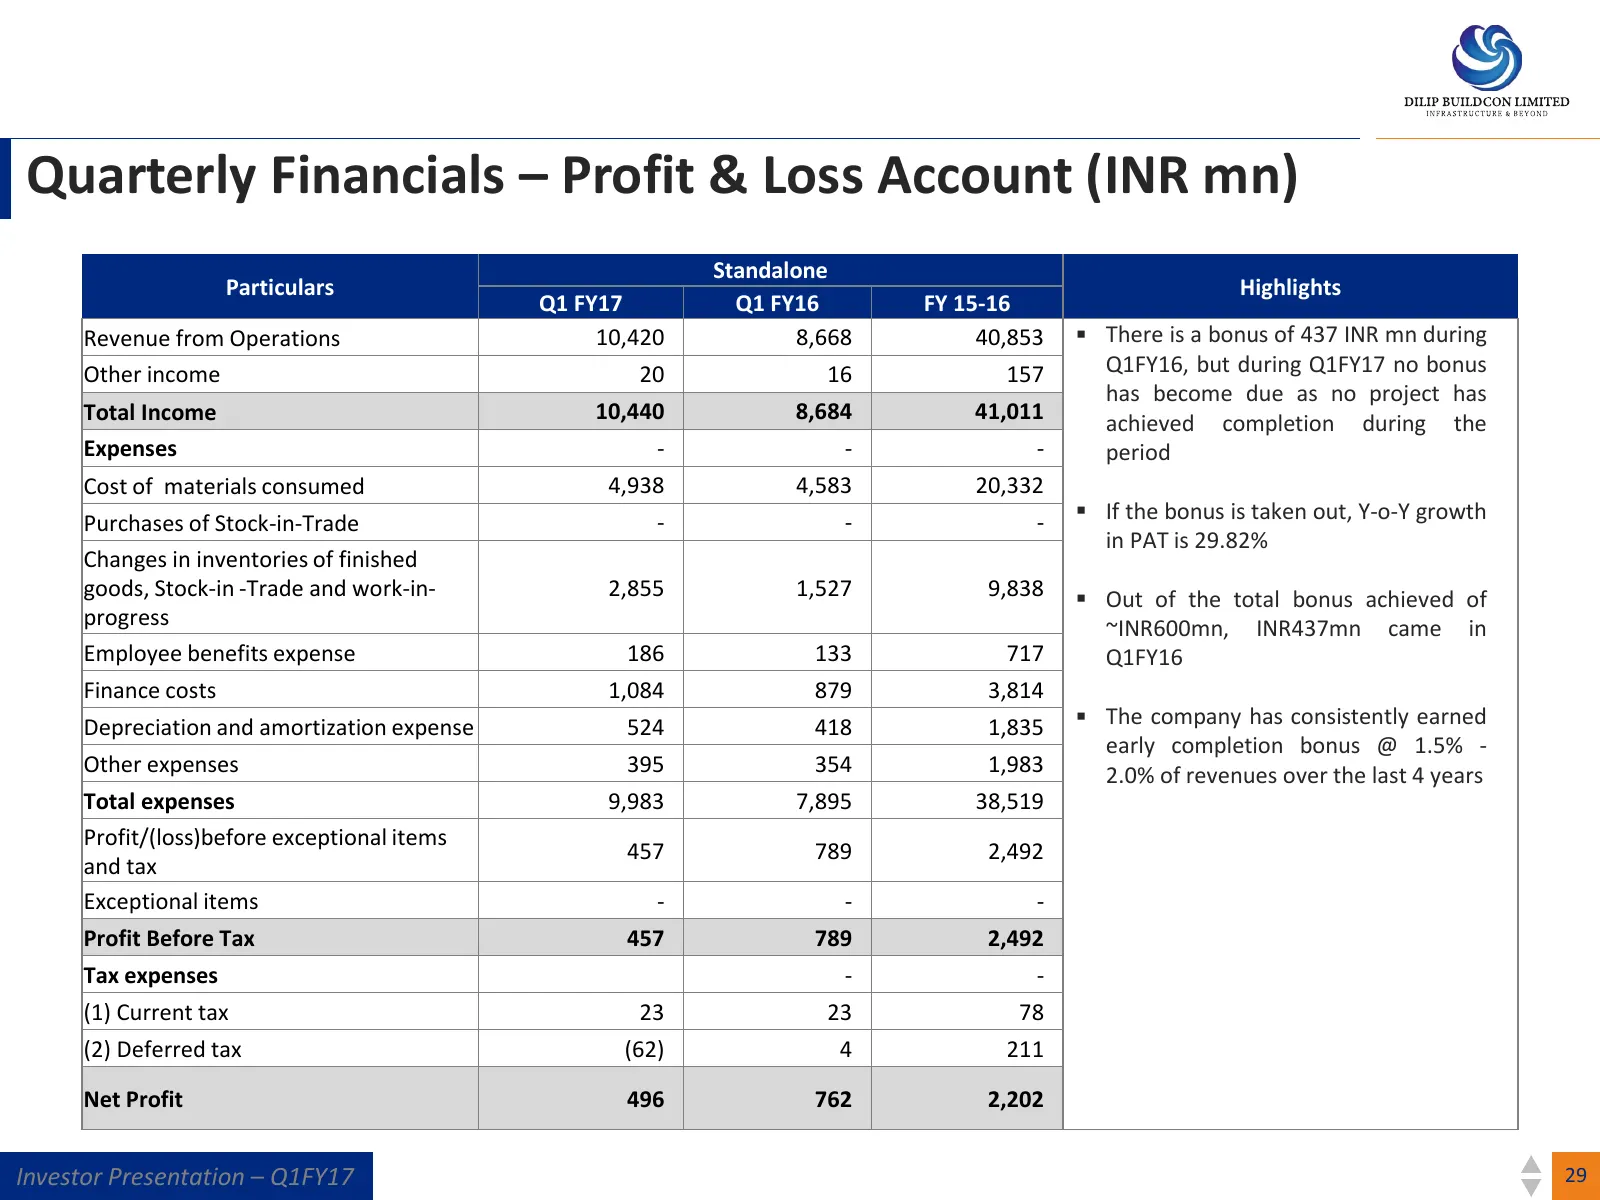
Slide 29: Quarterly Financials – Profit & Loss Account (INR mn)
Quarterly Financials – Profit & Loss Account (INR mn) Standalone Particulars Highlights Q1 FY17 Q1 FY16 FY 15-16 Revenue from Operations 10,420 8,668 40,853 There is a bonus of 437 INR mn during Other income 20 16 157 Q1FY16, but during Q1FY17 no bonus has become due as no project has Total Income
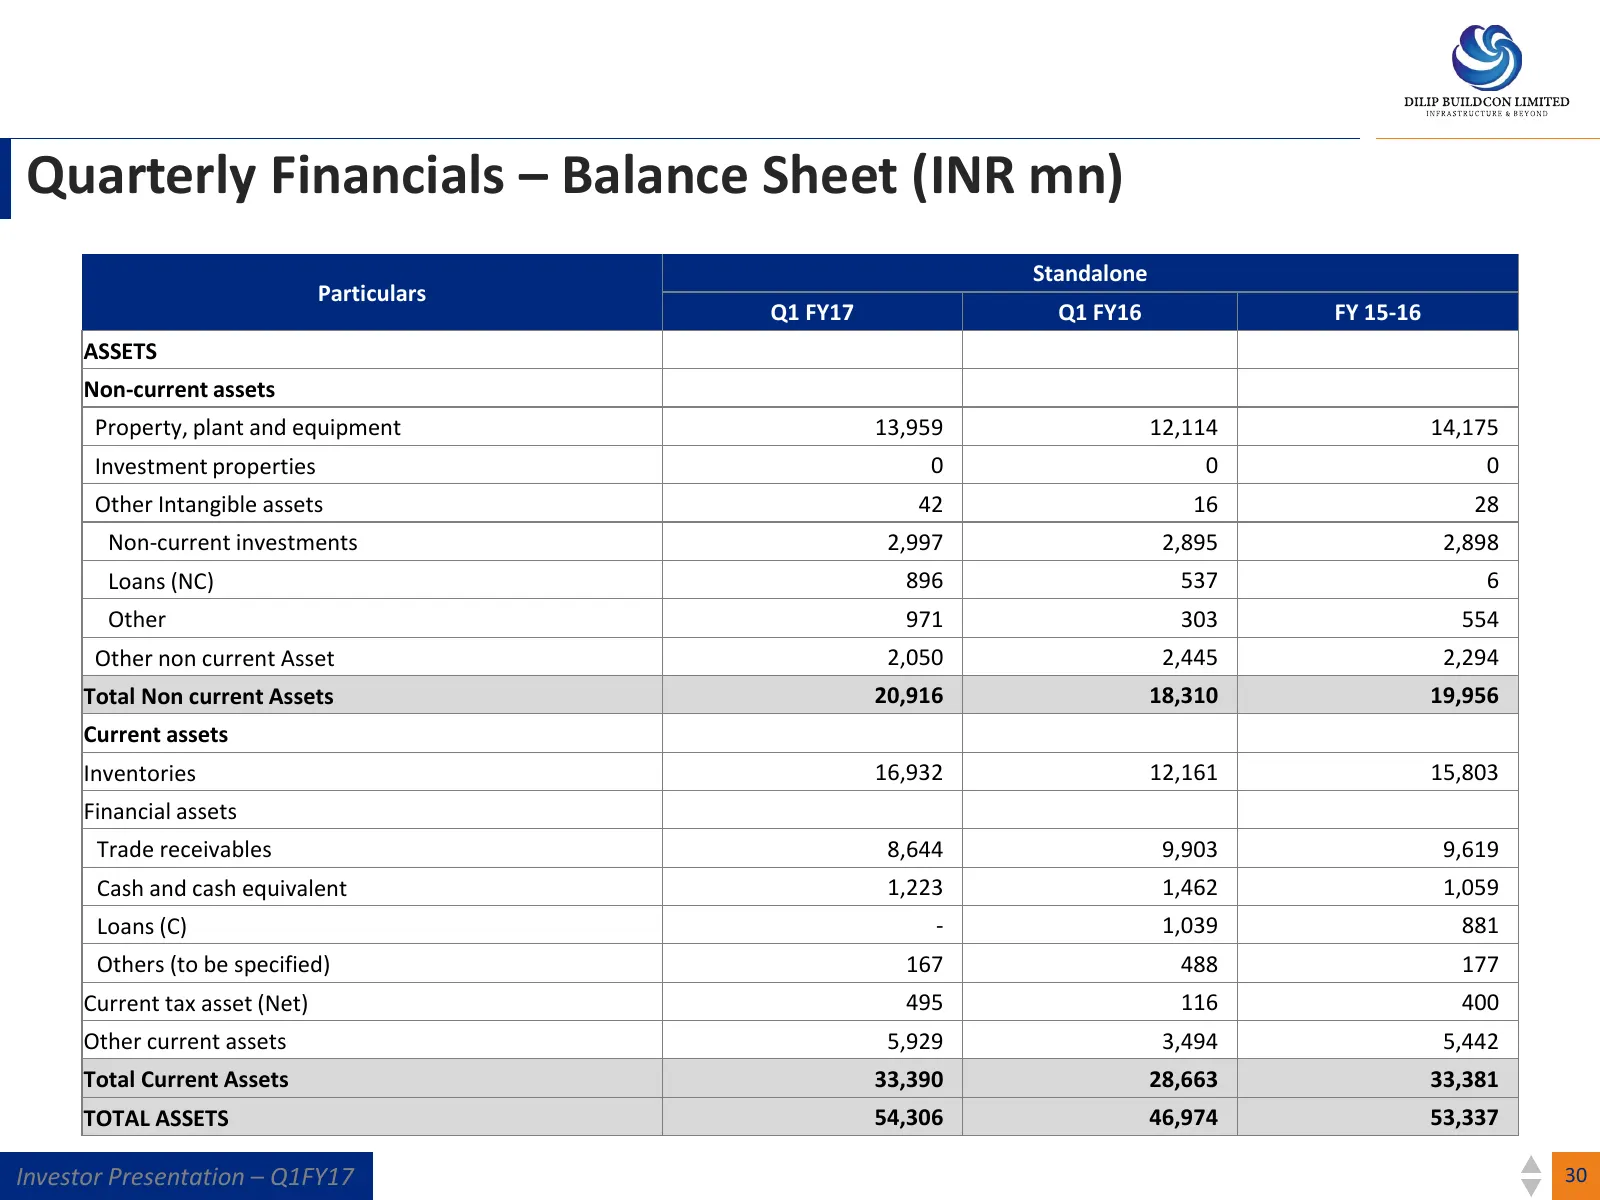
Slide 30: Quarterly Financials – Balance Sheet (INR mn)
Quarterly Financials – Balance Sheet (INR mn) Standalone Particulars Q1 FY17 Q1 FY16 FY 15-16 ASSETS Non-current assets Property, plant and equipment 13,959 12,114 14,175 Investment properties 0 0 0 Other Intangible assets 42 16 28 Non-current investments 2,997 2,895 2,898 Loans (NC) 896 537 6 Other
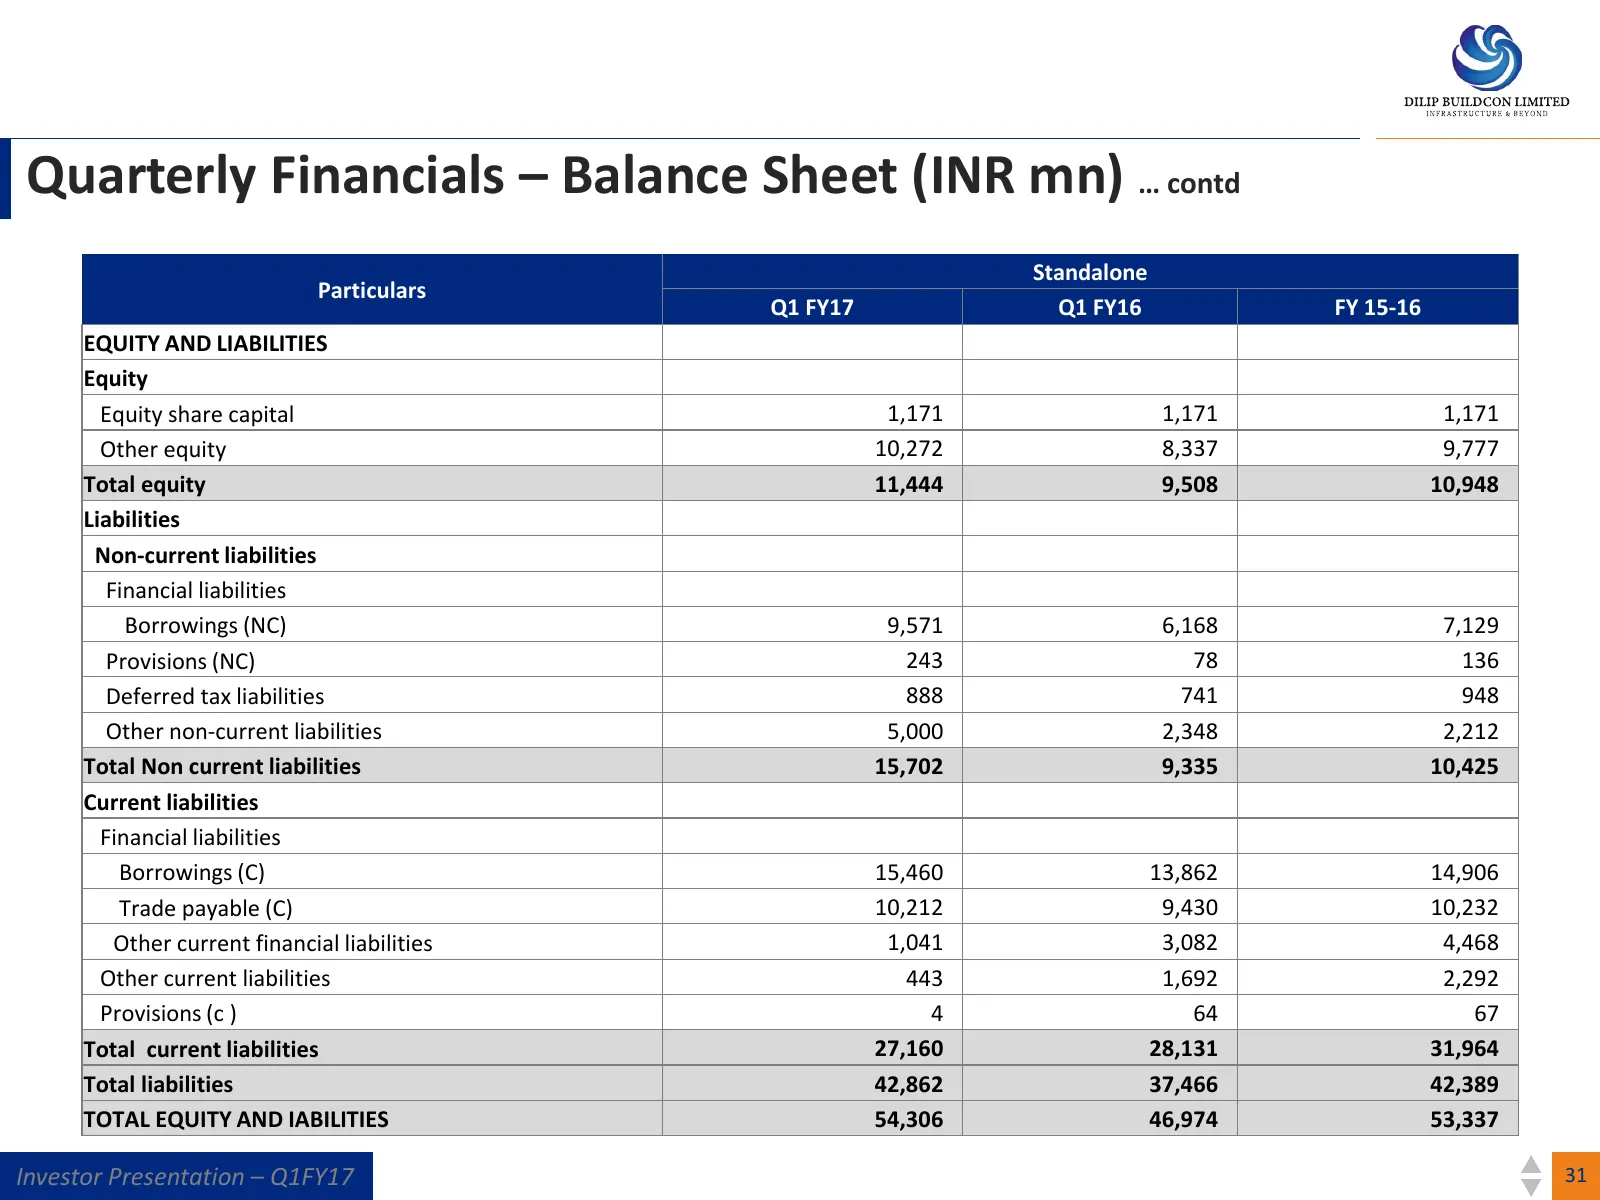
Slide 31: Quarterly Financials – Balance Sheet (INR mn) … contd
Quarterly Financials – Balance Sheet (INR mn) … contd Standalone Particulars Q1 FY17 Q1 FY16 FY 15-16 EQUITY AND LIABILITIES Equity Equity share capital 1,171 1,171 1,171 Other equity 10,272 8,337 9,777 Total equity 11,444 9,508 10,948 Liabilities Non-current liabilities Financial liabilities Borrow
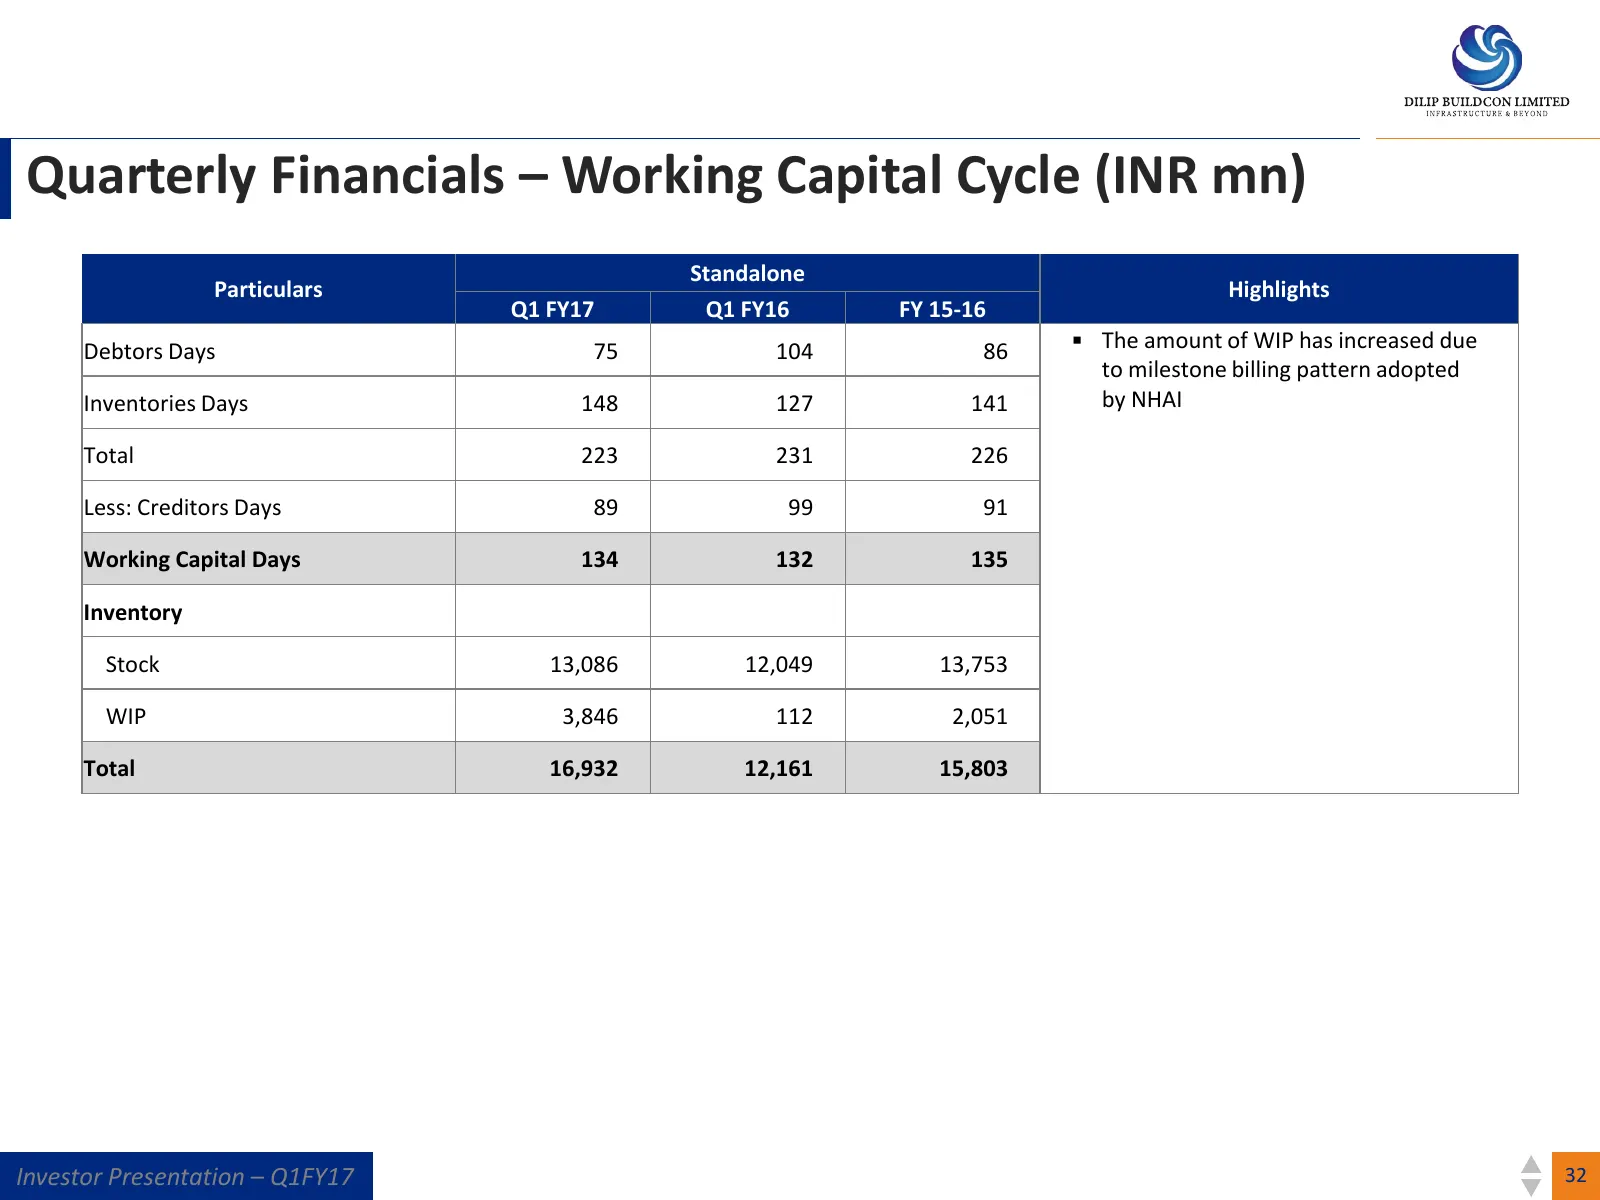
Slide 32: Quarterly Financials – Working Capital Cycle (INR mn)
Quarterly Financials – Working Capital Cycle (INR mn) Standalone Particulars Highlights Q1 FY17 Q1 FY16 FY 15-16 Debtors Days 75 104 86 The amount of WIP has increased due to milestone billing pattern adopted Inventories Days 148 127 141 by NHAI Total 223 231 226 Less: Creditors Days 89 99 91 Work
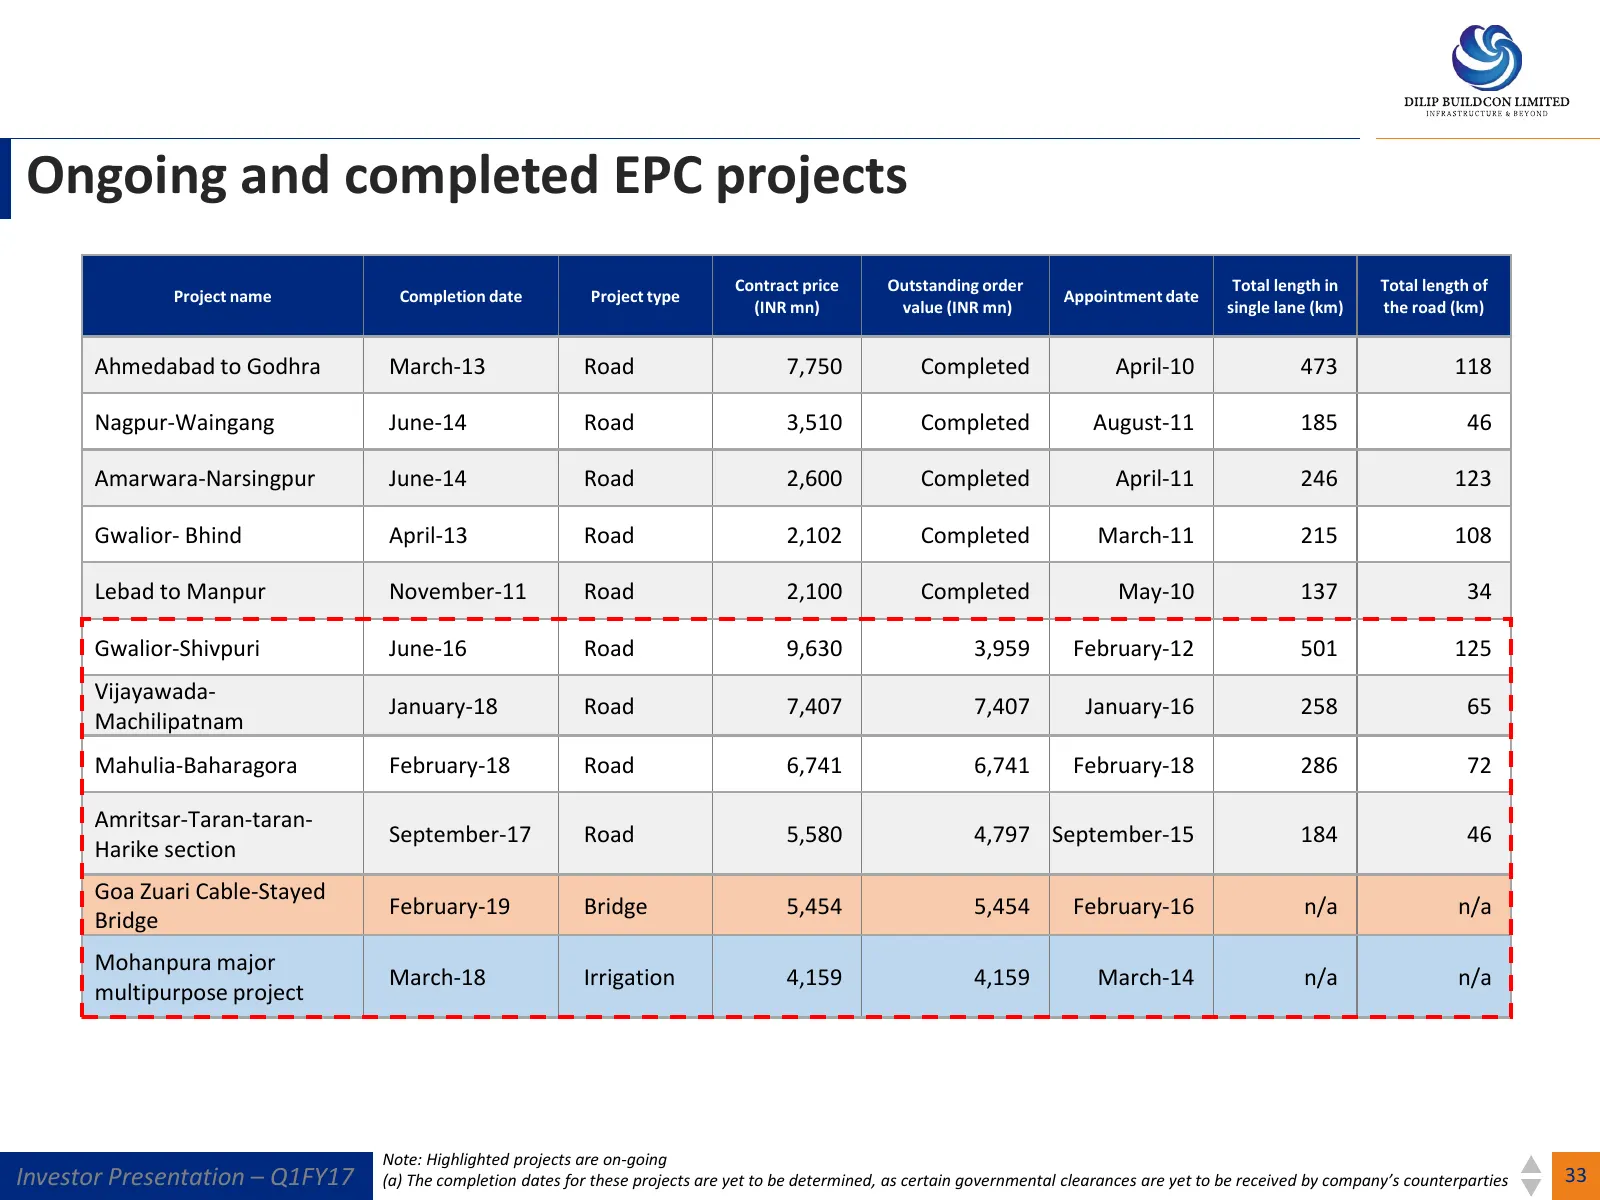
Slide 33: Ongoing and completed EPC projects
Ongoing and completed EPC projects Contract price Outstanding order Total length in Total length of Project name Completion date Project type Appointment date (INR mn) value (INR mn) single lane (km) the road (km) Ahmedabad to Godhra March-13 Road 7,750 Completed April-10 473 118 Nagpur-Waingang Jun
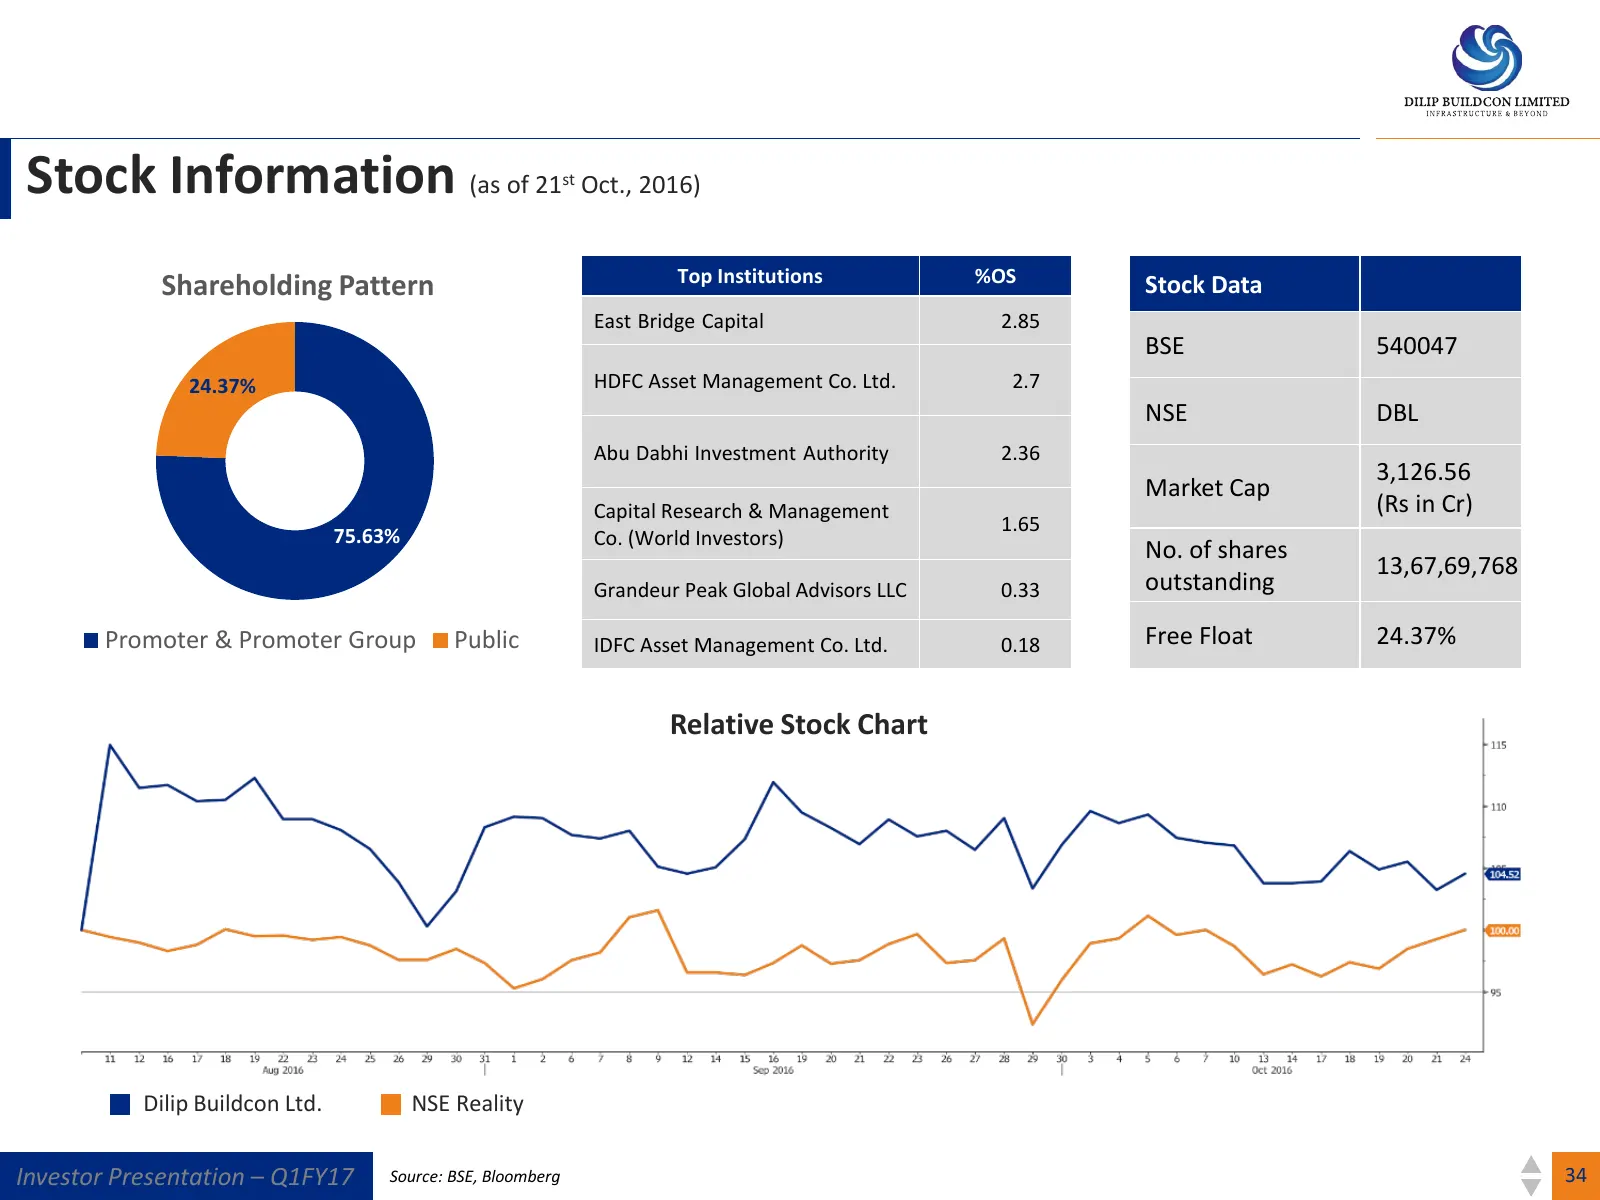
Slide 34: Stock Information
Stock Information (as of 21 Oct., 2016) st Top Institutions %OS Shareholding Pattern Stock Data East Bridge Capital 2.85 BSE 540047 24.37% HDFC Asset Management Co. Ltd. 2.7 NSE DBL Abu Dabhi Investment Authority 2.36 3,126.56 Market Cap Capital Research & Management (Rs in Cr) 1.65 75.63% Co. (Worl
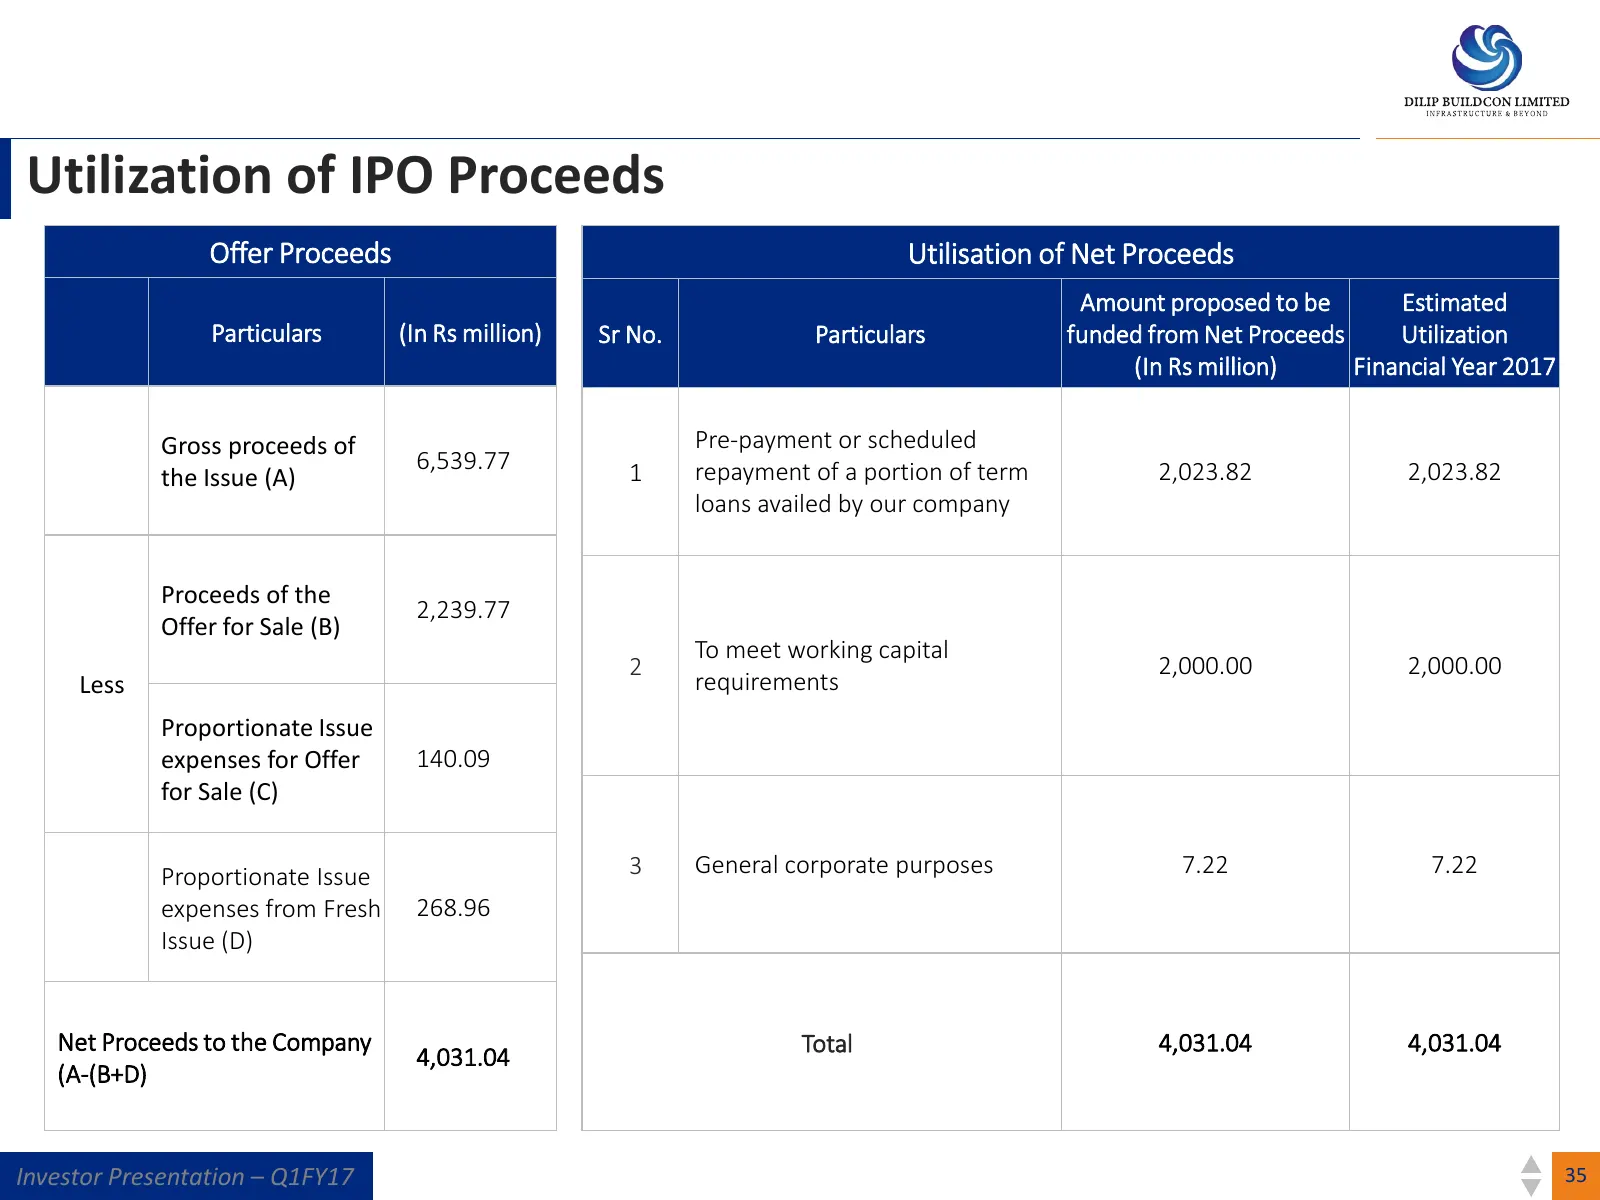
Slide 35: Utilization of IPO Proceeds
Utilization of IPO Proceeds Offer Proceeds Utilisation of Net Proceeds Amount proposed to be Estimated Particulars (In Rs million) Sr No. Particulars funded from Net Proceeds Utilization (In Rs million) Financial Year 2017 Gross proceeds of Pre-payment or scheduled 6,539.77 1 repayment of a portion
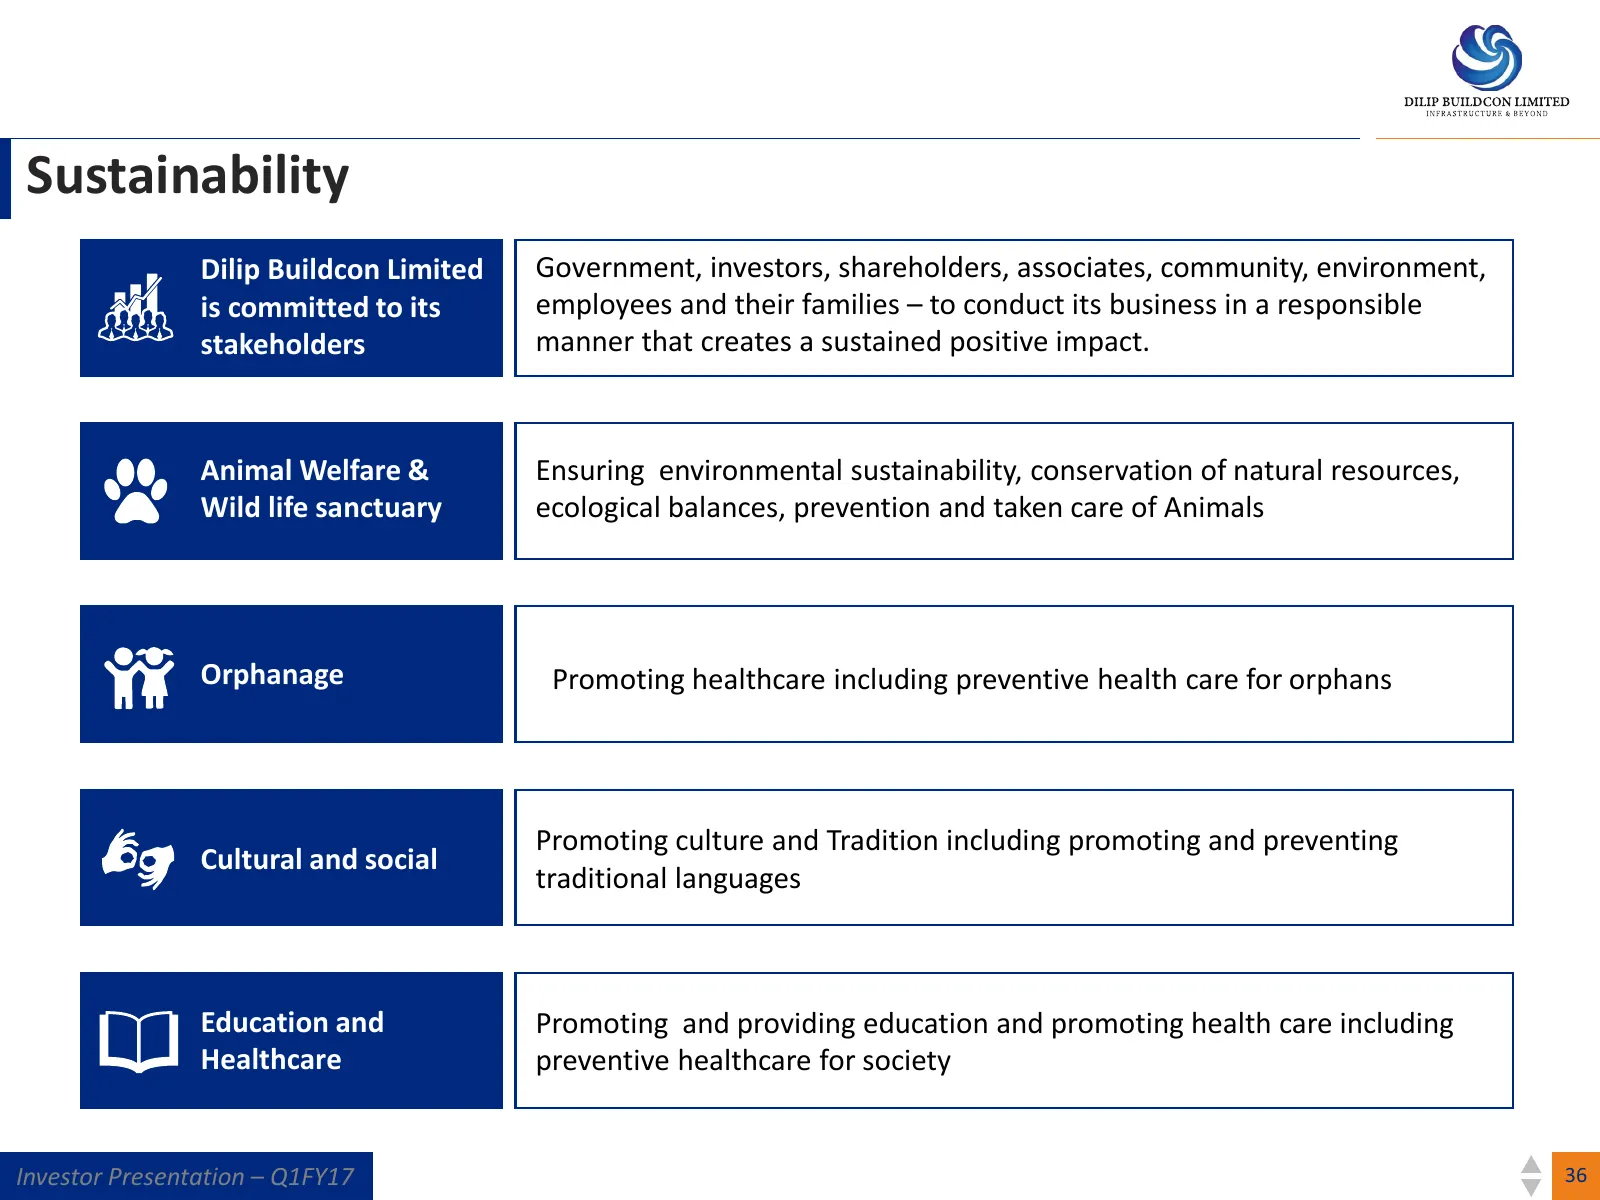
Slide 36: Sustainability
Sustainability Dilip Buildcon Limited Government, investors, shareholders, associates, community, environment, is committed to its employees and their families – to conduct its business in a responsible stakeholders manner that creates a sustained positive impact. Animal Welfare & Ensuring environme
Slide 37: Dilip Buildcon Limited
Registered Address: Dilip Buildcon Limited Plot No. 5, Inside Govind Narayan Singh Gate, Chuna Bhatti, Kolar Road, Bhopal Madhya Pradesh - 462 016 Investor Presentation Phone: 0755 - 4029999 Q1FY17 Fax: 0755 - 4029998 Email: db@dilipbuildcon.co.in CIN: U45201MP2006PLC018689
Source: Internet Archive copy of dilipbuildcon.com
More decks from Dilip Buildcon Ltd.
 Q2 & H1 FY27 Earnings Presentation43 slides · Nov 12, 2026
 Q1 FY27 Earnings Presentation38 slides · Aug 10, 2026
 Q4 FY26 Earnings Presentation43 slides · May 14, 2026
 Q3 FY26 Earnings Presentation47 slides · Feb 10, 2026
 Q2 FY26 Earnings Presentation46 slides · Nov 13, 2025
 Q1 FY26 Earnings Presentation42 slides · Jul 29, 2025