Bridge Capital — Shareholder Meeting (May 2008)
47 slides from Bridge Capital's shareholder meeting presentation, May 15, 2008
Slide 1: Annual Shareholders Meeting
CAPITAL HOLDINGS u i git Annual Shareholders Meetin May 15, 2008 Daniel P. Myers Allan C. Kramer, M.D. BRIDGE CAPITAL HOLDINGS President Chairman NASDAQ: BENK Chief Executive Officer BRIDGECAPITALHOLDINGS.COM
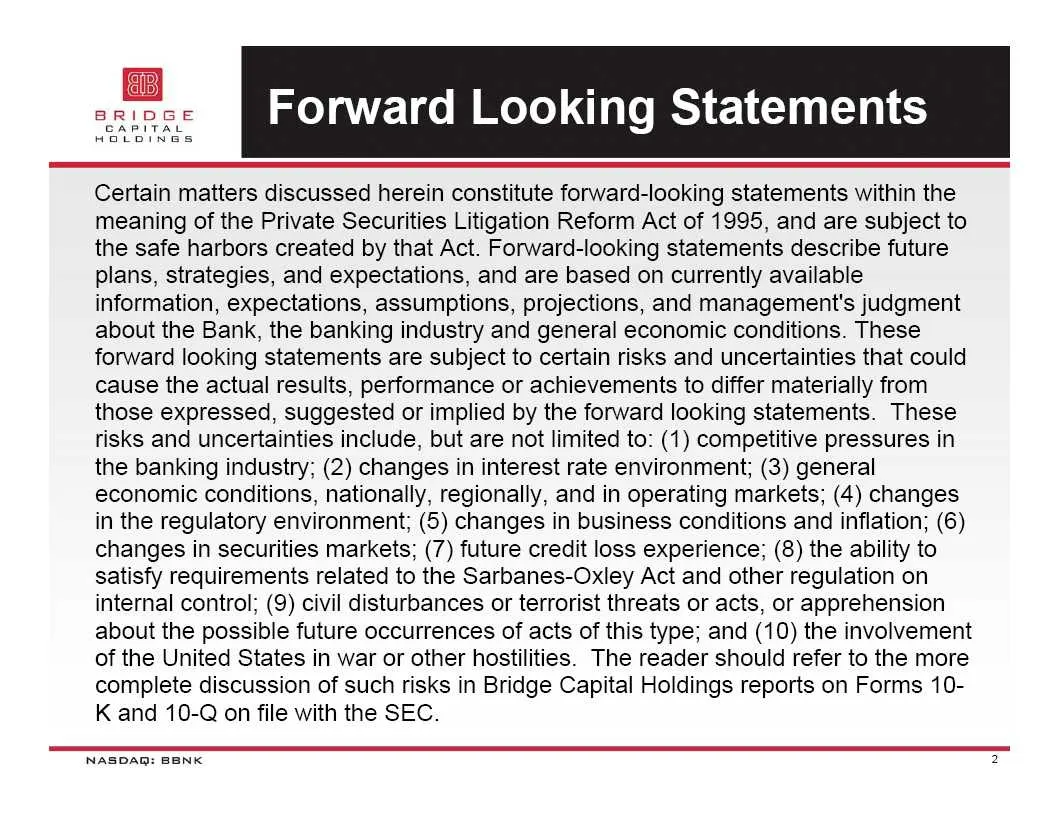
Slide 2: Forward-looking statements
Certain matters discussed herein constitute forward-looking statements within the meaning of the Private Securities Litigation Reform Act of 1995, and are subject to the safe harbors created by that Act. Forward-looking statements describe future plans, strategies, and expectations, and are based on
Slide 3: Chairman's Presentation
CAPITAL HOLDINGS CHAIRMAN’S PRESENTATION BRIDGE CAPITAL HOLDINGS Allan C. Kramer, M.D. Chairman BRID!
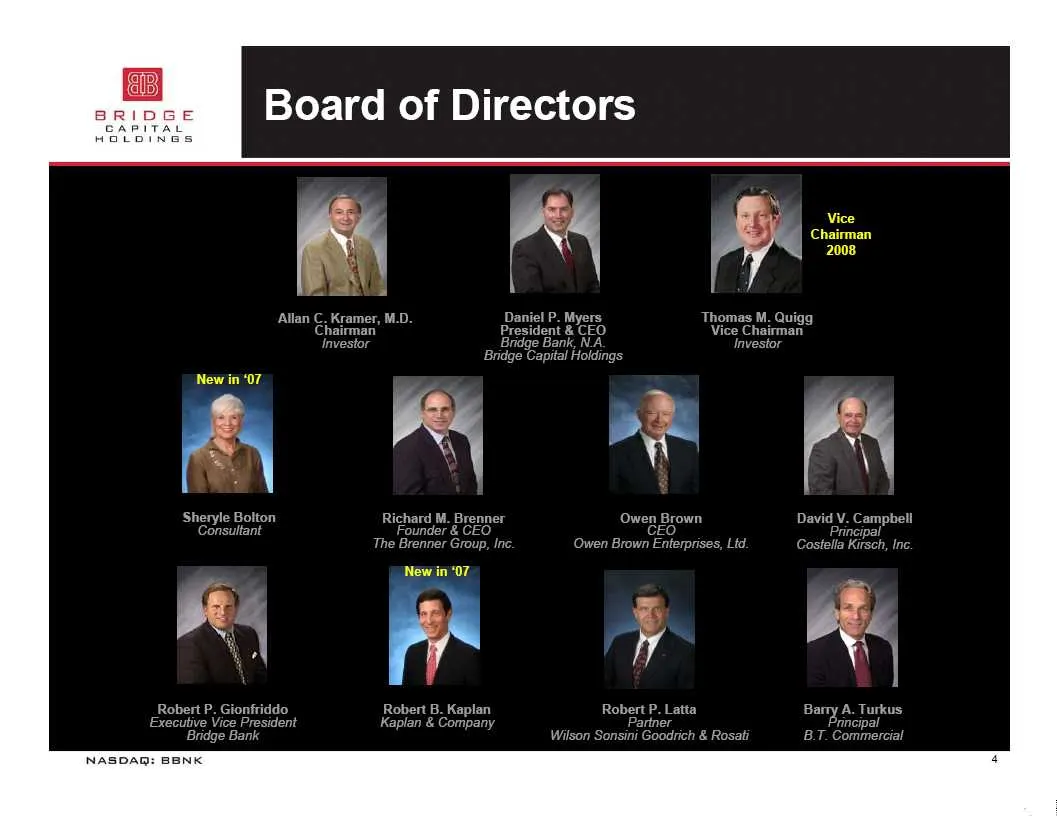
Slide 4: Board of Directors
j sy Vice Px ea i Allan C. Kramer, M.D. Daniel P. Myers Thomas M. Quigg Chairman’ President & CEO Vice Chairman Investor Bridge Bank, NA investor >>\) (_. "\ Sheryle Bolton Richard M. Brenner Owen Brown David V. Campbell Consultant Founder & CEO EO Principal The Brenner Group, Inc Owen Brown Enterpr
Slide 5: Shareholder Briefing
- erioGe BANK DGE f iy 1 aos LV L INGS /¥{! an SHAREHOLDER BRIEFING Daniel P. Myers BRIDGE CAPITAL HOLDINGS President K Chief Executive Officer
Slide 6: The Big Story: Deteriorating Economic & Business Environment
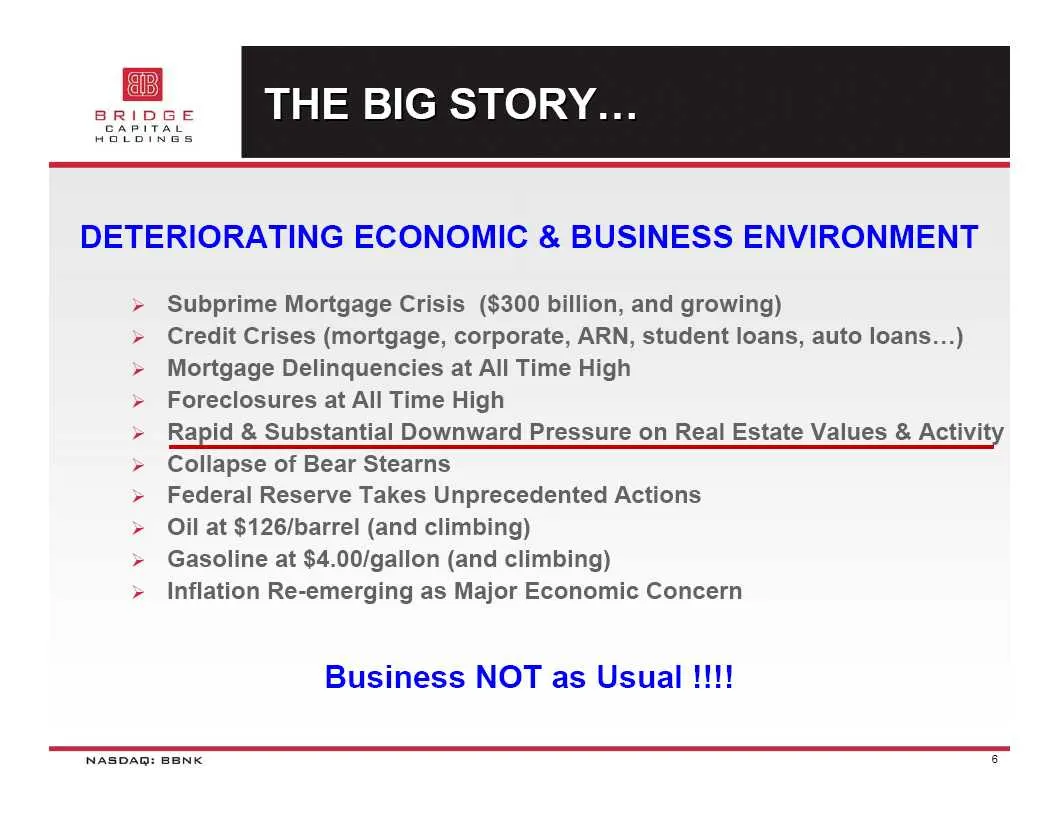
THE BIG STORY... DETERIORATING ECONOMIC & BUSINESS ENVIRONMENT >» Subprime Mortgage Crisis ($300 billion, and growing) > Credit Crises (mortgage, corporate, ARN, student loans, auto loans...) >» Mortgage Delinquencies at All Time High > Foreclosures at All Time High » Rapid & Substantial Downward Pr
Slide 7: Who's Affected?
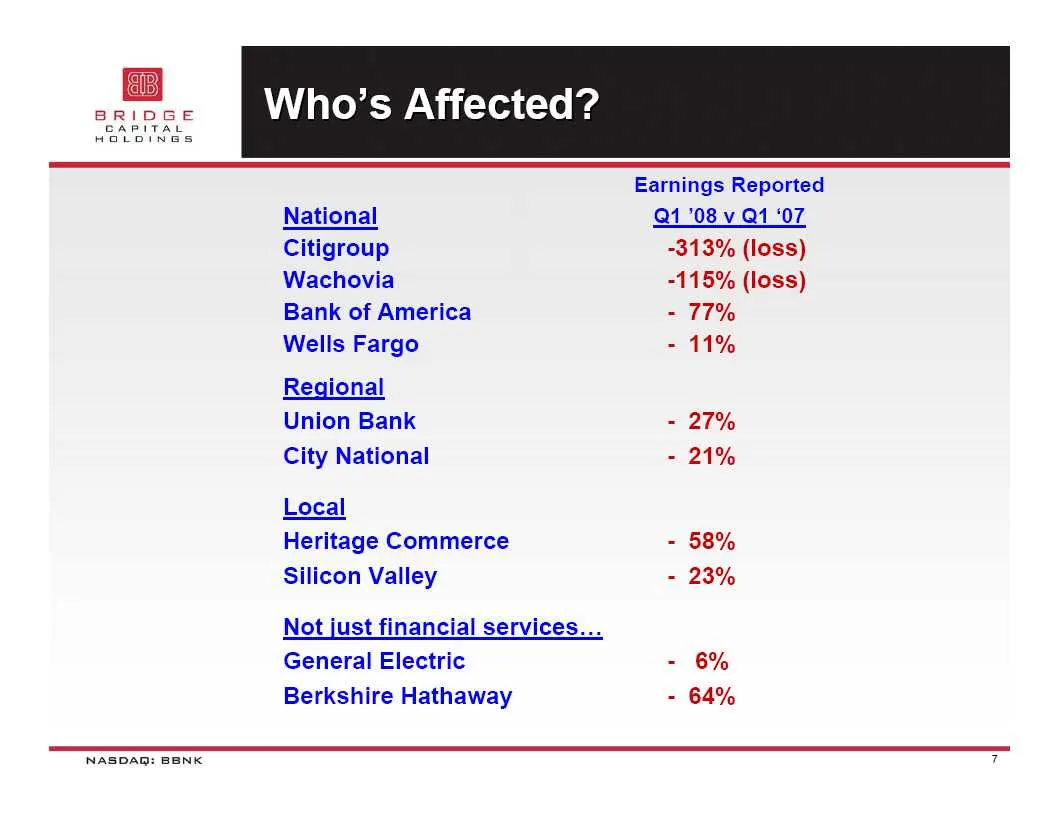
Who’s Affected? Earnings Reported National Q1 08 v Q1 ‘07 Citigroup -313% (loss) Wachovia -115% (loss) Bank of America - 717% Wells Fargo - 11% Regional Union Bank - 27% City National - 21% Local Heritage Commerce - 58% 23% Silicon Valley Not just financial services... General Electric - 6% Berkshir
Slide 8: Price Perspective
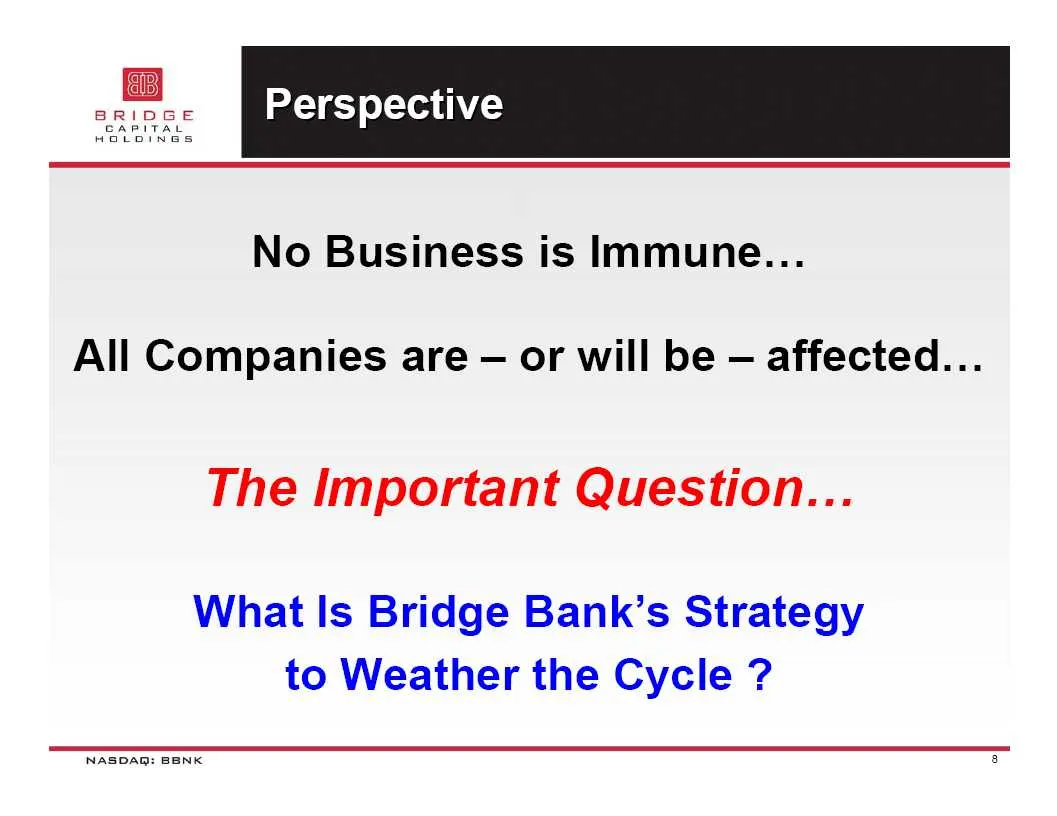
rice Perspective No Business is Immune... All Companies are — or will be — affected... The Important Question... What Is Bridge Bank’s Strategy to Weather the Cycle ? NASDAQ: BENK
Slide 9: Our Model
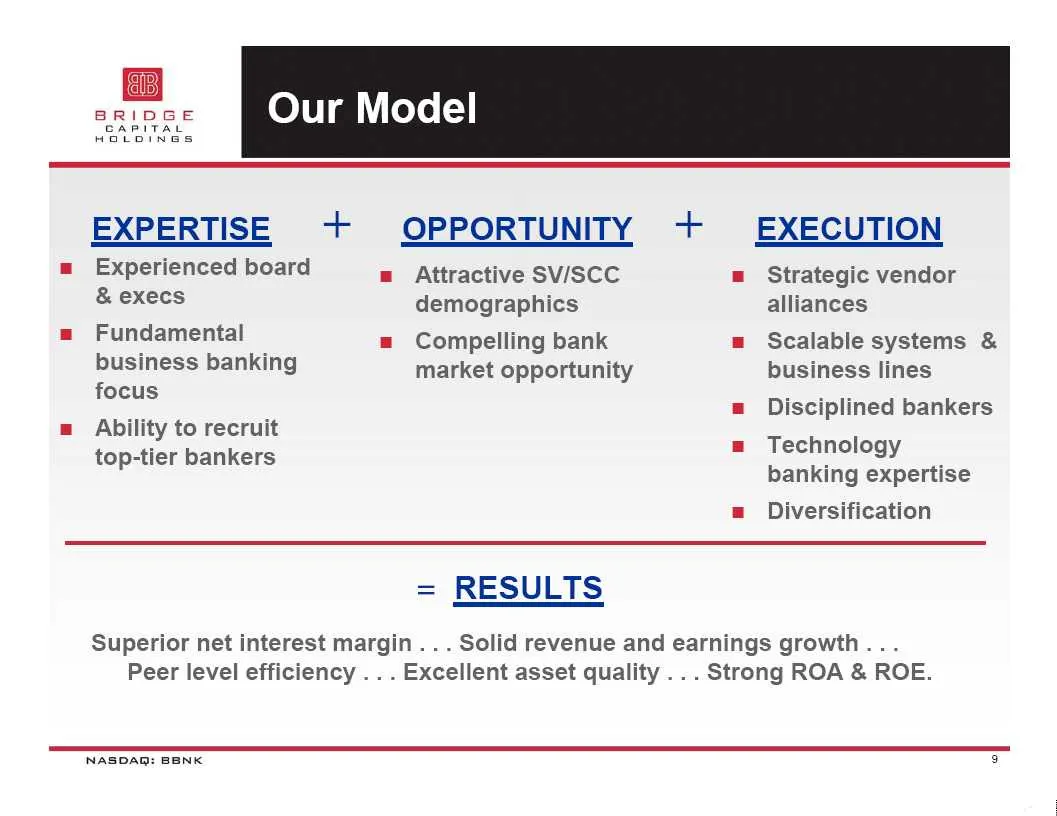
e Our Model EXPERTISE + OPPORTUNITY + EXECUTION m Experienced board = Attractive SV/SCC = Strategic vendor & execs demographics alliances = Fundamental = Compelling bank = Scalable systems & business banking market opportunity business lines focus = Disciplined bankers ms Technology banking expertis
Slide 10: Bridge Bank
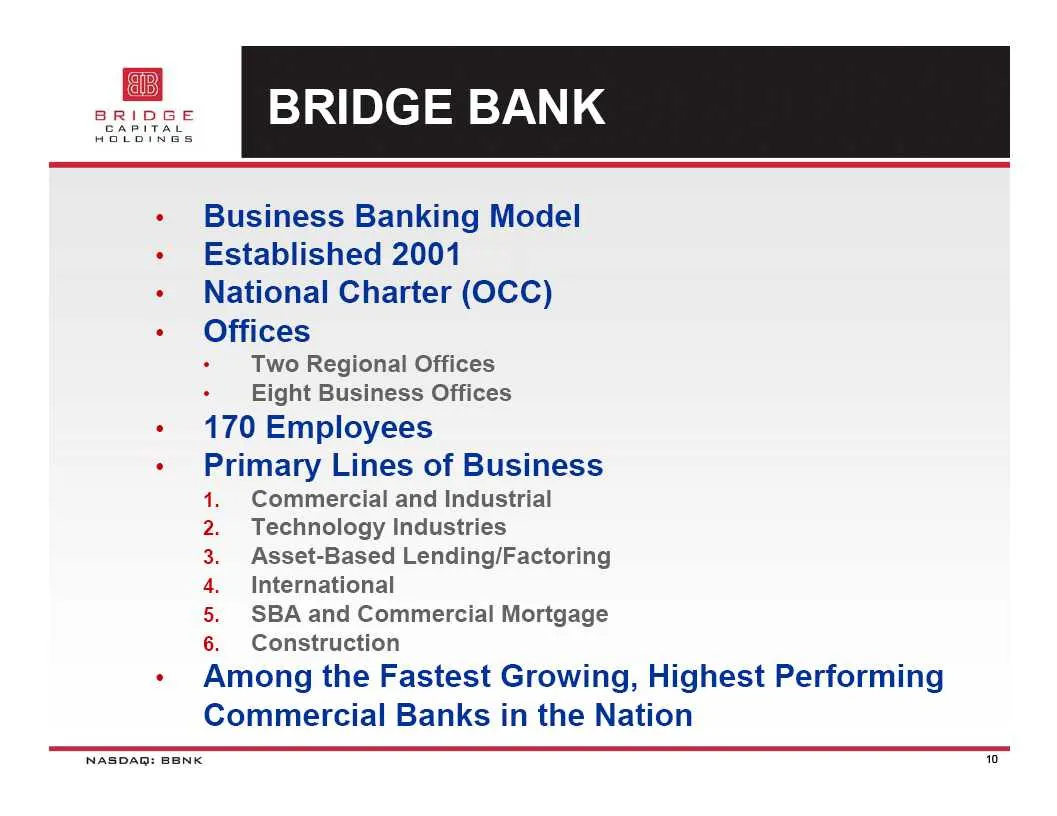
BRIDGE BANK - Business Banking Model + Established 2001 + National Charter (OCC) - Offices Two Regional Offices Eight Business Offices + 170 Employees - Primary Lines of Business 1. Commercial and Industrial Technology Industries Asset-Based Lending/Factoring International SBA and Commercial Mortgag
Slide 11: Financial Results
FINANCIAL RESULTS NASDAQ: BENK
Slide 12: Summary of Results
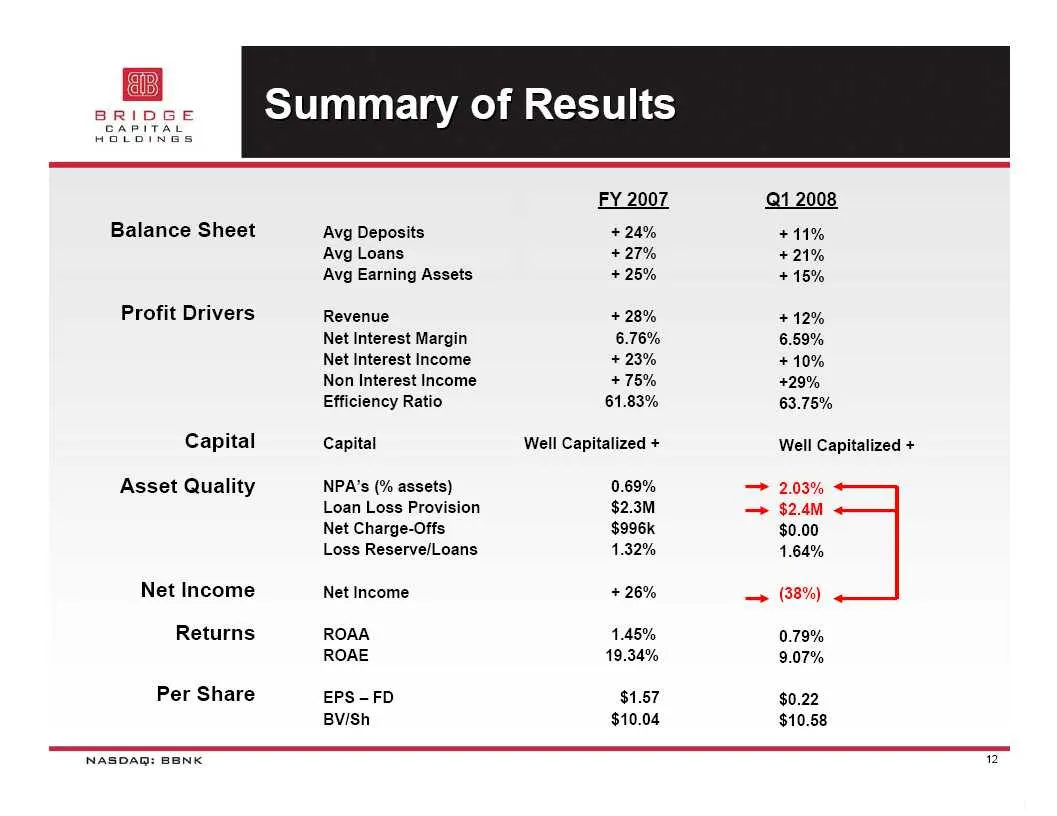
Summary of Results Balance Sheet Profit Drivers Capital Asset Quality Net Income Returns Per Share Avg Deposits ‘Avg Loans Avg Earning Assets Revenue Net Interest Margin Net Interest Income Non Interest Income Efficiency Ratio Capital NPA’s (% assets) Loan Loss Provision Net Charge-Offs Loss Reserve
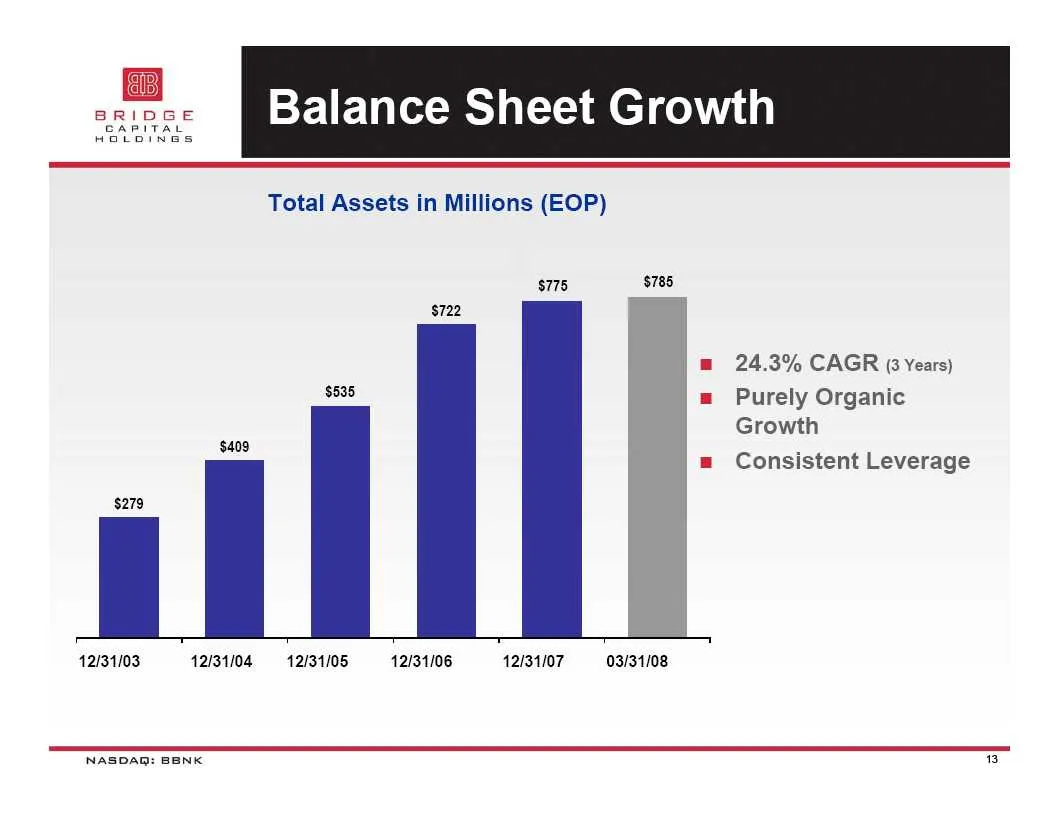
Slide 13: Balance Sheet Growth
Balance Sheet Growth Total Assets in Millions (EOP) $775 $785 $722 m 24.3% CAGR (3 Years) se m Purely Organic Growth $409 + sm Consistent Leverage 12/31/03 12131104 12/31/05 12/31/06 12/31/07 03/31/08 NASDAQ: BENK 13
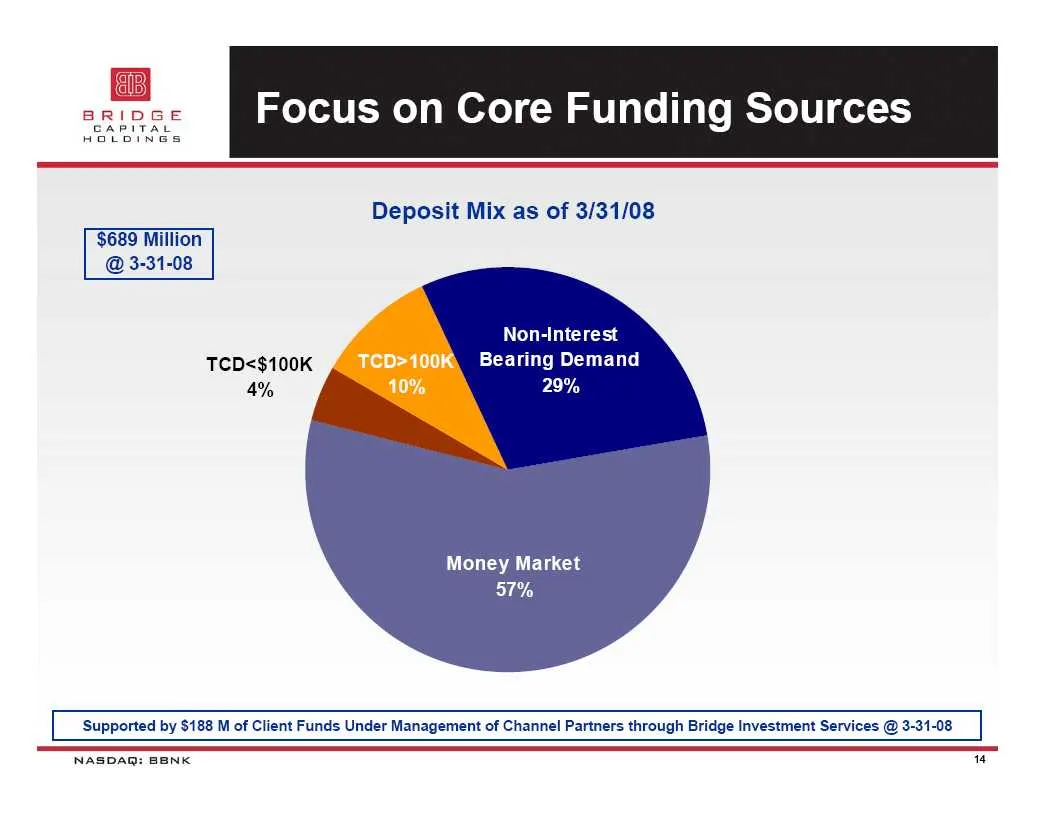
Slide 14: Deposit Mix as of 3/31/08
Deposit Mix as of 3/31/08 $689 Million @ 3-31-08 Non-Interest TCD<$100K Bearing Demand 4% . 29% Money Market 57% Supported by $188 M of Client Funds Under Management of Channel Partners through Bridge Investment Services @ 3-31-08 NASDAQ: BENK 14
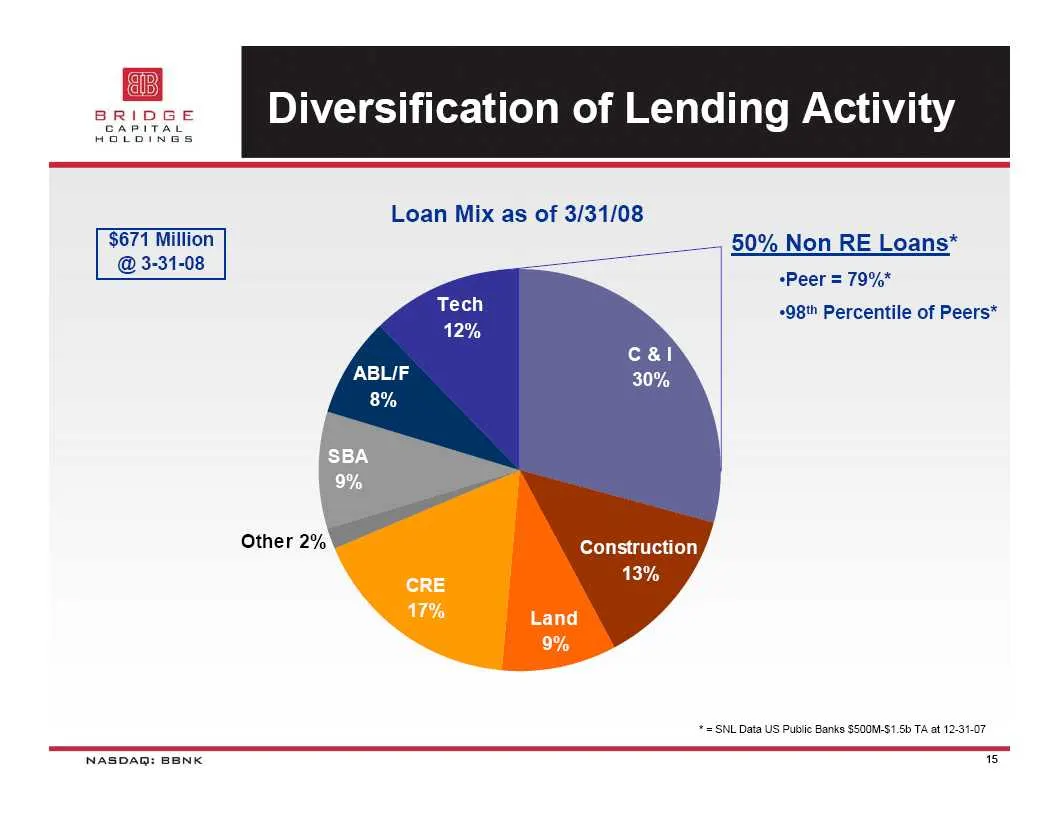
Slide 15: Loan Mix as of 3/31/08
Loan Mix as of 3/31/08 $671 Million __—, 50% Non RE Loans* @ 3-31-08 -Peer = 79%* 98" Percentile of Peers* Construction = SNL Data US Public Banks $S00M-$1.Sb TA at 12-31-07 NASDAQ: BENK 1S
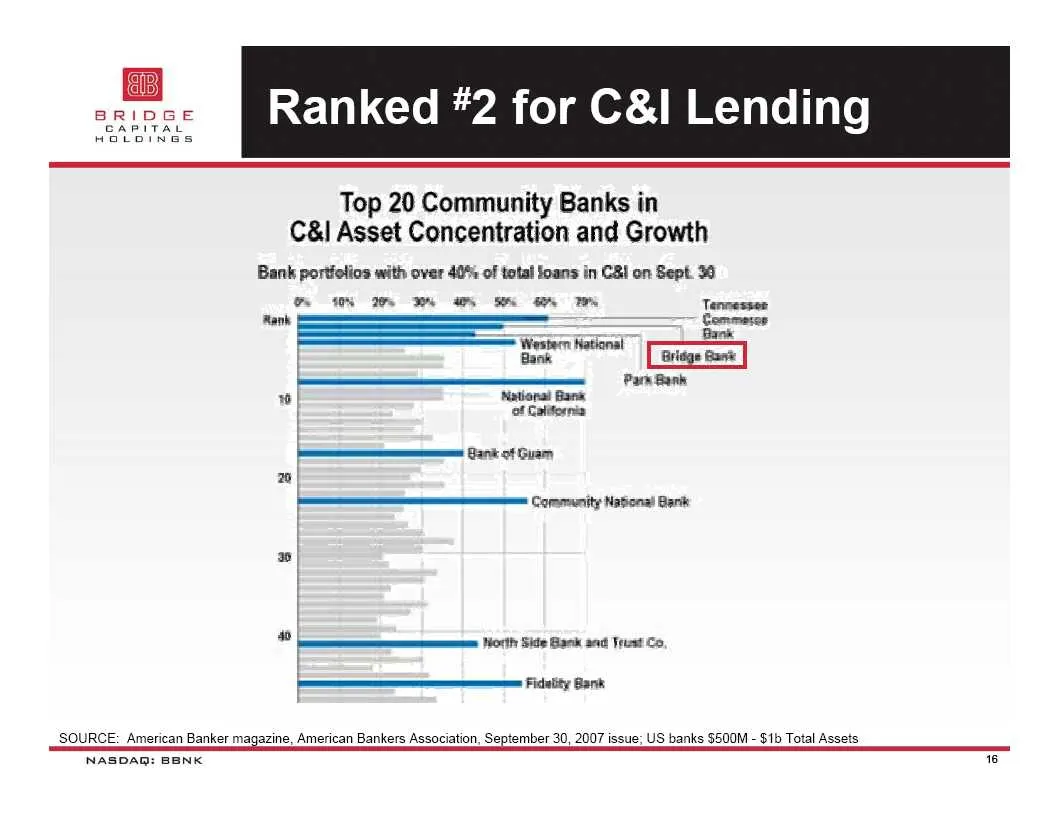
Slide 16: Ranked #2 for C&I Lending
Ranked #2 for C&l Lending Top 20 Community Banks in C&l Asset Concentration and Growth Bank portfolios with over 40%: of total Soans in C3l on Sept. 0 oO OR OS Tormeseen, ———————— = Western National Biot } Bank Griage Bane |S BT 10! Nationa! Bank | of California —— Gant of Gam nn —————— Community Na
Slide 17: A Closer Look
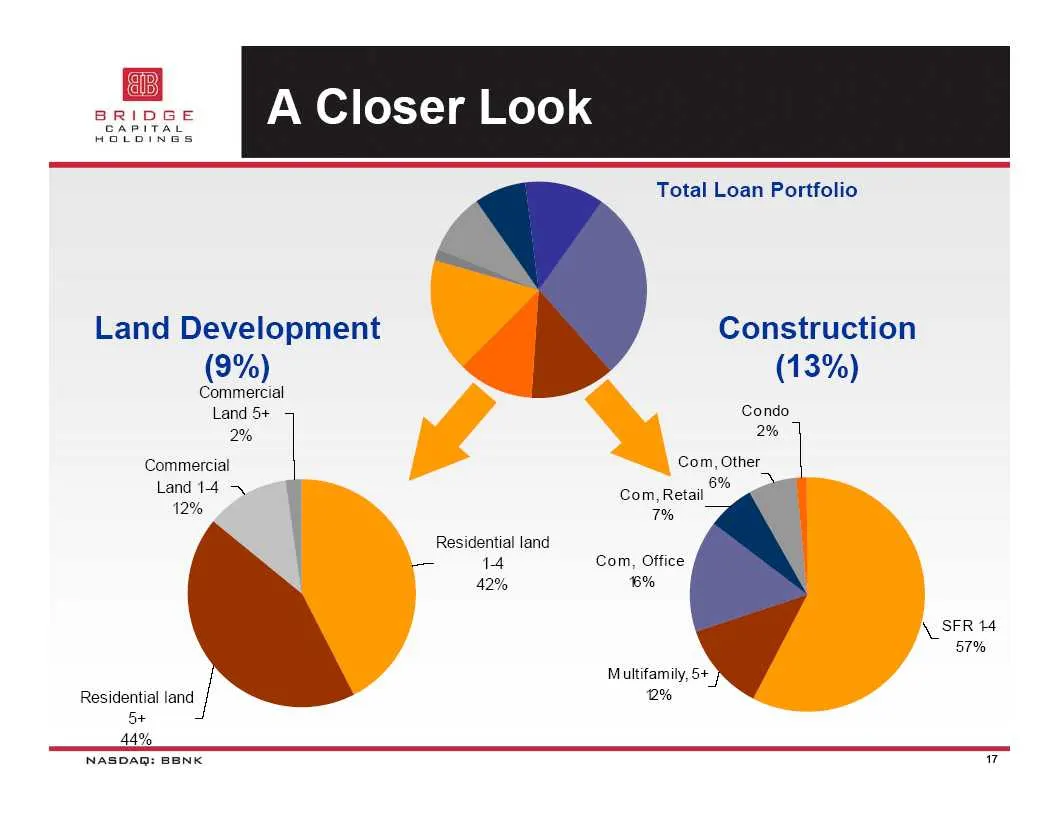
A Closer Look Total Loan Portfolio Land Development Construction (9%) (13%) Commercial Land 5+ Condo 2% 2% Commercial Com, Other » Land 1-4 ~\ 12% Com, Retail 7% Residential land 14 Com, Office 42% B% \ SFR 4 57% Multifamily, 5+ Residential land 2% 5+ 44% NASDAQ: BENK 7
Slide 18: Land Development by Region
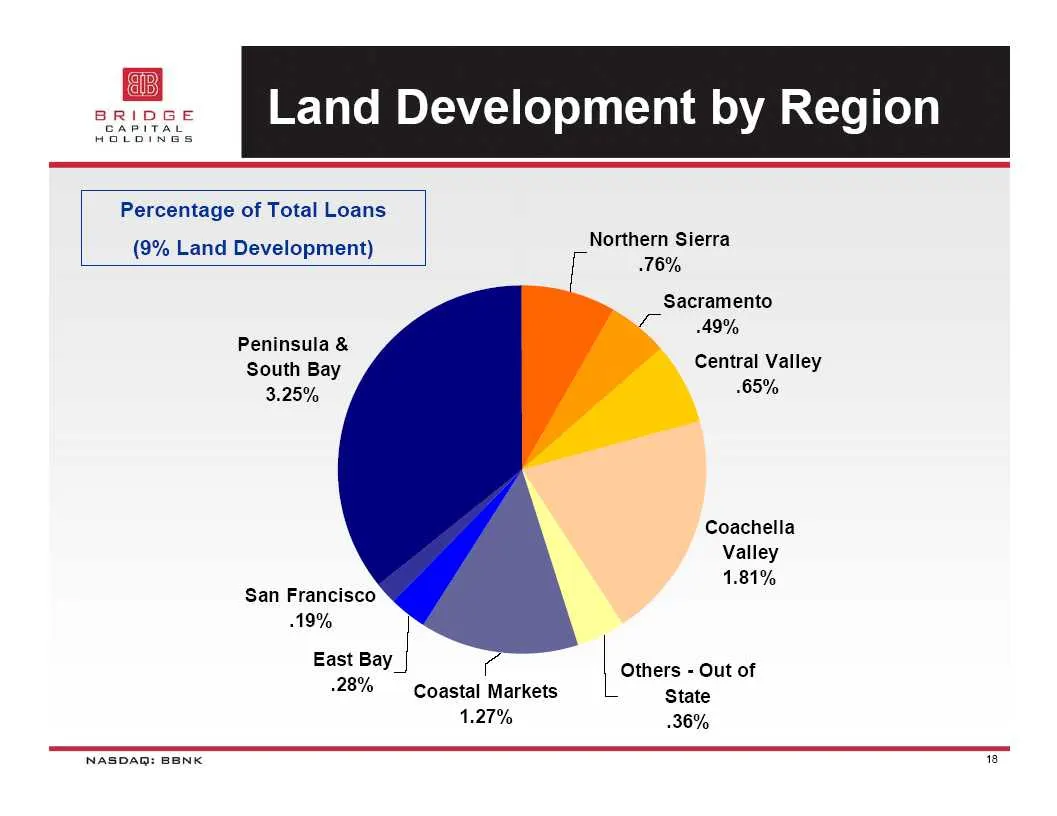
Land Development by Region Percentage of Total Loans Northern Sierra 76% (9% Land Development) Sacramento 49% Peninsula & South Bay Central Valley 3.25% 65% Coachella Valley 1.81% San Francisco 19% | East Bay if | omer - Out of -28% Coastal Markets State 1.27% 36% NASDAQ: BENK 8
Slide 19: Construction by Region
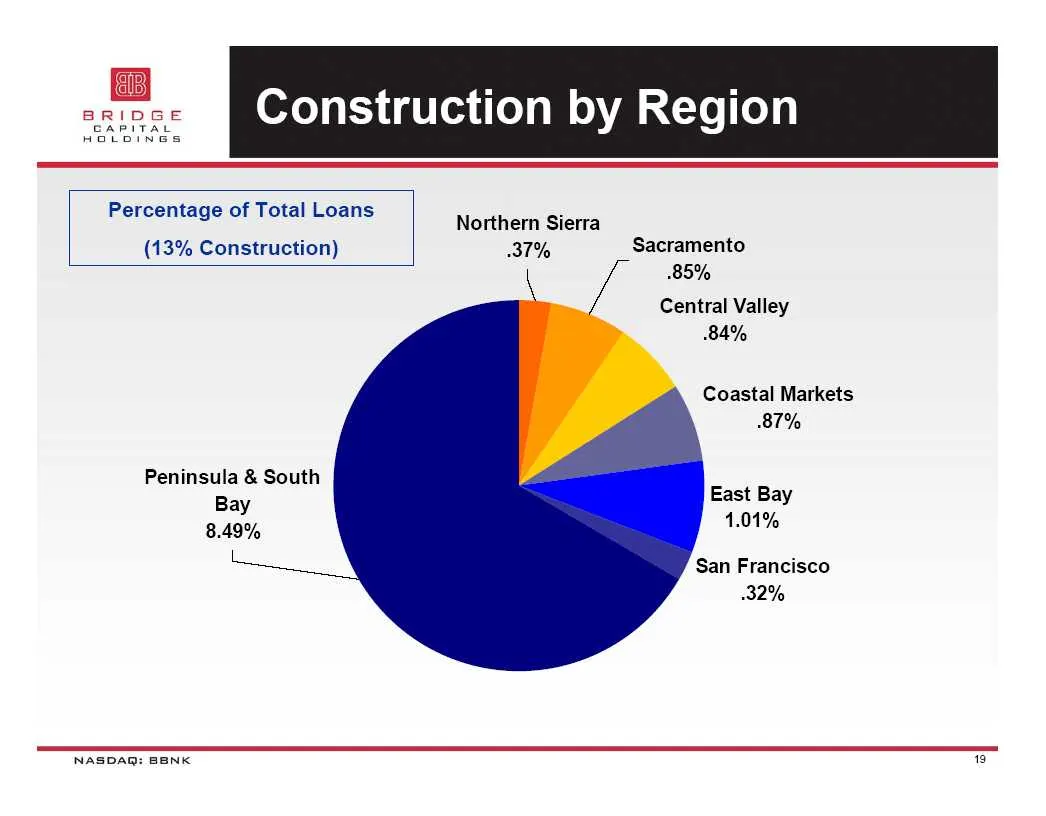
truction by Region Percentage of Total Loans Nerthem Sierra (13% Construction) 37% Sacramento 85% Central Valley 84% Coastal Markets 87% Peninsula & South Bay East Bay 8.49% 1.01% San Francisco 32% NASDAQ: BENK 8
Slide 20: Proactive Credit Risk Management
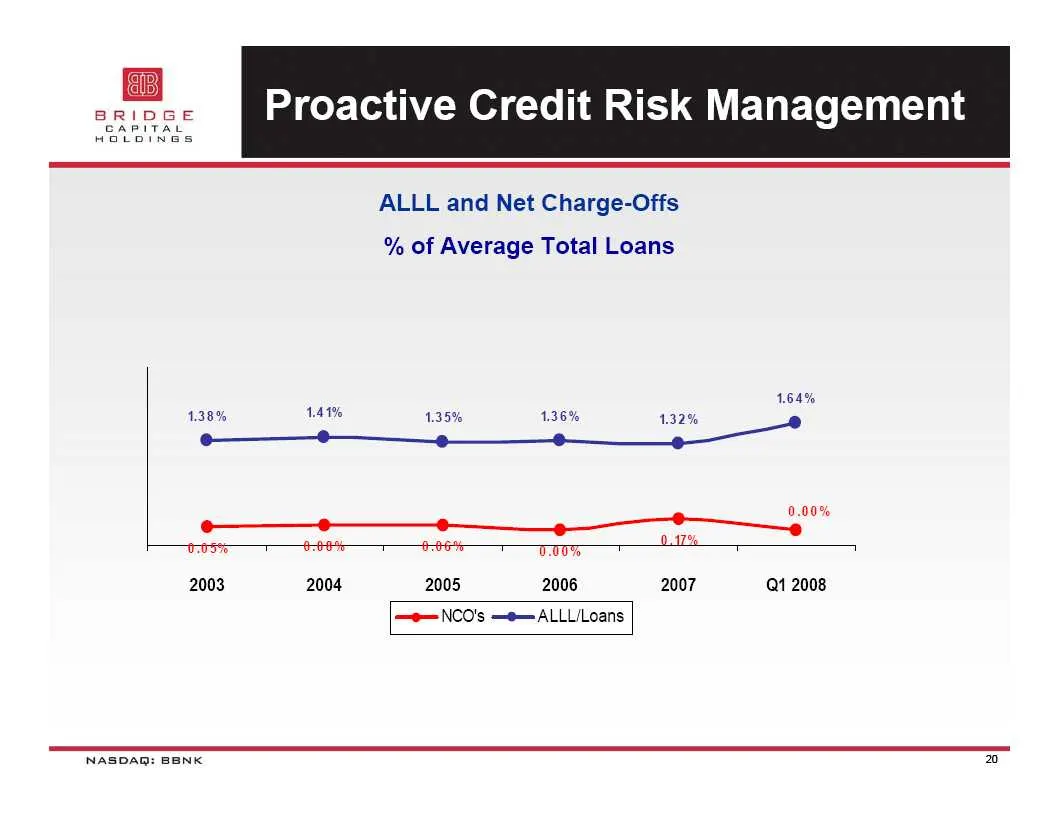
Proactive Credit Risk Management ALLL and Net Charge-Offs % of Average Total Loans hs TIO% 2003 2004 2005 2006 2007 Q1 2008 —e—NCO's —@—=ALLL/Loans NASDAQ: BENK 20
Slide 21: Proactive Credit Risk Management
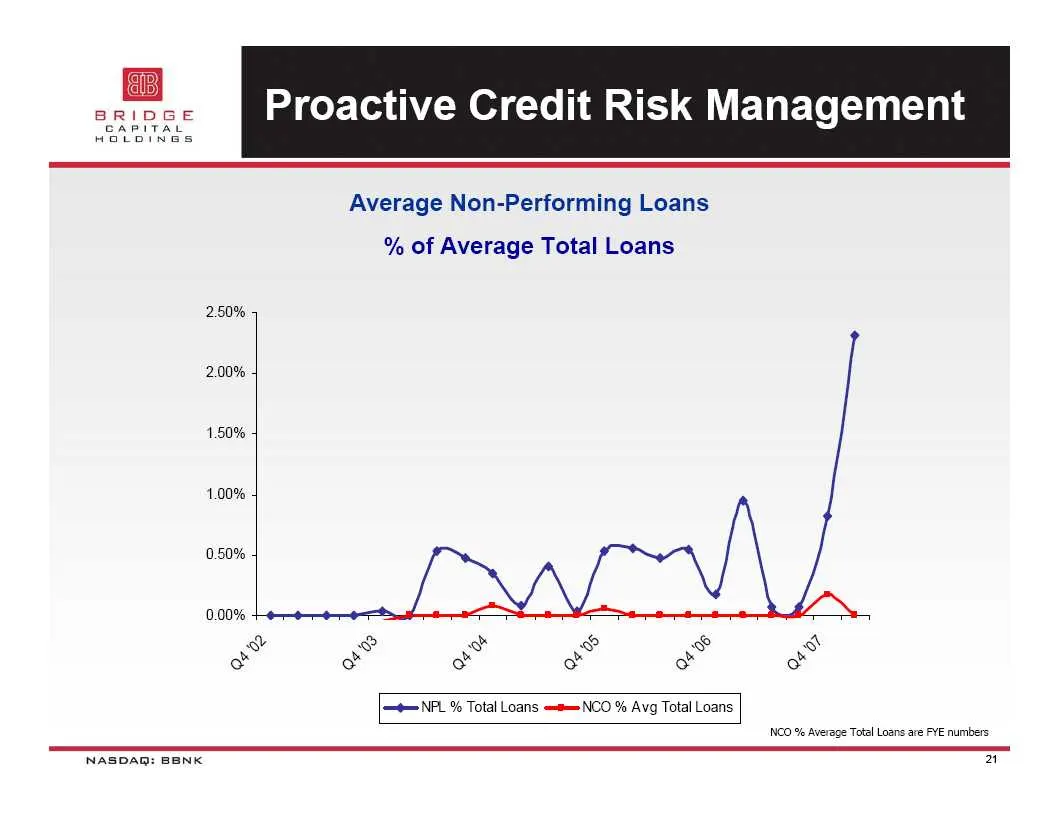
Proactive Credit Risk Management NASDAQ: BENK 2.50% 2.00% 1.50% 1.00% 0.50% Average Non-Performing Loans % of Average Total Loans [+= NFL % Total Loans =s=NCO % Avg Total Loans NCO % Average Total Loans ave FYE numbers 21
Slide 22: Proactive Credit Risk Management
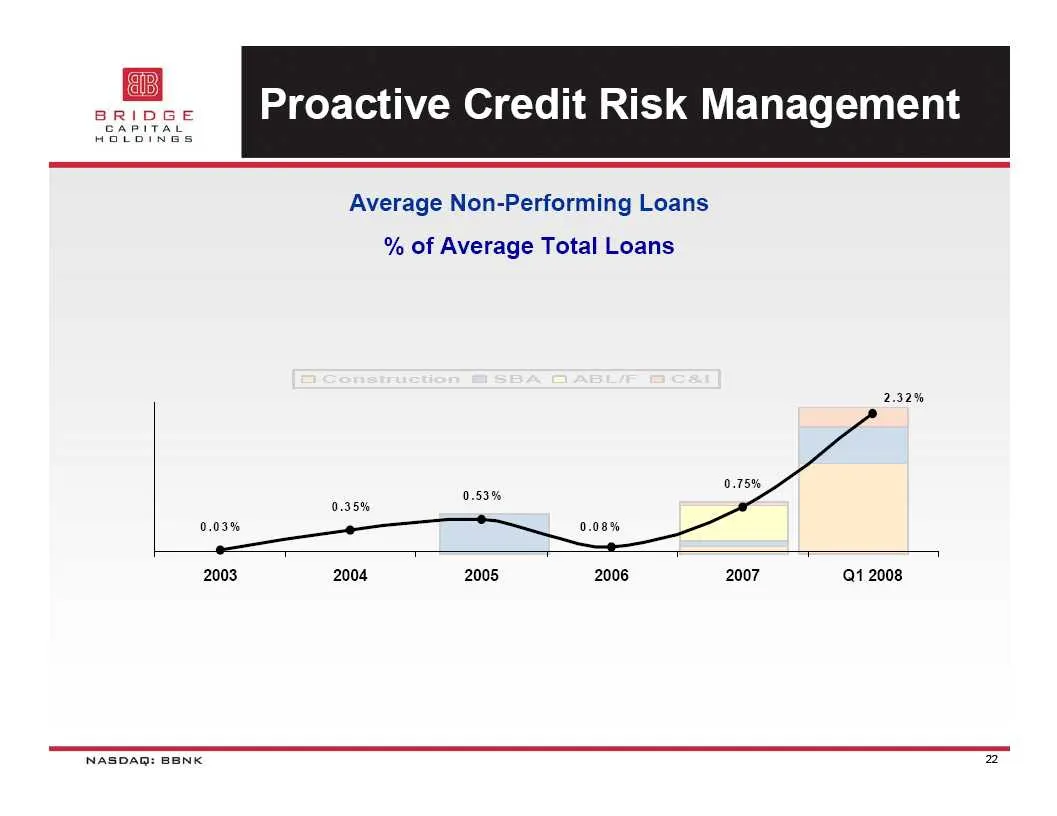
Proactive Credit Risk Management Average Non-Performing Loans % of Average Total Loans 2.32% 2003 2004 2005 2006 2007 Q1 2008 NASDAQ: BENK 22
Slide 23: Revenue Growth
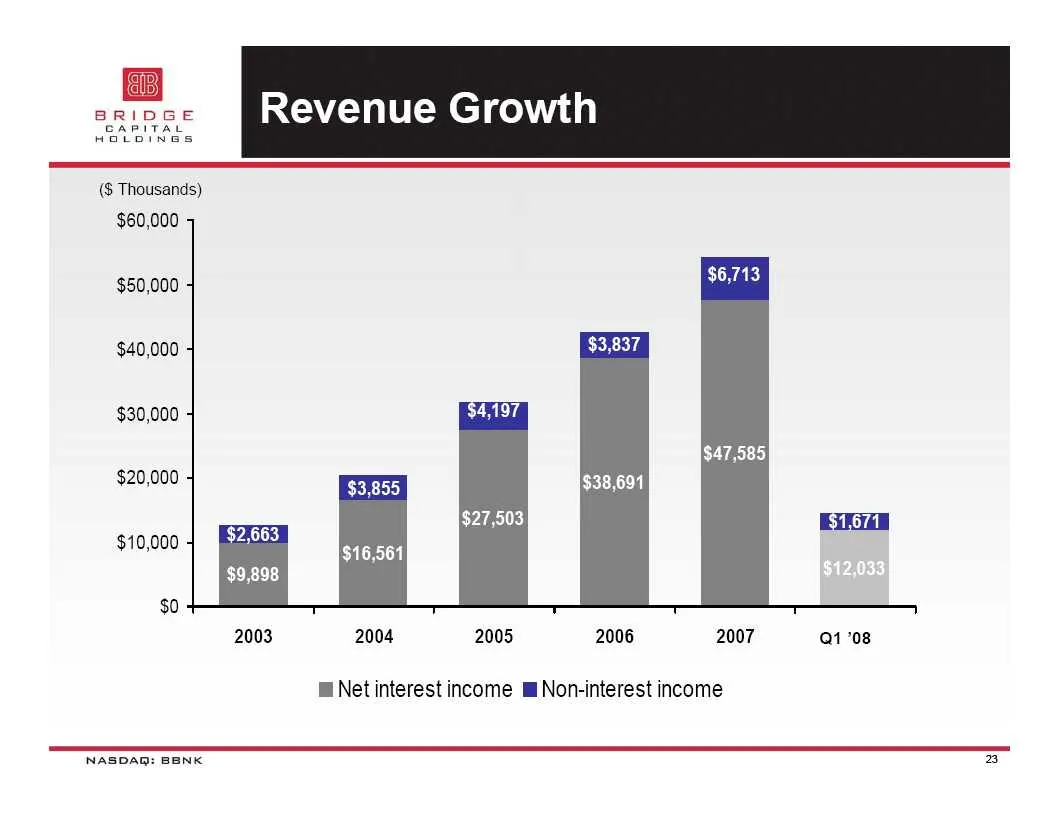
Revenue Growth ($ Thousands) $60,000 $50,000 $40,000 $30,000 $20,000 $10,000 $0 2003 2004 2005 2006 2007 Q1 08 @Net interest income m Non-interest income NASDAQ: BENK 2
Slide 24: Highly Productive Employees
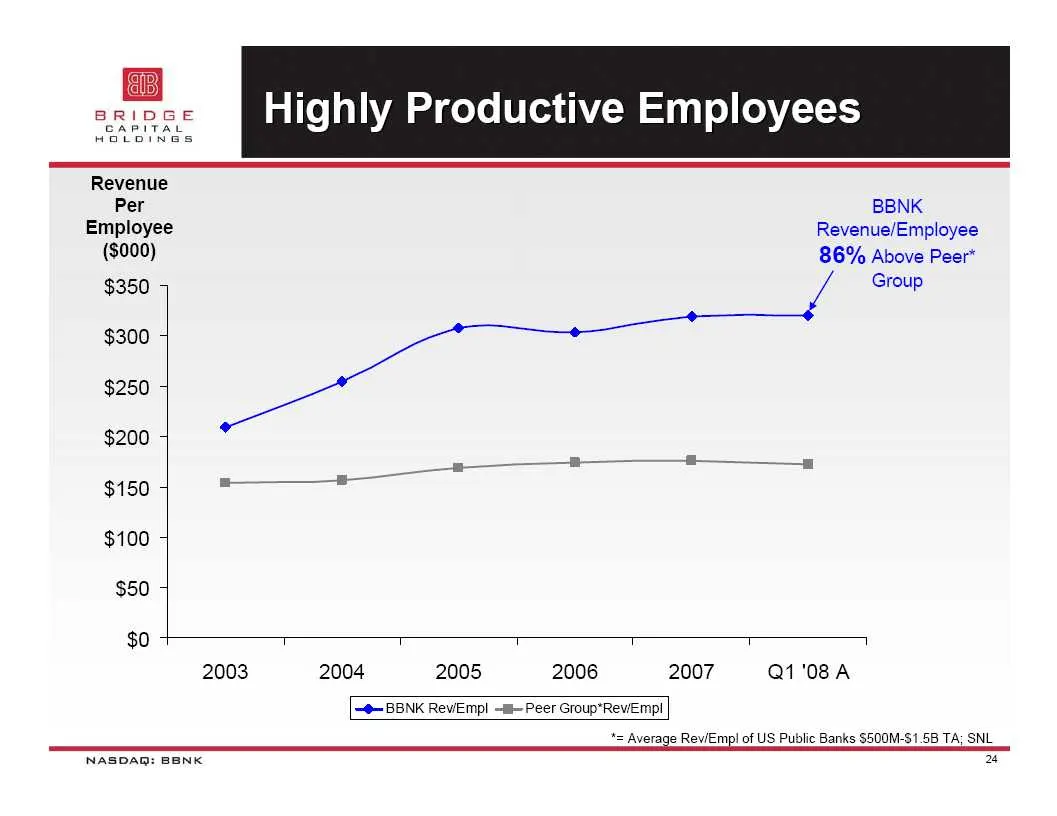
Highly Productive Employees Revenue Per BBNK Employee Revenue/Employee ($000) 86% Above Peer* $350 4 Group $300 5 $250 4 $200 4 $150 *———*—_— $100 5 $50 4 $0 T T T T T 1 2003 2004 2005 2006 2007 Q1'08A ~@—BBNK ReviEmpl ~~ Peer Group*ReviEmp! *= Average ReviEmpl of US Public Banks S500M-S1_58 TA; SNL
Slide 25: Q1 '08 loan mix
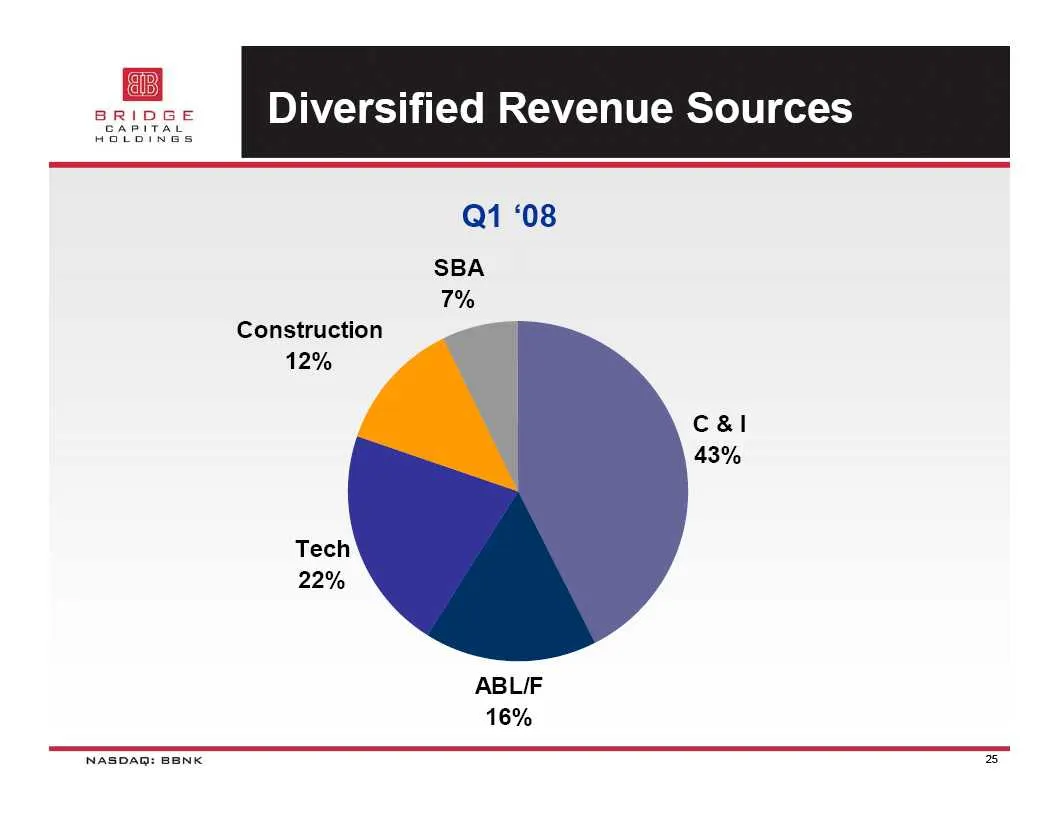
Q1 ‘08 SBA 7% Construction 12% cal 43% ABLIF 16% NASDAQ: BENK 25
Slide 26: High Quality Business: Net Interest Margin
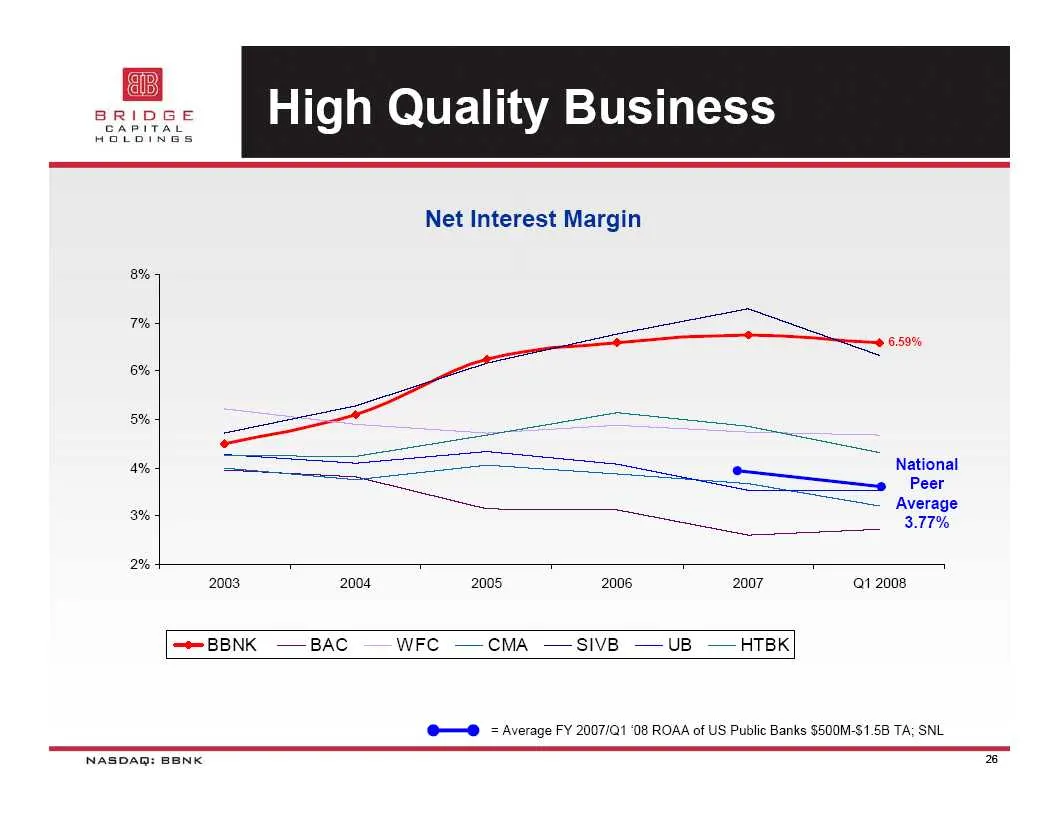
High Quality Business Net Interest Margin T% 6.50% 6% 5% 4% National Peer 7 Average as 3.77% 2% + 2003 2004 2005 2006 2007 Q1 2008 —-BBNK —BAC WFC _—CMA —SIVB —UB —HTBK @—© = Average FY 2007/01 ‘08 ROAA of US Public Banks $500M-$1.5B TA; SNL NASDAQ: BENK 28
Slide 27: Effective Expense Management
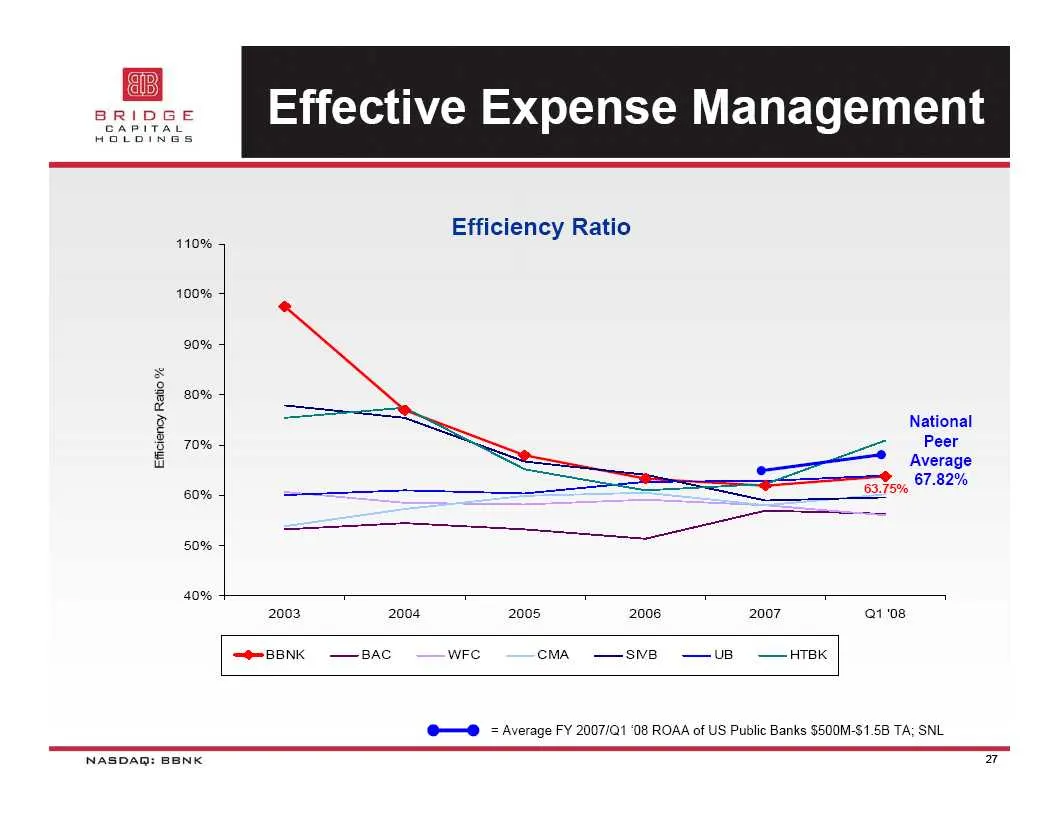
Effective Expense Management Efficiency Ratio 110% 100% 20% 20% ed z National 5 70% Peer hal Average 9, 67-82% oe 63.75% 50% 40% 2003 2004 2008 2006 2007 a1 08 —e5BNK =—Bsac wre cMA —sve —UB —HTBK @—© = Average FY 2007/01 ‘08 ROAA of US Public Banks $500M-$1.5B TA; SNL NASDAQ: BENK 2
Slide 28: ROAA
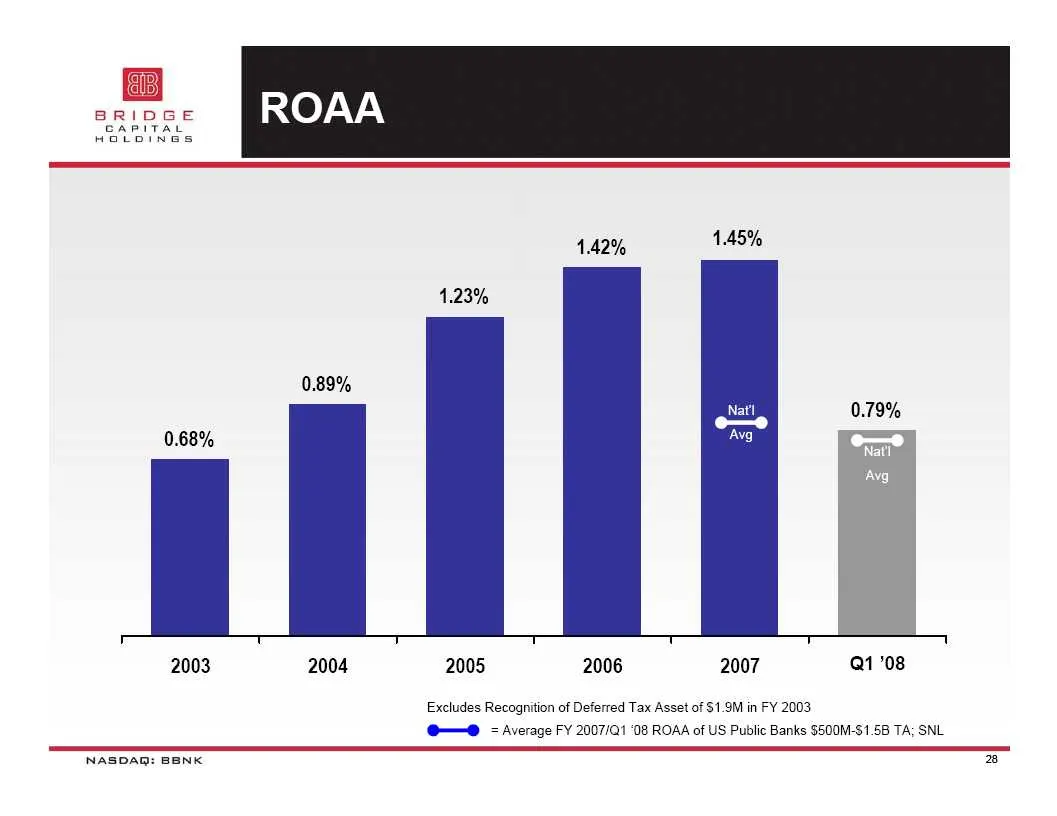
ee ROAA HoLorNGs 1.42% 145% 1.23% 0.89% Natl 0.79% 0.68% Ag — 2003 2004 2005 2006 2007 Q1'08 Excludes Recognition of Deferred Tax Asset of $1.9M in FY 2003 @—© = Average FY 2007/01 ‘08 ROAA of US Public Banks $500M-S1.5B TA; SNL NASDAQ: BENK
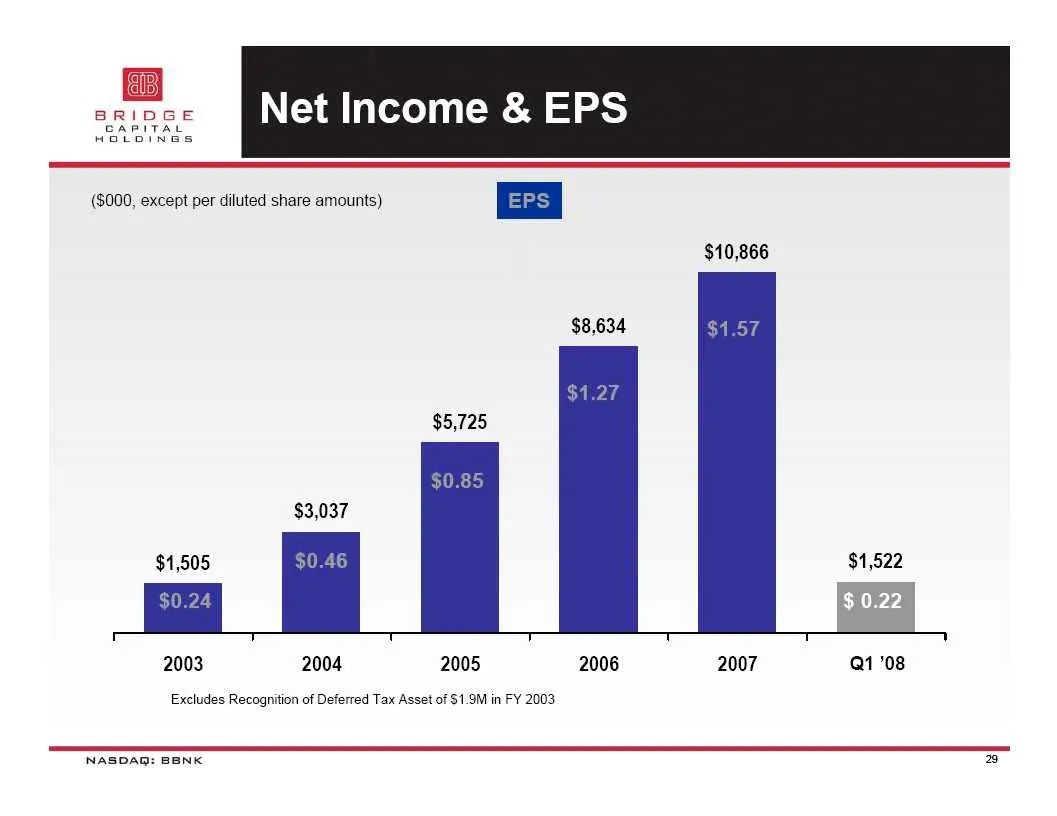
Slide 29: Net Income & EPS
Net Income & EPS (8000, except per diluted share amounts) $10,866 $3,037 2003 2004 2005 2006 2007 Q1'08 Excludes Recognition of Deferred Tax Asset of $1.9M in FY 2003 NASDAQ: BENK 29
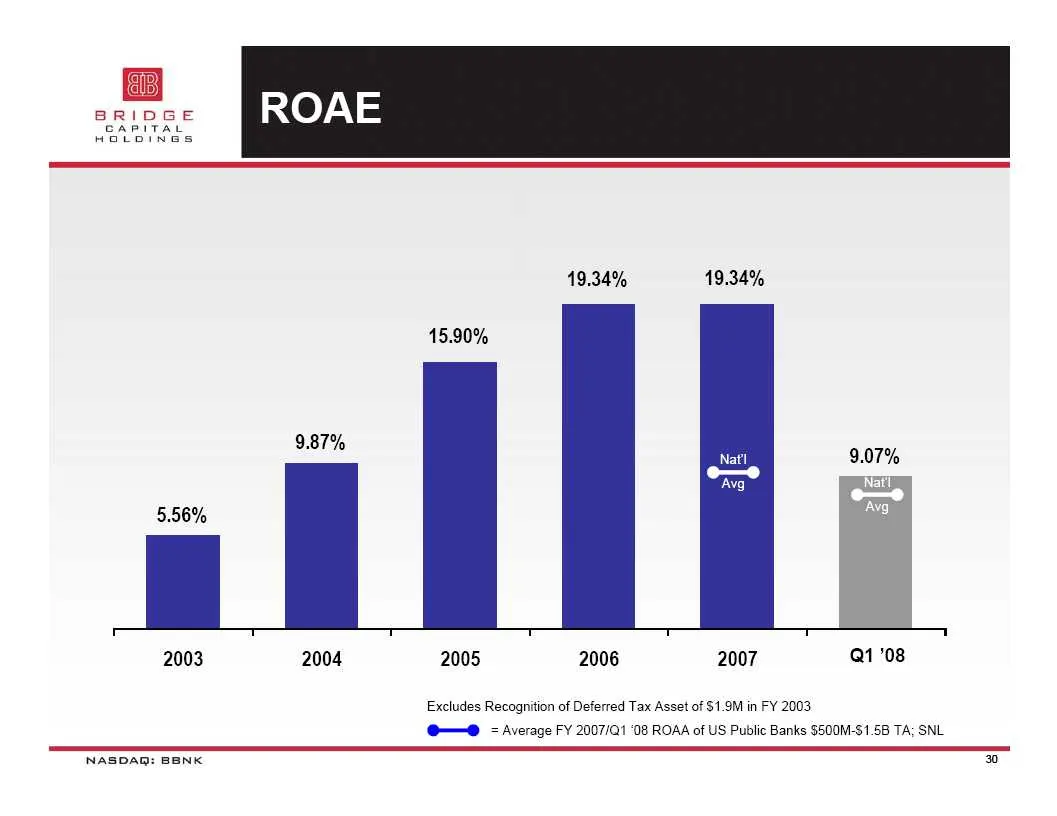
Slide 30: ROAE
19.34% 19.34% 15.90% m oh Natl 9.07% ce Nat oe 5.56% ag 2003 2004 2005 2006 2007 Q1 08 Excludes Recognition of Deferred Tax Asset of §1.9M in FY 2003 @—@ = Average FY 2007/01 ‘08 ROAA of US Public Banks $500M-S1.5B TA; SNL NASDAQ: BENK 20
Slide 31: Equity Performance
EQUITY PERFORMANCE NASDAQ: BENK
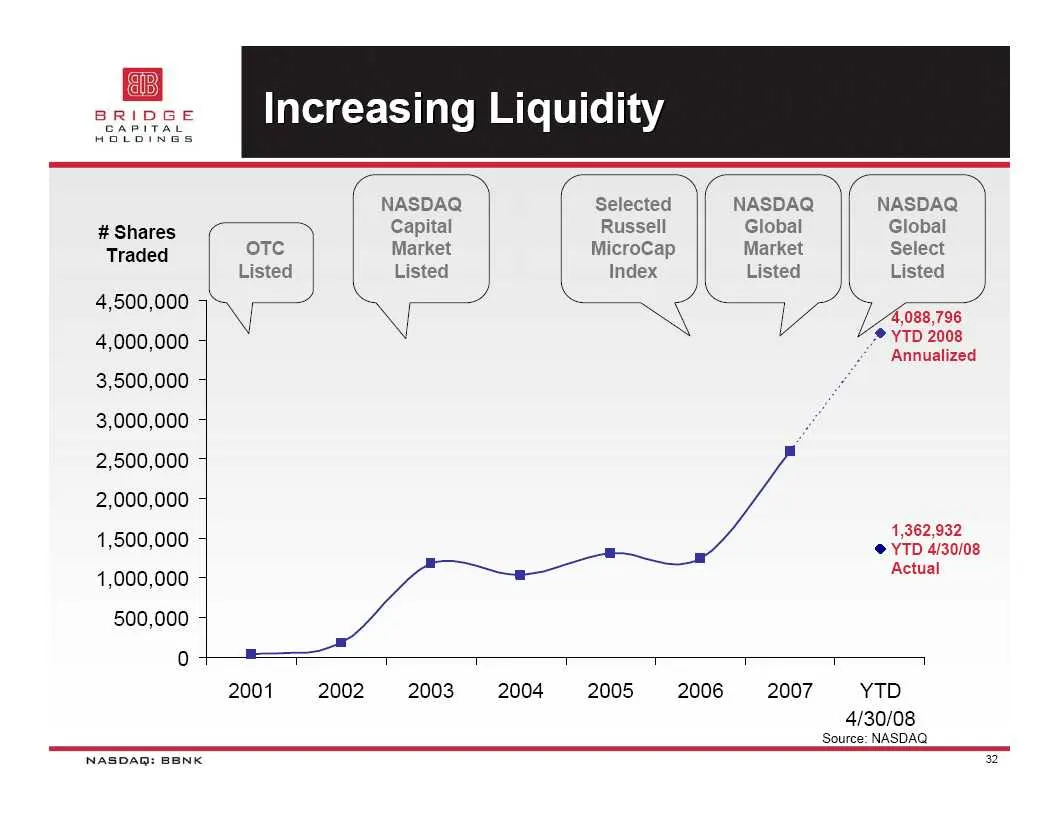
Slide 32: NASDAQ index performance
4,500,000 4 4,000,000 + 3,500,000 4 3,000,000 4 2,500,000 + 2,000,000 + 1,500,000 4 1,000,000 500,000 4 NASDAQ Selected NASDAQ NASDAQ Capital Russell Global Global Market MicroCap Market Select Listed Index Listed Listed ie) Sf v Va /, A088,796 \ @ YTD 2008 Annualized 1,362,932 @ YTD 4/30/08 Actual
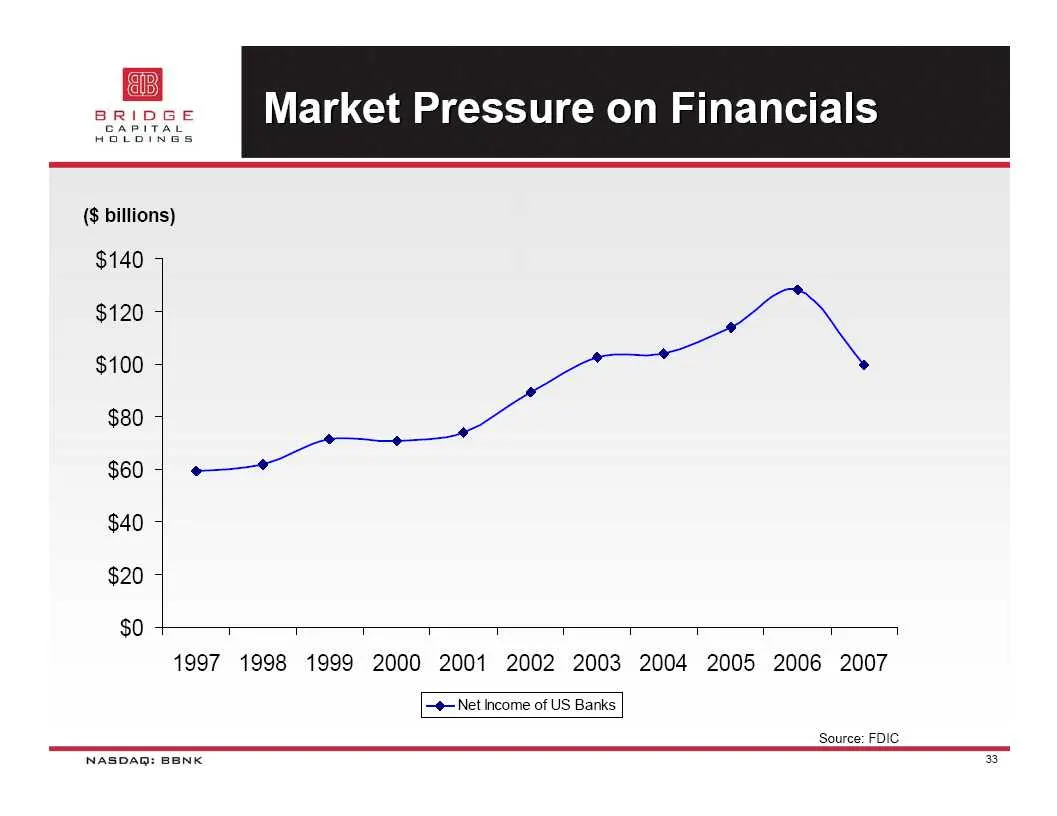
Slide 33: Market Pressure on Financials
Market Pressure on Financials ($ billions) $140 5 $120 4 $100 5 $80 4 $60 | $40 4 $20 4 $0 T T T T T T T T T T 1 1997 1998 1999 2000 2001 2002 2003 2004 2005 2006 2007 © Net income of US Banks Source: FDIC NASDAQ: BENK 33
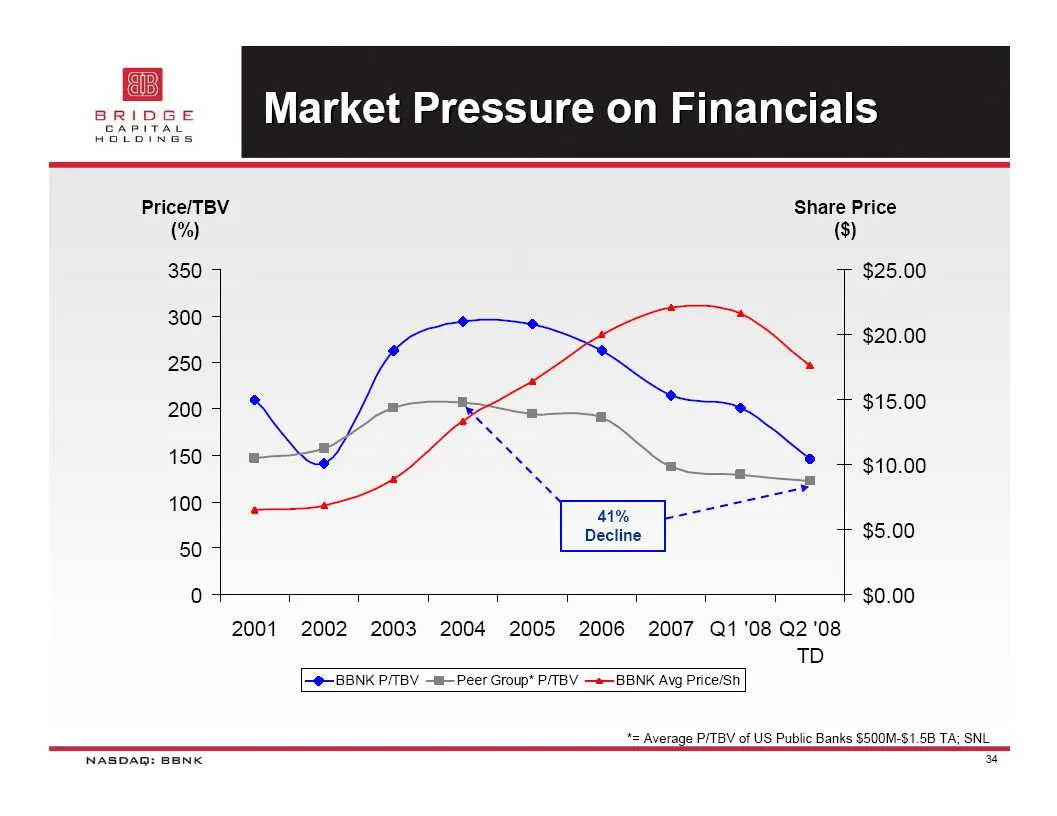
Slide 34: Market Pressure on Financials
Market Pressure on Financials Price/TBV Share Price (%) ($) 350 4 7 $25.00 300 5 + $20.00 250 7 200 4 + $15.00 150 4 7 $10.00 100 5 7 $5.00 507 0 T T T T T T T T 0.00 2001 2002 2003 2004 2005 2006 2007 Q1'08 Q2'08 TD -@-BBNK P/TBV -l Peer Group* PTV —*—BBNK Avg Price/Sh ‘= Average P/TBV of US Public
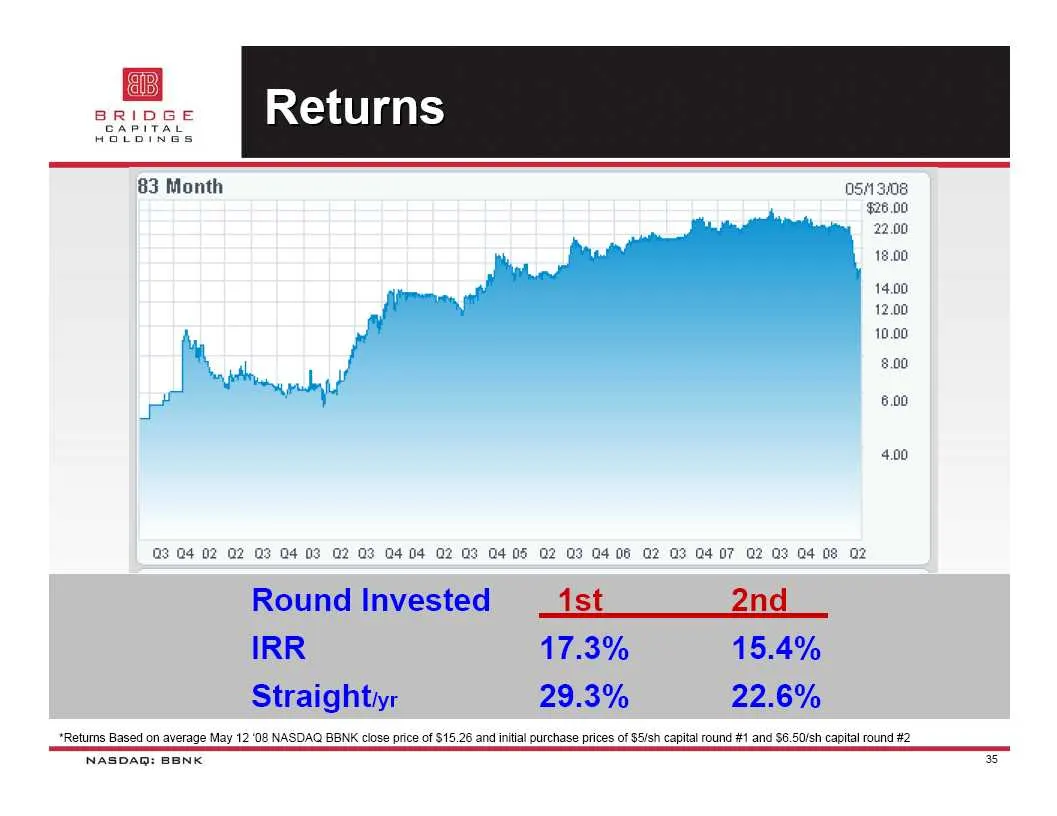
Slide 35: Investor returns by capital round
83 Month G3 04 02 3 O4 02 G2 03 0404 02 03 0408 02 03 0408 O2 03 D4 07 O2 03 OF Round Invested ist 2nd IRR 17.3% 15.4% Straightiyr 29.3% 22.6% *Retums Based on average May 12 ‘08 NASDAQ BBNK close price of $15.26 and intial purchase prices of $6/sh capital round #1 and $6.50/sh capital round #2 NASD
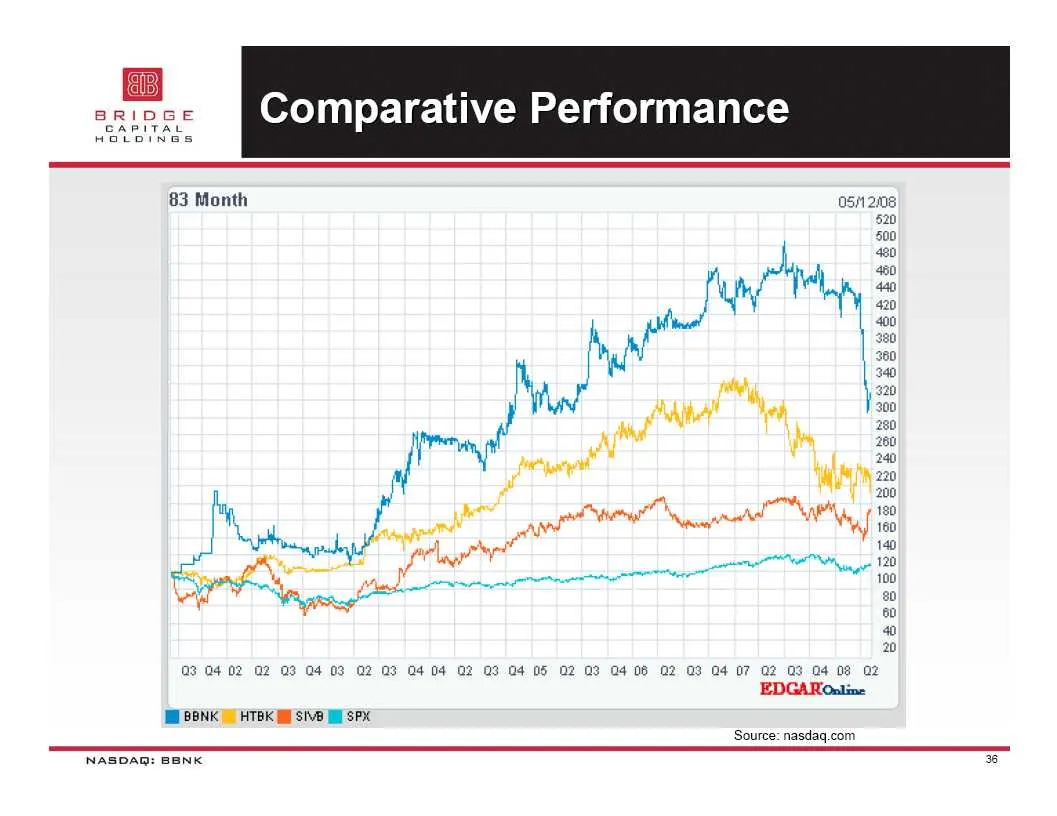
Slide 36: Comparative Performance
Comparative Performance 83 Month sit 03 04 02 G2 03 04 03 O2 03 04.04 G2 03 4 05 O2 OF 0406 O2 G8 04 OF O2 03 O4 09 O2 EDGAROnline I BBNK jl) HTBK MM SVB MM SPX Source: nasdaq.com NASDAQ: BENK ES
Slide 37: Looking Ahead
LOOKING AHEAD NASDAQ: BENK
Slide 38: Bridge Bank Strength
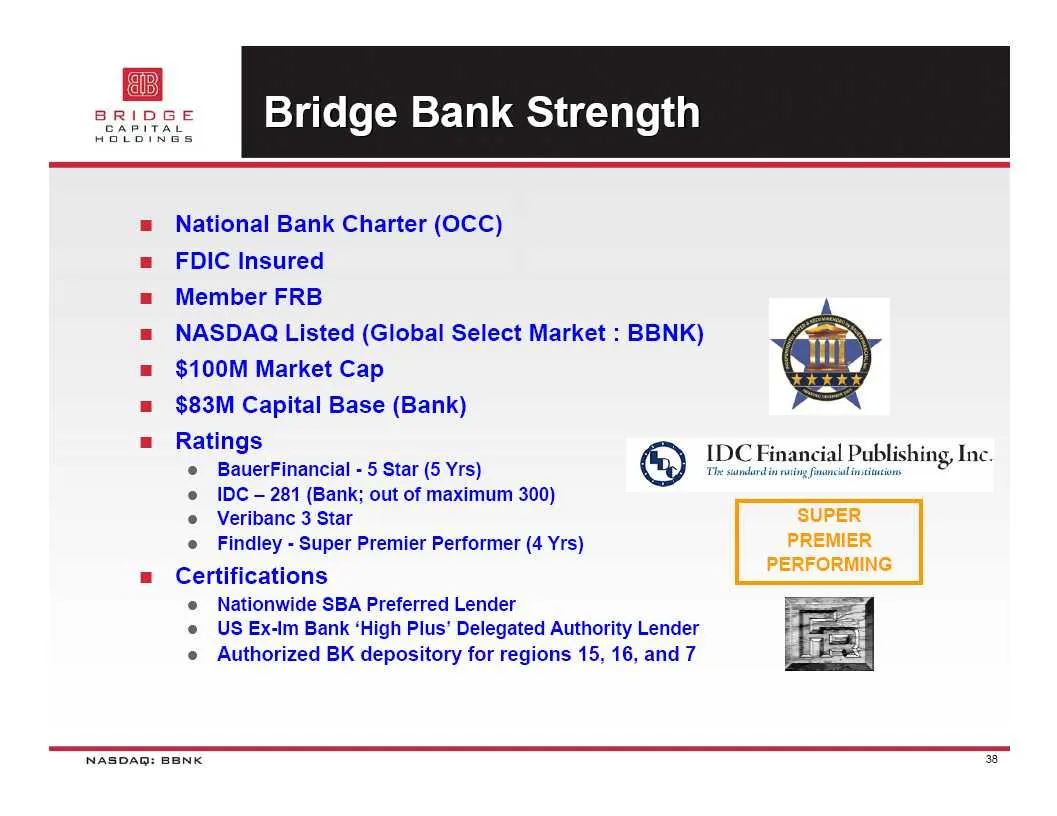
Bridge Bank Strength National Bank Charter (OCC) FDIC Insured Member FRB NASDAQ Listed (Global Select Market : BBNK) $100M Market Cap $83M Capital Base (Bank) Ratings e BauerFinancial - 5 Star (5 Yrs) e IDC — 281 (Bank; out of maximum 300) e Veribanc 3 Star e Findley - Super Premier Performer (4 Yrs
Slide 39: Among Top Banks in U.S.
Among Top Banks in U.S. USBdaNKer BBNK named among The Top 25 Banks of 2008 by U.S. Banker magazine in its January 2008 issue Ranked sixth among the Top 10 Community Banks of 2008 based upon return on equity performance CEO named one of the Top 10 Bank CEOs in the nation NASDAQ: BENK 39
Slide 40: Our Vision
falls) 5A freee Our Vision BRIDGE BANK A business banking franchise that is the Professional Business Bank of Choice for small and middle-market businesses and emerging technology companies in Silicon Valley, California and the nation.
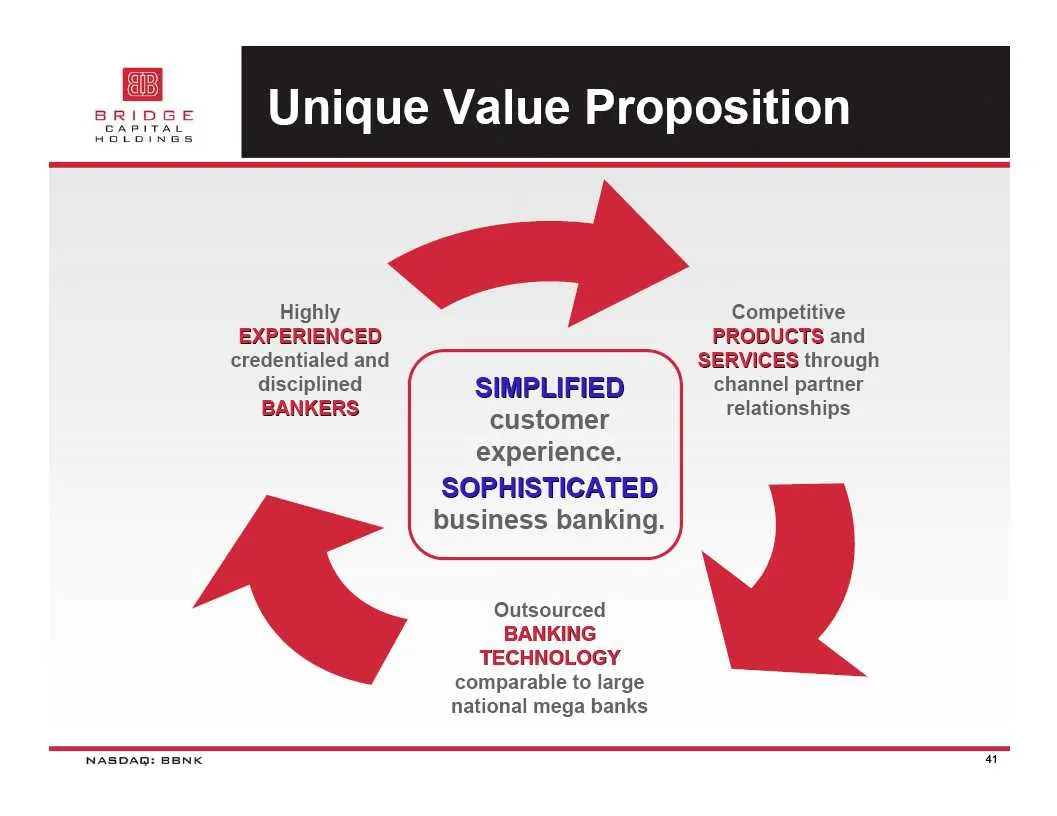
Slide 41: Unique Value Proposition
Unique Value Proposition Highly Competitive EXPERIENCED PRODUCTS and credentialed and SERVICES through disciplined SIMPLIFIED channel partner BANKERS customer relationships experience. SOPHISTICATED business banking. Outsourced BANKING TECHNOLOGY comparable to large national mega banks NASDAQ: BENK
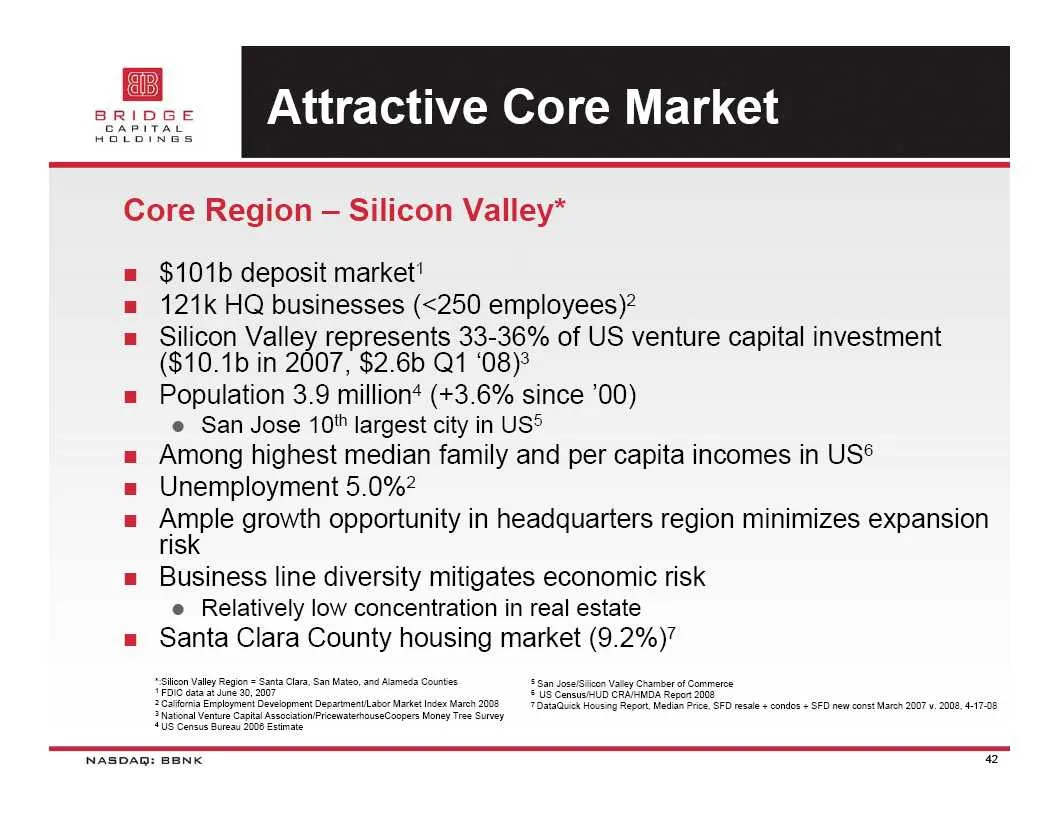
Slide 42: Attractive Core Market
Attractive Core Market Core Region — Silicon Valley* = $101b deposit market! = 121k HQ businesses (<250 employees)? = Silicon Valley represents 33-36% of US venture capital investment ($10.1b in 2007, $2.6b Q1 ‘08)3 = Population 3.9 million* (+3.6% since ’00) e San Jose 10" largest city in US® a Amo
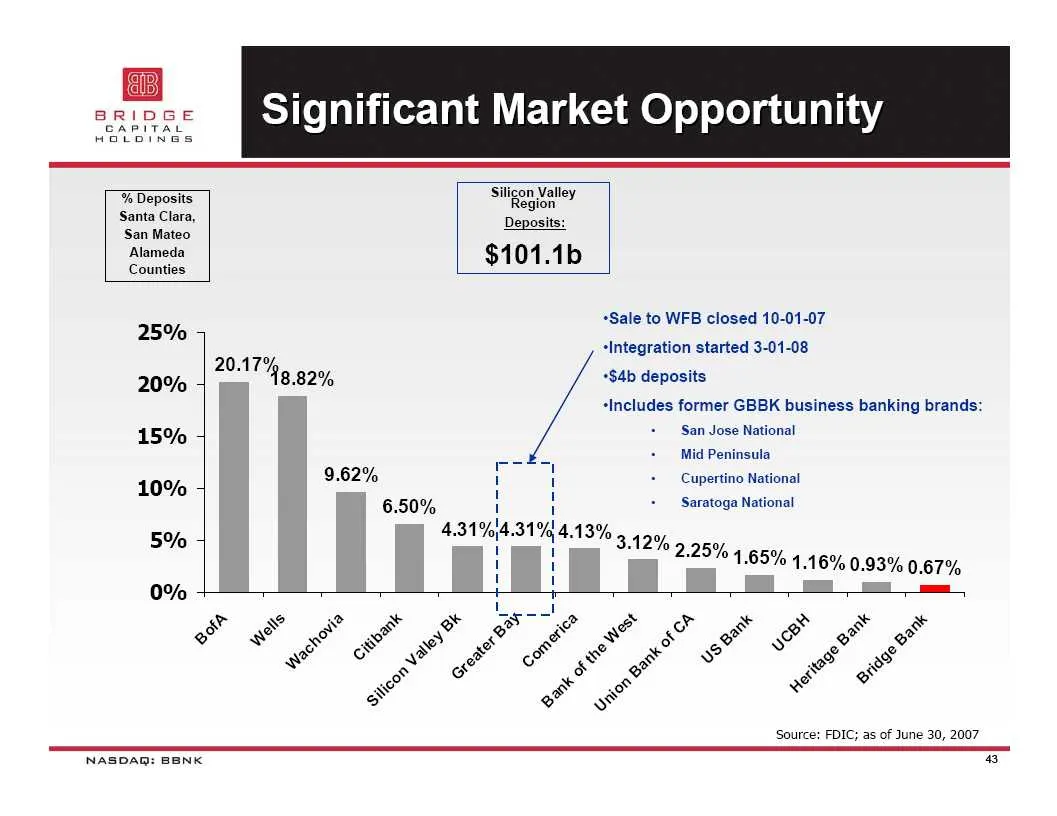
Slide 43: Significant Market Opportunity
Significant Market Opportunity ie Denese sien ary, anta Clara, San Mateo Beueed Alameda Counties $101.1b *Sale to WEB closed 10-01-07 25% : Integration started 3-01-08 20.17% . 20% 18.82% *$4b deposits +Includes former GBBK business banking brands: 15% S San Jose National =e Mid Peninsula 10% 9.62%
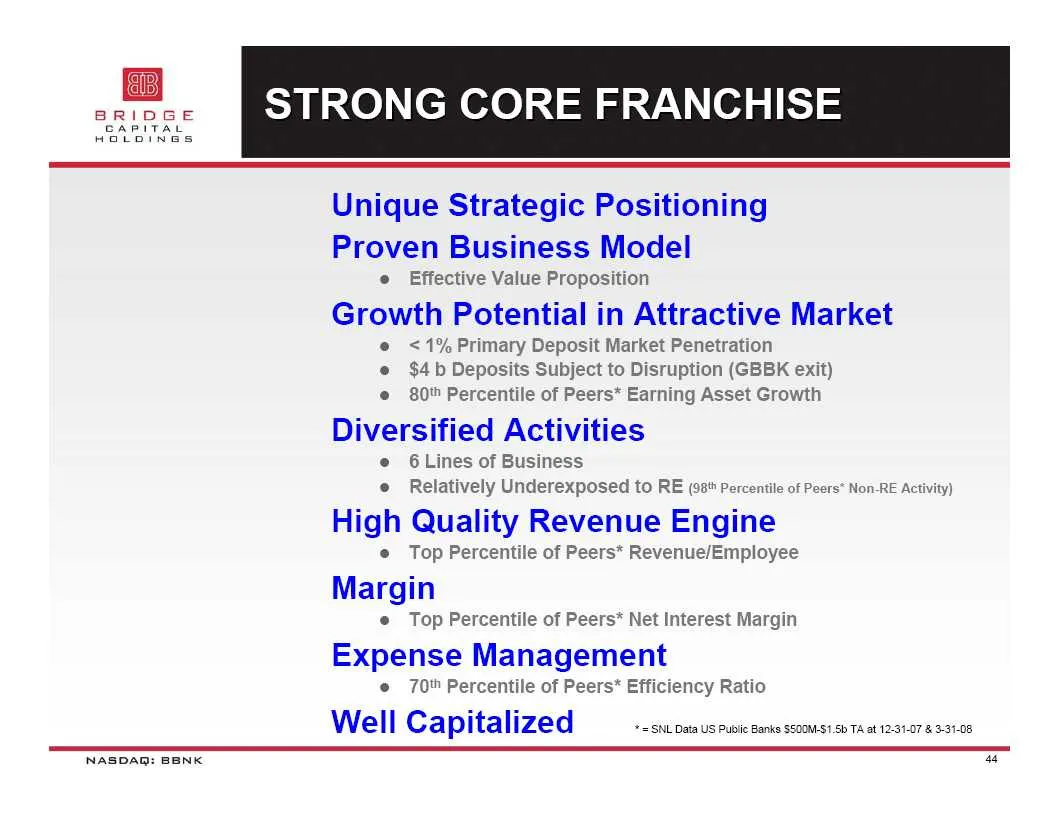
Slide 44: Strong Core Franchise
STRONG CORE FRANCHISE Unique Strategic Positioning Proven Business Model e Effective Value Proposition Growth Potential in Attractive Market e@ <1% Primary Deposit Market Penetration e $4b Deposits Subject to Disruption (GBBK exit) e 80' Percentile of Peers* Earning Asset Growth Diversified Activiti
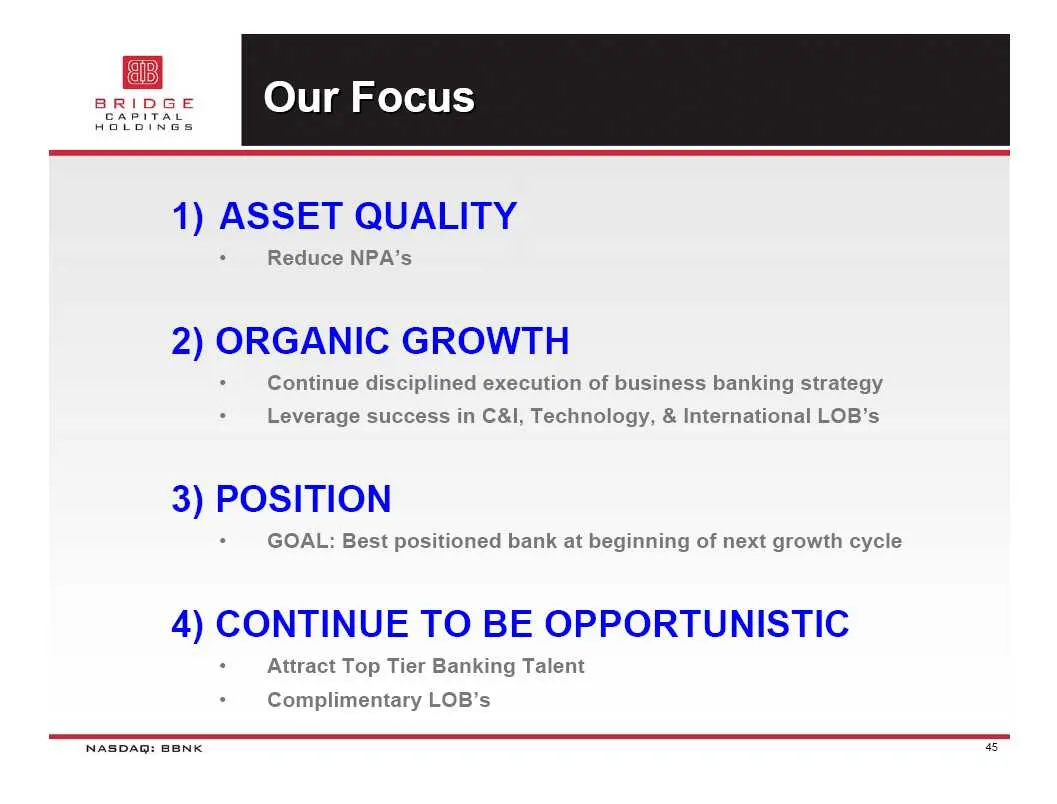
Slide 45: Strategic priorities
1) ASSET QUALITY Reduce NPA’s 2) ORGANIC GROWTH Continue disciplined execution of business banking strategy Leverage success in C&l, Technology, & International LOB’s 3) POSITION GOAL: Best positioned bank at beginning of next growth cycle 4) CONTINUE TO BE OPPORTUNISTIC Attract Top Tier Banking Tal
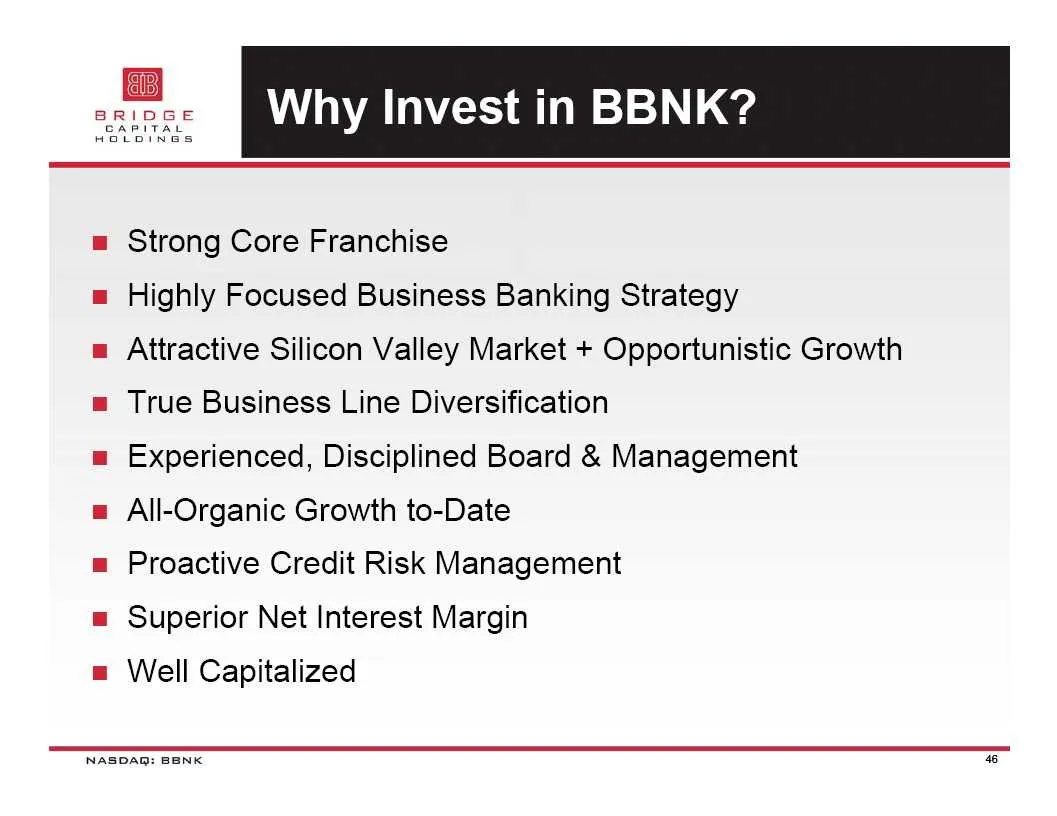
Slide 46: Strong Core Franchise
= Strong Core Franchise = Highly Focused Business Banking Strategy = Attractive Silicon Valley Market + Opportunistic Growth = True Business Line Diversification = Experienced, Disciplined Board & Management = All-Organic Growth to-Date = Proactive Credit Risk Management = Superior Net Interest Marg
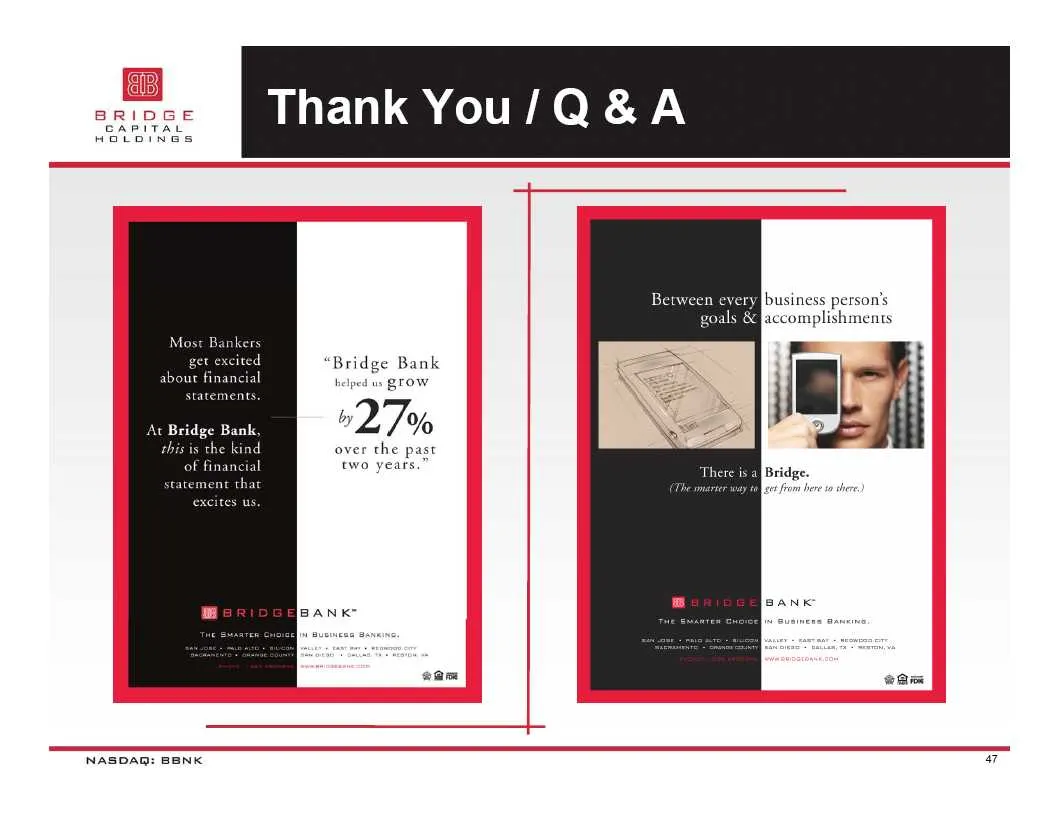
Slide 47: Thank You/Q&A
Sree Thank You/Q&A Between business person's RENNES accomplishments a Tera Bridge. “Bridge Bank about finan helped un BTOW statements. At Bridge Bank, »27% is the over the past of financial two years.” excites us BANK sam Bim NASDAQ: BENK a7
Source: SEC EDGAR · 8-K filed May 15, 2008
More decks from Bridge Capital Holdings
 Merger or Acquisition (March 2015)11 slides · Mar 9, 2015
 Q4 2014 Earnings Presentation22 slides · Feb 4, 2015
 Q2 2014 Earnings Presentation23 slides · Jul 29, 2014
 Shareholder Meeting (May 2014)19 slides · May 28, 2014
 Q1 2014 Earnings Presentation23 slides · May 13, 2014
 Q4 2013 Earnings Presentation24 slides · Feb 5, 2014