Simulations Plus, Inc. · NASDAQ:SLP
Simulations Plus — FY2023 Earnings Presentation
29 slides from Simulations Plus's earnings presentation, November 2023

Slide 1: Investor Presentation Q4 FY23 Update
Investor Presentation NASDAQ : SLP Q4 FY23 Update
Slide 2: Safe Harbor Statement
Safe Harbor Statement With the exception of historical information, the matters discussed in this presentation are forward-looking statements that involve a number of risks and uncertainties. Words like “believe,” “expect” and “anticipate” mean that these are our best estimates as of this writing, b
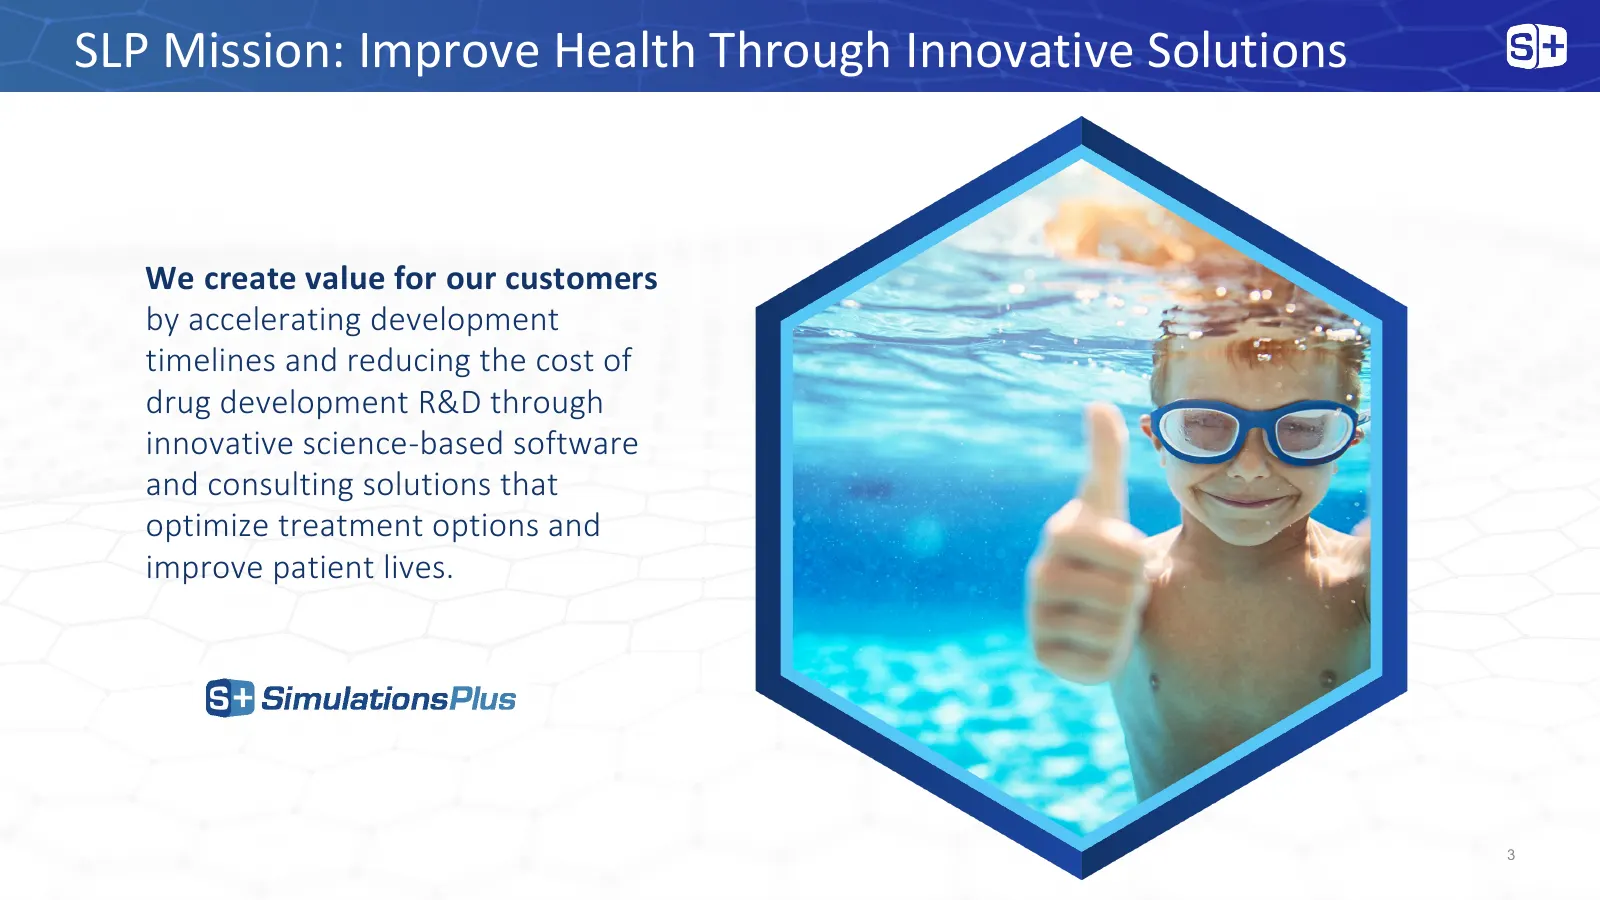
Slide 3: SLP Mission: Improve Health Through Innovative Solutions
SLP Mission: Improve Health Through Innovative Solutions We create value for our customers by accelerating development timelines and reducing the cost of drug development R&D through innovative science-based software and consulting solutions that optimize treatment options and improve patient lives
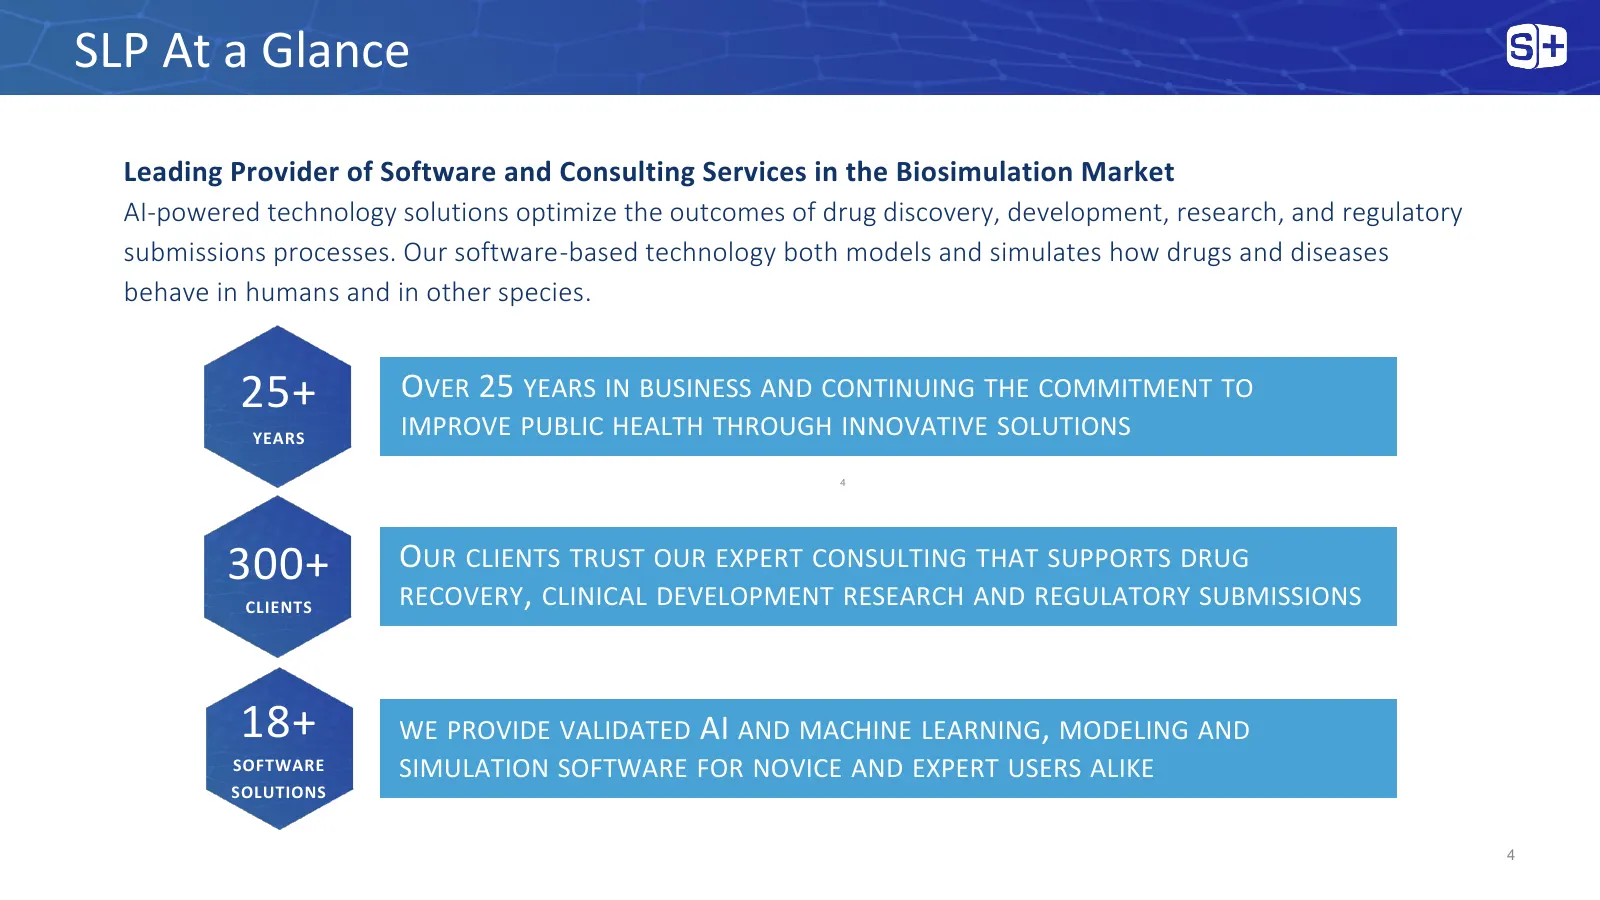
Slide 4: SLP At a Glance
SLP At a Glance Leading Provider of Software and Consulting Services in the Biosimulation Market AI-powered technology solutions optimize the outcomes of drug discovery, development, research, and regulatory submissions processes. Our software-based technology both models and simulates how drugs and
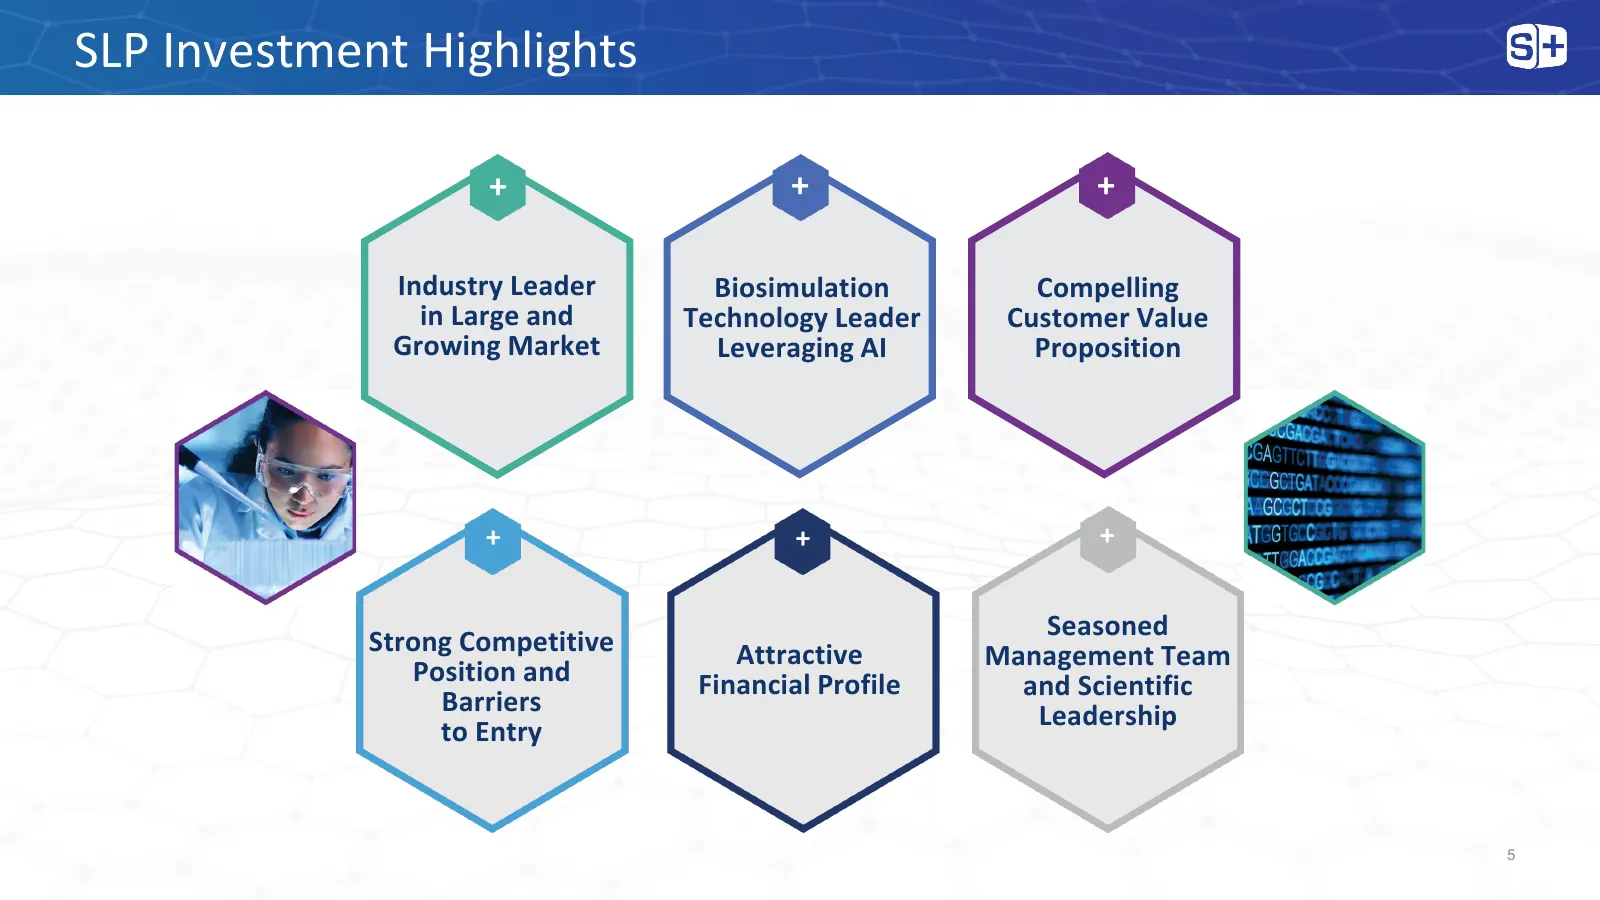
Slide 5: SLP Investment Highlights
SLP Investment Highlights + + + Industry Leader Biosimulation Compelling in Large and Technology Leader Customer Value Growing Market Leveraging AI Proposition + + + Seasoned Strong Competitive Attractive Management Team Position and Financial Profile and Scientific Barriers Leadership to Entry 5
Slide 6: Drug Discovery & Development
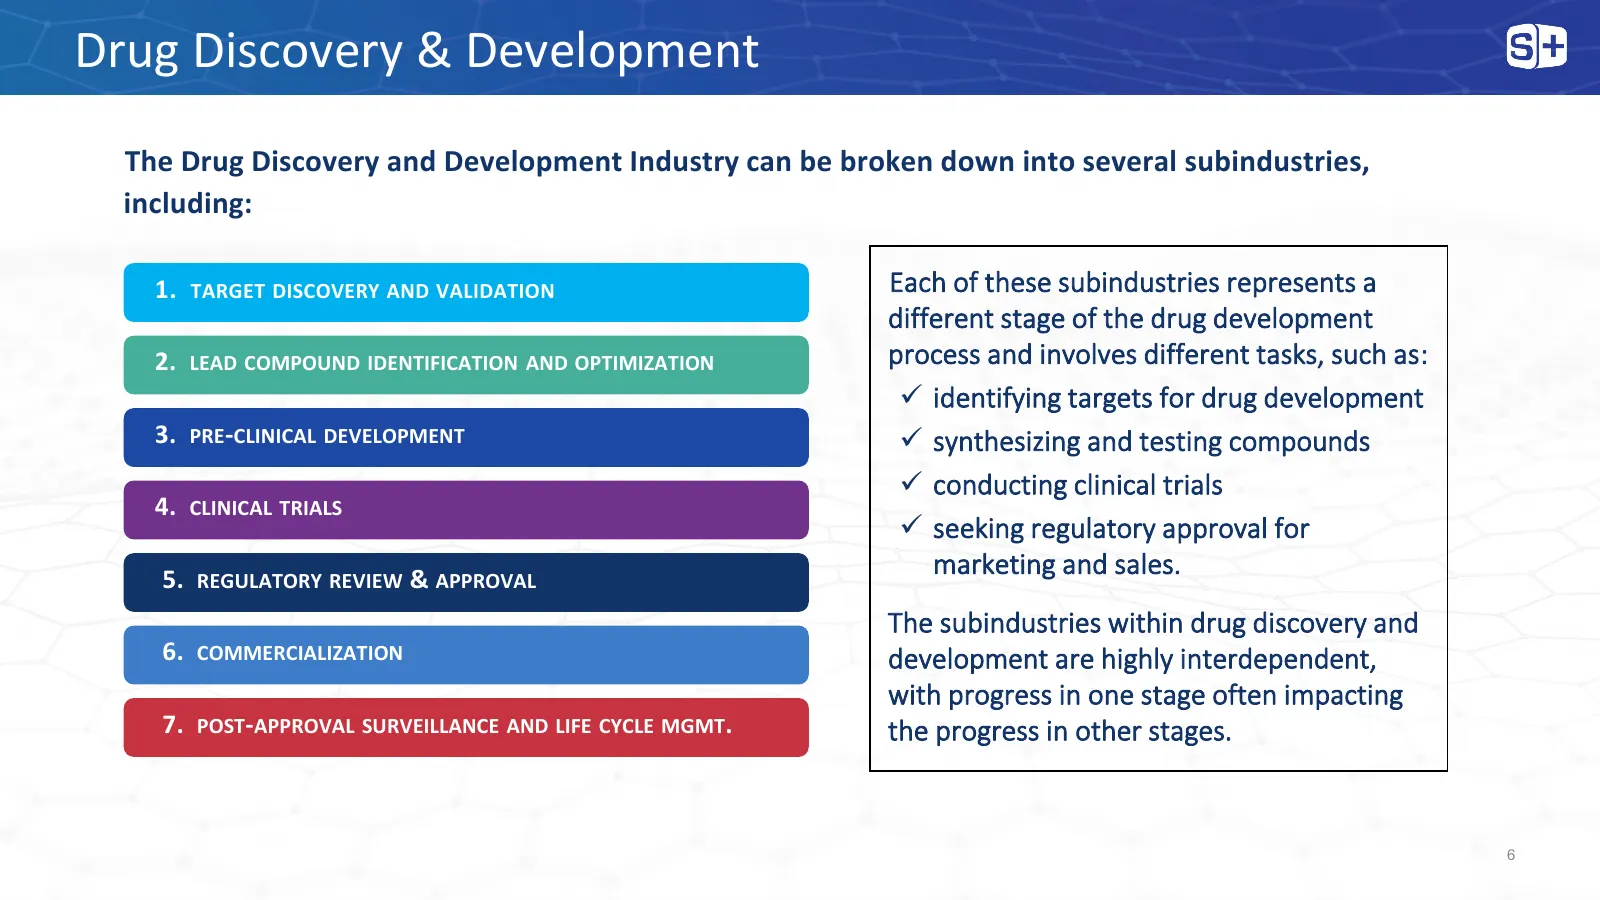
Drug Discovery & Development The Drug Discovery and Development Industry can be broken down into several subindustries, including: 1. TARGET DISCOVERY AND VALIDATION Each of these subindustries represents a different stage of the drug development 2. LEAD COMPOUND IDENTIFICATION AND OPTIMIZATION pro
Slide 7: Drug Development Challenges | SLP Biosimulation Solution
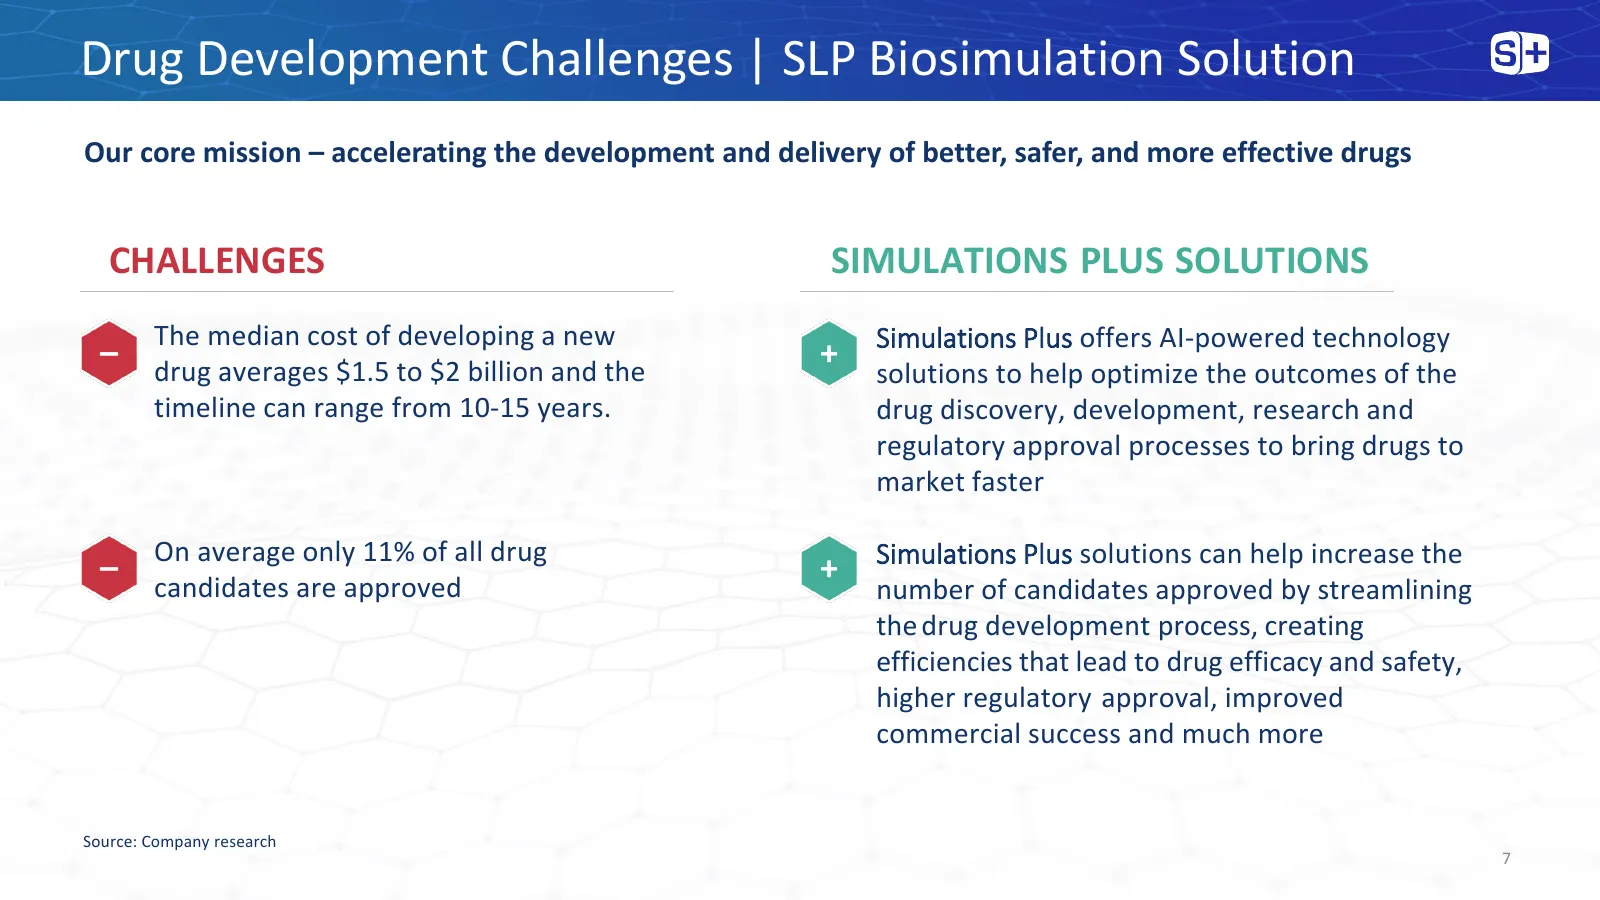
Drug Development Challenges | SLP Biosimulation Solution Our core mission – accelerating the development and delivery of better, safer, and more effective drugs CHALLENGES SIMULATIONS PLUS SOLUTIONS The median cost of developing a new Simulations Plus offers AI-powered technology – drug averages $1
Slide 8: Biosimulation Overview
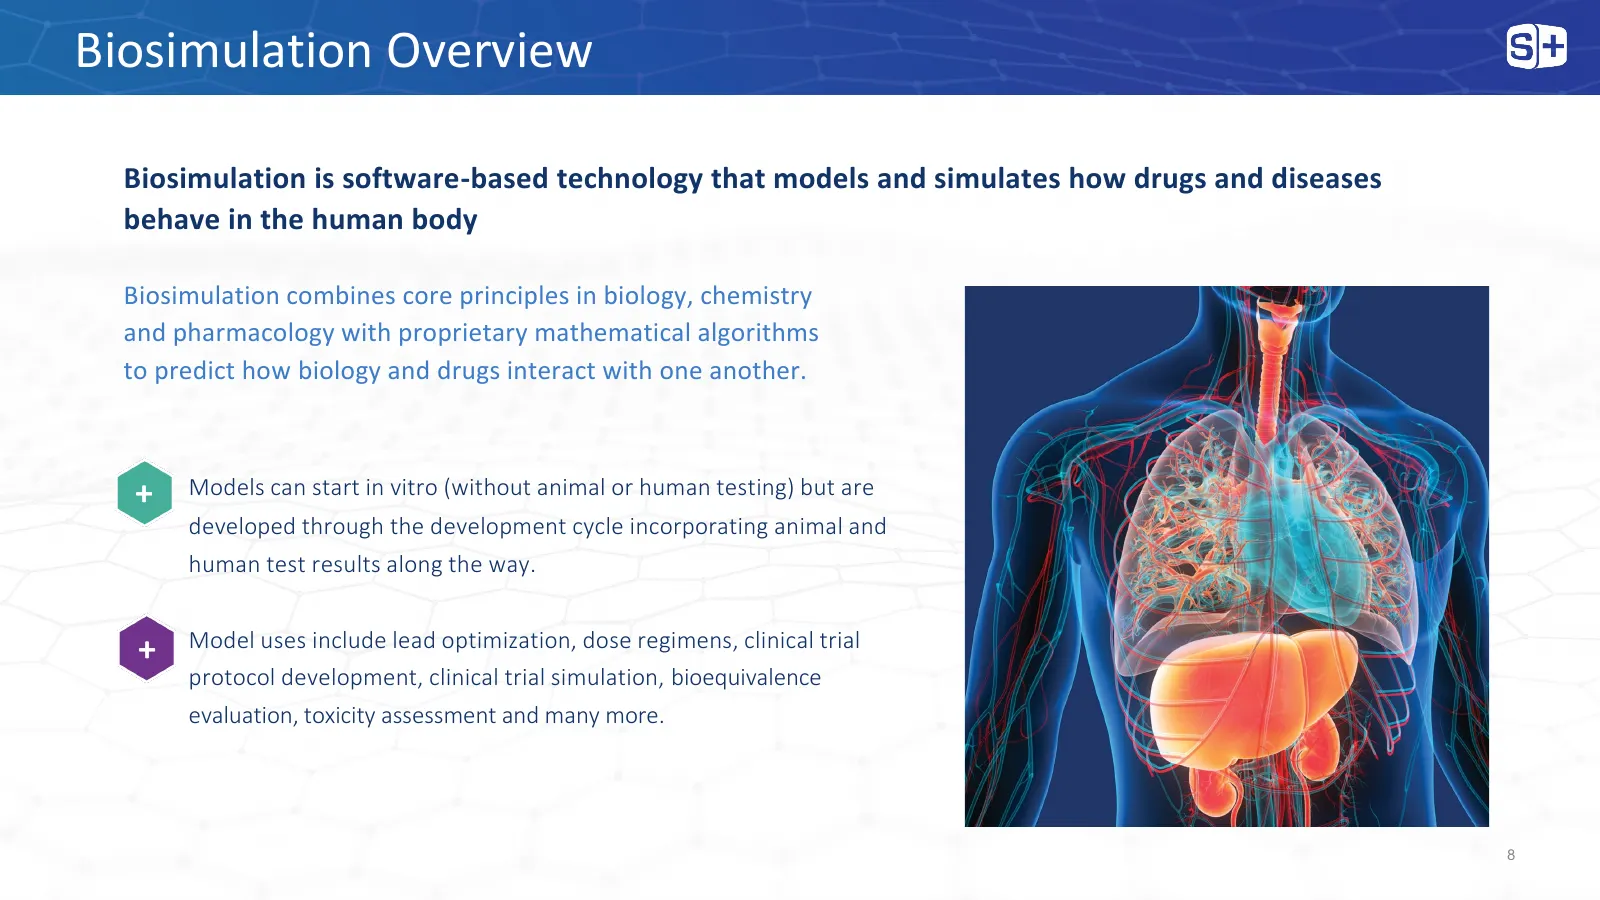
Biosimulation Overview Biosimulation is software-based technology that models and simulates how drugs and diseases behave in the human body Biosimulation combines core principles in biology, chemistry and pharmacology with proprietary mathematical algorithms to predict how biology and drugs inter
Slide 9: Large and Growing Market
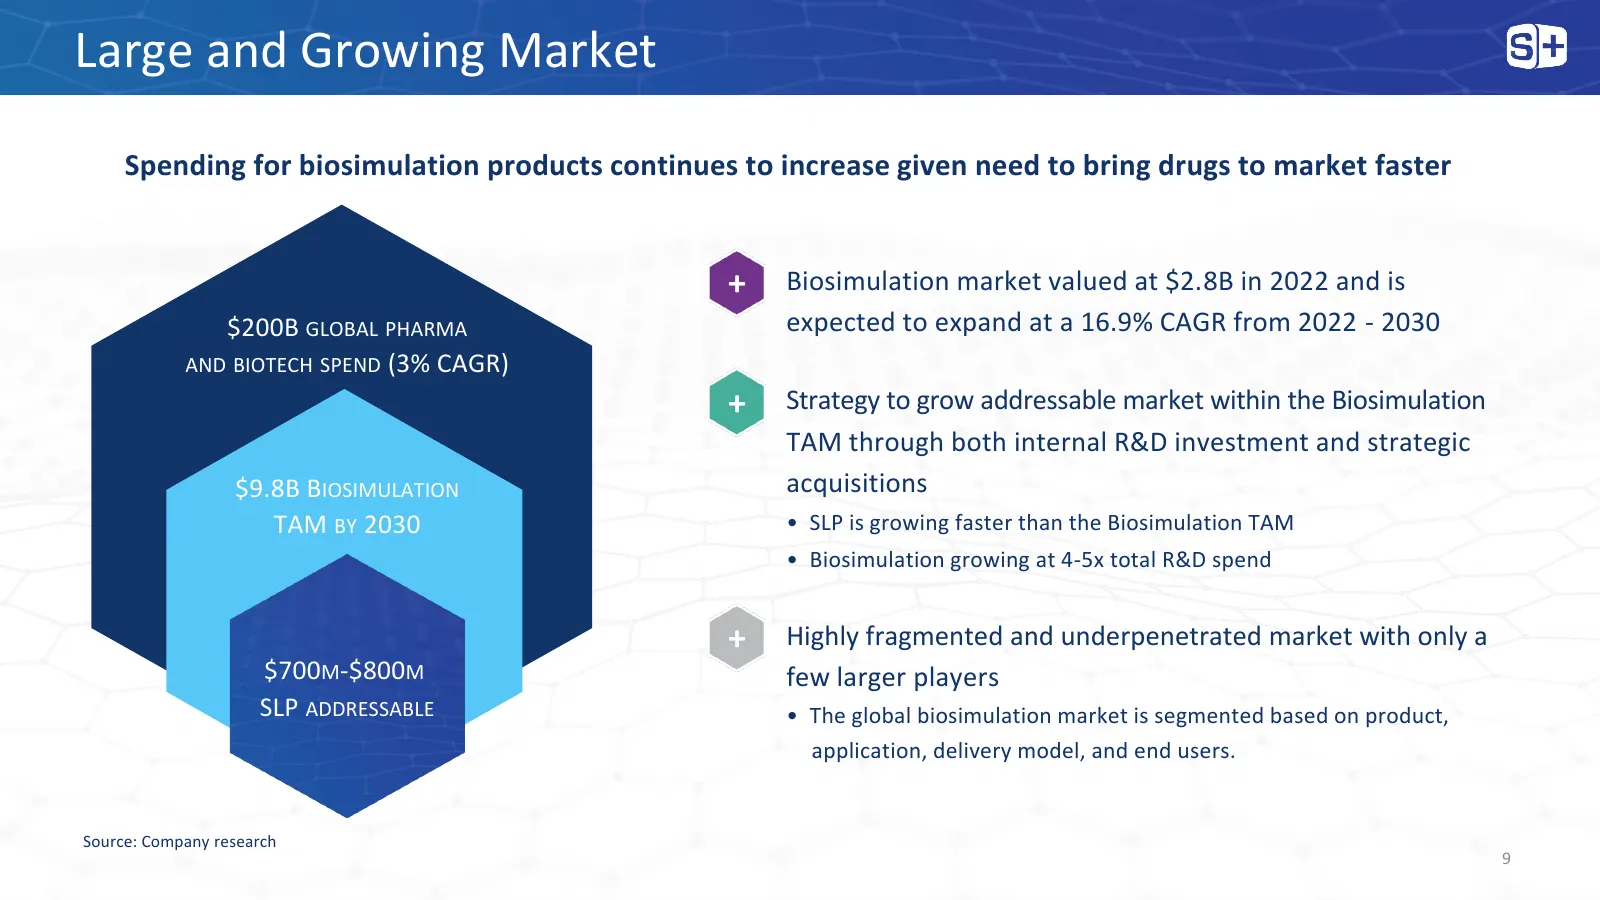
Large and Growing Market Spending for biosimulation products continues to increase given need to bring drugs to market faster + Biosimulation market valued at $2.8B in 2022 and is $200B GLOBAL PHARMA expected to expand at a 16.9% CAGR from 2022 - 2030 AND BIOTECH SPEND (3% CAGR) + Strategy to grow
Slide 10: Secular Trends Driving Sustained Long-Term Growth
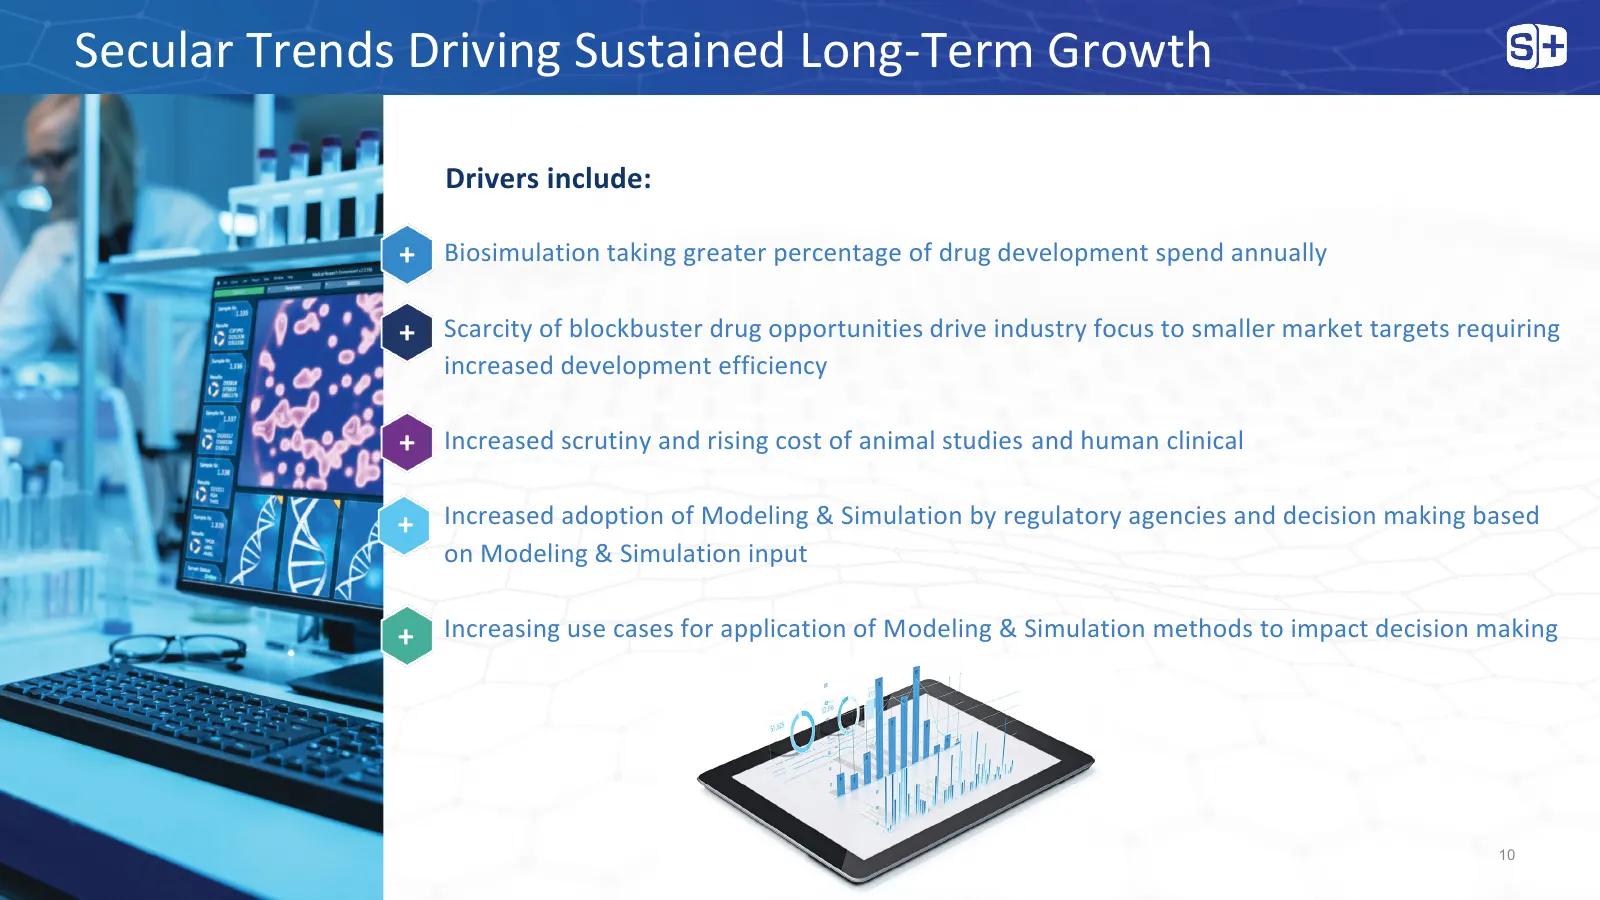
Secular Trends Driving Sustained Long-Term Growth Drivers include: + Biosimulation taking greater percentage of drug development spend annually + Scarcity of blockbuster drug opportunities drive industry focus to smaller market targets requiring increased development efficiency + Increased scrutiny
Slide 11: End-to-End Solutions Across the Development Life Cycle
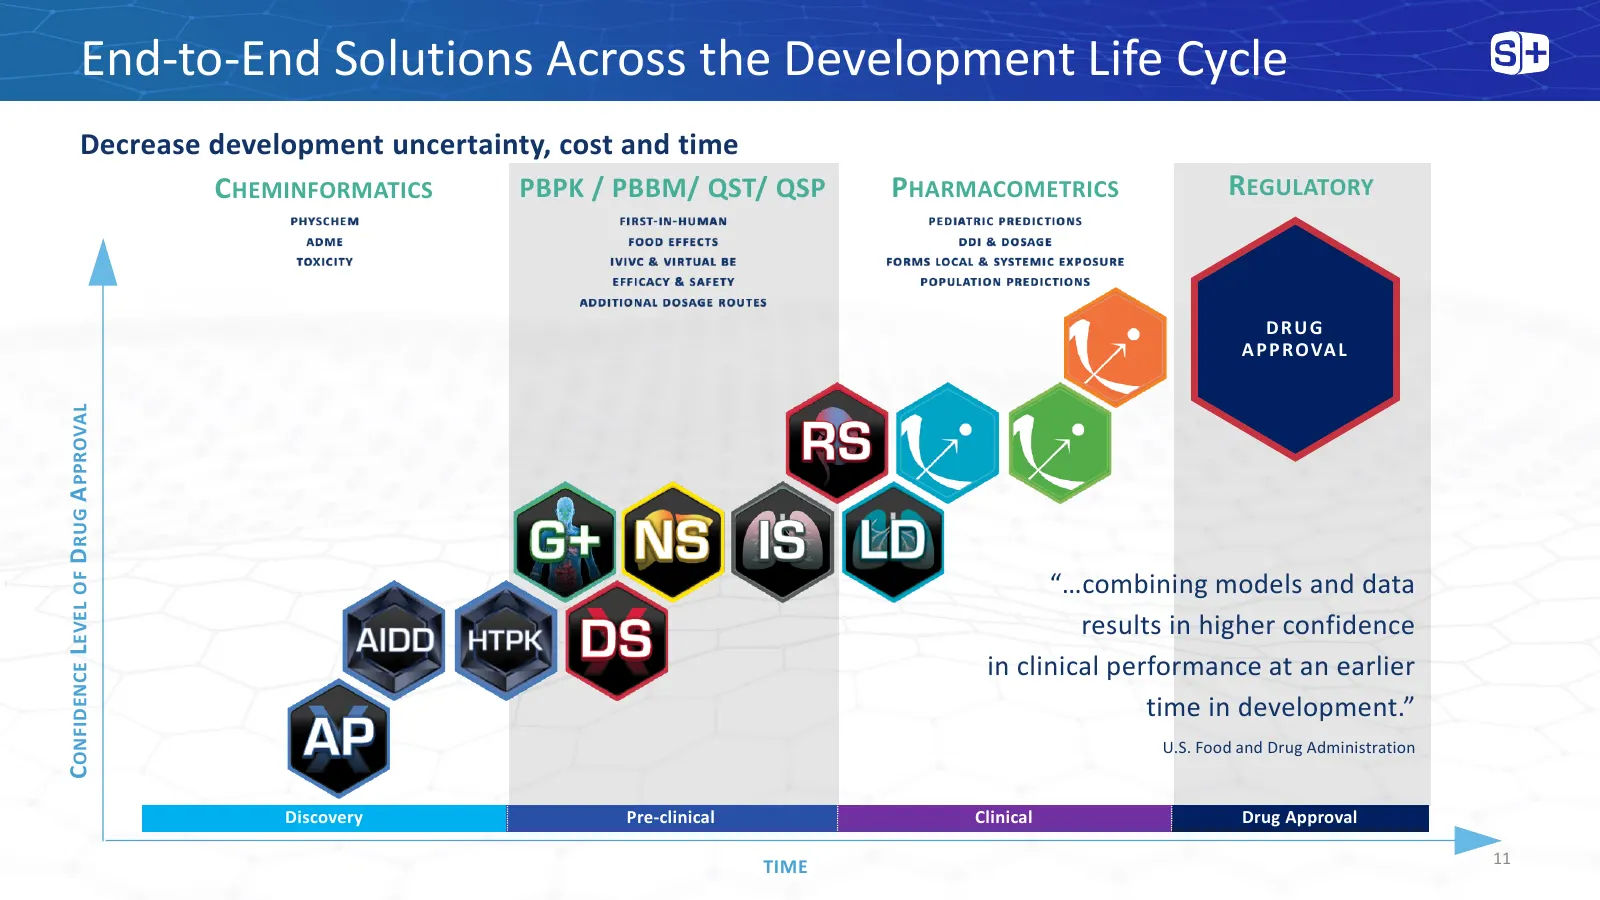
End-to-End Solutions Across the Development Life Cycle Decrease development uncertainty, cost and time CHEMINFORMATICS PBPK / PBBM/ QST/ QSP PHARMACOMETRICS REGULATORY DRUG A P P R OVA L CONFIDENCE L EVEL OF D RUG A PPROVAL “…combining models and data results in higher confidence in clinical perform
Slide 12: Strong Competitive Position
Strong Competitive Position LEADING POSITION IN LARGE, GROWING, FRAGMENTED AND + UNDERPENETRATED MARKET + LARGE, GROWING AND DIVERSE CUSTOMER BASE MOST COMPREHENSIVE AND WIDELY RECOGNIZED TOOLS IN THE + INDUSTRY + 300+ CUSTOMERS ACCUMULATED PUBLIC AND PRIVATE DATA THAT INFORMS OUR + ALGORITHMS AND
Slide 13: Fiscal 2023 Highlights
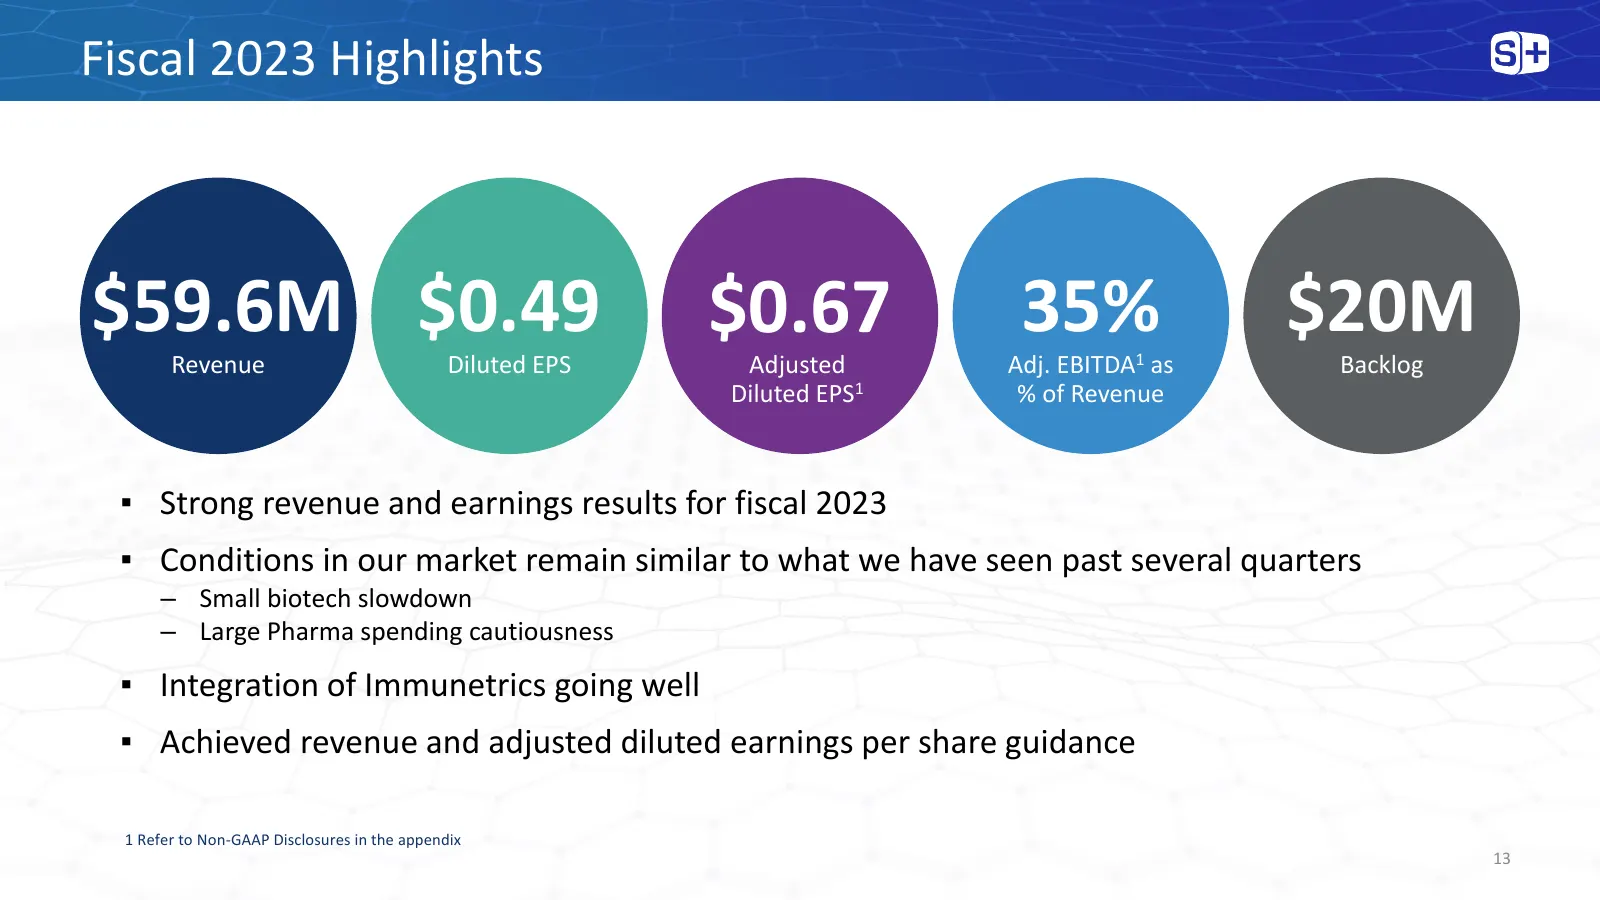
Fiscal 2023 Highlights $59.6M $0.49 $0.67 35% $20M Revenue Diluted EPS Adjusted Adj. EBITDA1 as Backlog Diluted EPS1 % of Revenue ▪ Strong revenue and earnings results for fiscal 2023 ▪ Conditions in our market remain similar to what we have seen past several quarters – Small biotech slowdown – Larg
Slide 14: Fiscal 2023 Capital Allocation Strategy
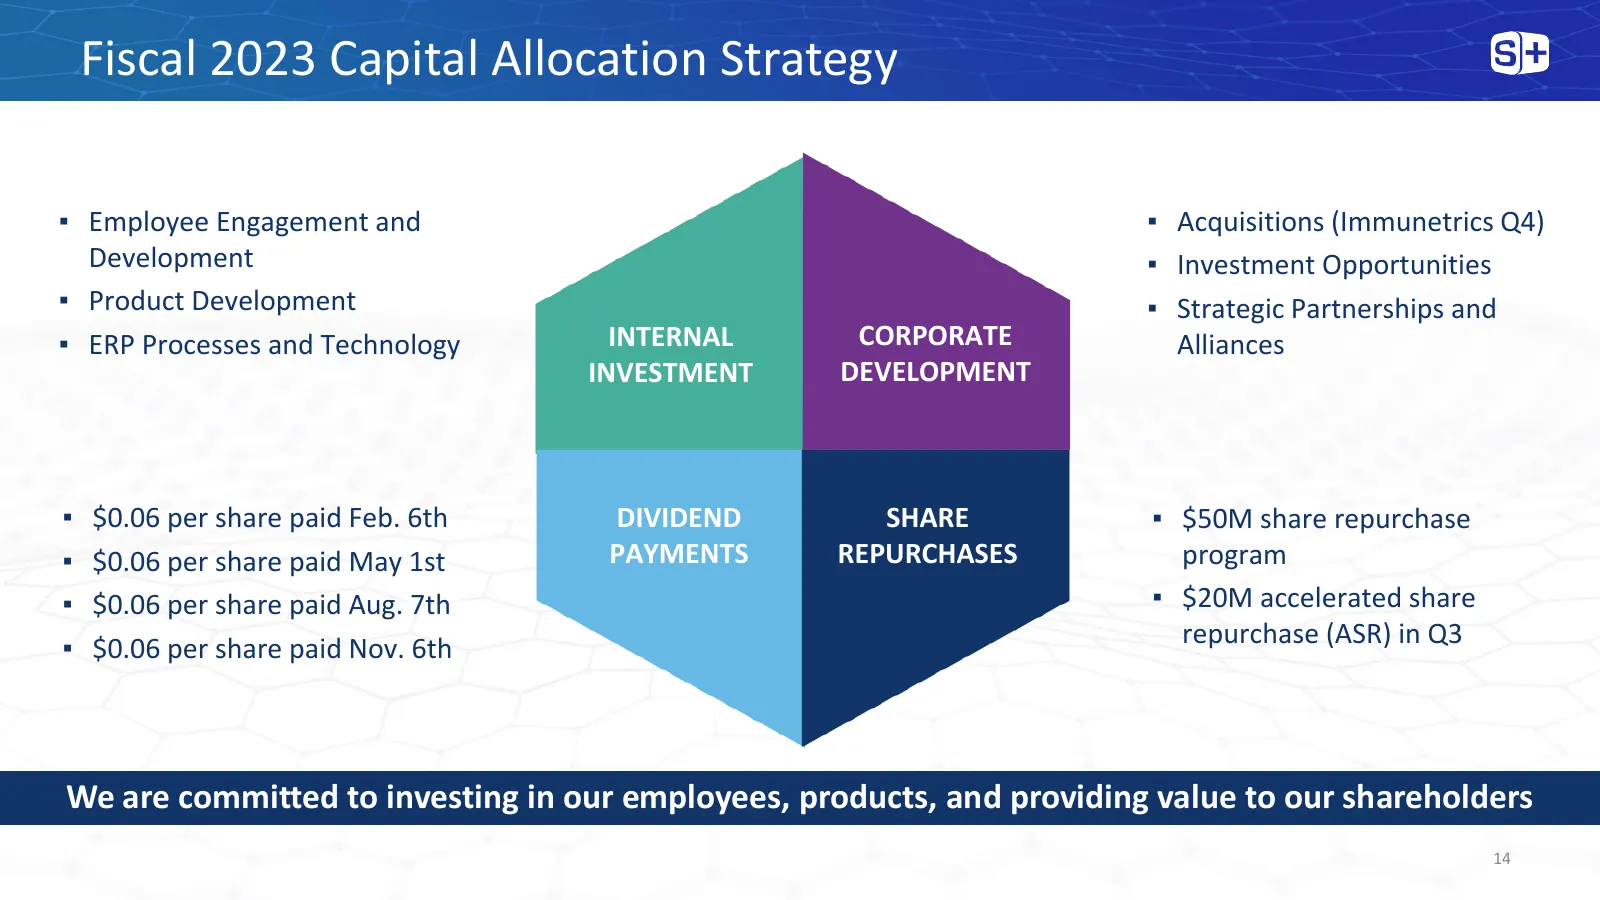
Fiscal 2023 Capital Allocation Strategy ▪ Employee Engagement and ▪ Acquisitions (Immunetrics Q4) Development ▪ Investment Opportunities ▪ Product Development ▪ Strategic Partnerships and ▪ ERP Processes and Technology INTERNAL CORPORATE Alliances INVESTMENT DEVELOPMENT ▪ $0.06 per share paid Feb. 6
Slide 15: Fiscal 2023 M&A | Immunetrics Acquisition and Integration
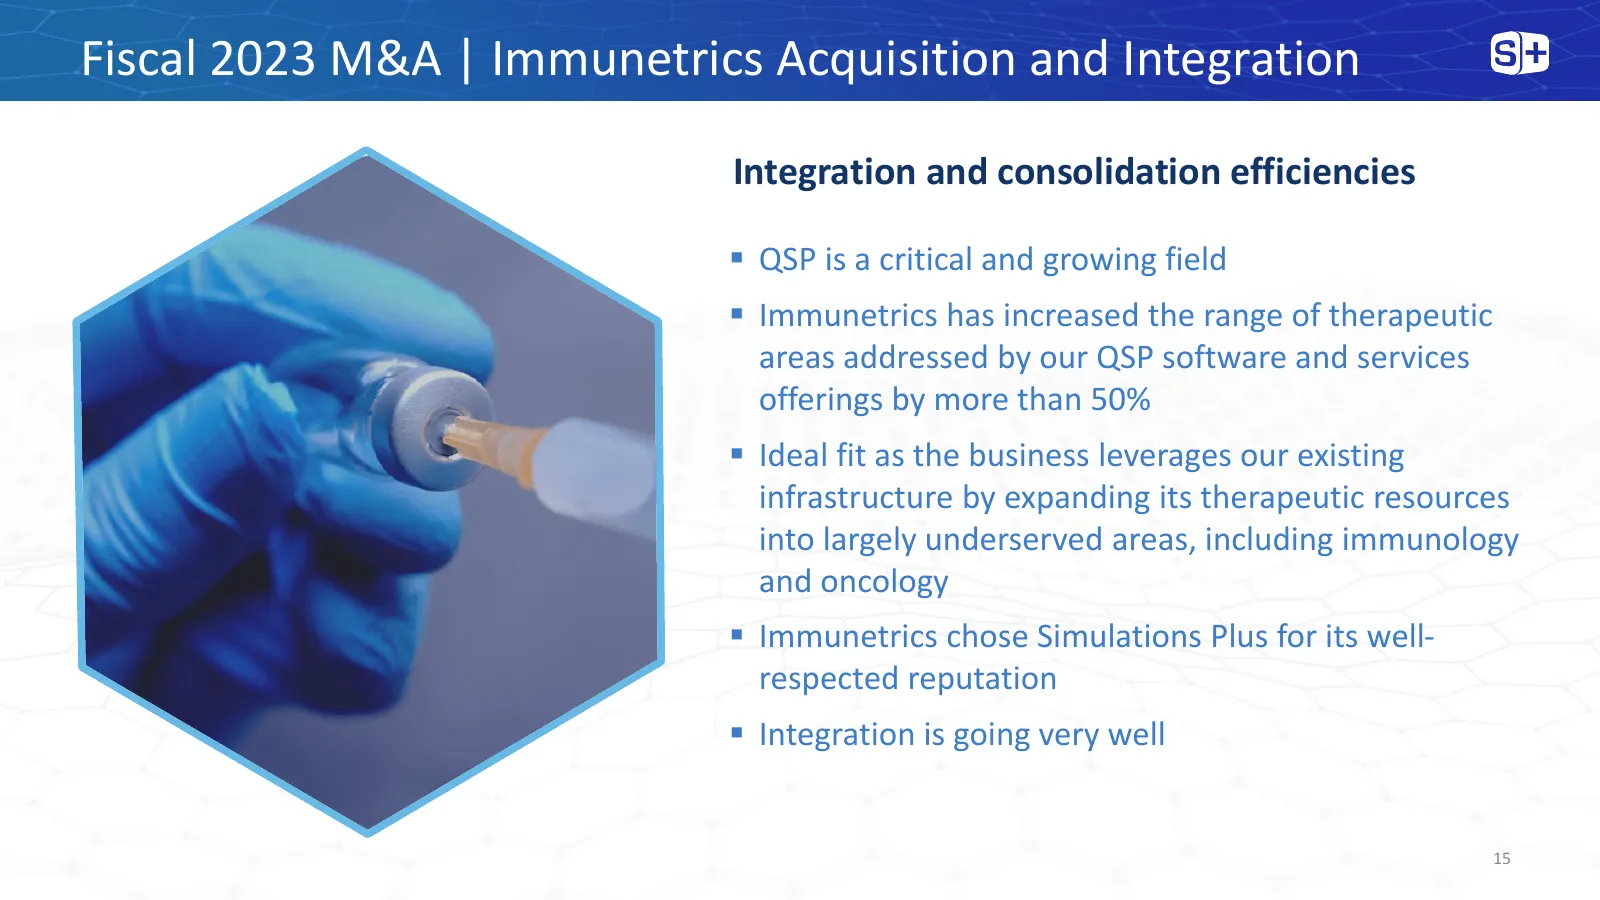
Fiscal 2023 M&A | Immunetrics Acquisition and Integration Integration and consolidation efficiencies ▪ QSP is a critical and growing field ▪ Immunetrics has increased the range of therapeutic areas addressed by our QSP software and services offerings by more than 50% ▪ Ideal fit as the business leve
Slide 16: Fiscal 2023 ESG Achievements
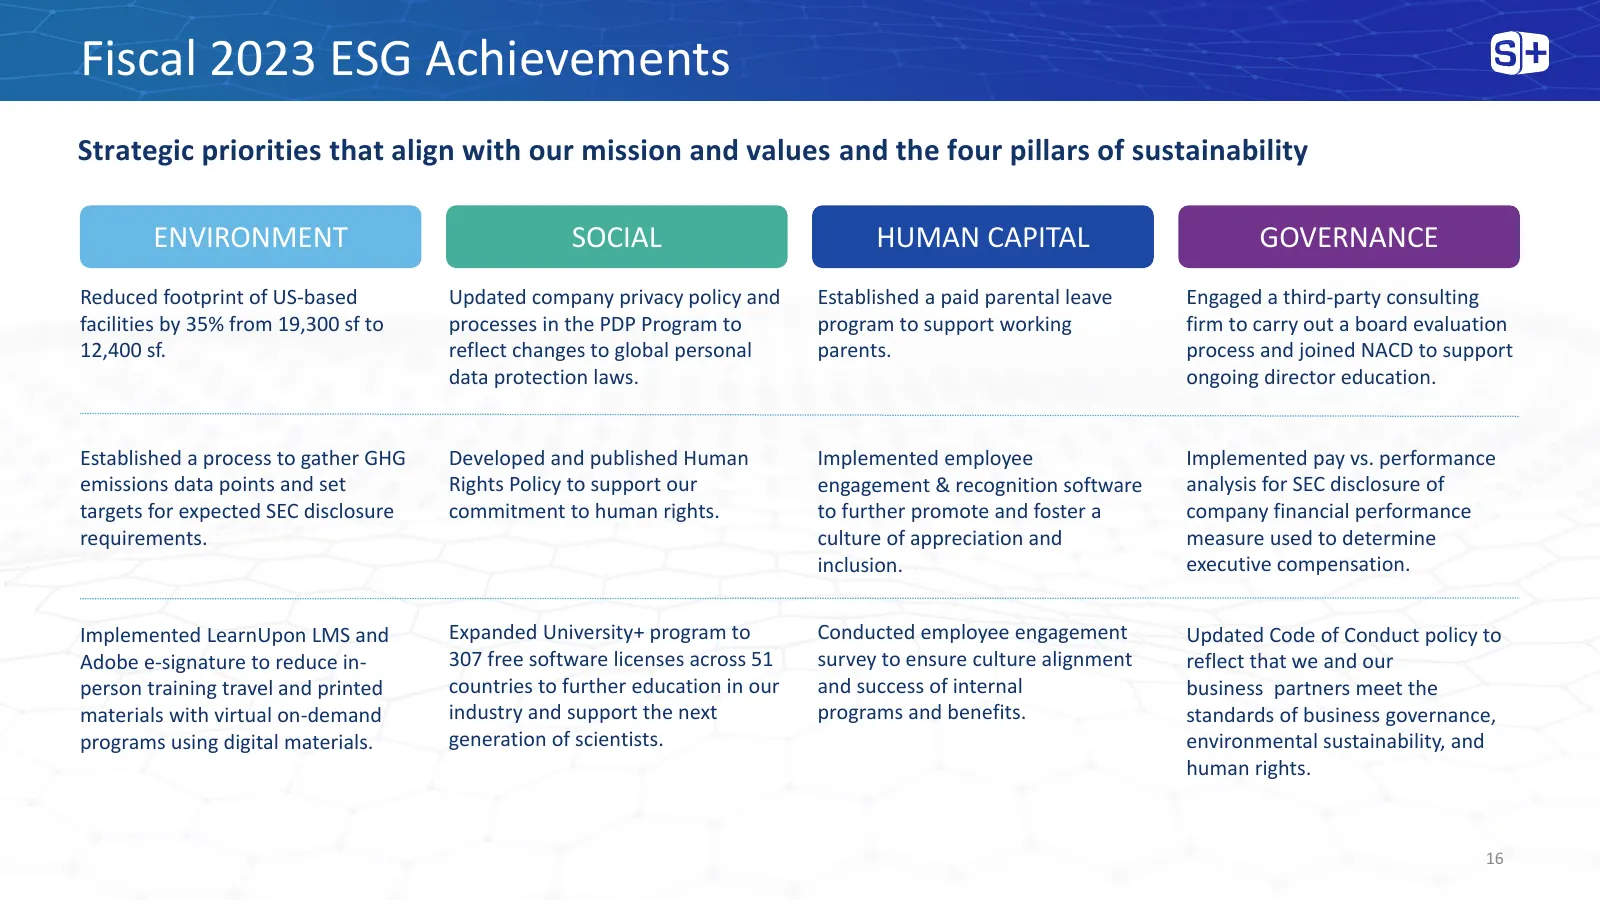
Fiscal 2023 ESG Achievements Strategic priorities that align with our mission and values and the four pillars of sustainability ENVIRONMENT SOCIAL HUMAN CAPITAL GOVERNANCE Reduced footprint of US-based Updated company privacy policy and Established a paid parental leave Engaged a third-party consult
Slide 17: Attractive Financial Profile
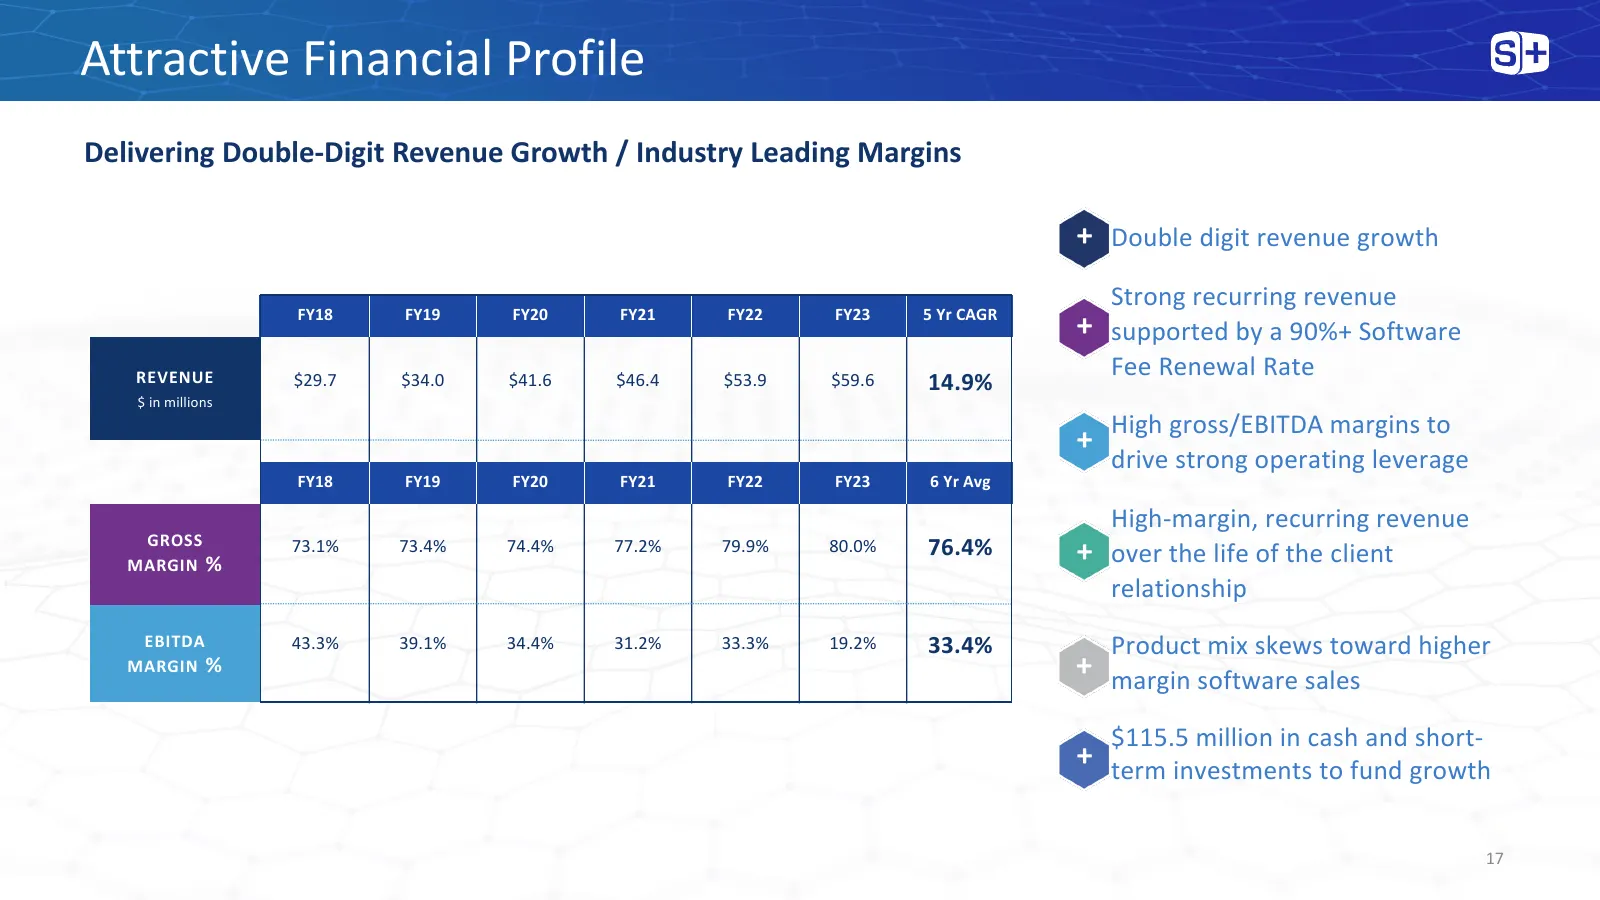
Attractive Financial Profile Delivering Double-Digit Revenue Growth / Industry Leading Margins + Double digit revenue growth Strong recurring revenue FY18 FY19 FY20 FY21 FY22 FY23 5 Yr CAGR + supported by a 90%+ Software REVENUE Fee Renewal Rate $29.7 $34.0 $41.6 $46.4 $53.9 $59.6 14.9% $ in mill
Slide 18: Fiscal 2024 Guidance
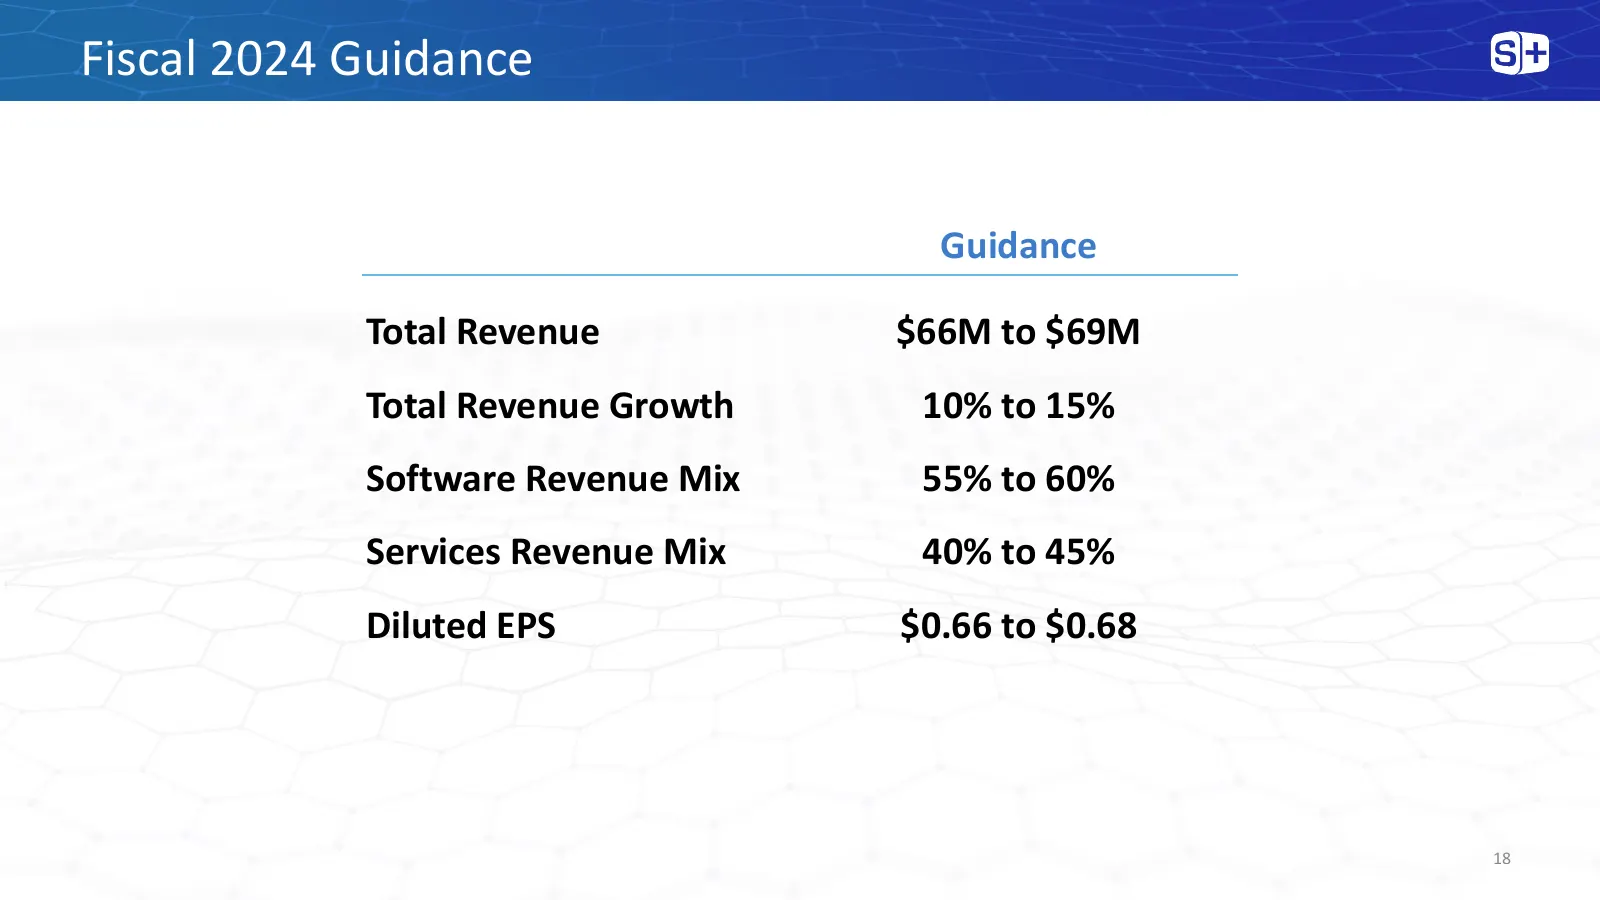
Fiscal 2024 Guidance Guidance Total Revenue $66M to $69M Total Revenue Growth 10% to 15% Software Revenue Mix 55% to 60% Services Revenue Mix 40% to 45% Diluted EPS $0.66 to $0.68 18
Slide 19: Seasoned Management Team and Scientific Leadership
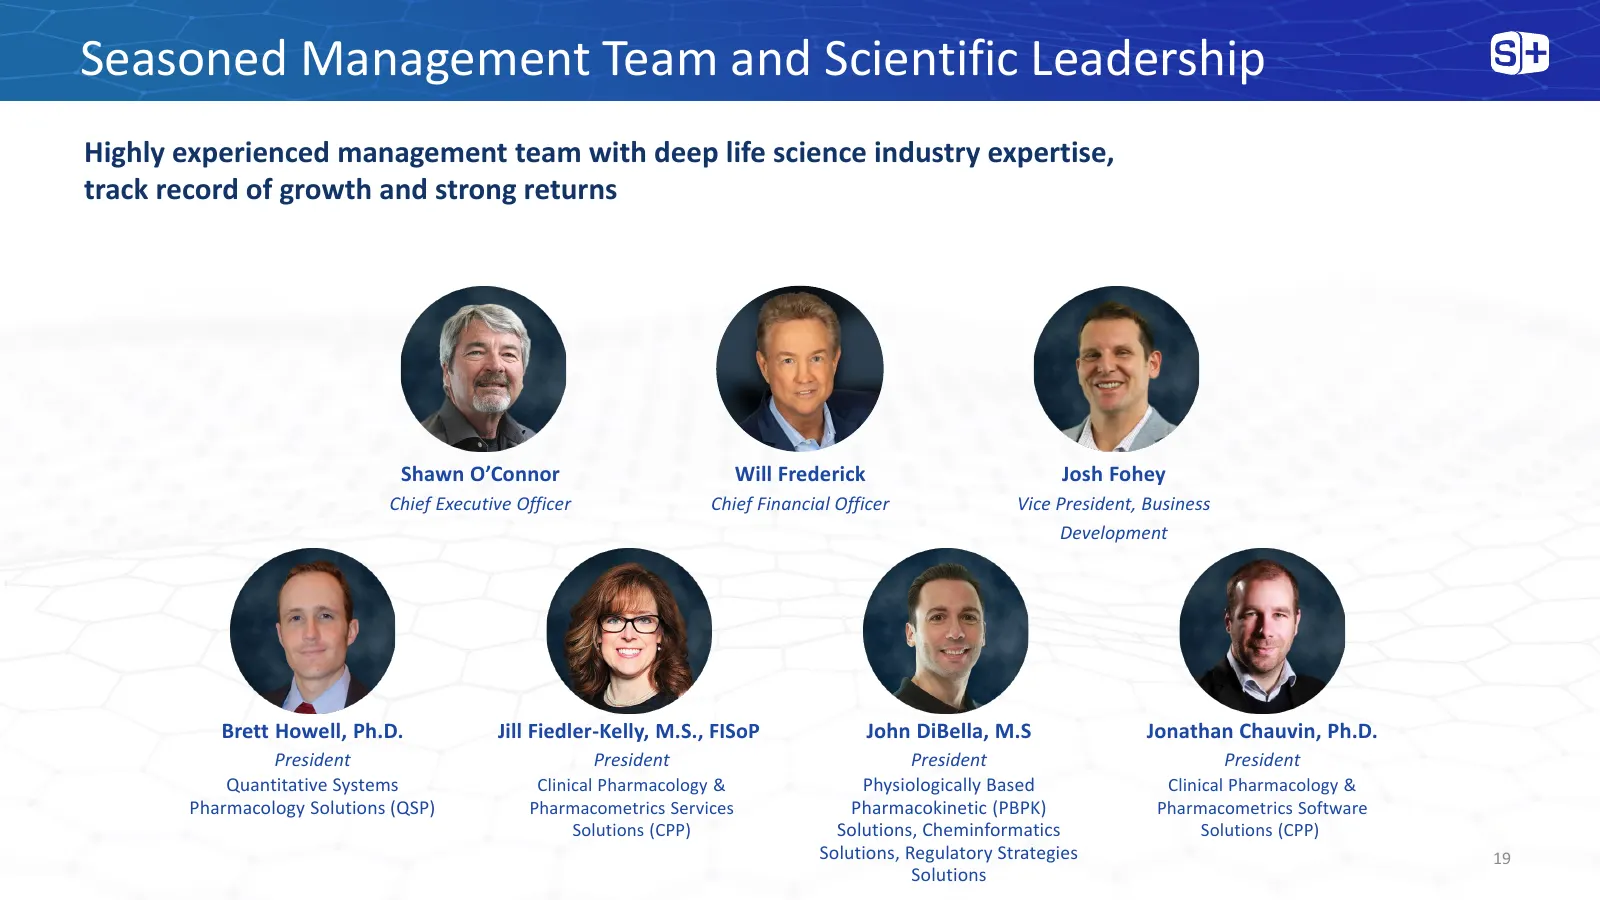
Seasoned Management Team and Scientific Leadership Highly experienced management team with deep life science industry expertise, track record of growth and strong returns Shawn O’Connor Will Frederick Josh Fohey Chief Executive Officer Chief Financial Officer Vice President, Business Development Bre
Slide 20: Organizational Structure Aligned to Support Customers
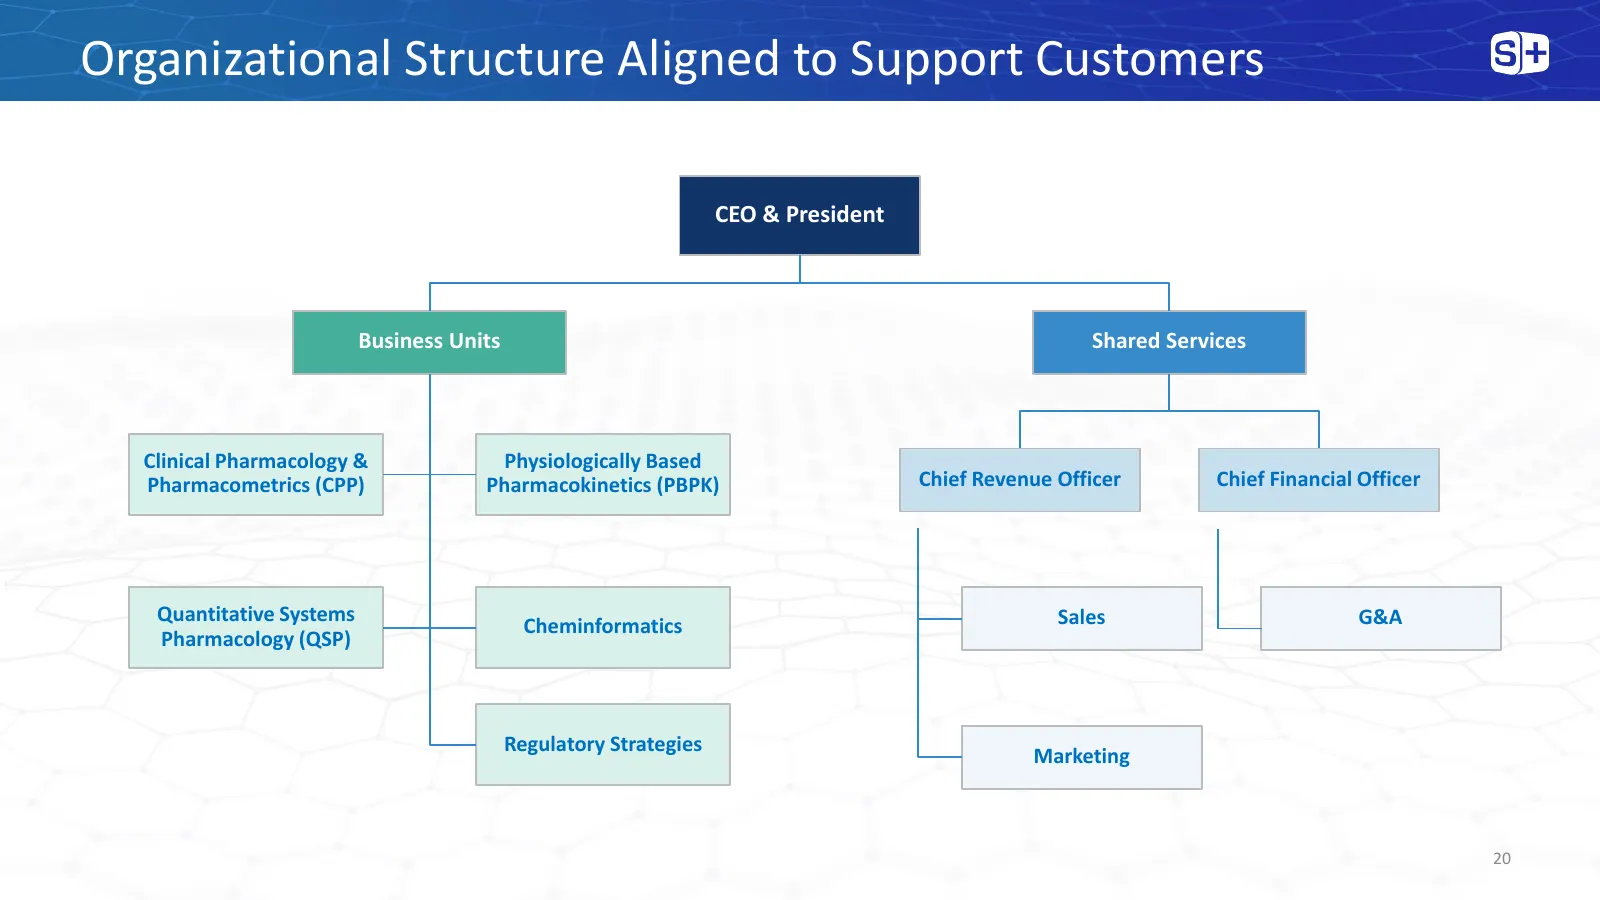
Organizational Structure Aligned to Support Customers CEO & President Business Units Shared Services Clinical Pharmacology & Physiologically Based Pharmacometrics (CPP) Pharmacokinetics (PBPK) Chief Revenue Officer Chief Financial Officer Quantitative Systems Sales G&A Cheminformatics Pharmacology (
Slide 21: Conclusion
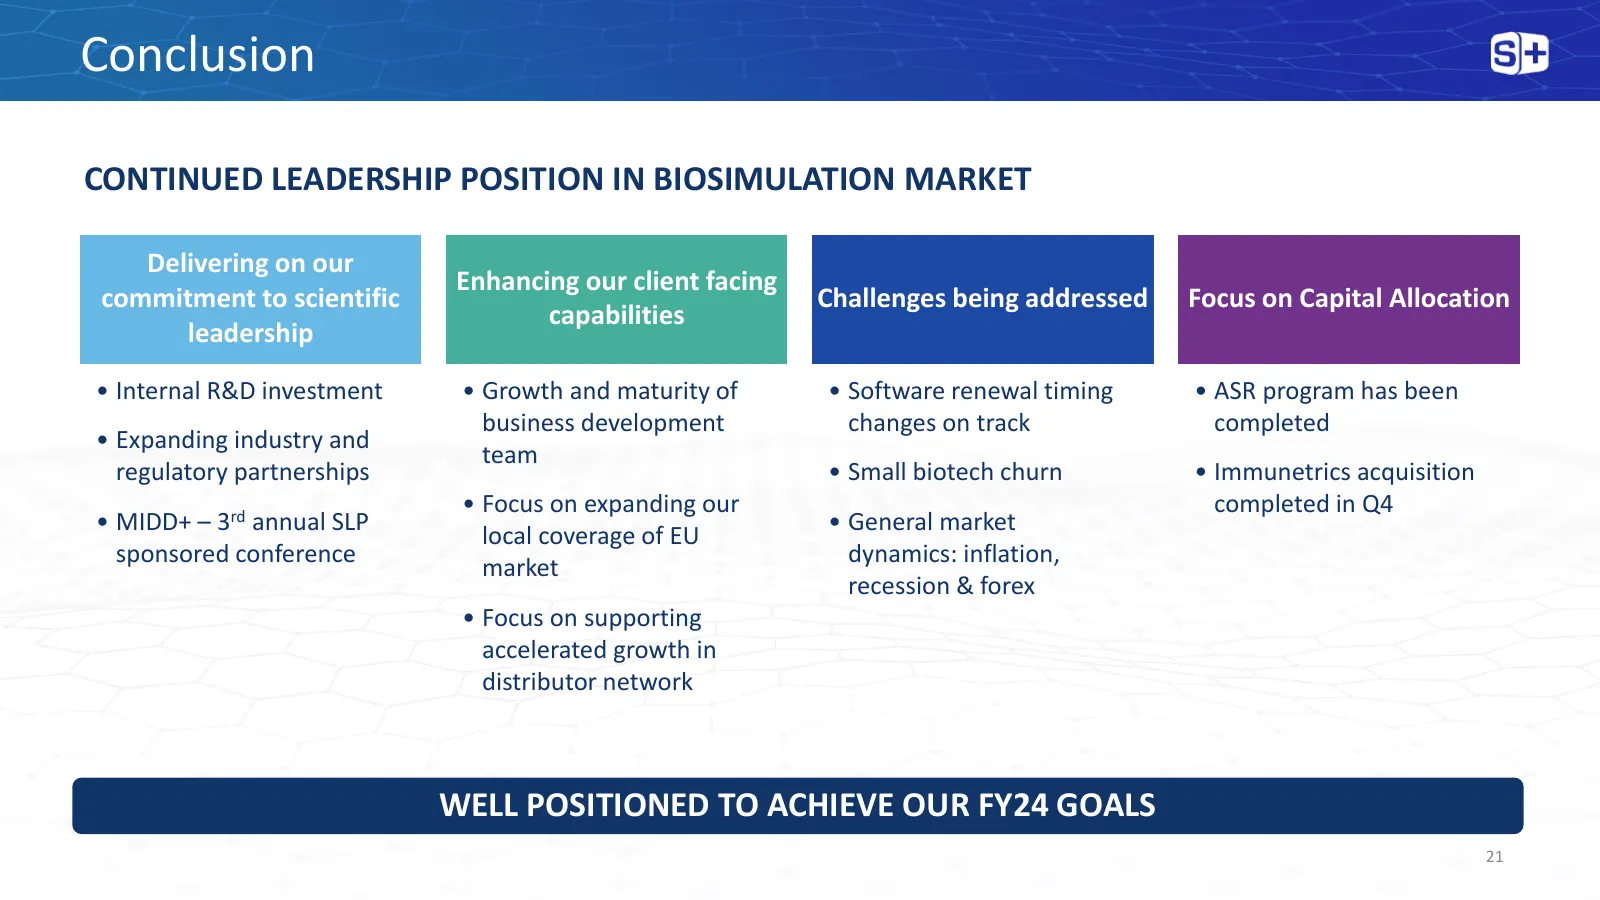
Conclusion CONTINUED LEADERSHIP POSITION IN BIOSIMULATION MARKET Delivering on our Enhancing our client facing commitment to scientific Challenges being addressed Focus on Capital Allocation capabilities leadership • Internal R&D investment • Growth and maturity of • Software renewal timing • ASR pr

Slide 22: Appendix
Appendix
Slide 23: Non-GAAP Definitions
Non-GAAP Definitions Adjusted EBITDA Adjusted EBITDA is defined as earnings (loss) before interest, taxes, depreciation and amortization, stock-based compensation, (gain) loss on currency exchange, any acquisition- or financial-transaction-related expenses, and any asset impairment charges. Currency
Slide 24: Cheminformatics and PBPK Solutions
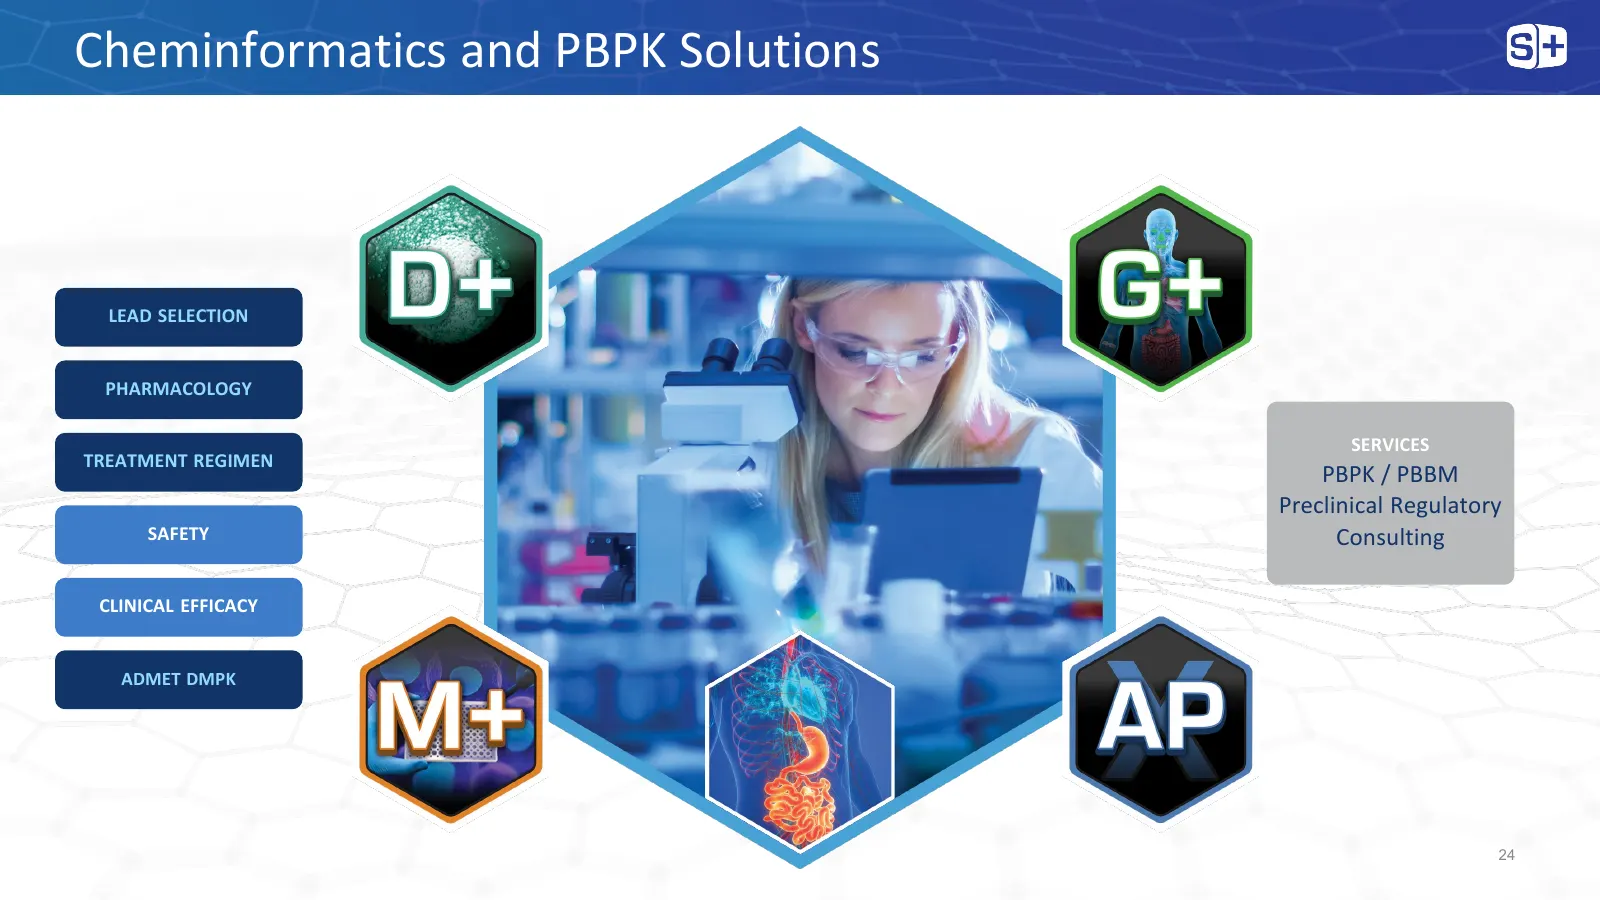
Cheminformatics and PBPK Solutions LEAD SELECTION PHARMACOLOGY SERVICES TREATMENT REGIMEN PBPK / PBBM Preclinical Regulatory SAFETY Consulting CLINICAL EFFICACY ADMET DMPK 24
Slide 25: Quantitative Systems Pharmacology Solutions
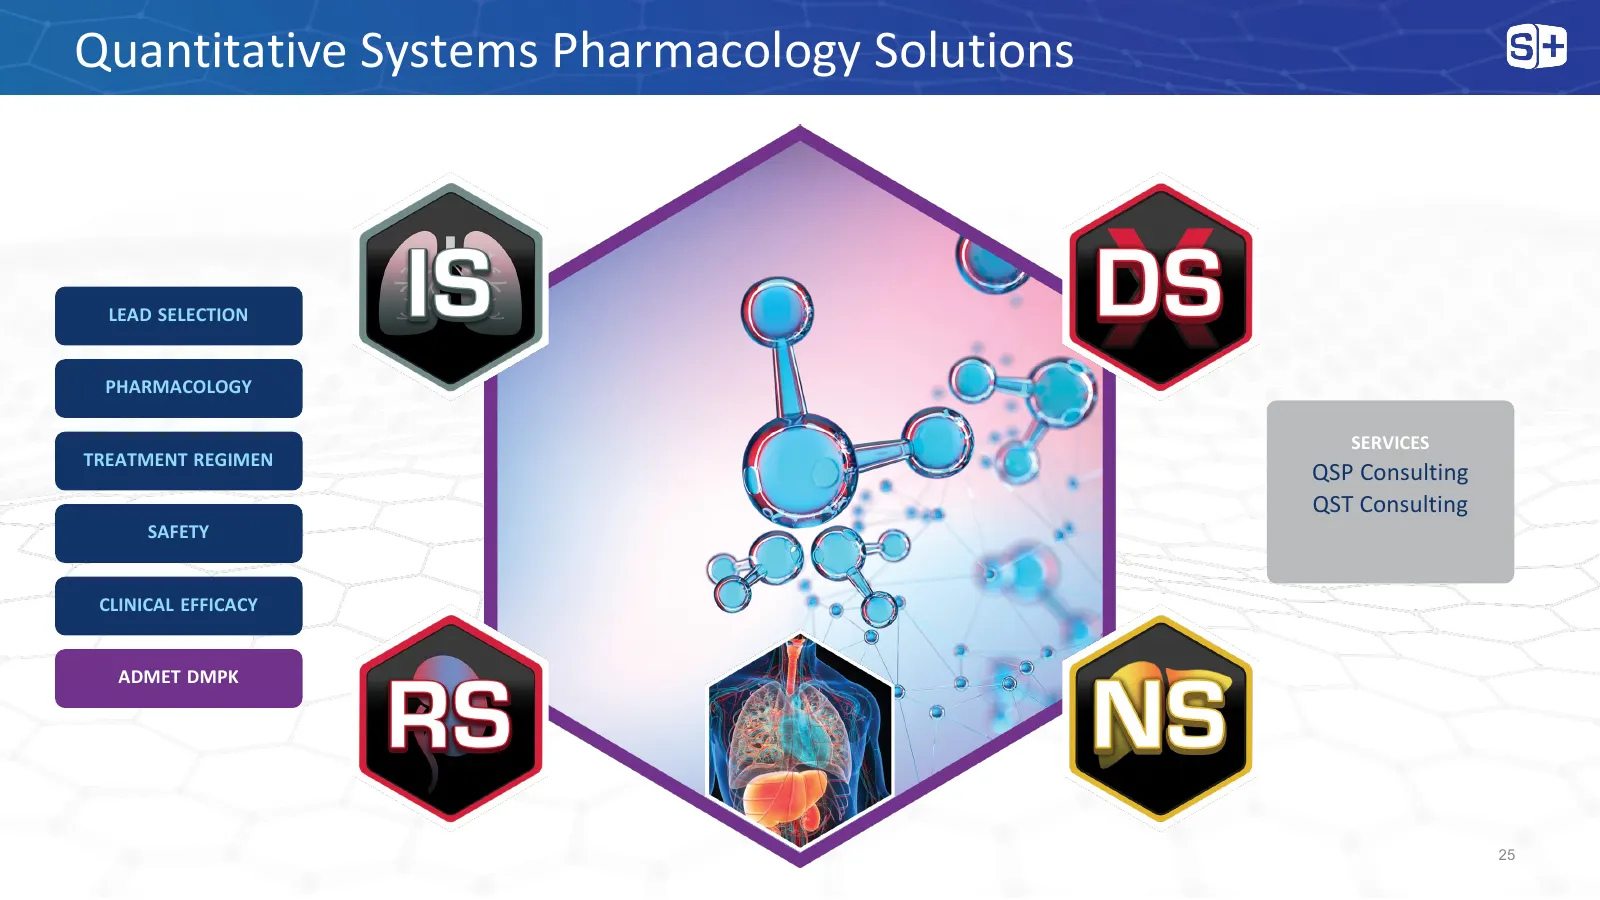
Quantitative Systems Pharmacology Solutions LEAD SELECTION PHARMACOLOGY SERVICES TREATMENT REGIMEN QSP Consulting QST Consulting SAFETY CLINICAL EFFICACY ADMET DMPK 25
Slide 26: Clinical Pharmacology & Pharmacometrics Solutions
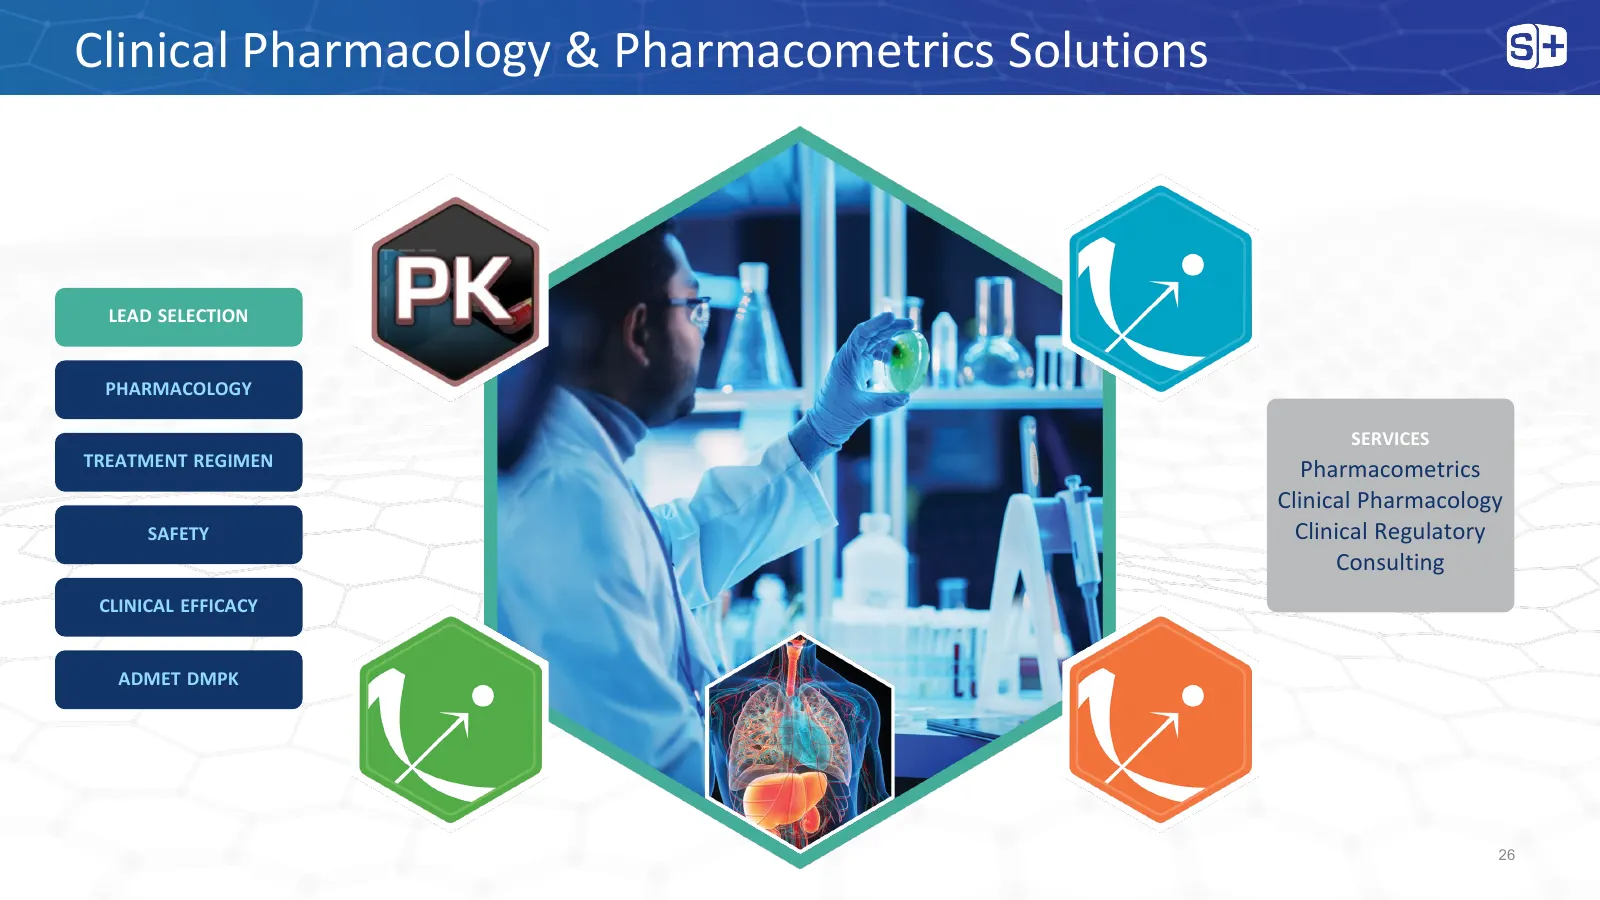
Clinical Pharmacology & Pharmacometrics Solutions LEAD SELECTION PHARMACOLOGY SERVICES TREATMENT REGIMEN Pharmacometrics Clinical Pharmacology SAFETY Clinical Regulatory Consulting CLINICAL EFFICACY ADMET DMPK 26
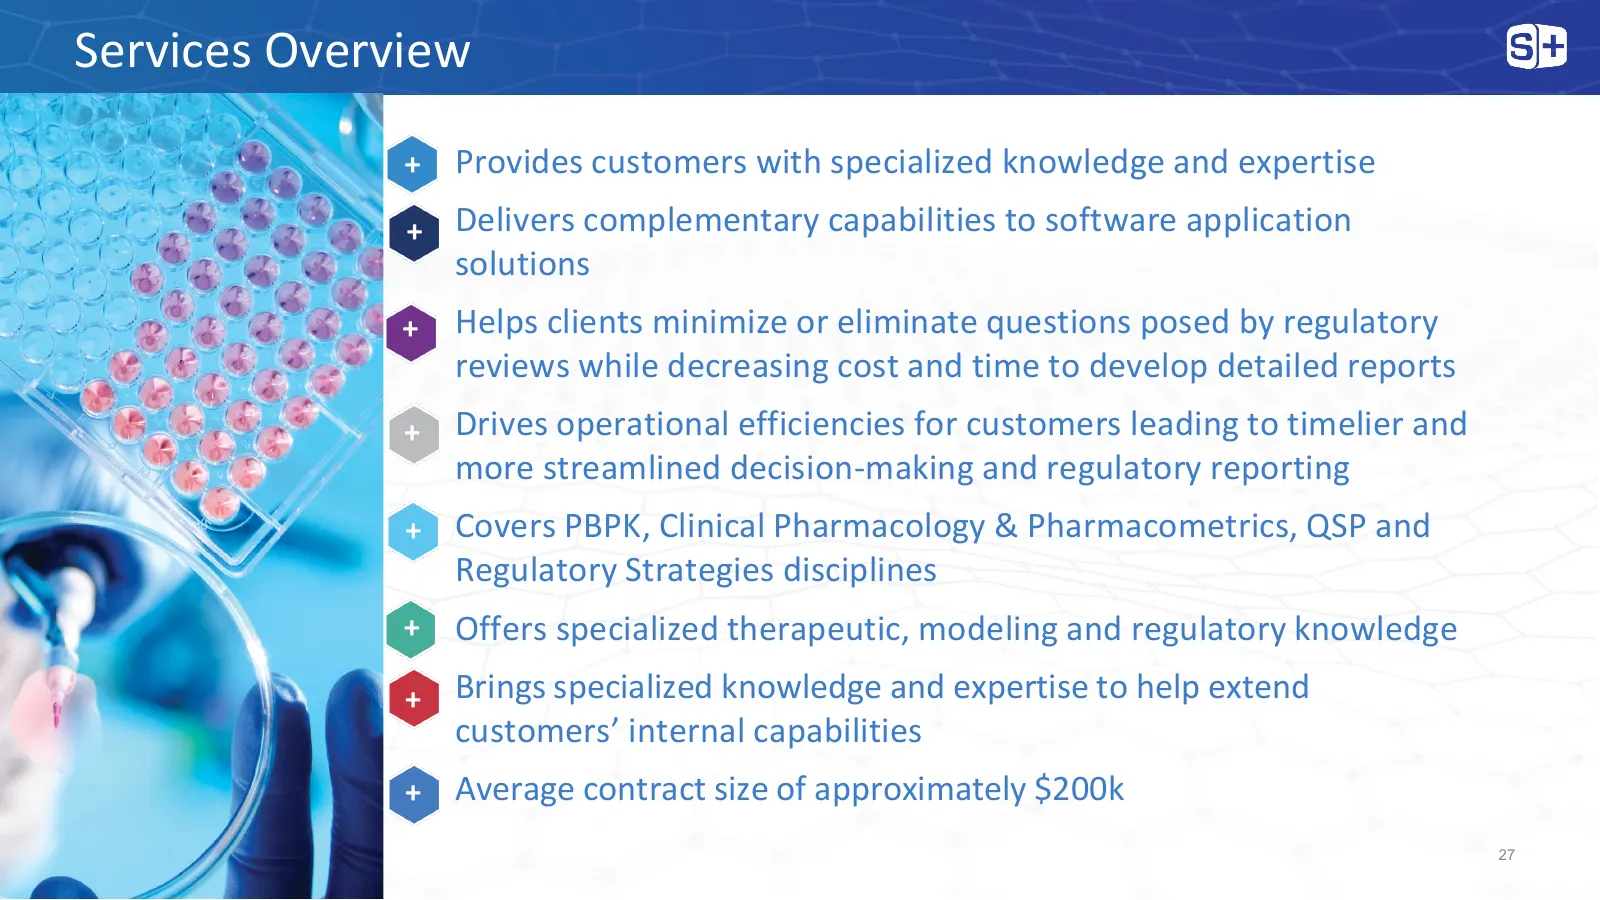
Slide 27: Services Overview
Services Overview + Provides customers with specialized knowledge and expertise + Delivers complementary capabilities to software application solutions + Helps clients minimize or eliminate questions posed by regulatory reviews while decreasing cost and time to develop detailed reports + Drives
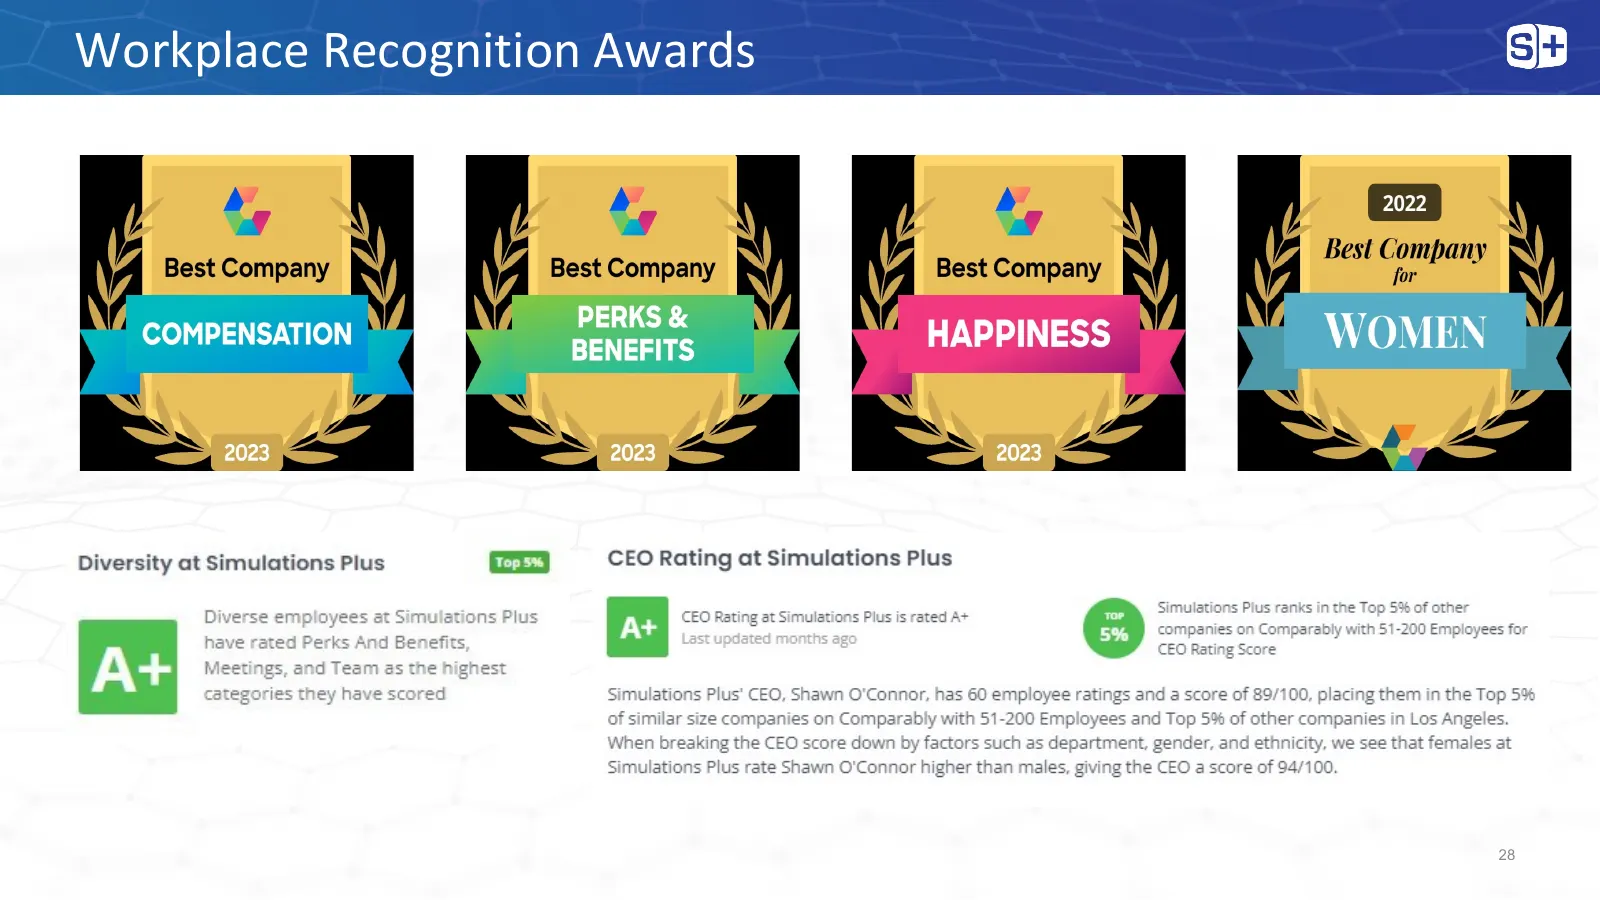
Slide 28: Workplace Recognition Awards
Workplace Recognition Awards 28

Slide 29: SimulationsPlus
iS|+ SimulationsPlus
Source: Internet Archive copy of simulations-plus.com
More decks from Simulations Plus, Inc.
 Q3 FY2026 Earnings Presentation21 slides · Jul 9, 2026
 Q2 FY2026 Earnings Presentation21 slides · Apr 9, 2026
 Q2 2026 Earnings Presentation21 slides · Apr 9, 2026
 Technical Presentation (January 2026)37 slides · Jan 22, 2026
 Q1 2026 Earnings Presentation19 slides · Jan 8, 2026
 Investor Day (2026)76 slides · 2026