Alexander & Baldwin Holdings Inc
Alexander & Baldwin — Investor Day (September 2017)
94 slides from Alexander & Baldwin's investor day presentation, Sep 12, 2017
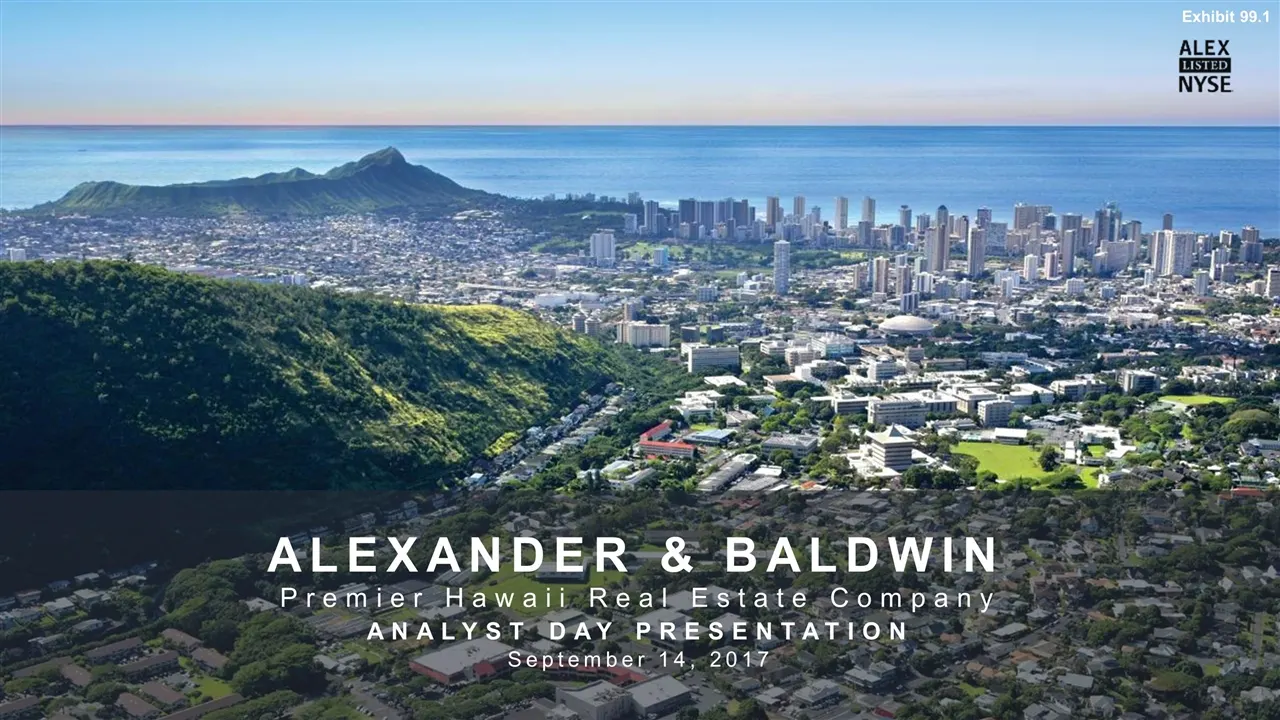
Slide 1: Analyst Day Presentation
ALEXANDER & BALDWIN Premier Hawaii Real Estate Company September 14, 2017 ANALYST DAY PRESENTATION
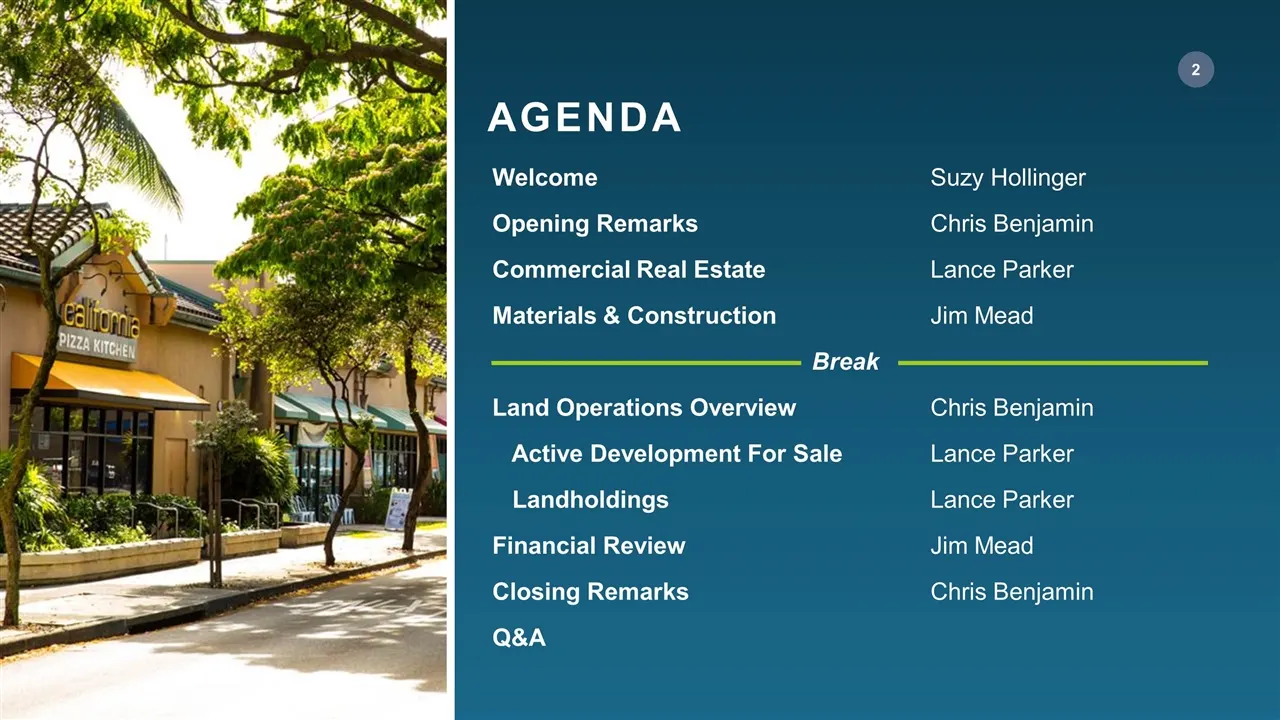
Slide 2: Agenda
Welcome Suzy Hollinger Opening Remarks Chris Benjamin Commercial Real Estate Lance Parker Materials & Construction Jim Mead Break Land Operations Overview Chris Benjamin Active Development For Sale Lance Parker Landholdings Lance Parker Financial Review Jim Mead Closing Remarks Chris Benjamin Q&A AG
Slide 3: Safe Harbor Statement
SAFE HARBOR STATEMENT Statements in this call and presentation that are not historical facts are “forward-looking statements” within the meaning of the Private Securities Litigation Reform Act of 1995. Forward-looking statements can typically be identified by words such as “believe,” “expect,” “esti
Slide 4: Opening Remarks
Opening Remarks Chris Benjamin President & CEO Alexander & Baldwin
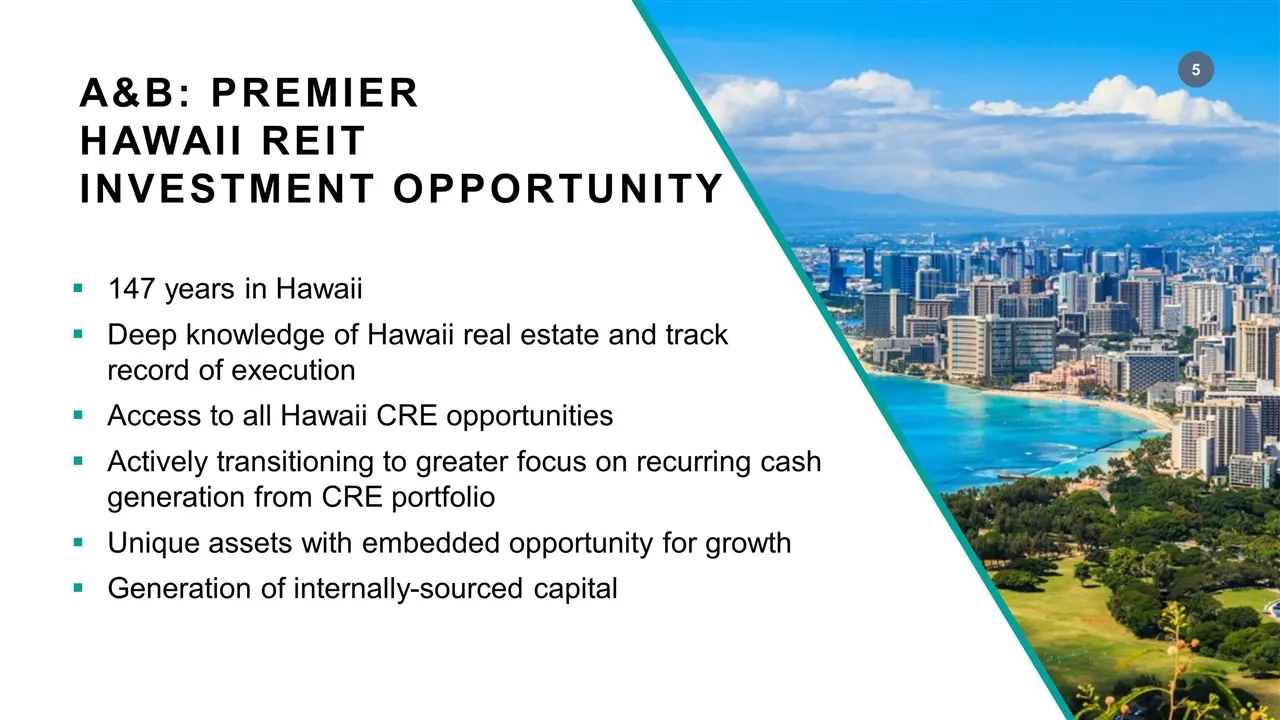
Slide 5: A&B: Premier Hawaii REIT Investment Opportunity
A&B: PREMIER HAWAII REIT INVESTMENT OPPORTUNITY 147 years in Hawaii Deep knowledge of Hawaii real estate and track record of execution Access to all Hawaii CRE opportunities Actively transitioning to greater focus on recurring cash generation from CRE portfolio Unique assets with embedded opportunit
Slide 6: Best public company vehicle for Hawaii real estate exposure
A&B is the BEST PUBLIC COMPANY vehicle to gain exposure to Hawaii real estate
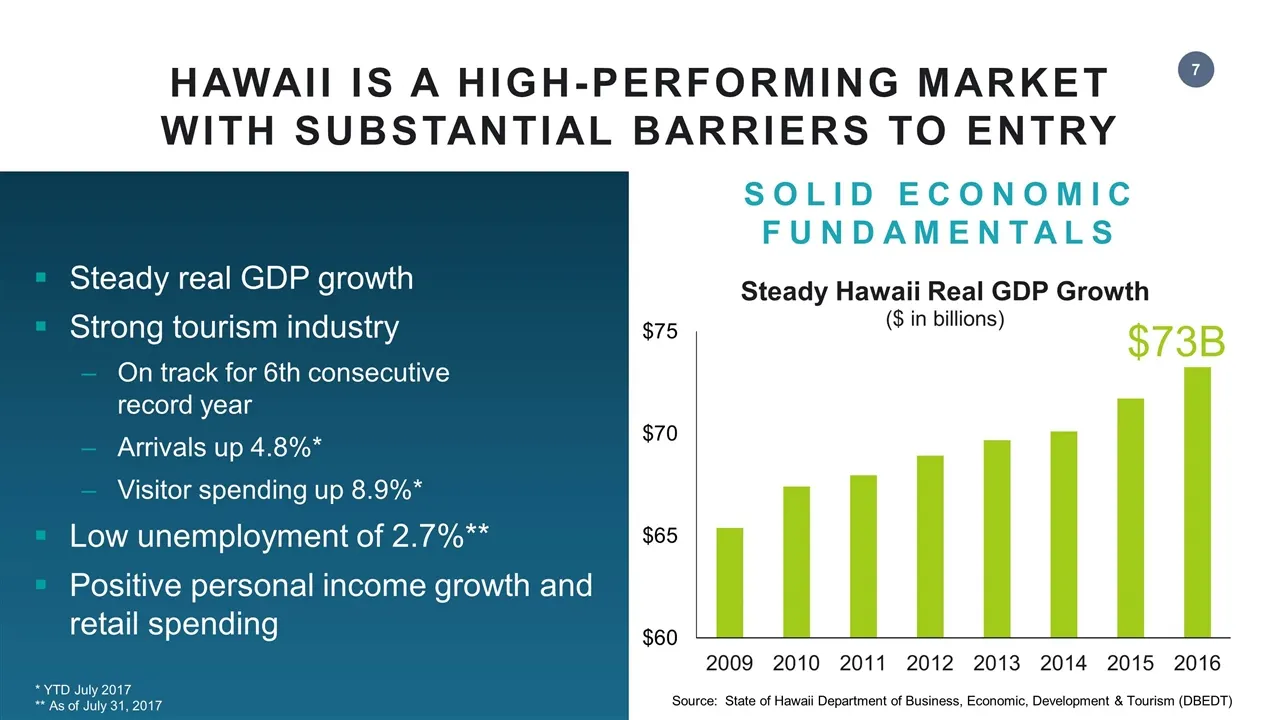
Slide 7: Solid Economic Fundamentals
SOLID ECONOMIC FUNDAMENTALS Source: State of Hawaii Department of Business, Economic, Development & Tourism (DBEDT) Steady real GDP growth Strong tourism industry On track for 6th consecutive record year Arrivals up 4.8%* Visitor spending up 8.9%* Low unemployment of 2.7%** Positive personal income
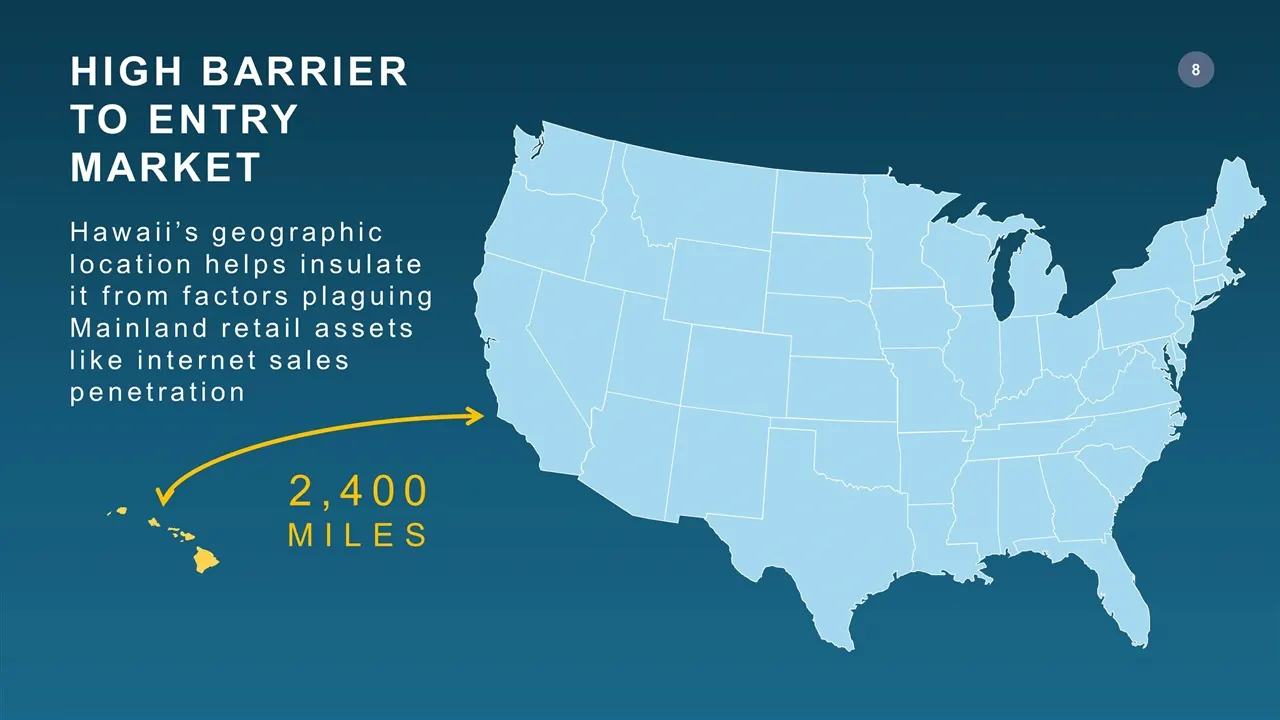
Slide 8: High Barrier to Entry Market
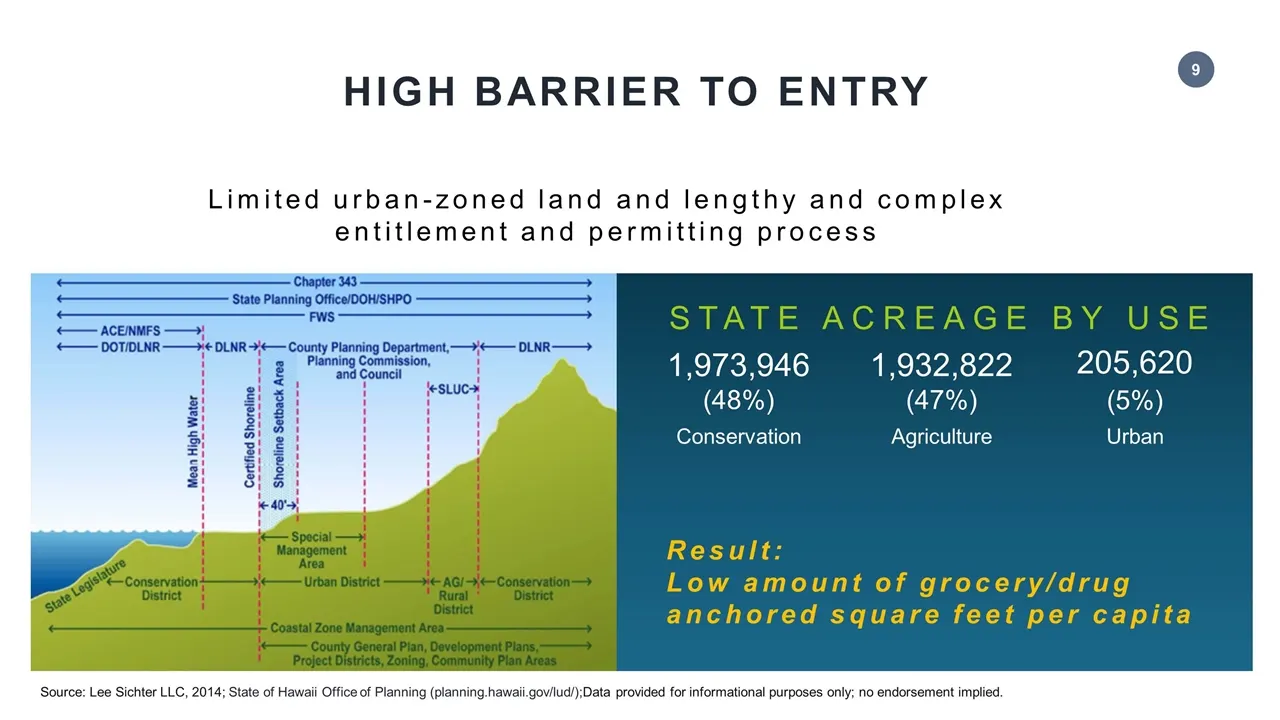
1,973,946 (48%) Hawaii’s geographic location helps insulate it from factors plaguing Mainland retail assets like internet sales penetration HIGH BARRIER TO ENTRY MARKET 2,400 MILES
Slide 9: High Barrier to Entry State Acreage by Use
HIGH BARRIER TO ENTRY STATE ACREAGE BY USE Conservation 1,932,822 (47%) 1,973,946 (48%) 205,620 (5%) Limited urban-zoned land and lengthy and complex entitlement and permitting process Agriculture Urban Result: Low amount of grocery/drug anchored square feet per capita Source: Lee Sichter LLC, 2014;
Slide 10: Strong Market Fundamentals Drive Performance
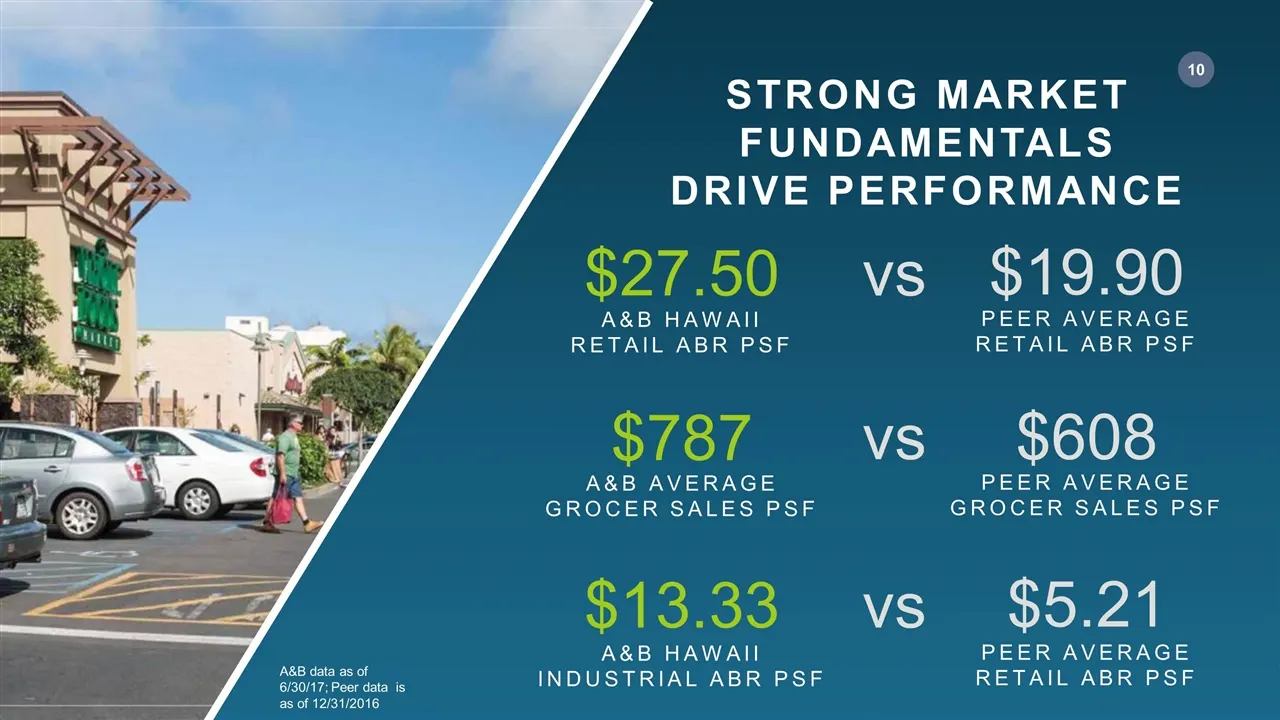
STRONG MARKET FUNDAMENTALS DRIVE PERFORMANCE A&B HAWAII RETAIL ABR PSF $27.50 A&B AVERAGE GROCER SALES PSF $787 PEER AVERAGE RETAIL ABR PSF $19.90 PEER AVERAGE GROCER SALES PSF $608 vs vs A&B HAWAII INDUSTRIAL ABR PSF $13.33 PEER AVERAGE RETAIL ABR PSF $5.21 vs A&B data as of 6/30/17; Peer data is a
Slide 11: CRE Growth Opportunities
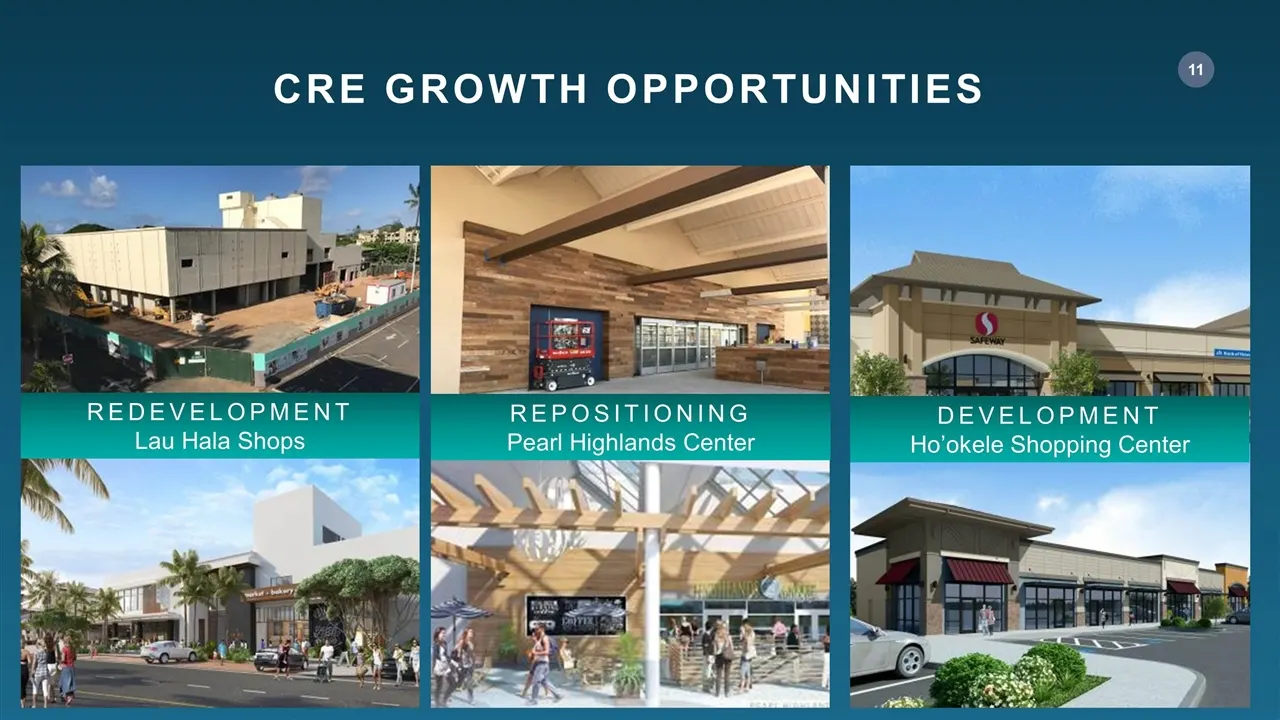
CRE GROWTH OPPORTUNITIES REDEVELOPMENT Lau Hala Shops REPOSITIONING Pearl Highlands Center DEVELOPMENT Ho’okele Shopping Center
Slide 12: Management Team with Deep Local Roots
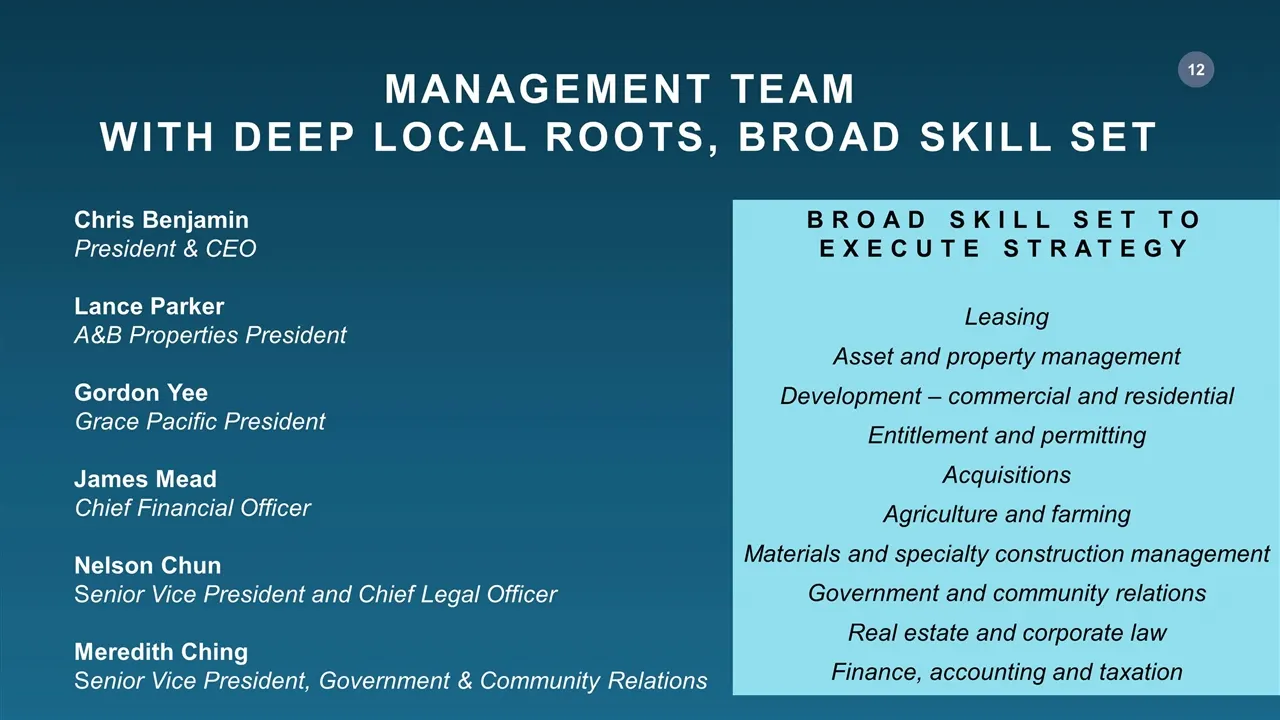
MANAGEMENT TEAM WITH DEEP LOCAL ROOTS, BROAD SKILL SET Chris Benjamin President & CEO Lance Parker A&B Properties President Gordon Yee Grace Pacific President James Mead Chief Financial Officer Nelson Chun Senior Vice President and Chief Legal Officer Meredith Ching Senior Vice President, Government
Slide 13: Focused on Creating Shareholder Value
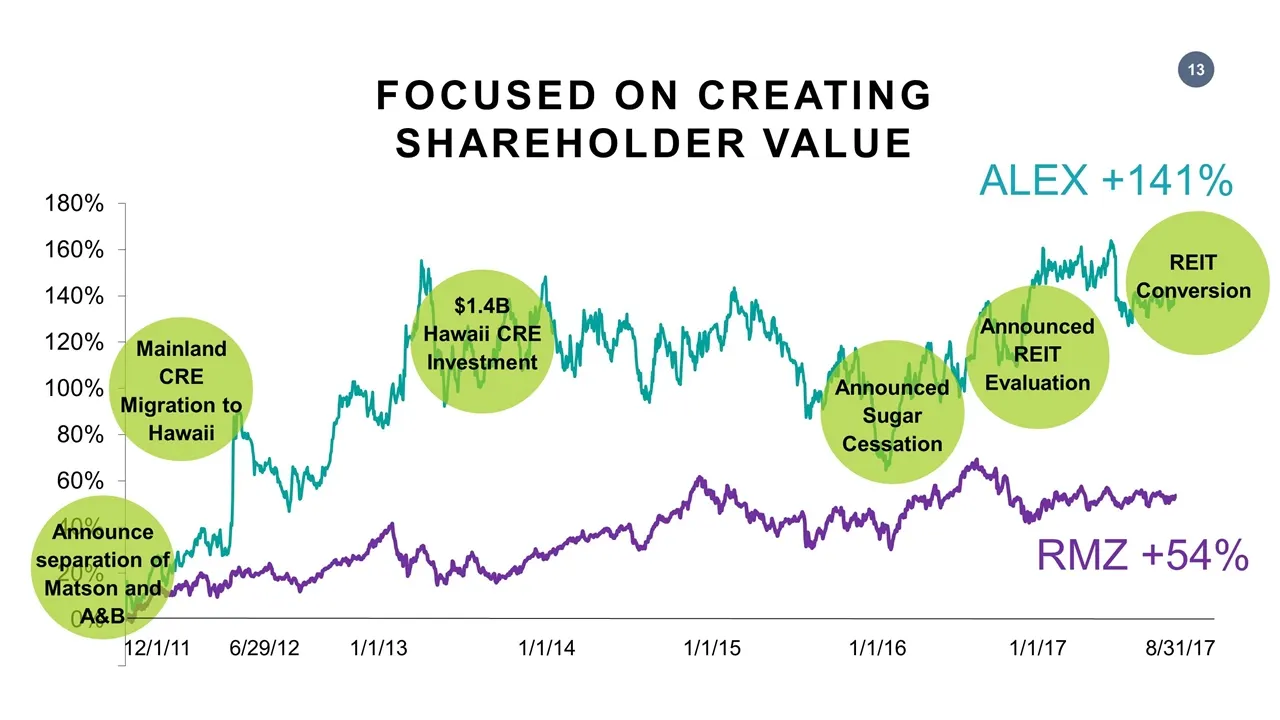
Announce separation of Matson and A&B Announced Sugar Cessation Mainland CRE Migration to Hawaii REIT Conversion Announced REIT Evaluation $1.4B Hawaii CRE Investment 8/31/17 ALEX +141% FOCUSED ON CREATING SHAREHOLDER VALUE 6/29/12 1/1/13 1/1/14 1/1/15 1/1/16 1/1/17 12/1/11 RMZ +54%
Slide 14: Strategic Mission
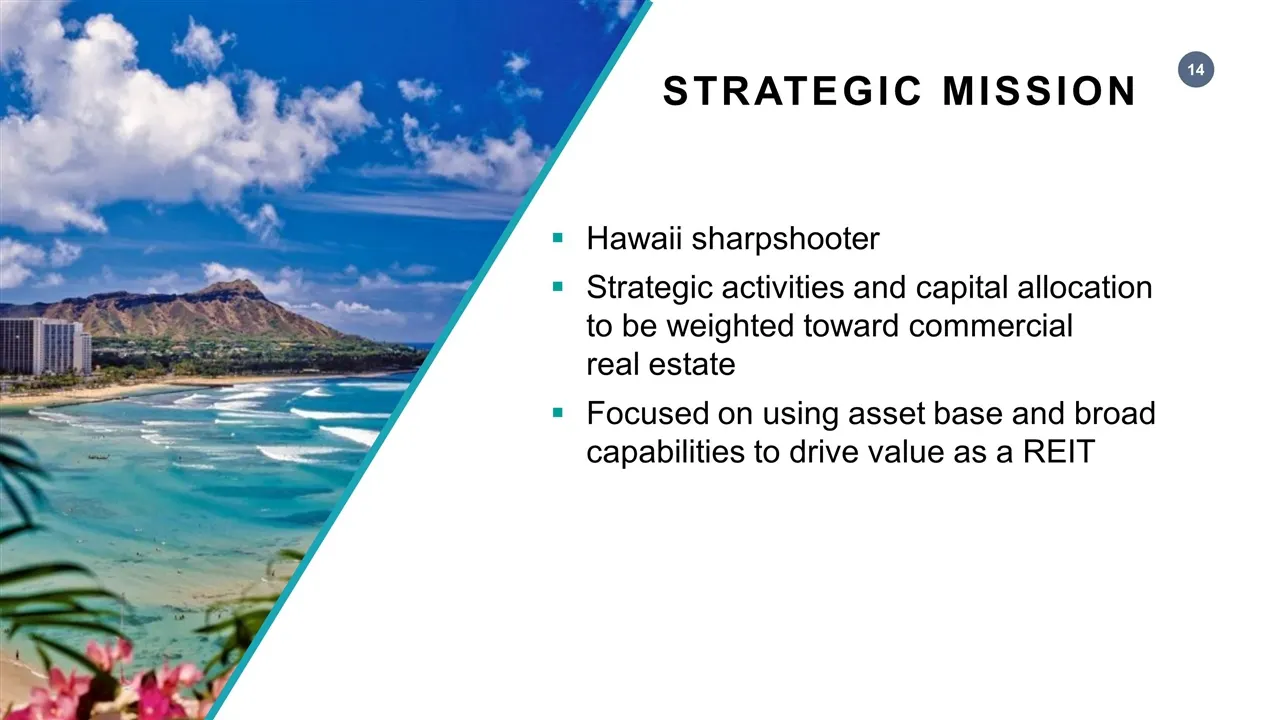
STRATEGIC MISSION Hawaii sharpshooter Strategic activities and capital allocation to be weighted toward commercial real estate Focused on using asset base and broad capabilities to drive value as a REIT
Slide 15: Commercial Real Estate
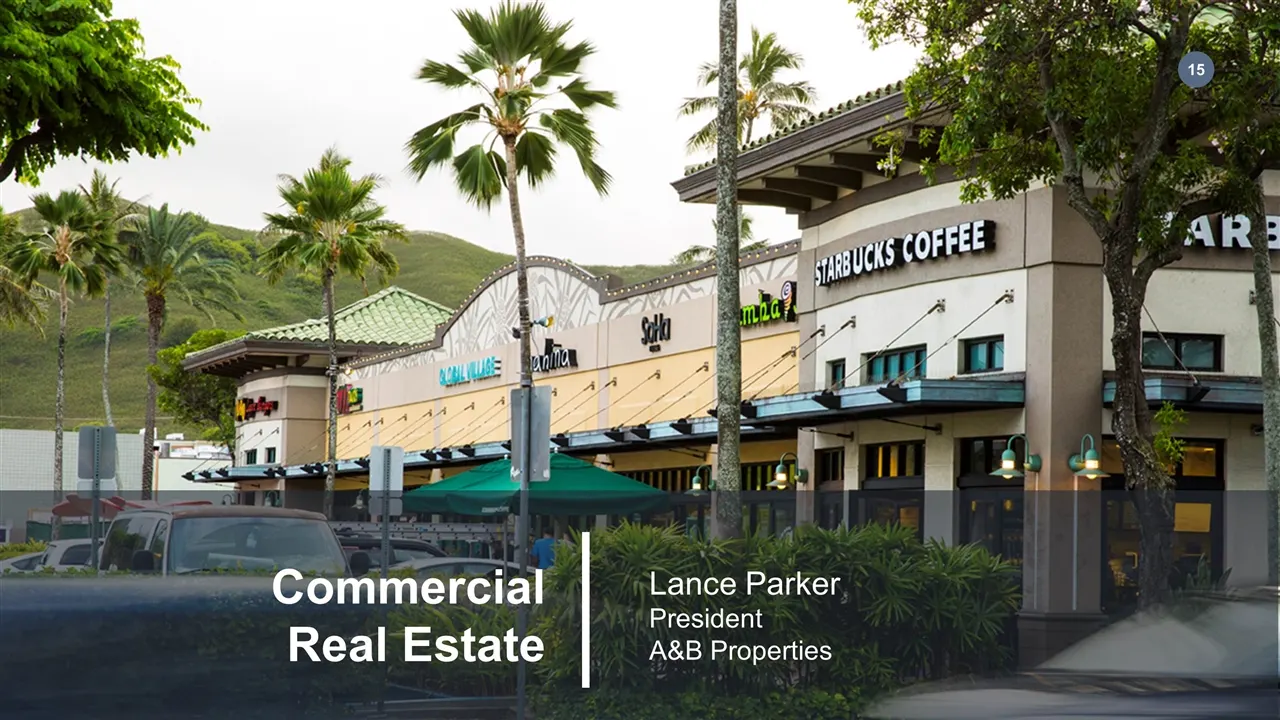
Commercial Real Estate Lance Parker President A&B Properties
Slide 16: CRE Management Team
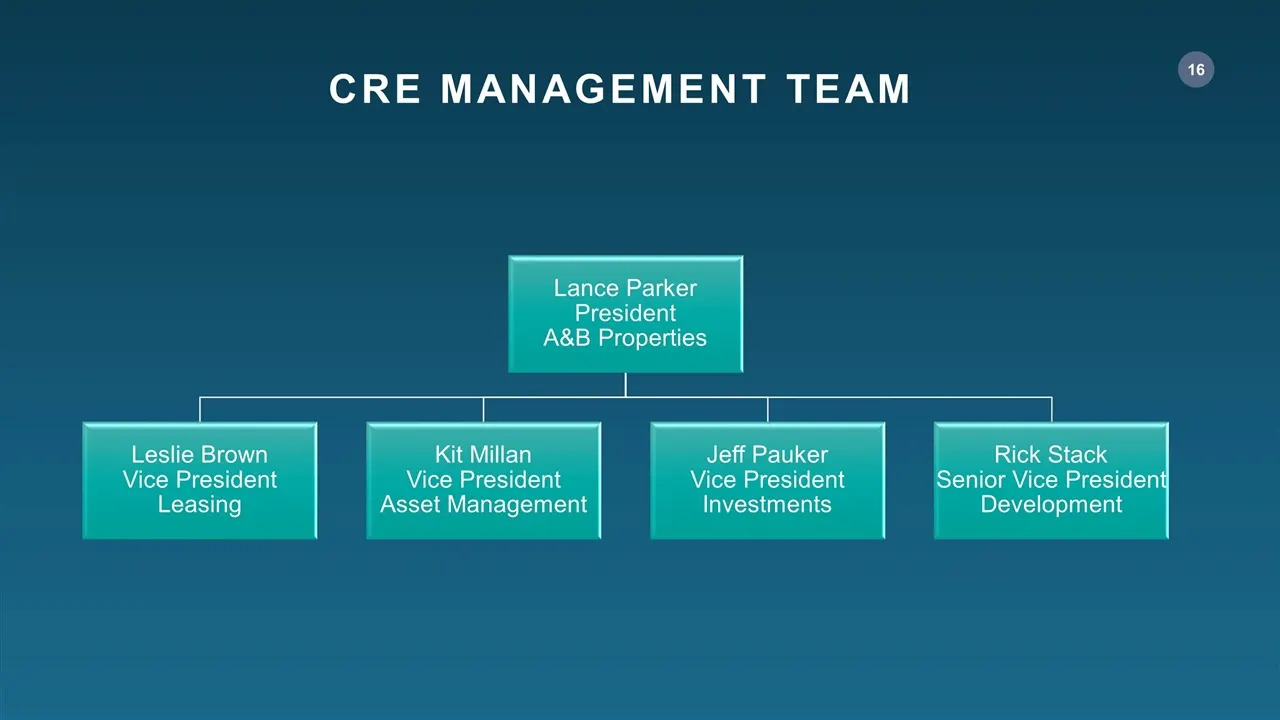
CRE MANAGEMENT TEAM Lance Parker President A&B Properties Leslie Brown Vice President Leasing Kit Millan Vice President Asset Management Jeff Pauker Vice President Investments Rick Stack Senior Vice President Development
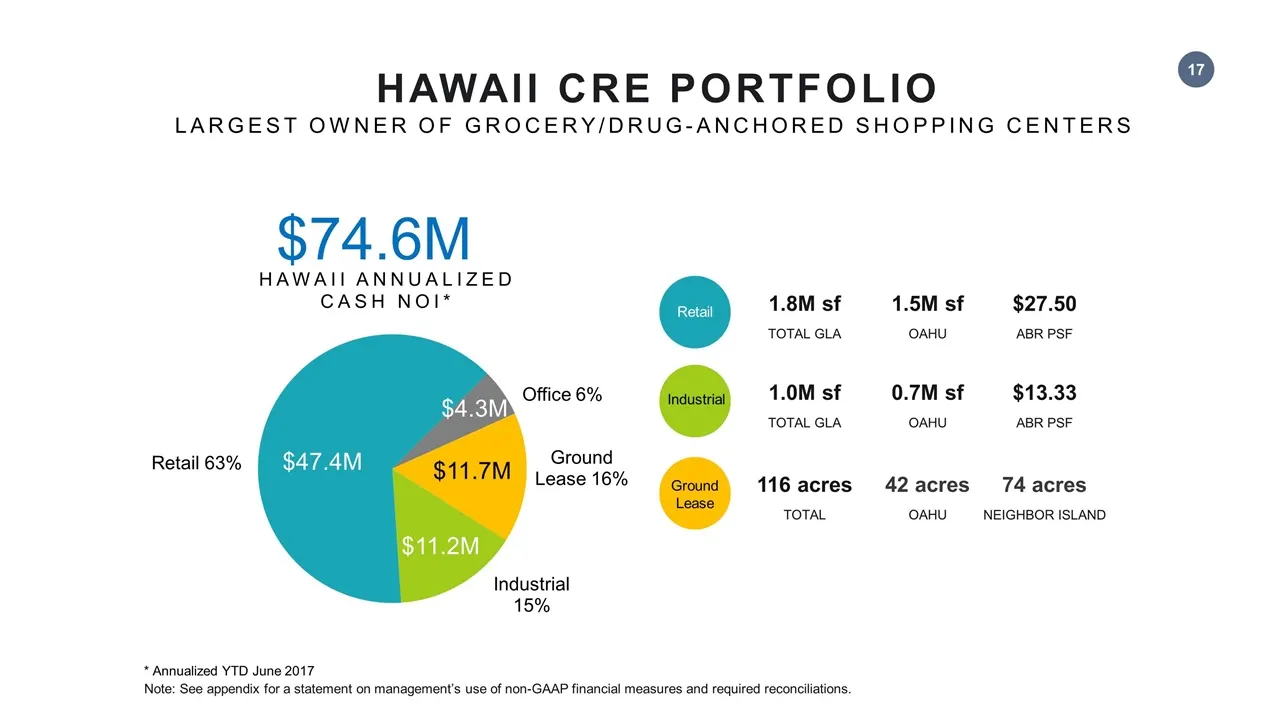
Slide 17: Hawaii CRE Portfolio
Largest owner of grocery/drug-anchored shopping centers Ground Lease 116 acres TOTAL 42 acres OAHU 74 acres NEIGHBOR ISLAND $74.6M HAWAII ANNUALIZED CASH NOI* Note: See appendix for a statement on management’s use of non-GAAP financial measures and required reconciliations. $47.4M $11.2M $4.3M $11.7
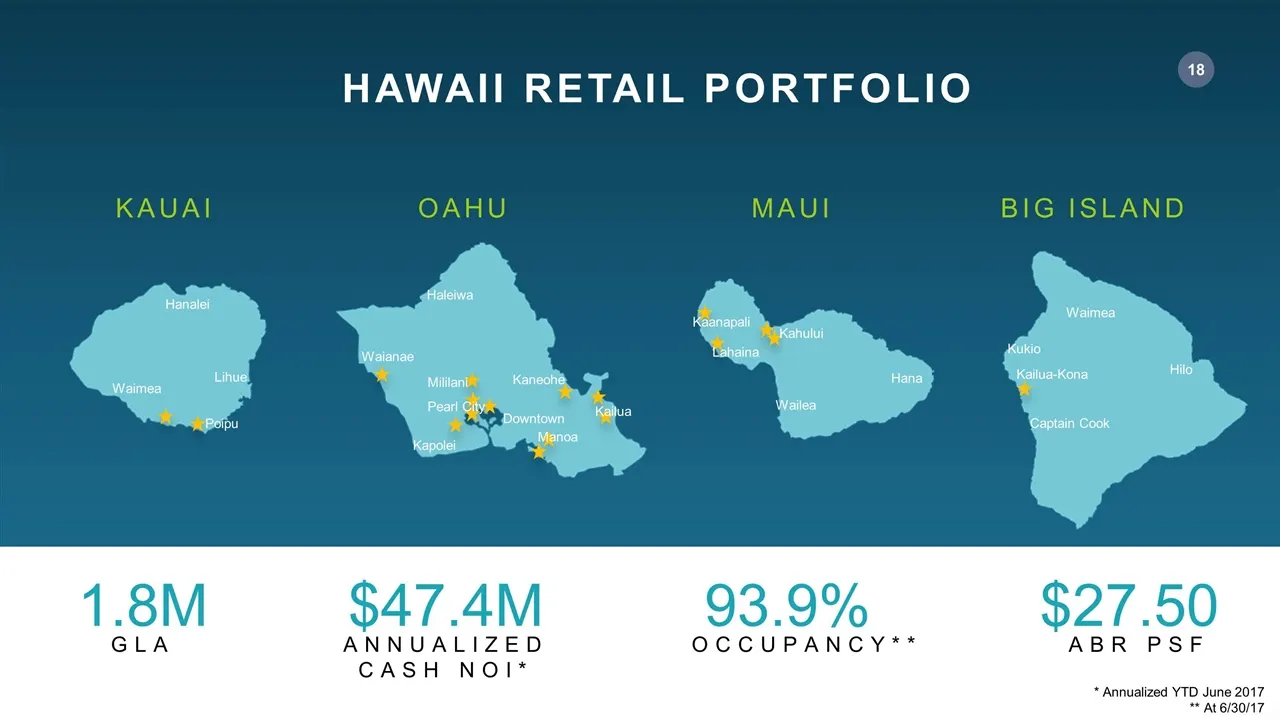
Slide 18: Hawaii Retail Portfolio
GLA 1.8M ANNUALIZED CASH NOI* $47.4M OCCUPANCY** 93.9% ABR PSF $27.50 HAWAII RETAIL PORTFOLIO KAUAI MAUI OAHU BIG ISLAND Poipu Lihue Hanalei Waimea Kailua Kaneohe Manoa Mililani Pearl City Kapolei Waianae Haleiwa Kahului Downtown Lahaina Kaanapali Wailea Hana Kailua-Kona Hilo Waimea Kukio Captain Co
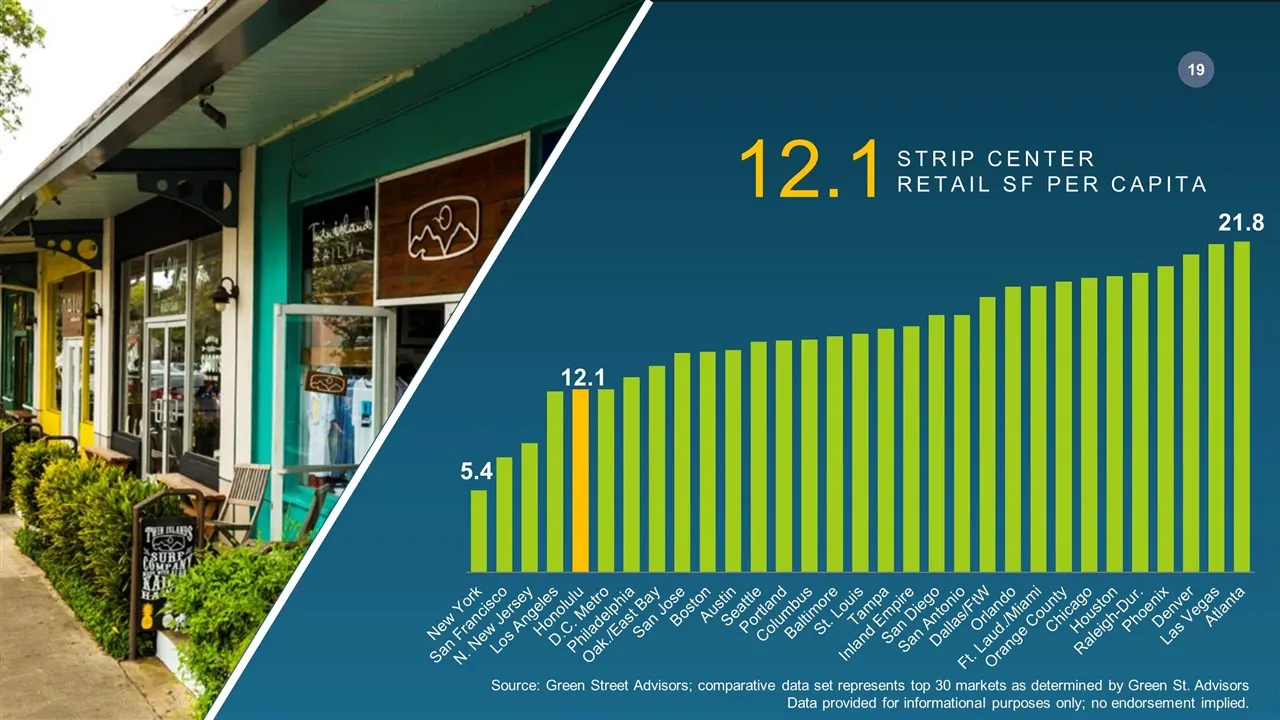
Slide 19: Strip Center Retail SF per Capita
STRIP CENTER RETAIL SF PER CAPITA 12.1 Source: Green Street Advisors; comparative data set represents top 30 markets as determined by Green St. Advisors Data provided for informational purposes only; no endorsement implied.
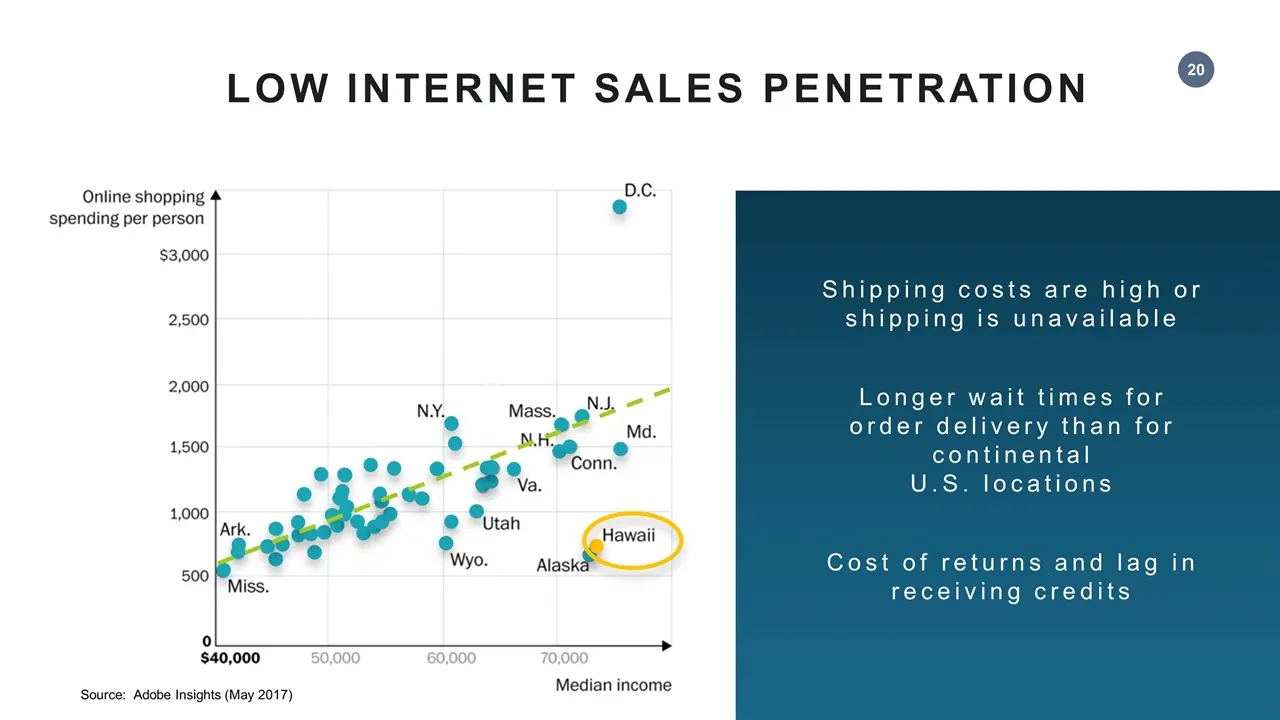
Slide 20: Low Internet Sales Penetration
LOW INTERNET SALES PENETRATION Shipping costs are high or shipping is unavailable Longer wait times for order delivery than for continental U.S. locations Cost of returns and lag in receiving credits Source: Adobe Insights (May 2017)
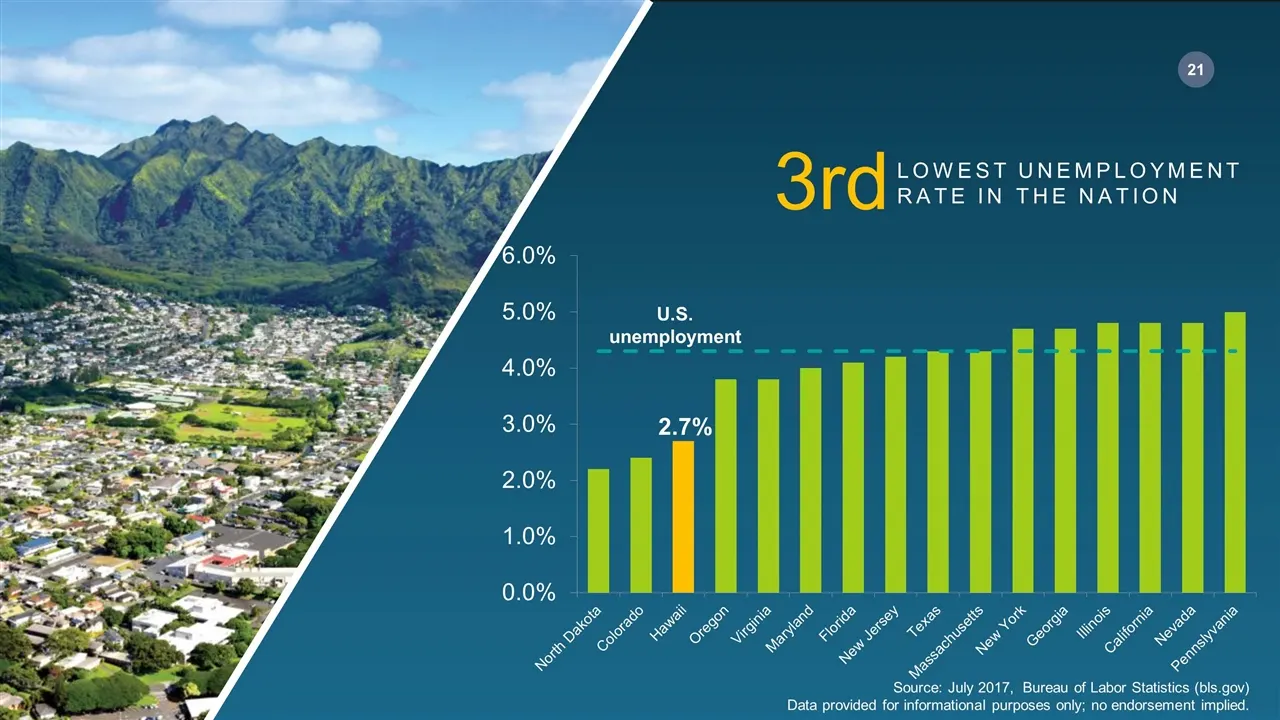
Slide 21: Lowest Unemployment Rate in the Nation
LOWEST UNEMPLOYMENT RATE IN THE NATION 3rd Source: July 2017, Bureau of Labor Statistics (bls.gov) Data provided for informational purposes only; no endorsement implied. U.S. unemployment
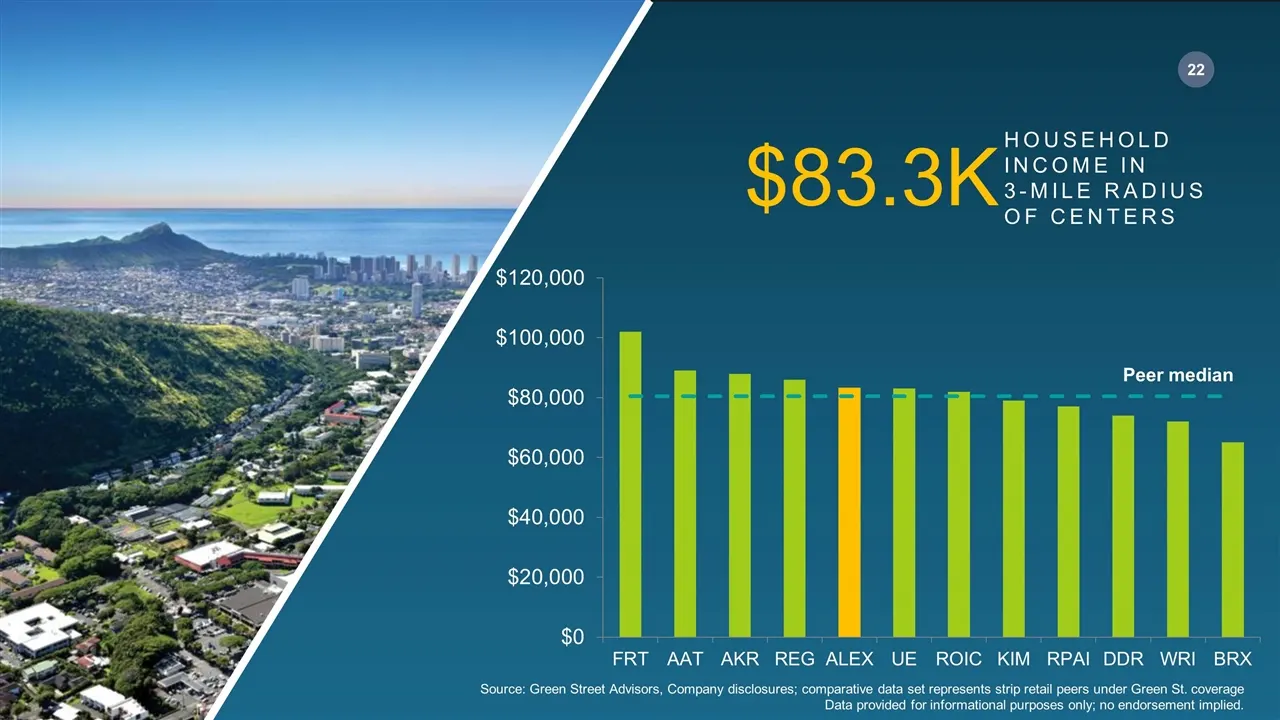
Slide 22: Household Income in 3-Mile Radius of Centers
$83.3K HOUSEHOLD INCOME IN 3-MILE RADIUS OF CENTERS Source: Green Street Advisors, Company disclosures; comparative data set represents strip retail peers under Green St. coverage Data provided for informational purposes only; no endorsement implied. Peer median
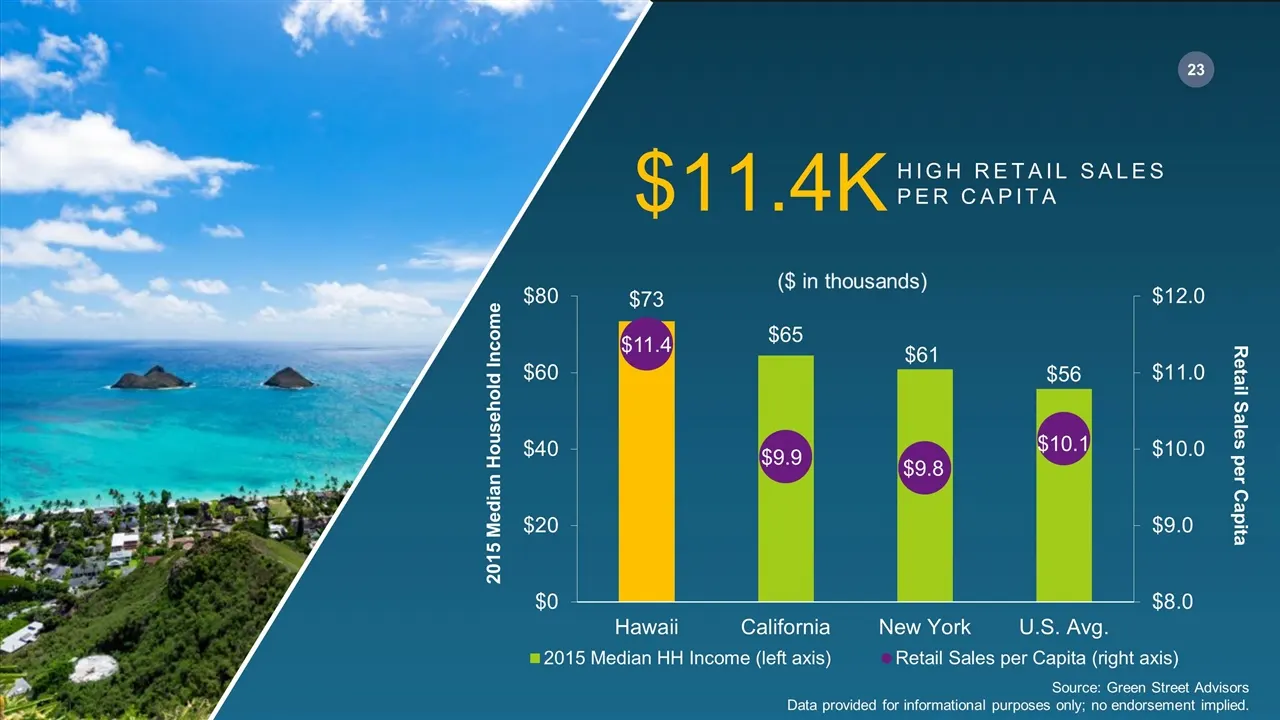
Slide 23: High Retail Sales per Capita
HIGH RETAIL SALES PER CAPITA $11.4K Retail Sales per Capita 2015 Median Household Income Source: Green Street Advisors Data provided for informational purposes only; no endorsement implied.
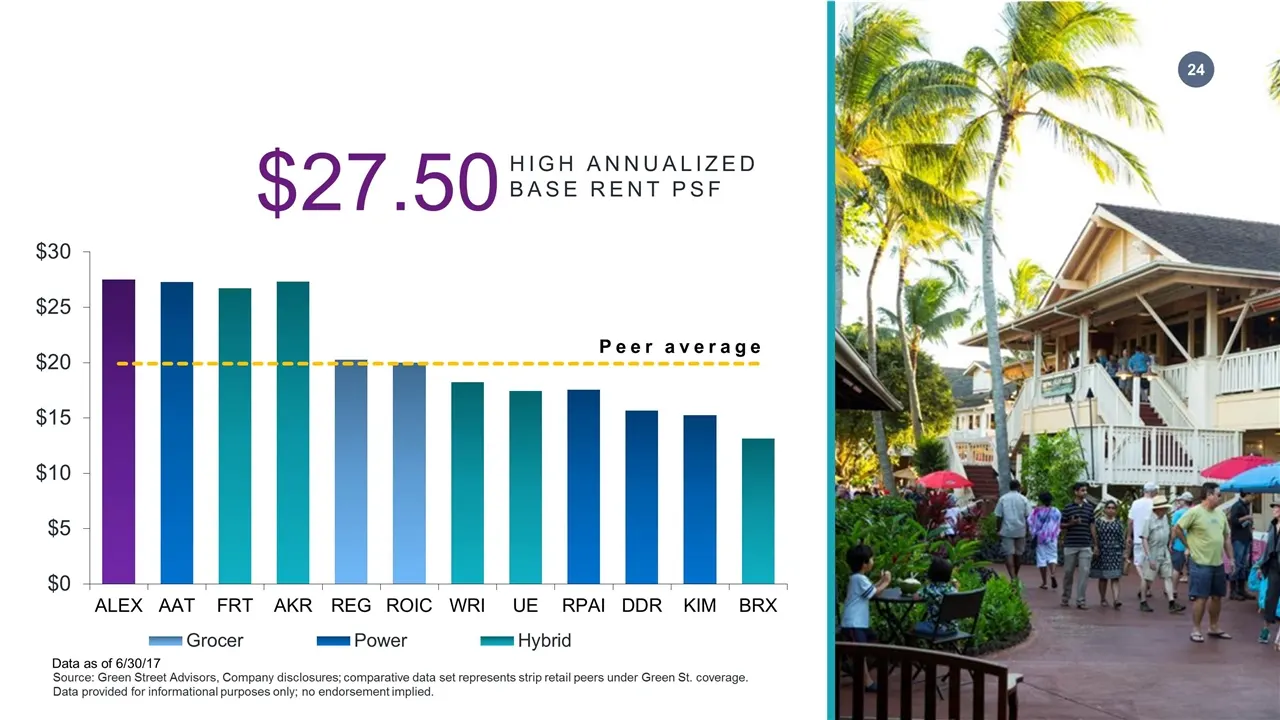
Slide 24: High Annualized Base Rent PSF
HIGH ANNUALIZED BASE RENT PSF $27.50 Source: Green Street Advisors, Company disclosures; comparative data set represents strip retail peers under Green St. coverage. Data provided for informational purposes only; no endorsement implied. Data as of 6/30/17 Peer average
Slide 25: 2016 Grocer Sales Productivity
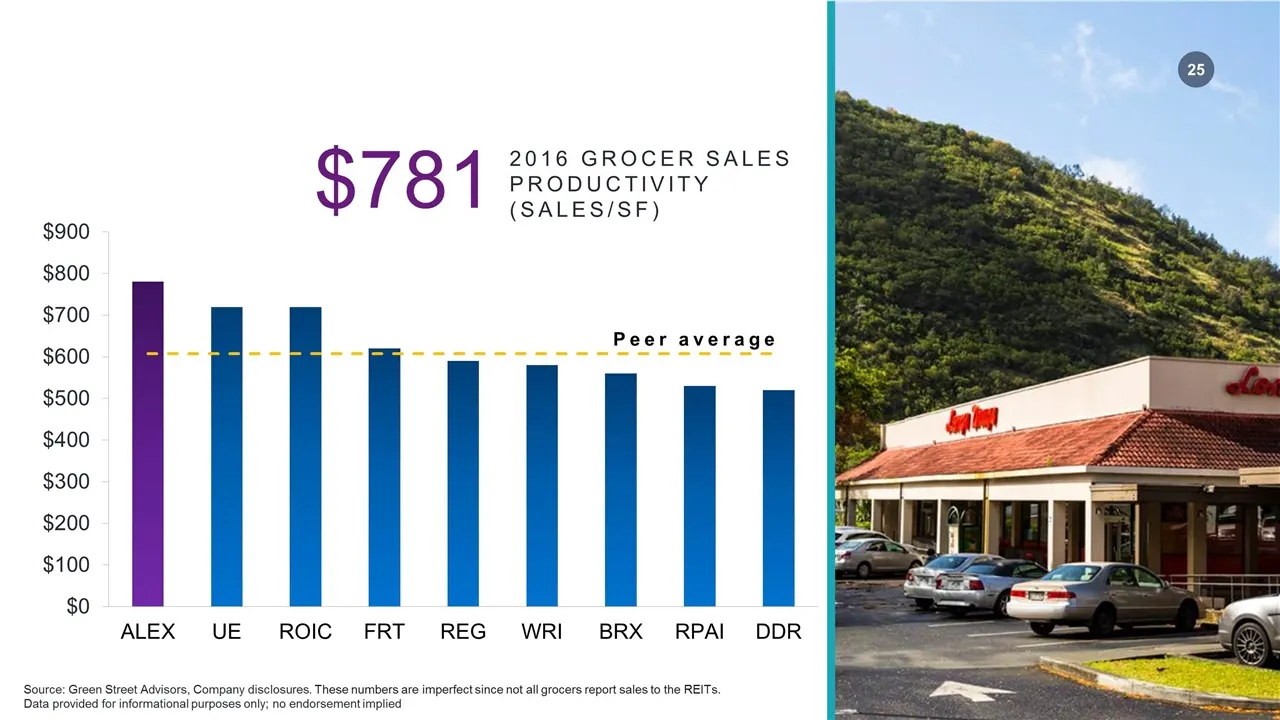
2016 GROCER SALES PRODUCTIVITY (SALES/SF) $781 Source: Green Street Advisors, Company disclosures. These numbers are imperfect since not all grocers report sales to the REITs. Data provided for informational purposes only; no endorsement implied Peer average
Slide 26: High Hawaii Retail Releasing Spreads
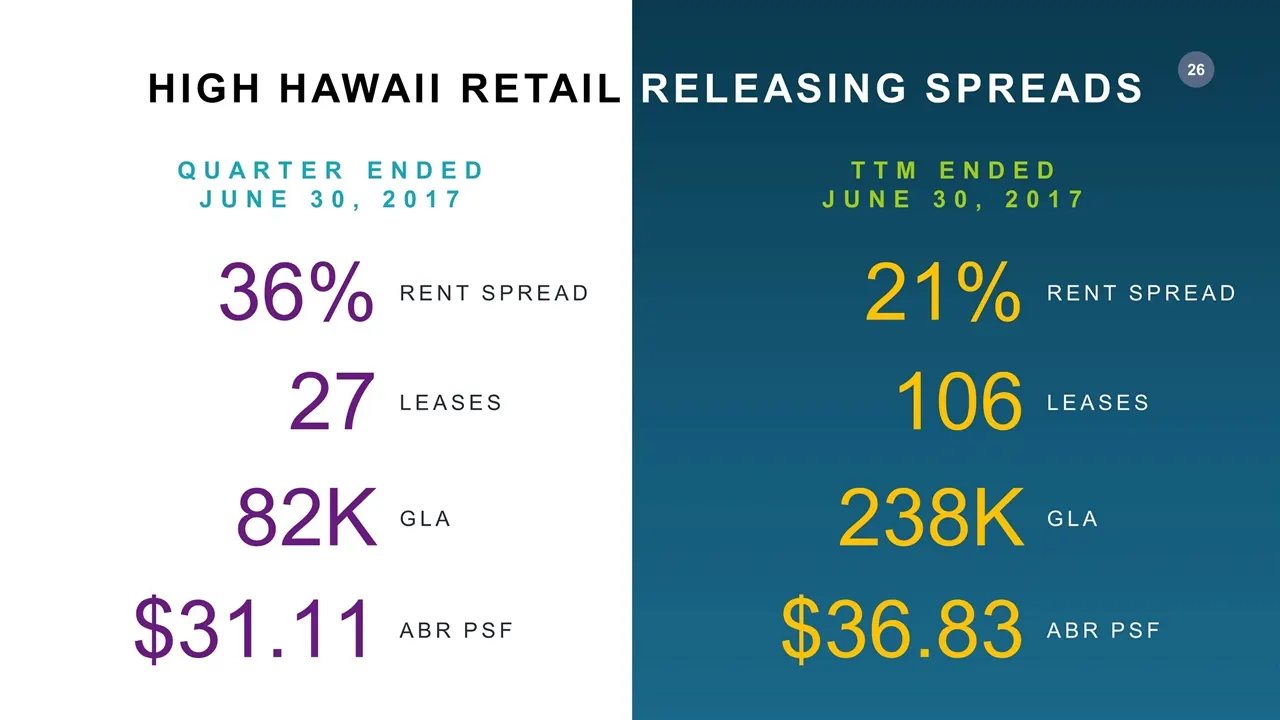
RENT SPREAD 36% HIGH HAWAII RETAIL RELEASING SPREADS LEASES 27 GLA 82K ABR PSF $31.11 RENT SPREAD 21% LEASES 106 GLA 238K ABR PSF $36.83 TTM ENDED JUNE 30, 2017 QUARTER ENDED JUNE 30, 2017
Slide 27: Strong Retail Same-Store Cash NOI Growth
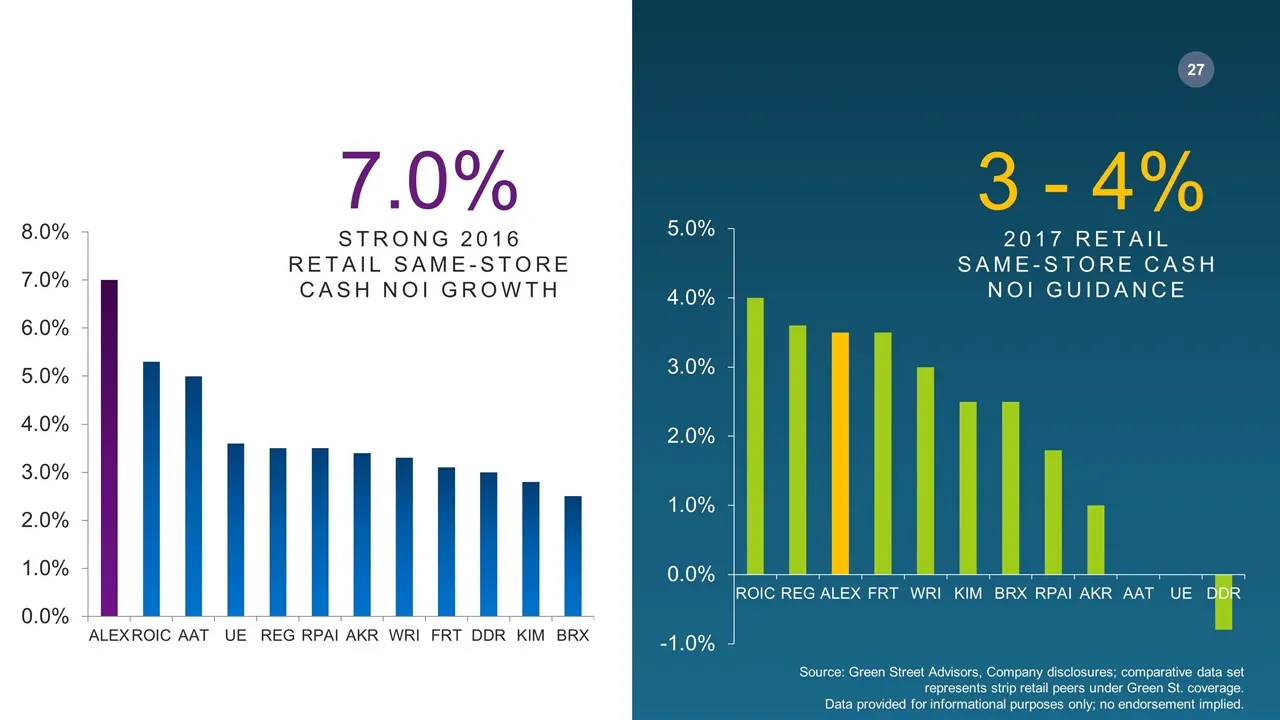
STRONG 2016 RETAIL SAME-STORE CASH NOI GROWTH 7.0% 2017 RETAIL SAME-STORE CASH NOI GUIDANCE 3 - 4% Source: Green Street Advisors, Company disclosures; comparative data set represents strip retail peers under Green St. coverage. Data provided for informational purposes only; no endorsement implied.
Slide 28: Low Exposure to At Risk Retailers
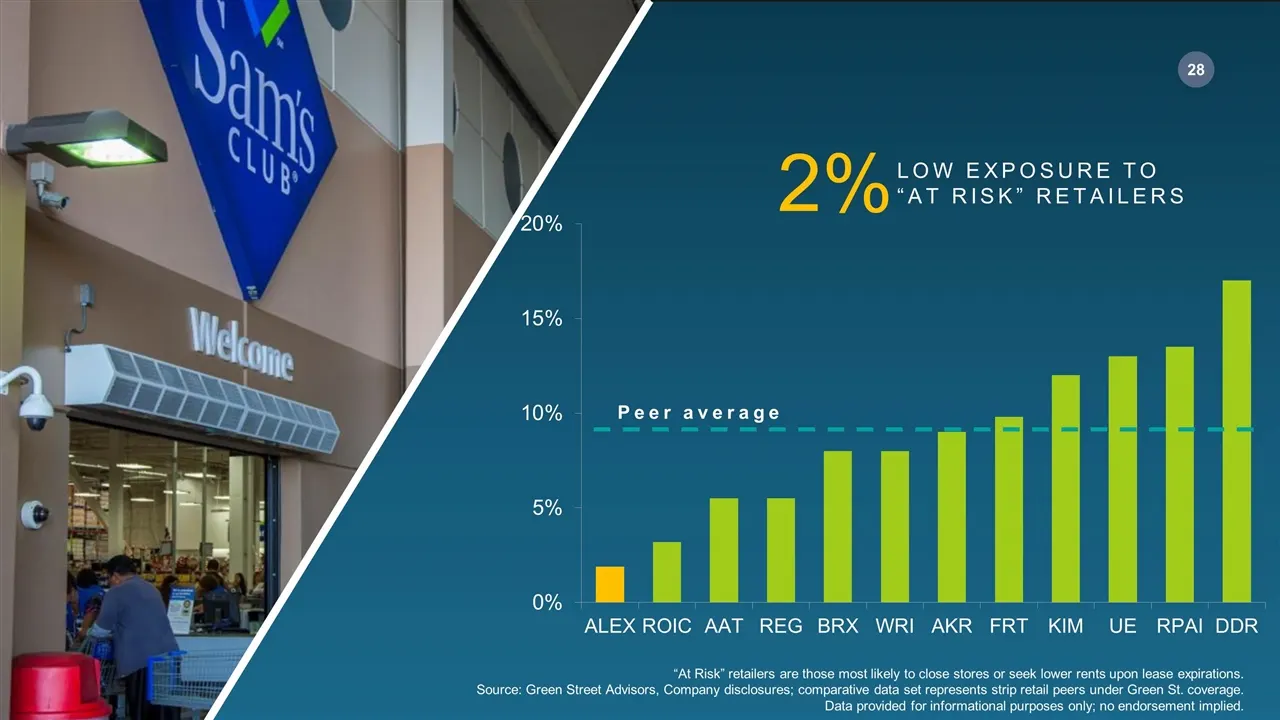
LOW EXPOSURE TO “AT RISK” RETAILERS 2% “At Risk” retailers are those most likely to close stores or seek lower rents upon lease expirations. Source: Green Street Advisors, Company disclosures; comparative data set represents strip retail peers under Green St. coverage. Data provided for informationa
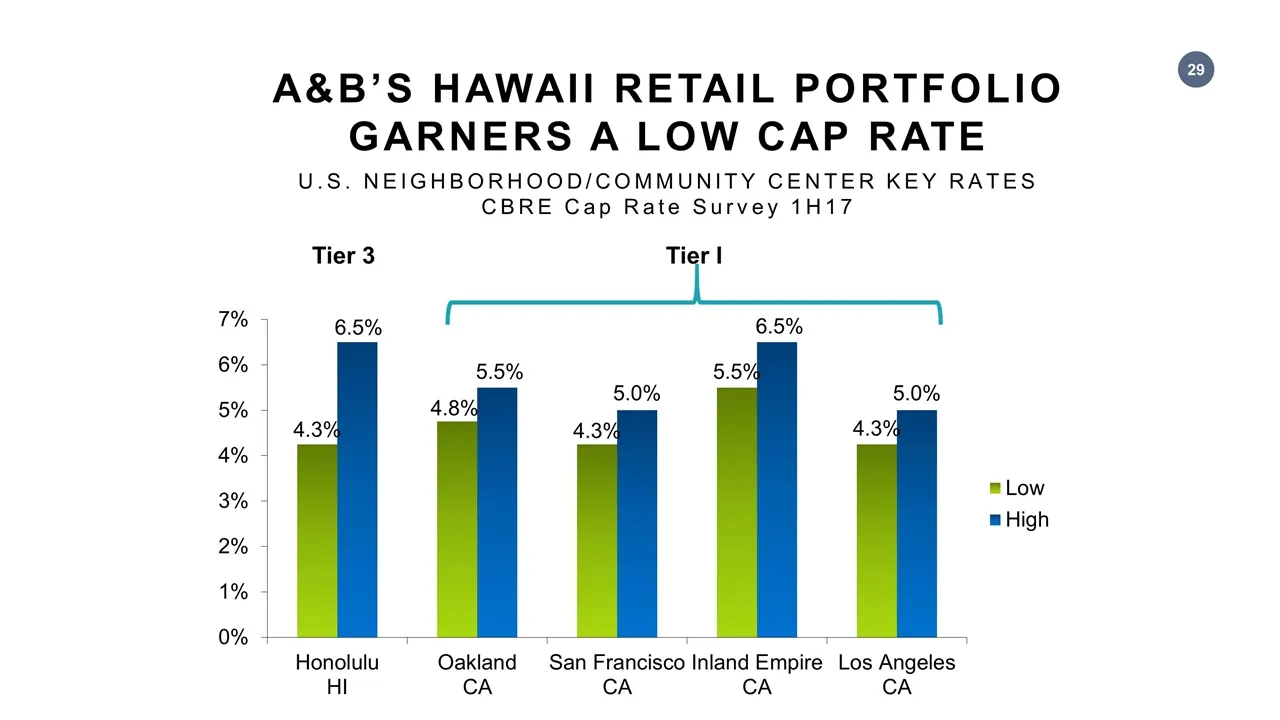
Slide 29: Hawaii Retail Portfolio Garners a Low Cap Rate
A&B’S HAWAII RETAIL PORTFOLIO GARNERS A LOW CAP RATE U.S. NEIGHBORHOOD/COMMUNITY CENTER KEY RATES CBRE Cap Rate Survey 1H17 Tier I Tier 3
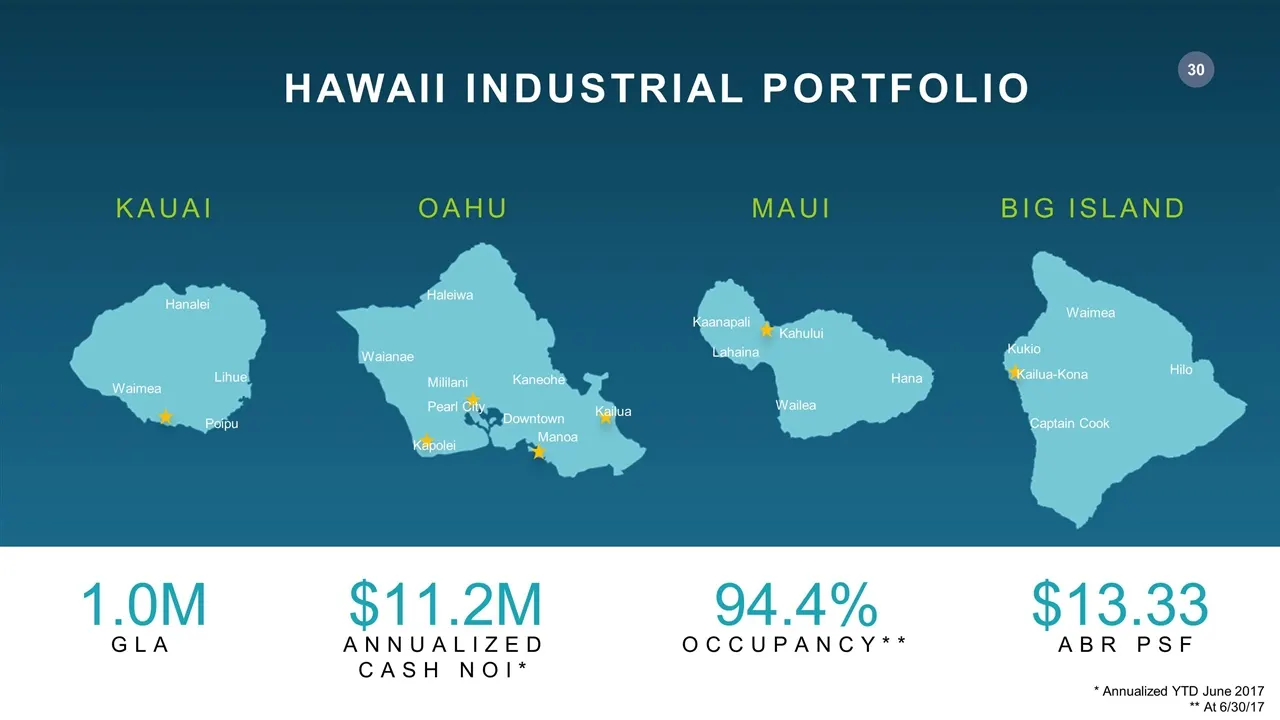
Slide 30: Hawaii Industrial Portfolio
GLA 1.0M ANNUALIZED CASH NOI* $11.2M OCCUPANCY** 94.4% ABR PSF $13.33 HAWAII INDUSTRIAL PORTFOLIO KAUAI MAUI OAHU BIG ISLAND Poipu Lihue Hanalei Waimea Kailua Kaneohe Manoa Mililani Pearl City Kapolei Waianae Haleiwa Kahului Downtown Lahaina Kaanapali Wailea Hana Kailua-Kona Hilo Waimea Kukio Captai
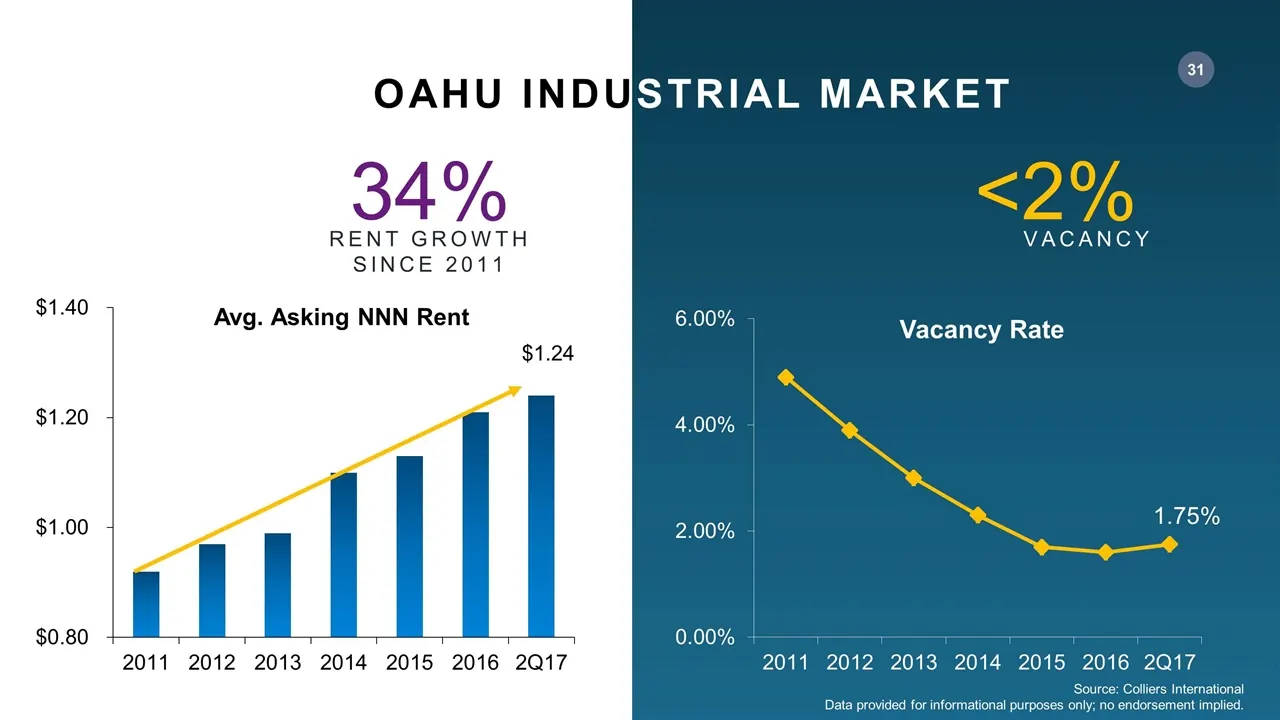
Slide 31: Oahu Industrial Market
RENT GROWTH SINCE 2011 34% VACANCY <2% Source: Colliers International Data provided for informational purposes only; no endorsement implied. OAHU INDUSTRIAL MARKET
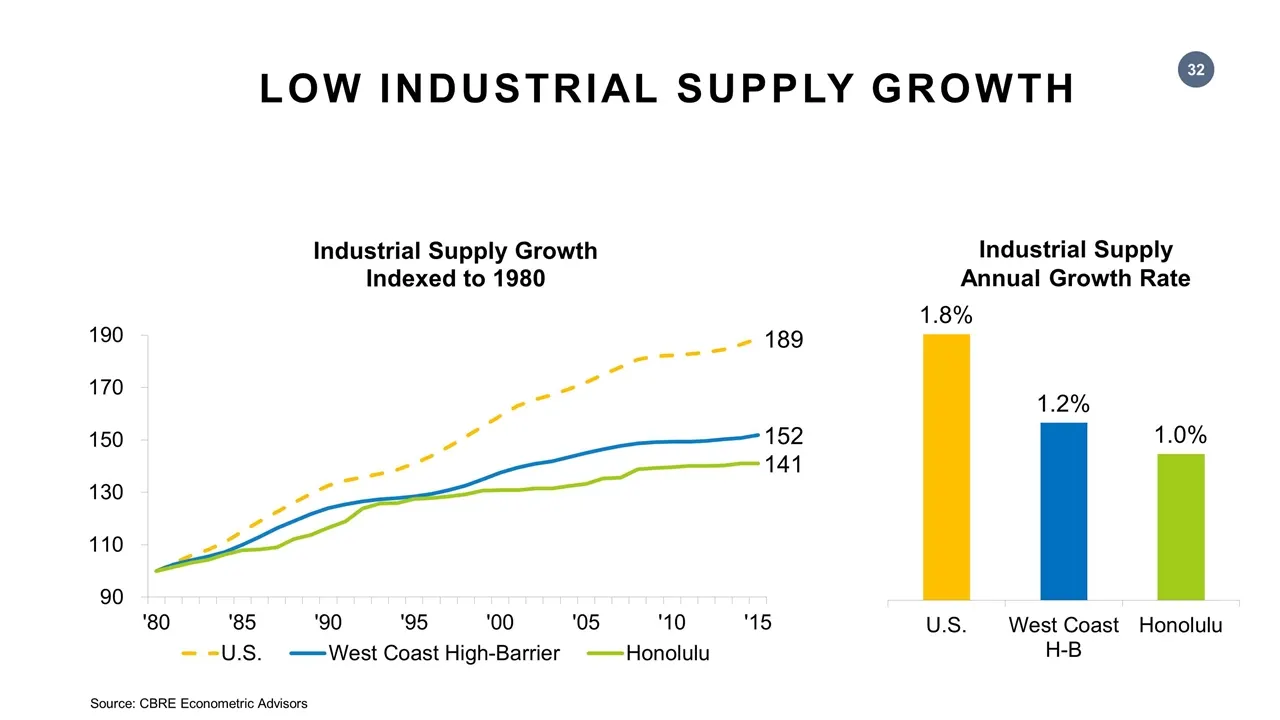
Slide 32: Low Industrial Supply Growth
Source: CBRE Econometric Advisors Industrial Supply Annual Growth Rate LOW INDUSTRIAL SUPPLY GROWTH
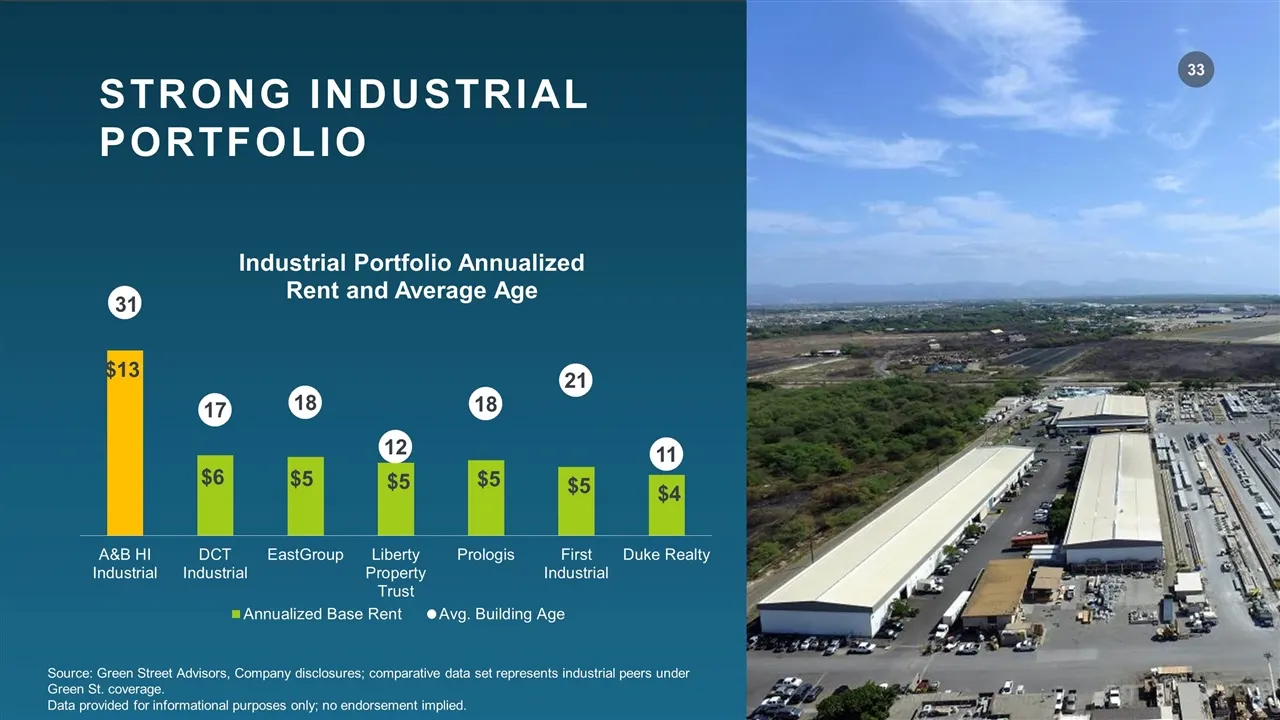
Slide 33: Strong Industrial Portfolio
STRONG INDUSTRIAL PORTFOLIO Source: Green Street Advisors, Company disclosures; comparative data set represents industrial peers under Green St. coverage. Data provided for informational purposes only; no endorsement implied.
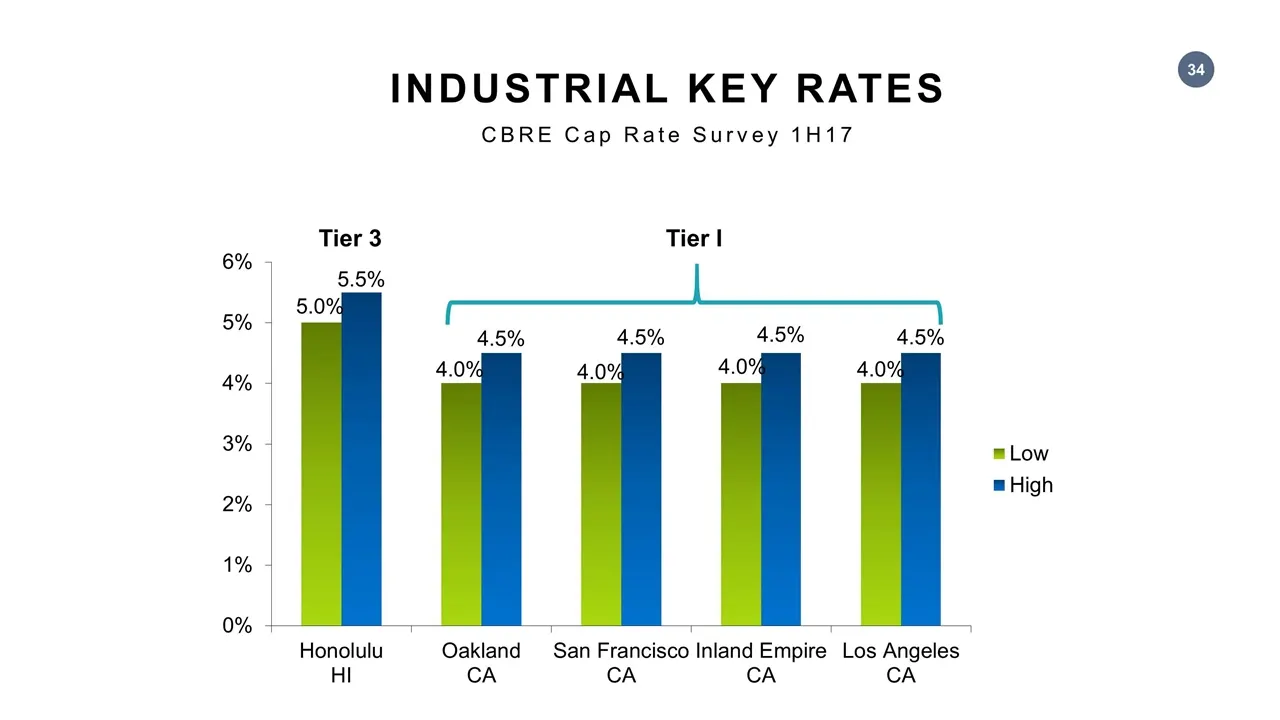
Slide 34: Industrial Key Rates
INDUSTRIAL KEY RATES CBRE Cap Rate Survey 1H17 Tier I Tier 3
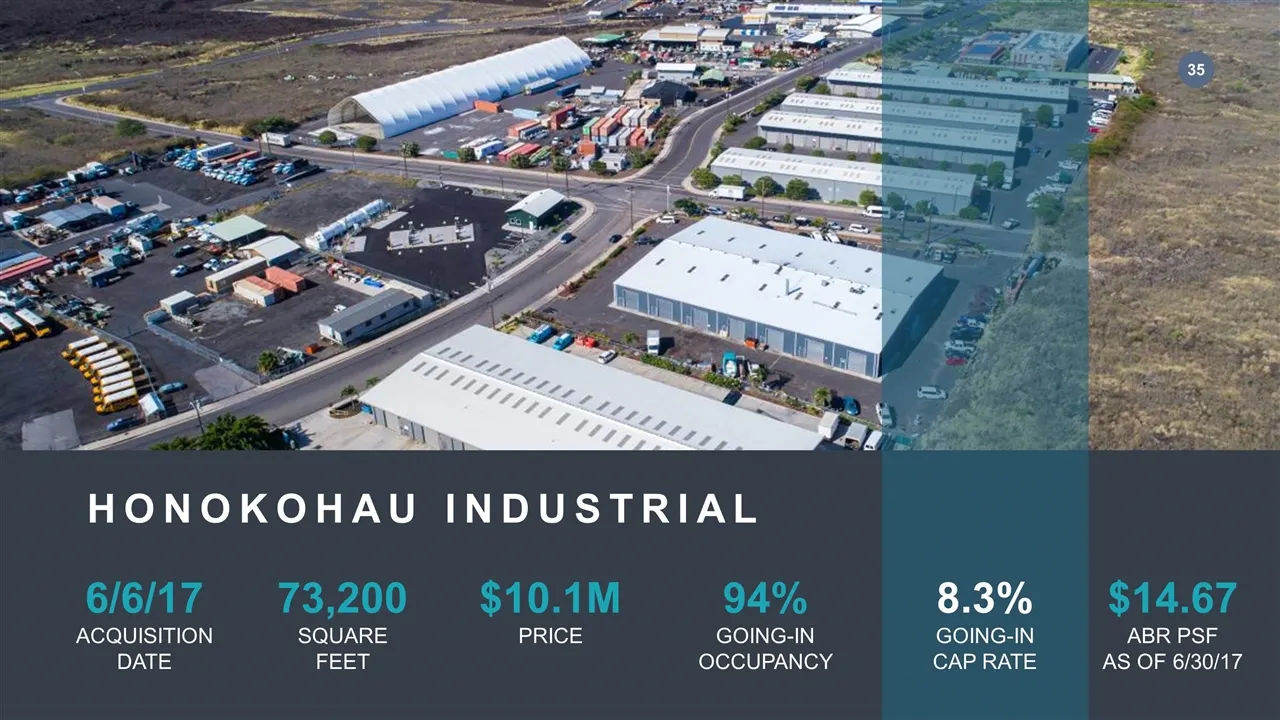
Slide 35: Honokohau Industrial Acquisition
HONOKOHAU INDUSTRIAL $10.1M PRICE 94% GOING-IN OCCUPANCY 8.3% GOING-IN CAP RATE $14.67 ABR PSF AS OF 6/30/17 73,200 SQUARE FEET 6/6/17 ACQUISITION DATE
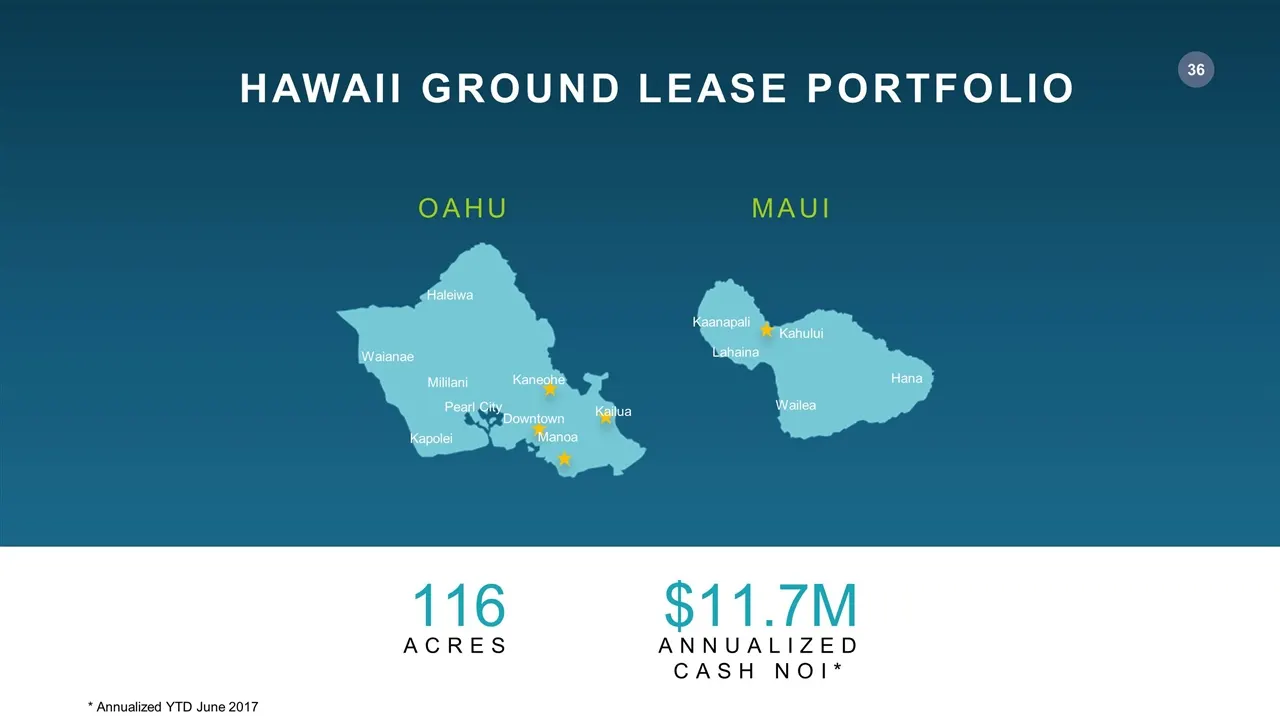
Slide 36: Hawaii Ground Lease Portfolio
ACRES 116 ANNUALIZED CASH NOI* $11.7M HAWAII GROUND LEASE PORTFOLIO MAUI OAHU Kailua Kaneohe Manoa Mililani Pearl City Kapolei Waianae Haleiwa Kahului Downtown Lahaina Kaanapali Wailea Hana * Annualized YTD June 2017
Slide 37: Ground Lease Portfolio Benefits
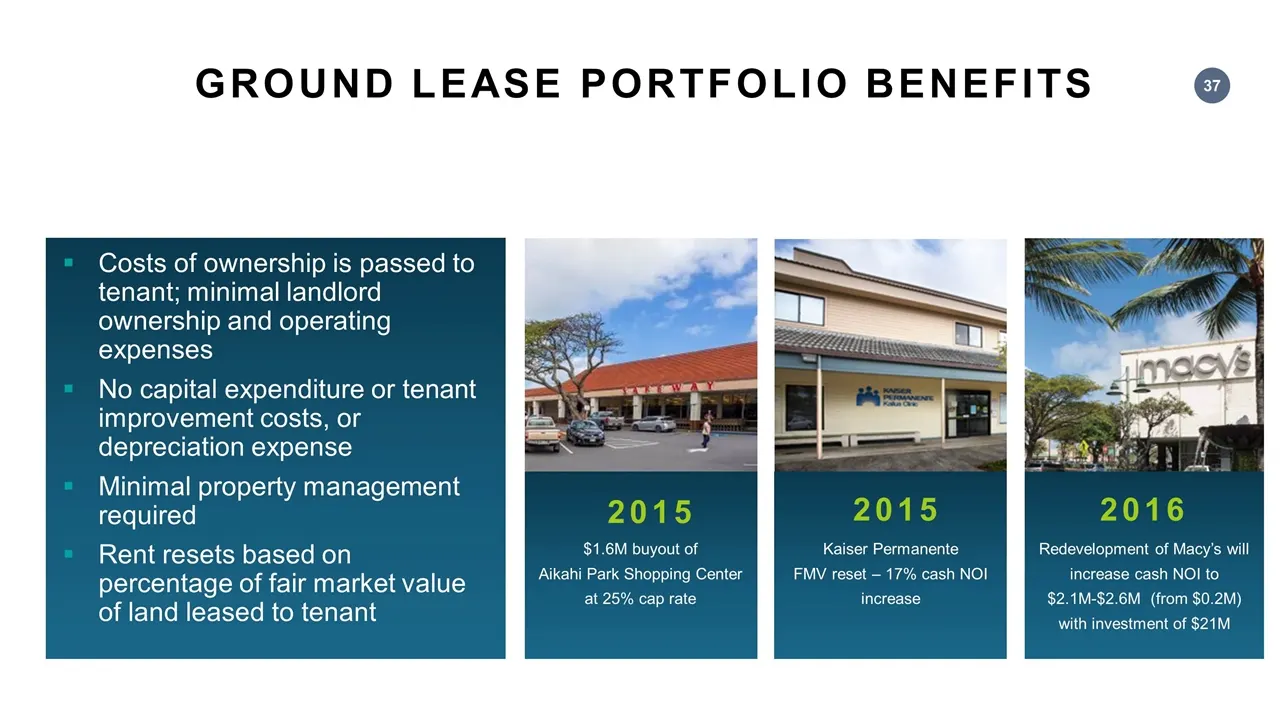
Costs of ownership is passed to tenant; minimal landlord ownership and operating expenses No capital expenditure or tenant improvement costs, or depreciation expense Minimal property management required Rent resets based on percentage of fair market value of land leased to tenant GROUND LEASE PORTFO
Slide 38: Top 10 Ground Leases
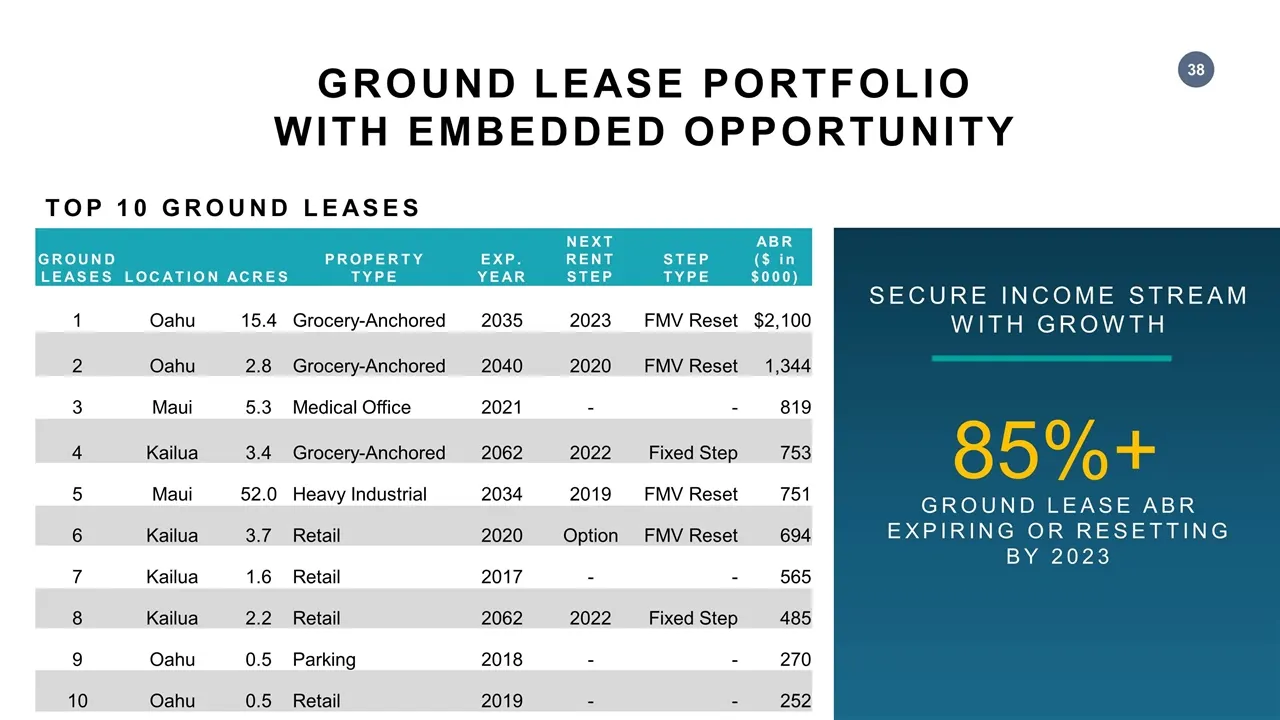
GROUND LEASES LOCATION ACRES PROPERTY TYPE EXP. YEAR NEXT RENT STEP STEP TYPE ABR ($ in $000) 1 Oahu 15.4 Grocery-Anchored 2035 2023 FMV Reset $2,100 2 Oahu 2.8 Grocery-Anchored 2040 2020 FMV Reset 1,344 3 Maui 5.3 Medical Office 2021 - - 819 4 Kailua 3.4 Grocery-Anchored 2062 2022 Fixed Step 753 5
Slide 39: Ground Lease Escalations & Reversions
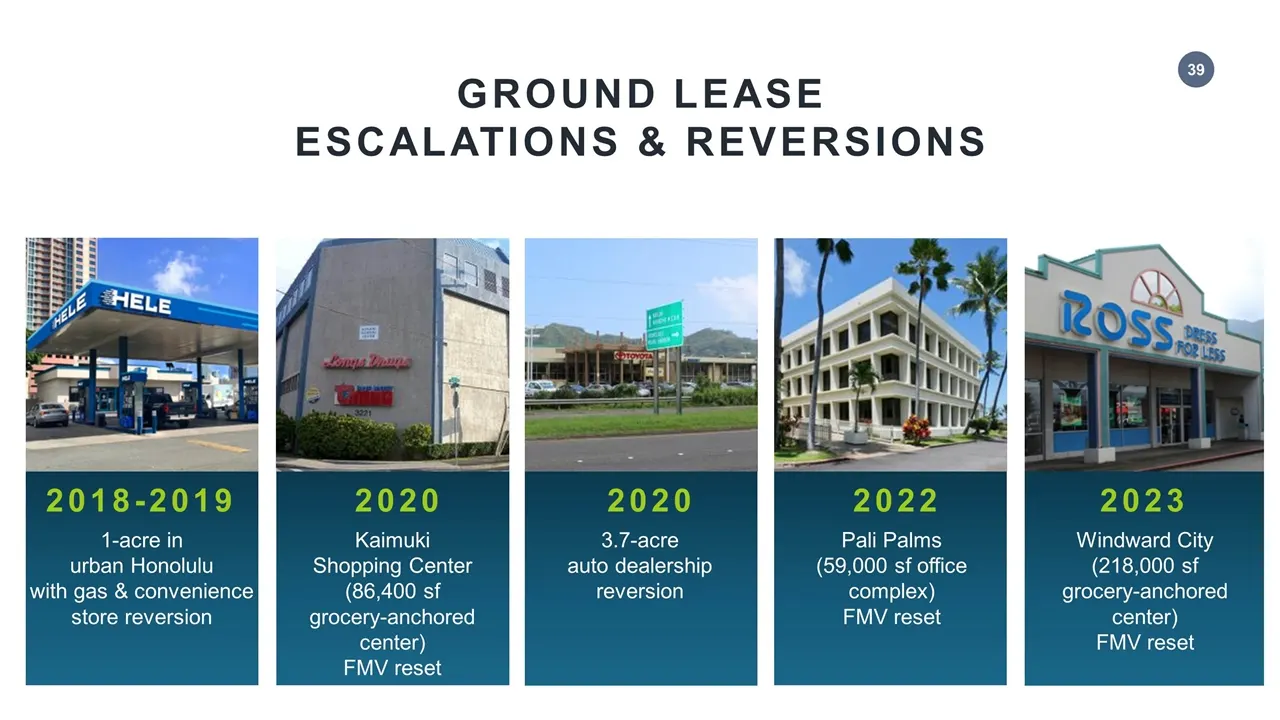
2018-2019 1-acre in urban Honolulu with gas & convenience store reversion 2020 Kaimuki Shopping Center (86,400 sf grocery-anchored center) FMV reset GROUND LEASE ESCALATIONS & REVERSIONS 2020 3.7-acre auto dealership reversion 2022 Pali Palms (59,000 sf office complex) FMV reset 2023 Windward City (
Slide 40: Active Development & Redevelopment Opportunities
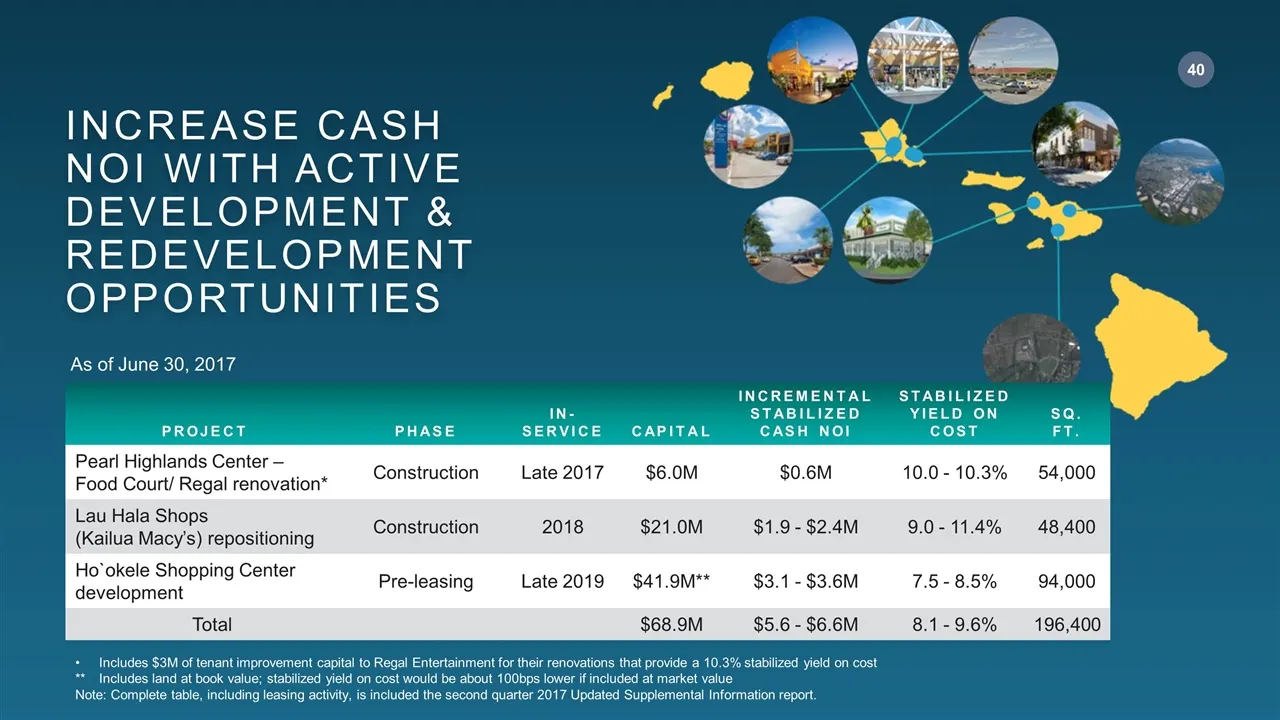
INCREASE CASH NOI WITH ACTIVE DEVELOPMENT & REDEVELOPMENT OPPORTUNITIES PROJECT PHASE IN-SERVICE CAPITAL INCREMENTAL STABILIZED CASH NOI STABILIZED YIELD ON COST SQ. FT. Pearl Highlands Center – Food Court/ Regal renovation* Construction Late 2017 $6.0M $0.6M 10.0 - 10.3% 54,000 Lau Hala Shops (Kail
Slide 41: Lau Hala, Pearl Highlands, Ho'okele
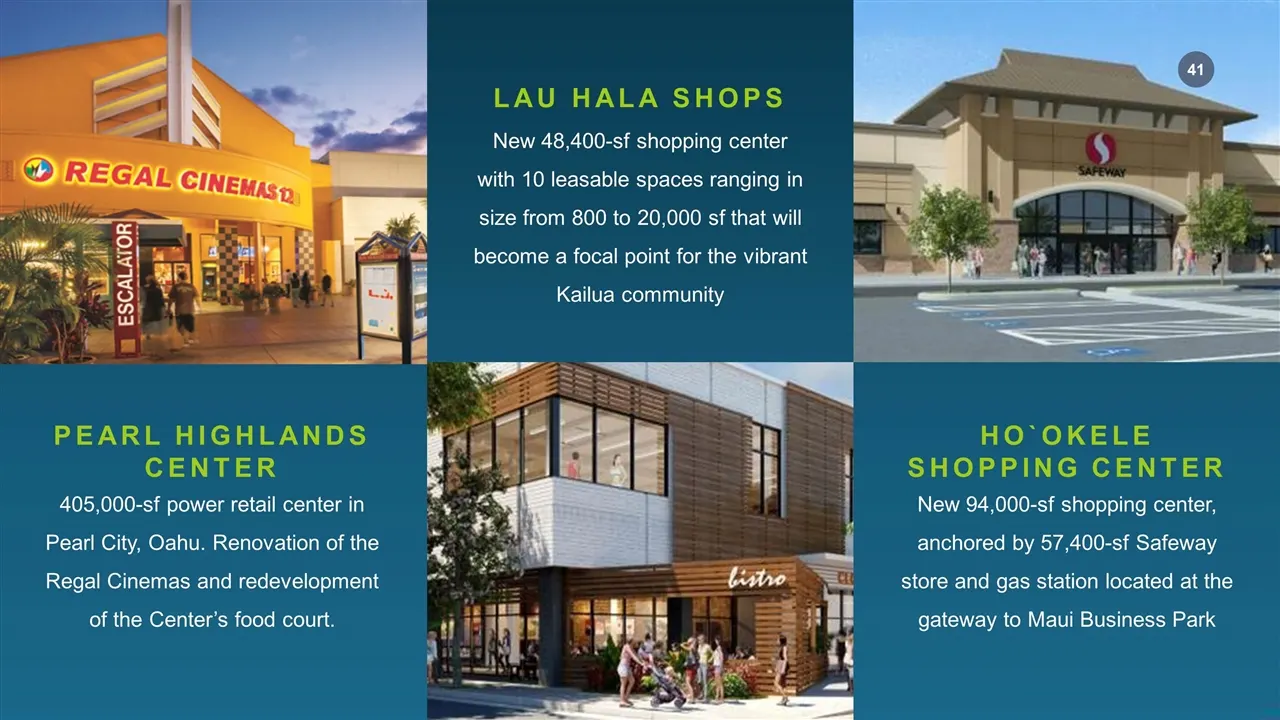
LAU HALA SHOPS New 48,400-sf shopping center with 10 leasable spaces ranging in size from 800 to 20,000 sf that will become a focal point for the vibrant Kailua community PEARL HIGHLANDS CENTER 405,000-sf power retail center in Pearl City, Oahu. Renovation of the Regal Cinemas and redevelopment of t
Slide 42: Acquisitions
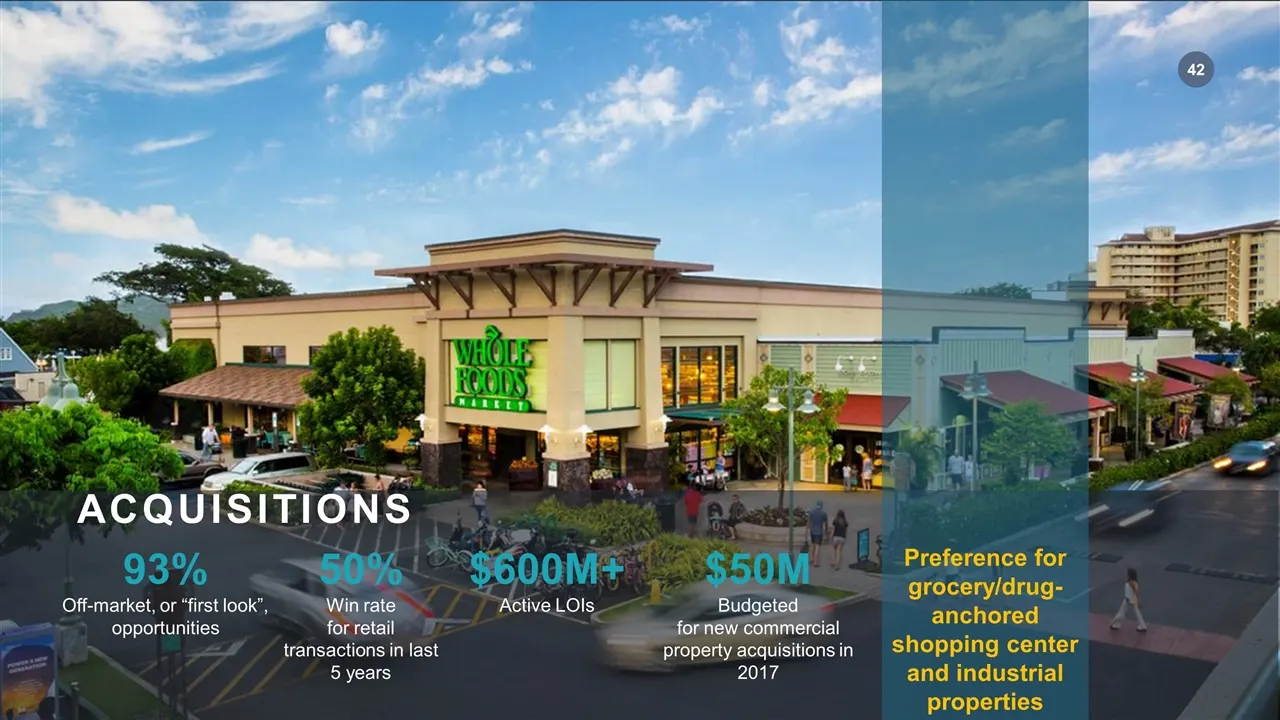
ACQUISITIONS 50% Win rate for retail transactions in last 5 years $600M+ Active LOIs 93% Off-market, or “first look”, opportunities $50M Budgeted for new commercial property acquisitions in 2017 Preference for grocery/drug-anchored shopping center and industrial properties
Slide 43: Oahu Retail & Industrial Market
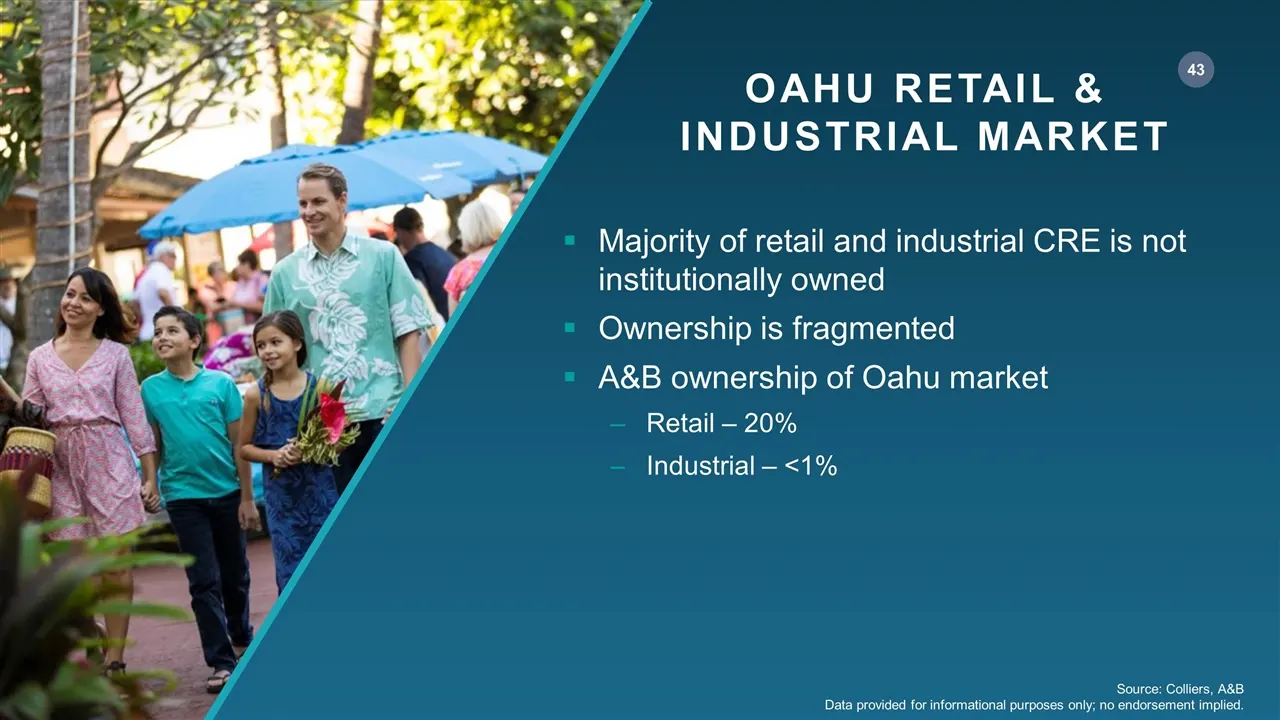
Source: Colliers, A&B Data provided for informational purposes only; no endorsement implied. Majority of retail and industrial CRE is not institutionally owned Ownership is fragmented A&B ownership of Oahu market Retail – 20% Industrial – <1% OAHU RETAIL & INDUSTRIAL MARKET
Slide 44: Break
BREAK
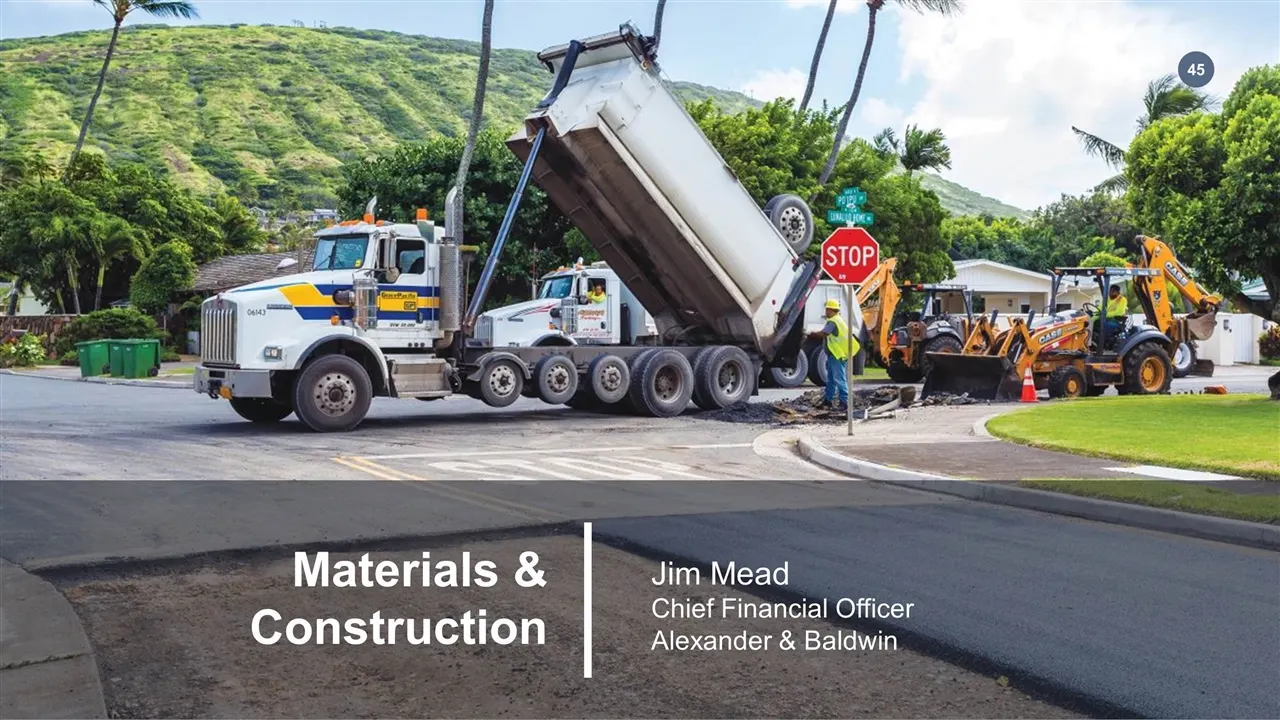
Slide 45: Materials & Construction
Materials & Construction Jim Mead Chief Financial Officer Alexander & Baldwin
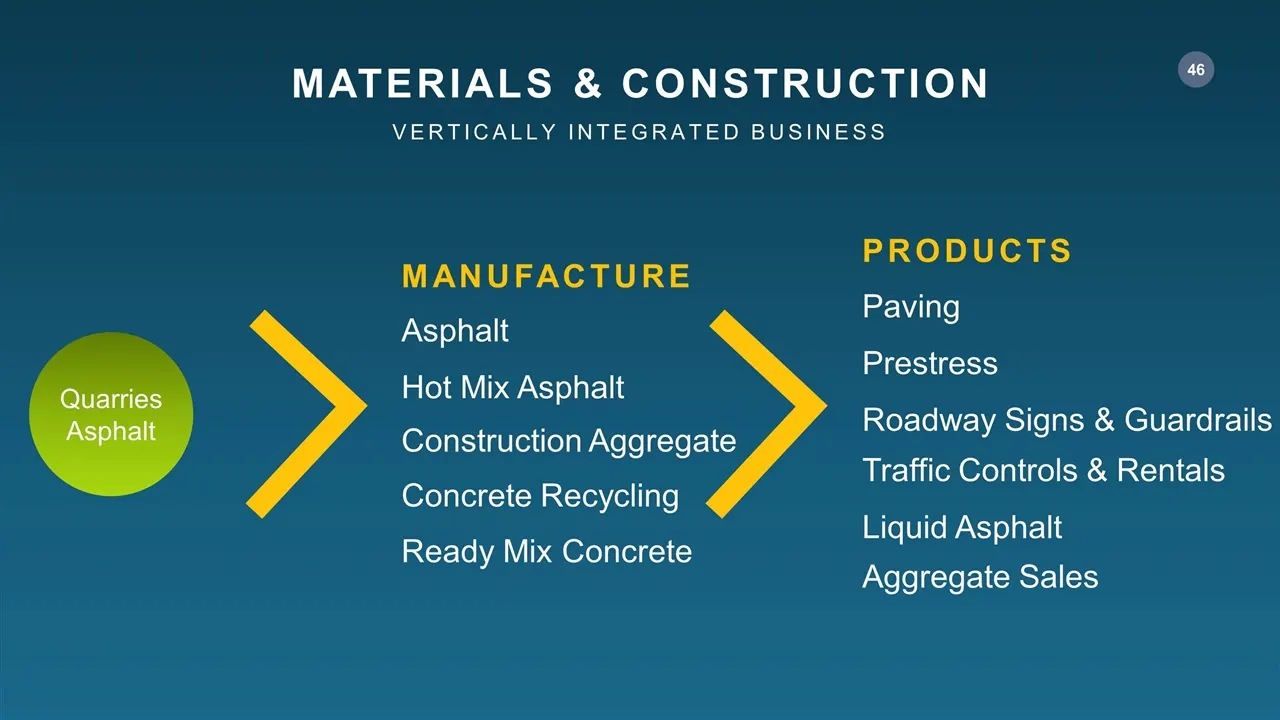
Slide 46: Materials & Construction Vertically Integrated Business
MATERIALS & CONSTRUCTION Vertically Integrated Business Quarries Asphalt Hot Mix Asphalt Asphalt Construction Aggregate Concrete Recycling Ready Mix Concrete MANUFACTURE Prestress Paving Roadway Signs & Guardrails Traffic Controls & Rentals Liquid Asphalt Aggregate Sales PRODUCTS
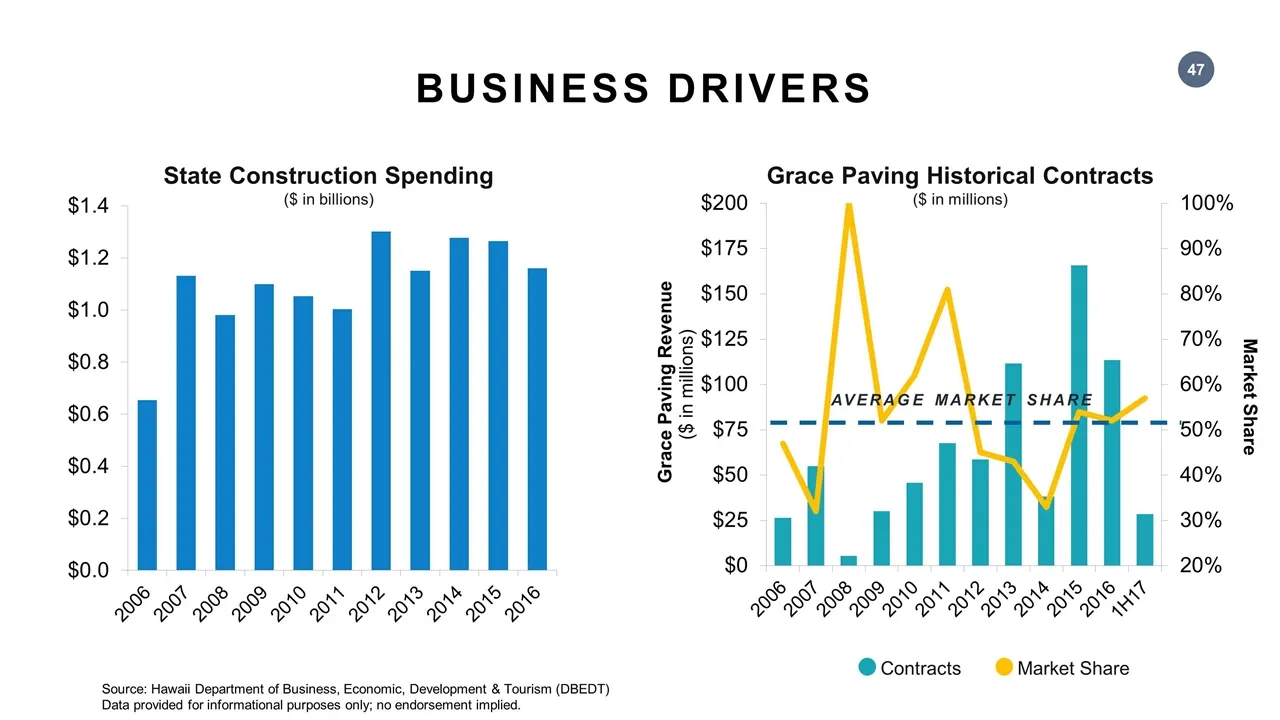
Slide 47: Business Drivers and Market Share
AVERAGE MARKET SHARE BUSINESS DRIVERS State Construction Spending ($ in billions) Grace Paving Historical Contracts ($ in millions) Market Share Market Share Contracts Source: Hawaii Department of Business, Economic, Development & Tourism (DBEDT) Data provided for informational purposes only; no end
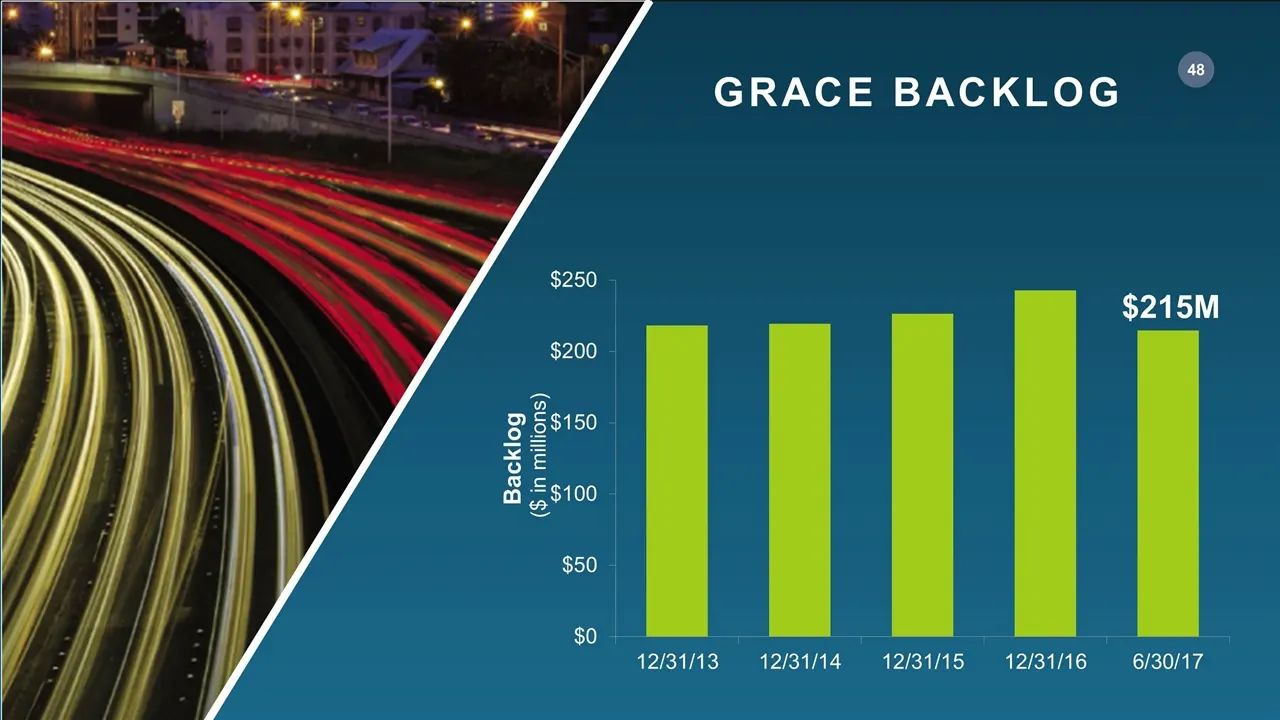
Slide 48: Grace Backlog
GRACE BACKLOG . $0 12/31/13 12/31/14 12/31/15 12/31/16 6/30/17 $215M Backlog ($ in millions) & s ® ro} S
Slide 49: Operating Results
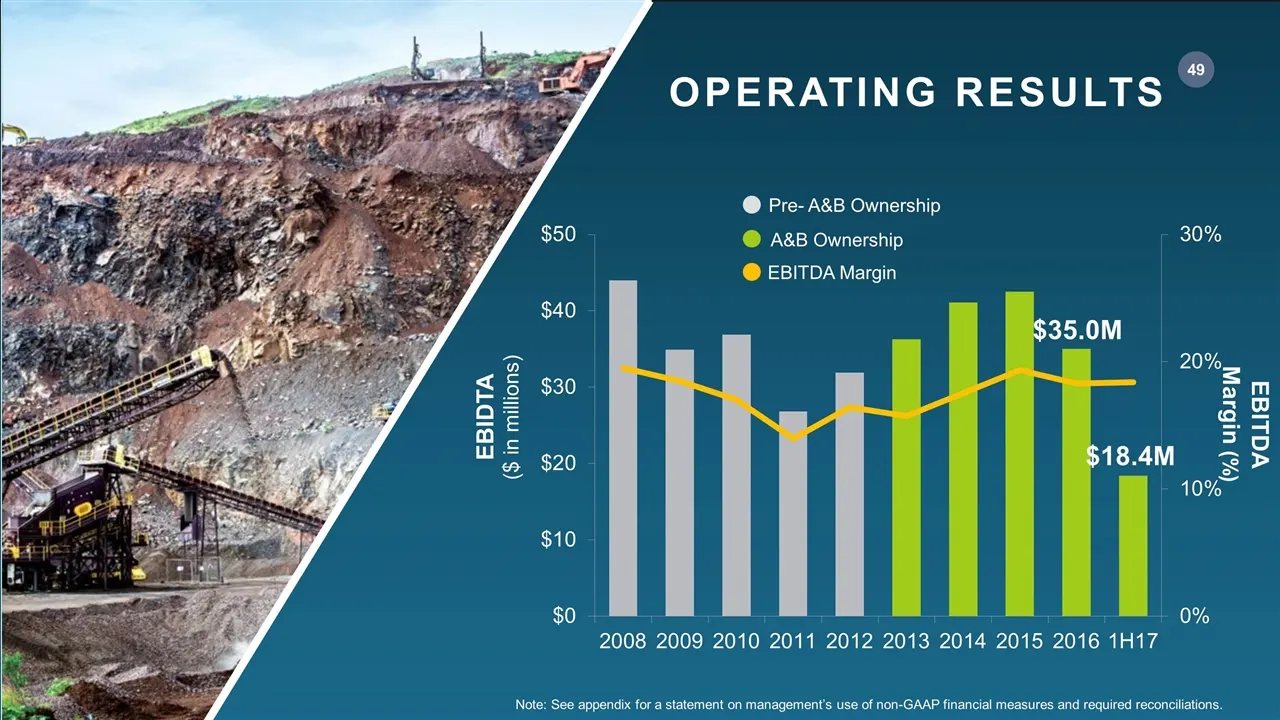
OPERATING RESULTS EBITDA Margin (%) A&B Ownership EBITDA Margin Note: See appendix for a statement on management’s use of non-GAAP financial measures and required reconciliations. Pre- A&B Ownership
Slide 50: Public Company Comparables
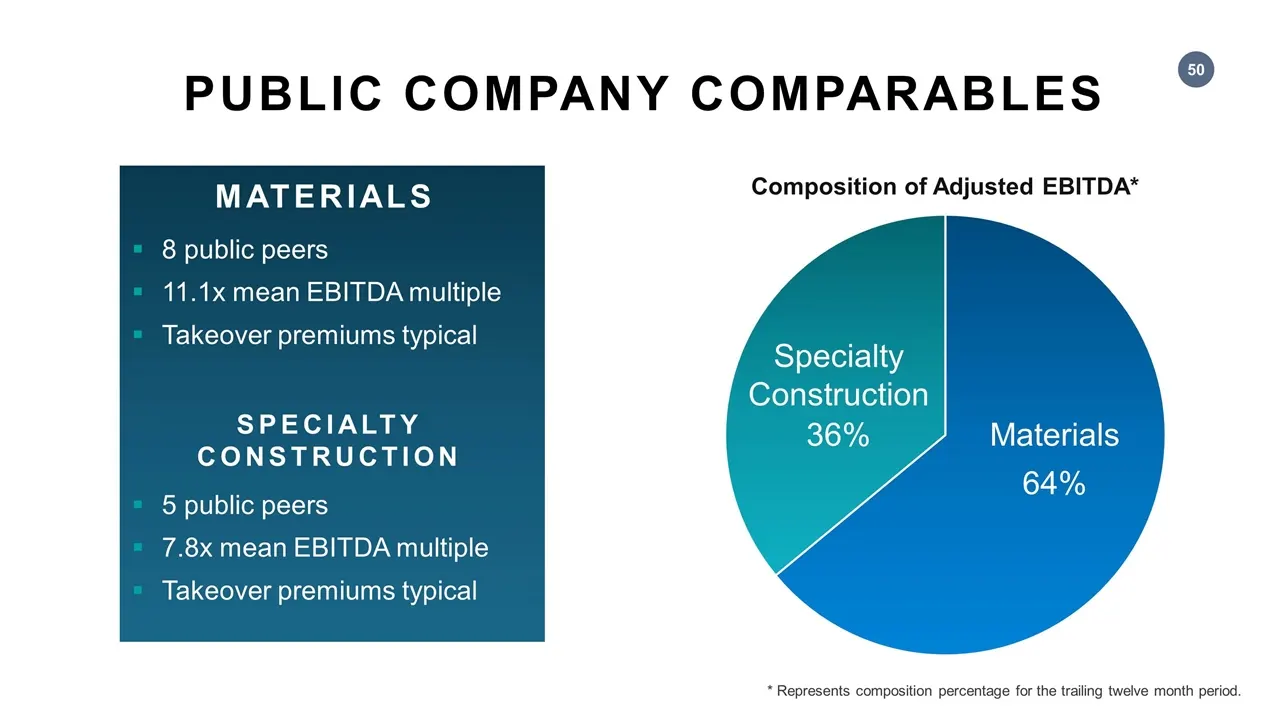
MATERIALS 8 public peers 11.1x mean EBITDA multiple Takeover premiums typical SPECIALTY CONSTRUCTION 5 public peers 7.8x mean EBITDA multiple Takeover premiums typical Materials 64% Specialty Construction 36% Composition of Adjusted EBITDA* * Represents composition percentage for the trailing twelve
Slide 51: Land Operations
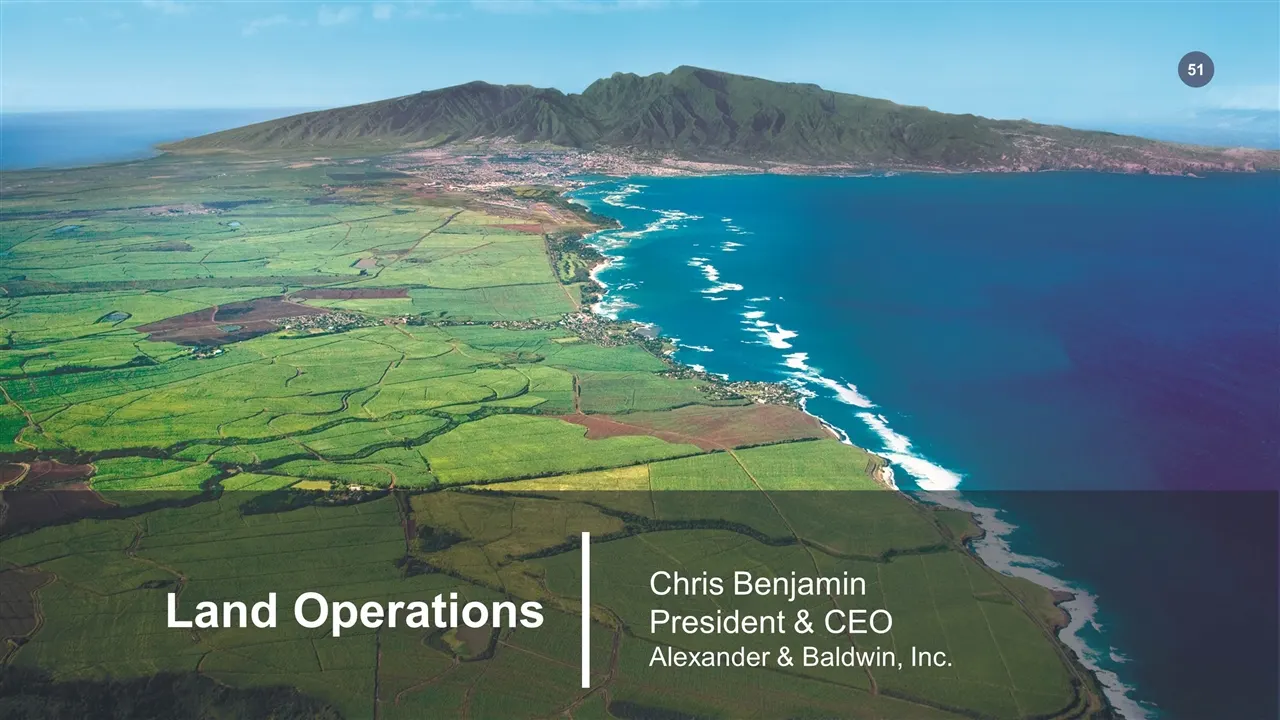
Land Operations Chris Benjamin President & CEO Alexander & Baldwin, Inc.
Slide 52: Land Operations Overview
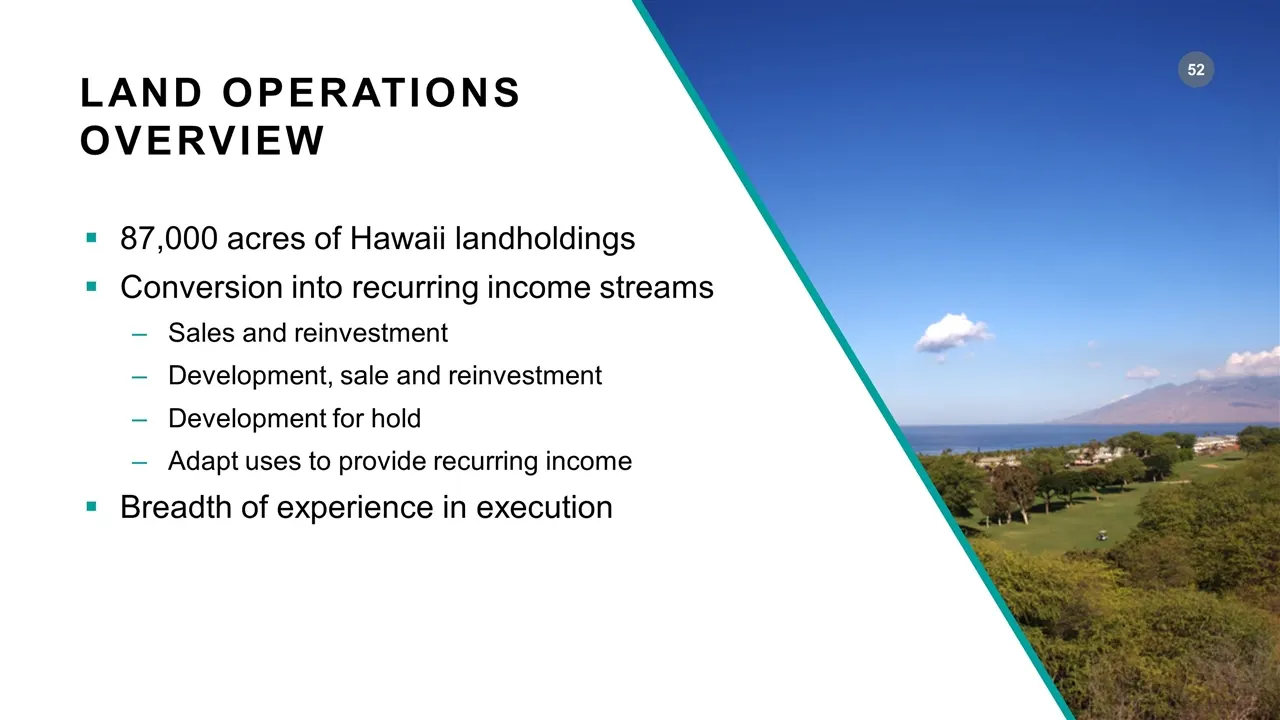
LAND OPERATIONS OVERVIEW 87,000 acres of Hawaii landholdings Conversion into recurring income streams Sales and reinvestment Development, sale and reinvestment Development for hold Adapt uses to provide recurring income Breadth of experience in execution
Slide 53: Track Record of Execution
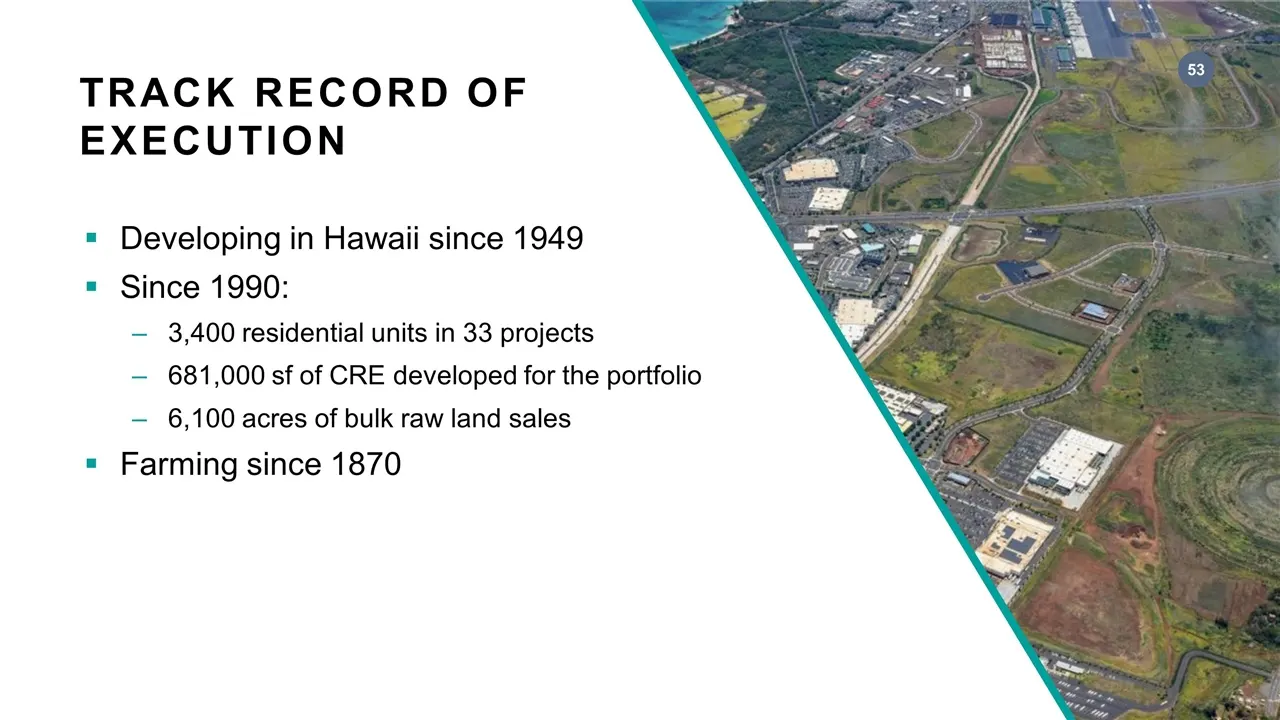
TRACK RECORD OF EXECUTION Developing in Hawaii since 1949 Since 1990: 3,400 residential units in 33 projects 681,000 sf of CRE developed for the portfolio 6,100 acres of bulk raw land sales Farming since 1870
Slide 54: Implementing Diversified Ag on Former Sugarcane Lands
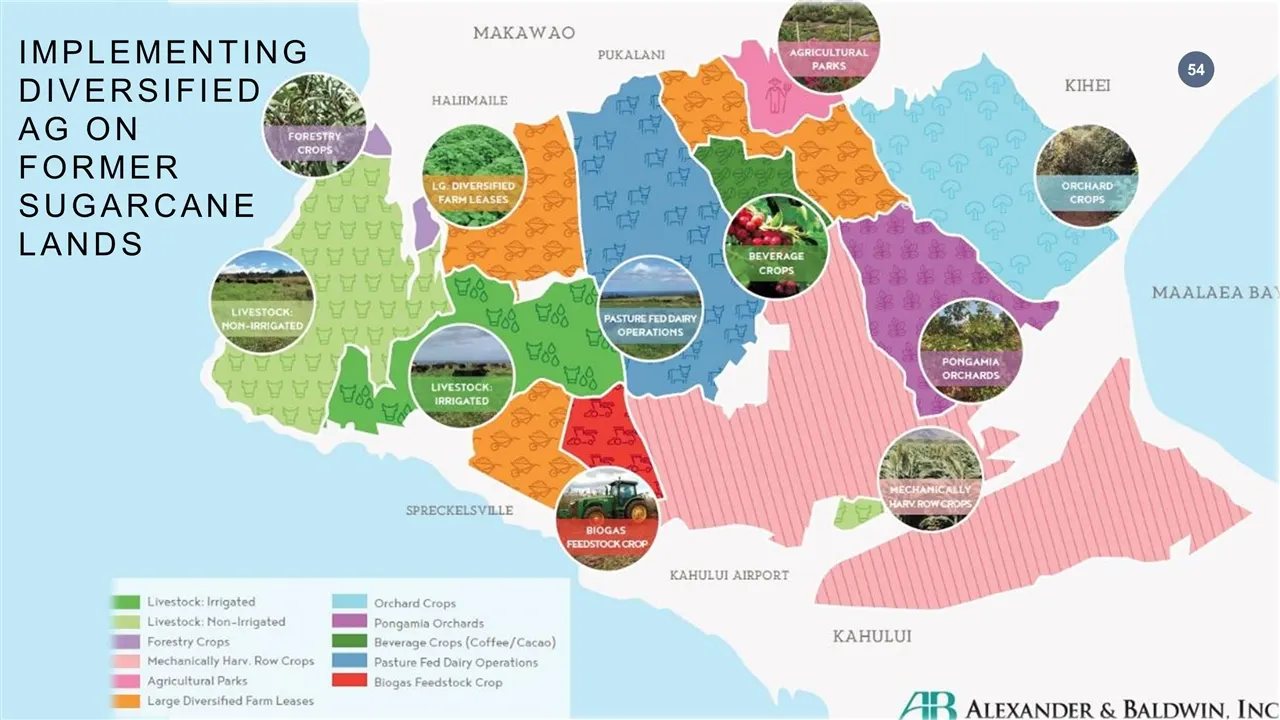
IMPLEMENTING DIVERSIFIED AG ON FORMER SUGARCANE LANDS
Slide 55: Development For Sale
Development For Sale Lance Parker President A&B Properties
Slide 56: Active Pipeline of For-Sale Units
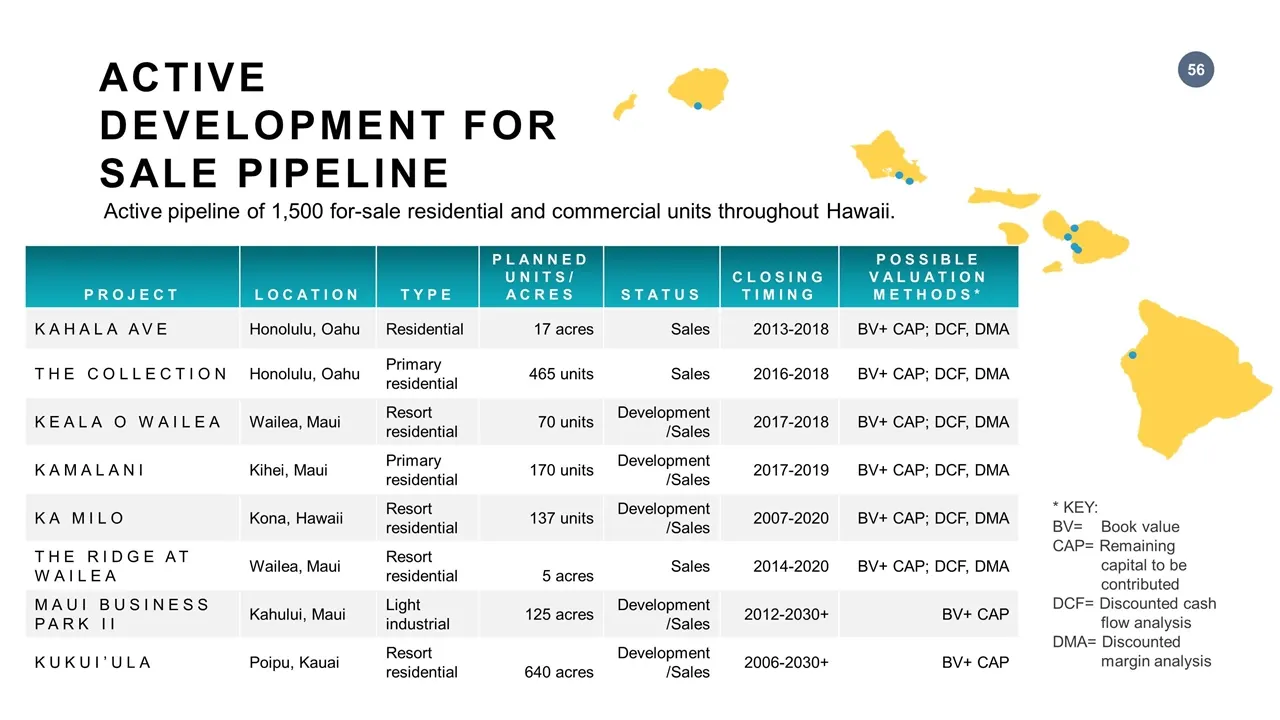
Active pipeline of 1,500 for-sale residential and commercial units throughout Hawaii. PROJECT LOCATION TYPE PLANNED UNITS/ ACRES STATUS CLOSING TIMING POSSIBLE VALUATION METHODS* KAHALA AVE Honolulu, Oahu Residential 17 acres Sales 2013-2018 BV+ CAP; DCF, DMA THE COLLECTION Honolulu, Oahu Primary re
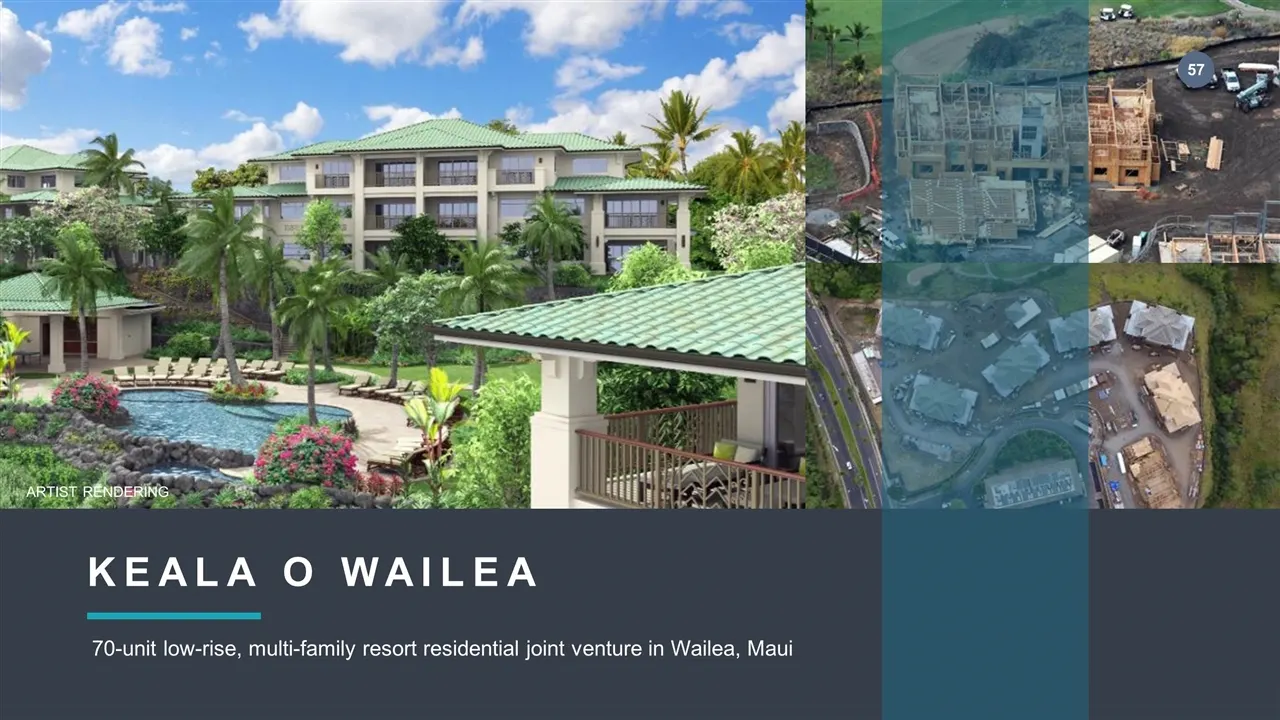
Slide 57: Keala O Wailea
KEALA O WAILEA 70-unit low-rise, multi-family resort residential joint venture in Wailea, Maui ARTIST RENDERING
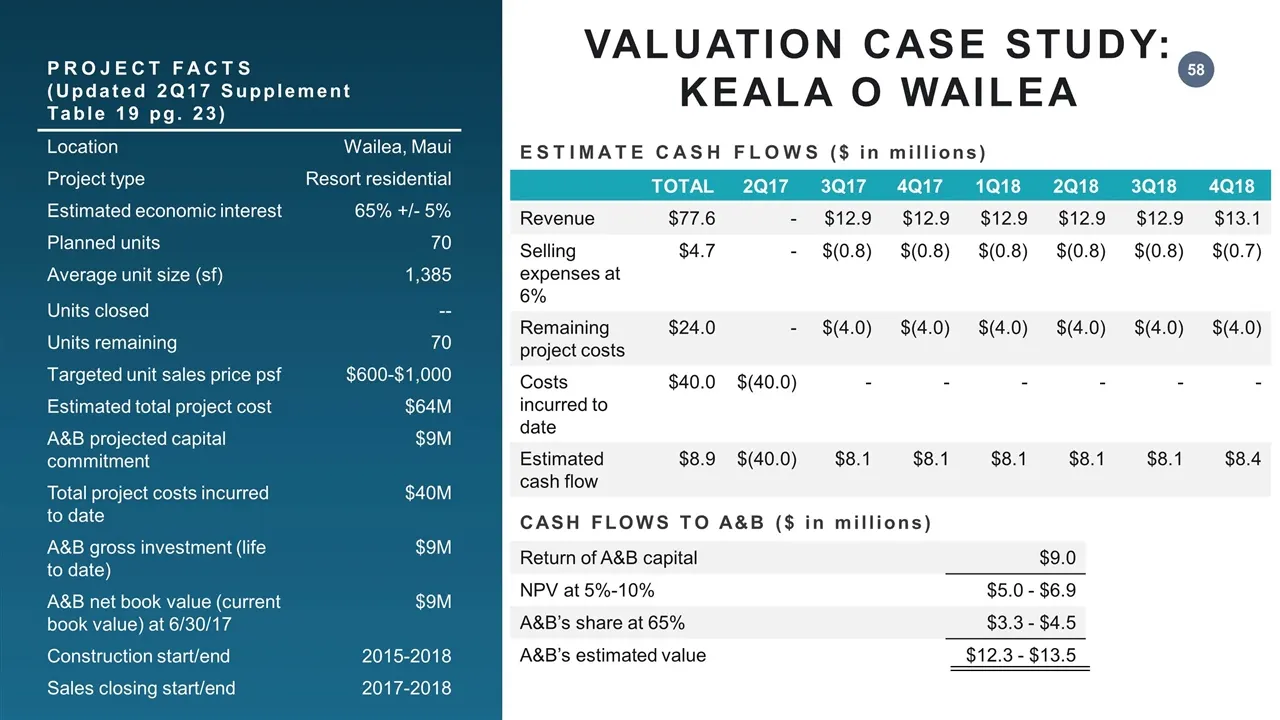
Slide 58: Estimate Cash Flows Valuation Case Study
ESTIMATE CASH FLOWS ($ in millions) TOTAL 2Q17 3Q17 4Q17 1Q18 2Q18 3Q18 4Q18 Revenue $77.6 - $12.9 $12.9 $12.9 $12.9 $12.9 $13.1 Selling expenses at 6% $4.7 - $(0.8) $(0.8) $(0.8) $(0.8) $(0.8) $(0.7) Remaining project costs $24.0 - $(4.0) $(4.0) $(4.0) $(4.0) $(4.0) $(4.0) Costs incurred to date $4
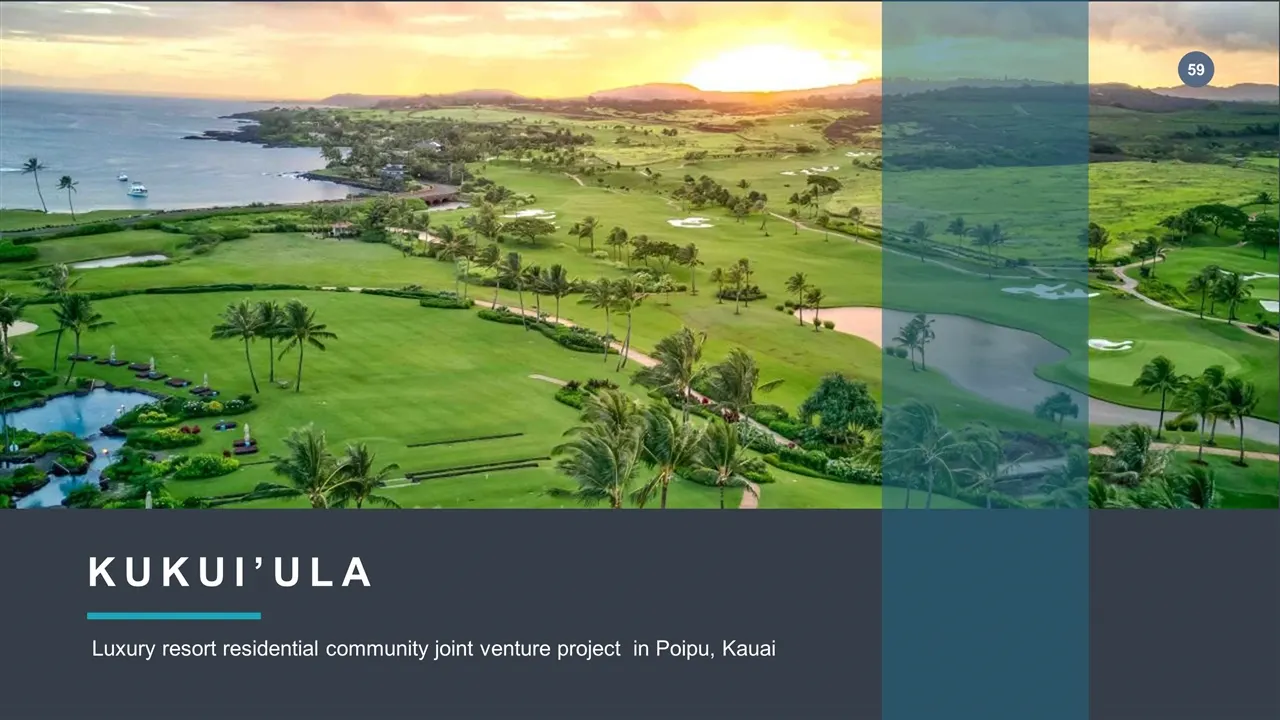
Slide 59: Kukui'ula
KUKUI’ULA Luxury resort residential community joint venture project in Poipu, Kauai
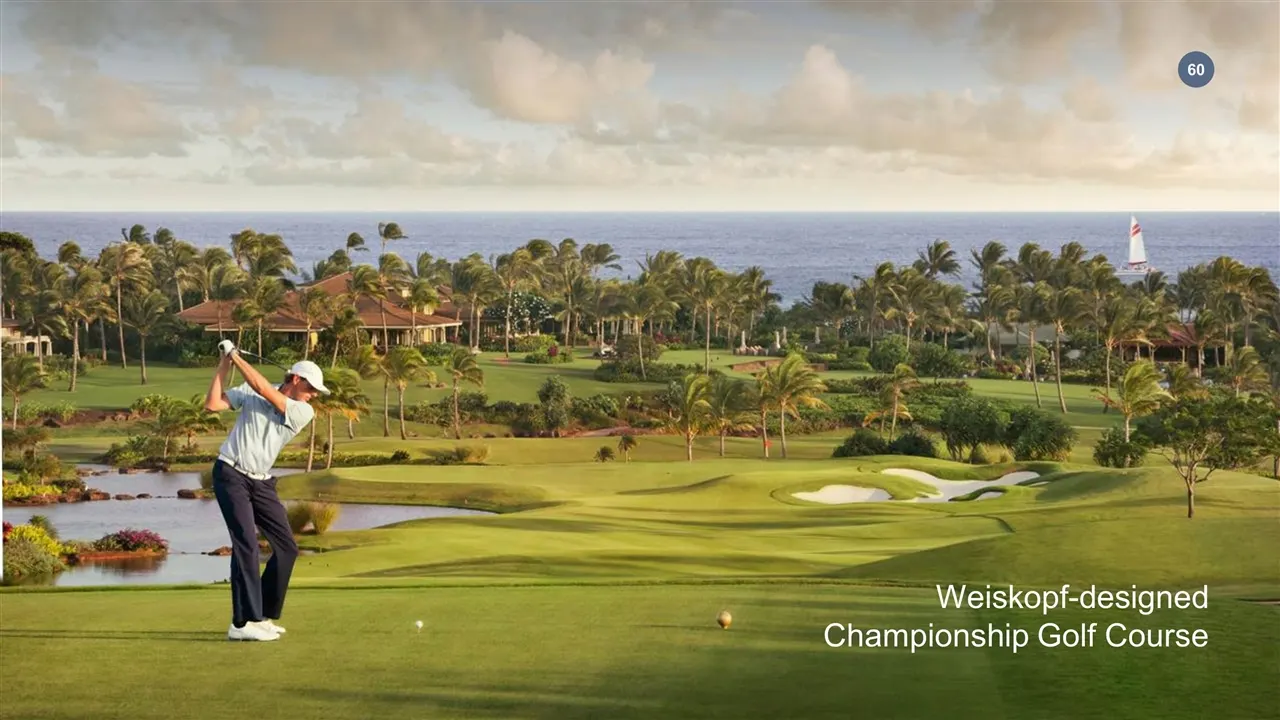
Slide 60: Championship Golf Course
Weiskopf-designed Championship Golf Course

Slide 61: World-Class Spa
World-Class Spa
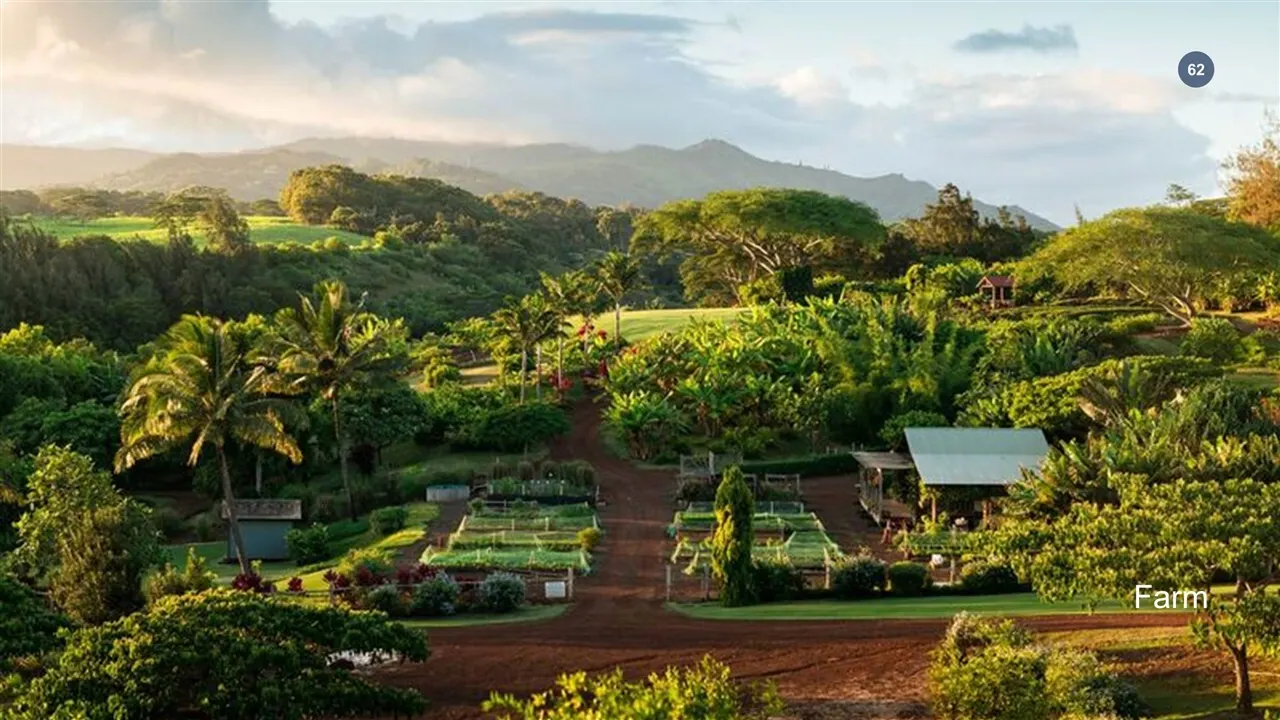
Slide 62: Farm
N Farm Ne as
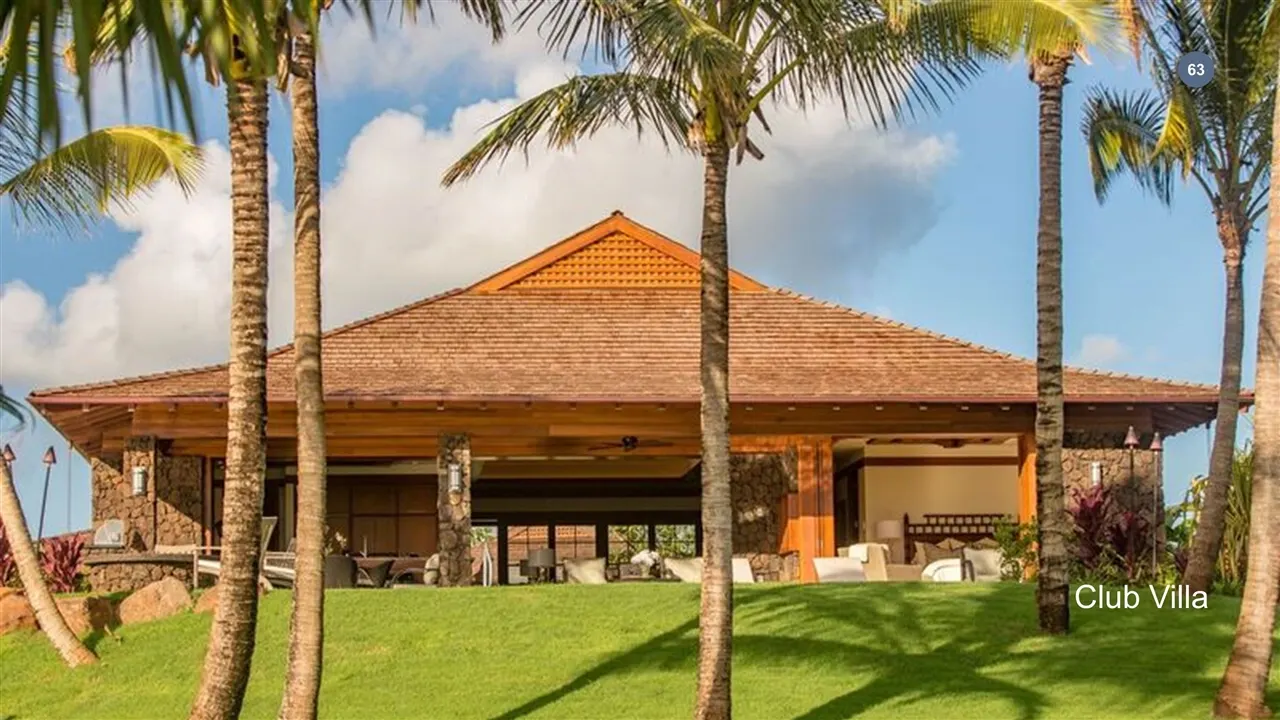
Slide 63: ieeaibariacisans
& = aL im ie ieeaibariacisans
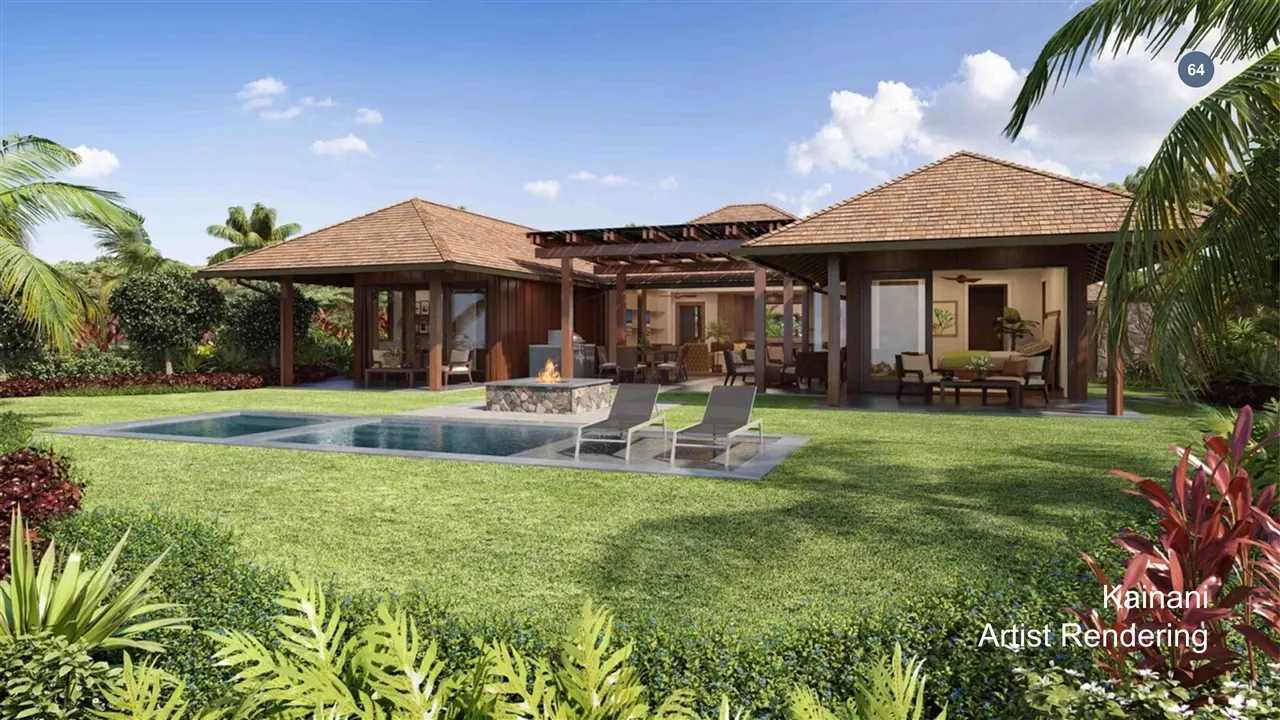
Slide 64: Se SN \
Se SN \ S -Kethant ies em “dist Rendering
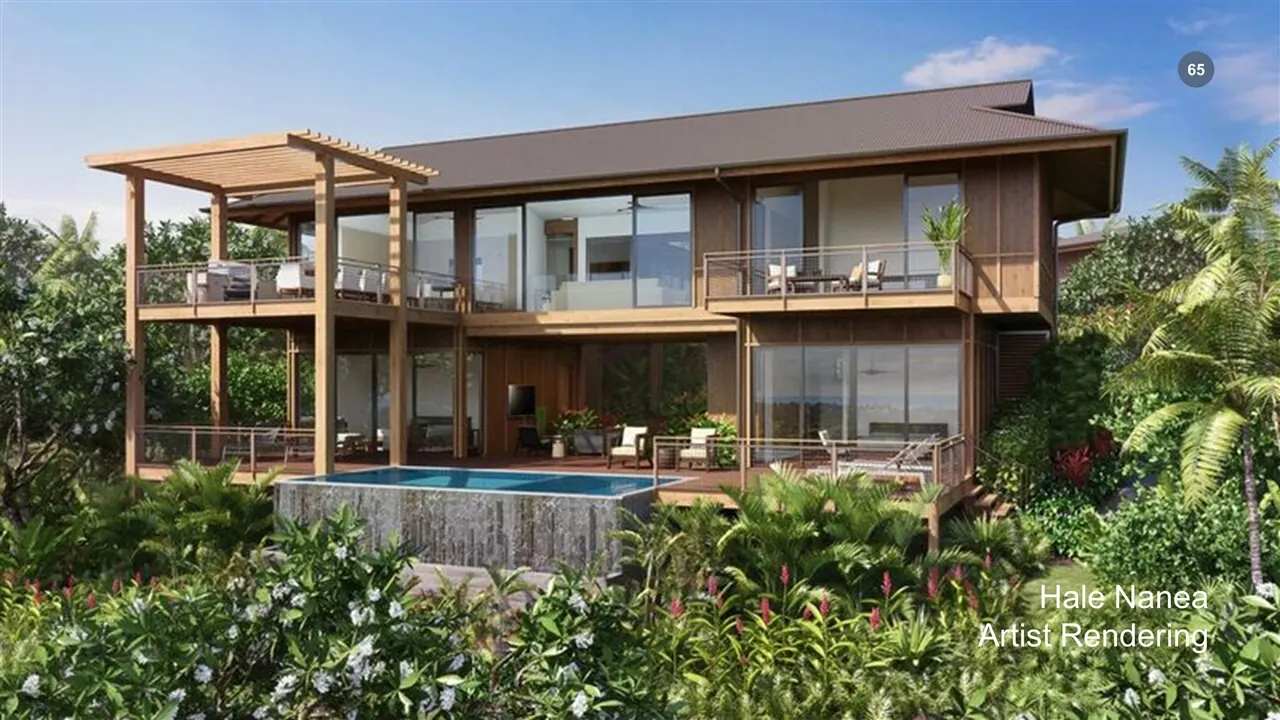
Slide 65: Hale Nanea Artist Rendering
Hale Nanea Artist Rendering
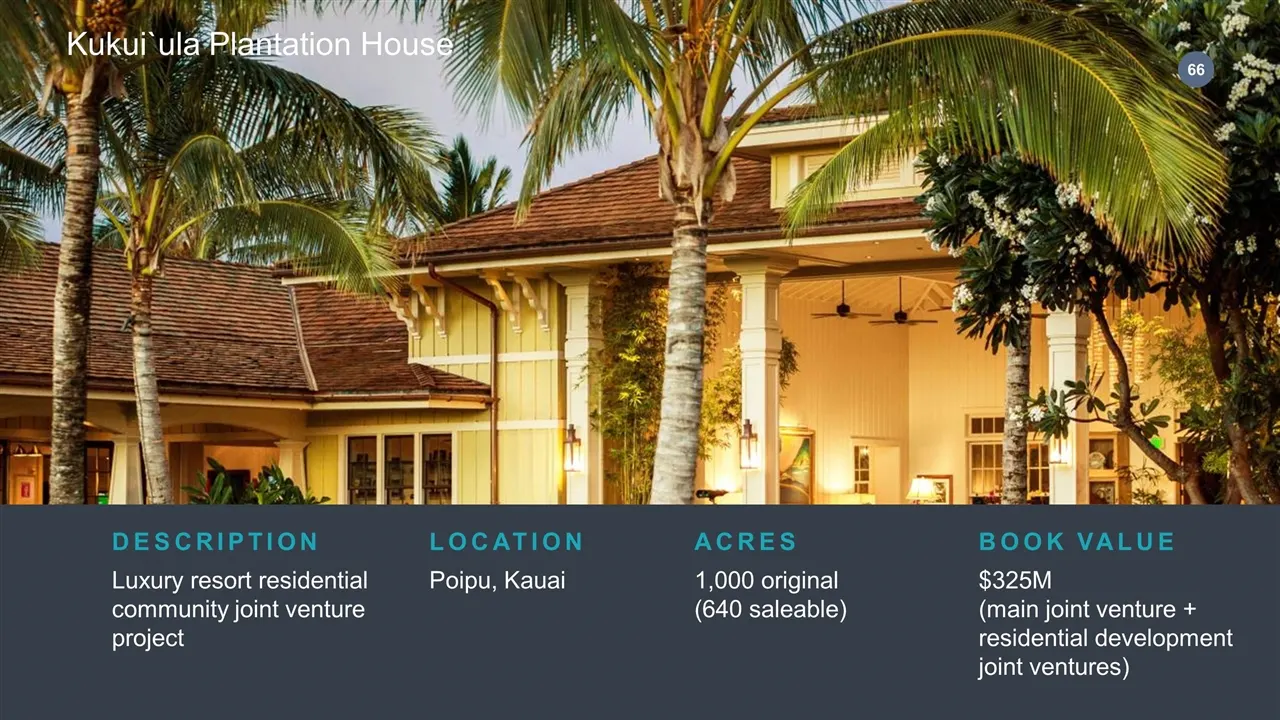
Slide 66: Kukui'ula Luxury Resort Residential Community
Luxury resort residential community joint venture project DESCRIPTION Poipu, Kauai LOCATION 1,000 original (640 saleable) ACRES $325M (main joint venture + residential development joint ventures) BOOK VALUE Kukui`ula Plantation House
Slide 67: Landholdings
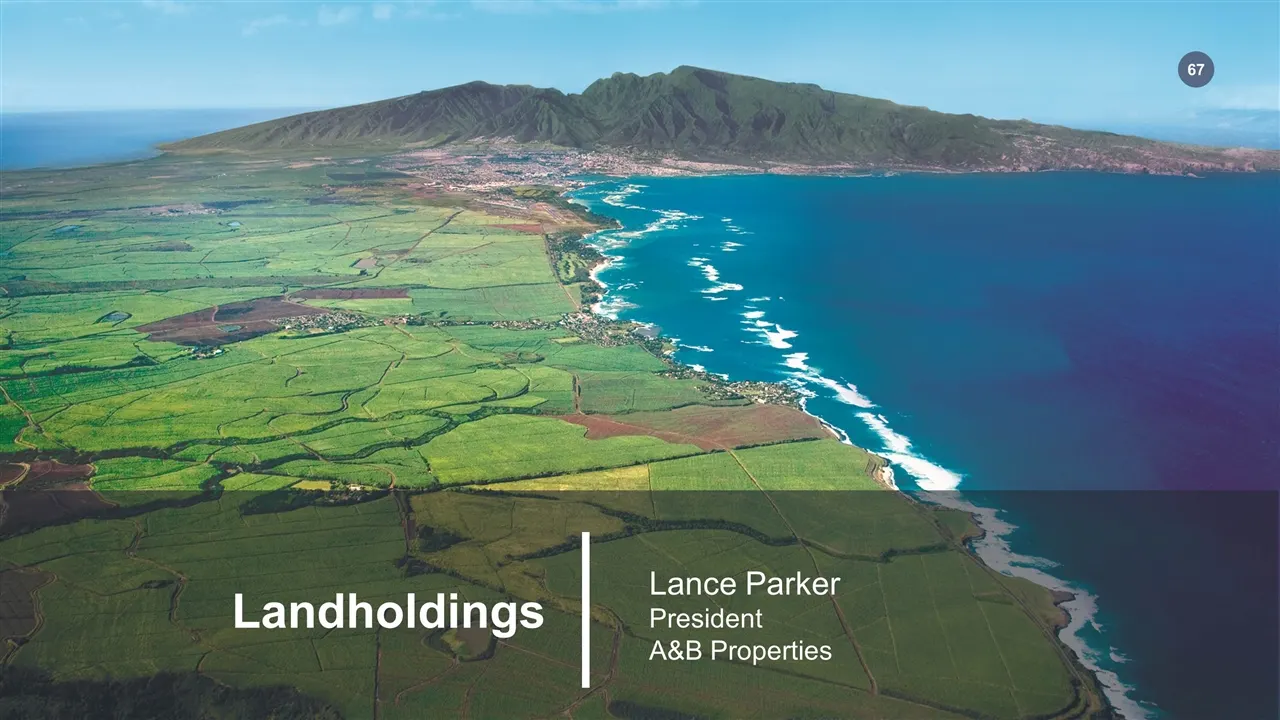
Landholdings Lance Parker President A&B Properties
Slide 68: Landholdings
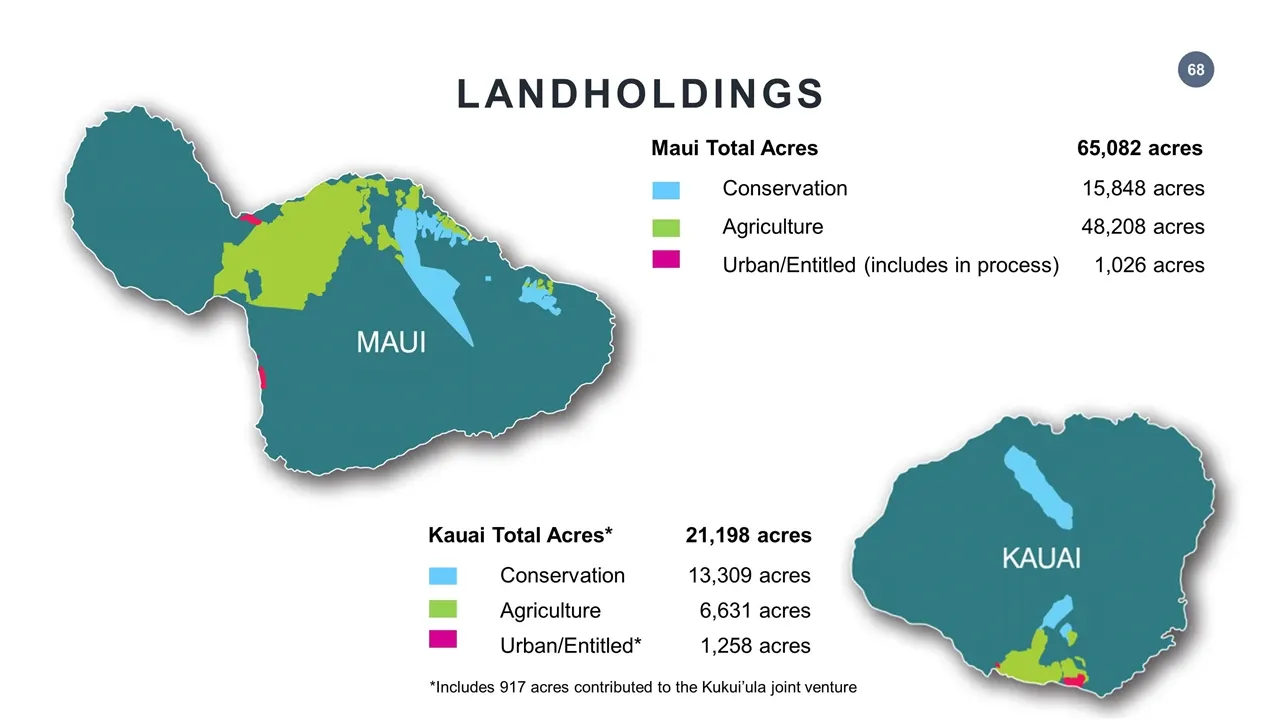
LANDHOLDINGS Kauai Total Acres* 21,198 acres Conservation 13,309 acres Agriculture 6,631 acres Urban/Entitled* 1,258 acres *Includes 917 acres contributed to the Kukui’ula joint venture Maui Total Acres 65,082 acres Conservation 15,848 acres Agriculture 48,208 acres Urban/Entitled (includes in proce
Slide 69: Higher Use Potential Lands
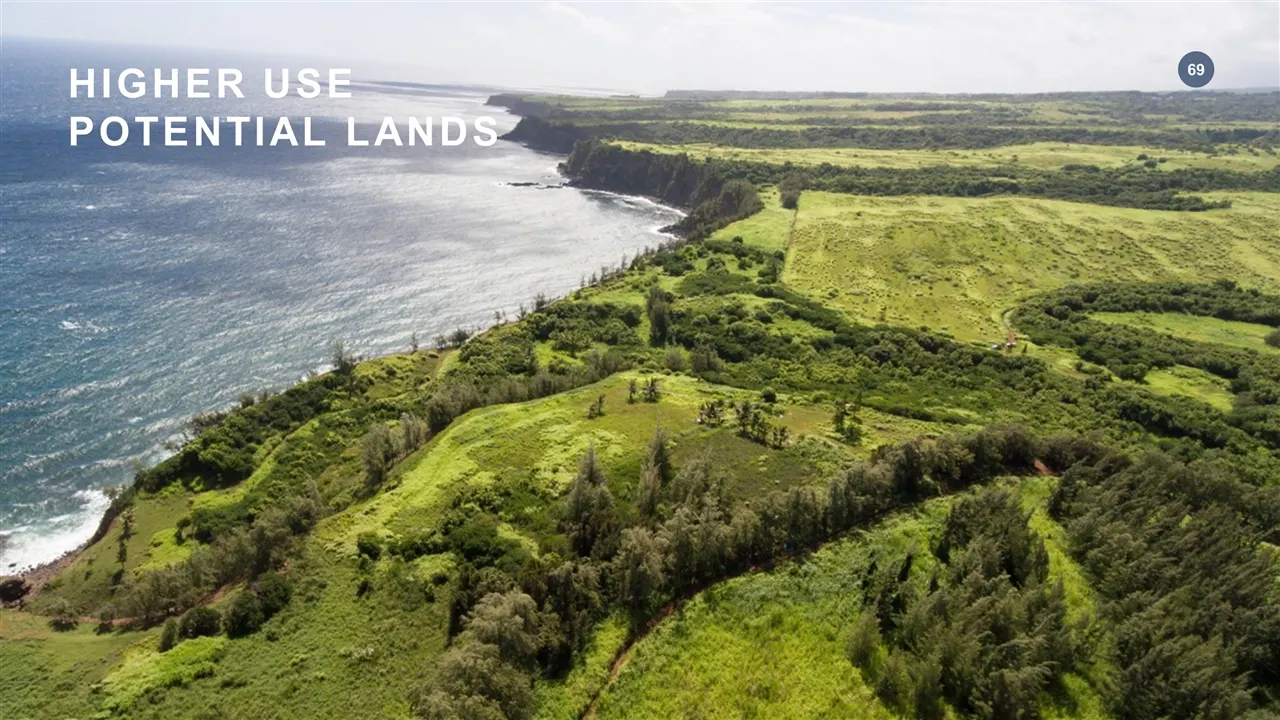
HIGHER USE POTENTIAL LANDS
Slide 70: Core Agricultural Lands
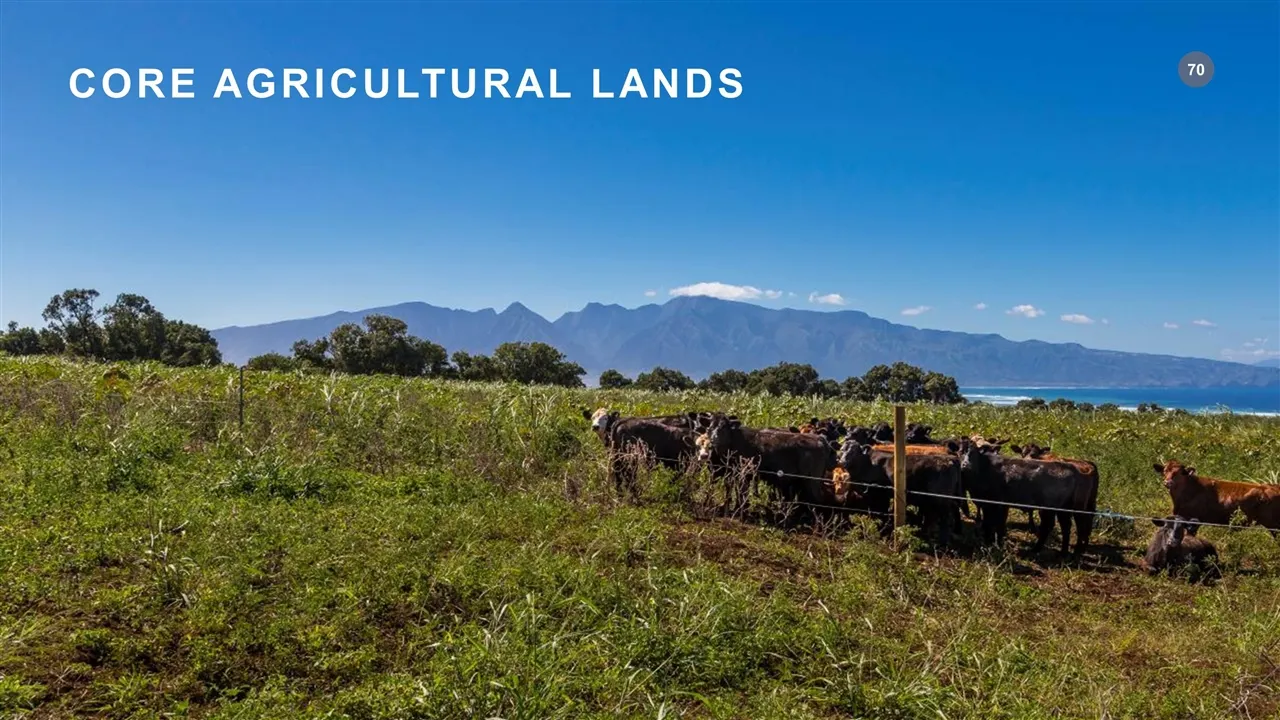
CORE AGRICULTURAL LANDS
Slide 71: Supporting Lands
SUPPORTING LANDS
Slide 72: Ag-Related Land Classifications
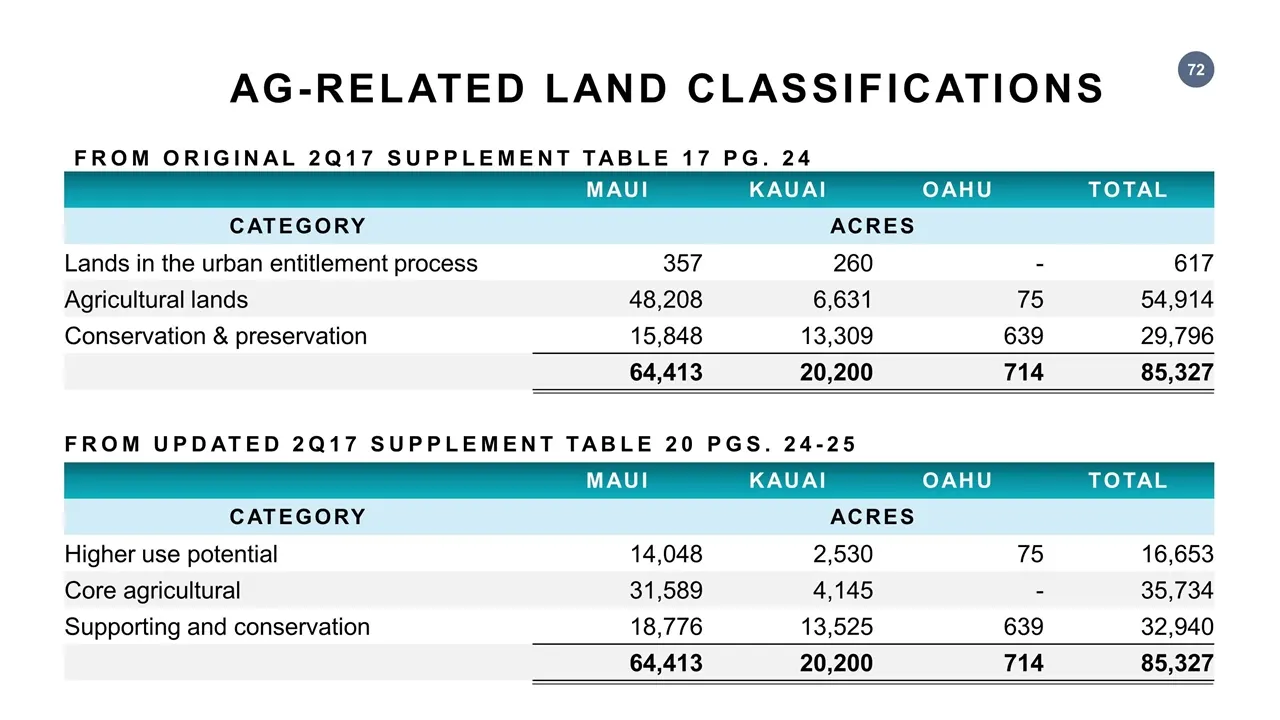
AG-RELATED LAND CLASSIFICATIONS MAUI KAUAI OAHU TOTAL CATEGORY ACRES Lands in the urban entitlement process 357 260 - 617 Agricultural lands 48,208 6,631 75 54,914 Conservation & preservation 15,848 13,309 639 29,796 64,413 20,200 714 85,327 FROM UPDATED 2Q17 SUPPLEMENT TABLE 20 PGS. 24-25 MAUI KAUA
Slide 73: Higher Use Potential Land Sales
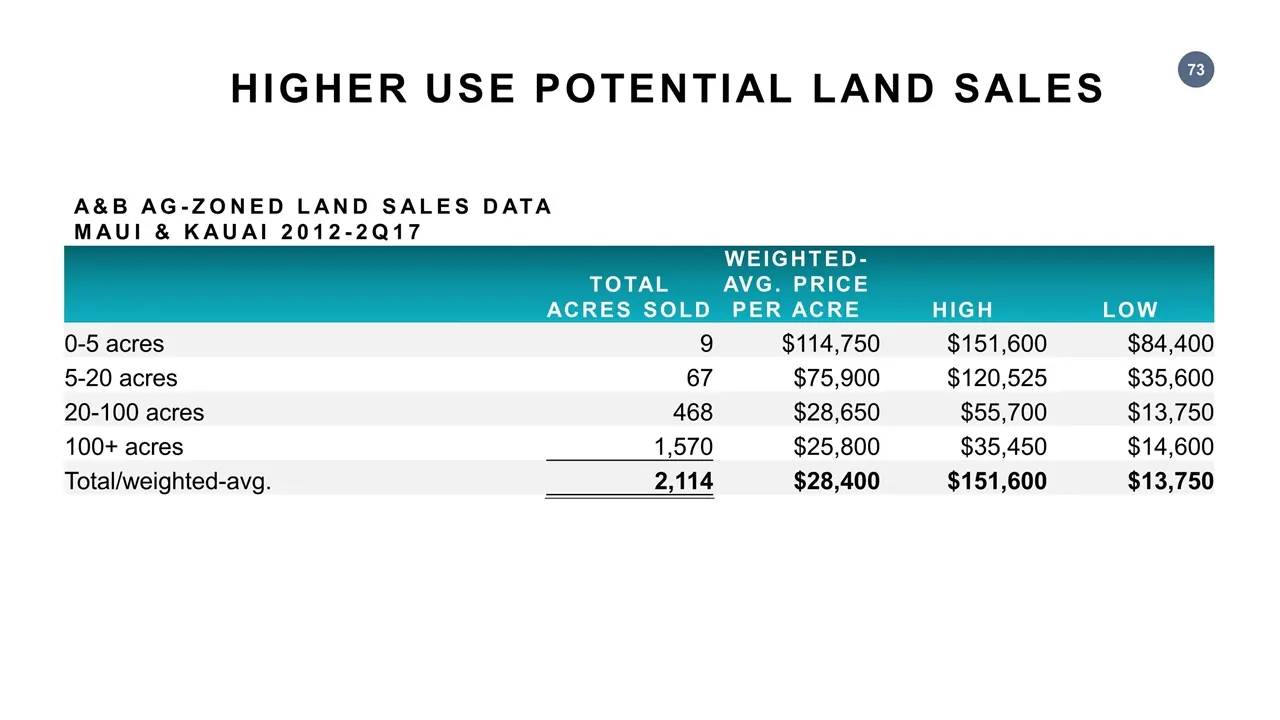
HIGHER USE POTENTIAL LAND SALES TOTAL ACRES SOLD WEIGHTED-AVG. PRICE PER ACRE HIGH LOW 0-5 acres 9 $114,750 $151,600 $84,400 5-20 acres 67 $75,900 $120,525 $35,600 20-100 acres 468 $28,650 $55,700 $13,750 100+ acres 1,570 $25,800 $35,450 $14,600 Total/weighted-avg. 2,114 $28,400 $151,600 $13,750 A&B
Slide 74: Undiscounted Retail Tax Assessed Values
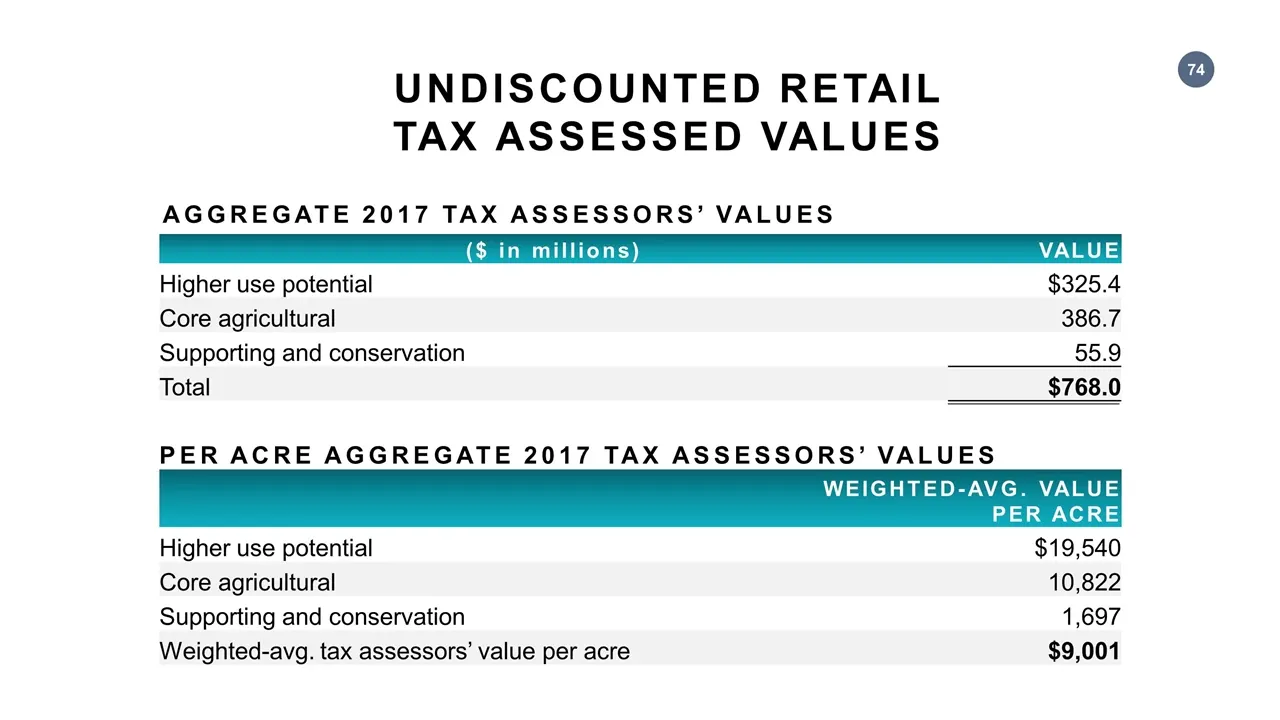
UNDISCOUNTED RETAIL TAX ASSESSED VALUES ($ in millions) VALUE Higher use potential $325.4 Core agricultural 386.7 Supporting and conservation 55.9 Total $768.0 PER ACRE AGGREGATE 2017 TAX ASSESSORS’ VALUES WEIGHTED-AVG. VALUE PER ACRE Higher use potential $19,540 Core agricultural 10,822 Supporting
Slide 75: PV Associated with Long-Term Monetization Strategy
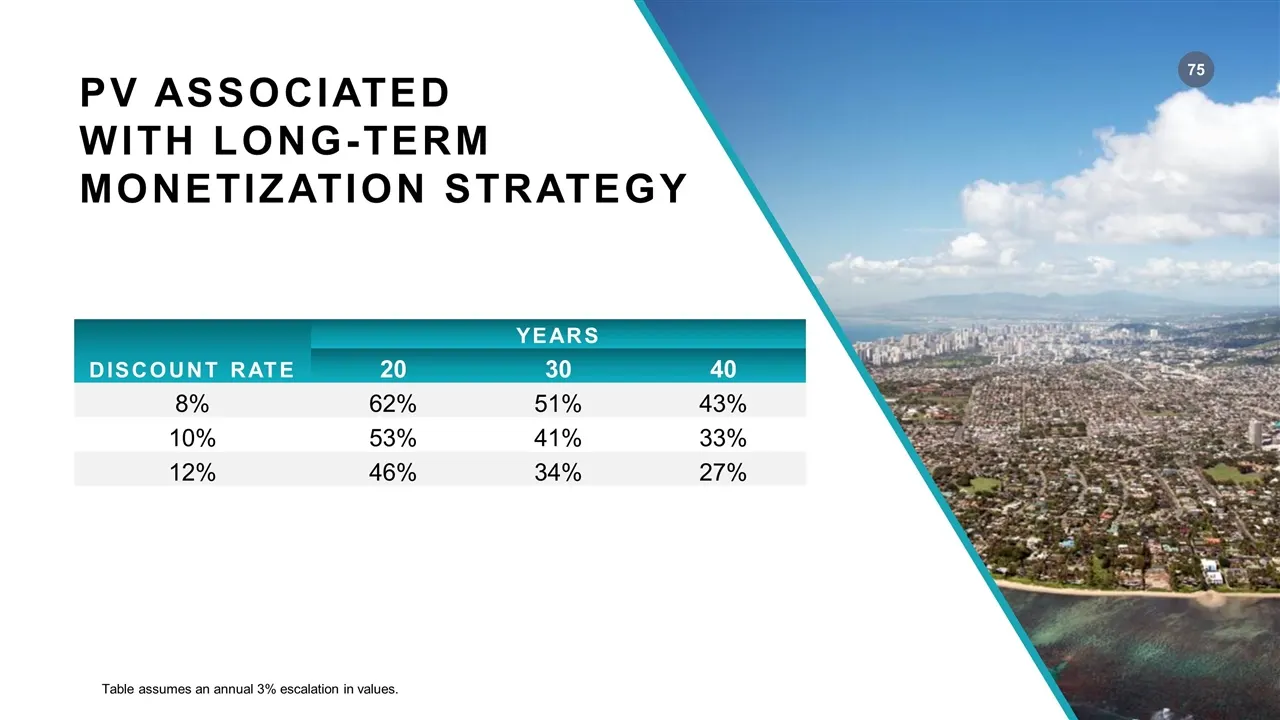
PV ASSOCIATED WITH LONG-TERM MONETIZATION STRATEGY DISCOUNT RATE YEARS 20 30 40 8% 62% 51% 43% 10% 53% 41% 33% 12% 46% 34% 27% Table assumes an annual 3% escalation in values.
Slide 76: Urban-Zoned Land Sales Data
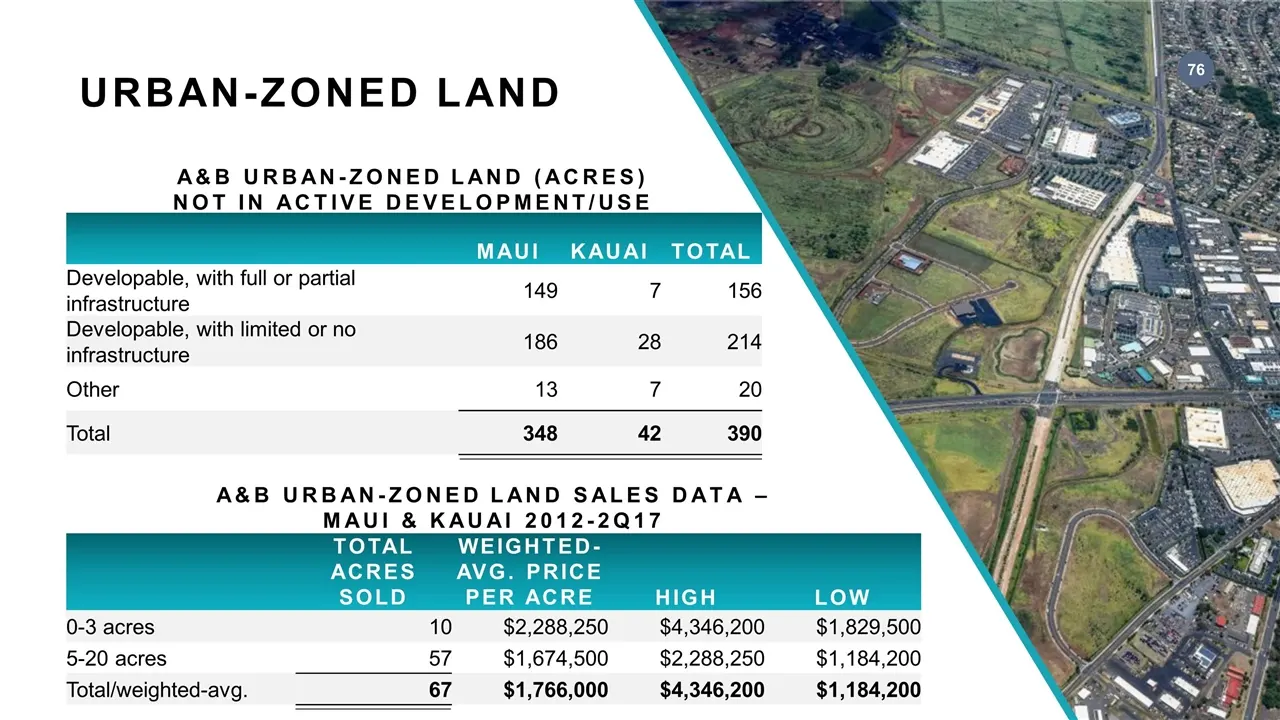
URBAN-ZONED LAND TOTAL ACRES SOLD WEIGHTED-AVG. PRICE PER ACRE HIGH LOW 0-3 acres 10 $2,288,250 $4,346,200 $1,829,500 5-20 acres 57 $1,674,500 $2,288,250 $1,184,200 Total/weighted-avg. 67 $1,766,000 $4,346,200 $1,184,200 A&B URBAN-ZONED LAND SALES DATA – MAUI & KAUAI 2012-2Q17 MAUI KAUAI TOTAL Devel
Slide 77: Financial Review
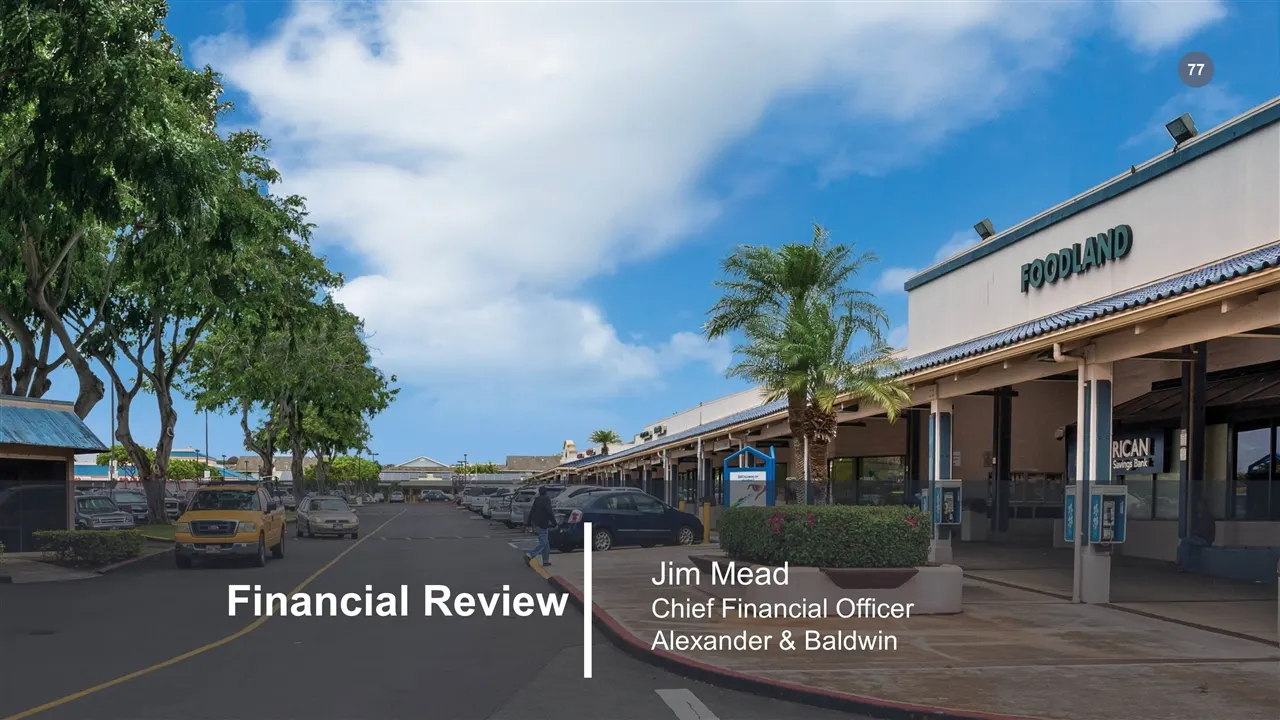
Financial Review Jim Mead Chief Financial Officer Alexander & Baldwin
Slide 78: Financial Review
FINANCIAL REVIEW Supplement enhancements Deferred tax reversal Special Distribution Tax-advantaged pension contribution
Slide 79: Calculation of CRE Cash NOI
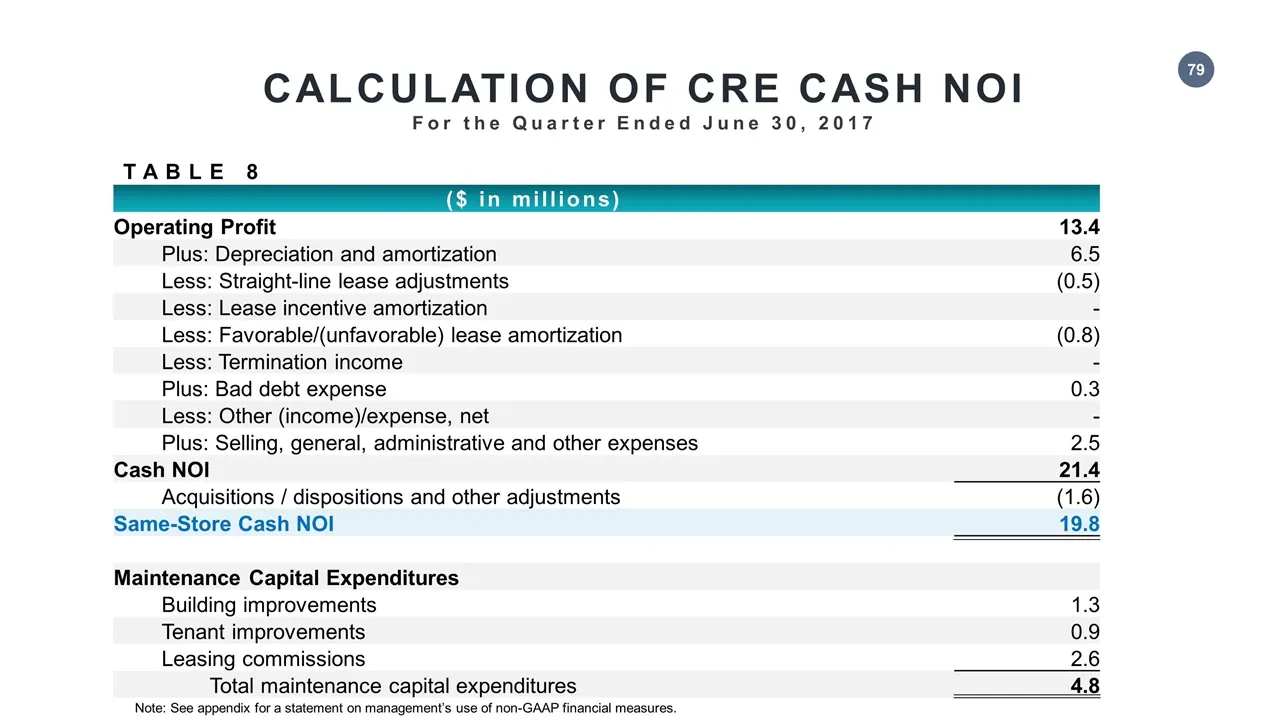
CALCULATION OF CRE CASH NOI For the Quarter Ended June 30, 2017 ($ in millions) Operating Profit 13.4 Plus: Depreciation and amortization 6.5 Less: Straight-line lease adjustments (0.5) Less: Lease incentive amortization - Less: Favorable/(unfavorable) lease amortization (0.8) Less: Termination inco
Slide 80: Ground Leases
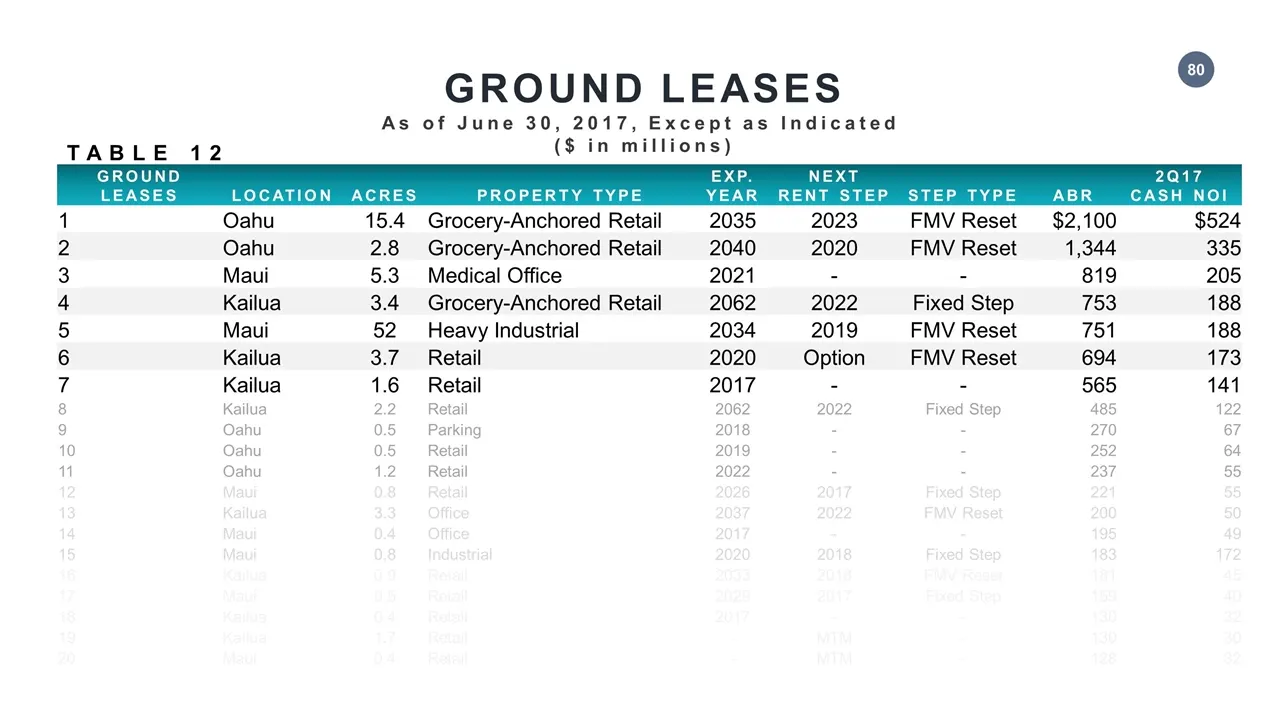
GROUND LEASES As of June 30, 2017, Except as Indicated ($ in millions) TABLE 12 GROUND LEASES LOCATION ACRES PROPERTY TYPE EXP. YEAR NEXT RENT STEP STEP TYPE ABR 2Q17 CASH NOI 1 Oahu 15.4 Grocery-Anchored Retail 2035 2023 FMV Reset $2,100 $524 2 Oahu 2.8 Grocery-Anchored Retail 2040 2020 FMV Reset 1
Slide 81: Deferred Tax Reversal: Liabilities
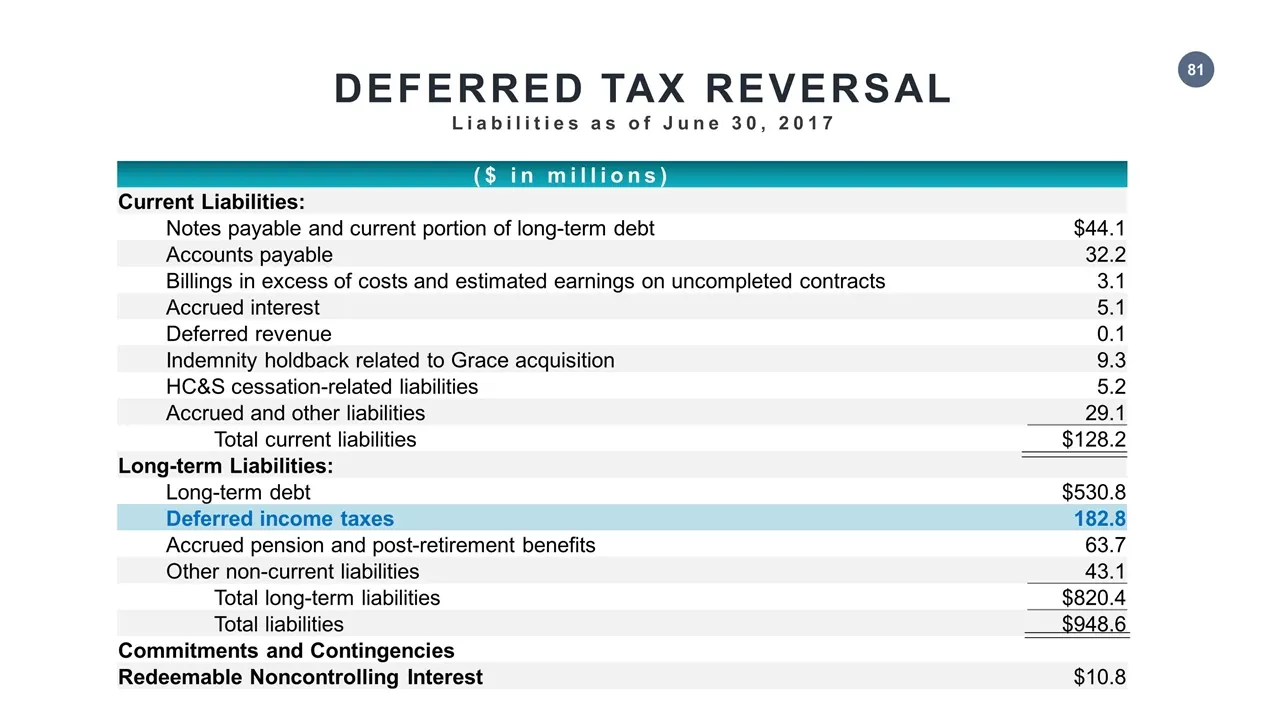
DEFERRED TAX REVERSAL Liabilities as of June 30, 2017 ($ in millions) Current Liabilities: Notes payable and current portion of long-term debt $44.1 Accounts payable 32.2 Billings in excess of costs and estimated earnings on uncompleted contracts 3.1 Accrued interest 5.1 Deferred revenue 0.1 Indemni
Slide 82: Deferred Tax Reversal: Components
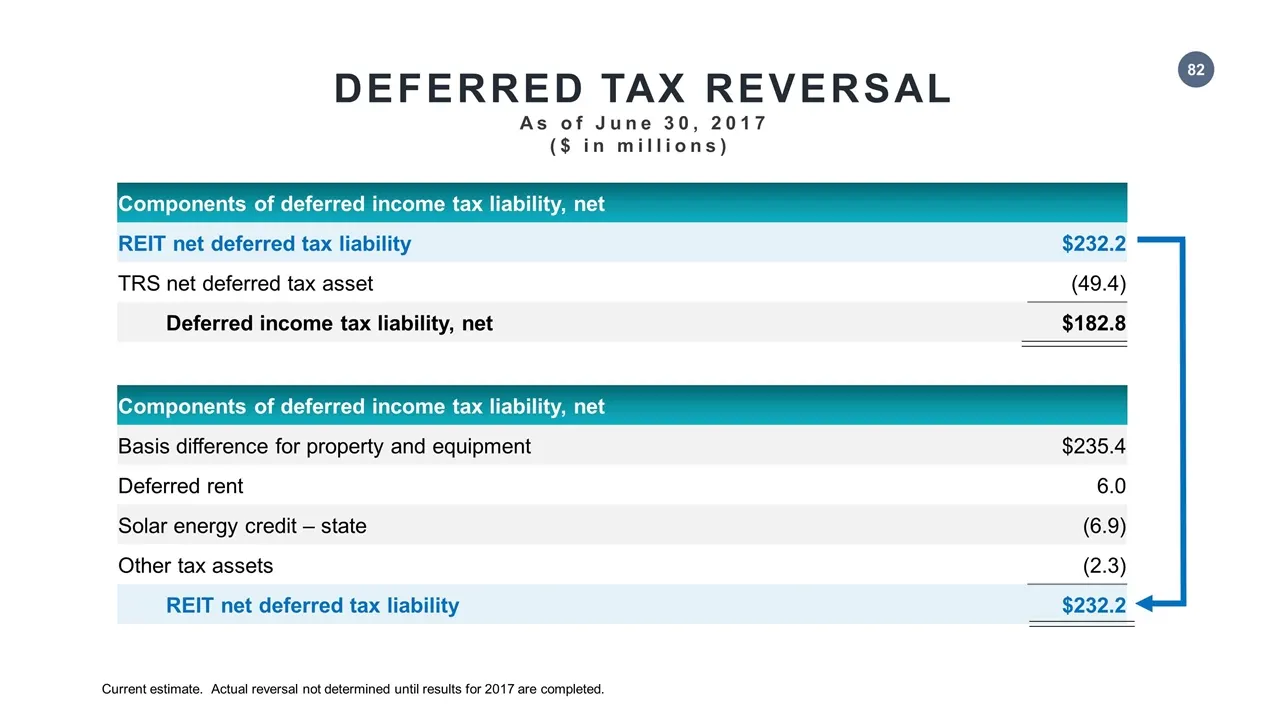
DEFERRED TAX REVERSAL As of June 30, 2017 ($ in millions) Components of deferred income tax liability, net REIT net deferred tax liability $232.2 TRS net deferred tax asset (49.4) Deferred income tax liability, net $182.8 Components of deferred income tax liability, net Basis difference for property
Slide 83: Special Distribution
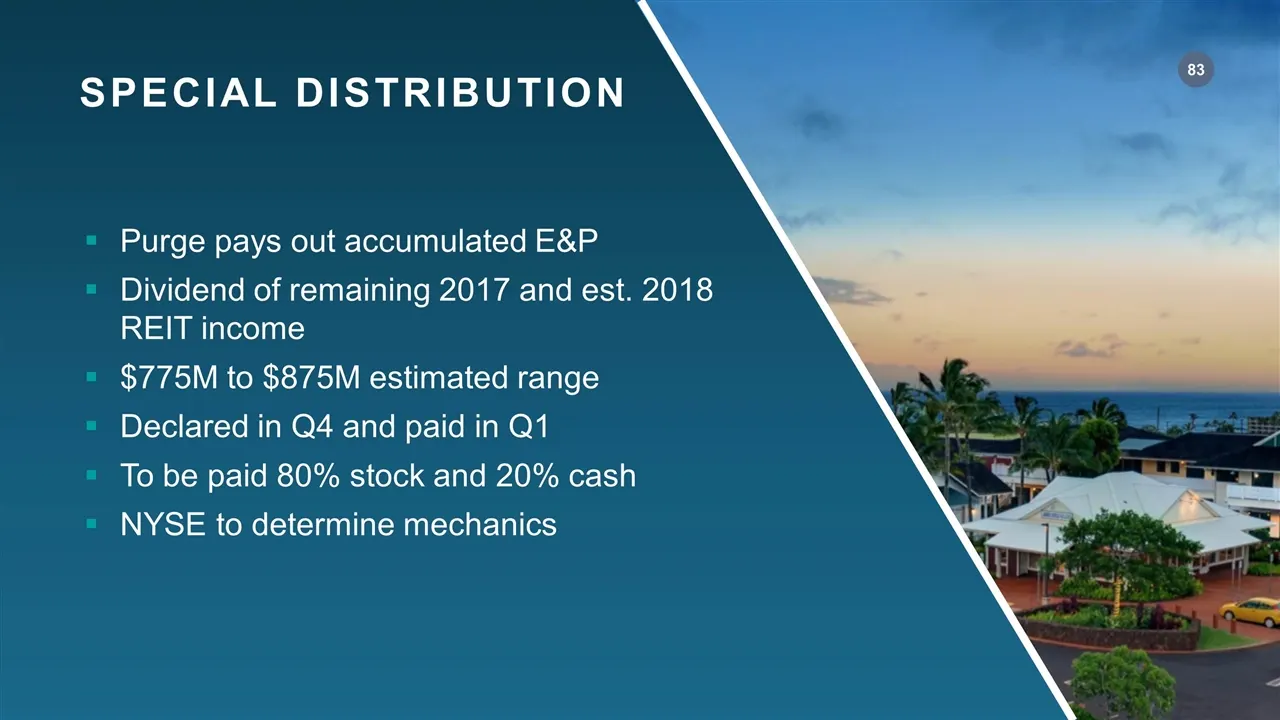
SPECIAL DISTRIBUTION Purge pays out accumulated E&P Dividend of remaining 2017 and est. 2018 REIT income $775M to $875M estimated range Declared in Q4 and paid in Q1 To be paid 80% stock and 20% cash NYSE to determine mechanics
Slide 84: Pro Forma Impact of Pension Contribution
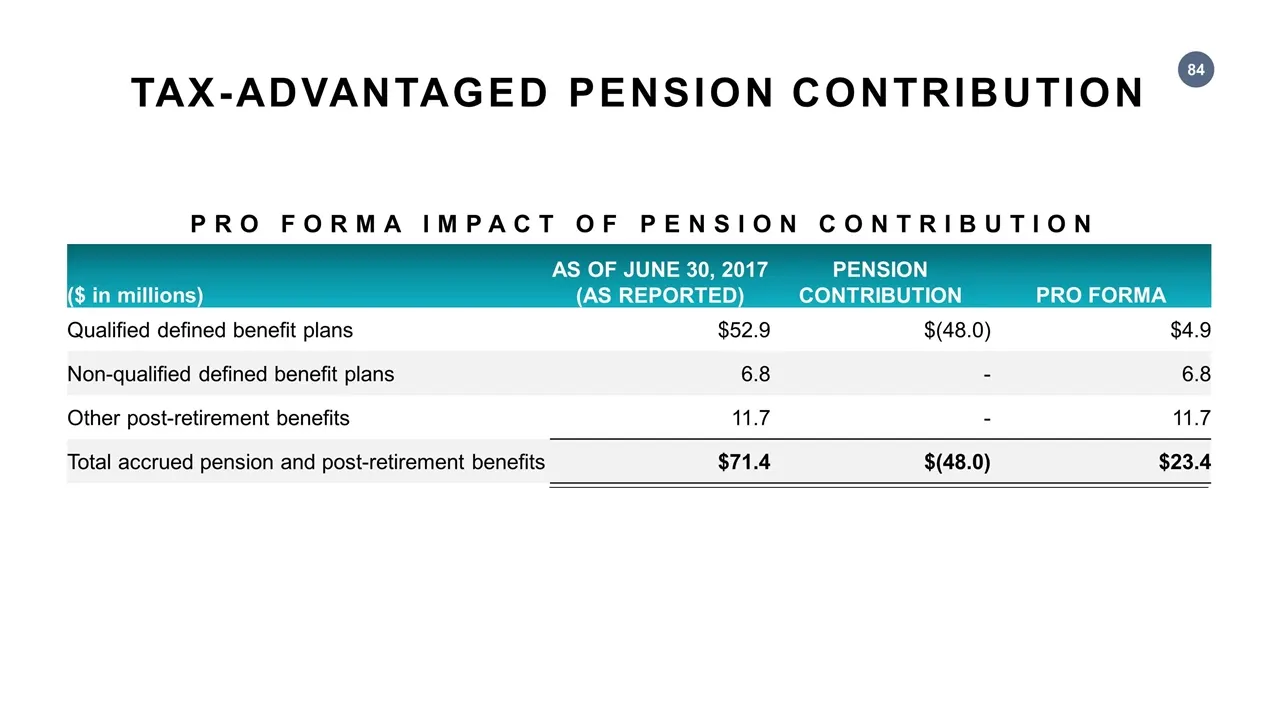
PRO FORMA IMPACT OF PENSION CONTRIBUTION TAX-ADVANTAGED PENSION CONTRIBUTION ($ in millions) As of June 30, 2017 (As reported) Pension contribution Pro forma Qualified defined benefit plans $52.9 $(48.0) $4.9 Non-qualified defined benefit plans 6.8 - 6.8 Other post-retirement benefits 11.7 - 11.7 To
Slide 85: Closing Remarks
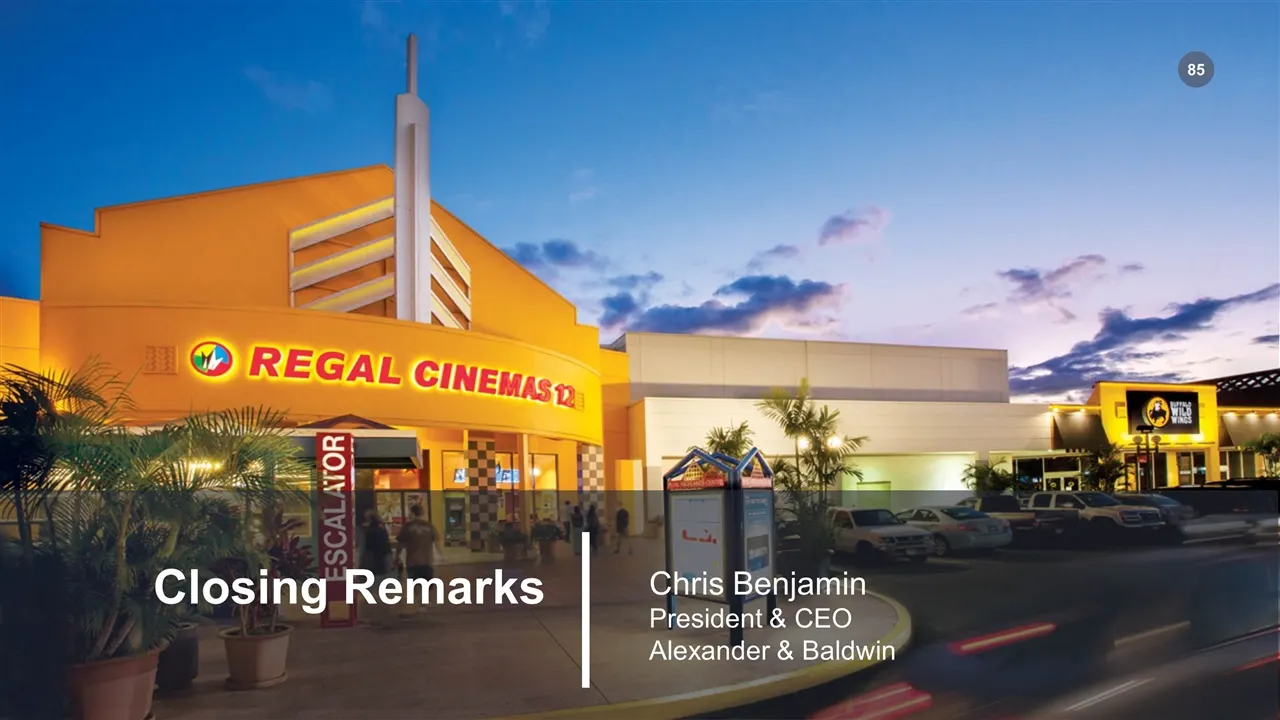
Closing Remarks Chris Benjamin President & CEO Alexander & Baldwin
Slide 86: Aligning Corporate Governance
ALIGNING CORPORATE GOVERNANCE Shareholder meeting to approve entity merger and facilitate compliance with REIT requirements Amending articles and bylaws Unclassified board Majority voting provisions Incorporated in Hawaii (no MUTA-like ability to classify board via board action) Added REIT director
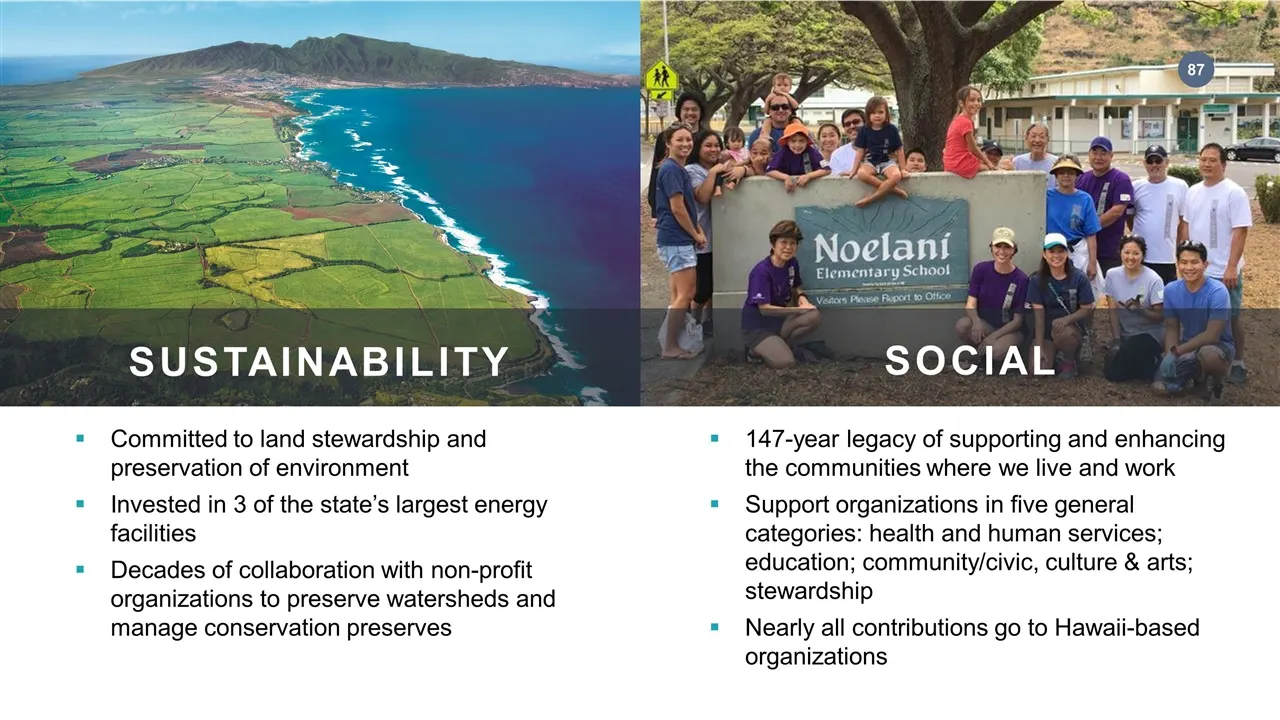
Slide 87: Sustainability and Social Commitment
Committed to land stewardship and preservation of environment Invested in 3 of the state’s largest energy facilities Decades of collaboration with non-profit organizations to preserve watersheds and manage conservation preserves SUSTAINABILITY 147-year legacy of supporting and enhancing the communit
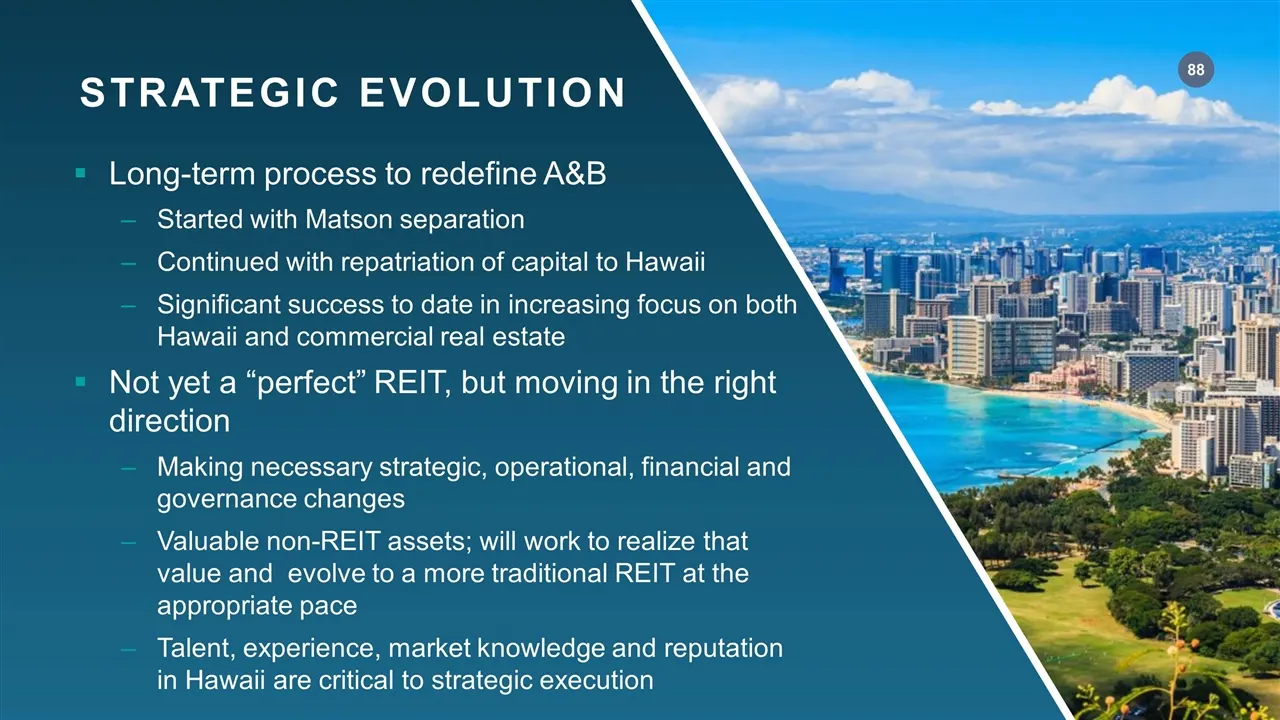
Slide 88: Strategic Evolution
STRATEGIC EVOLUTION Long-term process to redefine A&B Started with Matson separation Continued with repatriation of capital to Hawaii Significant success to date in increasing focus on both Hawaii and commercial real estate Not yet a “perfect” REIT, but moving in the right direction Making necessary
Slide 89: Questions & Answers
ALEXANDER & BALDWIN Premier Hawaii Real Estate Company ANALYST DAY PRESENTATION QUESTIONS & ANSWERS
Slide 90: Statement on Use of Non-GAAP Financial Measures
STATEMENT ON USE OF NON-GAAP FINANCIAL MEASURES The Company presents the certain non-GAAP financial measures in this presentation. The Company uses these non-GAAP measures when evaluating operating performance because management believes that they provide additional insight into the Company’s and se
Slide 91: CRE Cash Net Operating Income
CRE CASH NET OPERATING INCOME Cash Net Operating Income (Cash NOI) is a non-GAAP measure used by the Company in evaluating the CRE segment’s operating performance as it is an indicator of the return on property investment, and provides a method of comparing performance of operations, on an unlevered
Slide 92: CRE Cash NOI Reconciliation
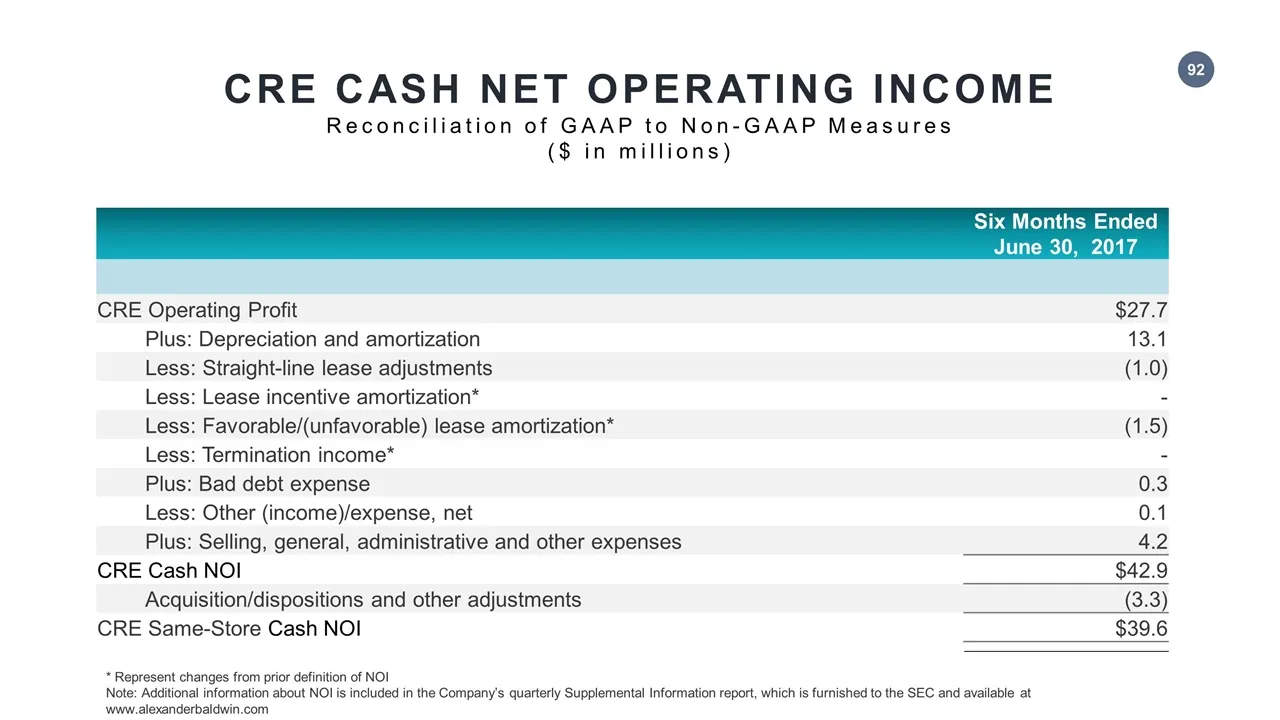
CRE CASH NET OPERATING INCOME Reconciliation of GAAP to Non-GAAP Measures ($ in millions) Six Months Ended June 30, 2017 CRE Operating Profit $27.7 Plus: Depreciation and amortization 13.1 Less: Straight-line lease adjustments (1.0) Less: Lease incentive amortization* - Less: Favorable/(unfavorable)
Slide 93: M&C EBITDA & Adjusted EBITDA
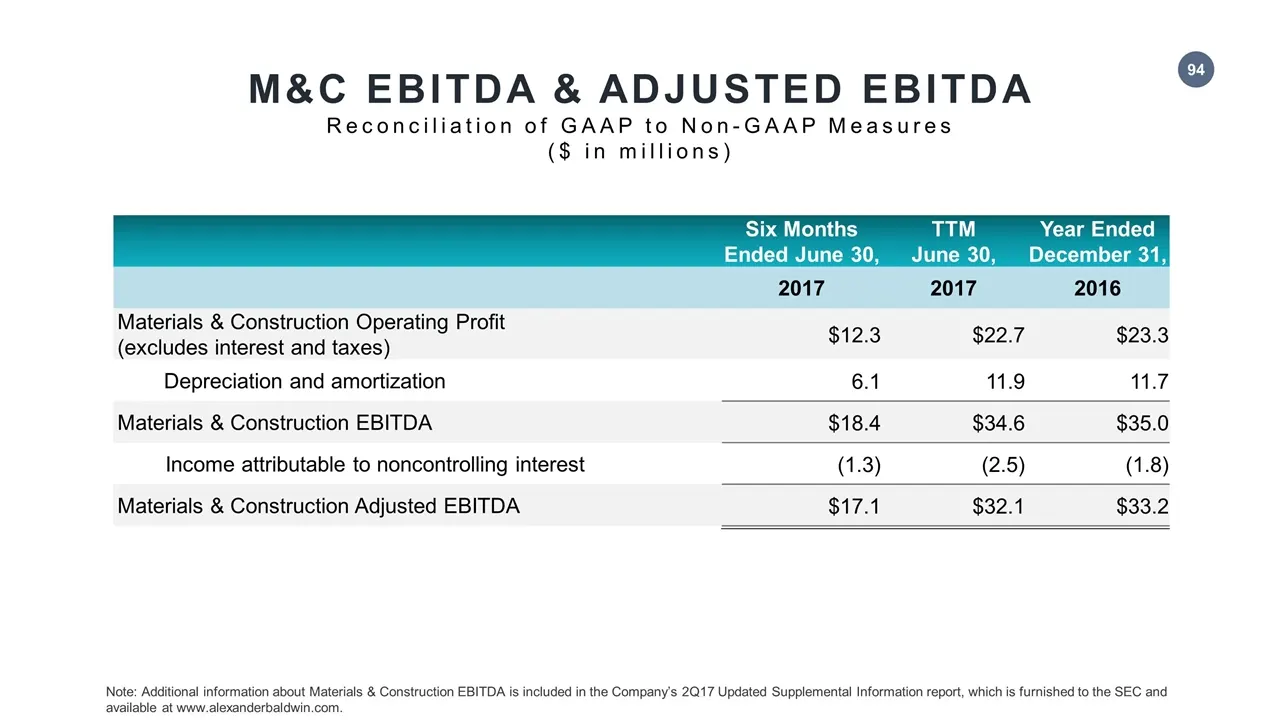
M&C EBITDA & ADJUSTED EBITDA Earnings Before Interest, Taxes, Depreciation and Amortization (EBITDA) is a non-GAAP measure used by the Company in evaluating the Materials & Construction segment's operating performance on a consistent and comparable basis from period to period. The Company provides t
Slide 94: M&C EBITDA Reconciliation
Six Months Ended June 30, TTM June 30, Year Ended December 31, 2017 2017 2016 Materials & Construction Operating Profit (excludes interest and taxes) $12.3 $22.7 $23.3 Depreciation and amortization 6.1 11.9 11.7 Materials & Construction EBITDA $18.4 $34.6 $35.0 Income attributable to noncontrolling
Source: SEC EDGAR · 8-K filed Sep 12, 2017
More decks from Alexander & Baldwin Holdings Inc
 Q2 2025 Earnings Presentation21 slides · Jul 24, 2025
 Q4 2023 Earnings Presentation27 slides · Feb 28, 2024
 Investor Presentation (September 2022)33 slides · Sep 9, 2022
 Investor Presentation (January 2022)39 slides · Jan 10, 2022
 Investor Presentation (December 2021)39 slides · Dec 15, 2021
 Q4 2017 Earnings Presentation33 slides · Mar 1, 2018