Novelis — Q2 2011 Earnings Presentation
27 slides from Novelis's earnings presentation, Nov 10, 2010
Slide 1: Novelis Second Quarter 2011 Earnings Conference Call
Novelis Second Quarter 2011 Earnings Conference Call Philip Martens President and Chief Operating Officer Steve Fisher Senior Vice President and Chief Financial Officer Brighter Ideas with Aluminum November 10, 2010
Slide 2: Forward-Looking Statements
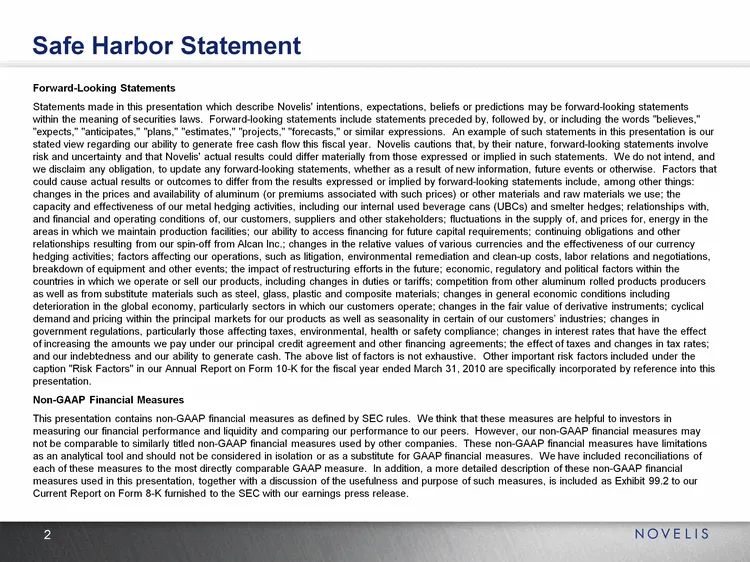
Forward-Looking Statements Statements made in this presentation which describe Novelis' intentions, expectations, beliefs or predictions may be forward-looking statements within the meaning of securities laws. Forward-looking statements include statements preceded by, followed by, or including the w
Slide 3: Agenda
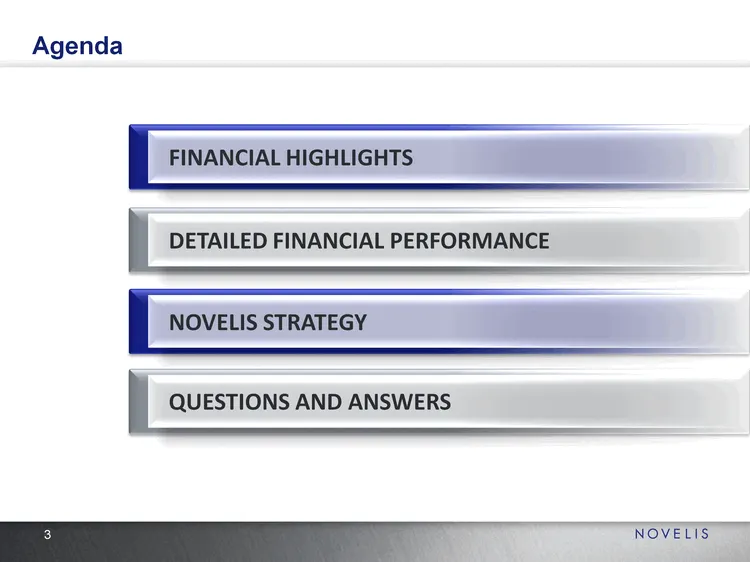
DETAILED FINANCIAL PERFORMANCE NOVELIS STRATEGY QUESTIONS AND ANSWERS FINANCIAL HIGHLIGHTS Agenda
Slide 4: Financial Highlights
NOVELIS FINANCIAL HIGHLIGHTS " NOVELIS
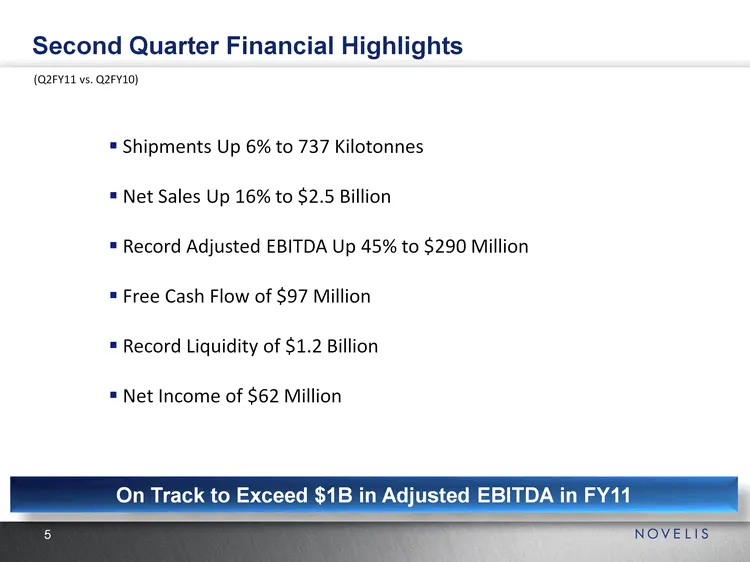
Slide 5: Second Quarter Financial Highlights (Q2FY11 vs. Q2FY10)
Second Quarter Financial Highlights (Q2FY11 vs. Q2FY10) On Track to Exceed $1B in Adjusted EBITDA in FY11 Shipments Up 6% to 737 Kilotonnes Net Sales Up 16% to $2.5 Billion Record Adjusted EBITDA Up 45% to $290 Million Free Cash Flow of $97 Million Record Liquidity of $1.2 Billion Net Income of $62
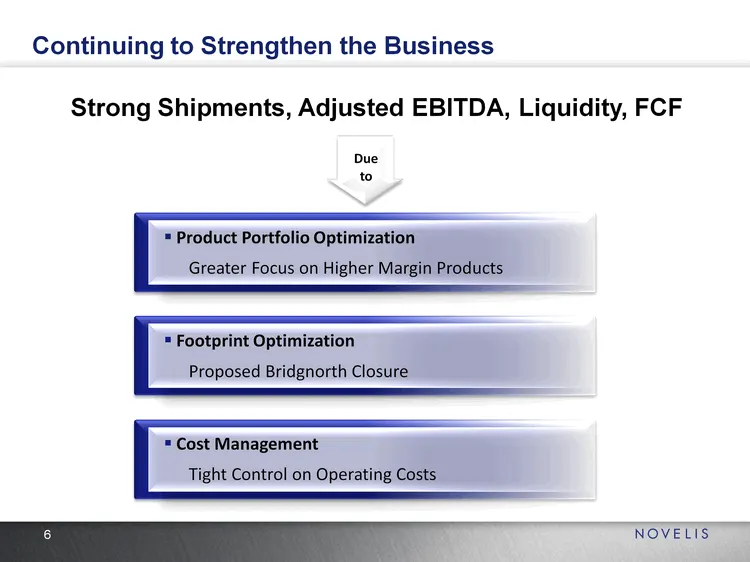
Slide 6: Strong Shipments, Adjusted EBITDA, Liquidity, FCF
Strong Shipments, Adjusted EBITDA, Liquidity, FCF Due to Product Portfolio Optimization Greater Focus on Higher Margin Products Footprint Optimization Proposed Bridgnorth Closure Cost Management Tight Control on Operating Costs Continuing to Strengthen the Business
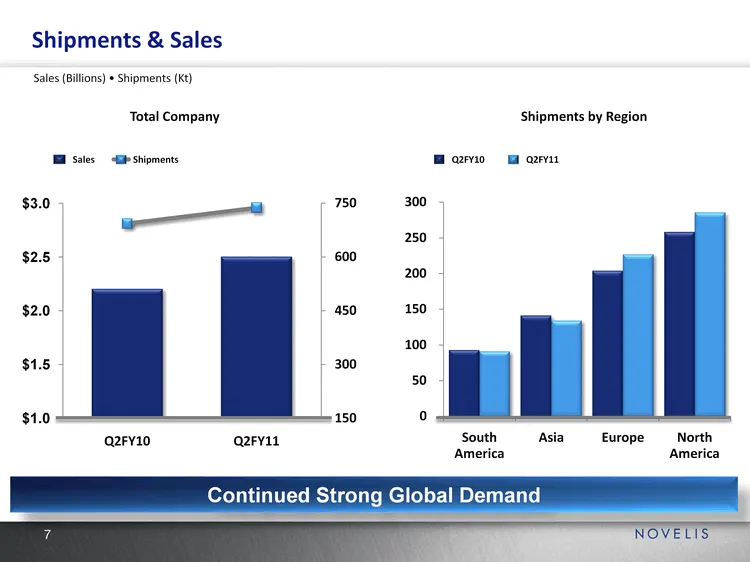
Slide 7: Shipments & Sales
(CHART) Shipments & Sales (CHART) Shipments by Region Total Company Sales (Billions) • Shipments (Kt) Continued Strong Global Demand Sales Q2FY10
Slide 8: Detailed Financial Performance
DETAILED FINANCIAL PERFORMANCE
Slide 9: EBITDA, Shipments and Pre-Tax Income
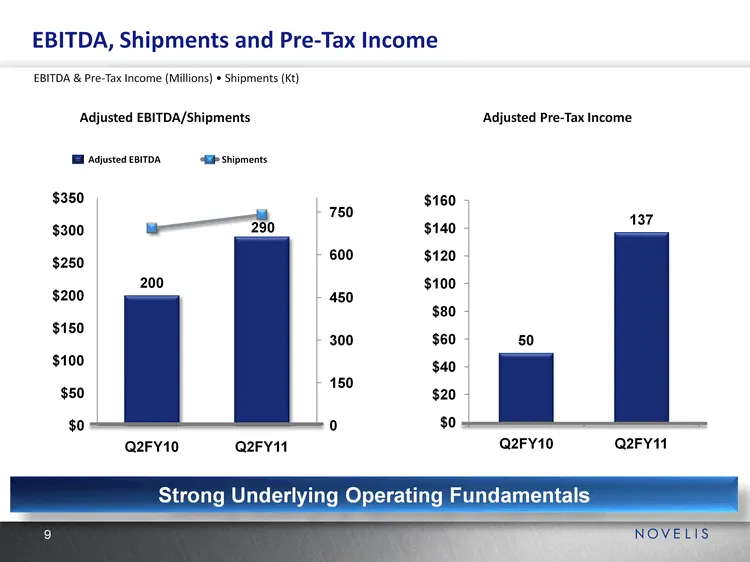
(CHART) (CHART) Adjusted EBITDA/Shipments Adjusted Pre-Tax Income EBITDA, Shipments and Pre-Tax Income Strong Underlying Operating Fundamentals EBITDA & Pre-Tax Income (Millions) • Shipments (Kt) Shipments Adjusted EBITDA
Slide 10: Strong Adjusted EBITDA
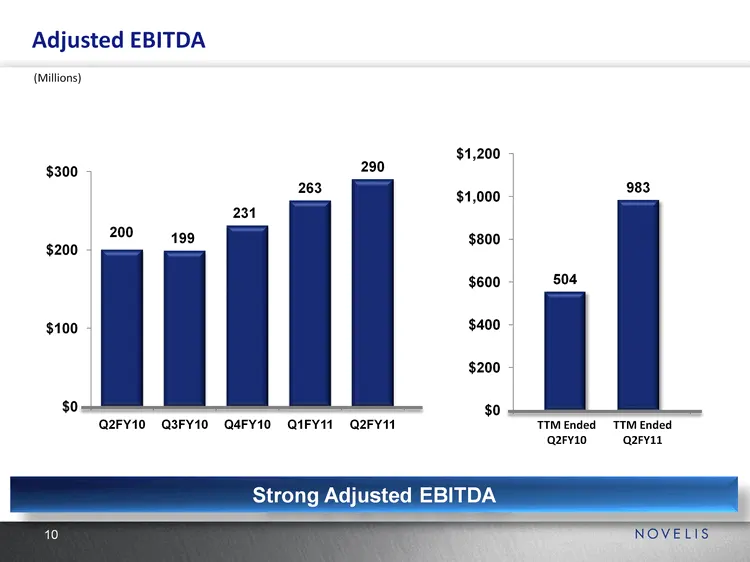
(Millions) (CHART) Adjusted EBITDA Strong Adjusted EBITDA (CHART) TTM Ended Q2FY10 TTM Ended Q2FY11
Slide 11: Adjusted EBITDA Q2FY10 vs. Q2FY11 Business Variables
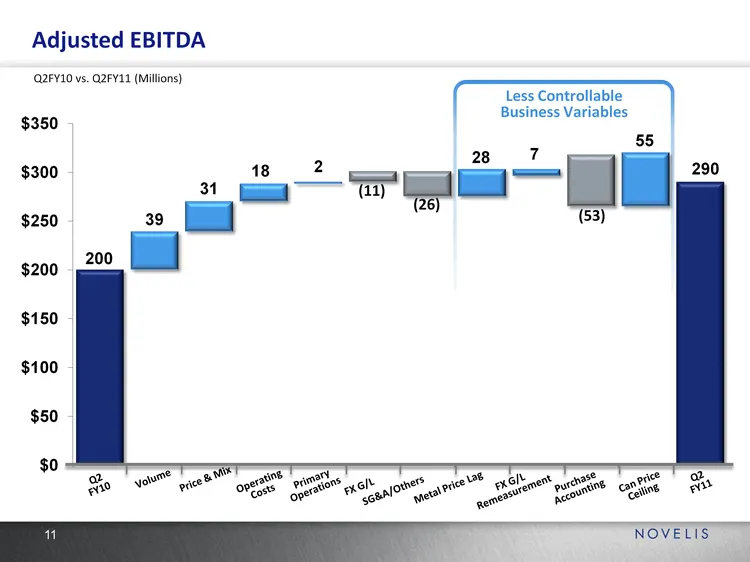
Less Controllable Business Variables Business Variables Business Variables Q2 FY10 Volume Price & Mix Operating Costs Primary Operations SG&A/Others FX G/L Metal Price Lag FX G/L Remeasurement Purchase Accounting Can Price Ceiling Q2 FY11 Adjusted EBITDA Q2FY10 vs. Q2FY11 (Millions) (26) (11) (53)
Slide 12: Sequential Income Statement
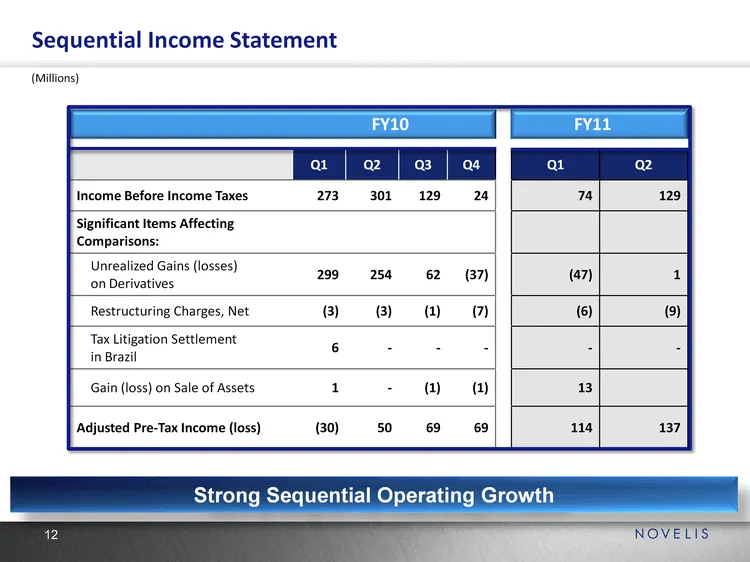
Q1 Q2 Q3 Q4 Q1 Q2 Income Before Income Taxes 273 301 129 24 74 129 Significant Items Affecting Comparisons: Significant Items Affecting Comparisons: Significant Items Affecting Comparisons: Significant Items Affecting Comparisons: Significant Items Affecting Comparisons: Unrealized Gains (losses) on
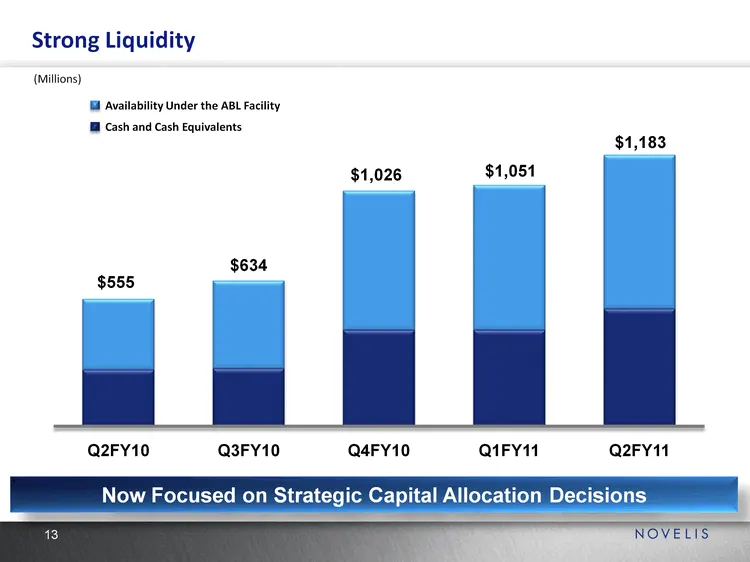
Slide 13: Strong Liquidity
(CHART) (Millions) Now Focused on Strategic Capital Allocation Decisions Strong Liquidity Availability Under the ABL Facility
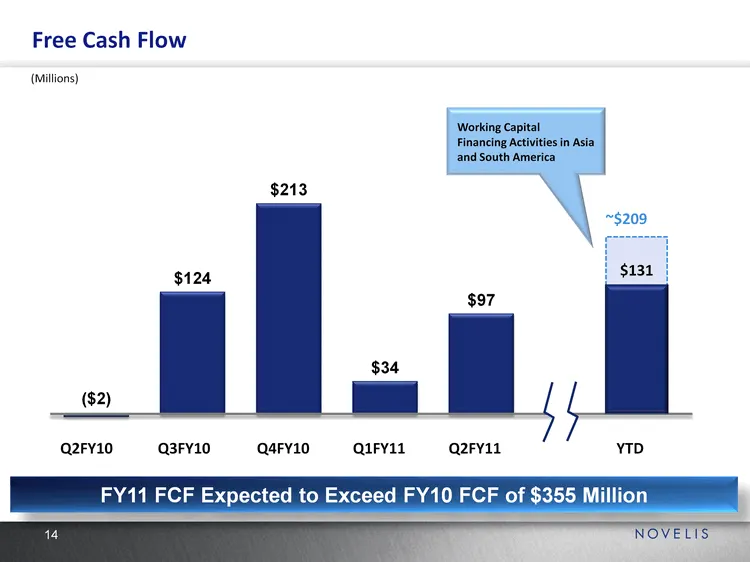
Slide 14: Free Cash Flow
(Millions) Working Capital Financing Activities in Asia and South America Free Cash Flow FY11 FCF Expected to Exceed FY10 FCF of $355 Million (CHART) ~$209 YTD Q2FY11 Q1FY11 Q4FY10 Q3FY10 Q2FY10 (CHART)
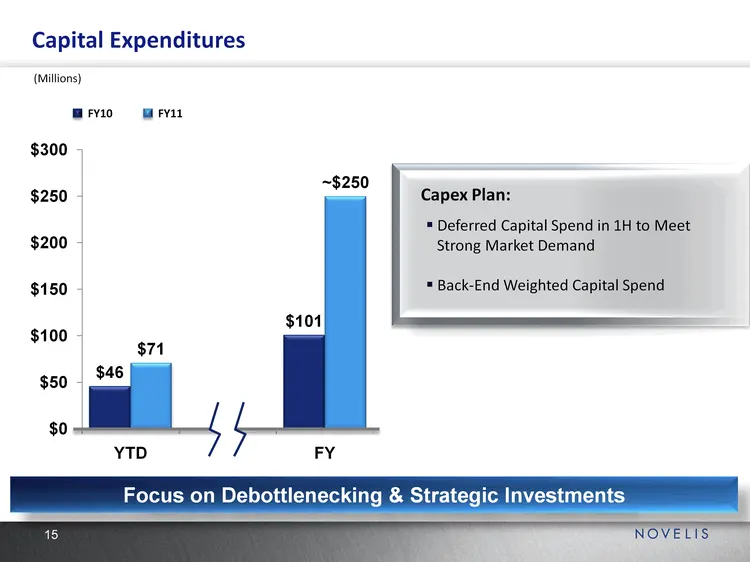
Slide 15: Capital Expenditures
(CHART) (Millions) Capital Expenditures Focus on Debottlenecking & Strategic Investments Capex Plan: Deferred Capital Spend in 1H to Meet Strong Market Demand Back-End Weighted Capital Spend FY11
Slide 16: Novelis Strategy
NOVELIS NOVELIS STRATEGY 16 NOVELIS
Slide 17: Novelis Strategy: One Novelis
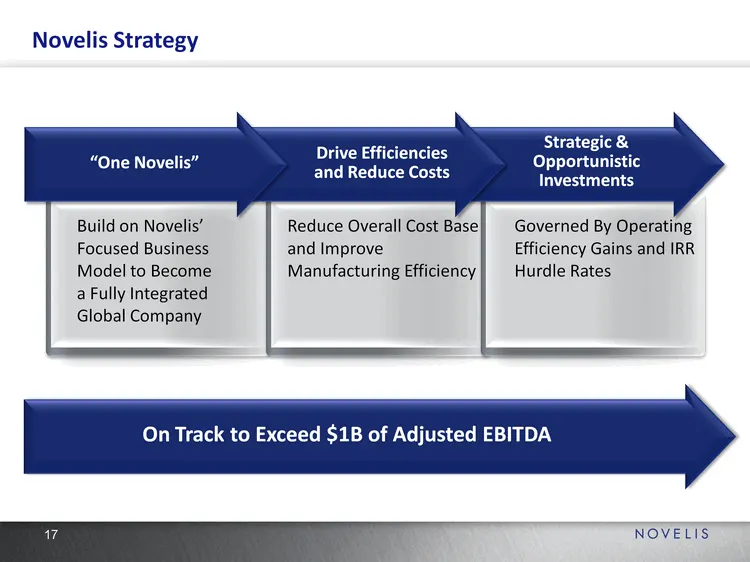
Reduce Overall Cost Base and Improve Manufacturing Efficiency Governed By Operating Efficiency Gains and IRR Hurdle Rates Drive Efficiencies and Reduce Costs On Track to Exceed $1B of Adjusted EBITDA Strategic & Opportunistic Investments Novelis Strategy Build on Novelis' Focused Business Model to B
Slide 18: Continuing to Implement Novelis Strategy
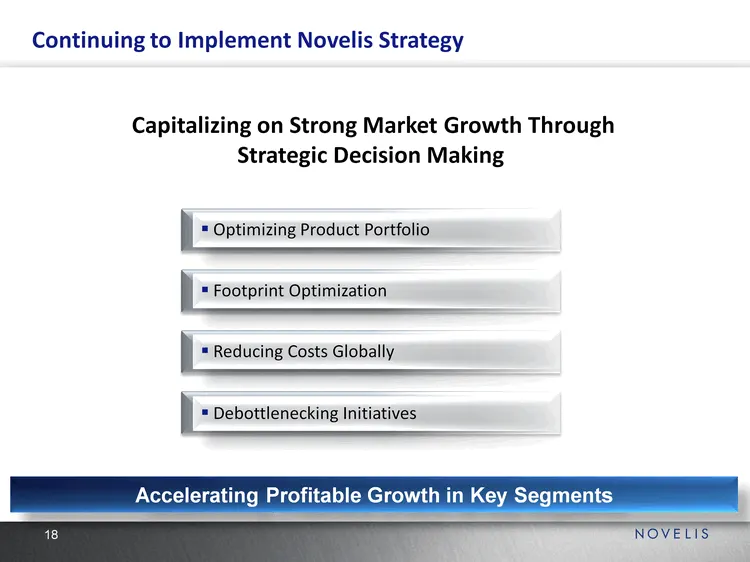
Capitalizing on Strong Market Growth Through Strategic Decision Making Continuing to Implement Novelis Strategy Accelerating Profitable Growth in Key Segments Optimizing Product Portfolio Footprint Optimization Debottlenecking Initiatives Reducing Costs Globally
Slide 19: Strong Market Growth
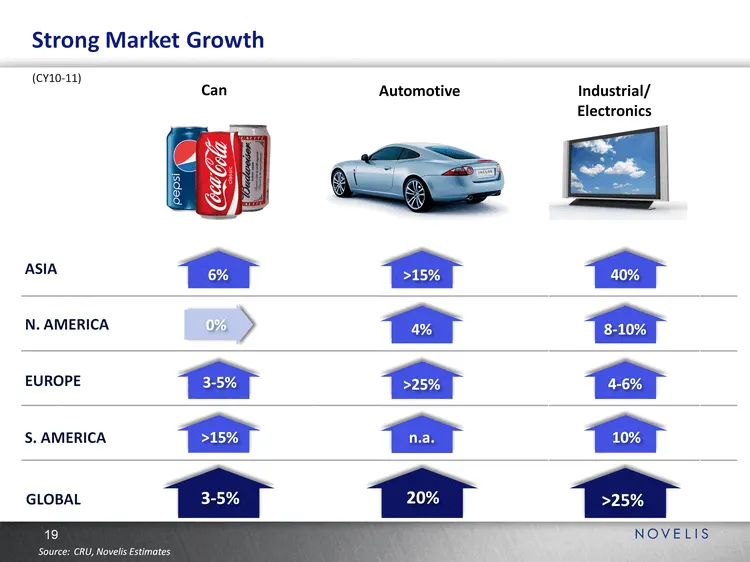
Source: CRU, Novelis Estimates Strong Market Growth N. AMERICA EUROPE S. AMERICA ASIA GLOBAL Automotive >15% 4% >25% n.a. 20% Can 6% 0% >15% 3-5% 3-5% Industrial/ Electronics 40% 10% >25% 8-10% 4-6% (CY10-11)
Slide 20: Optimizing Product Portfolio
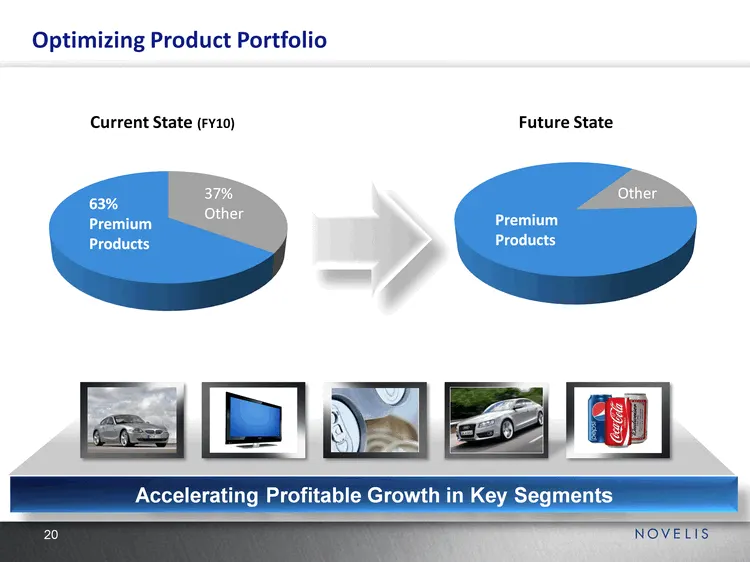
(CHART) (CHART) Current State (FY10) Future State 63% Premium Products 37% Other Other Premium Products Optimizing Product Portfolio Accelerating Profitable Growth in Key Segments
Slide 21: Bridgnorth: Footprint Optimization and Reducing Costs Globally
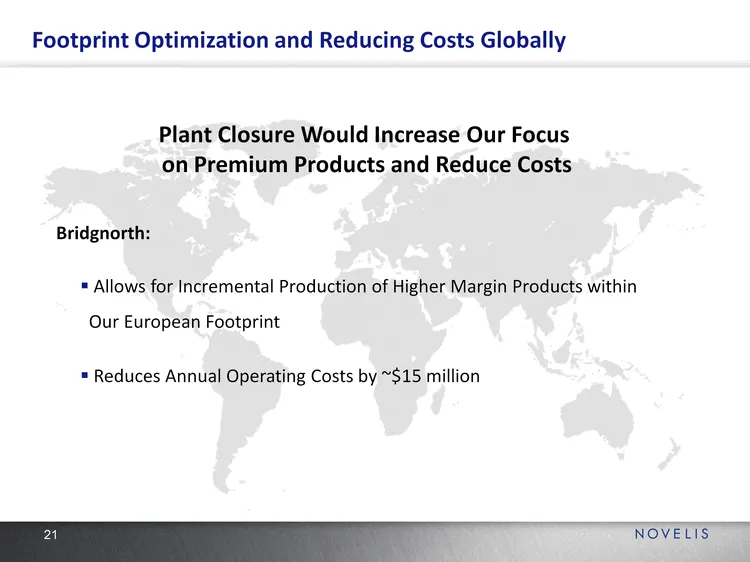
Bridgnorth: Footprint Optimization and Reducing Costs Globally Allows for Incremental Production of Higher Margin Products within Our European Footprint Reduces Annual Operating Costs by ~$15 million Plant Closure Would Increase Our Focus on Premium Products and Reduce Costs
Slide 22: Incremental Capacity Through Pinda Expansion and Debottlenecking
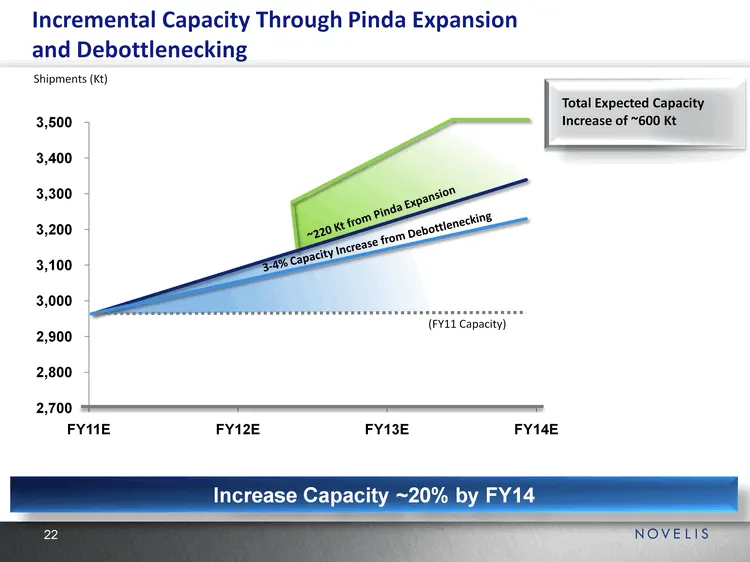
(CHART) Shipments (Kt) (FY11 Capacity) Total Expected Capacity Increase of ~600 Kt ~220 Kt from Pinda Expansion 3-4% Capacity Increase from Debottlenecking Incremental Capacity Through Pinda Expansion and Debottlenecking Increase Capacity ~20% by FY14
Slide 23: Questions and Answers
NOVELIS QUESTIONS AND ANSWERS 23 at NOVELIS aT
Slide 24: Appendix
NOVELIS APPENDIX 24 . NOVELIS
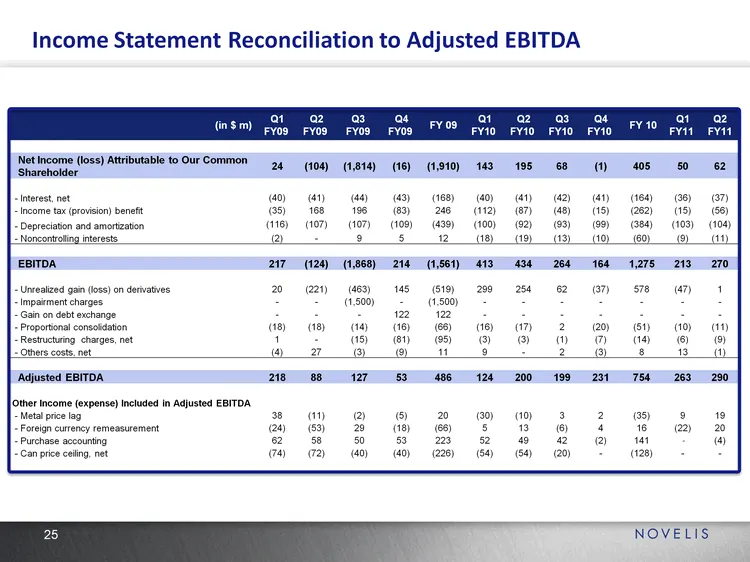
Slide 25: EBITDA Reconciliation
(in $ m) Q1 FY09 Q2 FY09 Q3 FY09 Q4 FY09 FY 09 Q1 FY10 Q2 FY10 Q3 FY10 Q4 FY10 FY 10 Q1 FY11 Q2FY11 Net Income (loss) Attributable to Our Common Shareholder 24 (104) (1,814) (16) (1,910) 143 195 68 (1) 405 50 62 - Interest, net (40) (41) (44) (43) (168) (40) (41) (42) (41) (164) (36) (37) - Income t
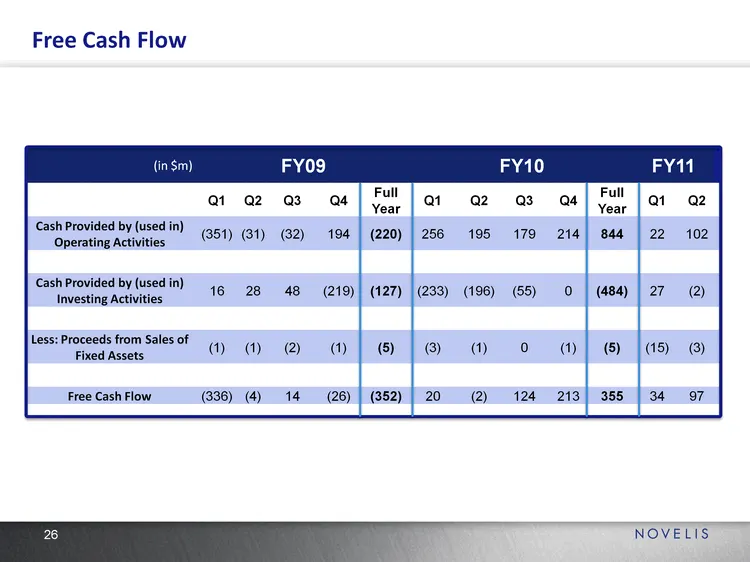
Slide 26: Free Cash Flow Reconciliation
(in $m) FY09 FY09 FY09 FY09 FY09 FY10 FY10 FY10 FY10 FY10 FY11 FY11 Q1 Q2 Q3 Q4 Full Year Q1 Q2 Q3 Q4 Full Year Q1 Q2 Cash Provided by (used in) Operating Activities (351) (31) (32) 194 (220) 256 195 179 214 844 22 102 Cash Provided by (used in) Investing Activities 16 28 48 (219) (127) (233) (196)
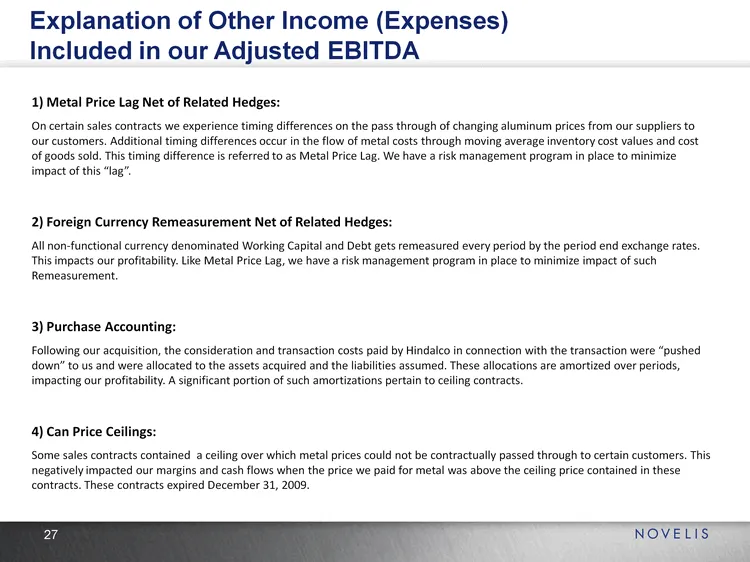
Slide 27: Explanation of Other Income (Expenses) Included in Adjusted EBITDA
Explanation of Other Income (Expenses) Included in our Adjusted EBITDA 1) Metal Price Lag Net of Related Hedges: On certain sales contracts we experience timing differences on the pass through of changing aluminum prices from our suppliers to our customers. Additional timing differences occur in the
Source: SEC EDGAR · 8-K filed Nov 10, 2010
More decks from Novelis Inc.
 Q2 FY2027 Earnings Presentation20 slides · Nov 5, 2026
 Q2 FY2027 Earnings Presentation31 slides · Nov 5, 2026
 Q1 FY2027 Earnings Presentation21 slides · Aug 5, 2026
 Q1 FY2027 Earnings Presentation31 slides · Aug 5, 2026
 Q4 FY2026 Earnings Presentation33 slides · May 19, 2026
 Q3 FY2026 Earnings Presentation33 slides · Feb 11, 2026