American Healthcare REIT, Inc. · NYSE:AHR
American Healthcare REIT — Investor Presentation (September 2025)
41 slides from American Healthcare REIT's investor presentation, September 2025

Slide 1: Investor Presentation September 2025
INVESTOR PRESENTATION SEPTEMBER 2025
Slide 2: Disclaimers
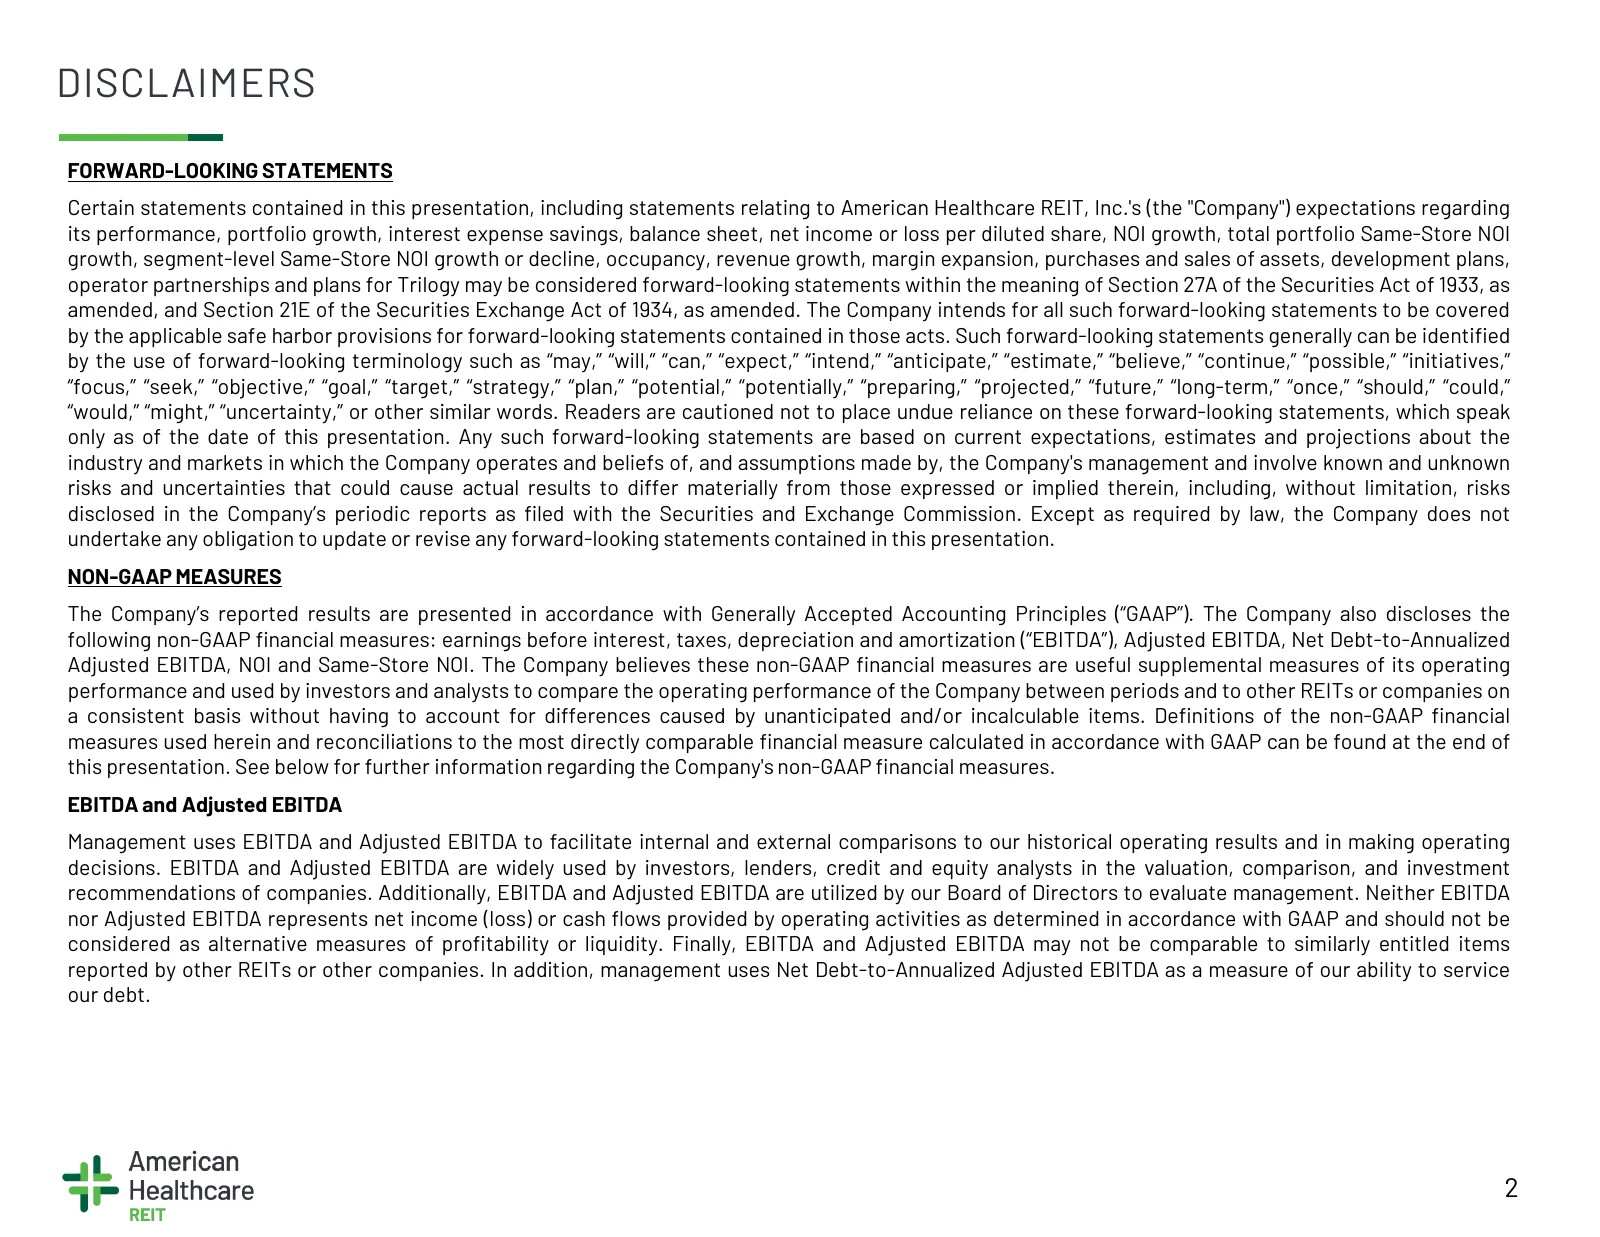
DISCLAIMERS FORWARD-LOOKING STATEMENTS Certain statements contained in this presentation, including statements relating to American Healthcare REIT, Inc.'s (the "Company") expectations regarding its performance, portfolio growth, interest expense savings, balance sheet, net income or loss per dilute
Slide 3: Disclaimers (Cont'd)
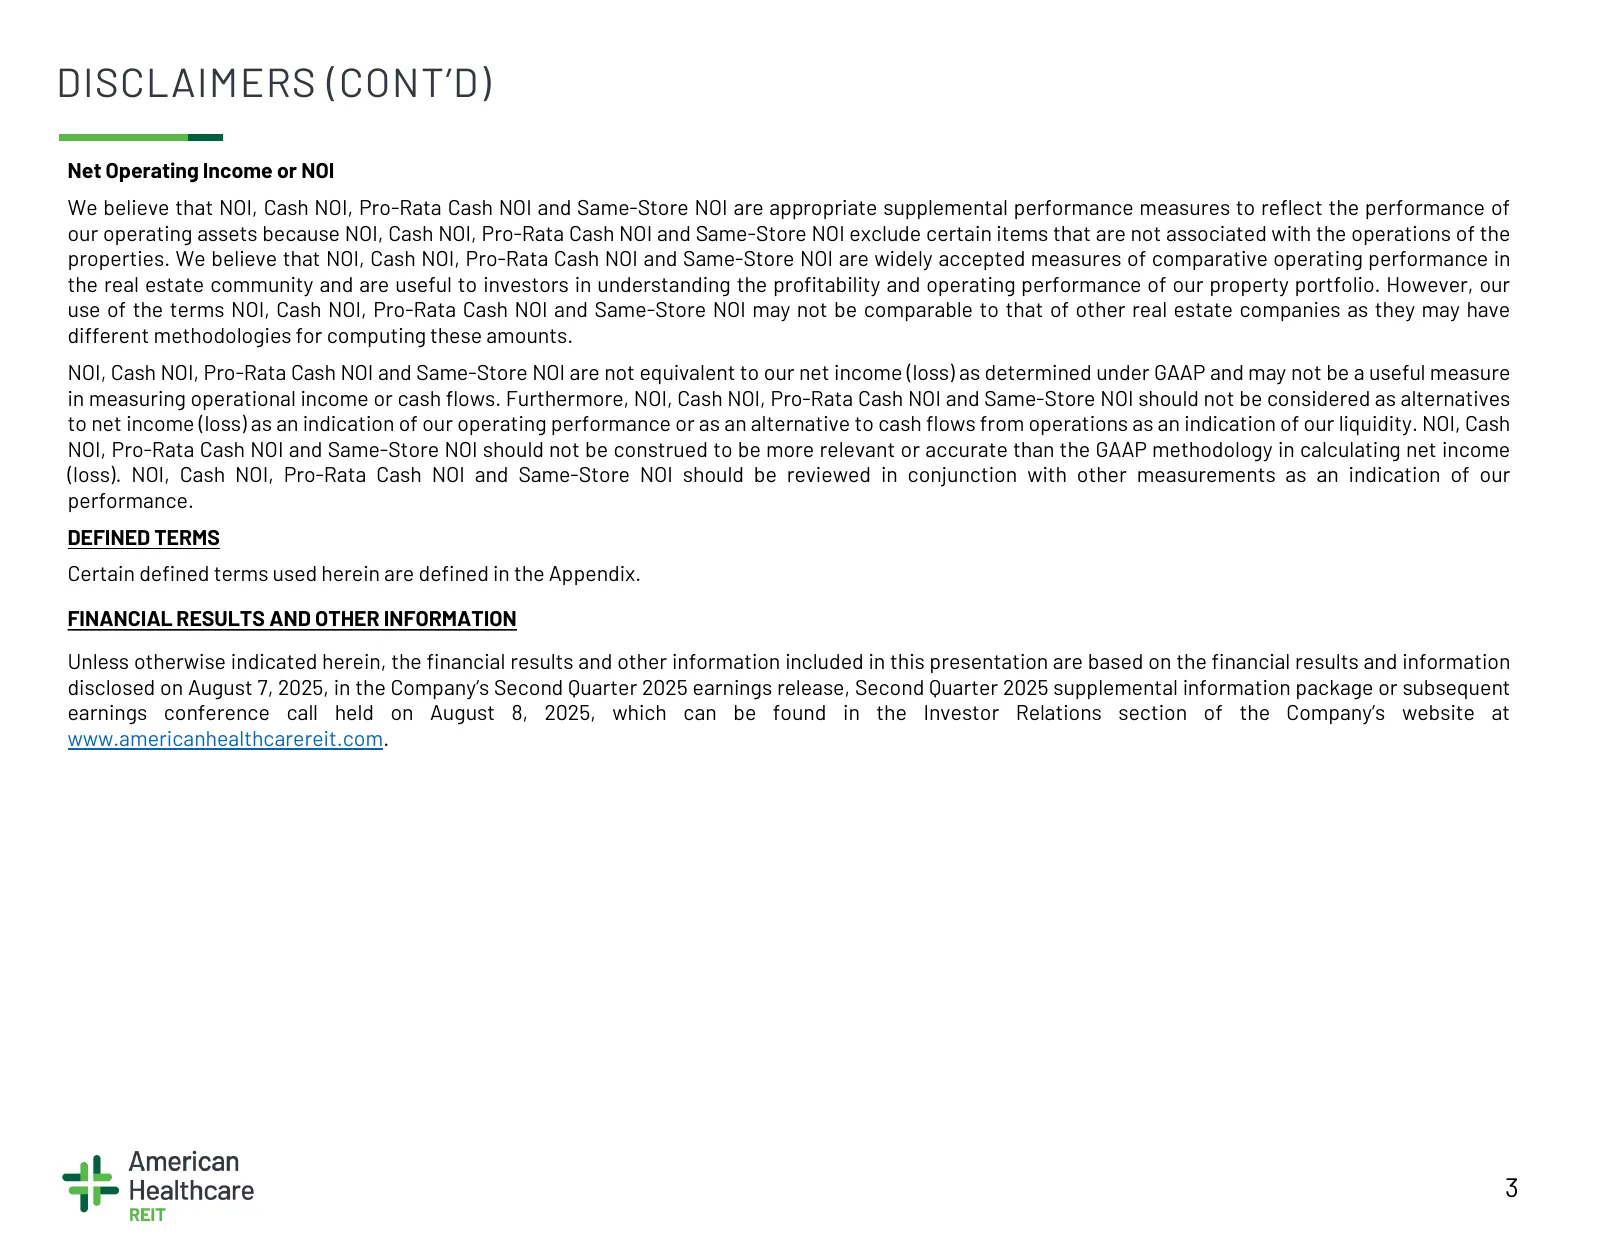
DISCLAIMERS (CONT’D) Net Operating Income or NOI We believe that NOI, Cash NOI, Pro-Rata Cash NOI and Same-Store NOI are appropriate supplemental performance measures to reflect the performance of our operating assets because NOI, Cash NOI, Pro-Rata Cash NOI and Same-Store NOI exclude certain items
Slide 4: Management Participants
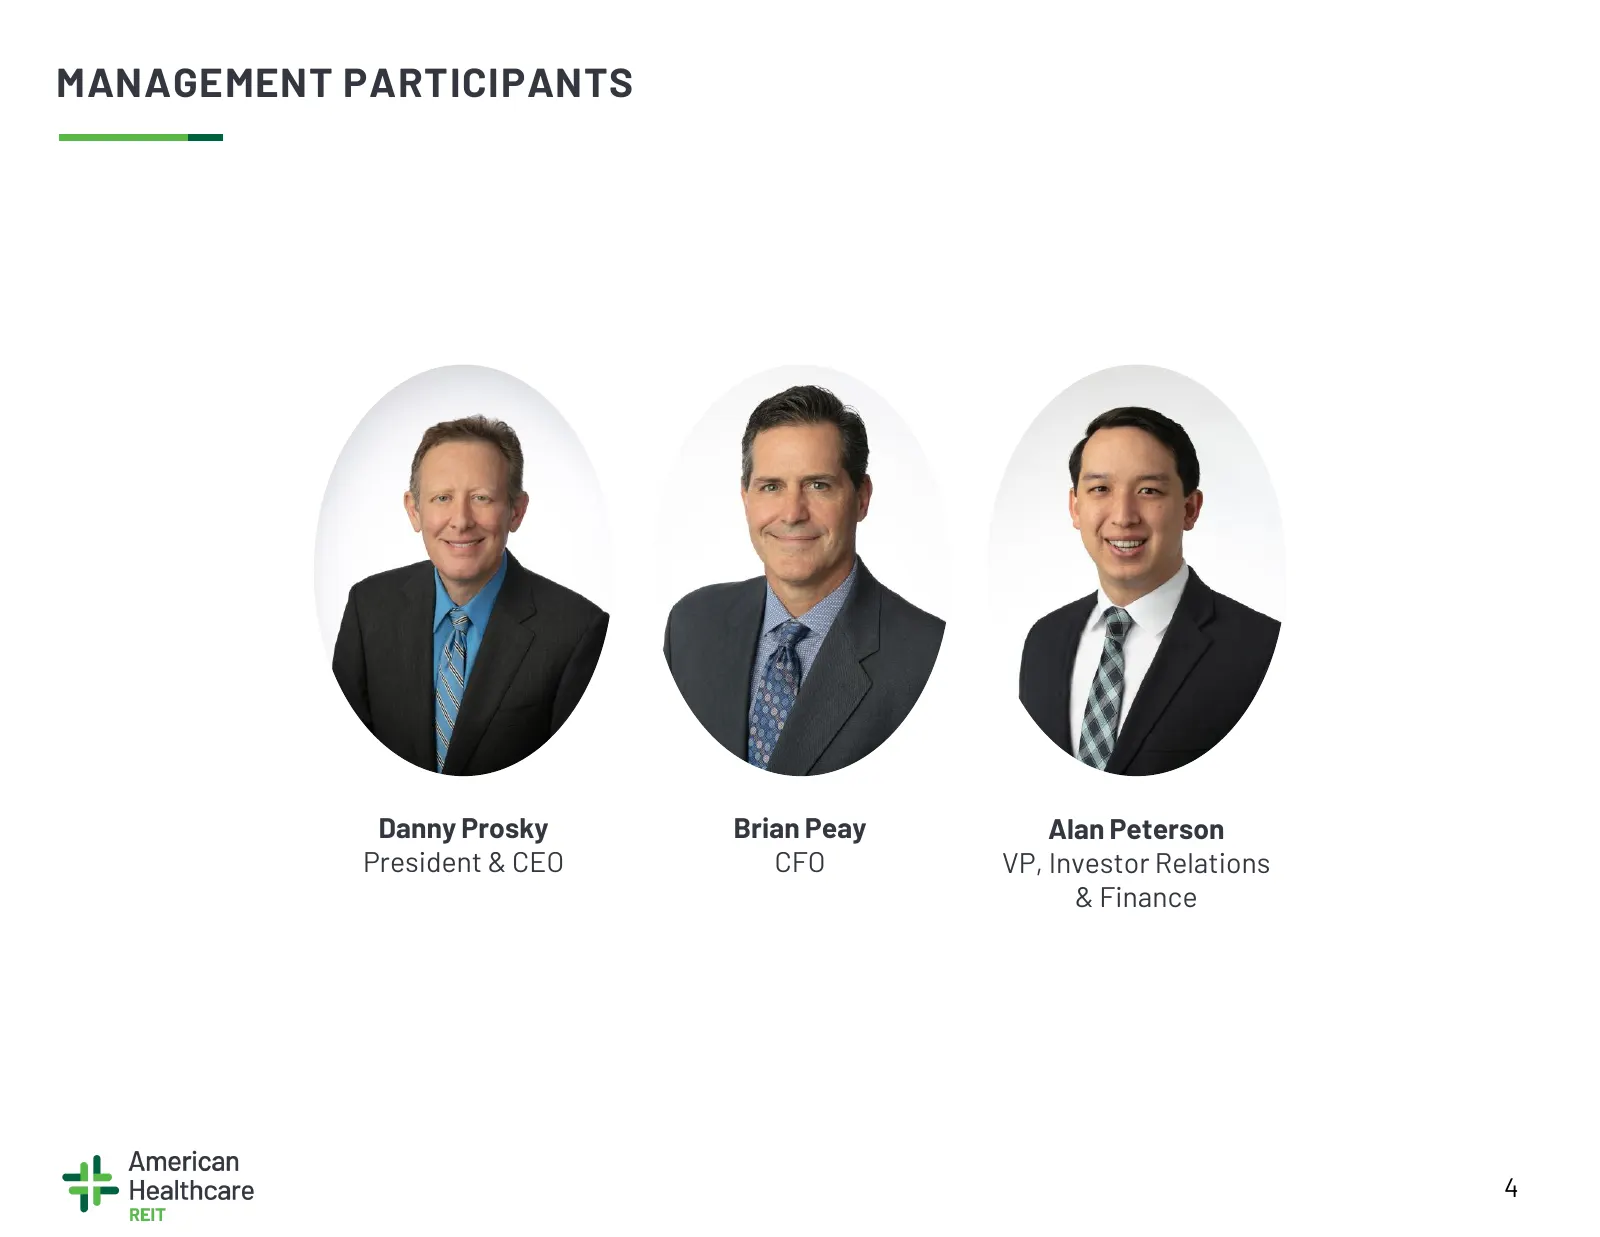
MANAGEMENT PARTICIPANTS Danny Prosky Brian Peay Alan Peterson President & CEO CFO VP, Investor Relations & Finance 4
Slide 5: Recent Highlights
RECENT HIGHLIGHTS
Slide 6: Recent Highlights | Q2 2025 Portfolio Performance
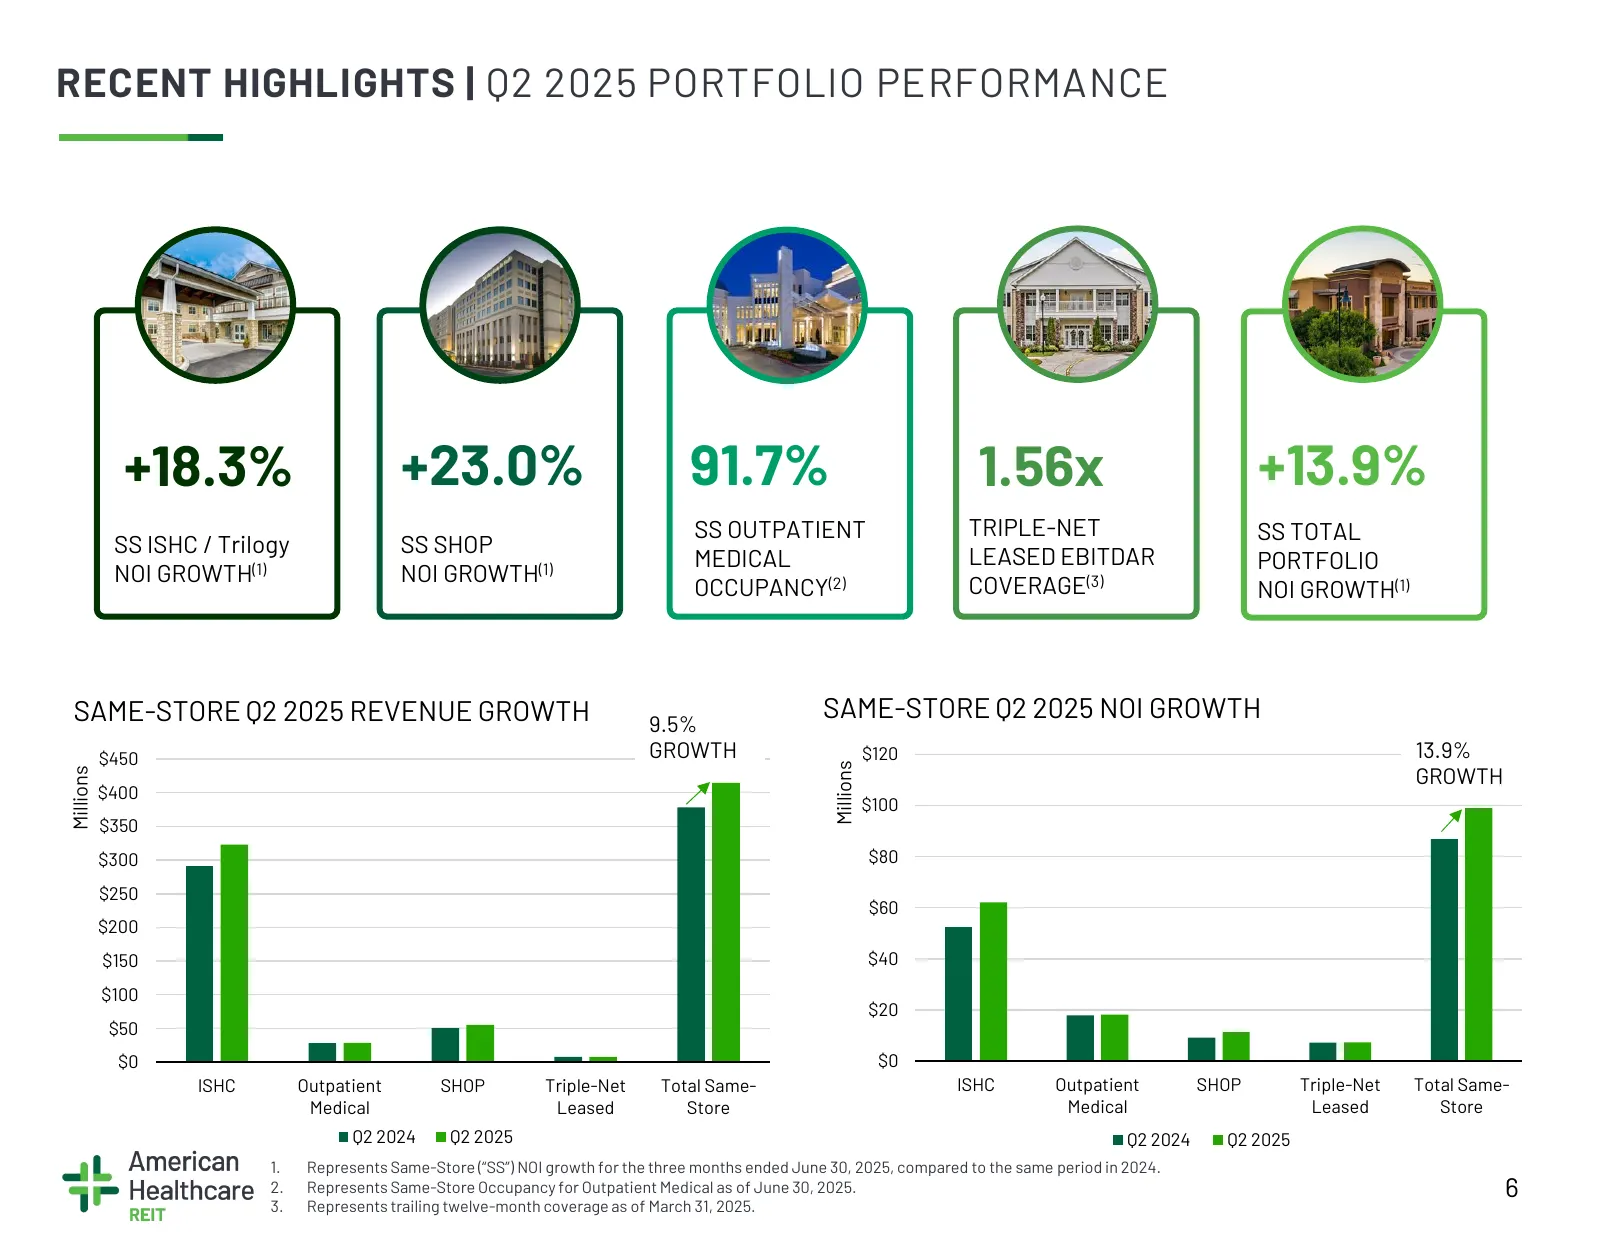
RECENT HIGHLIGHTS | Q2 2025 PORTFOLIO PERFORMANCE +18.3% +23.0% 91.7% 1.56x +13.9% SS OUTPATIENT TRIPLE-NET SS TOTAL SS ISHC / Trilogy SS SHOP MEDICAL LEASED EBITDAR PORTFOLIO NOI GROWTH(1) NOI GROWTH(1) OCCUPANCY(2) COVERAGE(3) NOI GROWTH(1) SAME-STORE Q2 2025 REVENUE GROWTH 9.5% SAME-STORE Q2 2025
Slide 7: Q2 2025 Performance & 2025 NOI Growth Guidance
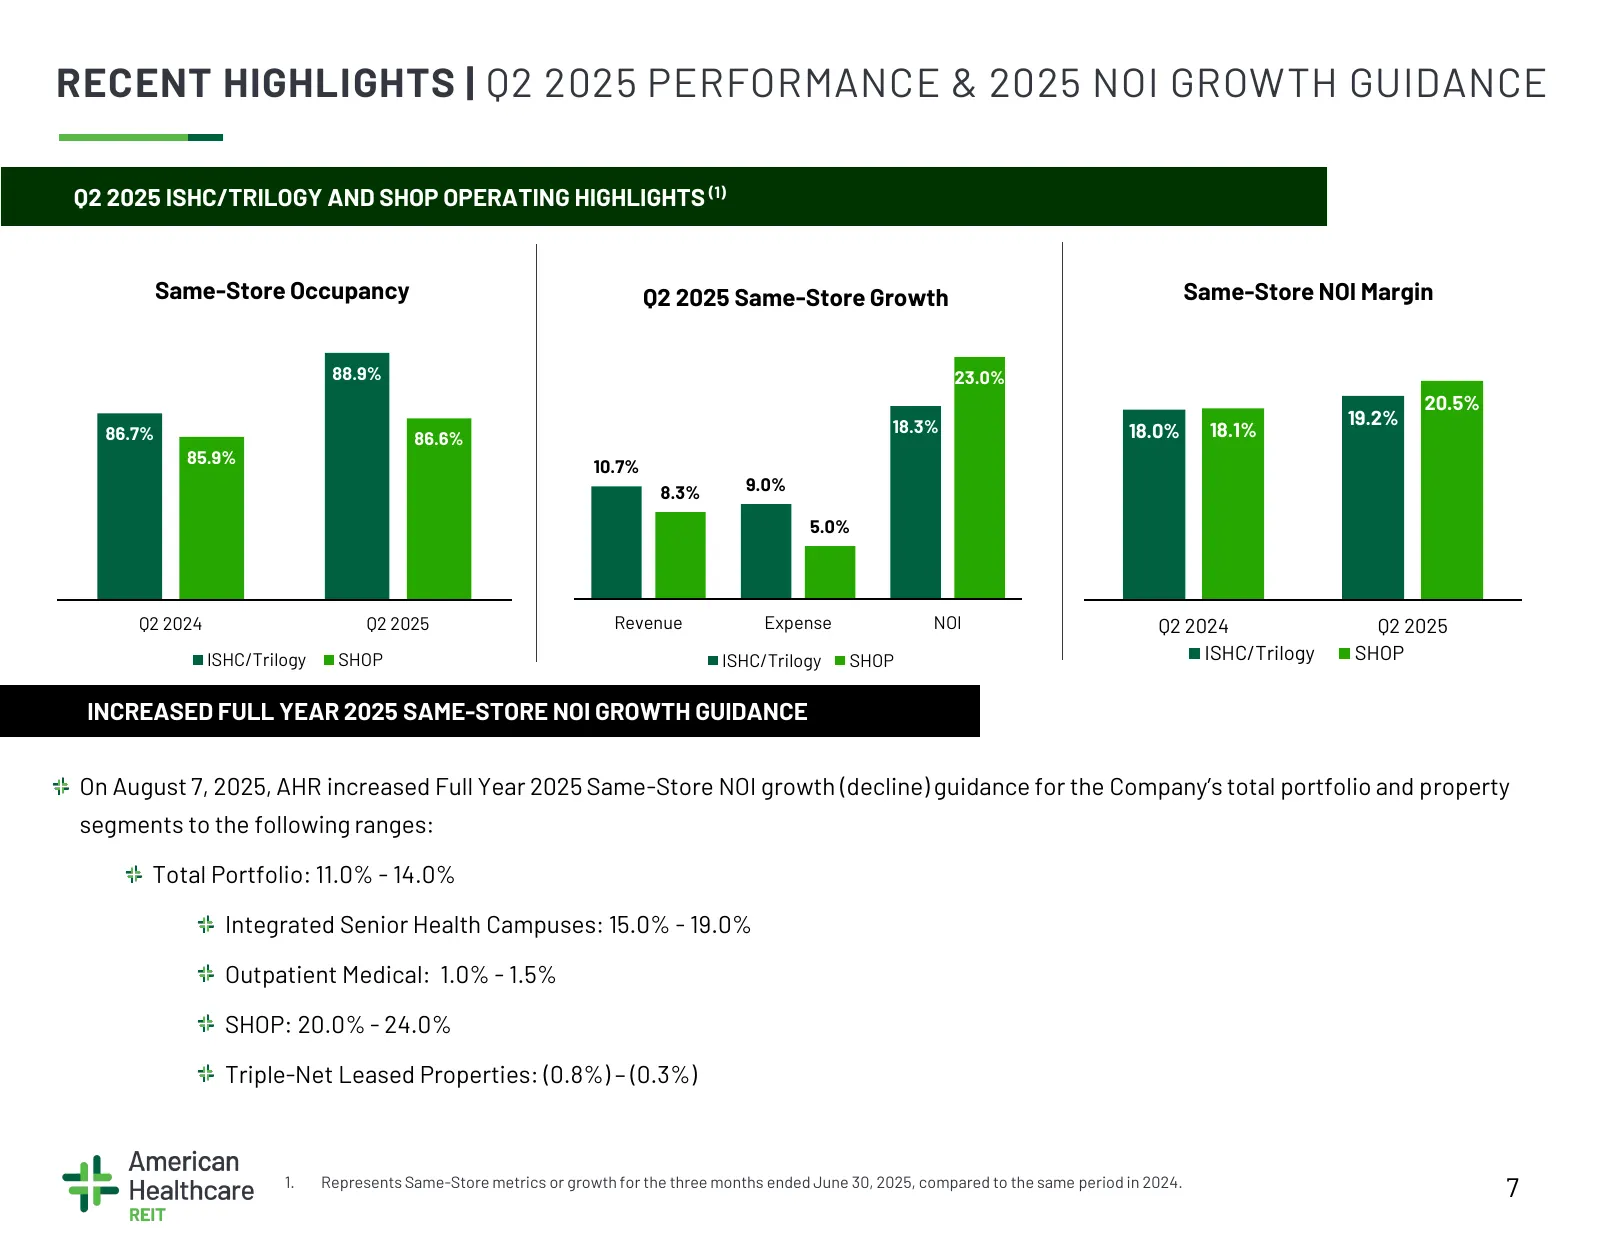
RECENT HIGHLIGHTS | Q2 2025 PERFORMANCE & 2025 NOI GROWTH GUIDANCE Q2 2025 ISHC/TRILOGY AND SHOP OPERATING HIGHLIGHTS (1) Same-Store Occupancy Q2 2025 Same-Store Growth Same-Store NOI Margin 88.9% 23.0% 20.5% 18.3% 19.2% 86.7% 86.6% 18.0% 18.1% 85.9% 10.7% 8.3% 9.0% 5.0% Q2 2024 Q2 2025 Revenue Expe
Slide 8: Recent Highlights | External Growth & Pipeline
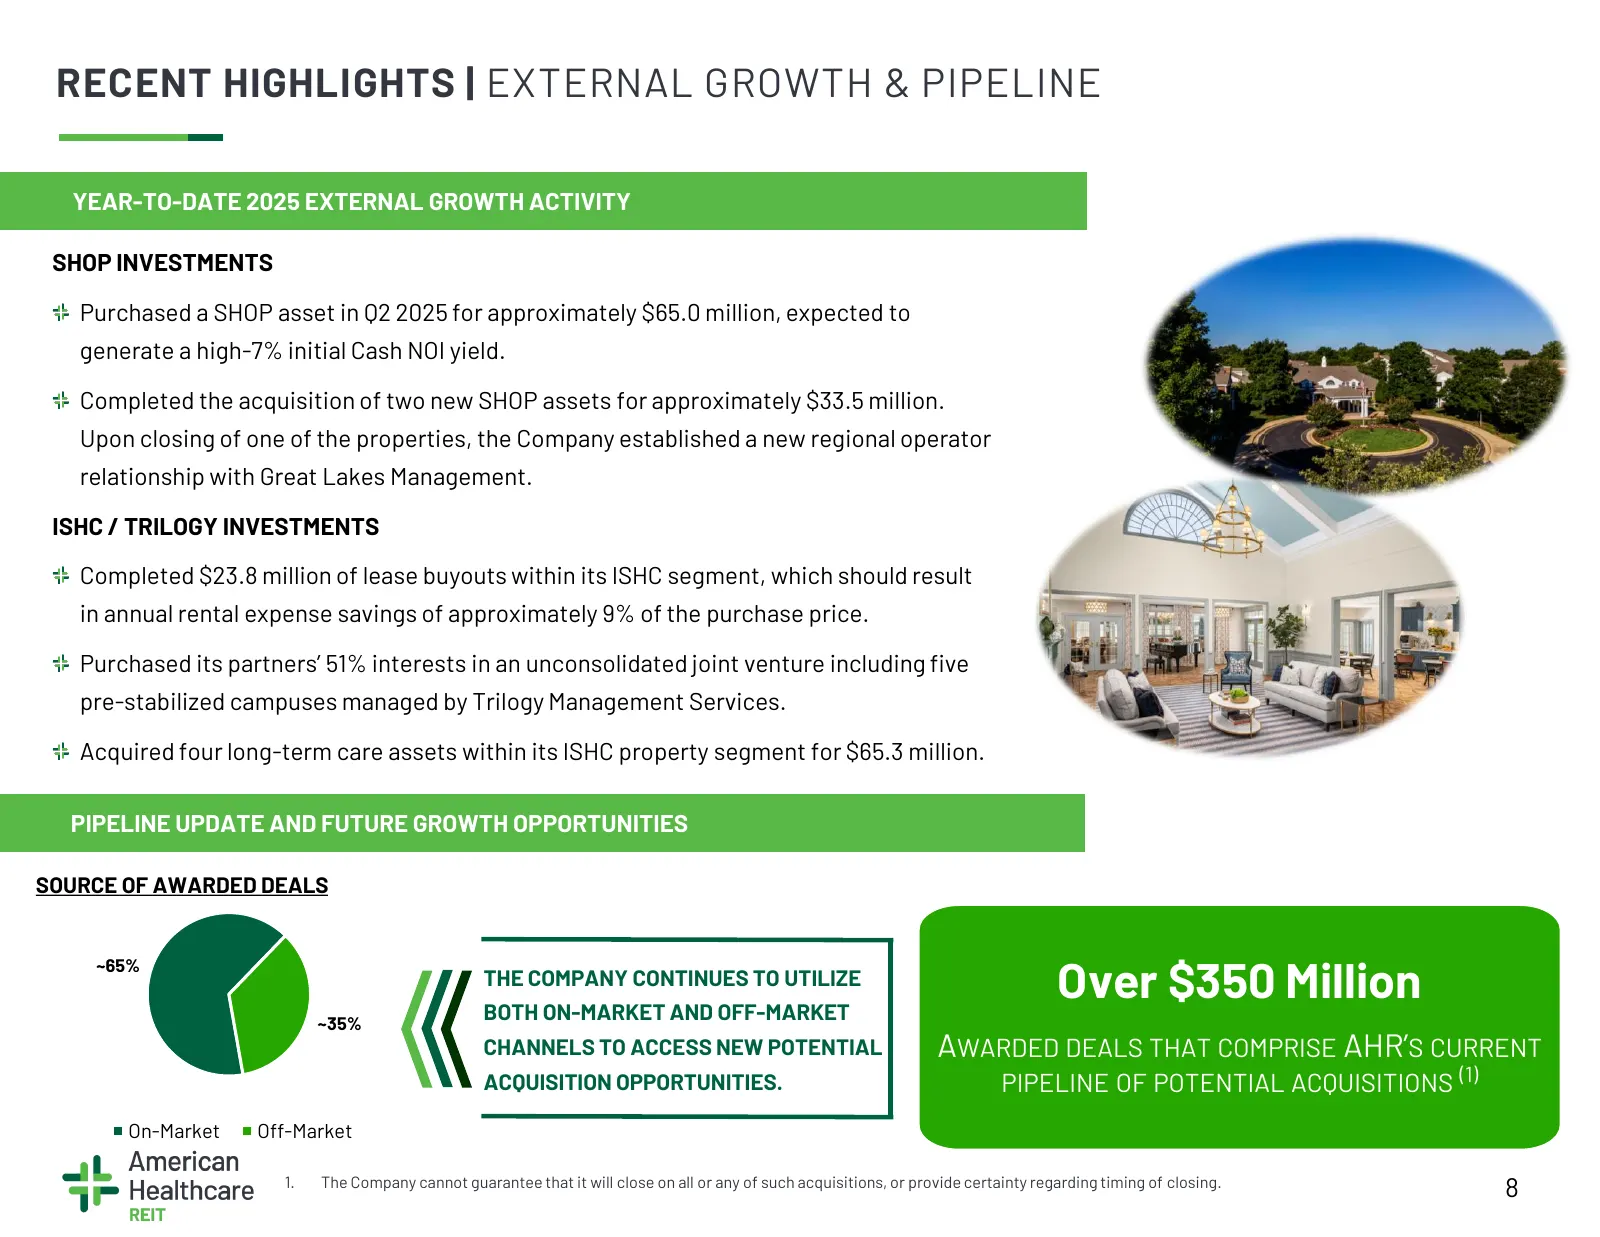
RECENT HIGHLIGHTS | EXTERNAL GROWTH & PIPELINE YEAR-TO-DATE 2025 EXTERNAL GROWTH ACTIVITY SHOP INVESTMENTS Purchased a SHOP asset in Q2 2025 for approximately $65.0 million, expected to generate a high-7% initial Cash NOI yield. Completed the acquisition of two new SHOP assets for approximately $33.
Slide 9: AHR Overview
AHR OVERVIEW
Slide 10: Company Snapshot
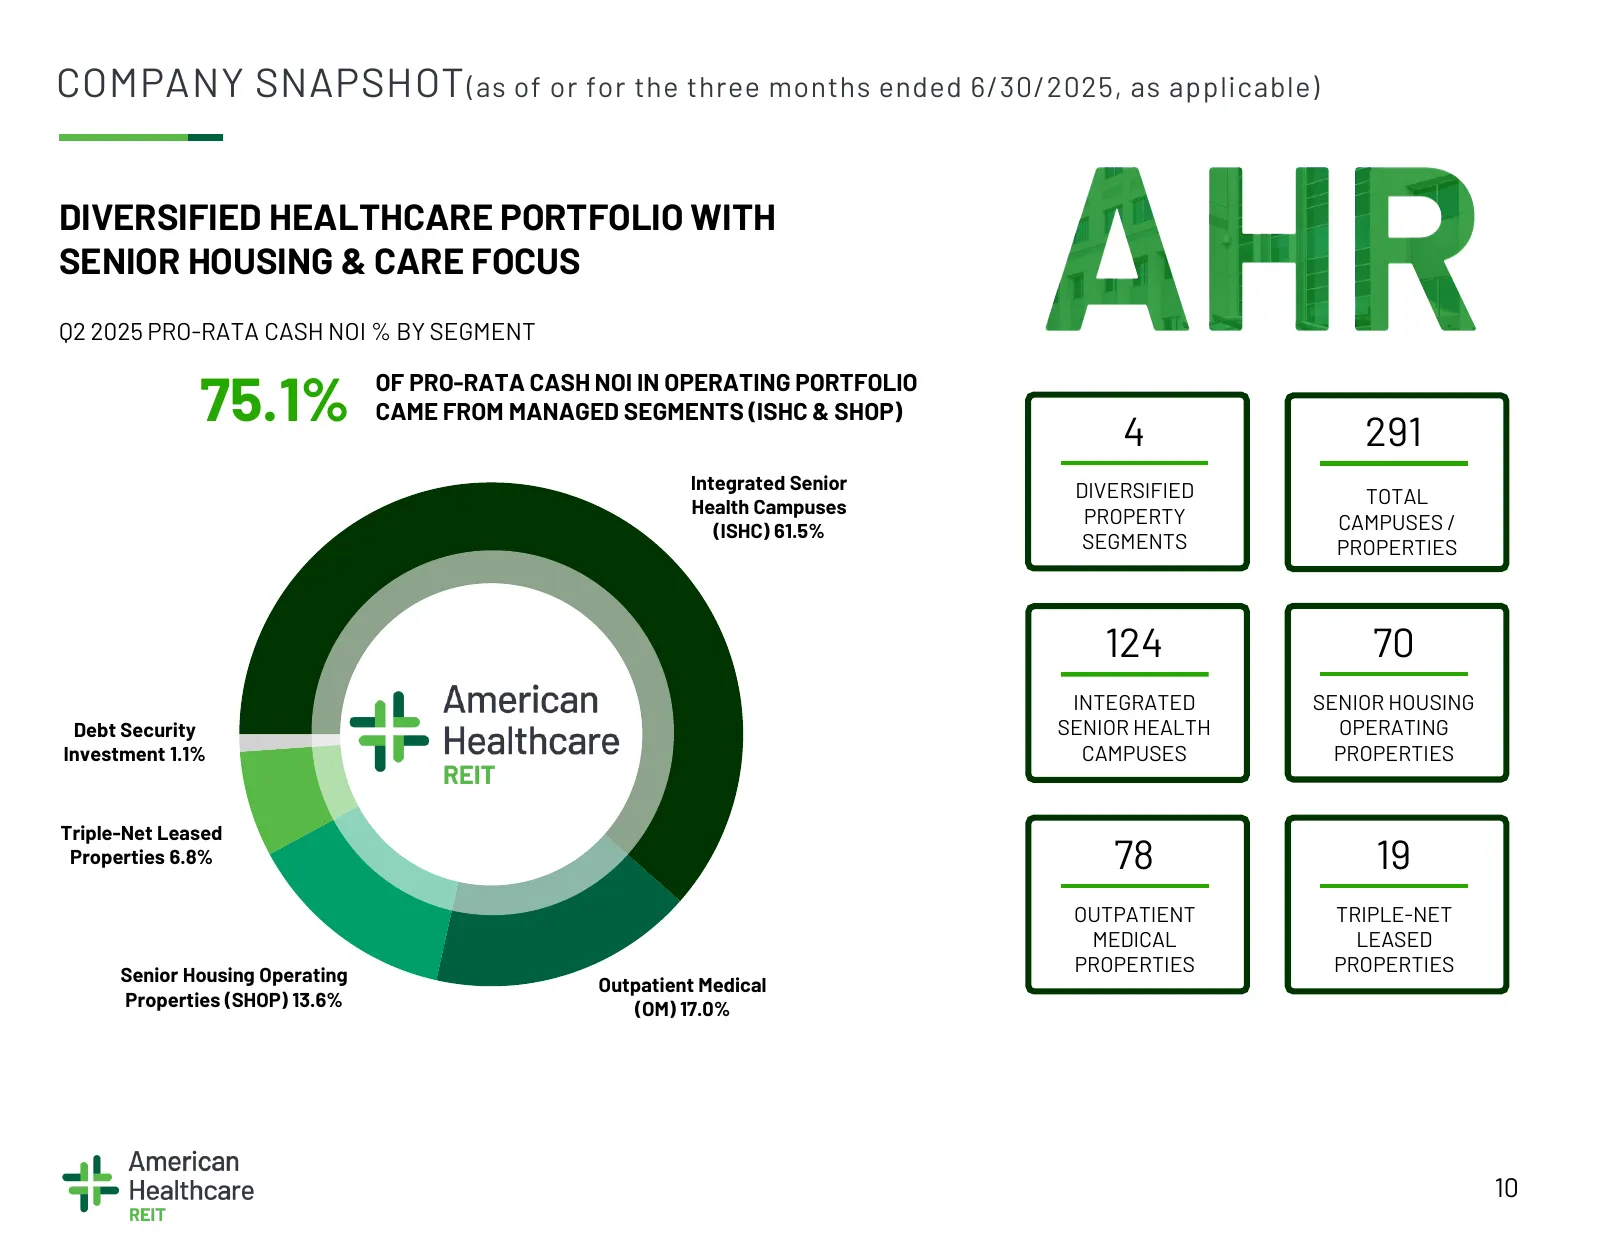
COMPANY SNAPSHOT (as of or for the three months ended 6/30/2025, as applicable) DIVERSIFIED HEALTHCARE PORTFOLIO WITH SENIOR HOUSING & CARE FOCUS Q2 2025 PRO-RATA CASH NOI % BY SEGMENT 75.1% OF PRO-RATA CASH NOI IN OPERATING PORTFOLIO CAME FROM MANAGED SEGMENTS (ISHC & SHOP) AHR 4 291 Integrated Sen
Slide 11: Portfolio Key Stats
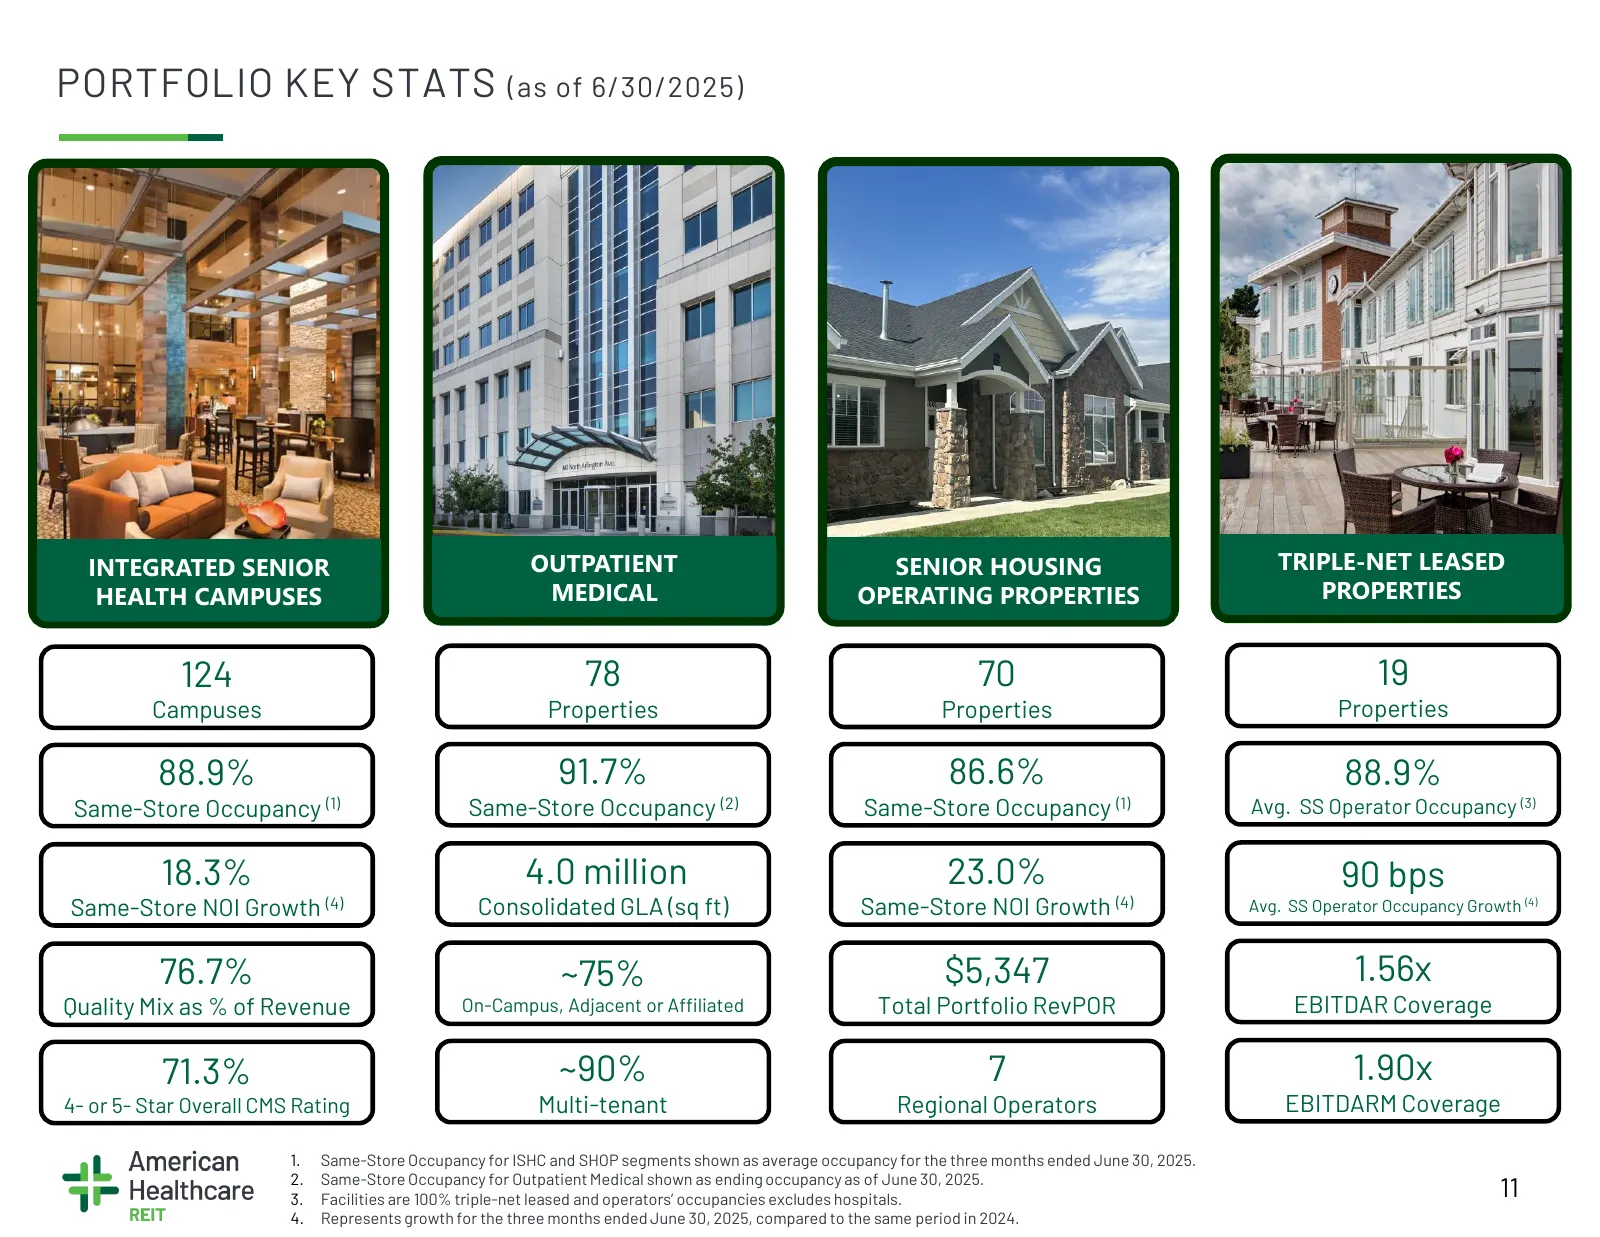
PORTFOLIO KEY STATS (as of 6/30/2025) INTEGRATED SENIOR OUTPATIENT SENIOR HOUSING TRIPLE-NET LEASED HEALTH CAMPUSES MEDICAL OPERATING PROPERTIES PROPERTIES 124 78 70 19 Campuses Properties Properties Properties 88.9% 91.7% 86.6% 88.9% Same-Store Occupancy (1) Same-Store Occupancy (2) Same-Store Occu
Slide 12: Senior Housing & Care Trends
SENIOR HOUSING & CARE TRENDS
Slide 13: Senior Housing Supply / Demand Fundamentals
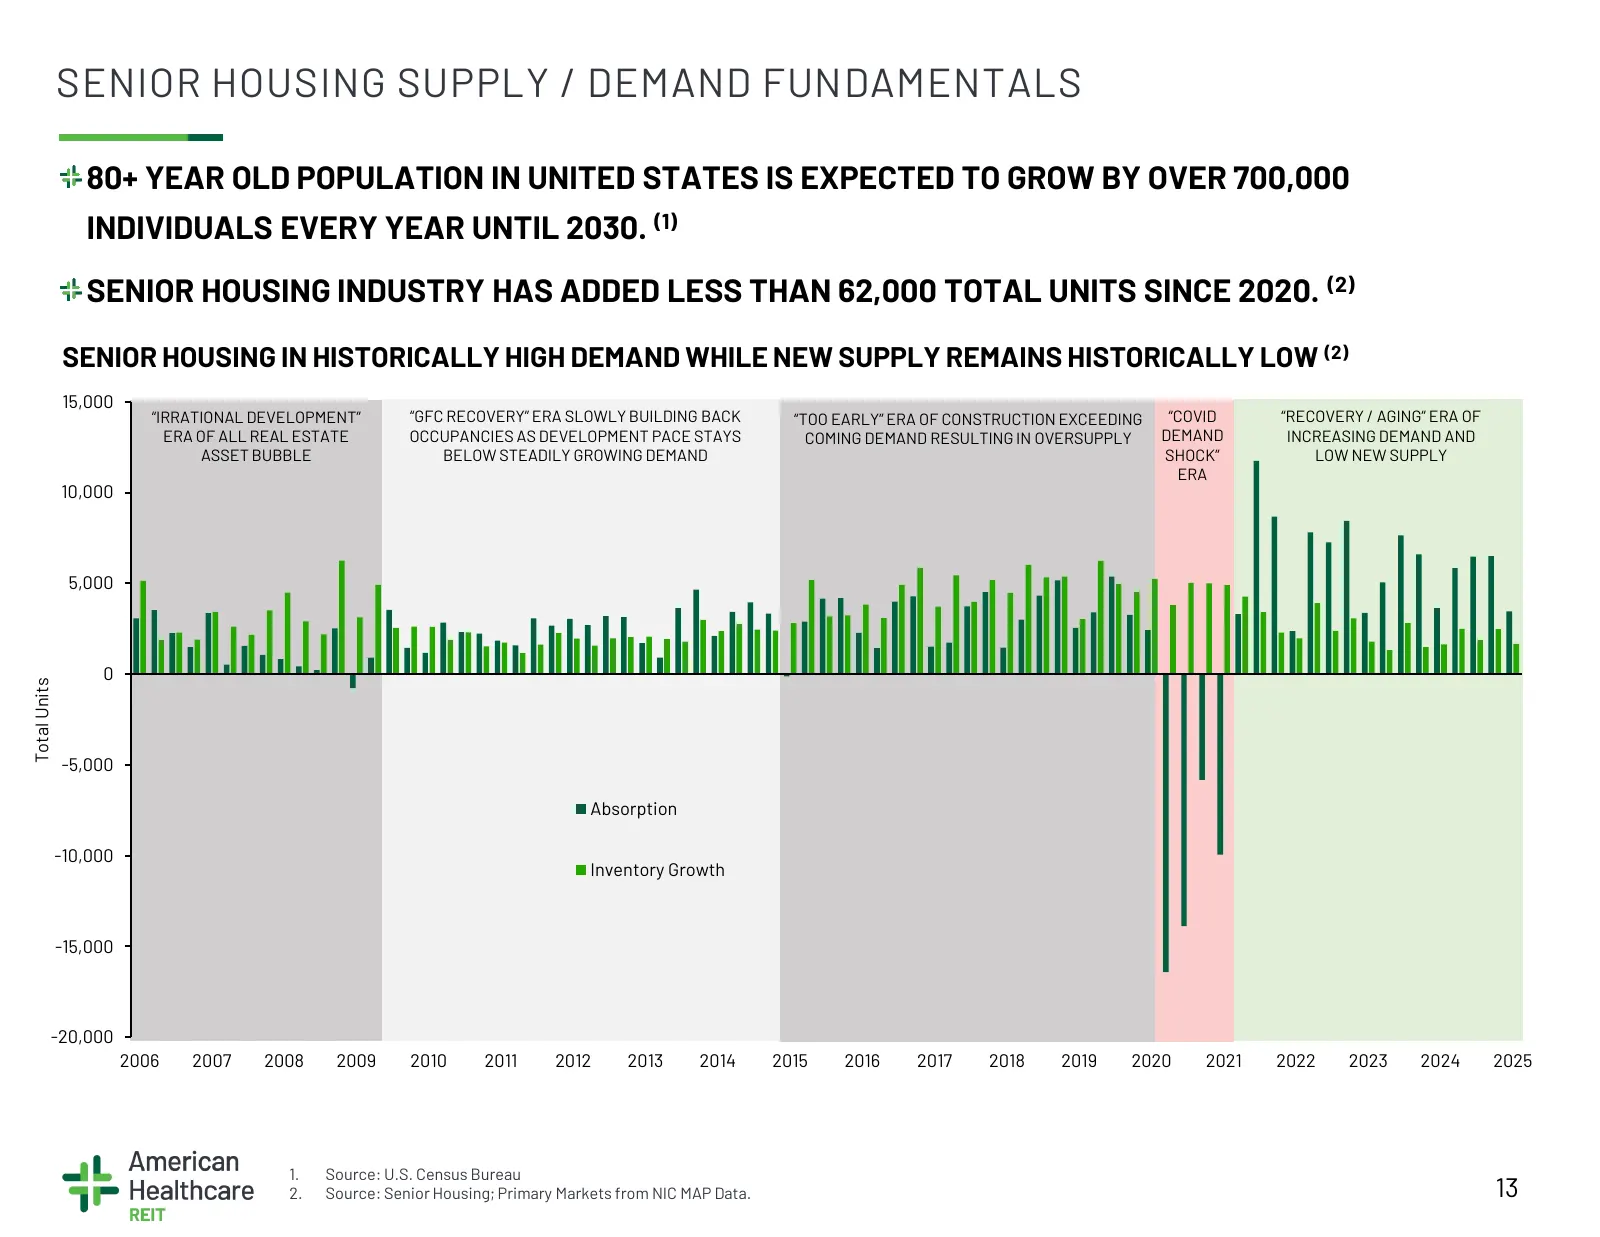
SENIOR HOUSING SUPPLY / DEMAND FUNDAMENTALS 80+ YEAR OLD POPULATION IN UNITED STATES IS EXPECTED TO GROW BY OVER 700,000 INDIVIDUALS EVERY YEAR UNTIL 2030. (1) SENIOR HOUSING INDUSTRY HAS ADDED LESS THAN 62,000 TOTAL UNITS SINCE 2020. (2) SENIOR HOUSING IN HISTORICALLY HIGH DEMAND WHILE NEW SUPPLY R
Slide 14: Gap Between New Supply and Demand Expected to Persist
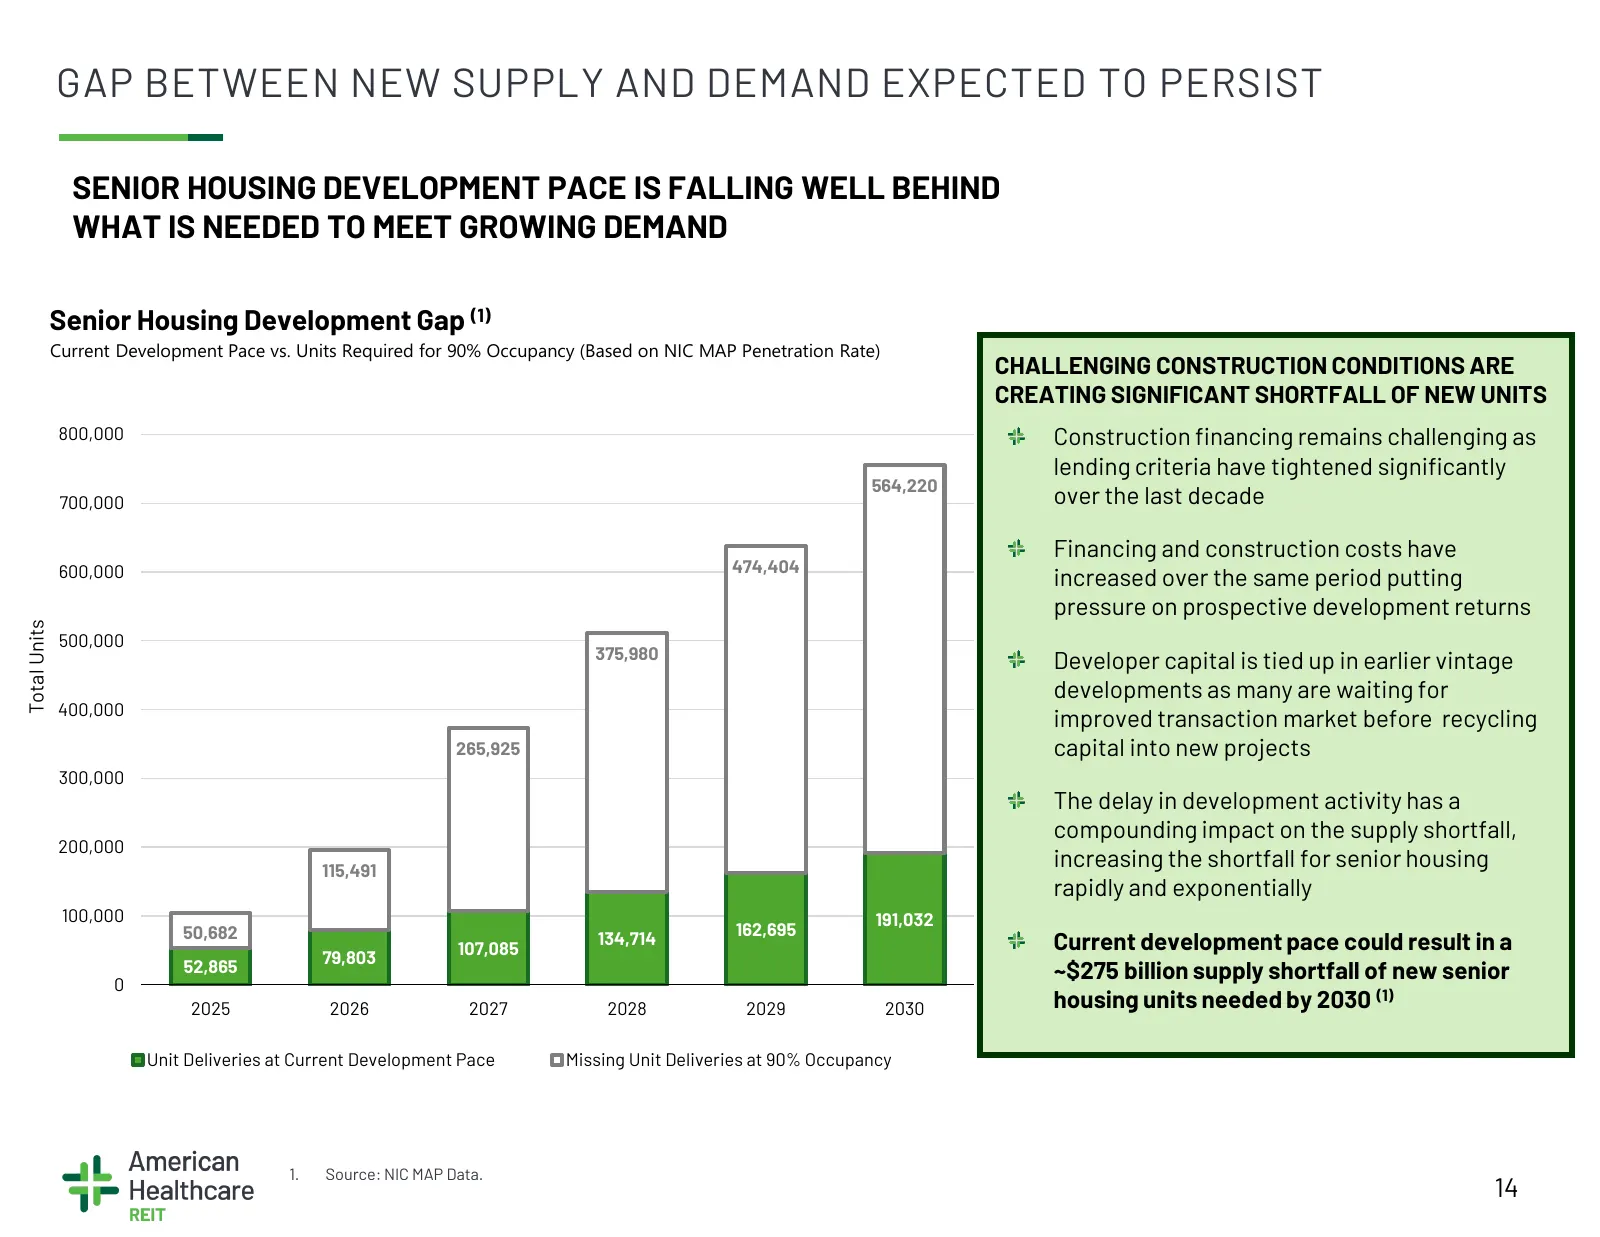
GAP BETWEEN NEW SUPPLY AND DEMAND EXPECTED TO PERSIST SENIOR HOUSING DEVELOPMENT PACE IS FALLING WELL BEHIND WHAT IS NEEDED TO MEET GROWING DEMAND Senior Housing Development Gap (1) Current Development Pace vs. Units Required for 90% Occupancy (Based on NIC MAP Penetration Rate) CHALLENGING CONSTRUC
Slide 15: Operating Portfolio
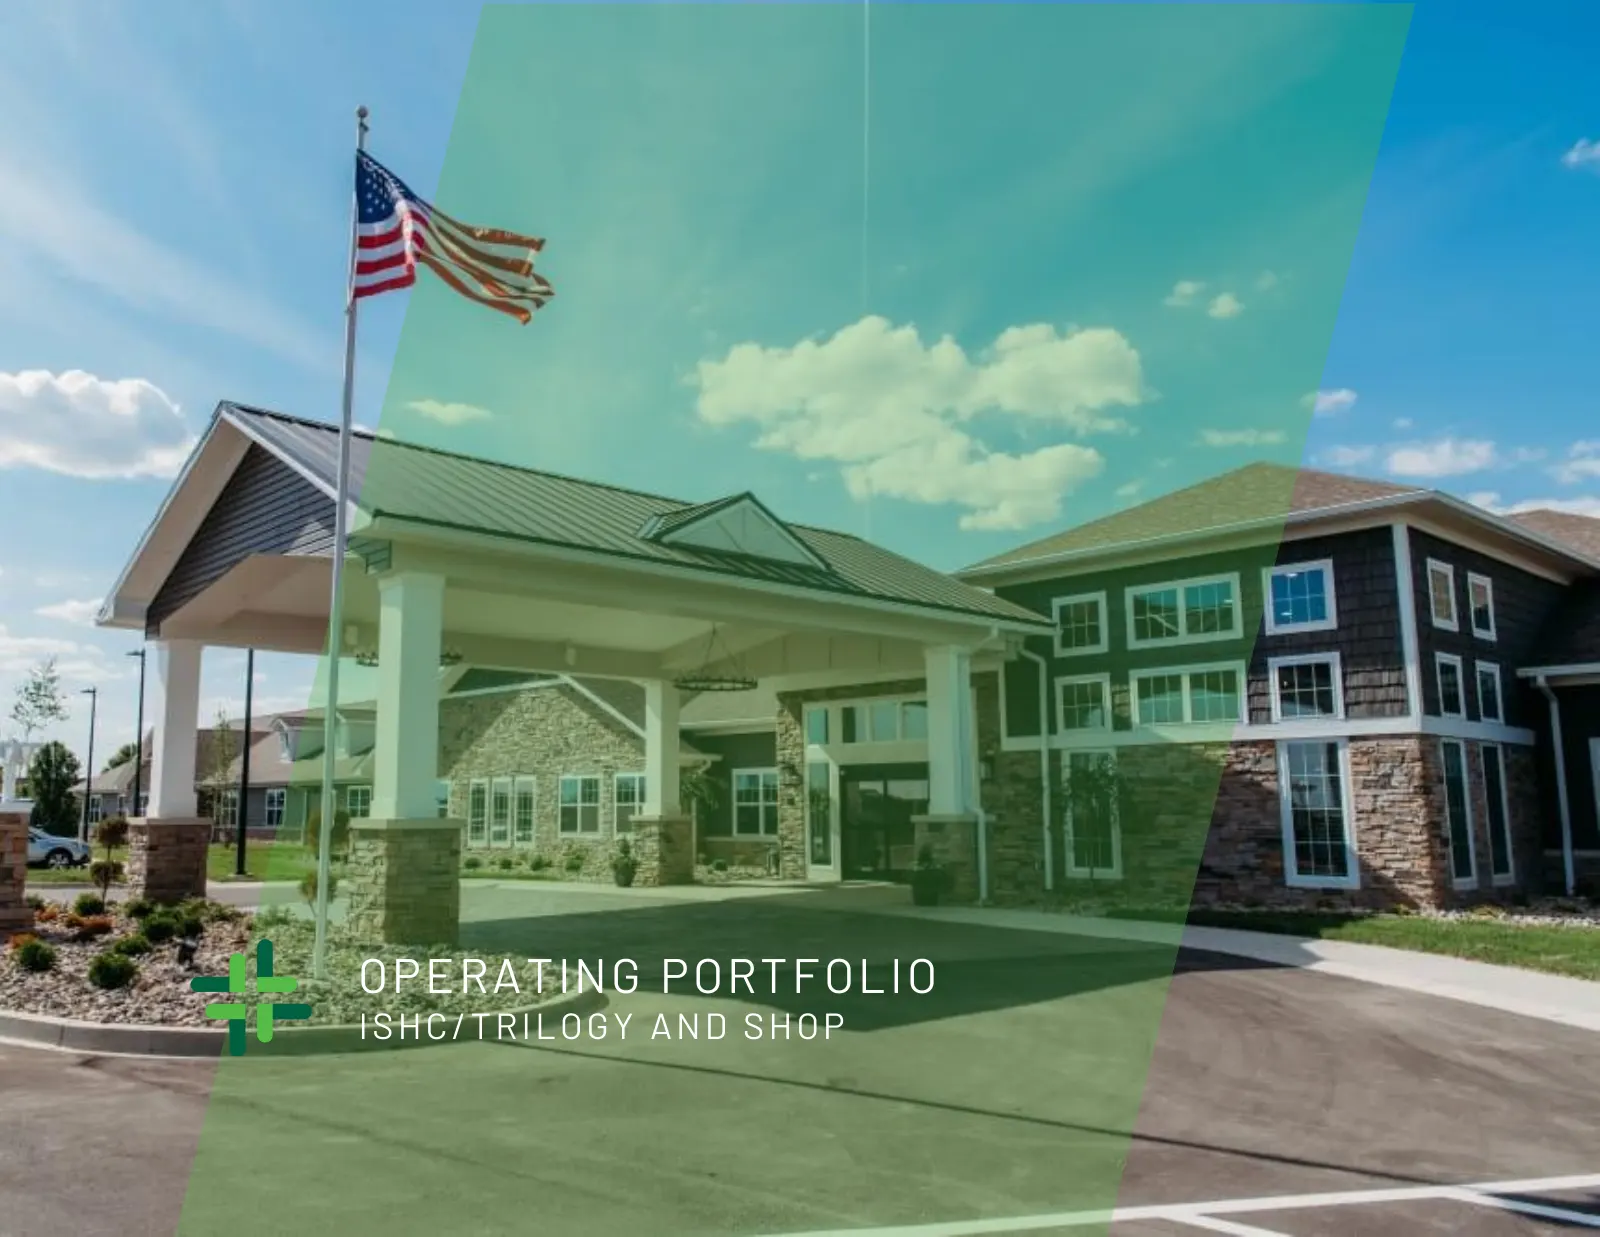
OPERATING PORTFOLIO ISHC/TRILOGY AND SHOP
Slide 16: Regional Focus and Operator Affiliations
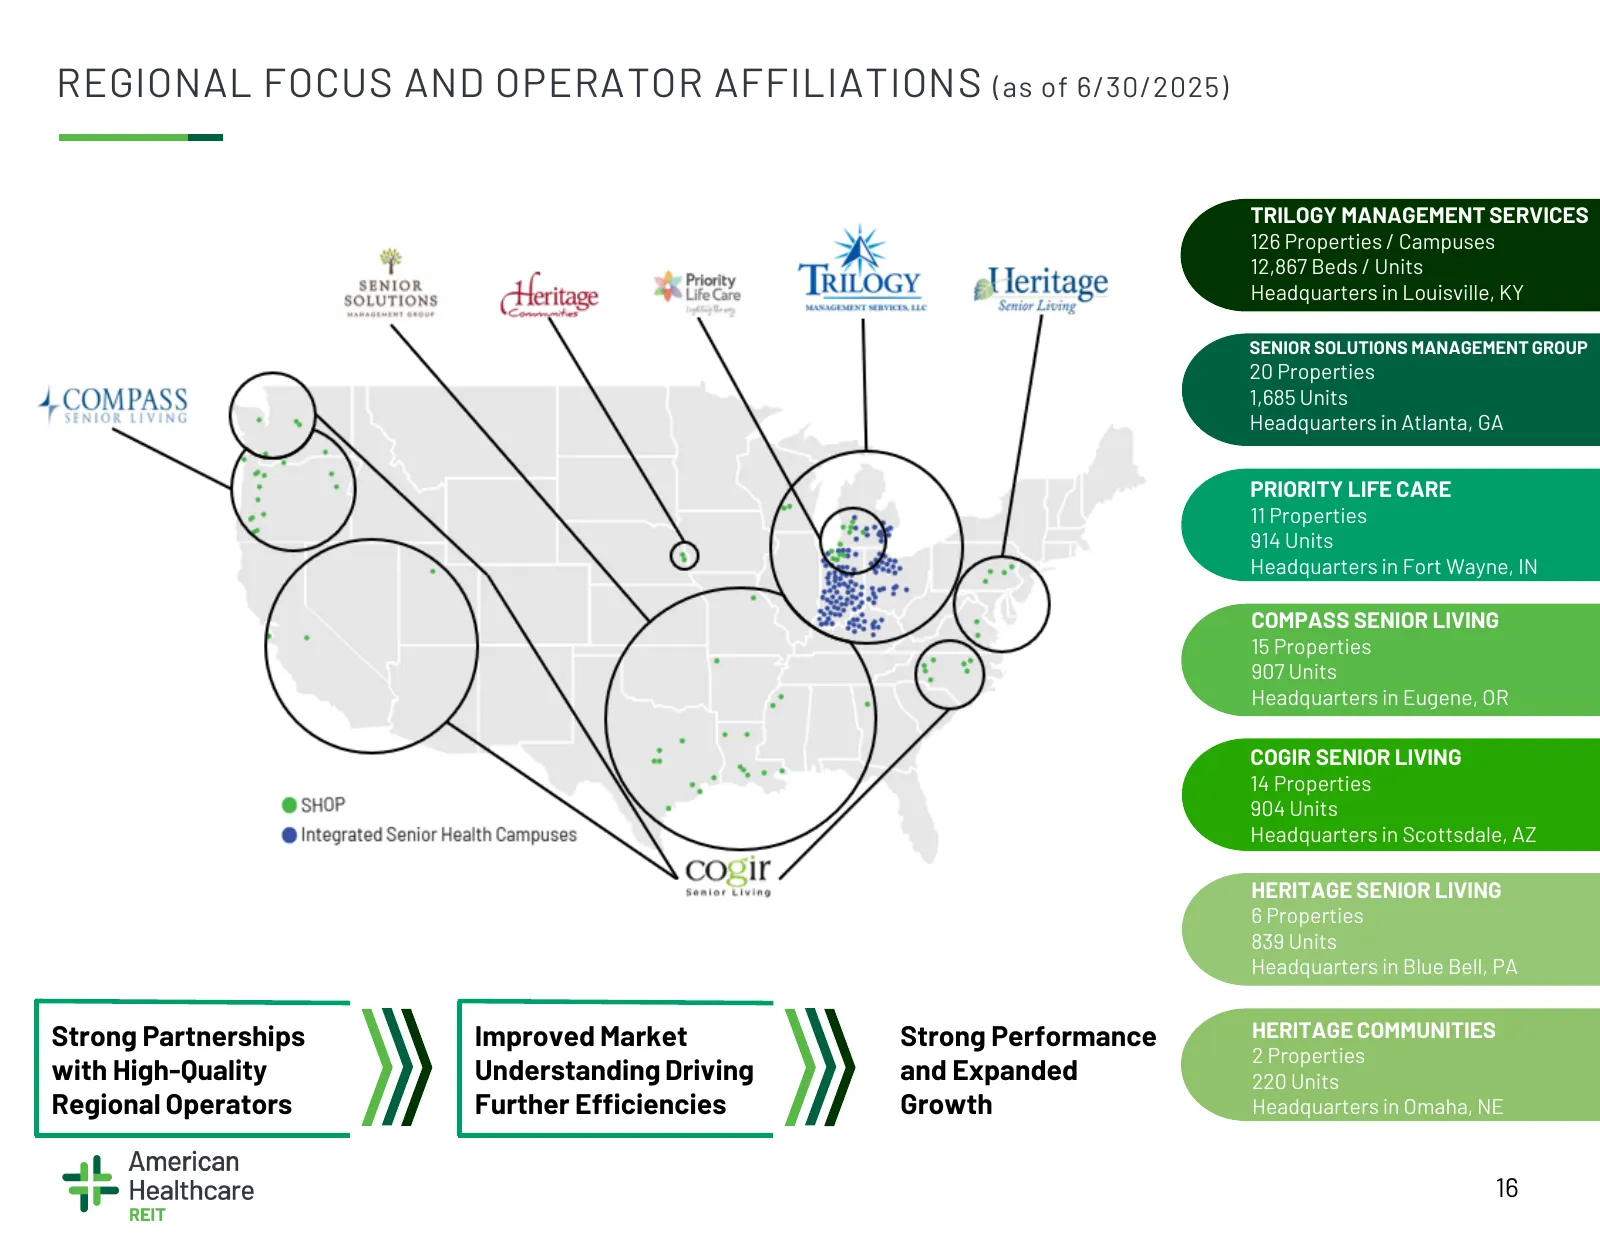
REGIONAL FOCUS AND OPERATOR AFFILIATIONS (as of 6/30/2025) TRILOGY MANAGEMENT SERVICES 126 Properties / Campuses 12,867 Beds / Units Headquarters in Louisville, KY SENIOR SOLUTIONS MANAGEMENT GROUP 20 Properties 1,685 Units Headquarters in Atlanta, GA PRIORITY LIFE CARE 11 Properties 914 Units Headq
Slide 17: Integrated Senior Health Campuses / Trilogy | Overview
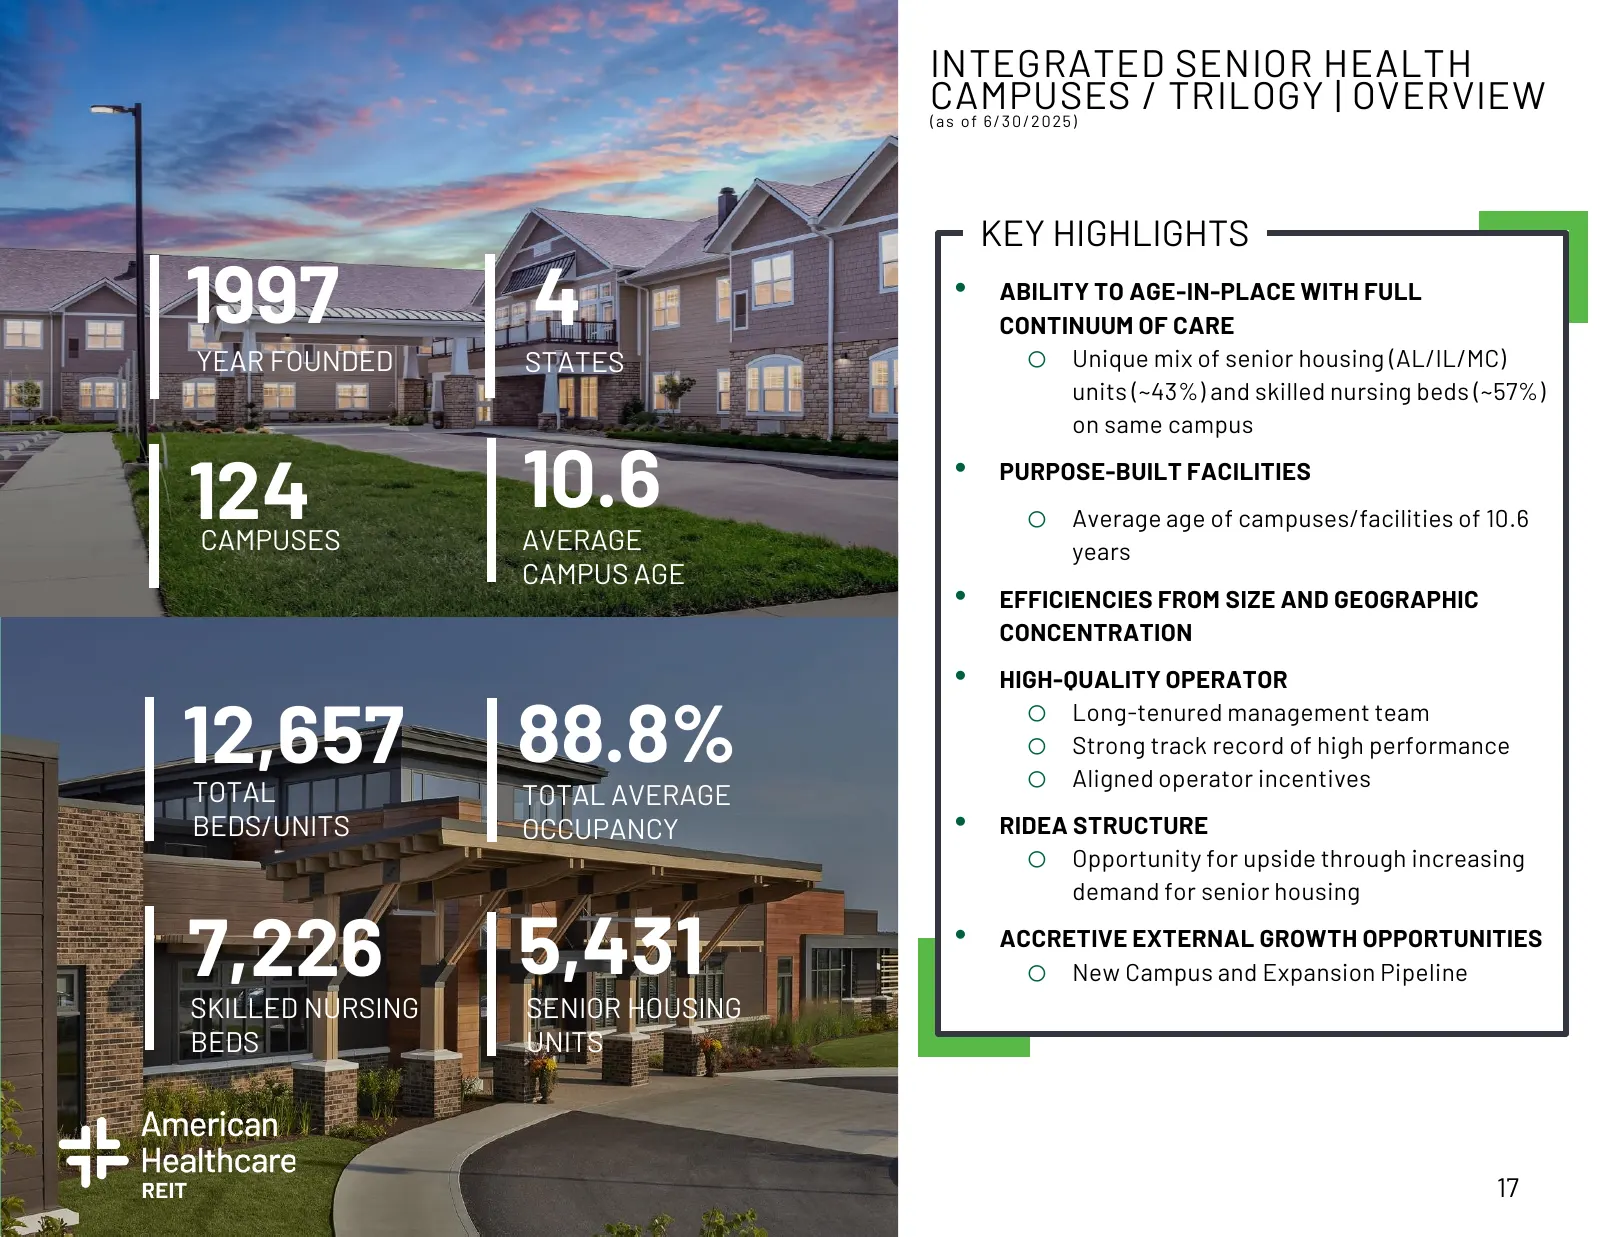
INTEGRATED SENIOR HEALTH CAMPUSES (as o f 6 / 3 0 / 2 0 25) / TRILOGY | OVERVIEW KEY HIGHLIGHTS 1997 4 • ABILITY TO AGE-IN-PLACE WITH FULL CONTINUUM OF CARE YEAR FOUNDED STATES o Unique mix of senior housing (AL/IL/MC) units (~43%) and skilled nursing beds (~57%) on same campus 124 10.6 • PURPOSE-BU
Slide 18: The Trilogy Concept – A Unique Design for Senior Care
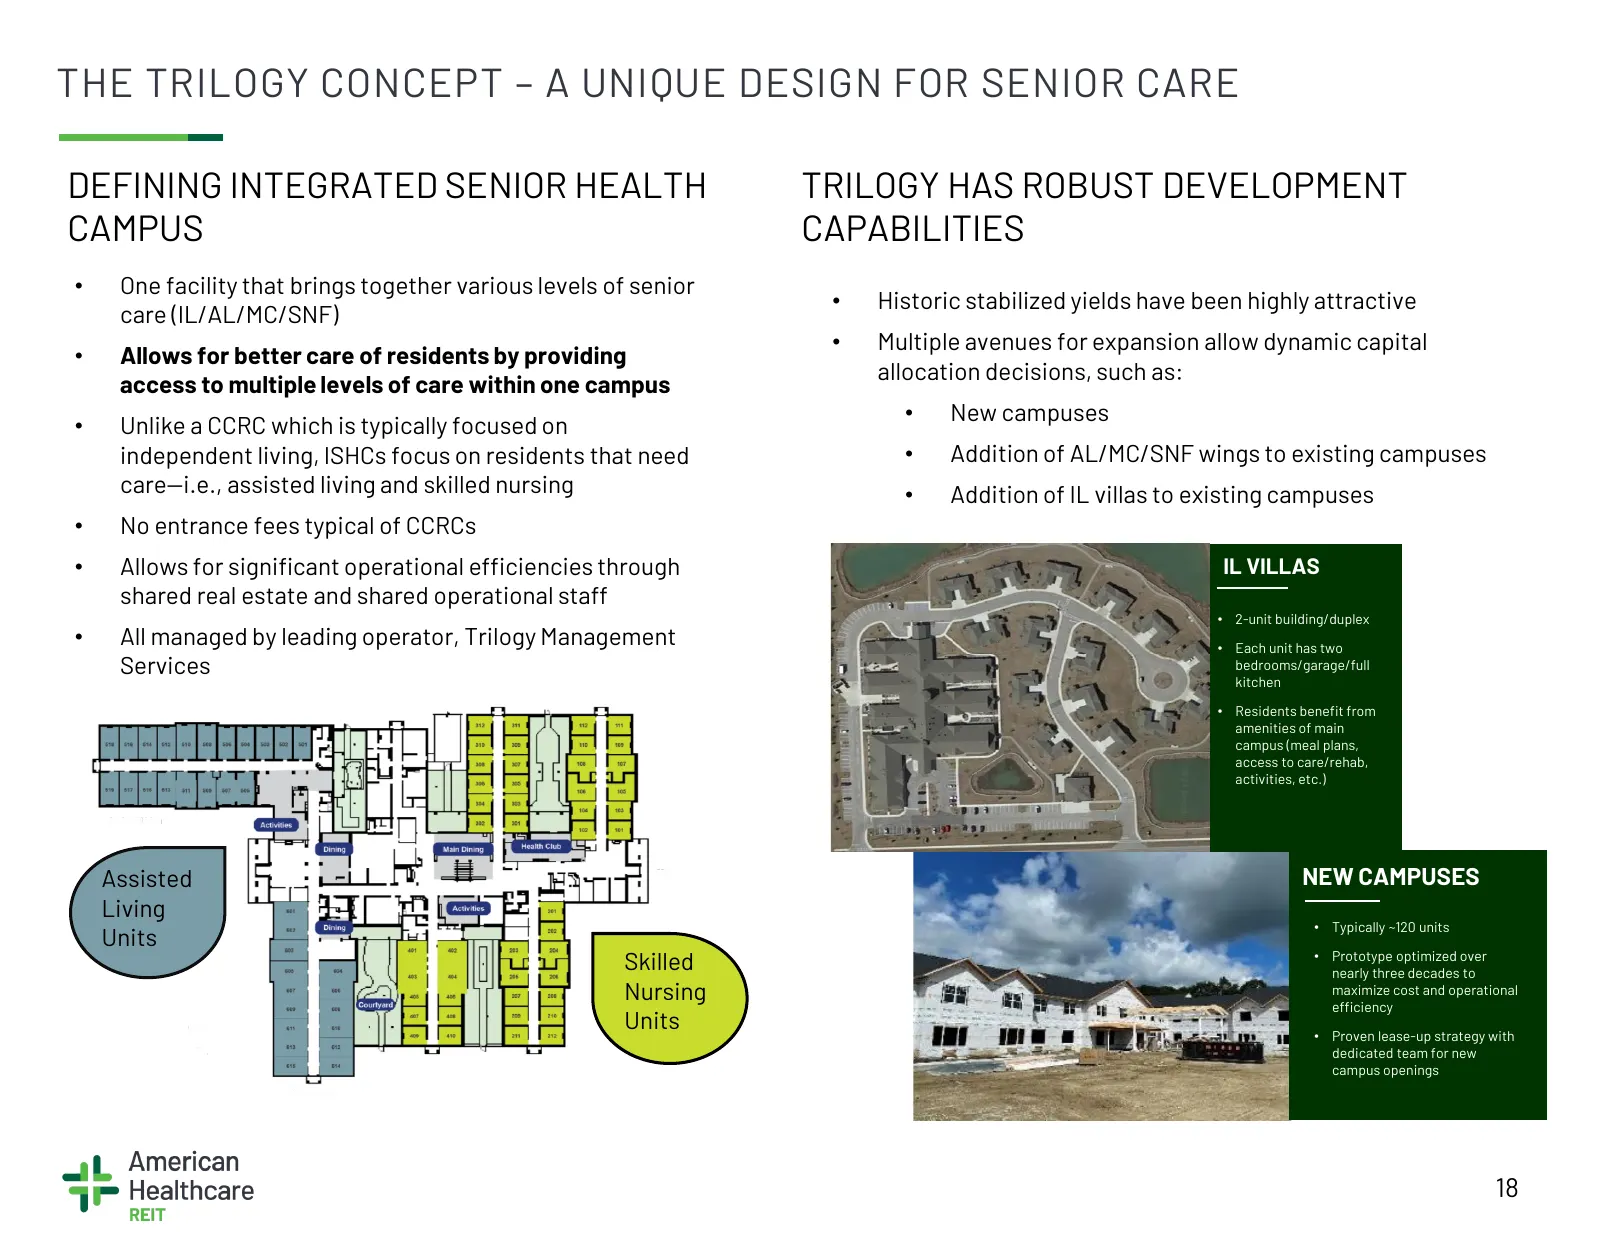
THE TRILOGY CONCEPT – A UNIQUE DESIGN FOR SENIOR CARE DEFINING INTEGRATED SENIOR HEALTH TRILOGY HAS ROBUST DEVELOPMENT CAMPUS CAPABILITIES • One facility that brings together various levels of senior • Historic stabilized yields have been highly attractive care (IL/AL/MC/SNF) • Multiple avenues for
Slide 19: Trilogy Keys to Competitive Advantage
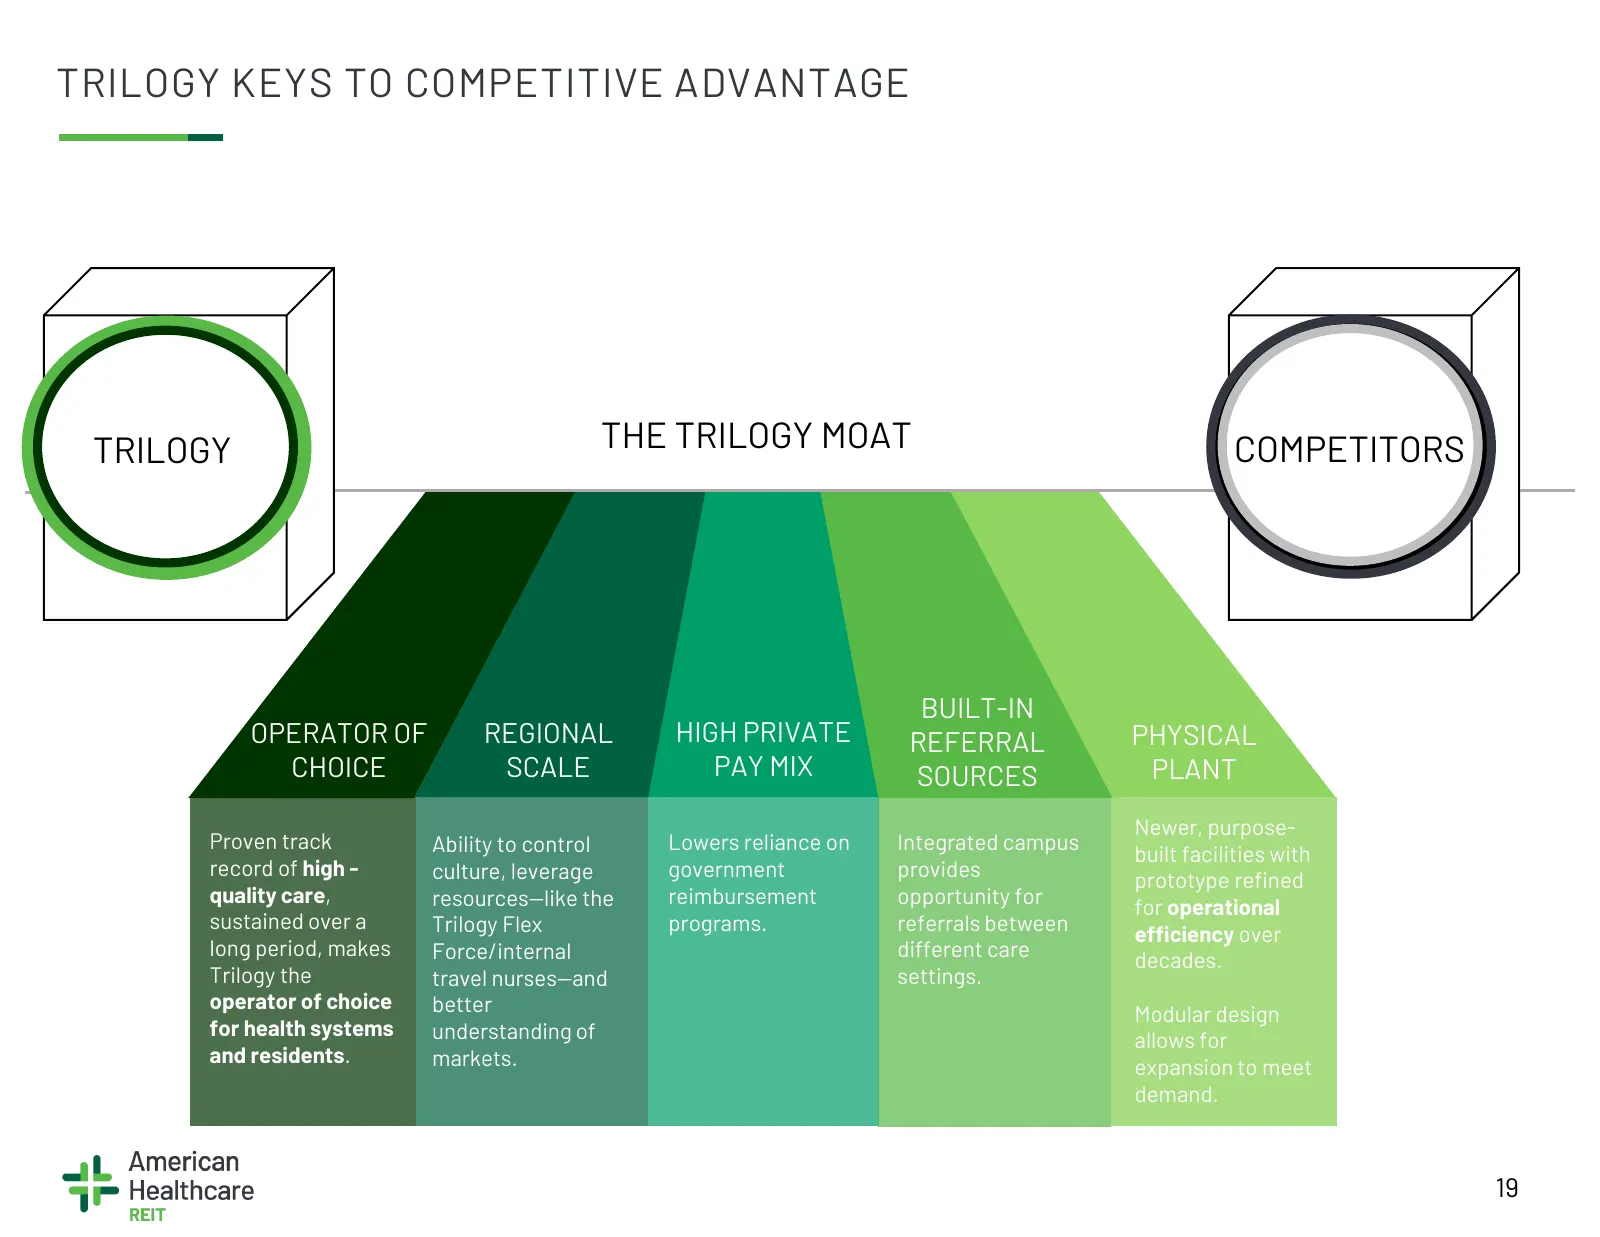
TRILOGY KEYS TO COMPETITIVE ADVANTAGE TRILOGY THE TRILOGY MOAT COMPETITORS building a lasting business BUILT-IN OPERATOR OF REGIONAL HIGH PRIVATE REFERRAL PHYSICAL CHOICE SCALE PAY MIX SOURCES PLANT Newer, purpose- Proven track Ability to control Lowers reliance on Integrated campus built facilities
Slide 20: Senior Housing Operating Properties (SHOP) | Overview
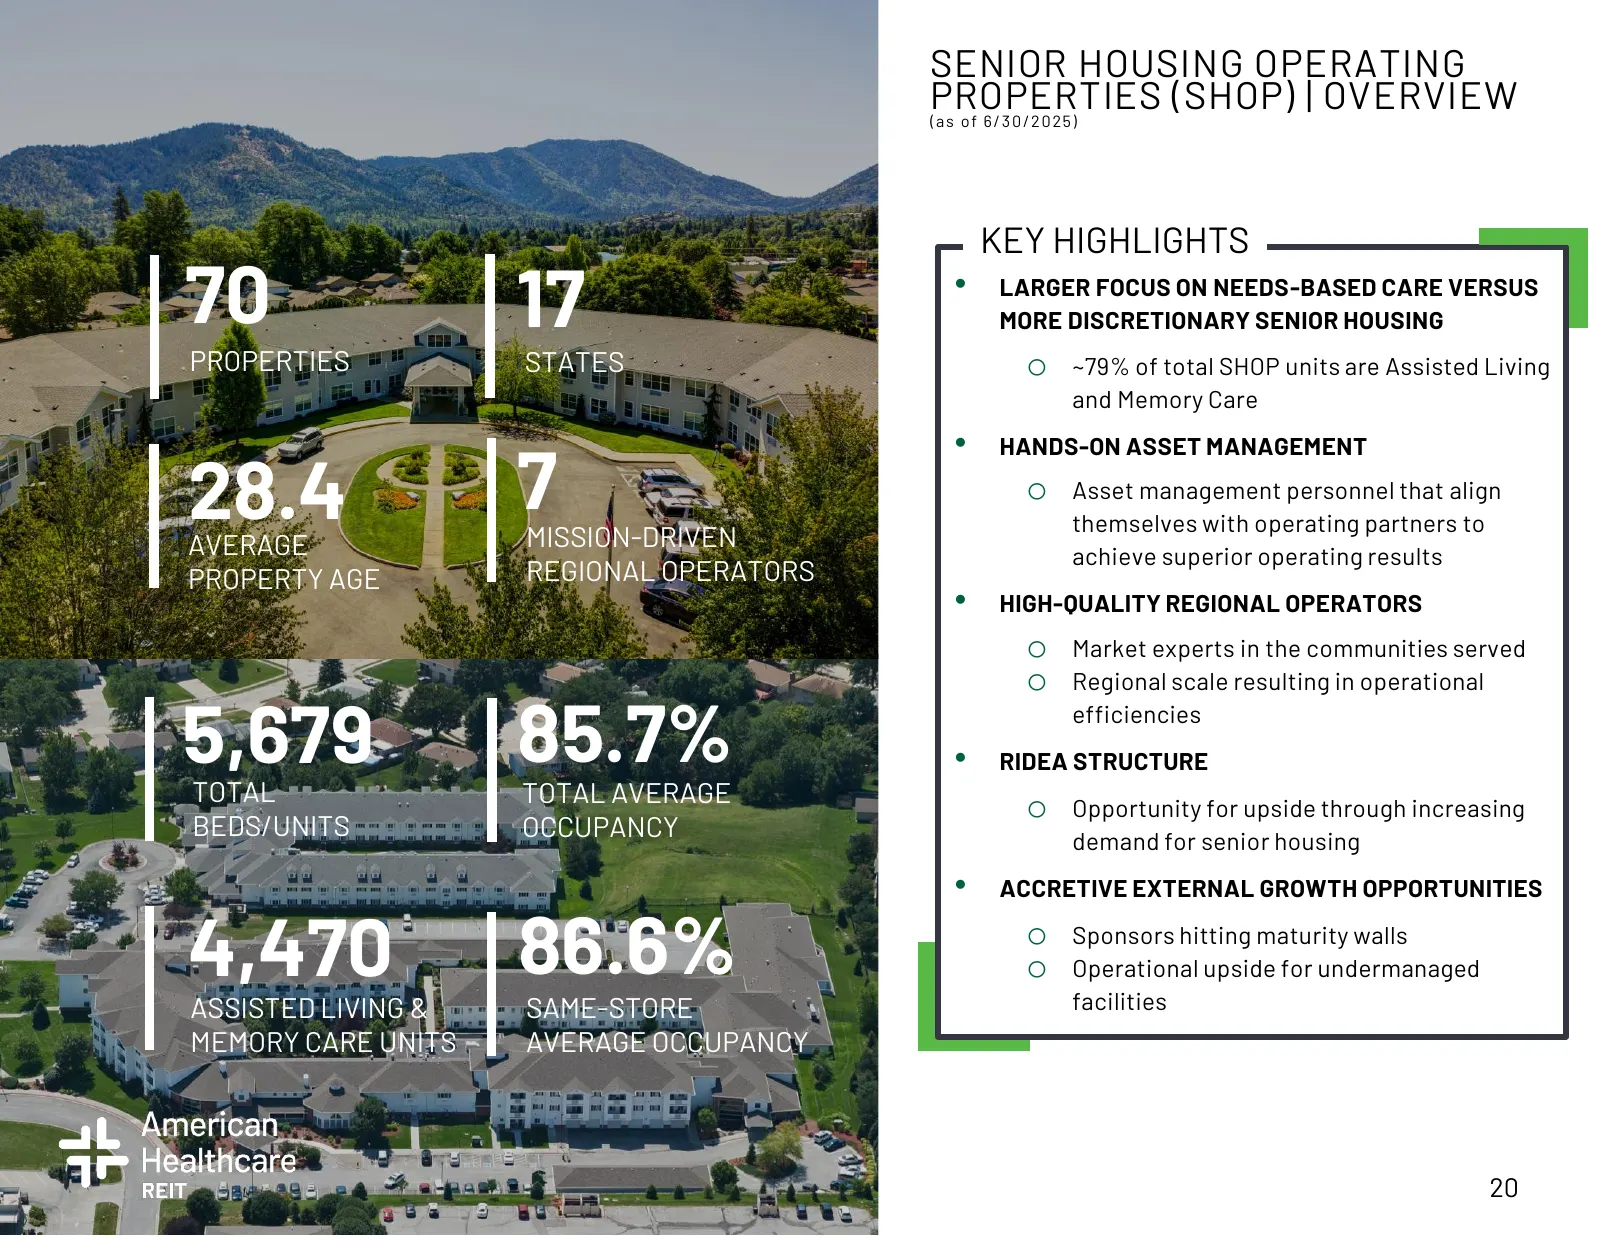
SENIOR HOUSING OPERATING PROPERTIES (as o f 6 / 3 0 / 2 0 25) (SHOP) | OVERVIEW KEY HIGHLIGHTS 70 17 • LARGER FOCUS ON NEEDS-BASED CARE VERSUS MORE DISCRETIONARY SENIOR HOUSING PROPERTIES STATES o ~79% of total SHOP units are Assisted Living and Memory Care • 7 HANDS-ON ASSET MANAGEMENT 28.4 AVERAGE
Slide 21: Senior Housing Demonstrating Robust Organic Growth
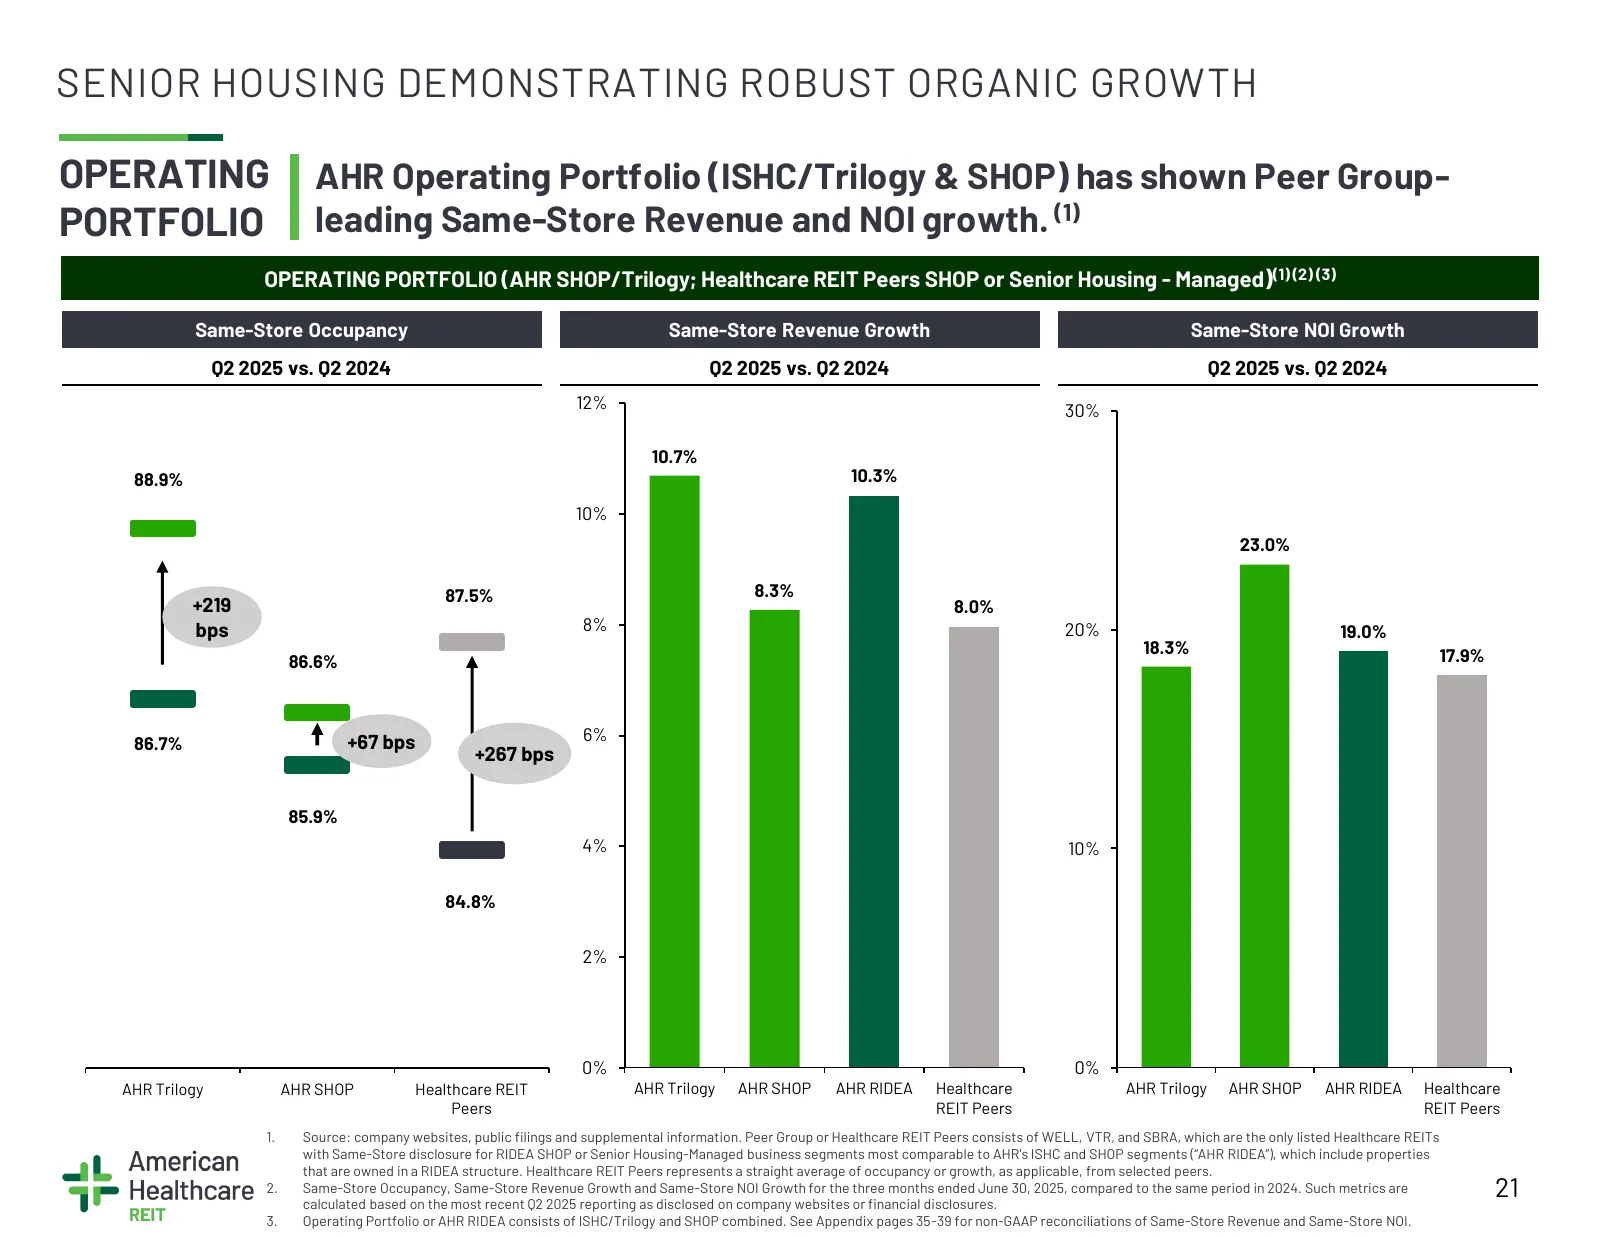
SENIOR HOUSING DEMONSTRATING ROBUST ORGANIC GROWTH OPERATING AHR Operating Portfolio (ISHC/Trilogy & SHOP) has shown Peer Group- PORTFOLIO leading Same-Store Revenue and NOI growth. (1) OPERATING PORTFOLIO (AHR SHOP/Trilogy; Healthcare REIT Peers SHOP or Senior Housing - Managed)(1) (2) (3) Same-Sto

Slide 22: Capital Allocation
& a i i H SF | I. a a. =e PC APITABALE OC ATION =
Slide 23: Capital Allocation – Strategic Sources and Uses
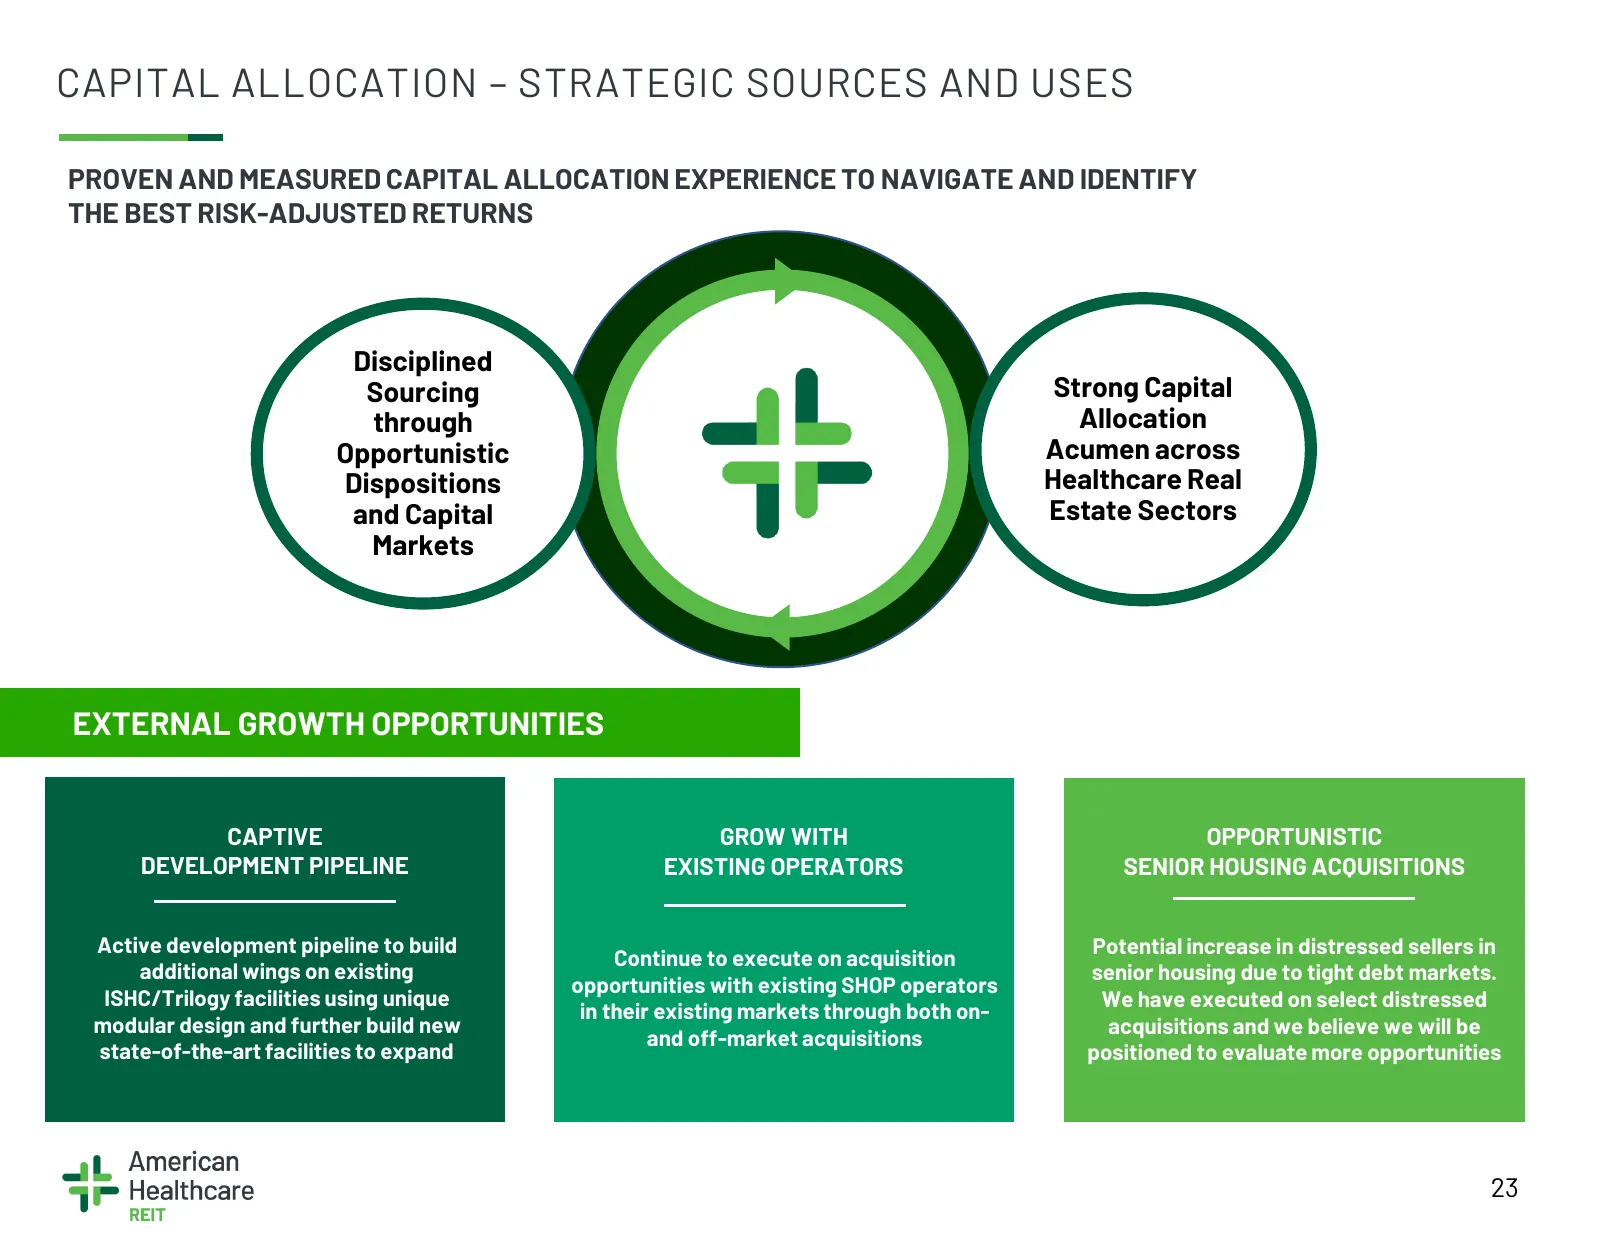
CAPITAL ALLOCATION – STRATEGIC SOURCES AND USES PROVEN AND MEASURED CAPITAL ALLOCATION EXPERIENCE TO NAVIGATE AND IDENTIFY THE BEST RISK-ADJUSTED RETURNS Disciplined Sourcing Strong Capital through Allocation Opportunistic Acumen across Dispositions Healthcare Real and Capital Estate Sectors Markets
Slide 24: Capital Markets & Balance Sheet
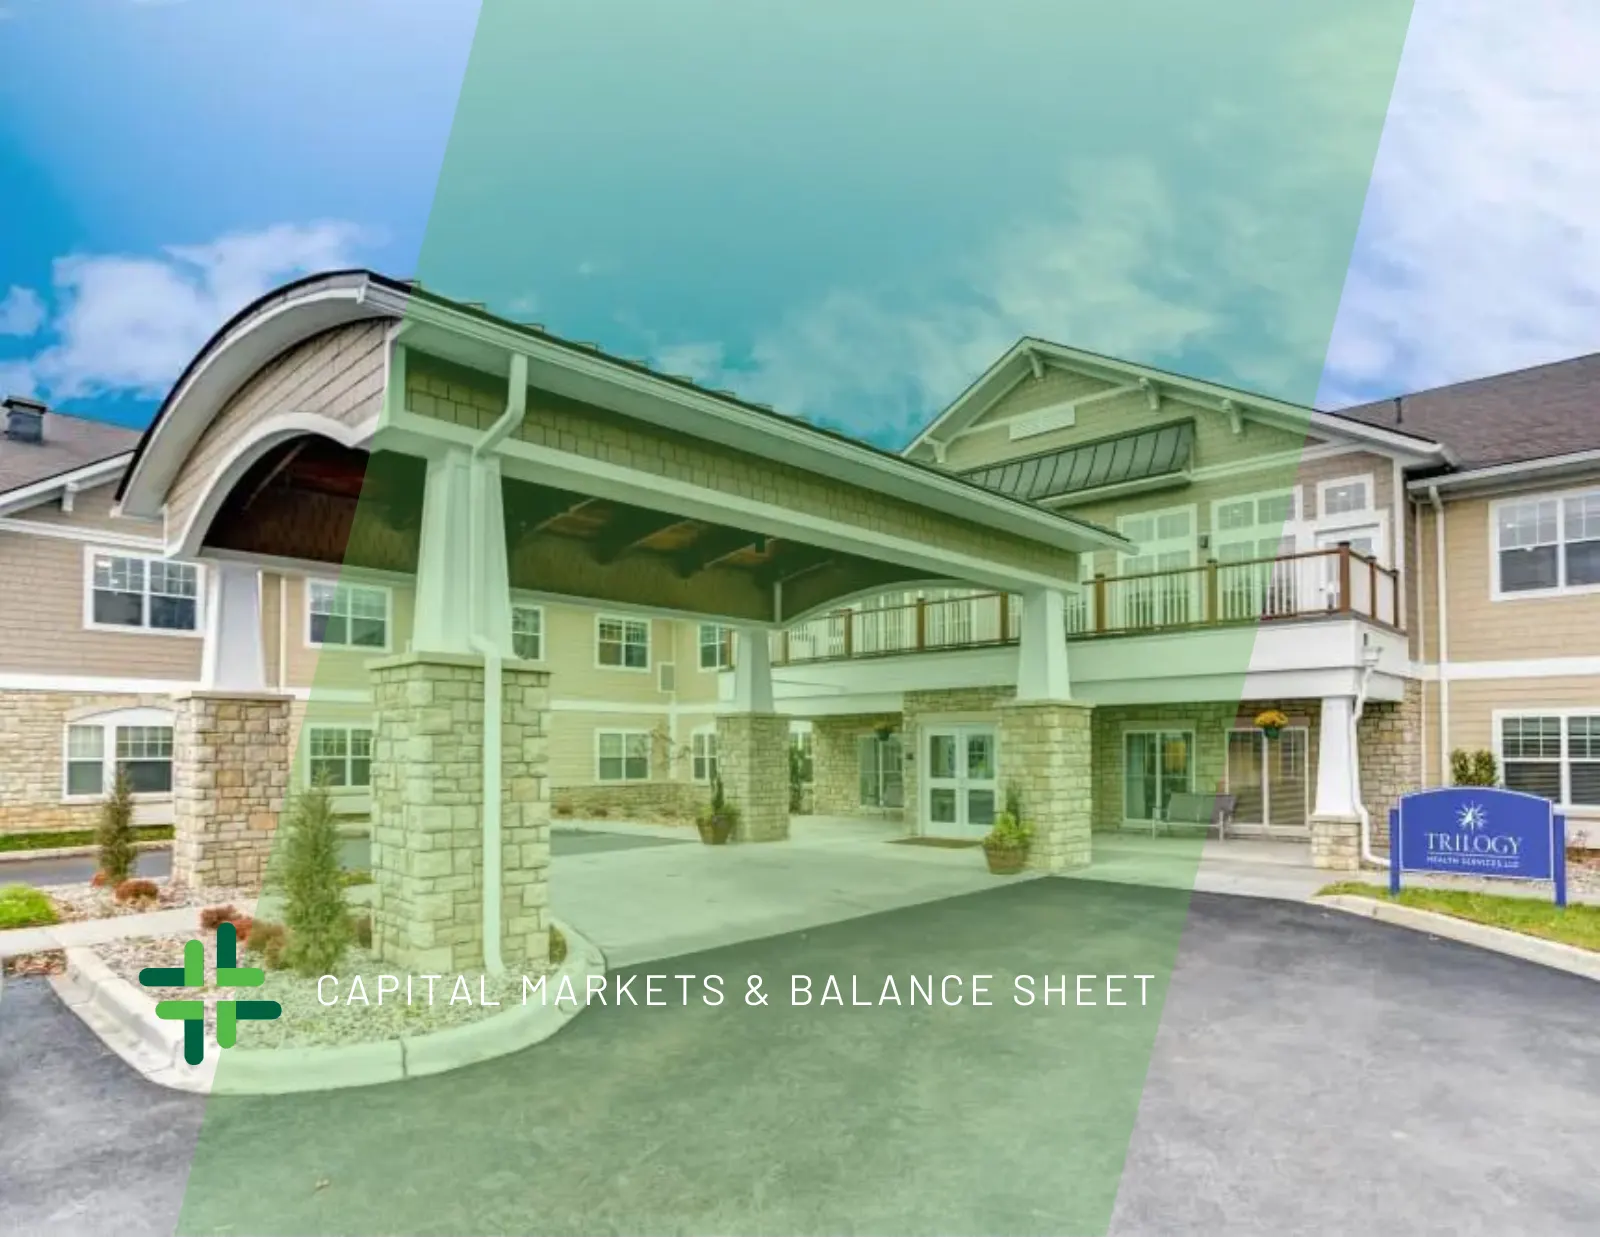
CAPITAL MARKETS & BALANCE SHEET
Slide 25: Balance Sheet Highlights
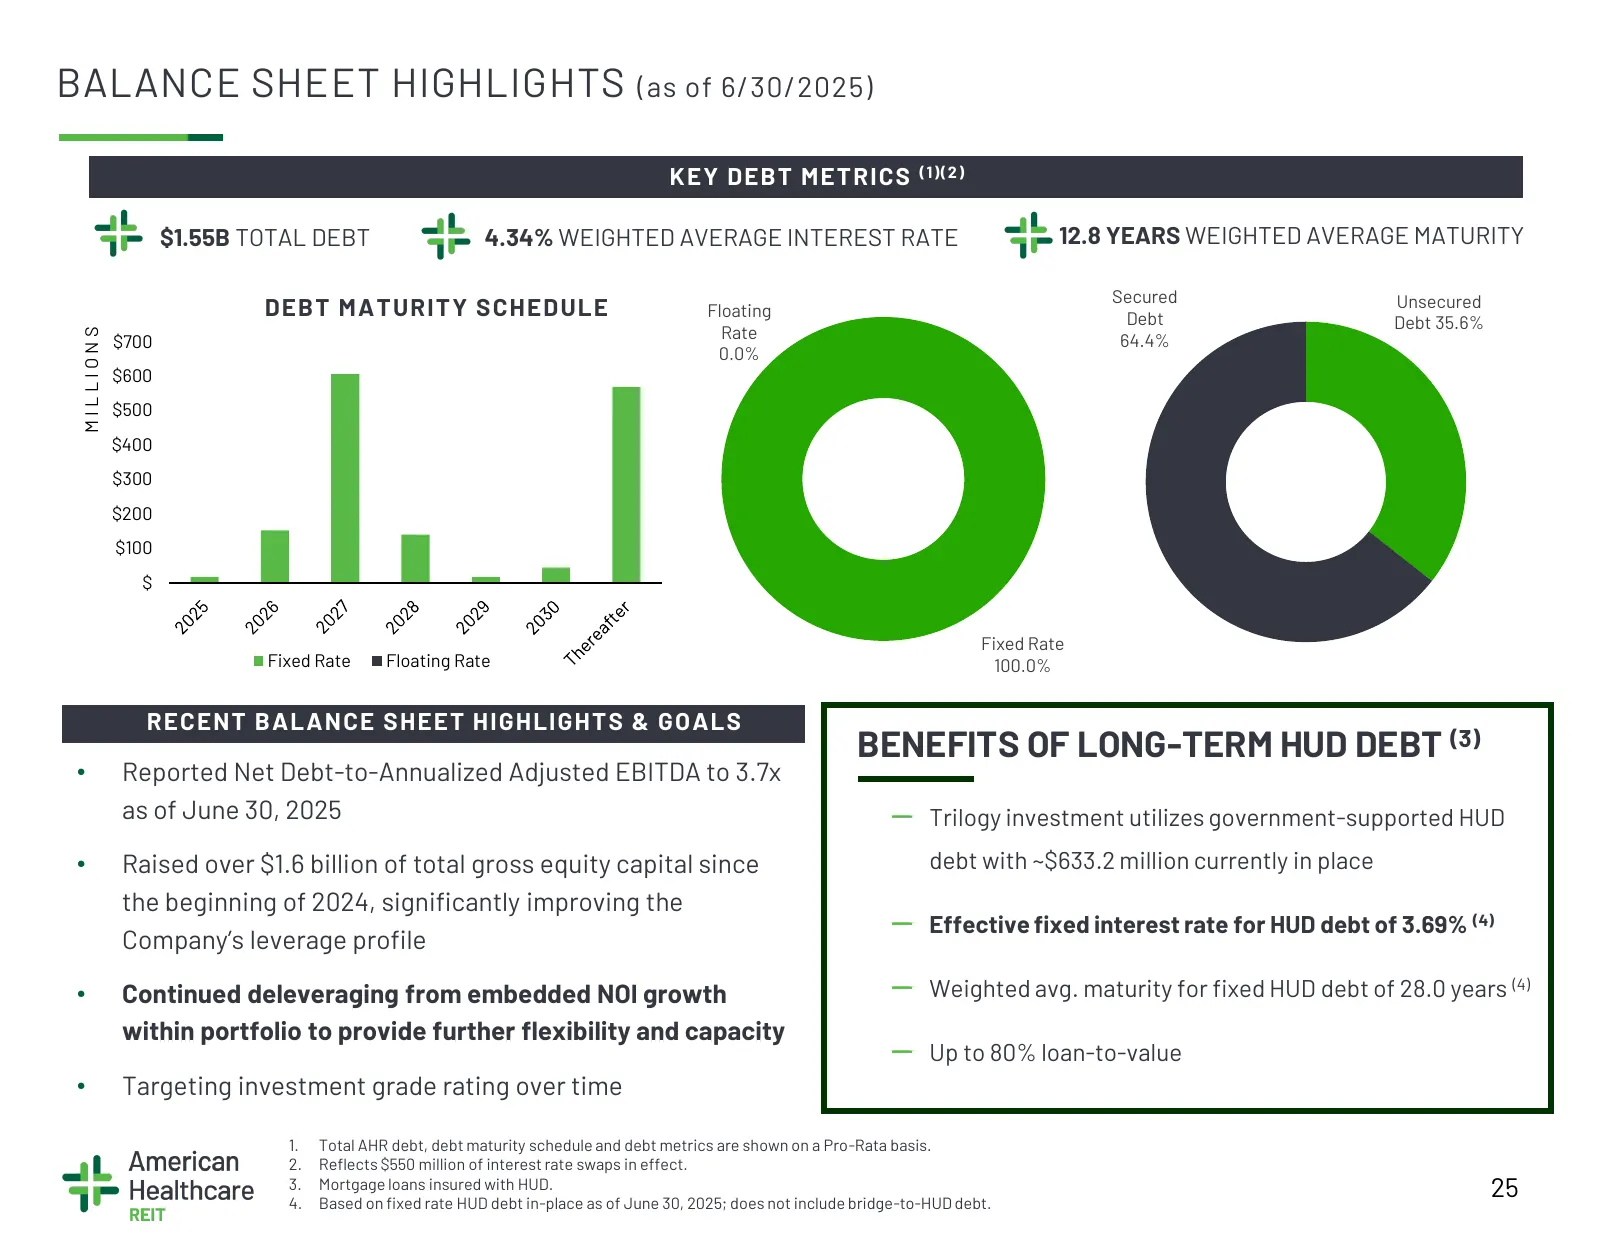
BALANCE SHEET HIGHLIGHTS (as of 6/30/2025) KEY DEBT METRICS (1)(2) $1.55B TOTAL DEBT 4.34% WEIGHTED AVERAGE INTEREST RATE 12.8 YEARS WEIGHTED AVERAGE MATURITY Secured Unsecured DEBT MATURITY SCHEDULE Floating Debt Debt 35.6% Rate MILLIONS $700 64.4% 0.0% $600 $500 $400 $300 $200 $100 $ Fixed Rate Fi
Slide 26: Management & Governance
MANAGEMENT & GOVERNANCE
Slide 27: Cohesive Management Team
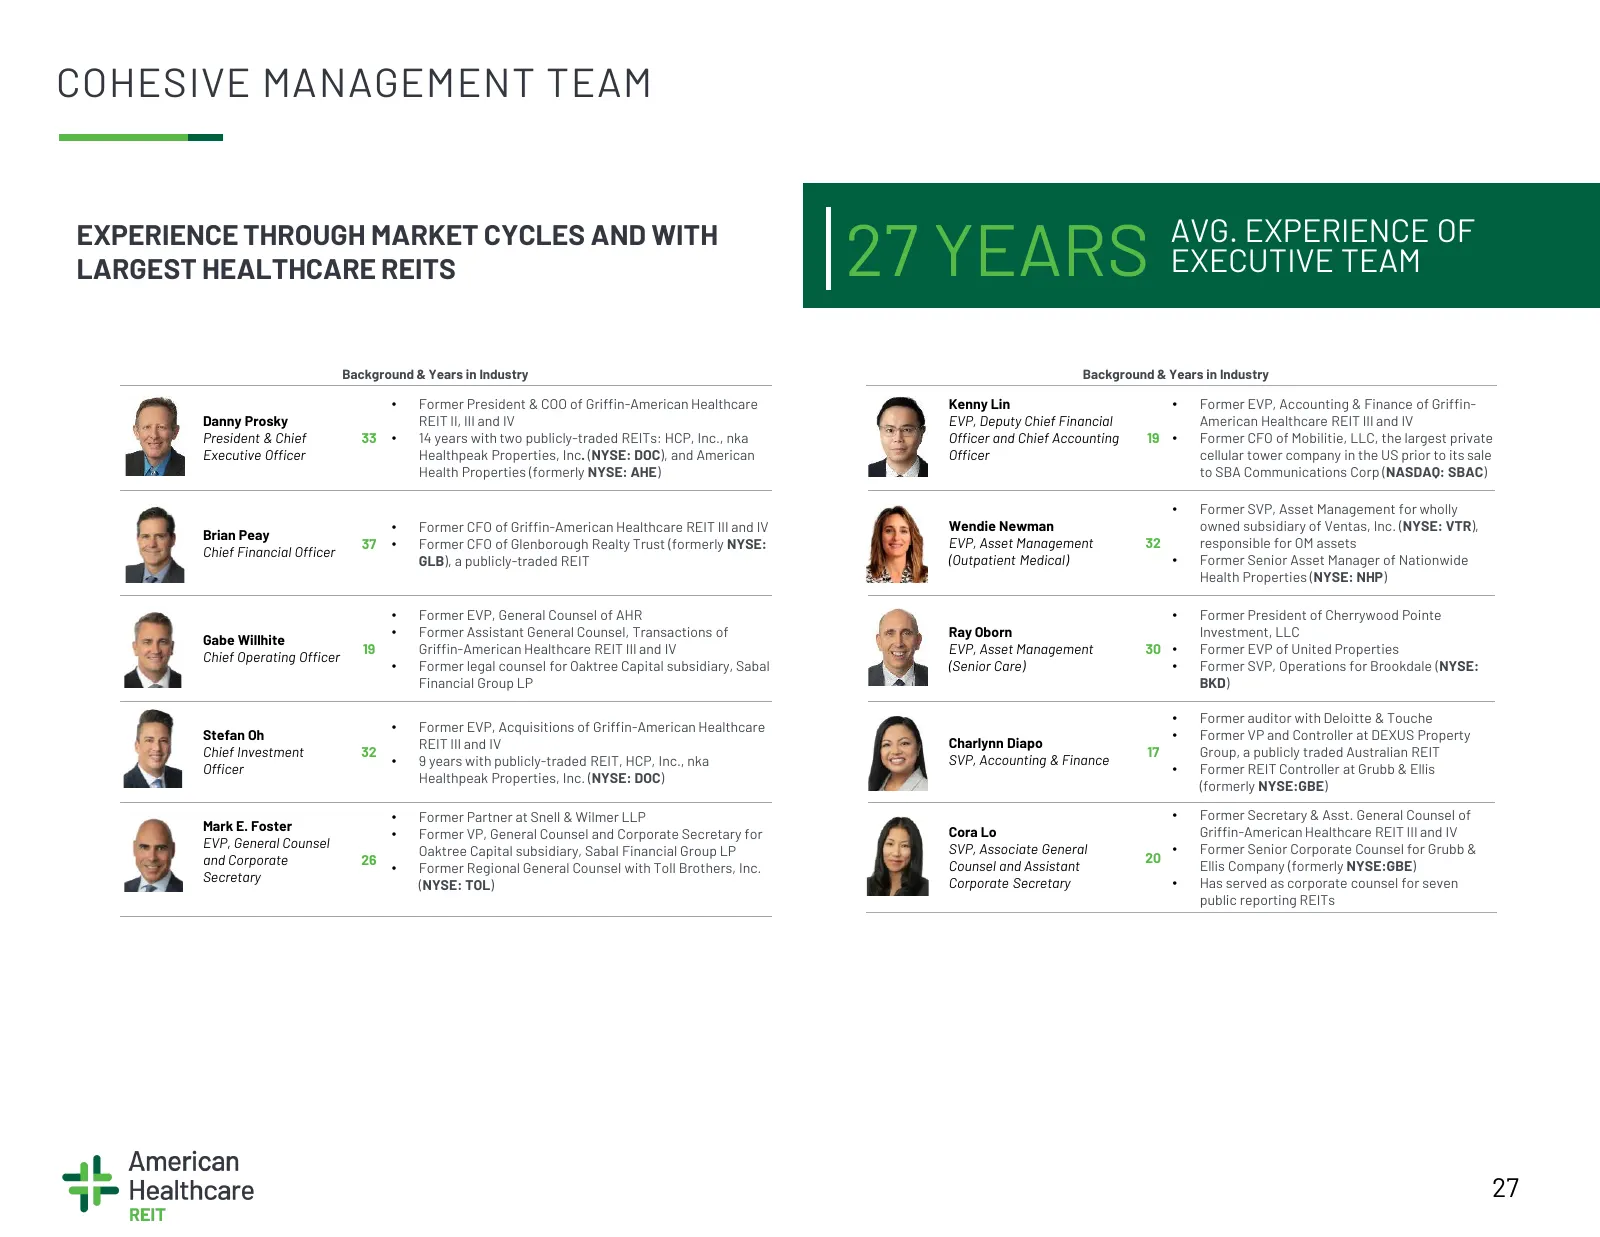
COHESIVE MANAGEMENT TEAM EXPERIENCE THROUGH MARKET CYCLES AND WITH LARGEST HEALTHCARE REITS 27 YEARS AVG. EXPERIENCE OF EXECUTIVE TEAM Background & Years in Industry Background & Years in Industry • Former President & COO of Griffin-American Healthcare Kenny Lin • Former EVP, Accounting & Finance of
Slide 28: Experienced Board of Directors with Strong Governance
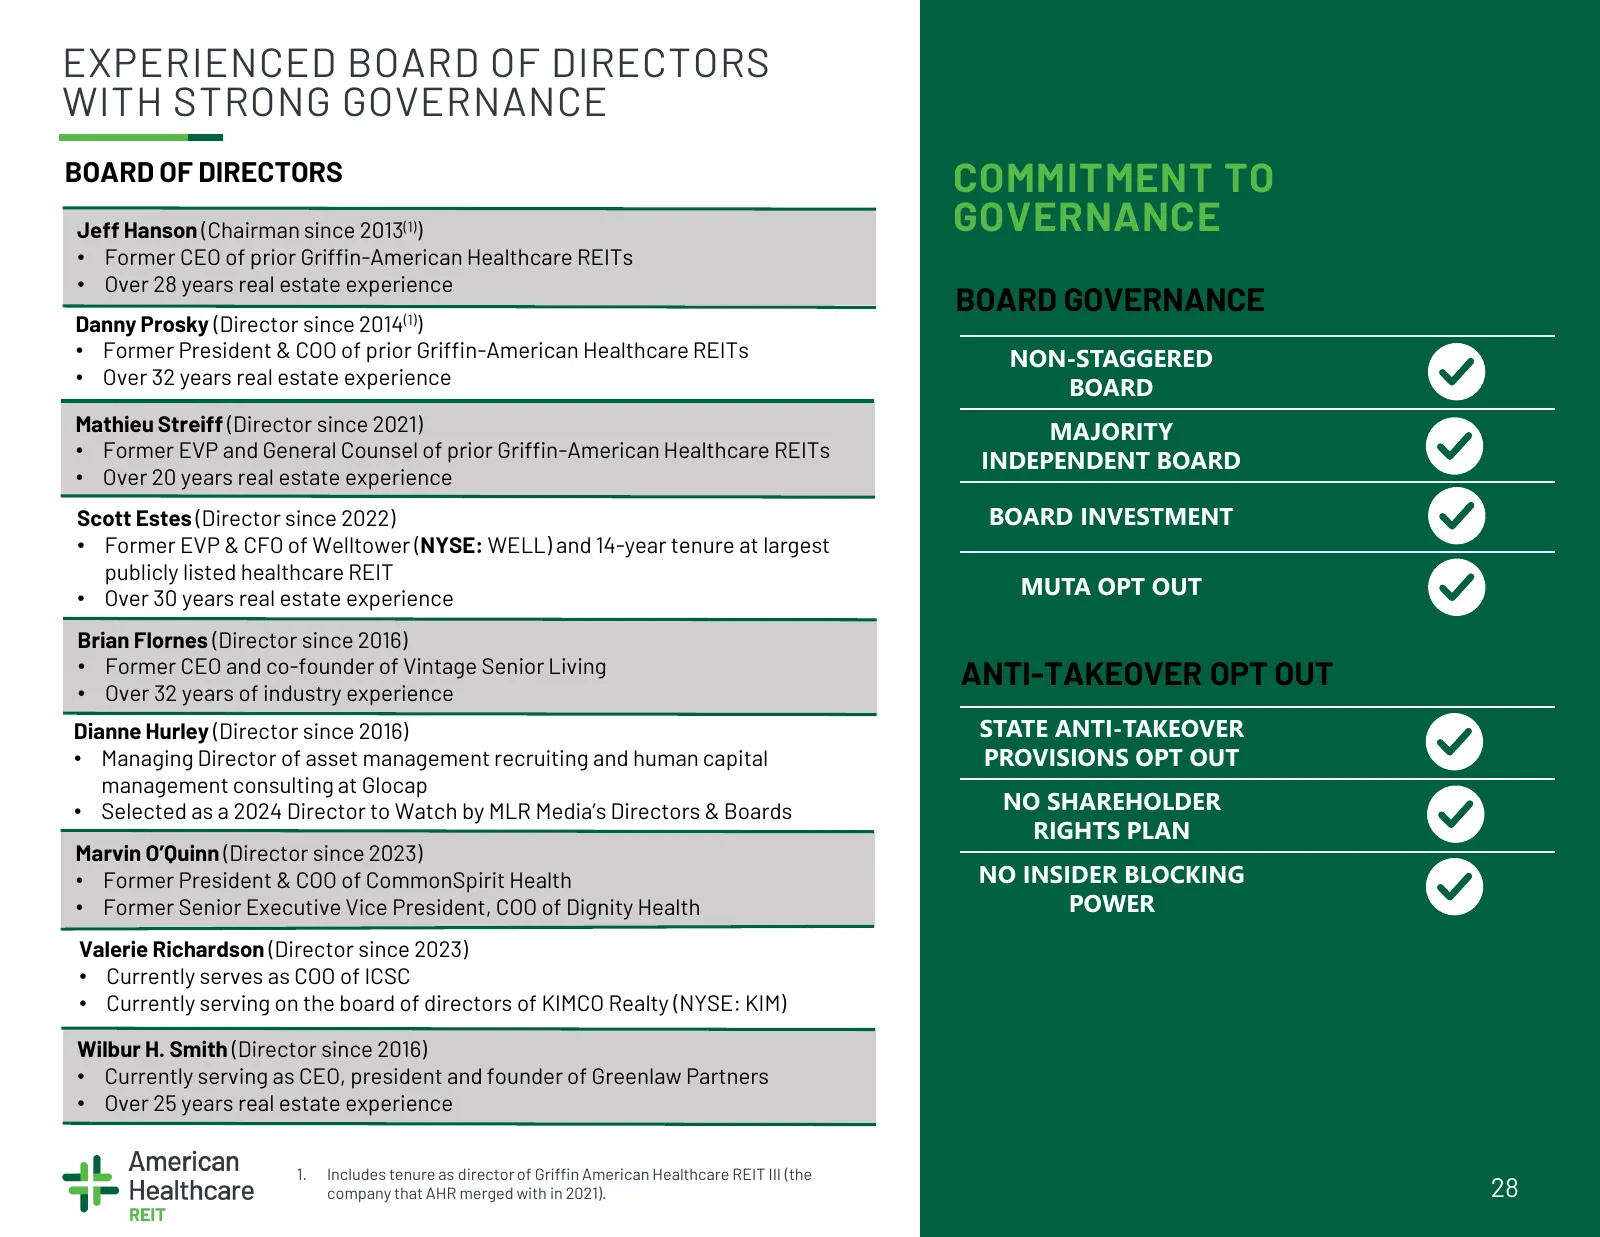
EXPERIENCED BOARD OF DIRECTORS WITH STRONG GOVERNANCE BOARD OF DIRECTORS COMMITMENT TO Jeff Hanson (Chairman since 2013(1)) GOVERNANCE • Former CEO of prior Griffin-American Healthcare REITs • Over 28 years real estate experience BOARD GOVERNANCE Danny Prosky (Director since 2014(1)) • Former Presid
Slide 29: Corporate Responsibility Initiatives
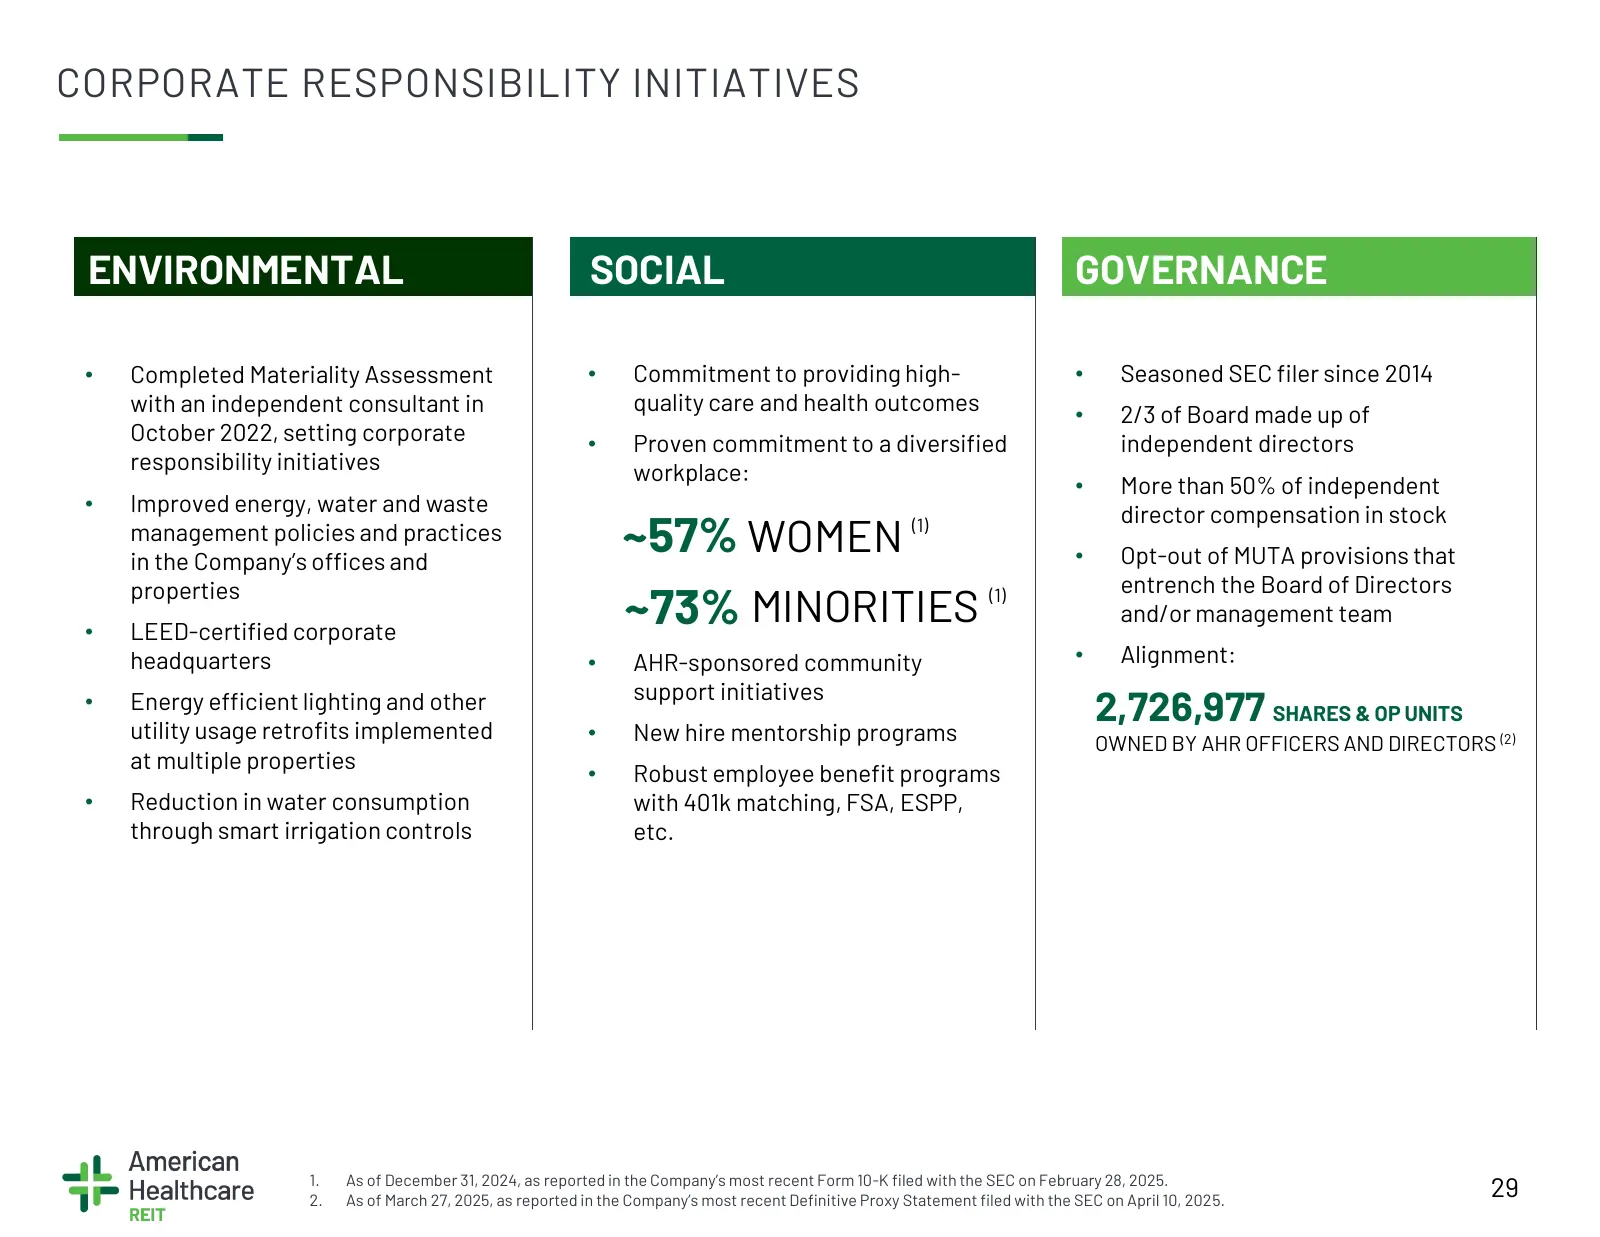
CORPORATE RESPONSIBILITY INITIATIVES ENVIRONMENTAL SOCIAL GOVERNANCE • Completed Materiality Assessment • Commitment to providing high- • Seasoned SEC filer since 2014 with an independent consultant in quality care and health outcomes • 2/3 of Board made up of October 2022, setting corporate • Prove
Slide 30: Appendix
APPENDIX
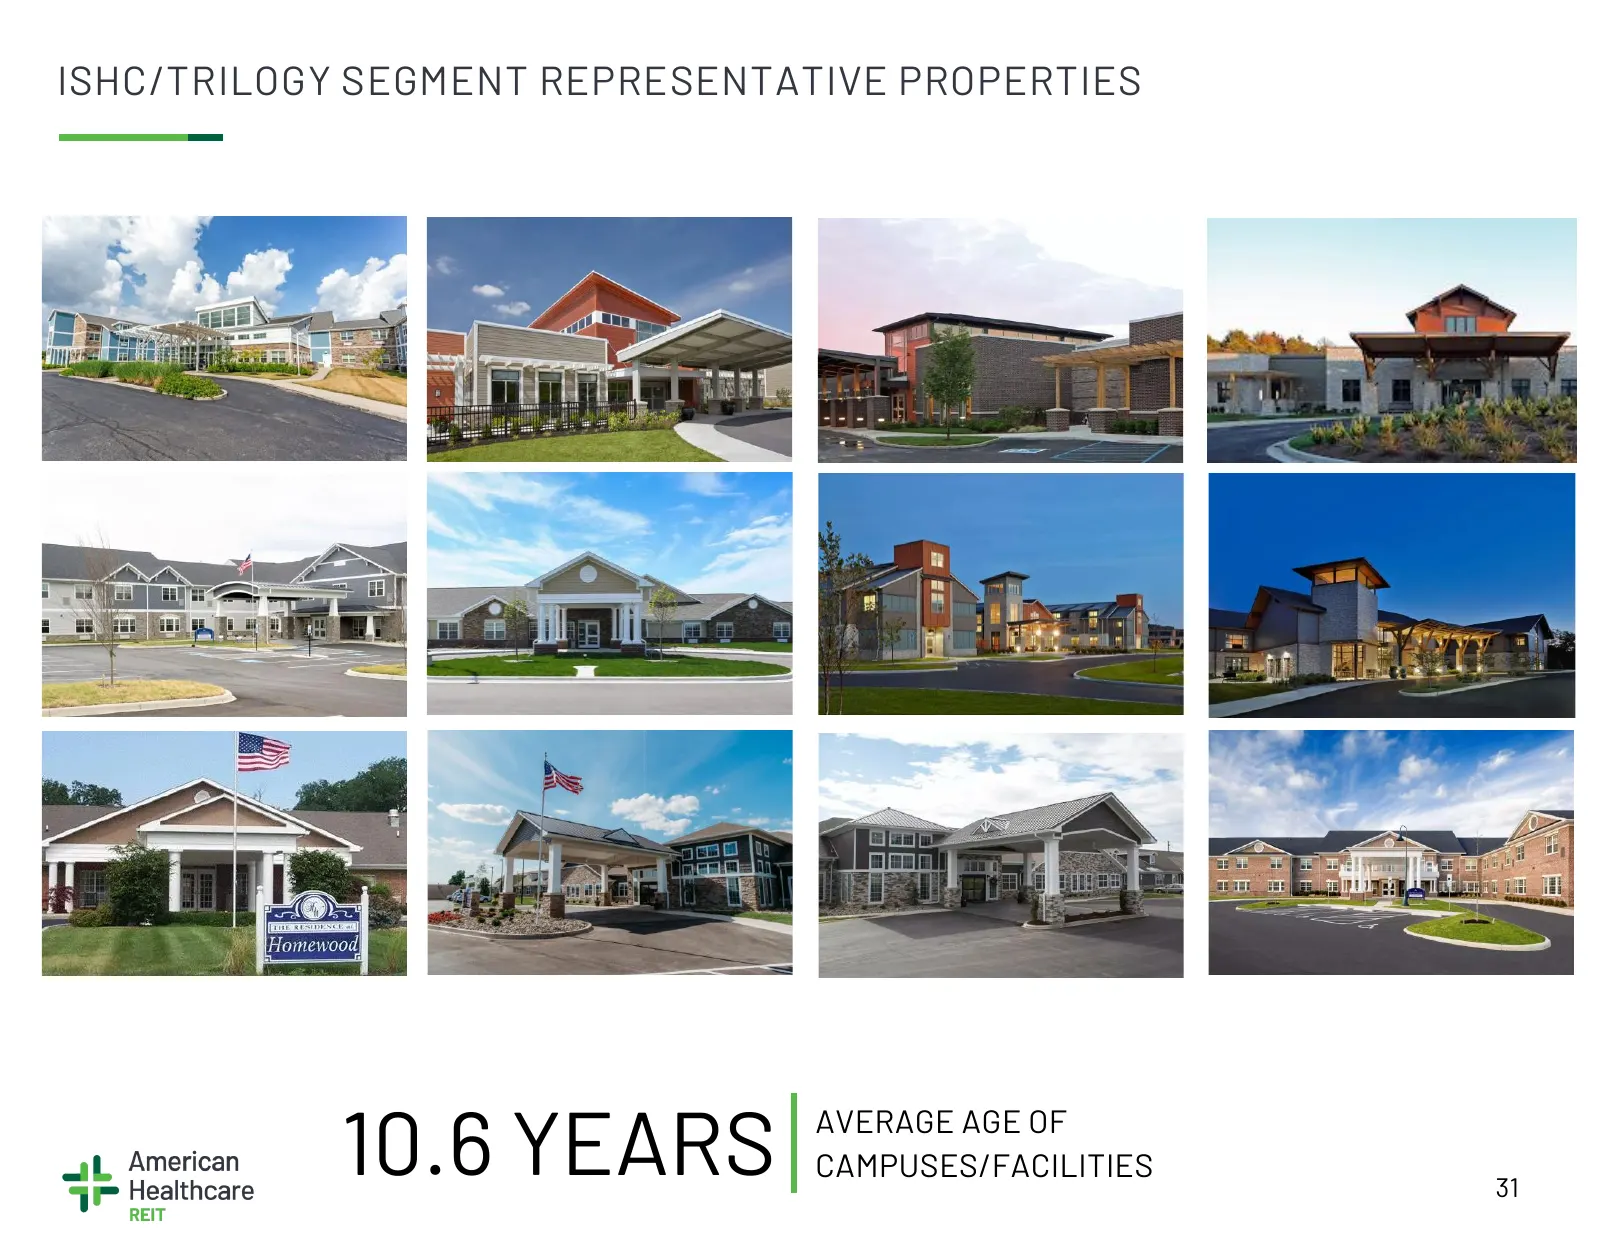
Slide 31: ISHC/Trilogy Segment Representative Properties
ISHC/TRILOGY SEGMENT REPRESENTATIVE PROPERTIES 10.6 YEARS AVERAGE AGE OF CAMPUSES/FACILITIES 31
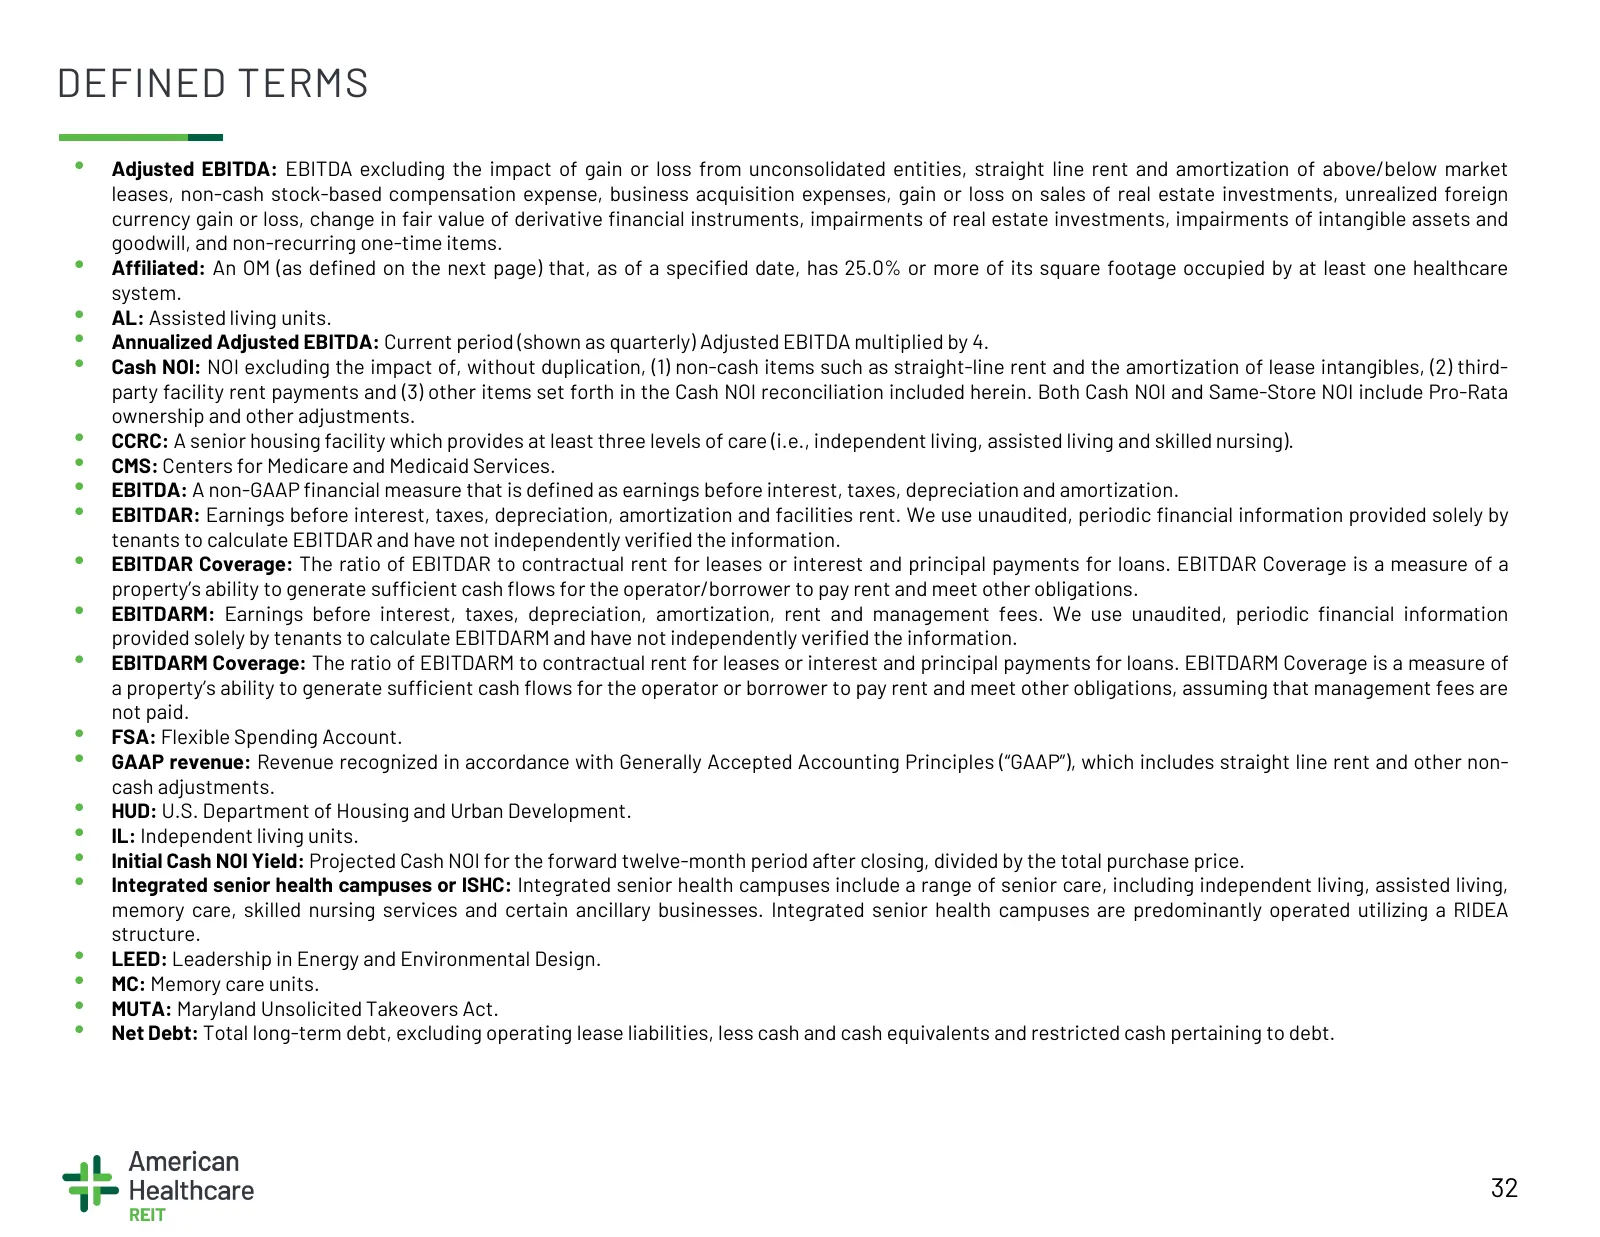
Slide 32: Defined Terms
DEFINED TERMS • Adjusted EBITDA: EBITDA excluding the impact of gain or loss from unconsolidated entities, straight line rent and amortization of above/below market leases, non-cash stock-based compensation expense, business acquisition expenses, gain or loss on sales of real estate investments, unr
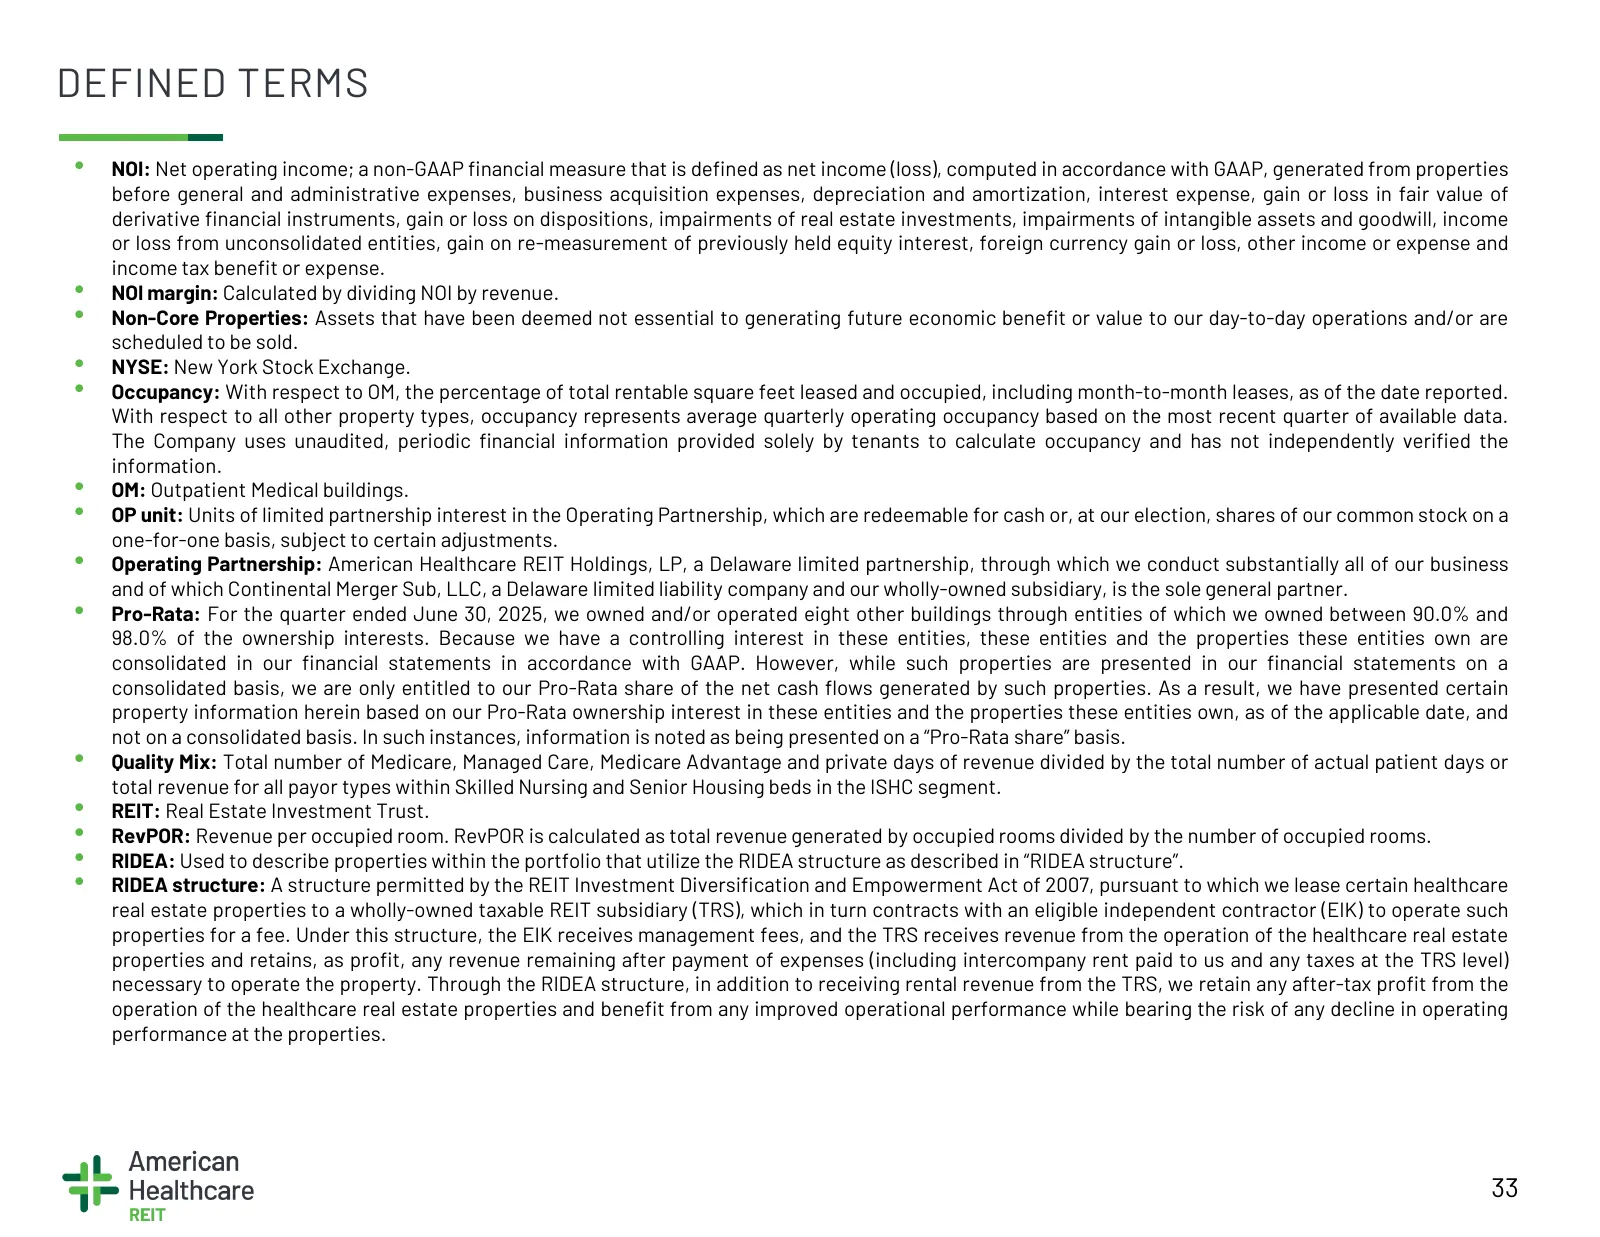
Slide 33: Defined Terms
DEFINED TERMS • NOI: Net operating income; a non-GAAP financial measure that is defined as net income (loss), computed in accordance with GAAP, generated from properties before general and administrative expenses, business acquisition expenses, depreciation and amortization, interest expense, gain o
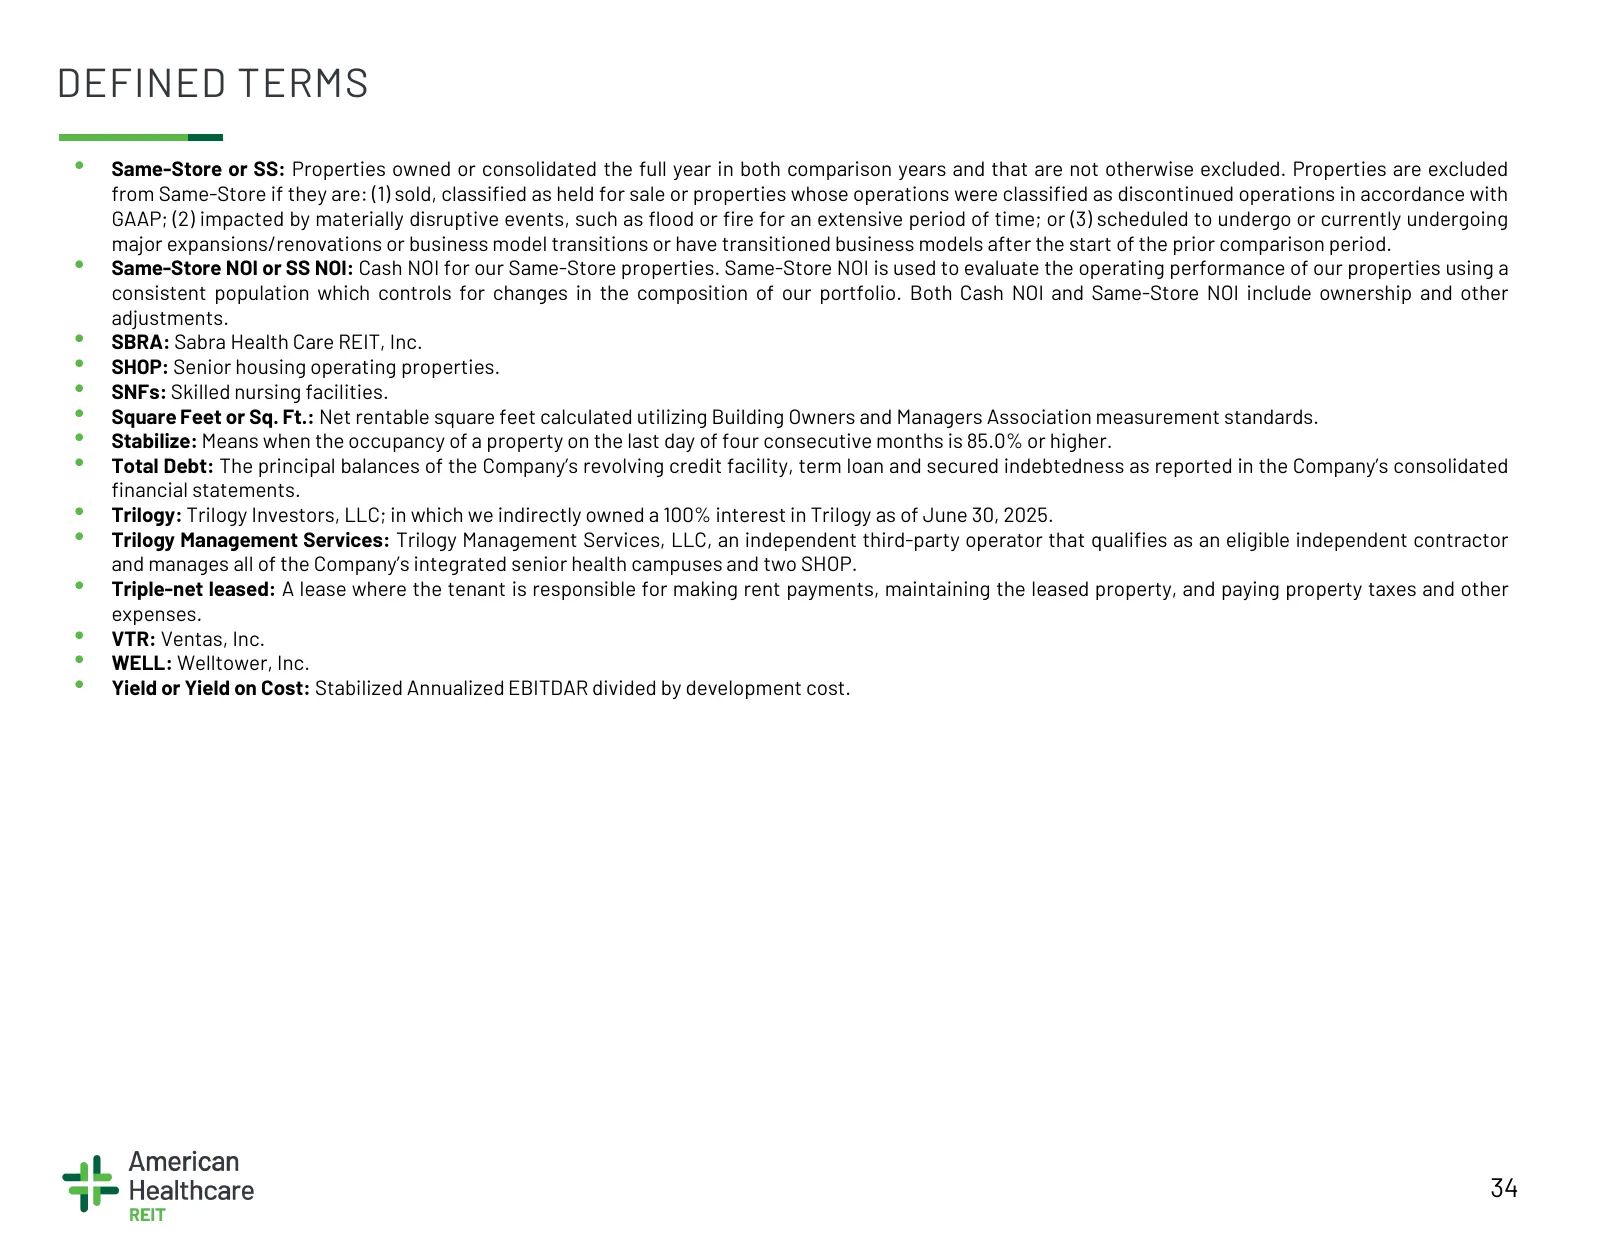
Slide 34: Defined Terms
DEFINED TERMS • Same-Store or SS: Properties owned or consolidated the full year in both comparison years and that are not otherwise excluded. Properties are excluded from Same-Store if they are: (1) sold, classified as held for sale or properties whose operations were classified as discontinued ope
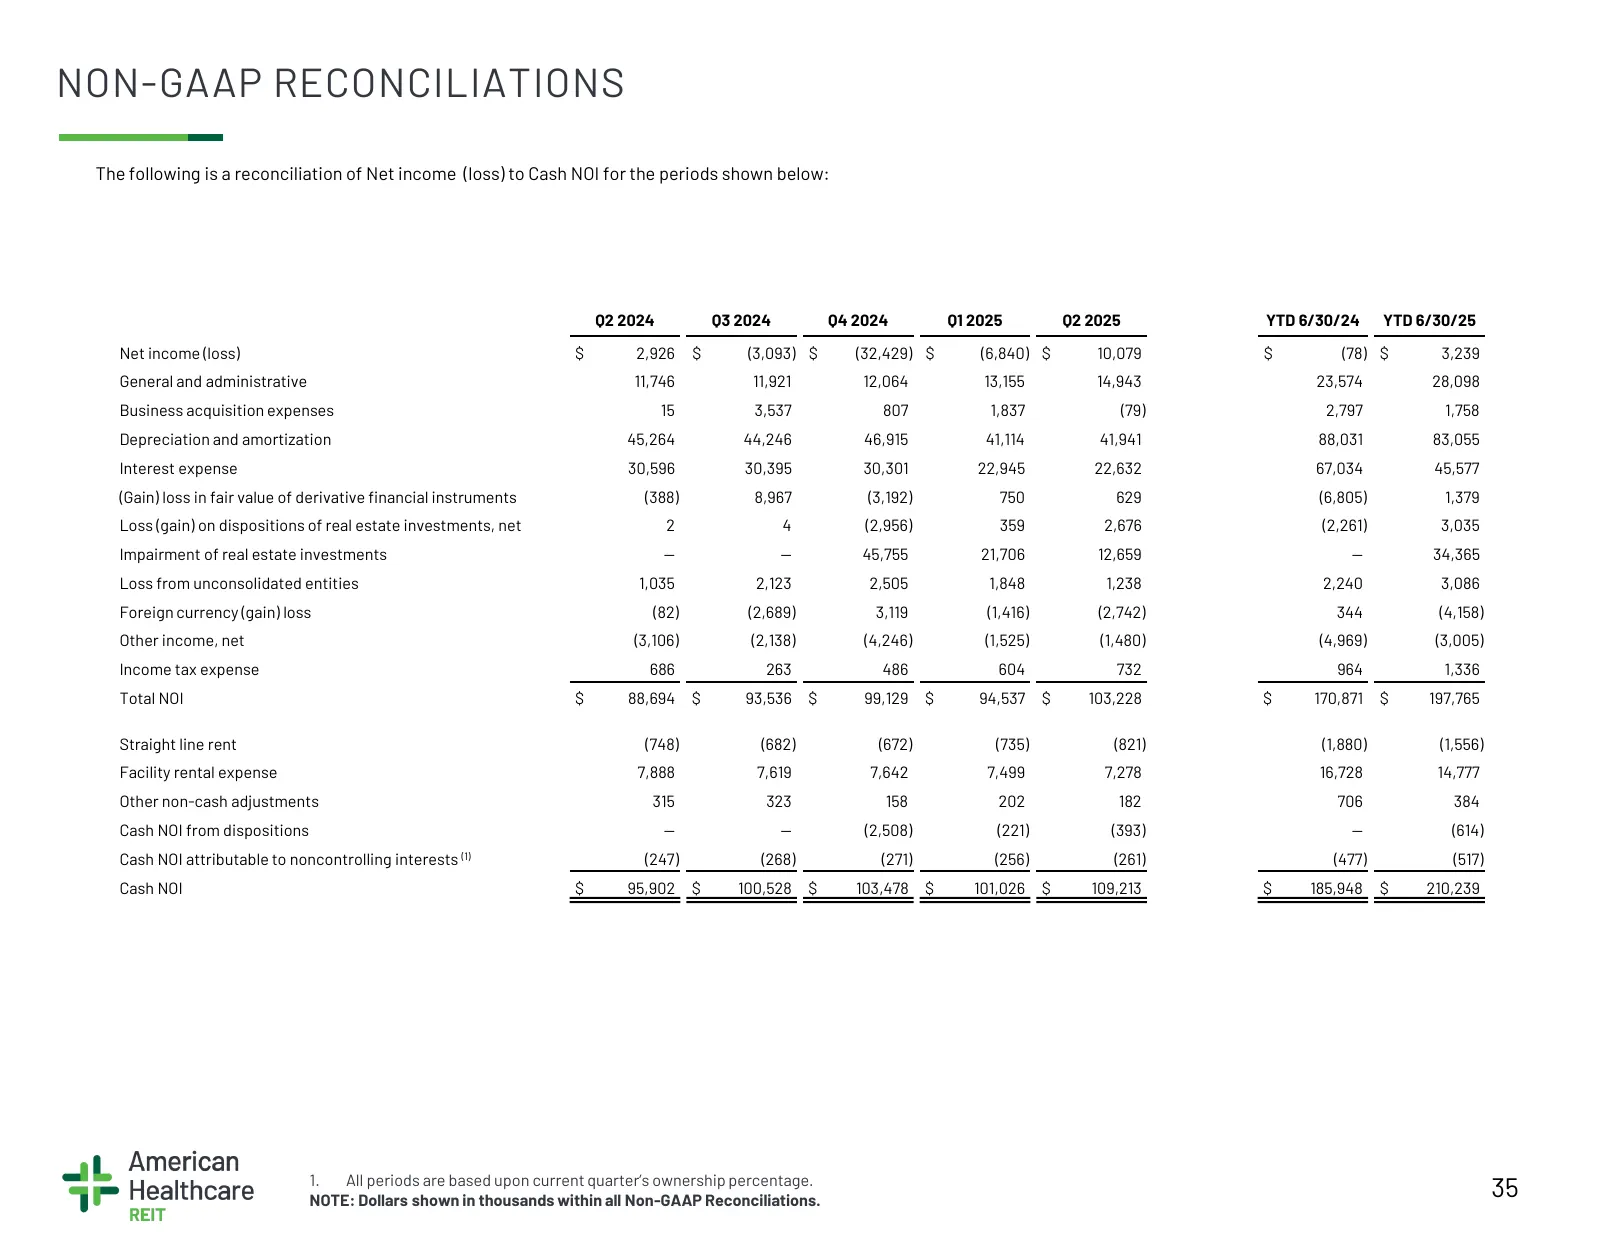
Slide 35: Non-GAAP Reconciliations
NON-GAAP RECONCILIATIONS The following is a reconciliation of Net income (loss) to Cash NOI for the periods shown below: Q2 2024 Q3 2024 Q4 2024 Q1 2025 Q2 2025 YTD 6/30/24 YTD 6/30/25 Net income (loss) $ 2,926 $ (3,093) $ (32,429) $ (6,840) $ 10,079 $ (78) $ 3,239 General and administrative 11,746
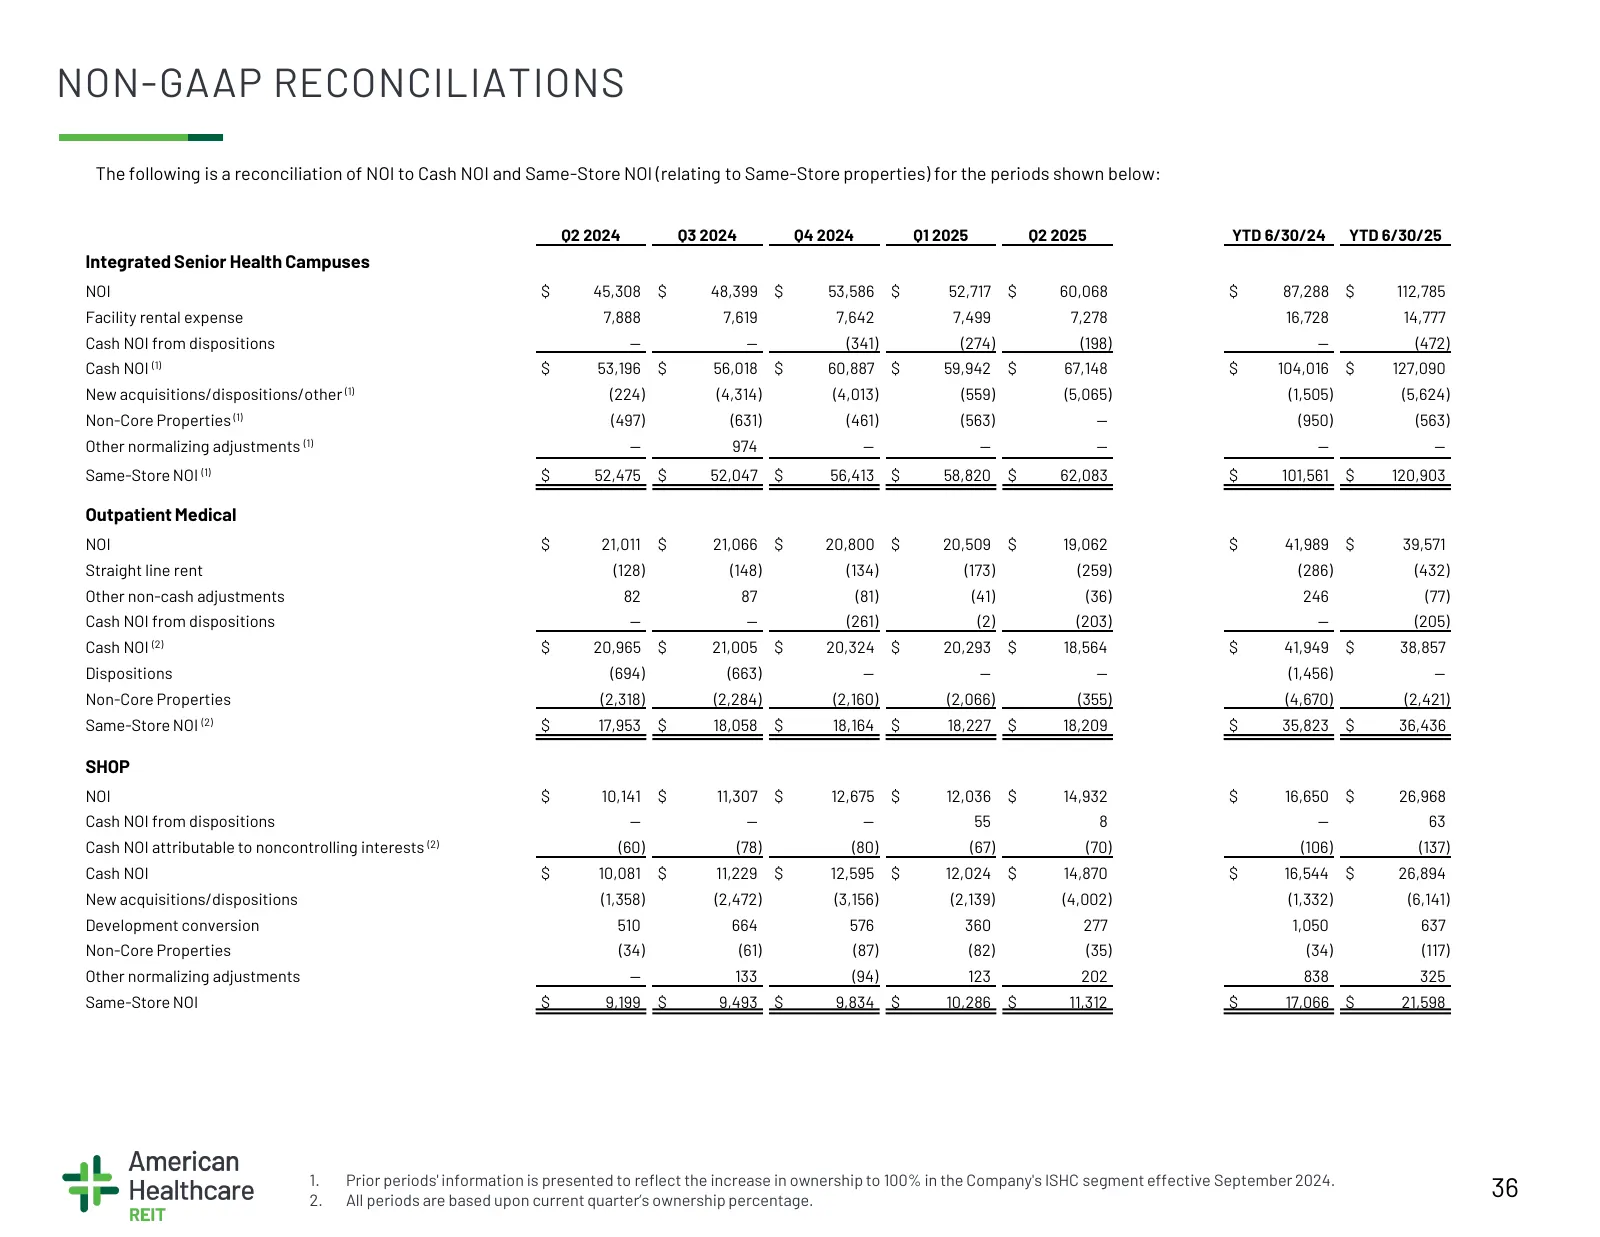
Slide 36: Non-GAAP Reconciliations
NON-GAAP RECONCILIATIONS The following is a reconciliation of NOI to Cash NOI and Same-Store NOI (relating to Same-Store properties) for the periods shown below: Q2 2024 Q3 2024 Q4 2024 Q1 2025 Q2 2025 YTD 6/30/24 YTD 6/30/25 Integrated Senior Health Campuses NOI $ 45,308 $ 48,399 $ 53,586 $ 52,717
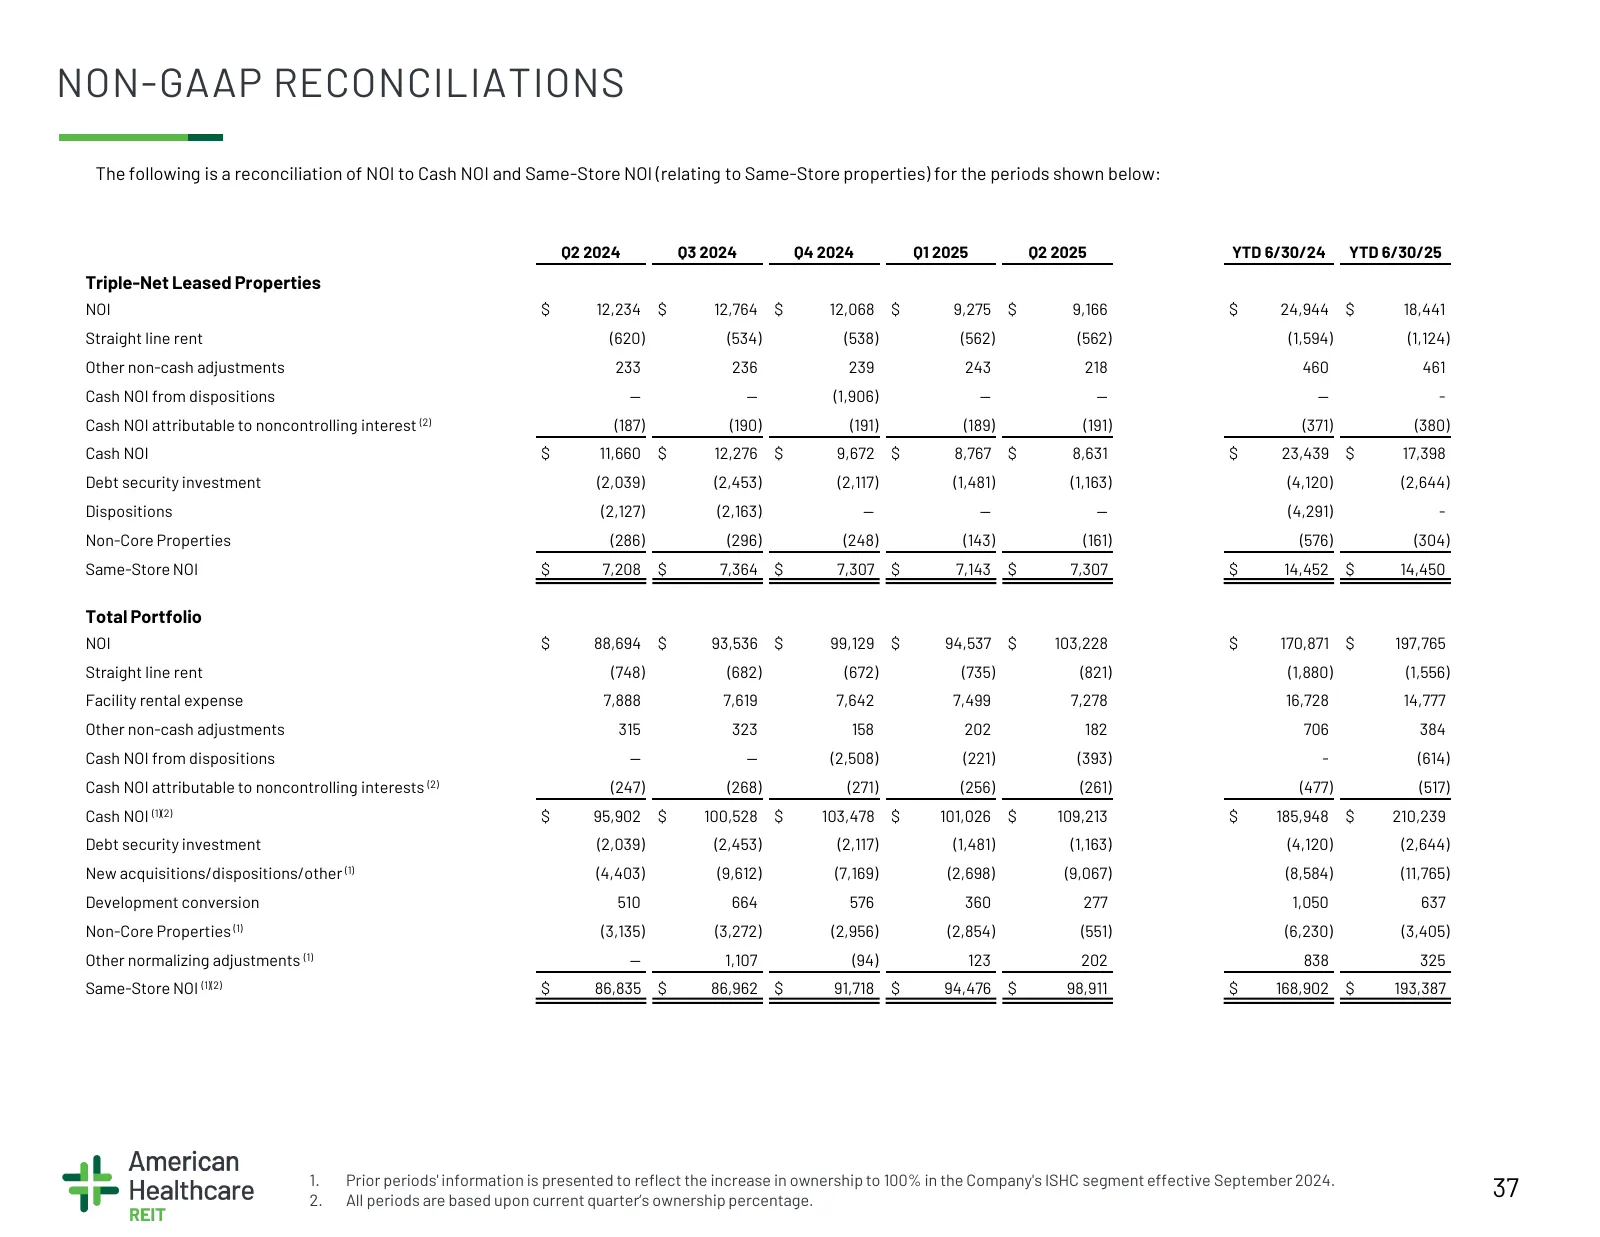
Slide 37: Non-GAAP Reconciliations
NON-GAAP RECONCILIATIONS The following is a reconciliation of NOI to Cash NOI and Same-Store NOI (relating to Same-Store properties) for the periods shown below: Q2 2024 Q3 2024 Q4 2024 Q1 2025 Q2 2025 YTD 6/30/24 YTD 6/30/25 Triple-Net Leased Properties NOI $ 12,234 $ 12,764 $ 12,068 $ 9,275 $ 9,16
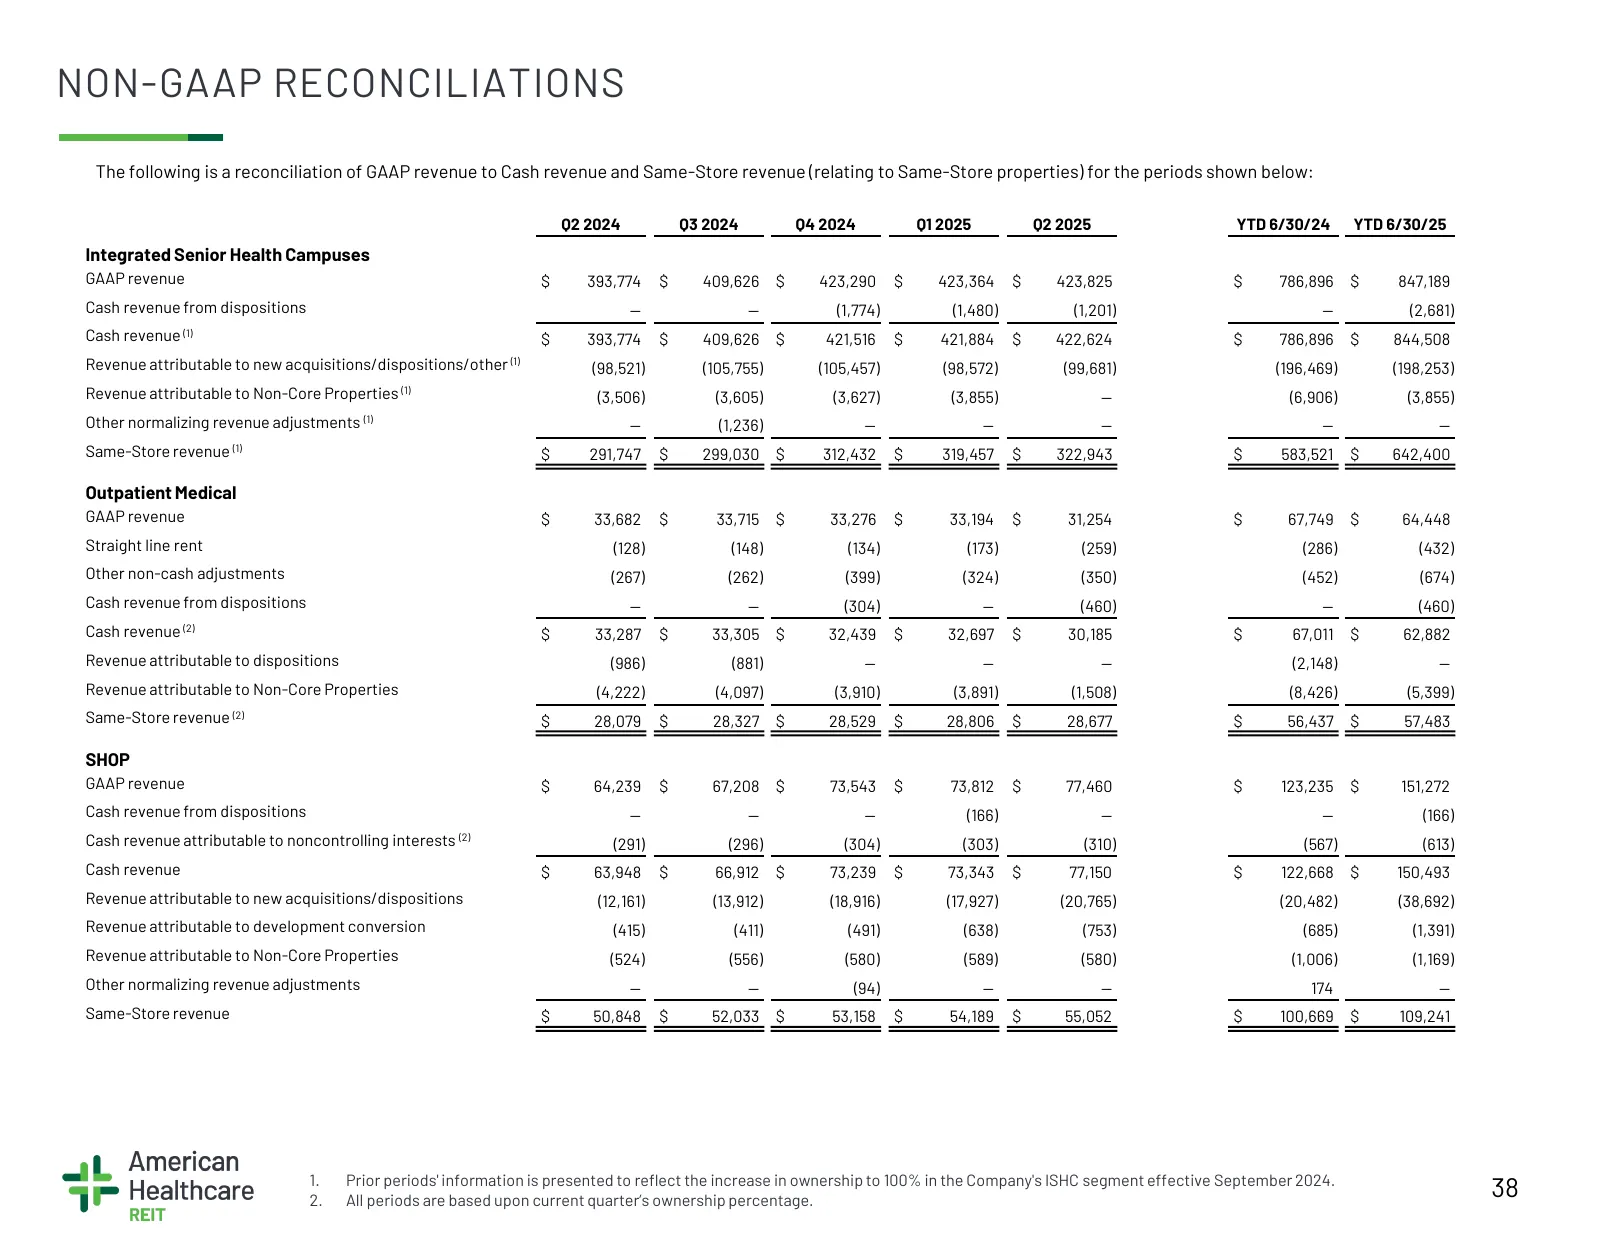
Slide 38: Non-GAAP Reconciliations
NON-GAAP RECONCILIATIONS The following is a reconciliation of GAAP revenue to Cash revenue and Same-Store revenue (relating to Same-Store properties) for the periods shown below: Q2 2024 Q3 2024 Q4 2024 Q1 2025 Q2 2025 YTD 6/30/24 YTD 6/30/25 Integrated Senior Health Campuses GAAP revenue $ 393,774
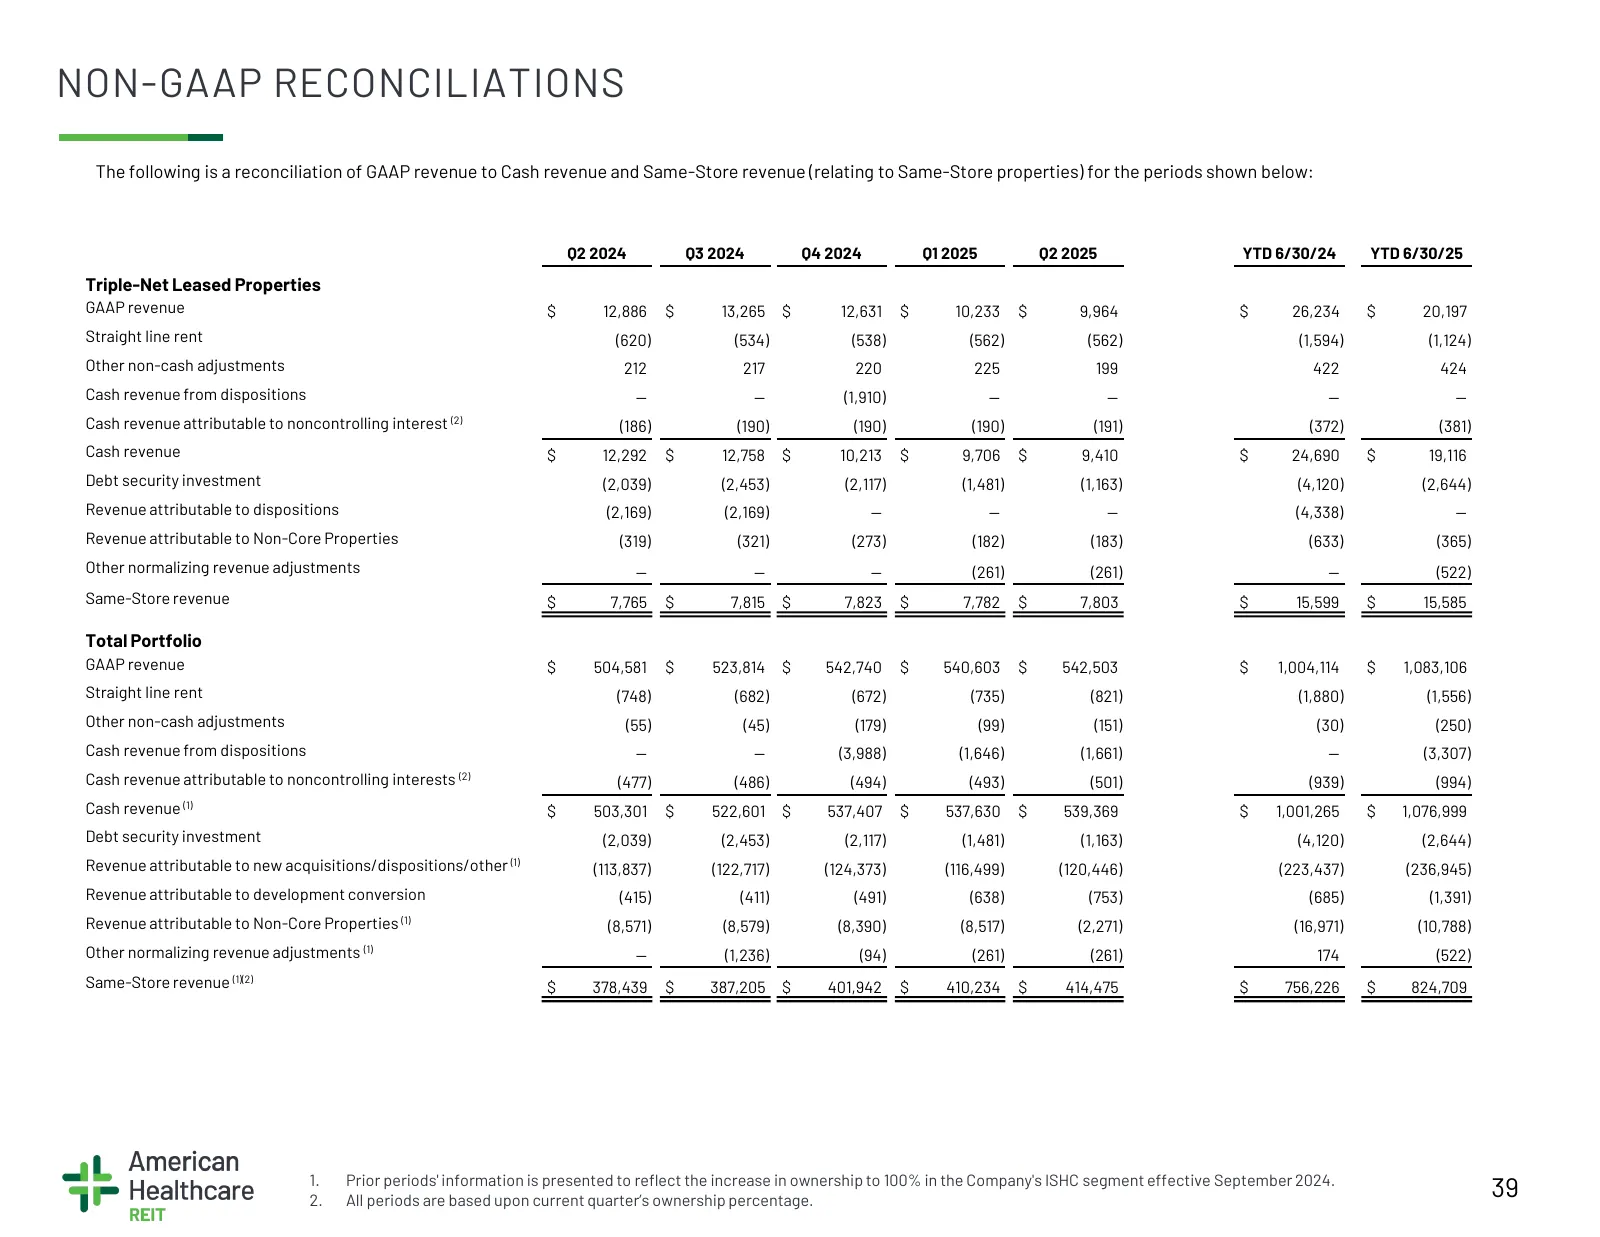
Slide 39: Non-GAAP Reconciliations
NON-GAAP RECONCILIATIONS The following is a reconciliation of GAAP revenue to Cash revenue and Same-Store revenue (relating to Same-Store properties) for the periods shown below: Q2 2024 Q3 2024 Q4 2024 Q1 2025 Q2 2025 YTD 6/30/24 YTD 6/30/25 Triple-Net Leased Properties GAAP revenue $ 12,886 $ 13,2
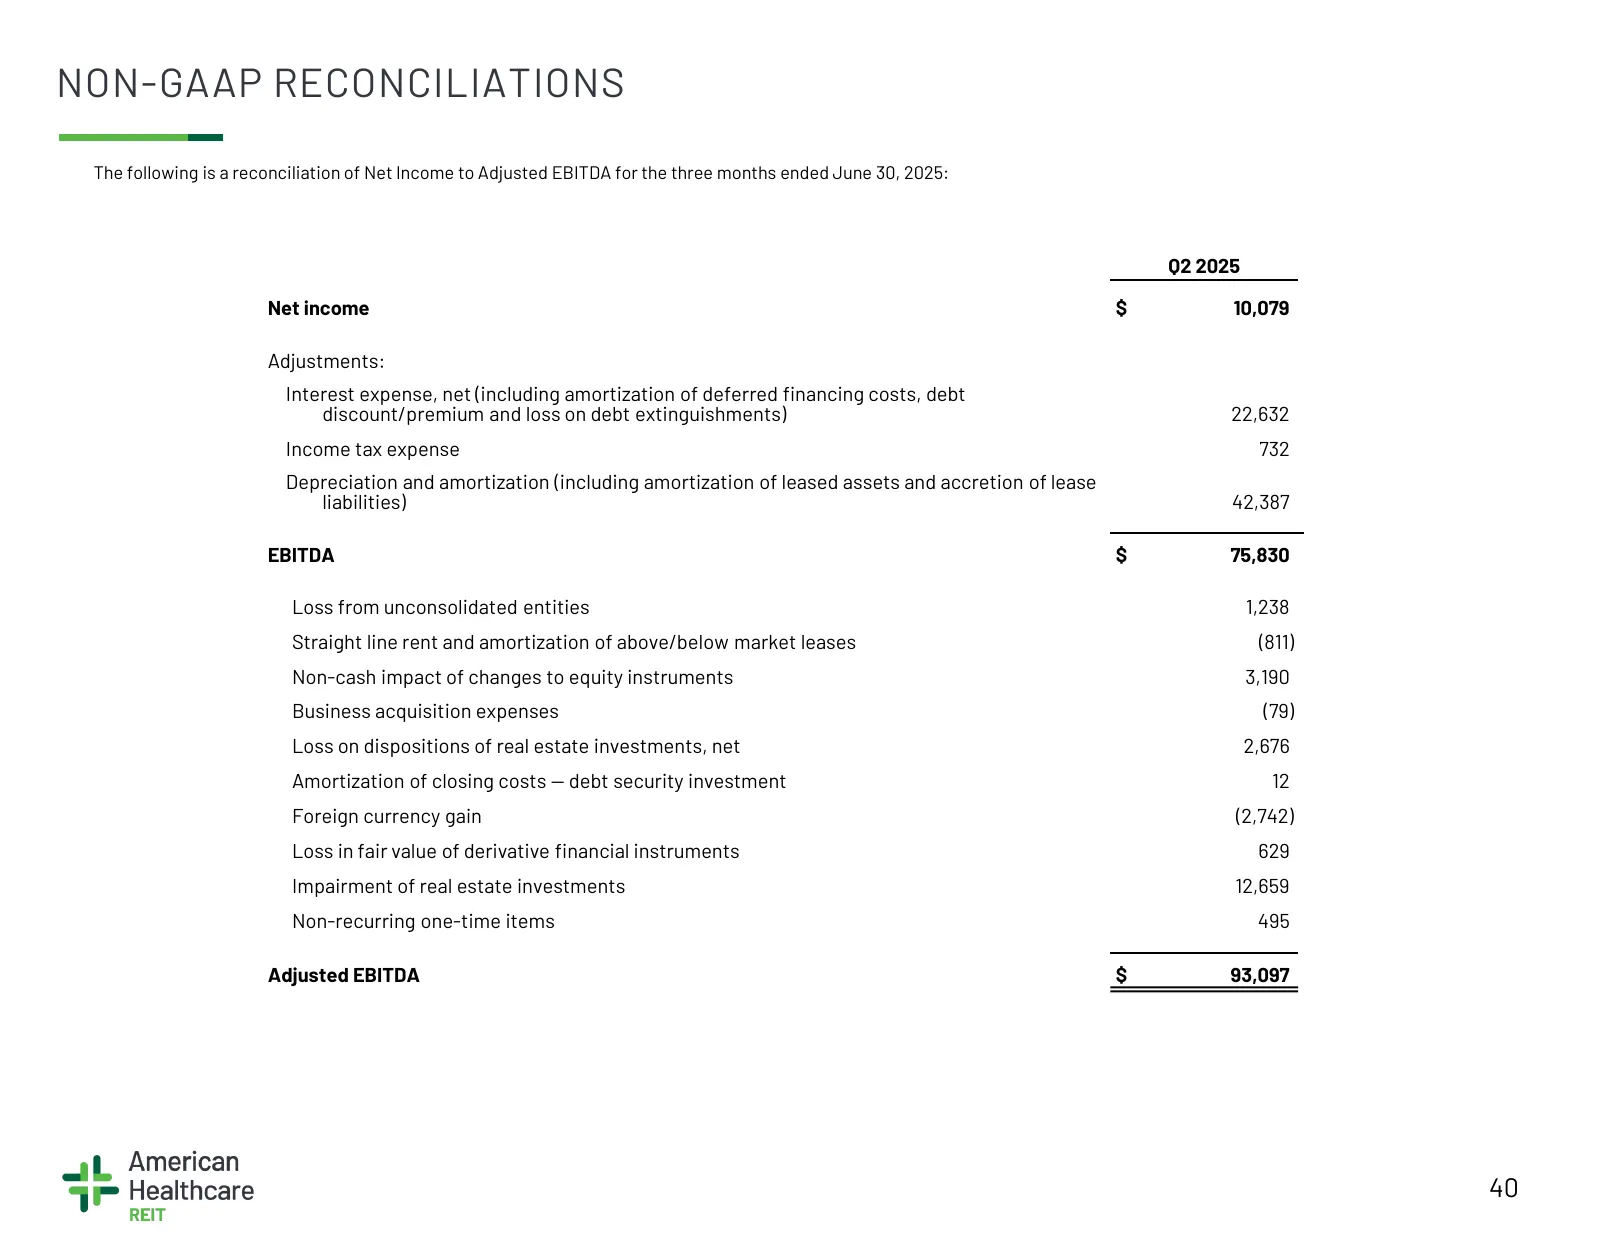
Slide 40: Non-GAAP Reconciliations
NON-GAAP RECONCILIATIONS The following is a reconciliation of Net Income to Adjusted EBITDA for the three months ended June 30, 2025: Q2 2025 Net income $ 10,079 Adjustments: Interest expense, net (including amortization of deferred financing costs, debt discount/premium and loss on debt extinguishm
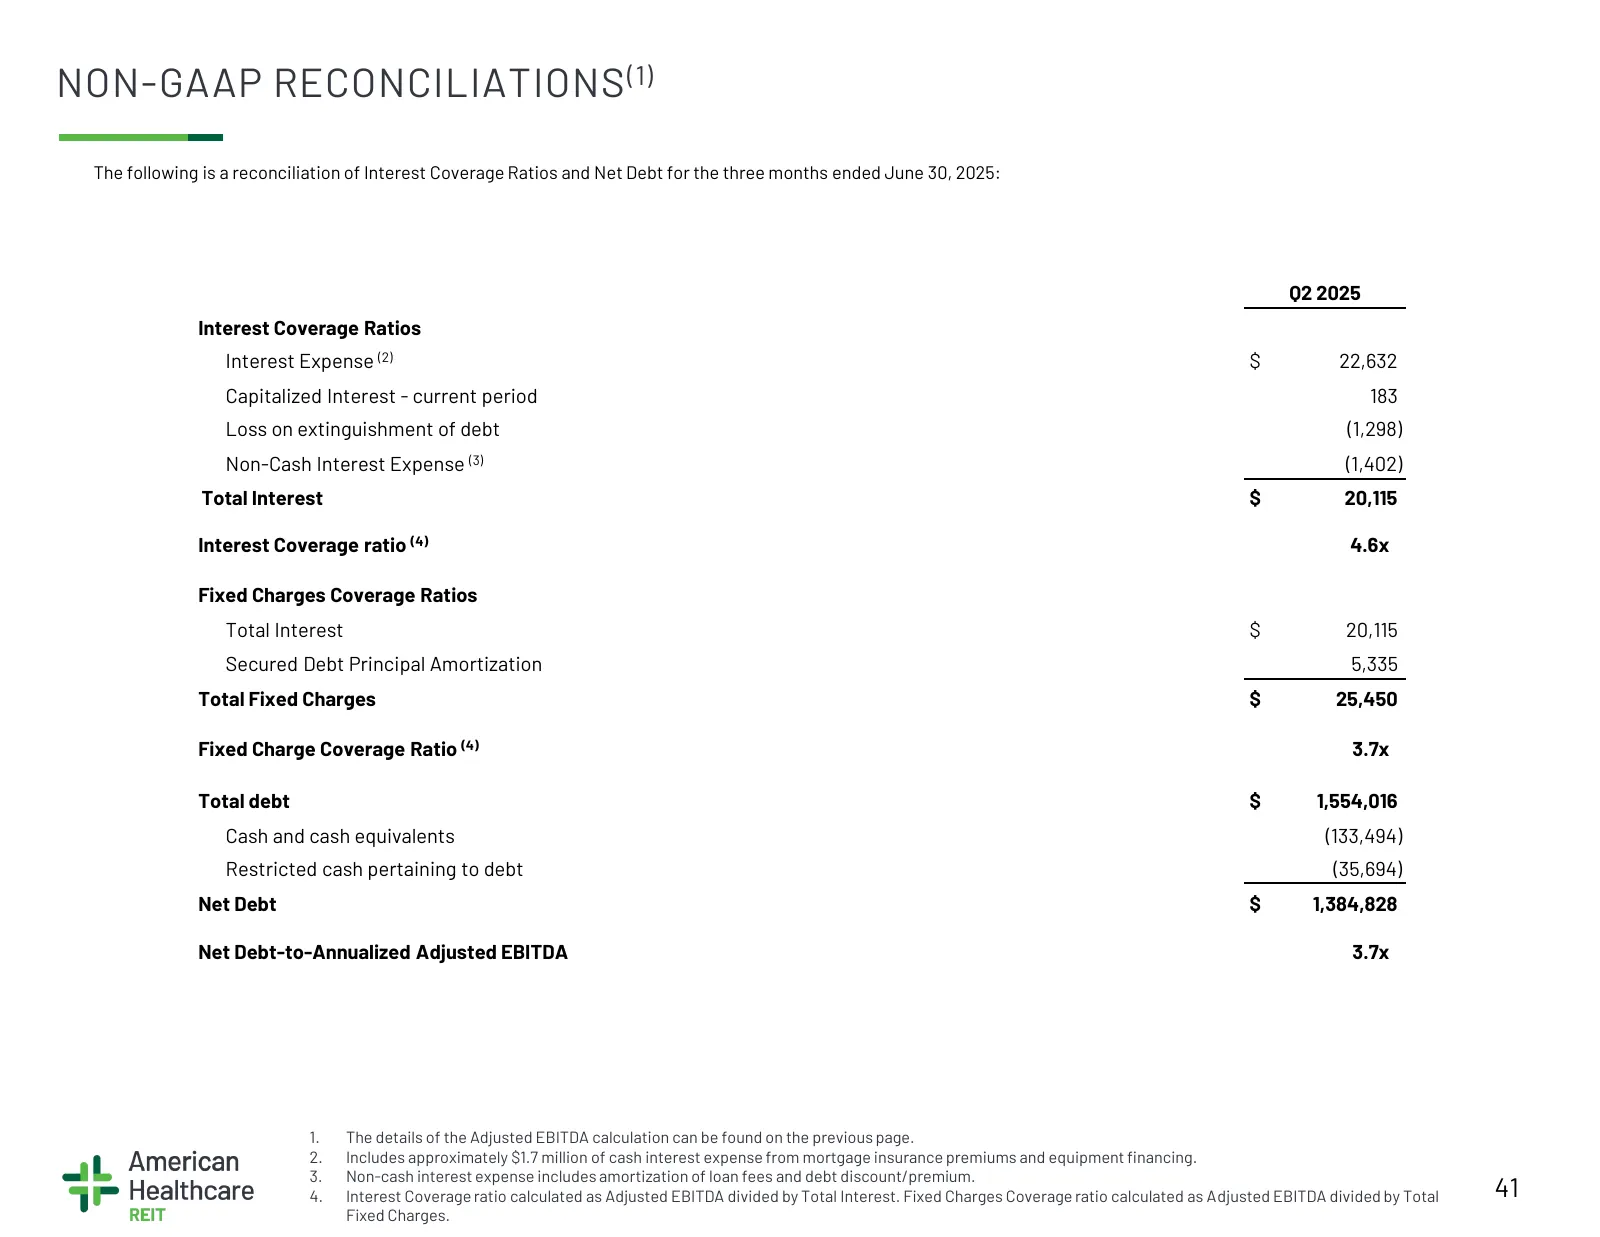
Slide 41: Non-GAAP Reconciliations
NON-GAAP RECONCILIATIONS (1) The following is a reconciliation of Interest Coverage Ratios and Net Debt for the three months ended June 30, 2025: Q2 2025 Interest Coverage Ratios Interest Expense (2) $ 22,632 Capitalized Interest - current period 183 Loss on extinguishment of debt (1,298) Non-Cash I
Source: Internet Archive copy of s203.q4cdn.com
More decks from American Healthcare REIT, Inc.
 Q3 2026 Earnings Presentation56 slides · Nov 6, 2026
 Q3 2026 Earnings Presentation8 slides · Nov 5, 2026
 Investor Presentation (September 2026)55 slides · September 2026
 Q2 2026 Earnings Presentation38 slides · Aug 7, 2026
 Q2 2026 Earnings Presentation6 slides · Aug 6, 2026
 Q1 2026 Earnings Presentation36 slides · May 8, 2026