AuKing Mining Ltd · ASX:AKN
AuKing Mining — China Yunnan Copper Australia — Investor Presentation (November 2007)
33 slides from AuKing Mining's investor presentation, Nov 13, 2007
Slide 1: A partnership with a competitive edge
“A partnership with a competitive edge” Presentation by Dr Mark Elliott Managing Director Sydney 13th November 2007 1
Slide 2: Disclaimer
Disclaimer Whilst this document and presentation is based on the information from sources which are considered reliable , China Yunnan Copper Australia Limited , its directors, employees and consultants do not represent, warrant or guarantee, expressly or impliedly , that the information in this doc
Slide 3: Contents
Contents Our Chinese Australian Partnership CYU – The Company Board of Directors Projects Mining Boom – For how long? Why Invest in CYU? 3
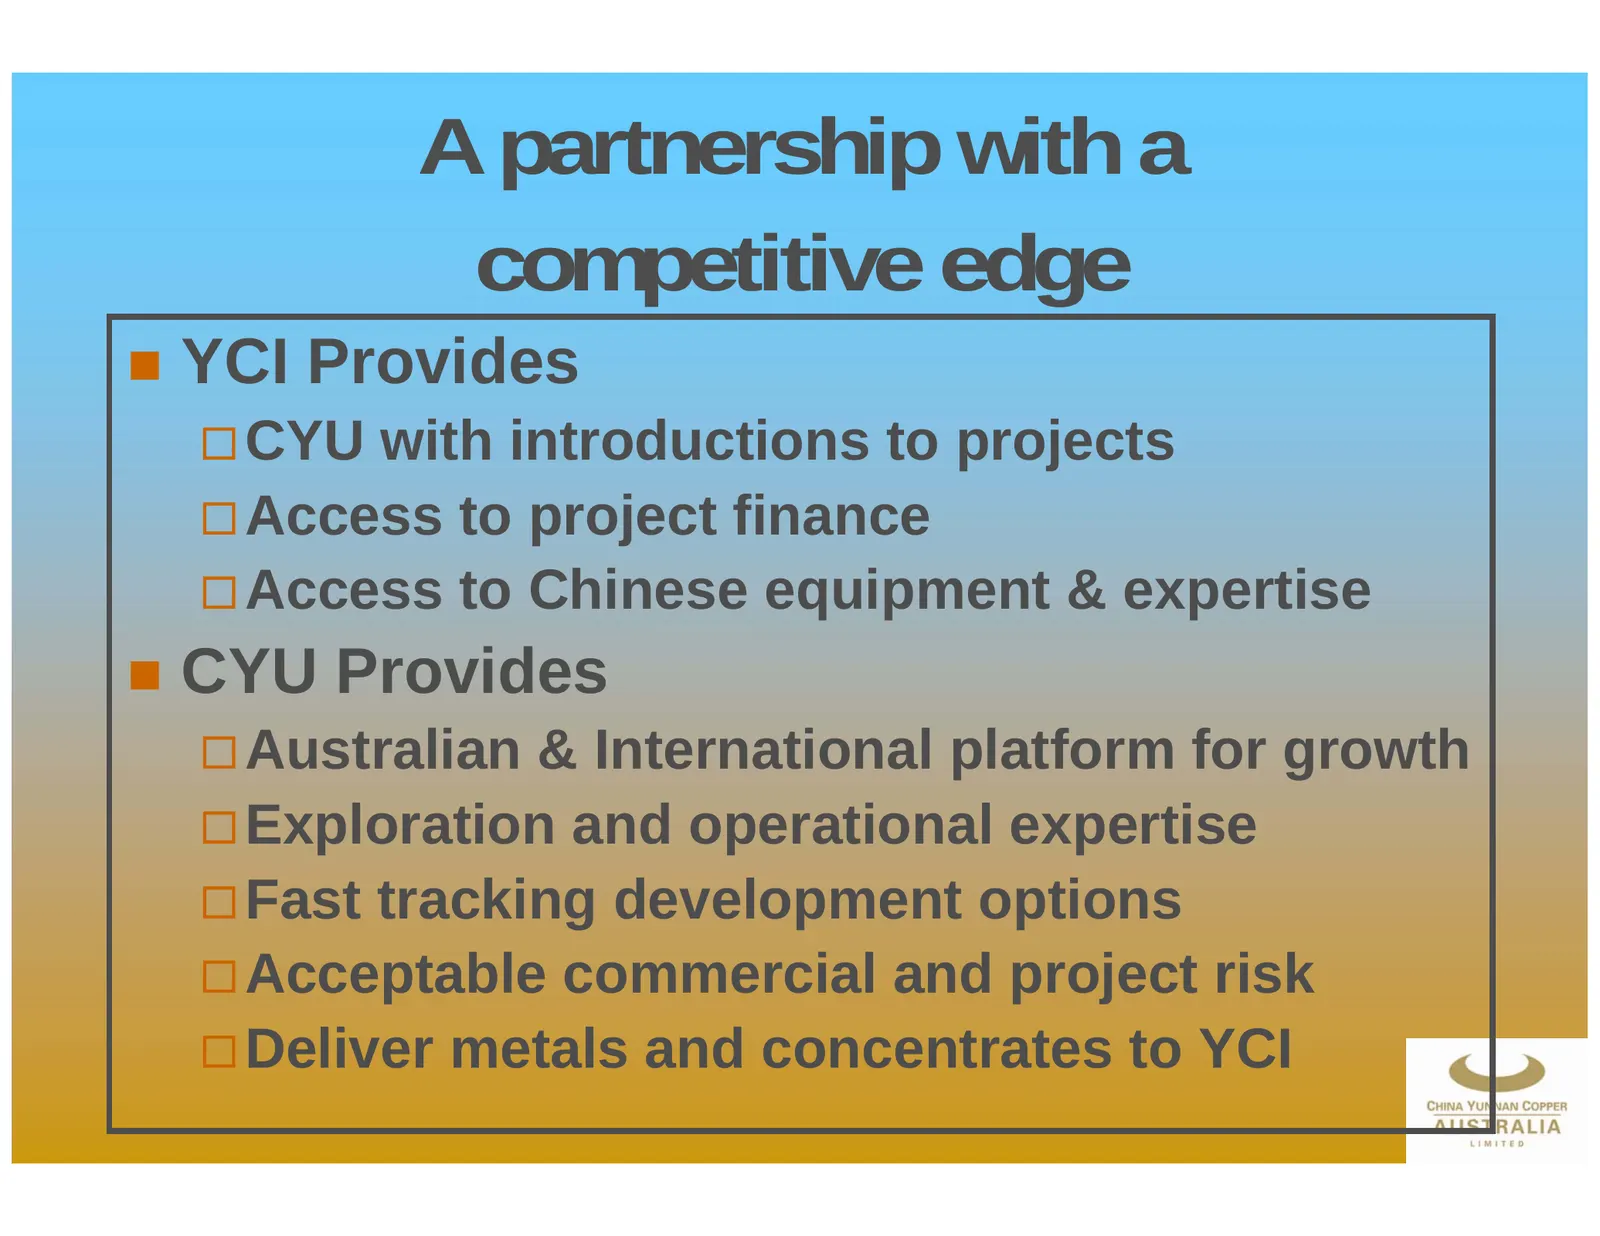
Slide 4: A partnership with a competitive edge
A partnership with a competitive edge YCI Provides CYU with introductions to projects Access to project finance Access to Chinese equipment & expertise CYU Provides Australian & International platform for growth Exploration and operational expertise Fast tracking development options Acceptable c
Slide 5: CYU - The Company (as at Nov 2007)
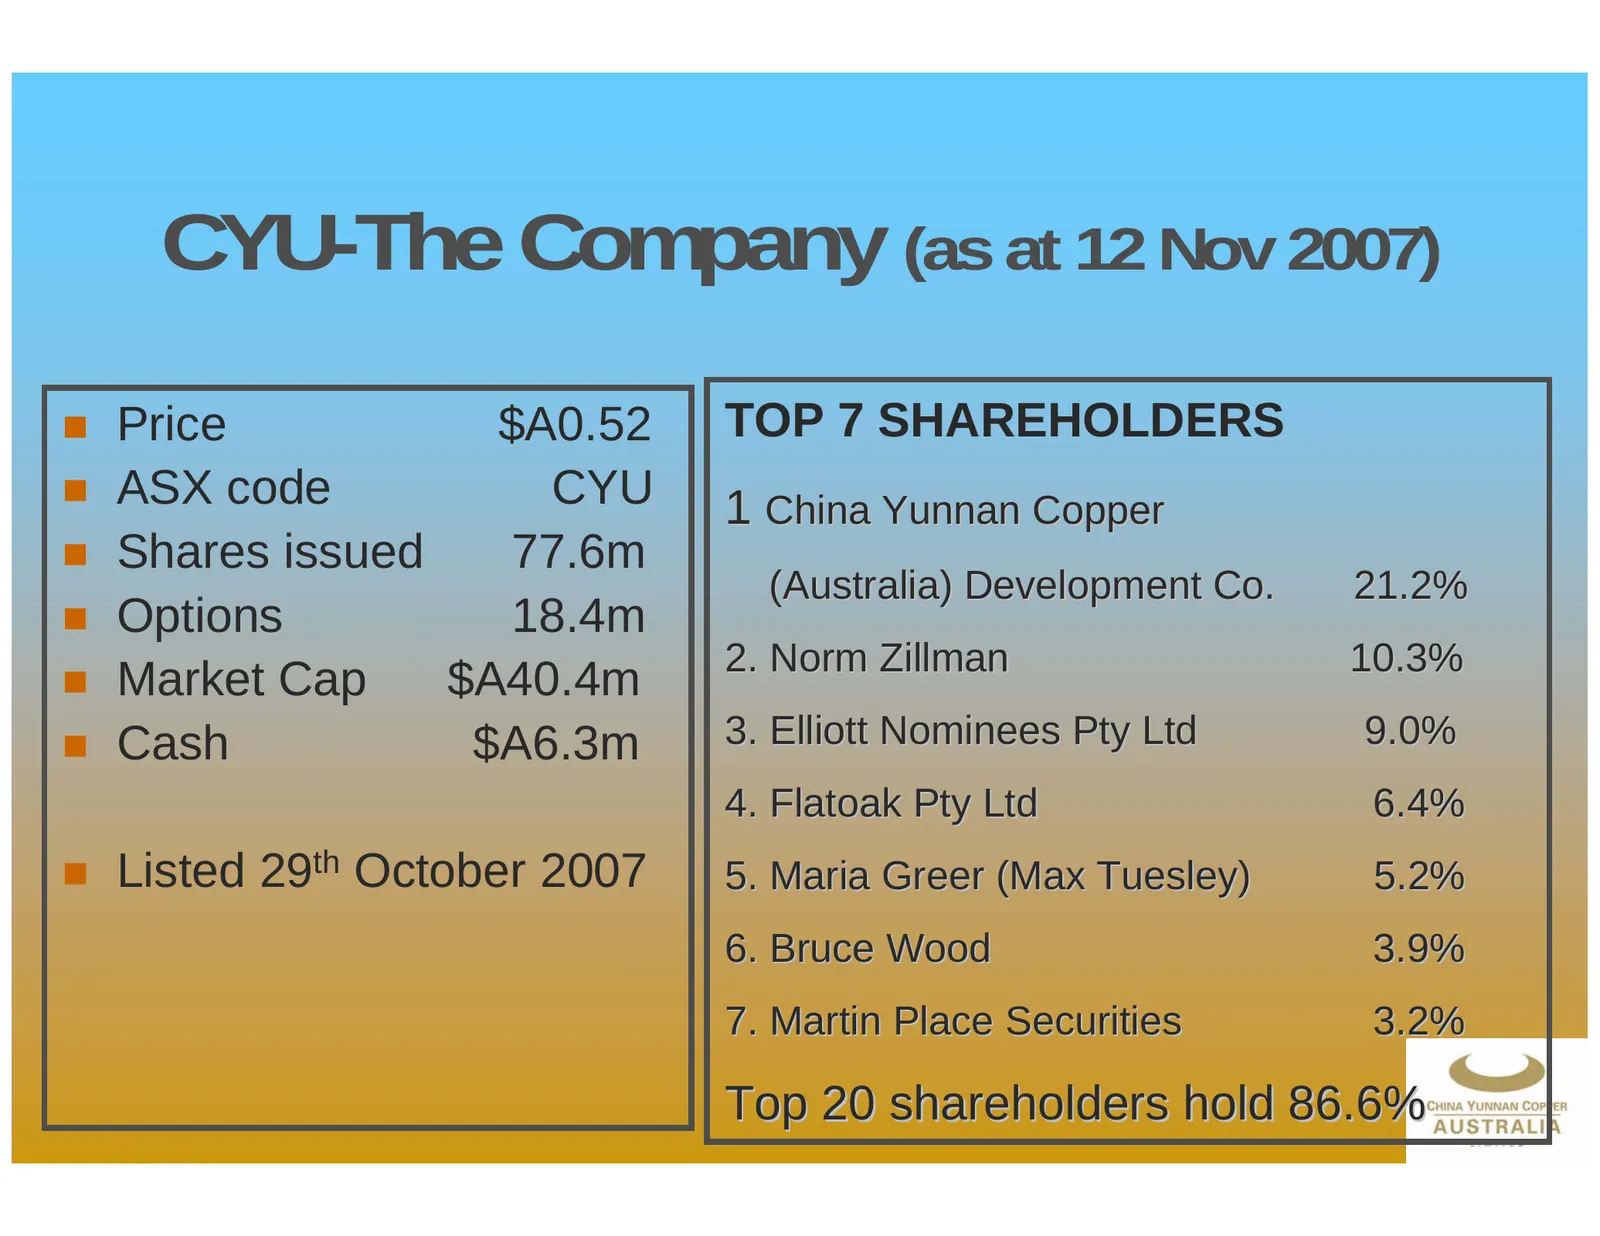
CYU-The Company (as at 12 Nov 2007) Price $A0.52 TOP 7 SHAREHOLDERS ASX code CYU 1 China Yunnan Copper Shares issued 77.6m (Australia) Development Co. 21.2% Options 18.4m 2. Norm Zillman 10.3% Market Cap $A40.4m Cash $A6.3m 3. Elliott Nominees Pty Ltd 9.0% 4. Flatoak Pty Ltd 6.4% Liste
Slide 6: Board of Directors
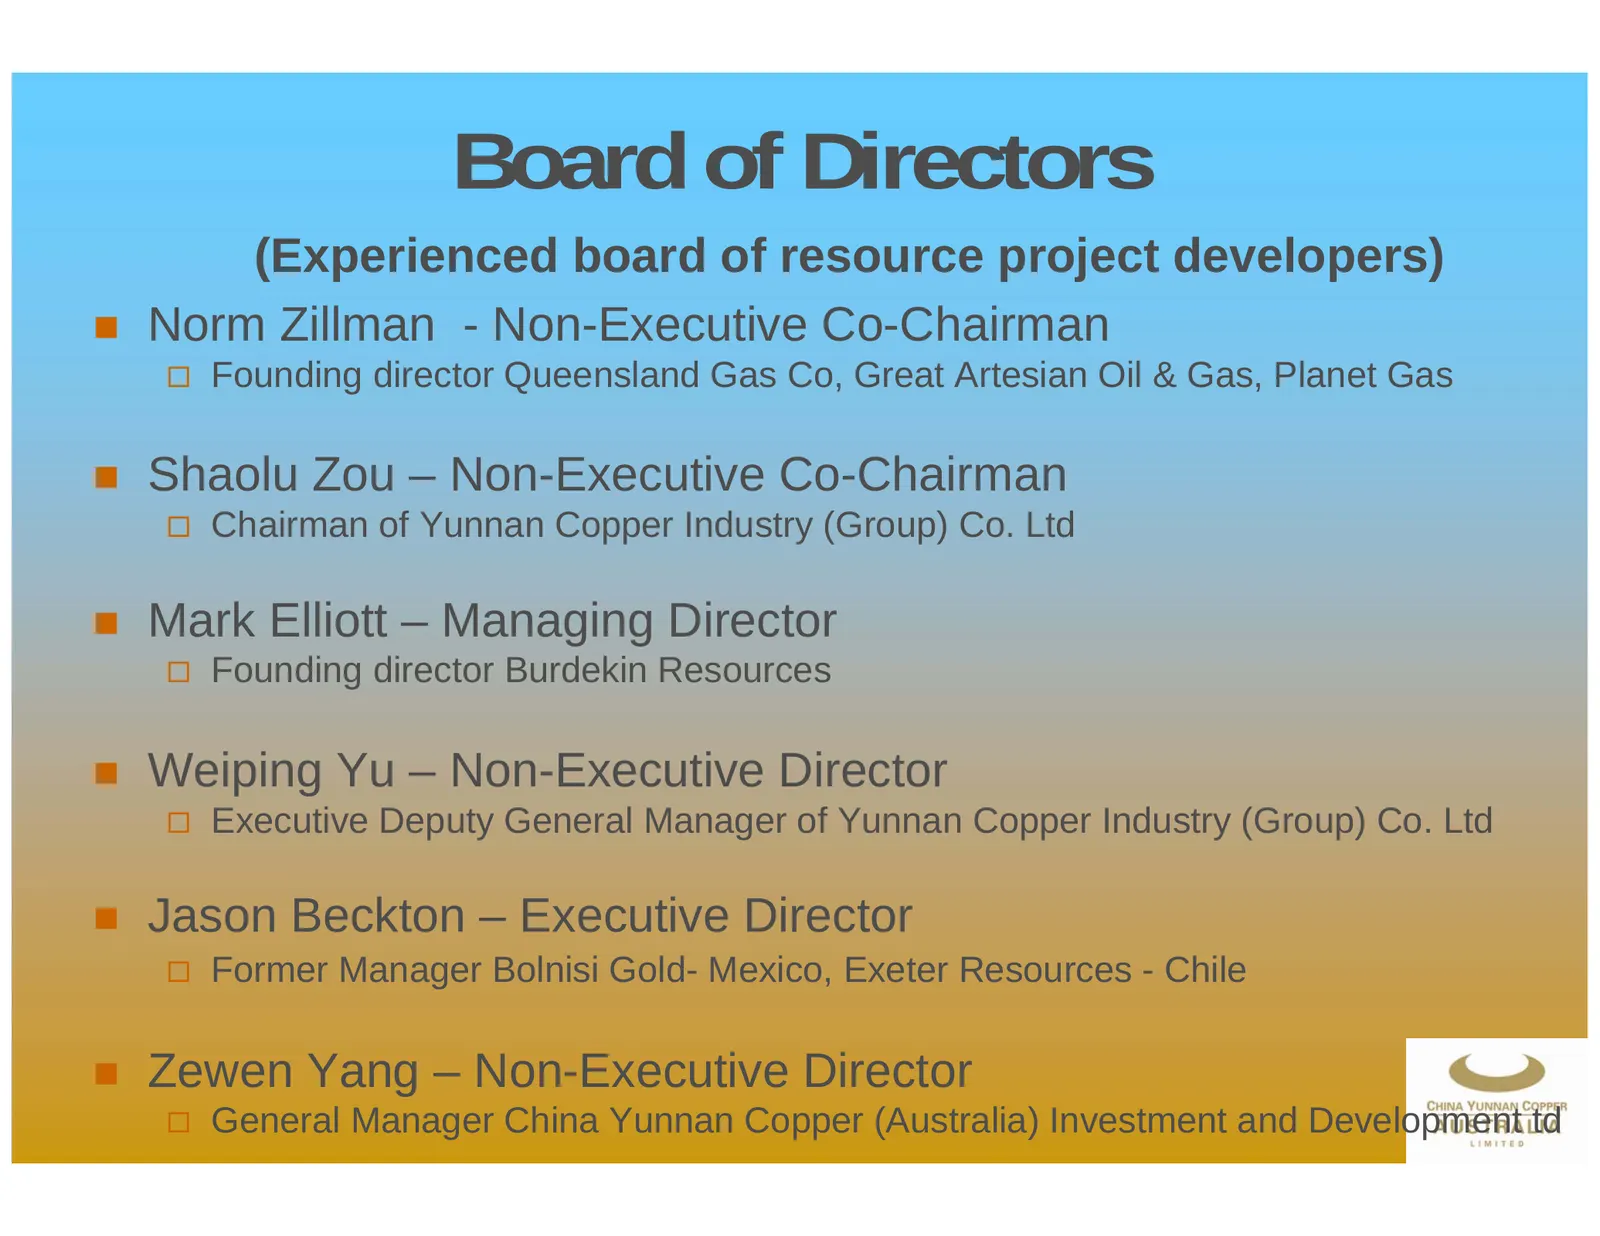
Board of Directors (Experienced board of resource project developers) Norm Zillman - Non-Executive Co-Chairman Founding director Queensland Gas Co, Great Artesian Oil & Gas, Planet Gas Shaolu Zou – Non-Executive Co-Chairman Chairman of Yunnan Copper Industry (Group) Co. Ltd Mark Elliott – Mana
Slide 7: Location of Projects
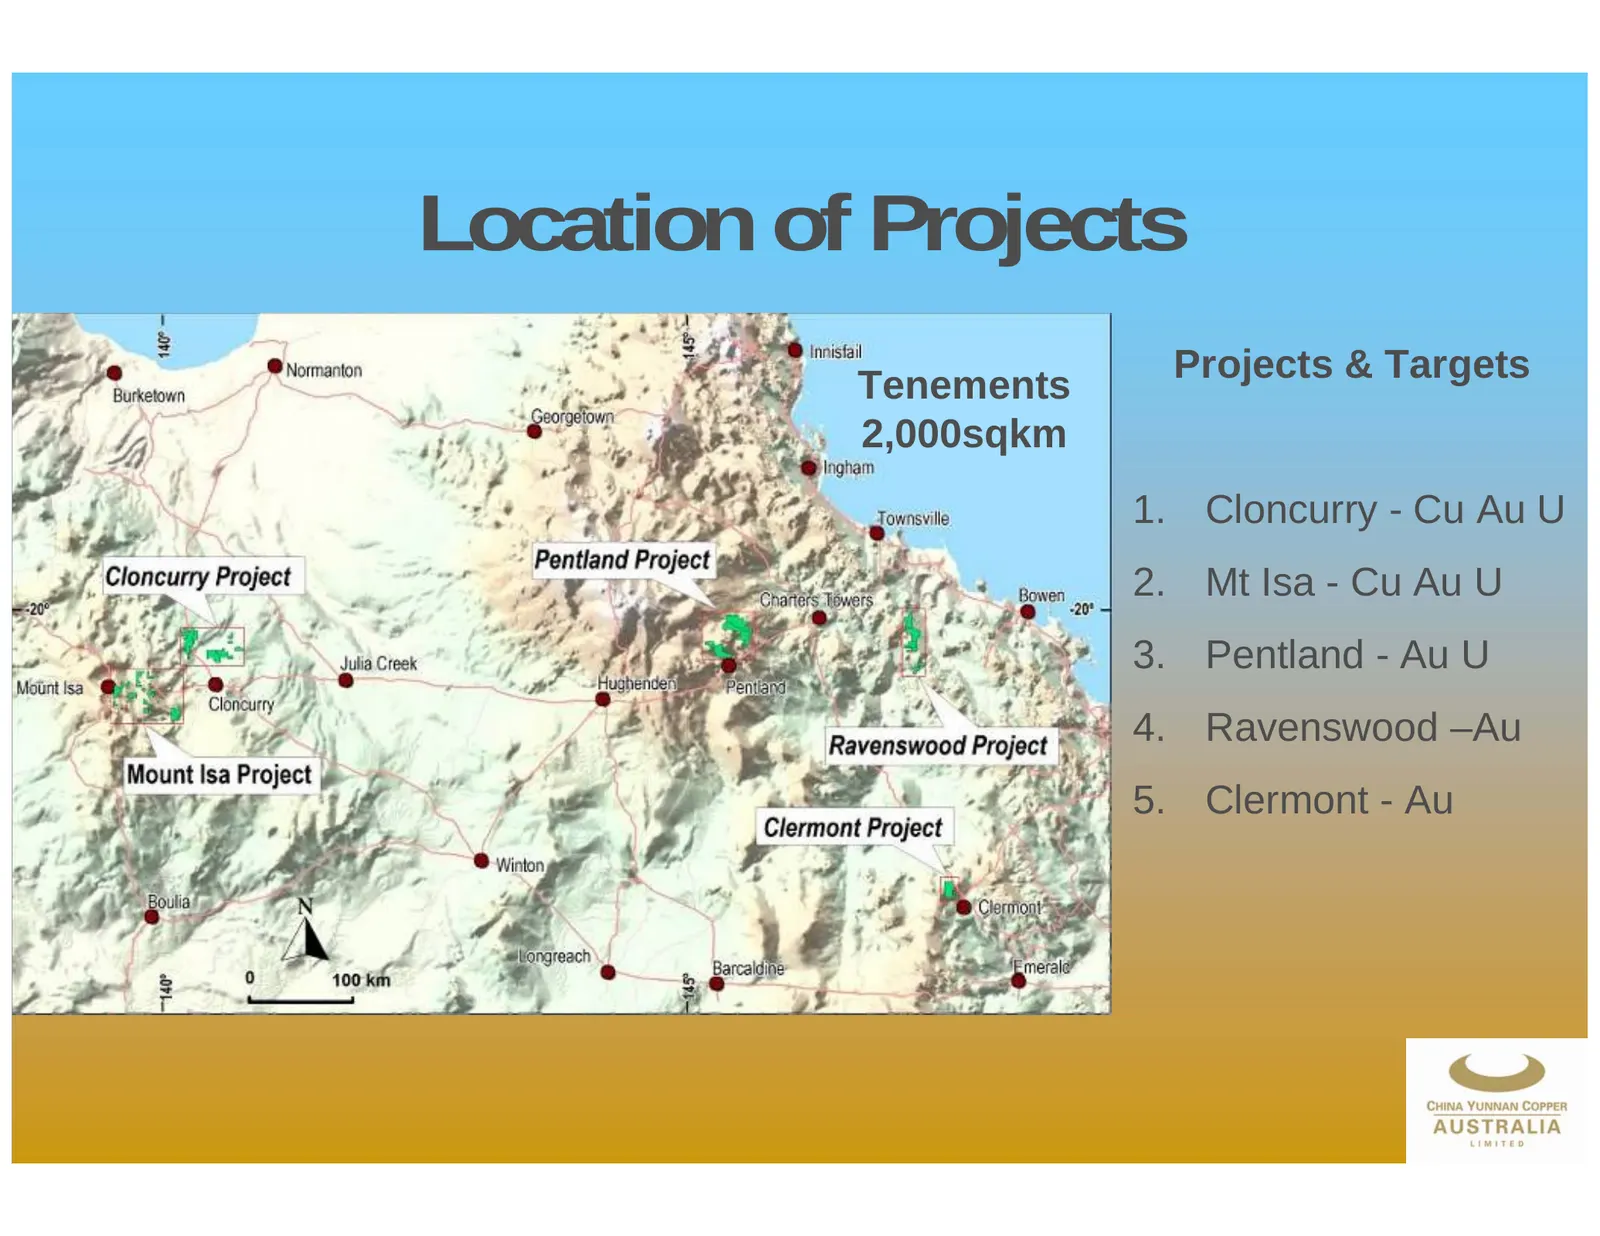
Location of Projects Projects & Targets Tenements 2,000sqkm 1. Cloncurry - Cu Au U 2. Mt Isa - Cu Au U 3. Pentland - Au U 4. Ravenswood –Au 5. Clermont - Au 7
Slide 8: NW Qld - The Place to be
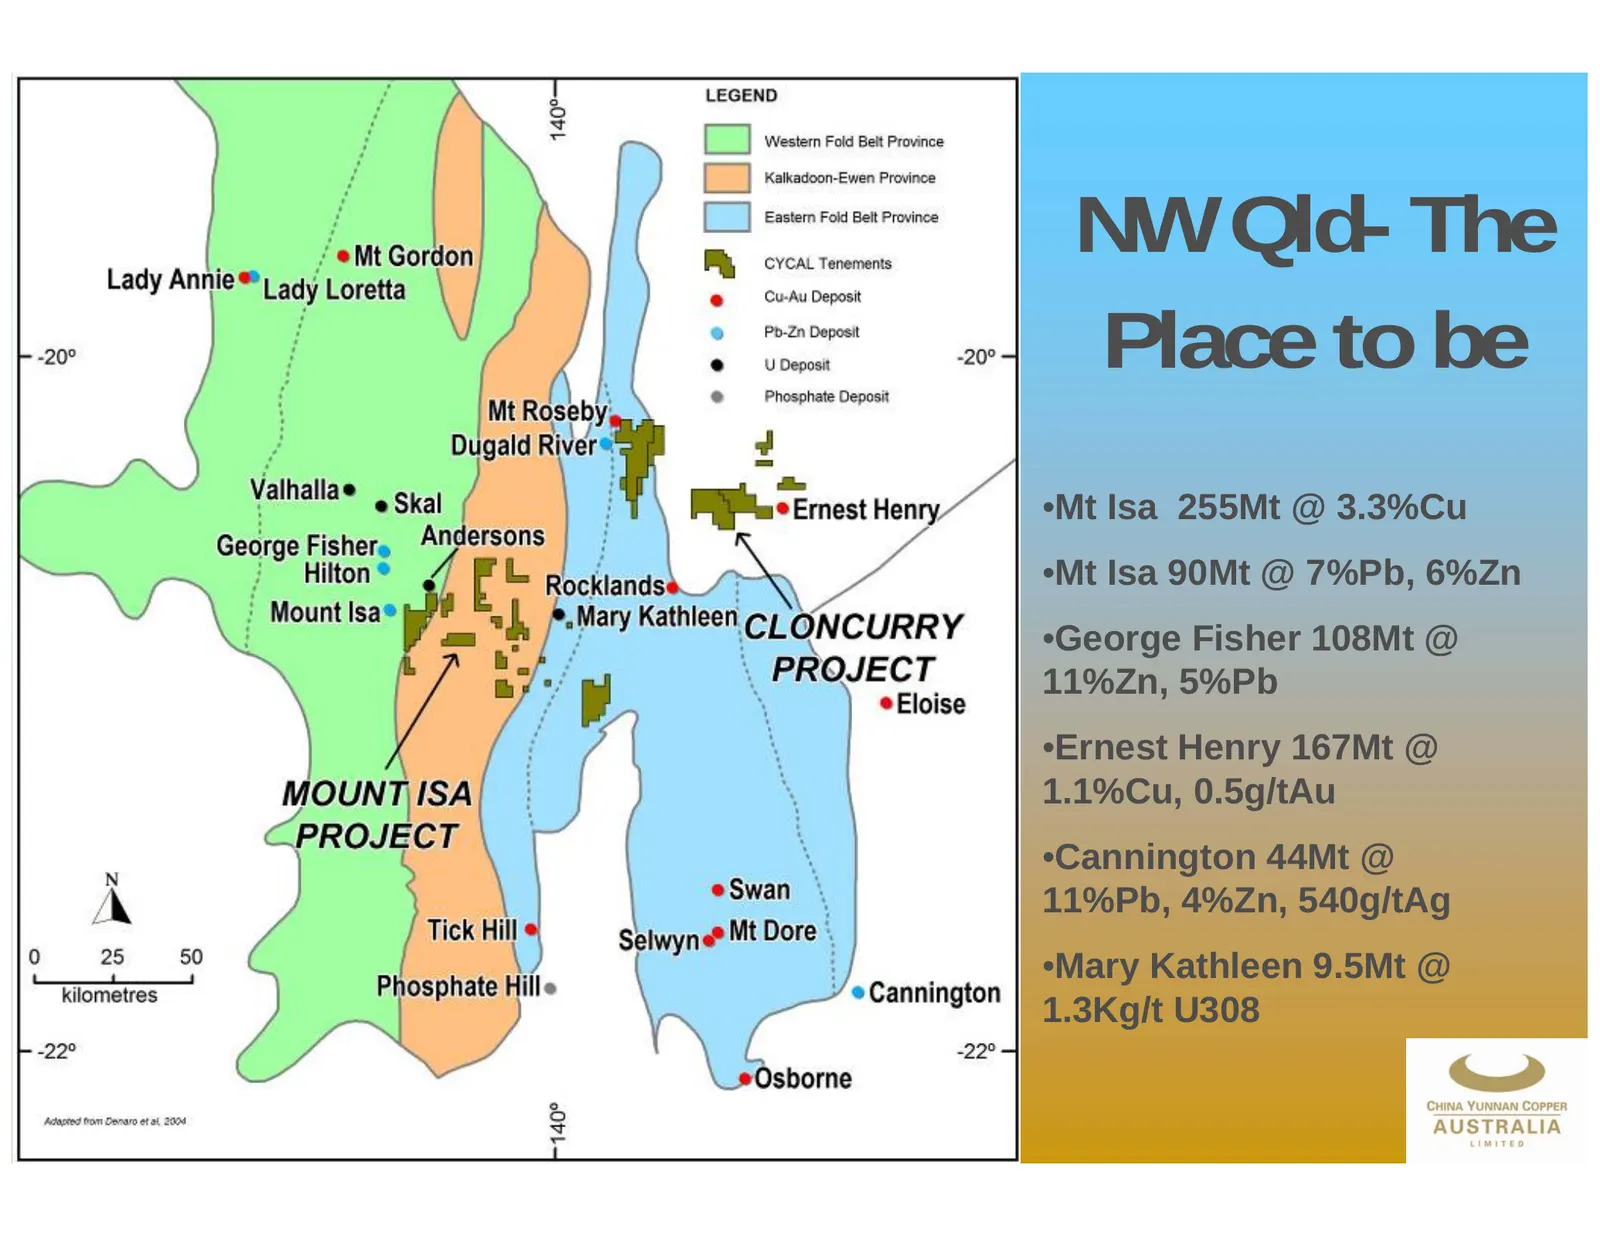
NW Qld- The Place to be •Mt Isa 255Mt @ 3.3%Cu •Mt Isa 90Mt @ 7%Pb, 6%Zn •George Fisher 108Mt @ 11%Zn, 5%Pb •Ernest Henry 167Mt @ 1.1%Cu, 0.5g/tAu •Cannington 44Mt @ 11%Pb, 4%Zn, 540g/tAg •Mary Kathleen 9.5Mt @ 1.3Kg/t U308 8
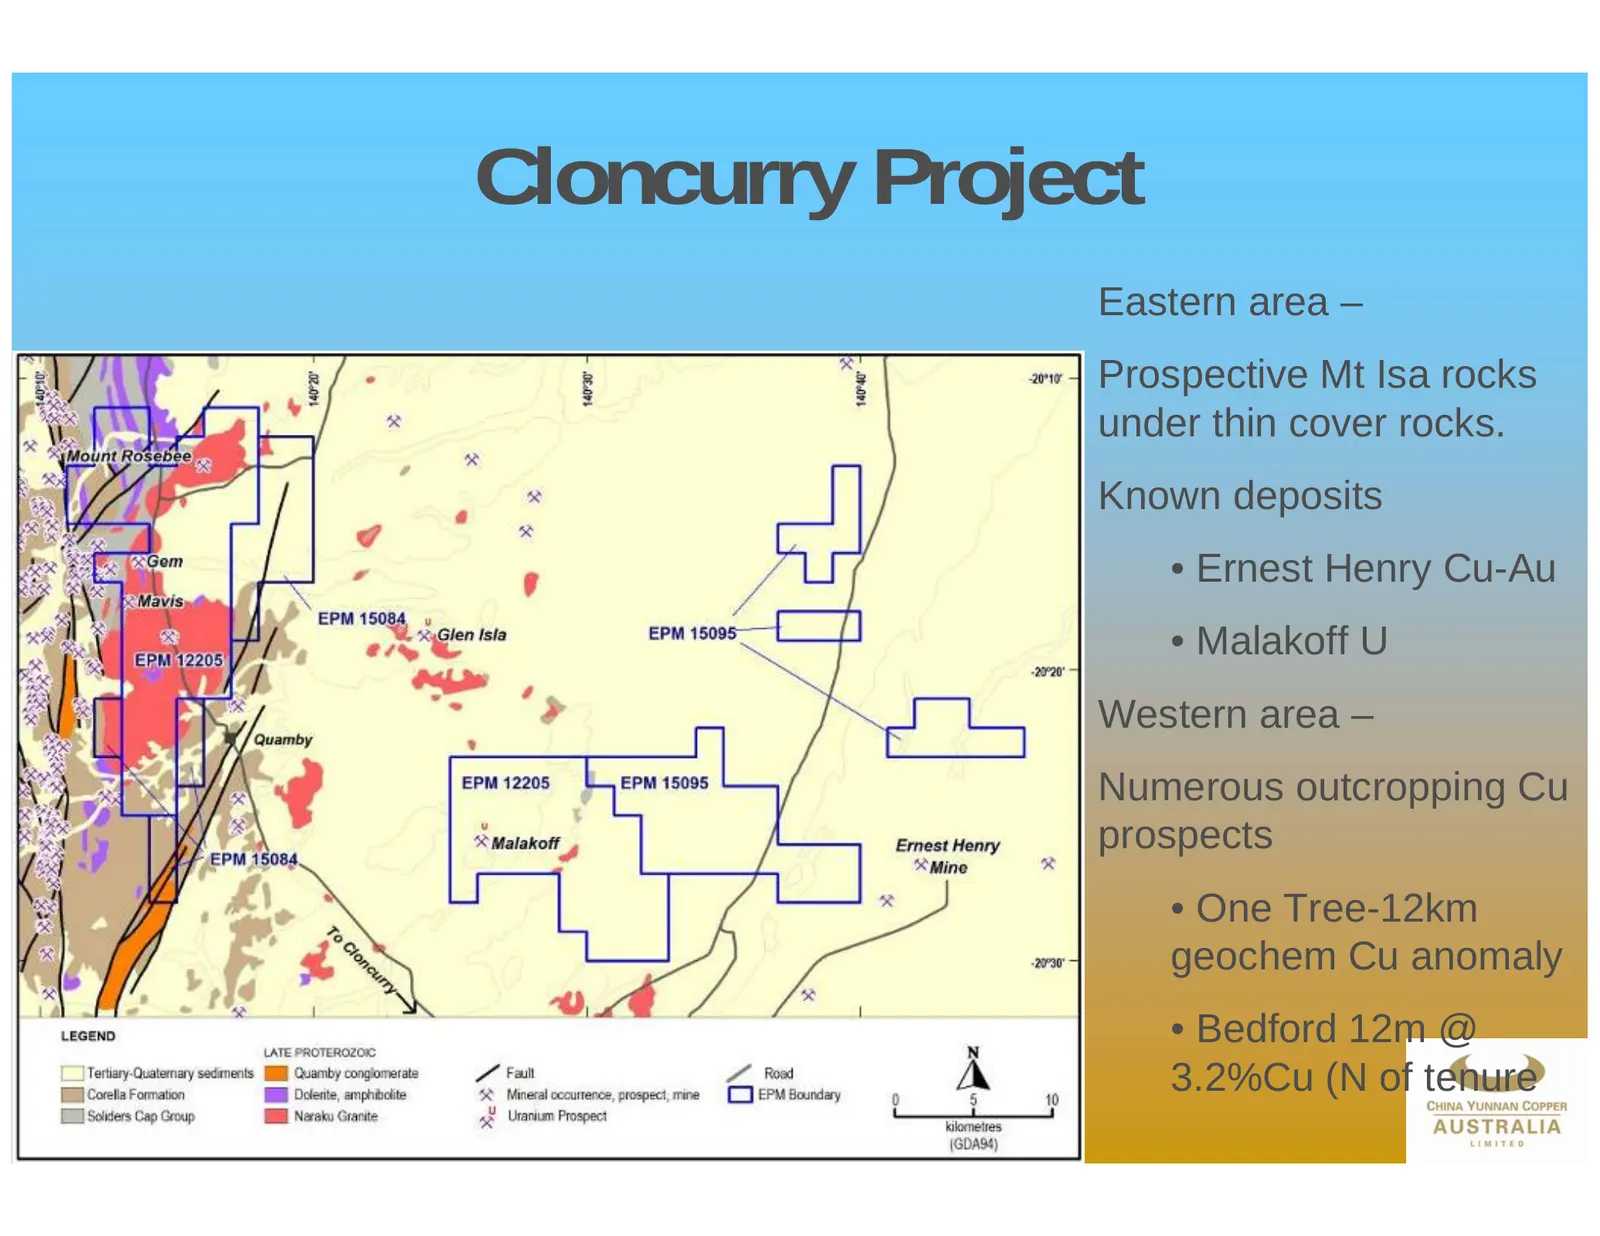
Slide 9: Cloncurry Project
Cloncurry Project Eastern area – Prospective Mt Isa rocks under thin cover rocks. Known deposits • Ernest Henry Cu-Au • Malakoff U Western area – Numerous outcropping Cu prospects • One Tree-12km geochem Cu anomaly • Bedford 12m @ 3.2%Cu (N of tenure 9
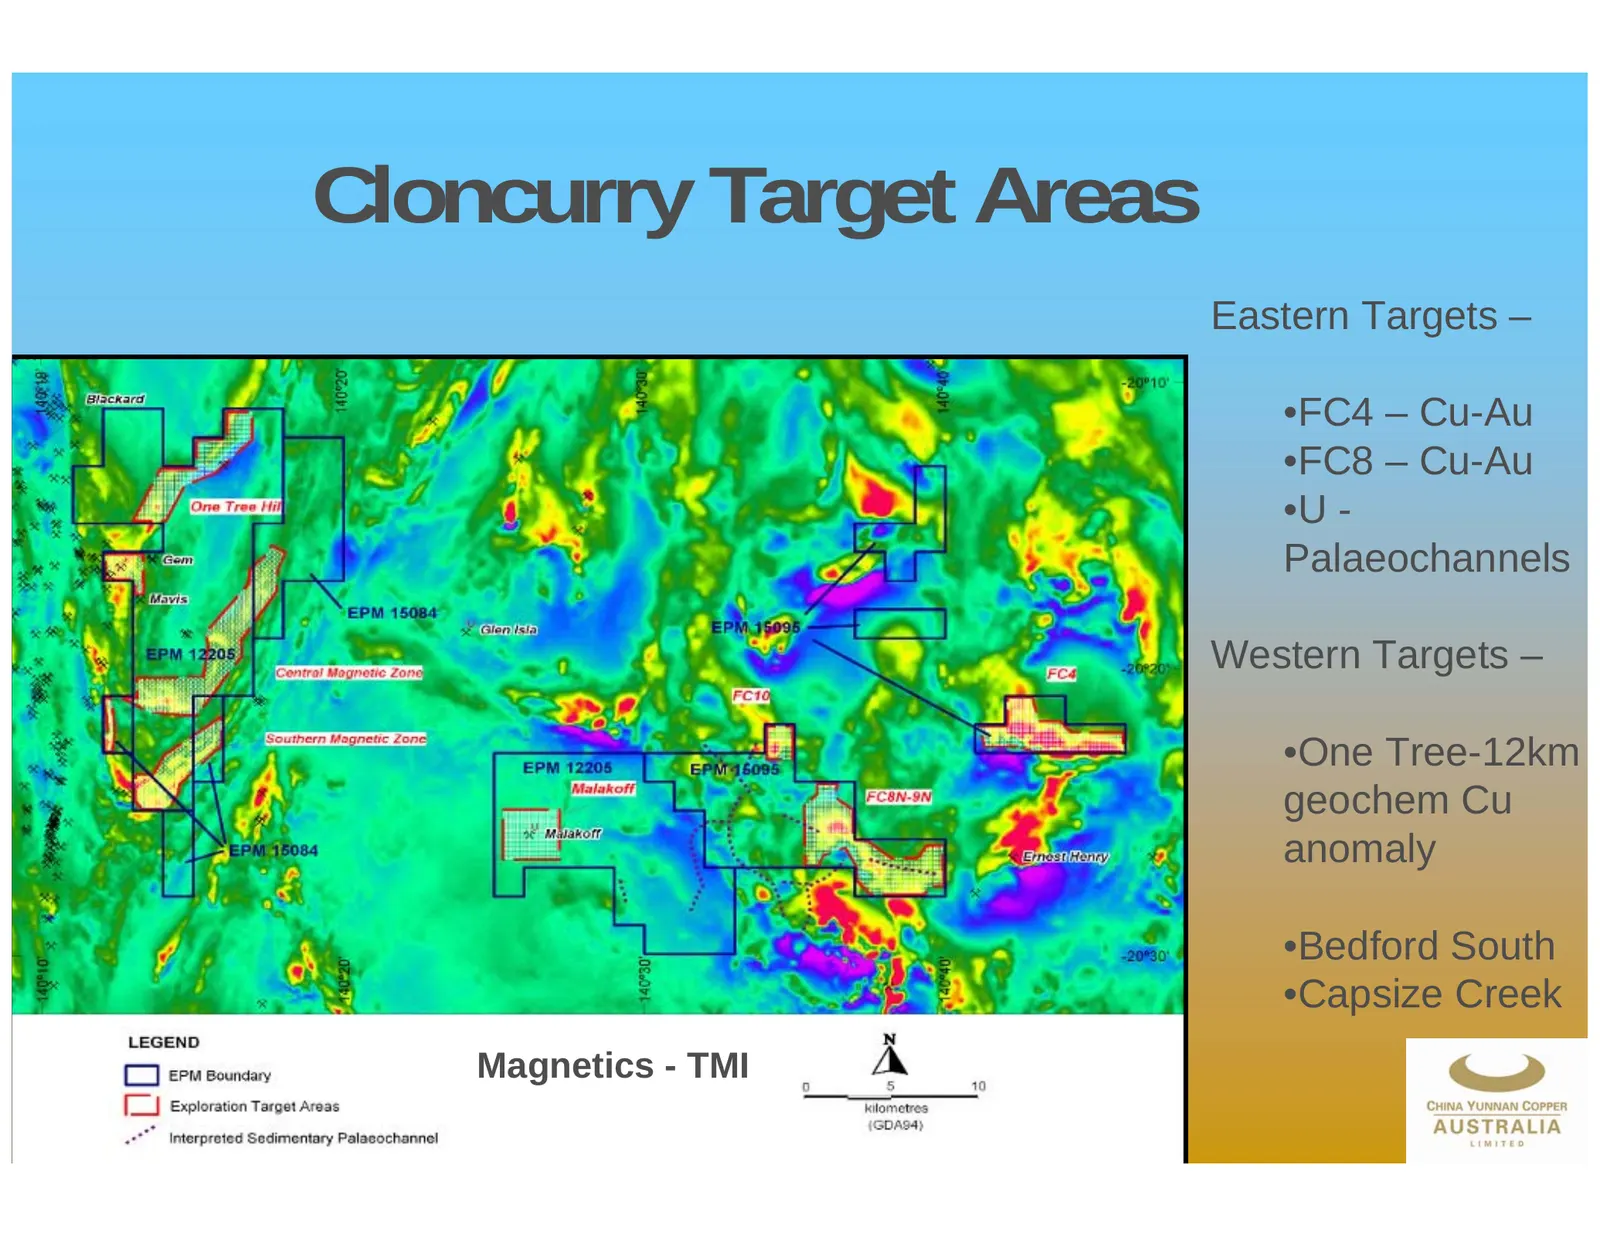
Slide 10: Cloncurry Target Areas
Cloncurry Target Areas Eastern Targets – •FC4 – Cu-Au •FC8 – Cu-Au •U - Palaeochannels Western Targets – •One Tree-12km geochem Cu anomaly •Bedford South •Capsize Creek Magnetics - TMI 10
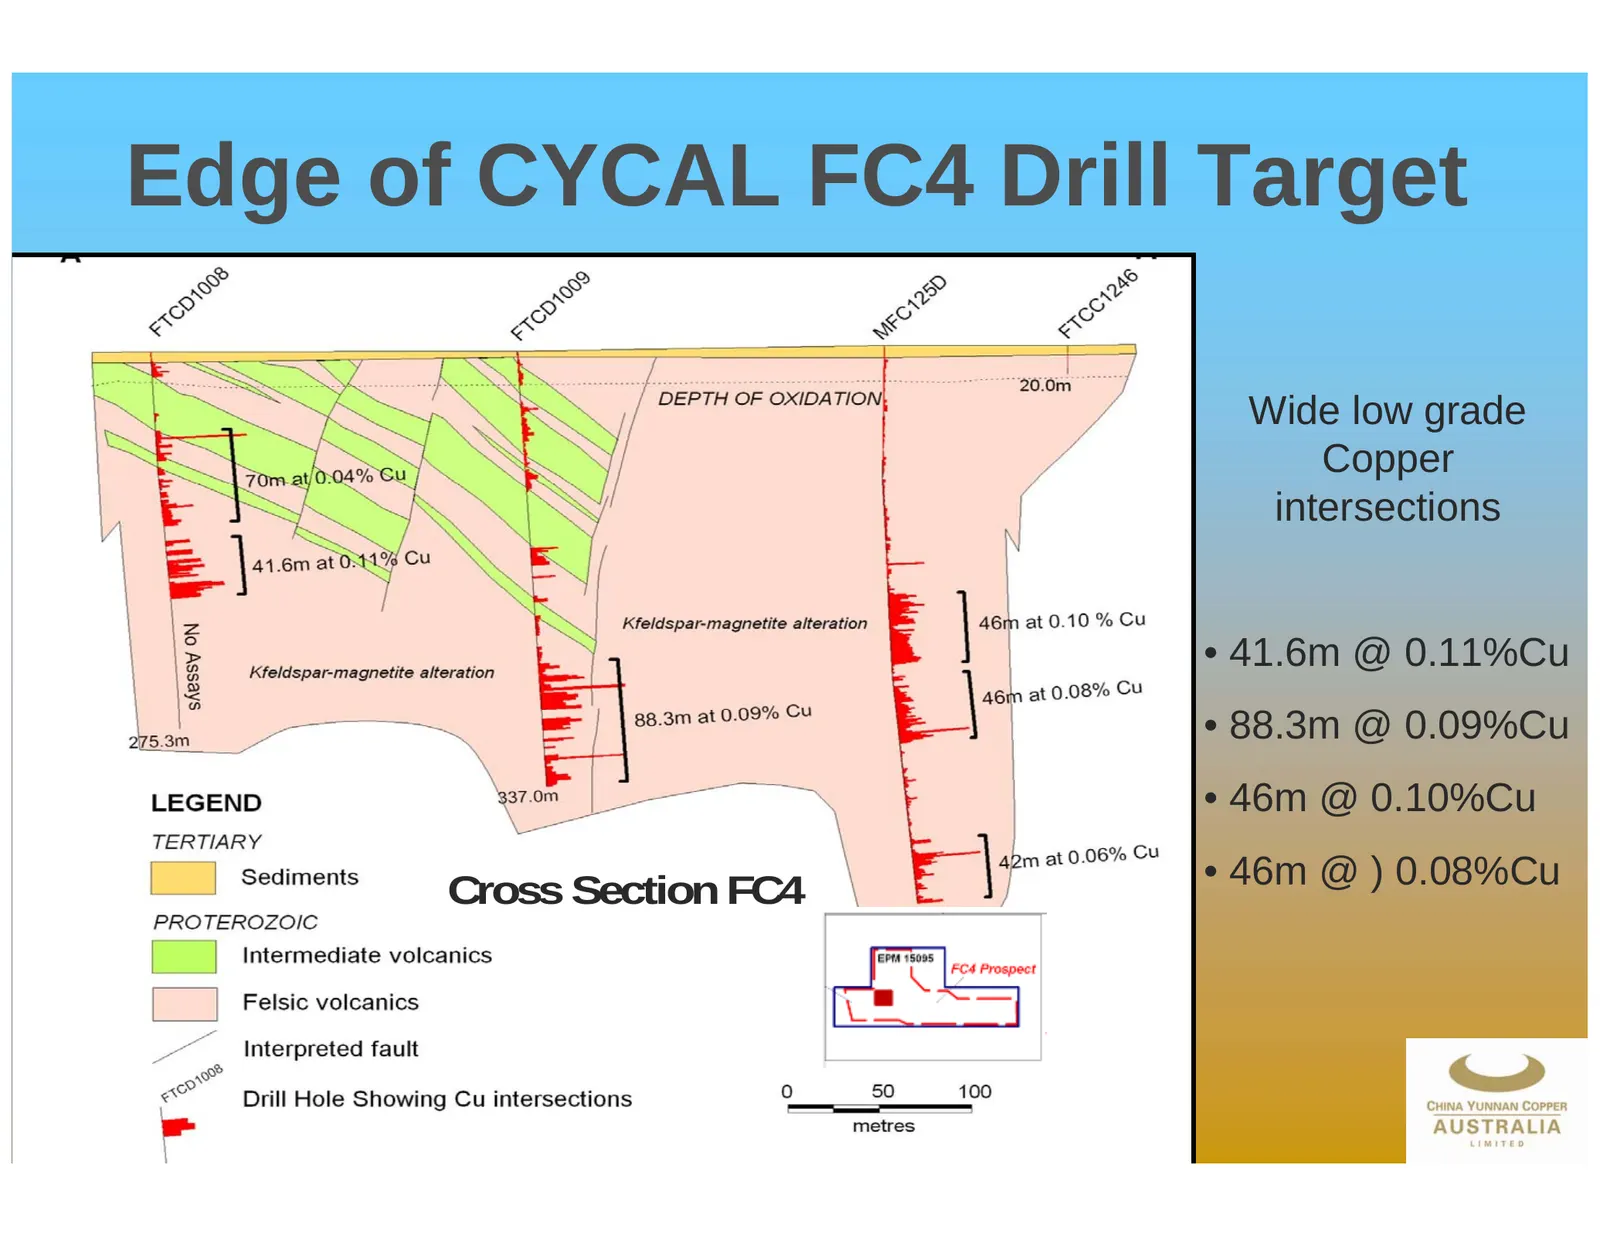
Slide 11: Edge of CYCAL FC4 Drill Target
Edge of CYCAL FC4 Drill Target Wide low grade Copper intersections • 41.6m @ 0.11%Cu • 88.3m @ 0.09%Cu • 46m @ 0.10%Cu Cross Section FC4 • 46m @ ) 0.08%Cu 11
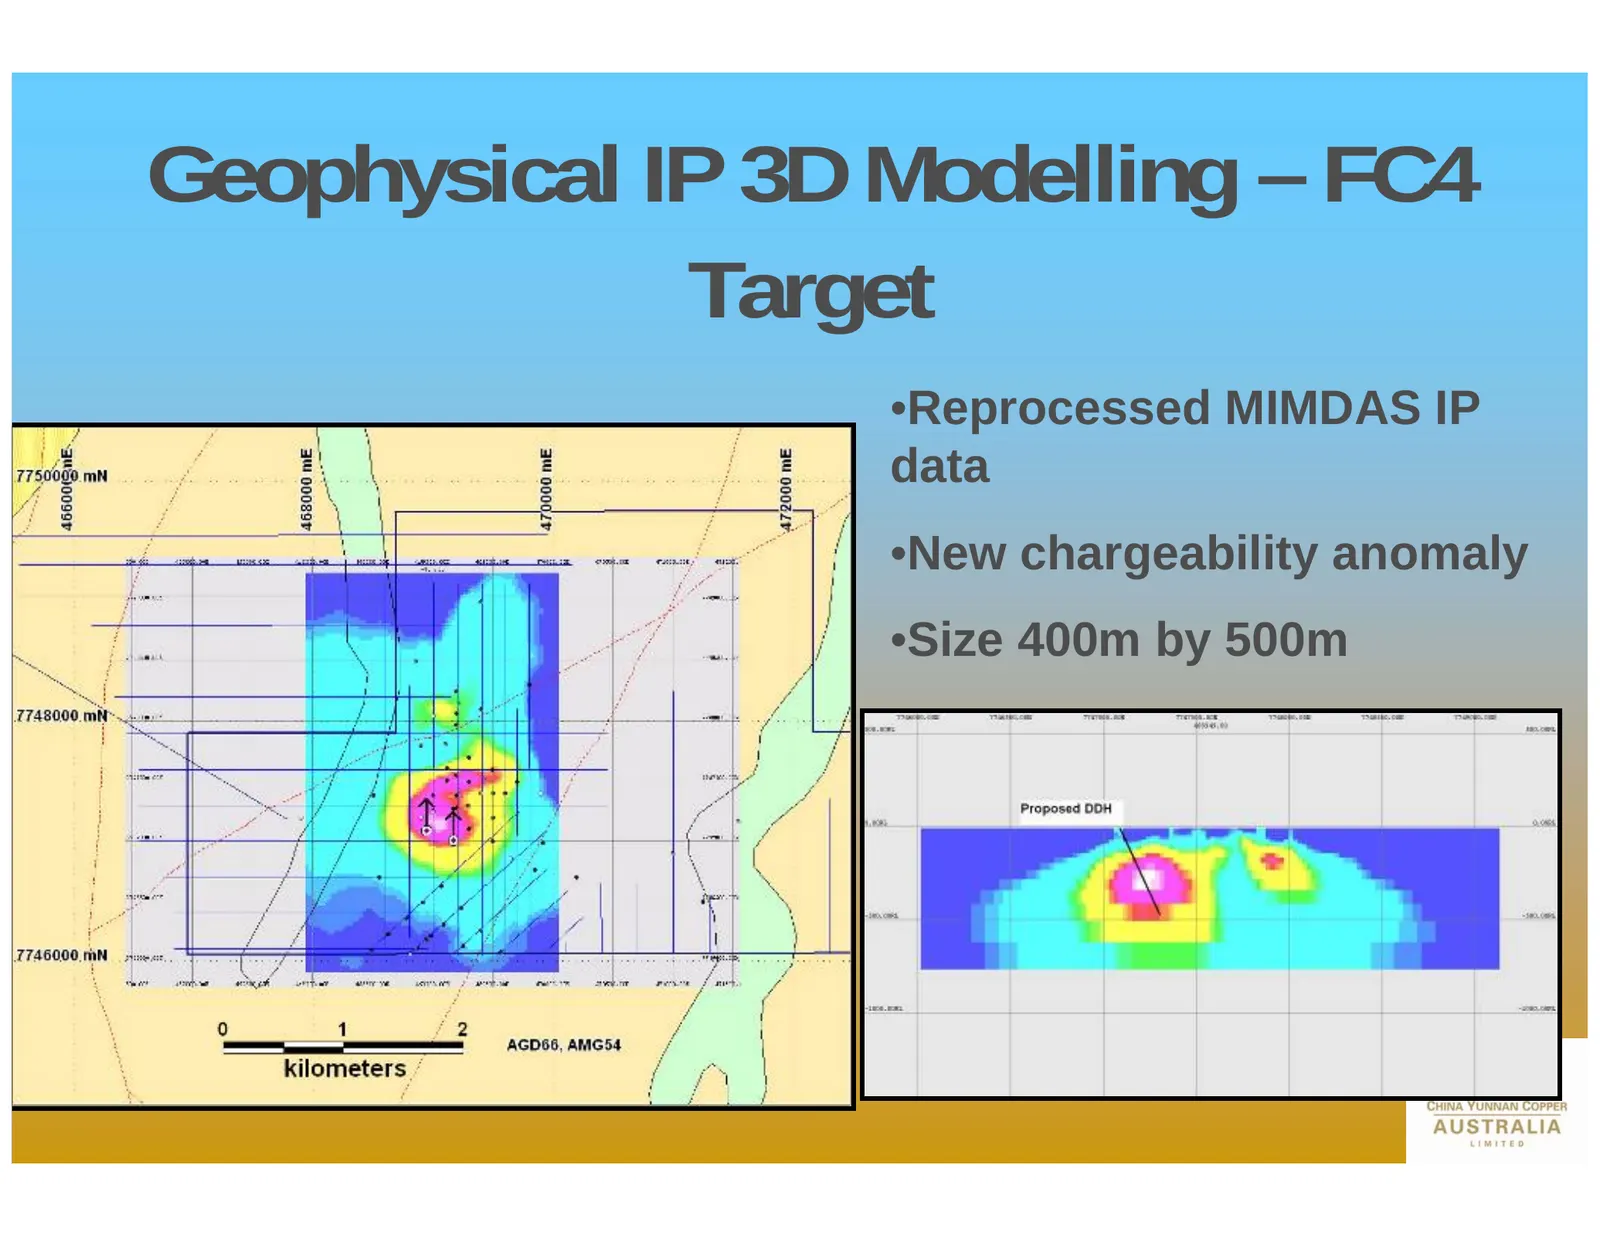
Slide 12: Geophysical IP 3D Modelling - FC4 Target
Geophysical IP 3D Modelling – FC4 Target •Reprocessed MIMDAS IP data •New chargeability anomaly •Size 400m by 500m 12
Slide 13: FC4 Drill Collar - 4km North of Ernest Henry Mine
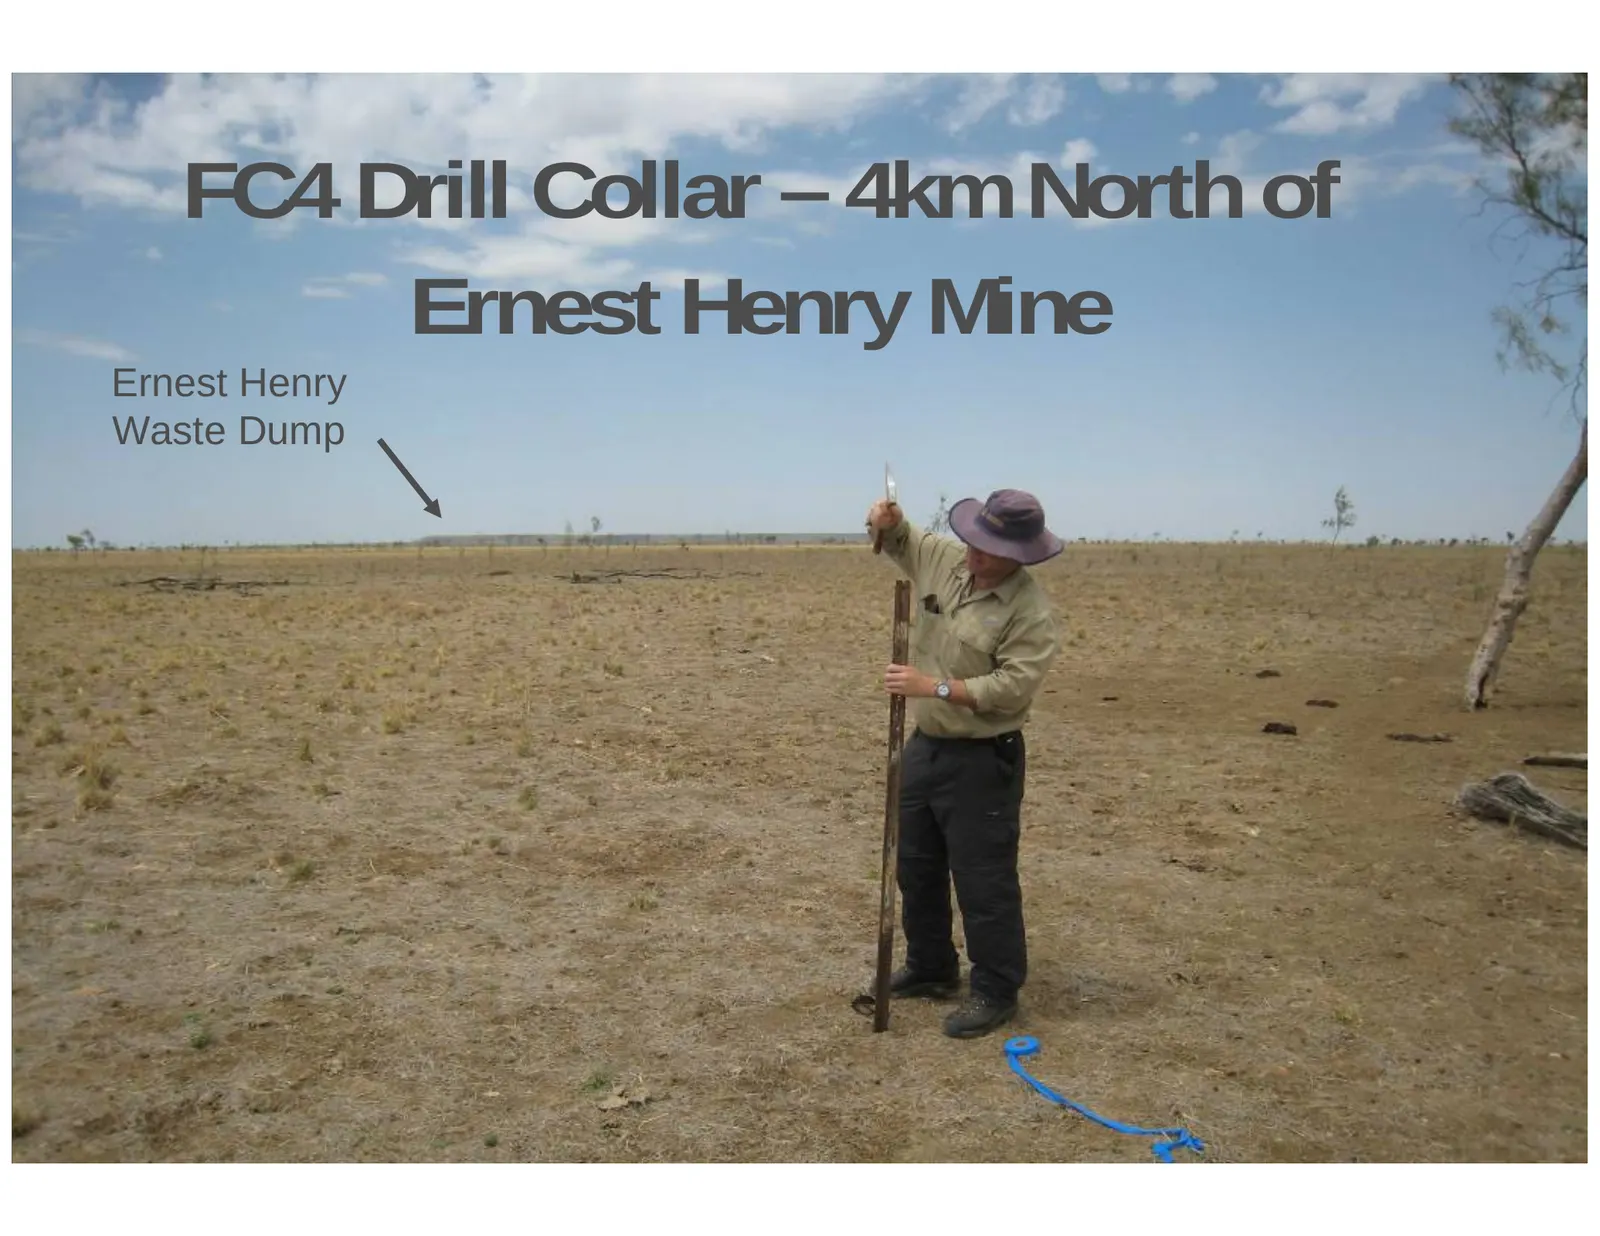
FC4 Drill Collar – 4km North of Ernest Henry Mine Ernest Henry Waste Dump 13
Slide 14: Mt Isa Project
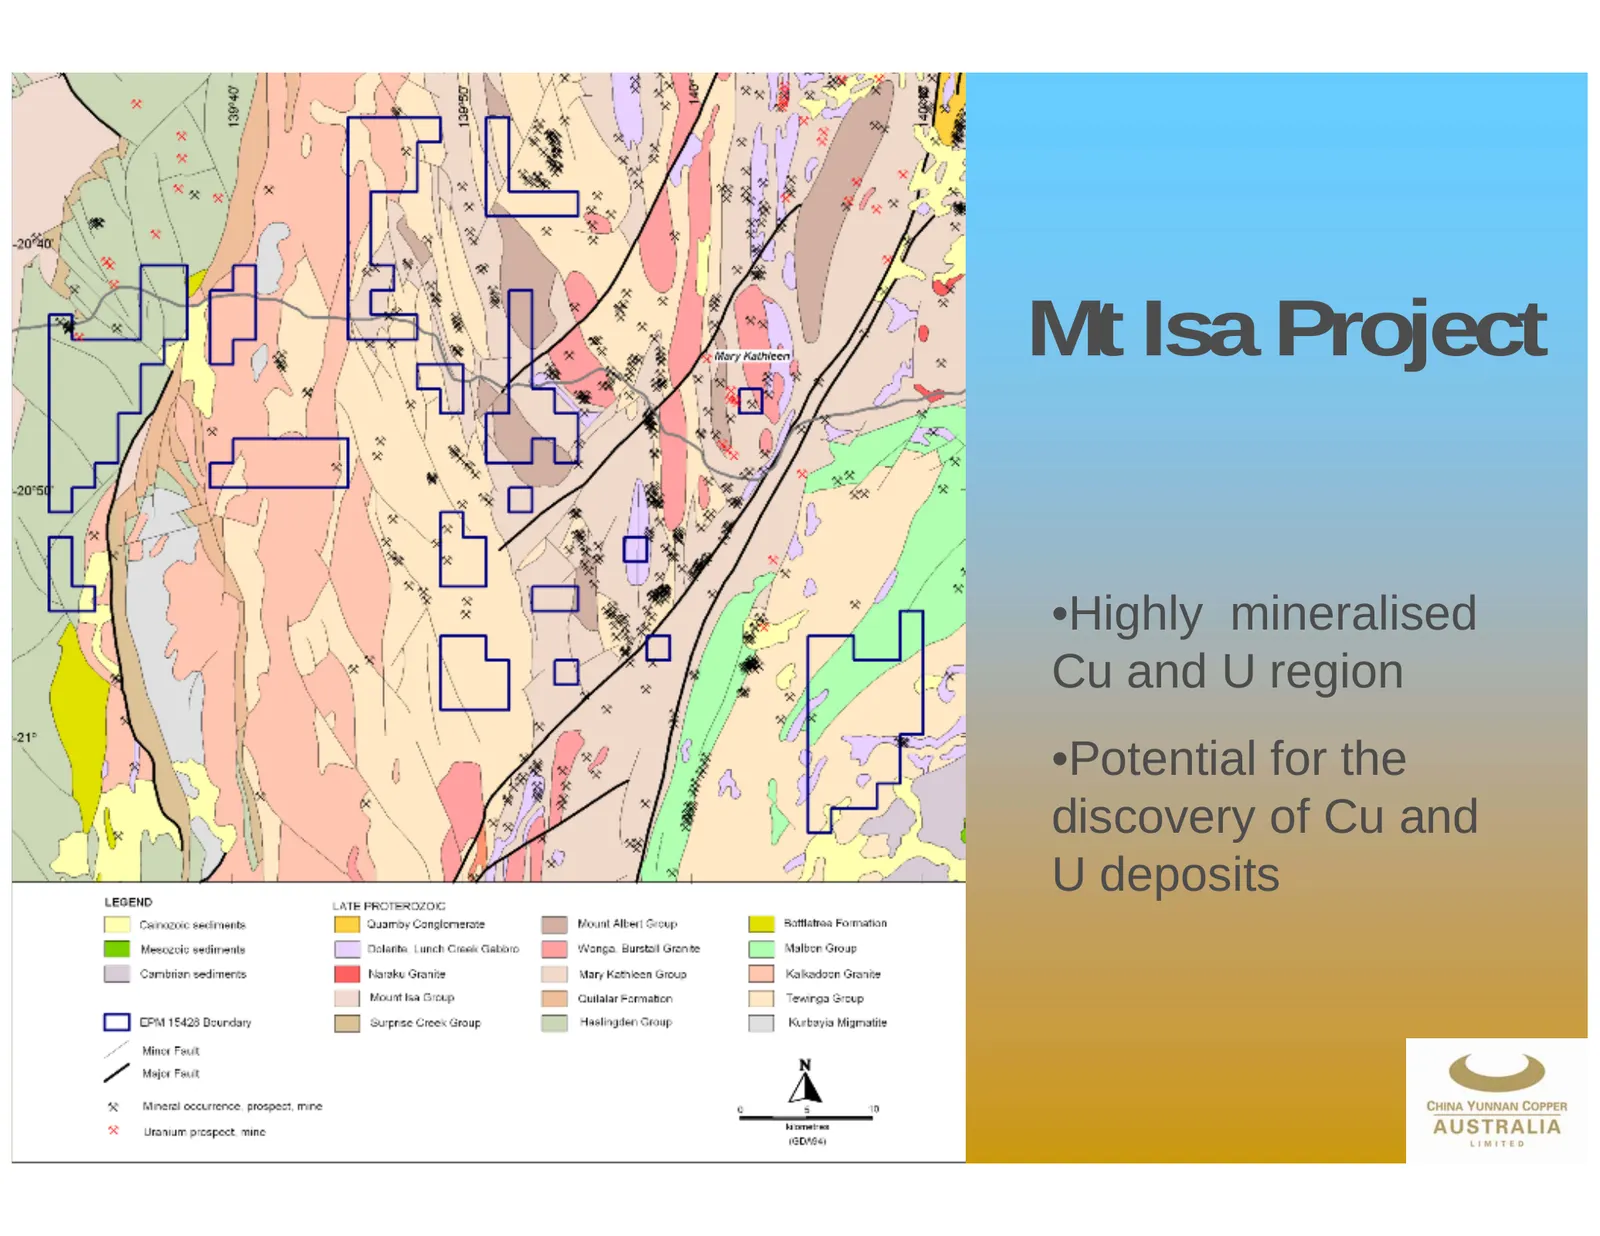
Mt Isa Project •Highly mineralised Cu and U region •Potential for the discovery of Cu and U deposits 14
Slide 15: North East Qld
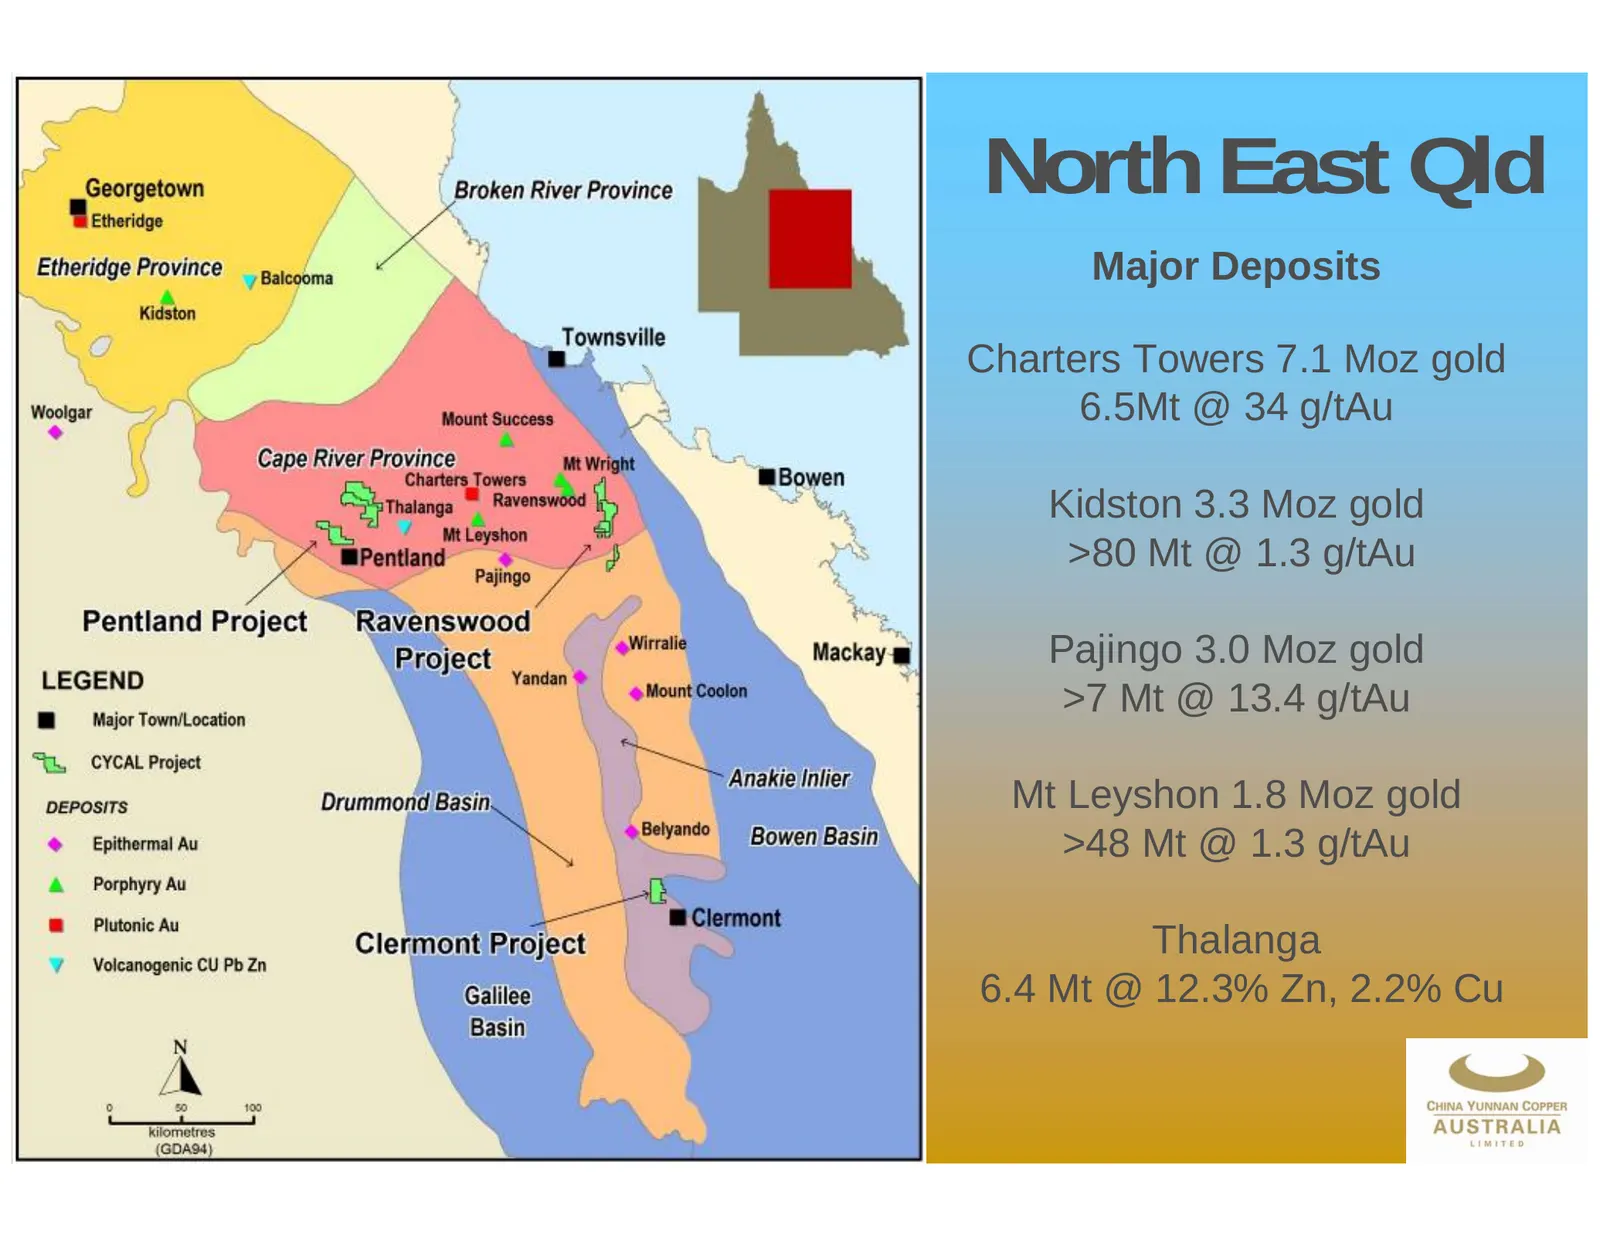
North East Qld Major Deposits Charters Towers 7.1 Moz gold 6.5Mt @ 34 g/tAu Kidston 3.3 Moz gold >80 Mt @ 1.3 g/tAu Pajingo 3.0 Moz gold >7 Mt @ 13.4 g/tAu Mt Leyshon 1.8 Moz gold >48 Mt @ 1.3 g/tAu Thalanga 6.4 Mt @ 12.3% Zn, 2.2% Cu 15
Slide 16: Pentland Project
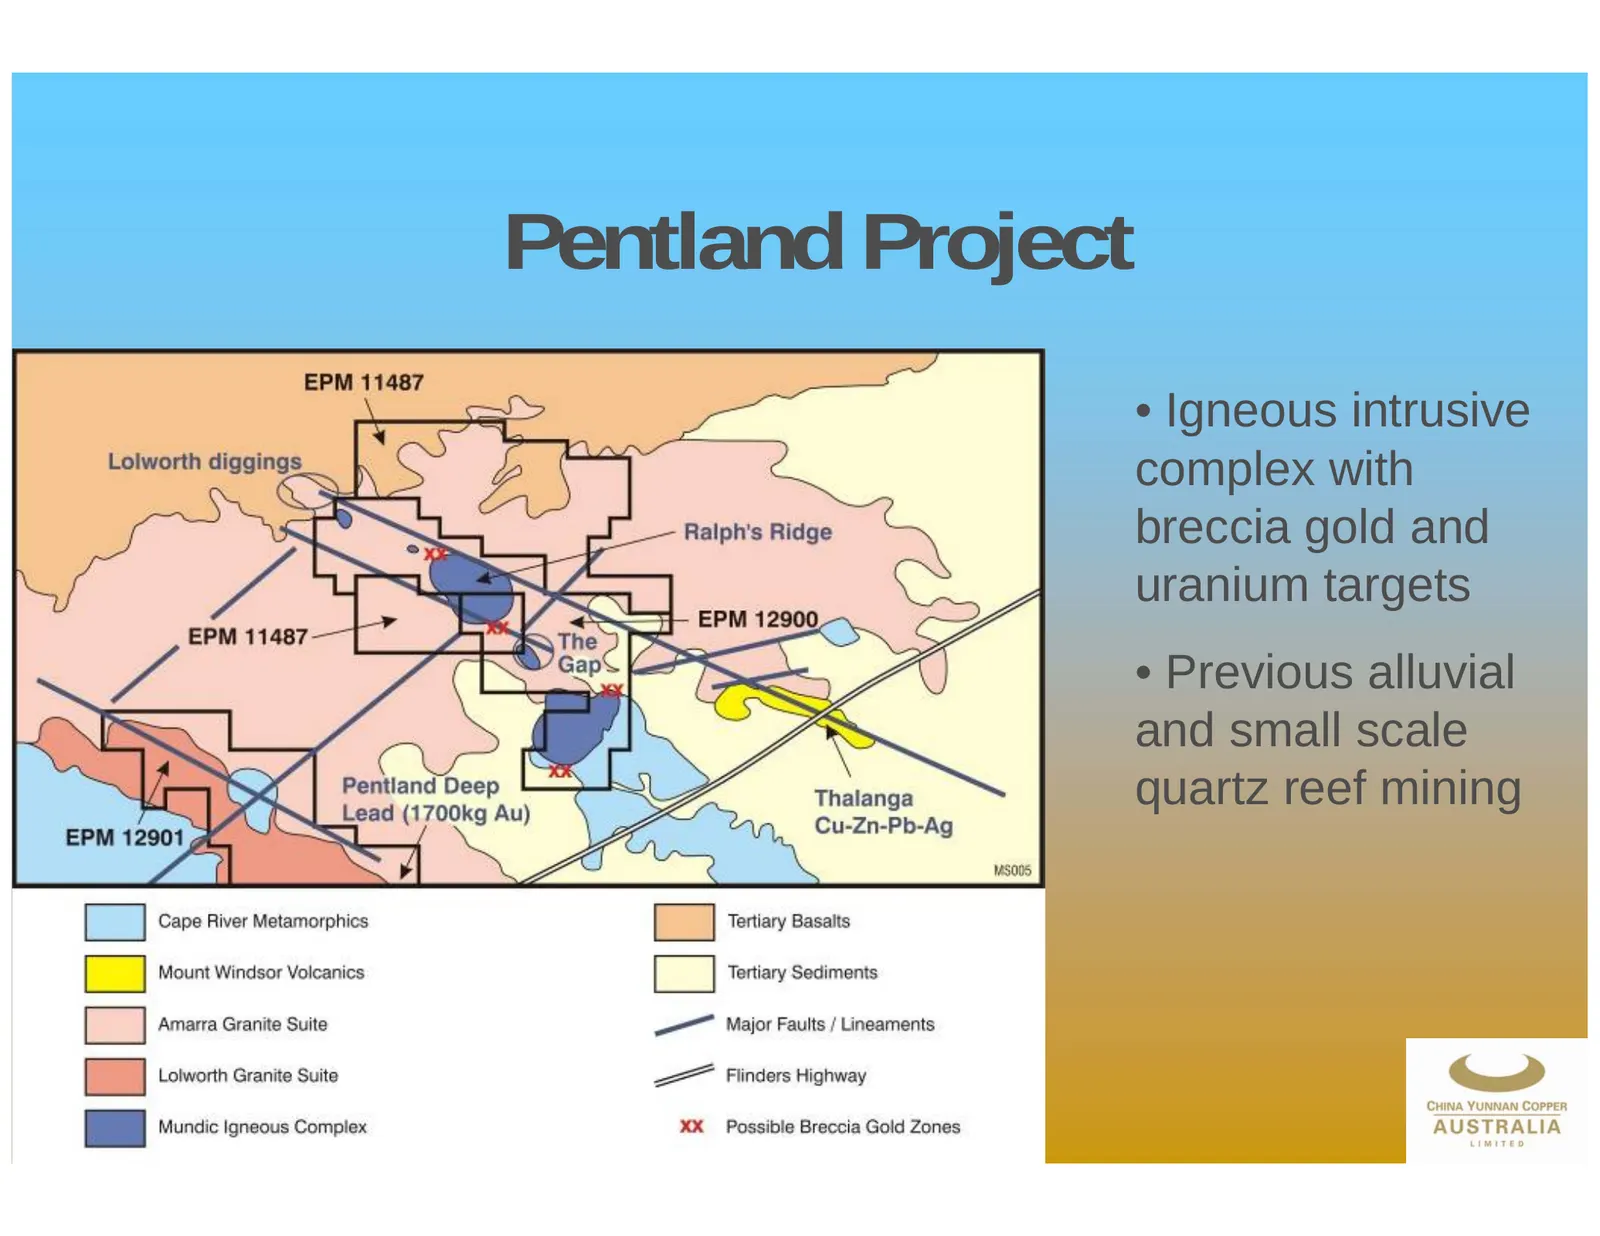
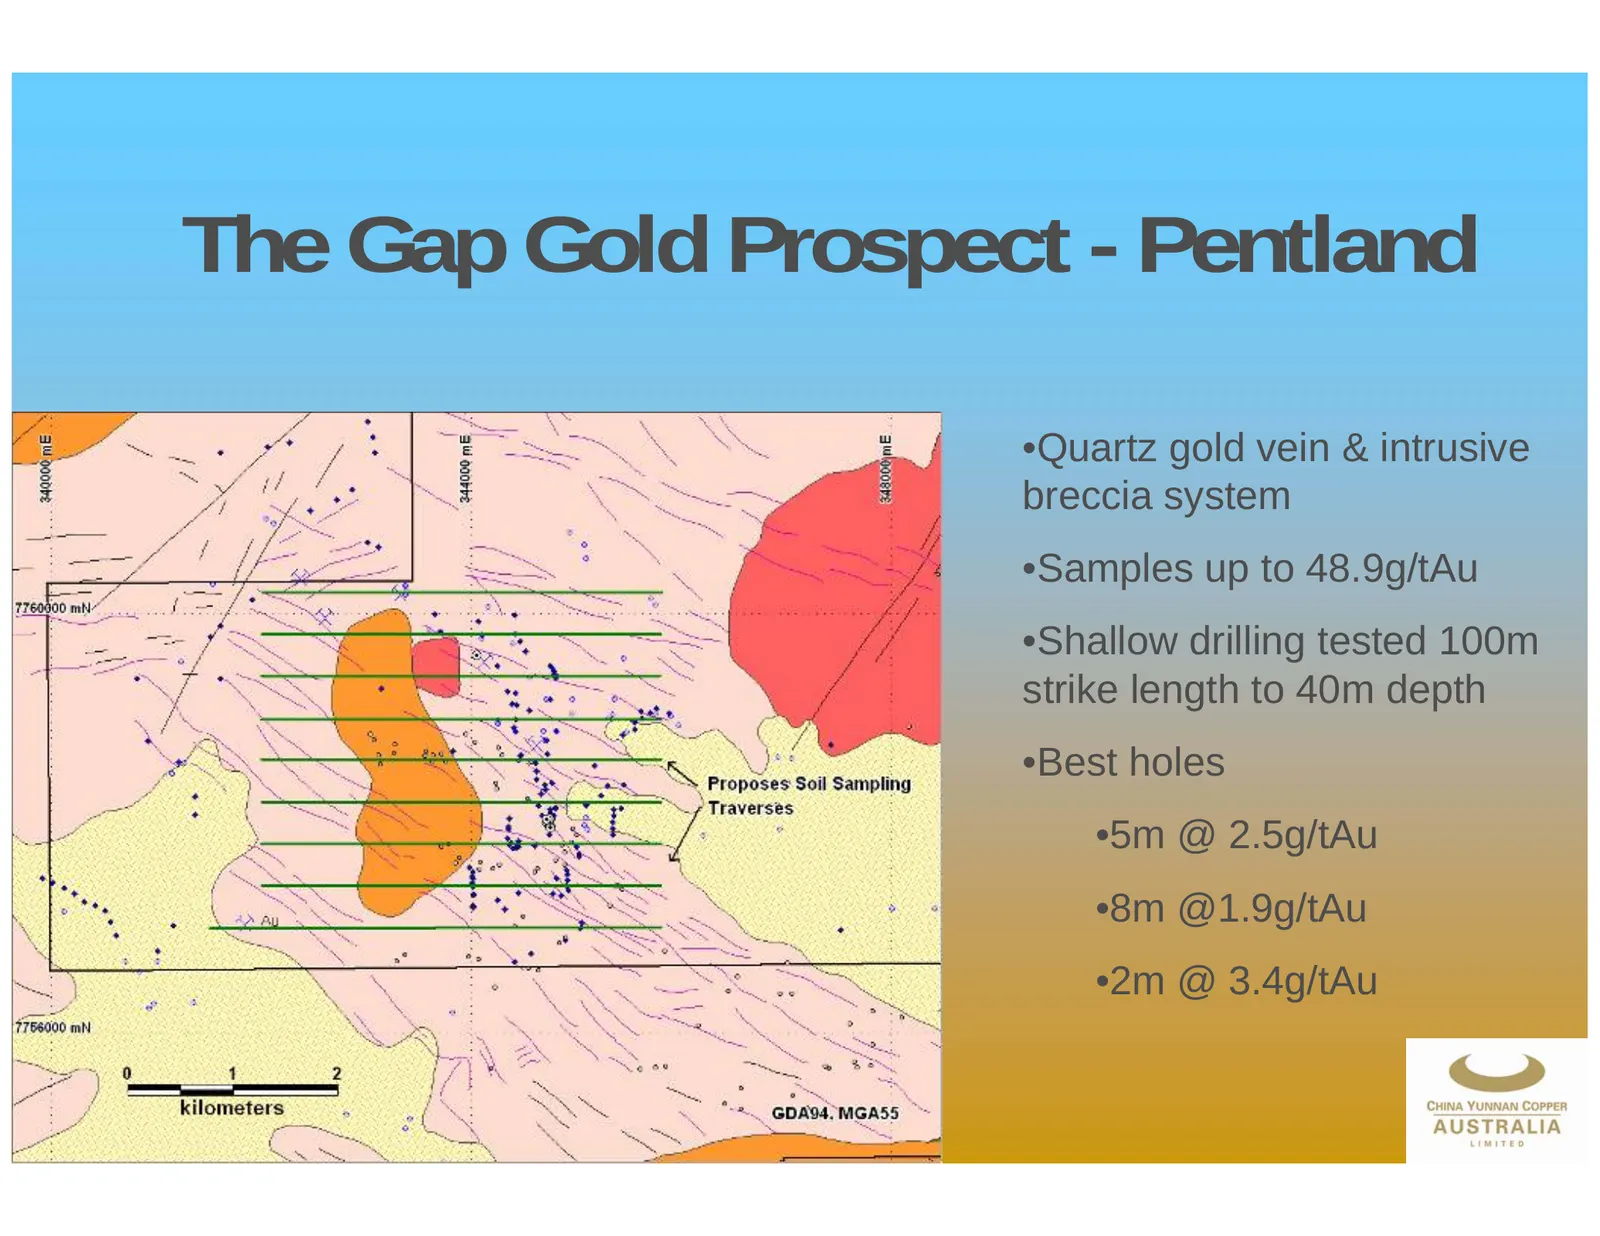
Pentland Project • Igneous intrusive complex with breccia gold and uranium targets • Previous alluvial and small scale quartz reef mining 16
Slide 17: The Gap Gold Prospect - Pentland
The Gap Gold Prospect - Pentland •Quartz gold vein & intrusive breccia system •Samples up to 48.9g/tAu •Shallow drilling tested 100m strike length to 40m depth •Best holes •5m @ 2.5g/tAu •8m @1.9g/tAu •2m @ 3.4g/tAu 17
Slide 18: Ravenswood Project
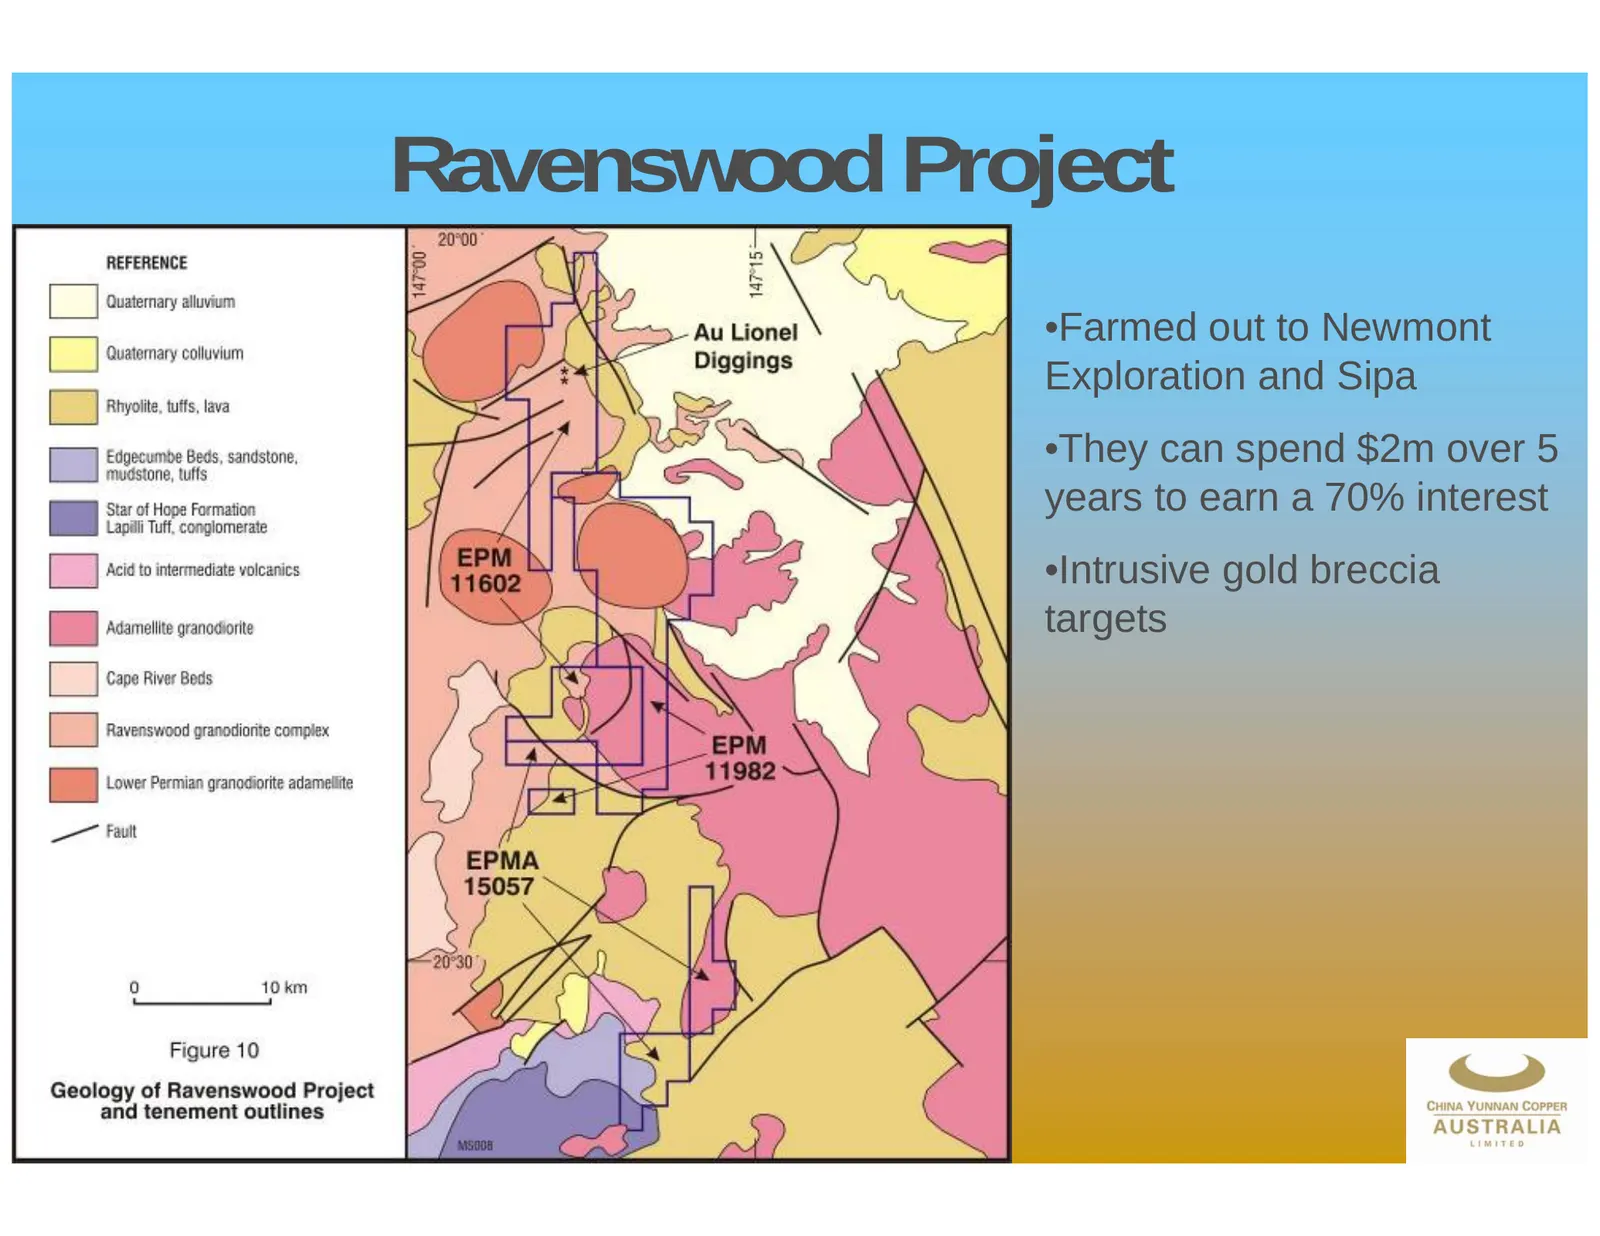
Ravenswood Project •Farmed out to Newmont Exploration and Sipa •They can spend $2m over 5 years to earn a 70% interest •Intrusive gold breccia targets 18
Slide 19: Clermont Project
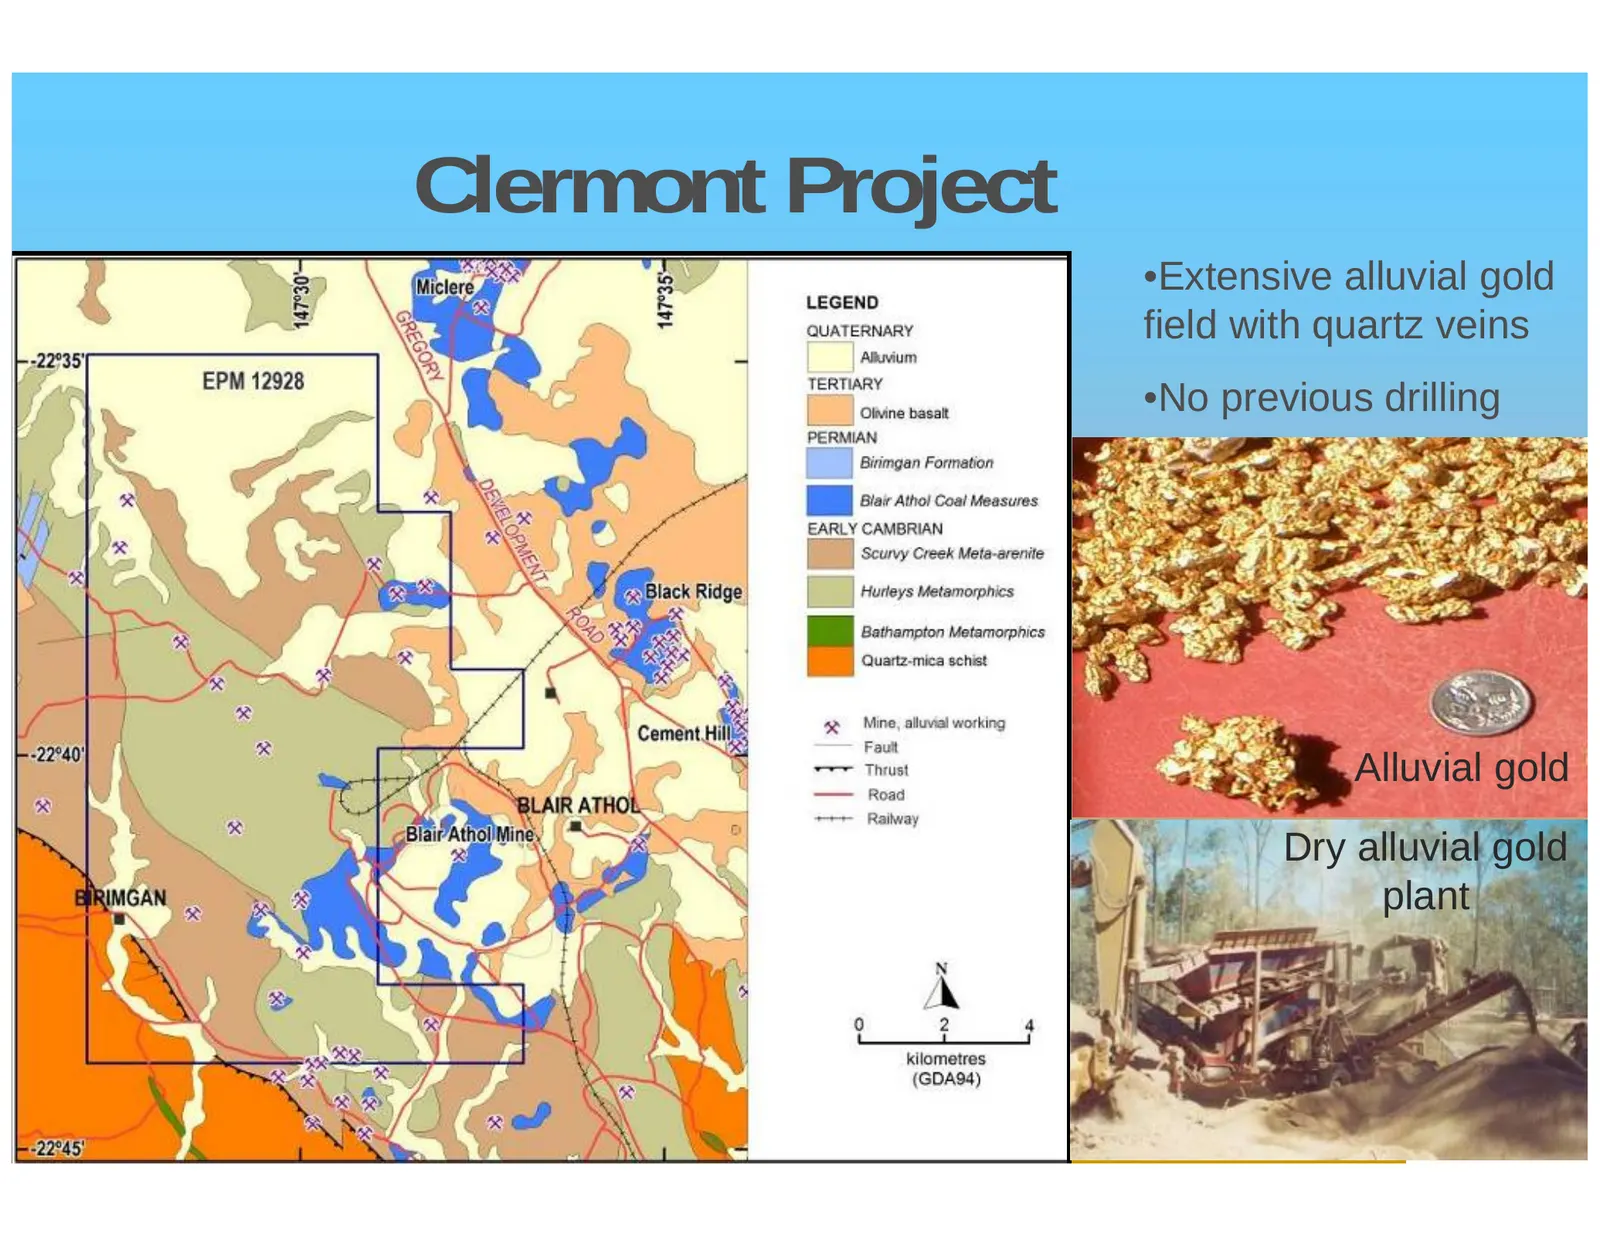
Clermont Project •Extensive alluvial gold field with quartz veins •No previous drilling Alluvial gold Dry alluvial gold plant 19
Slide 20: Project Budget
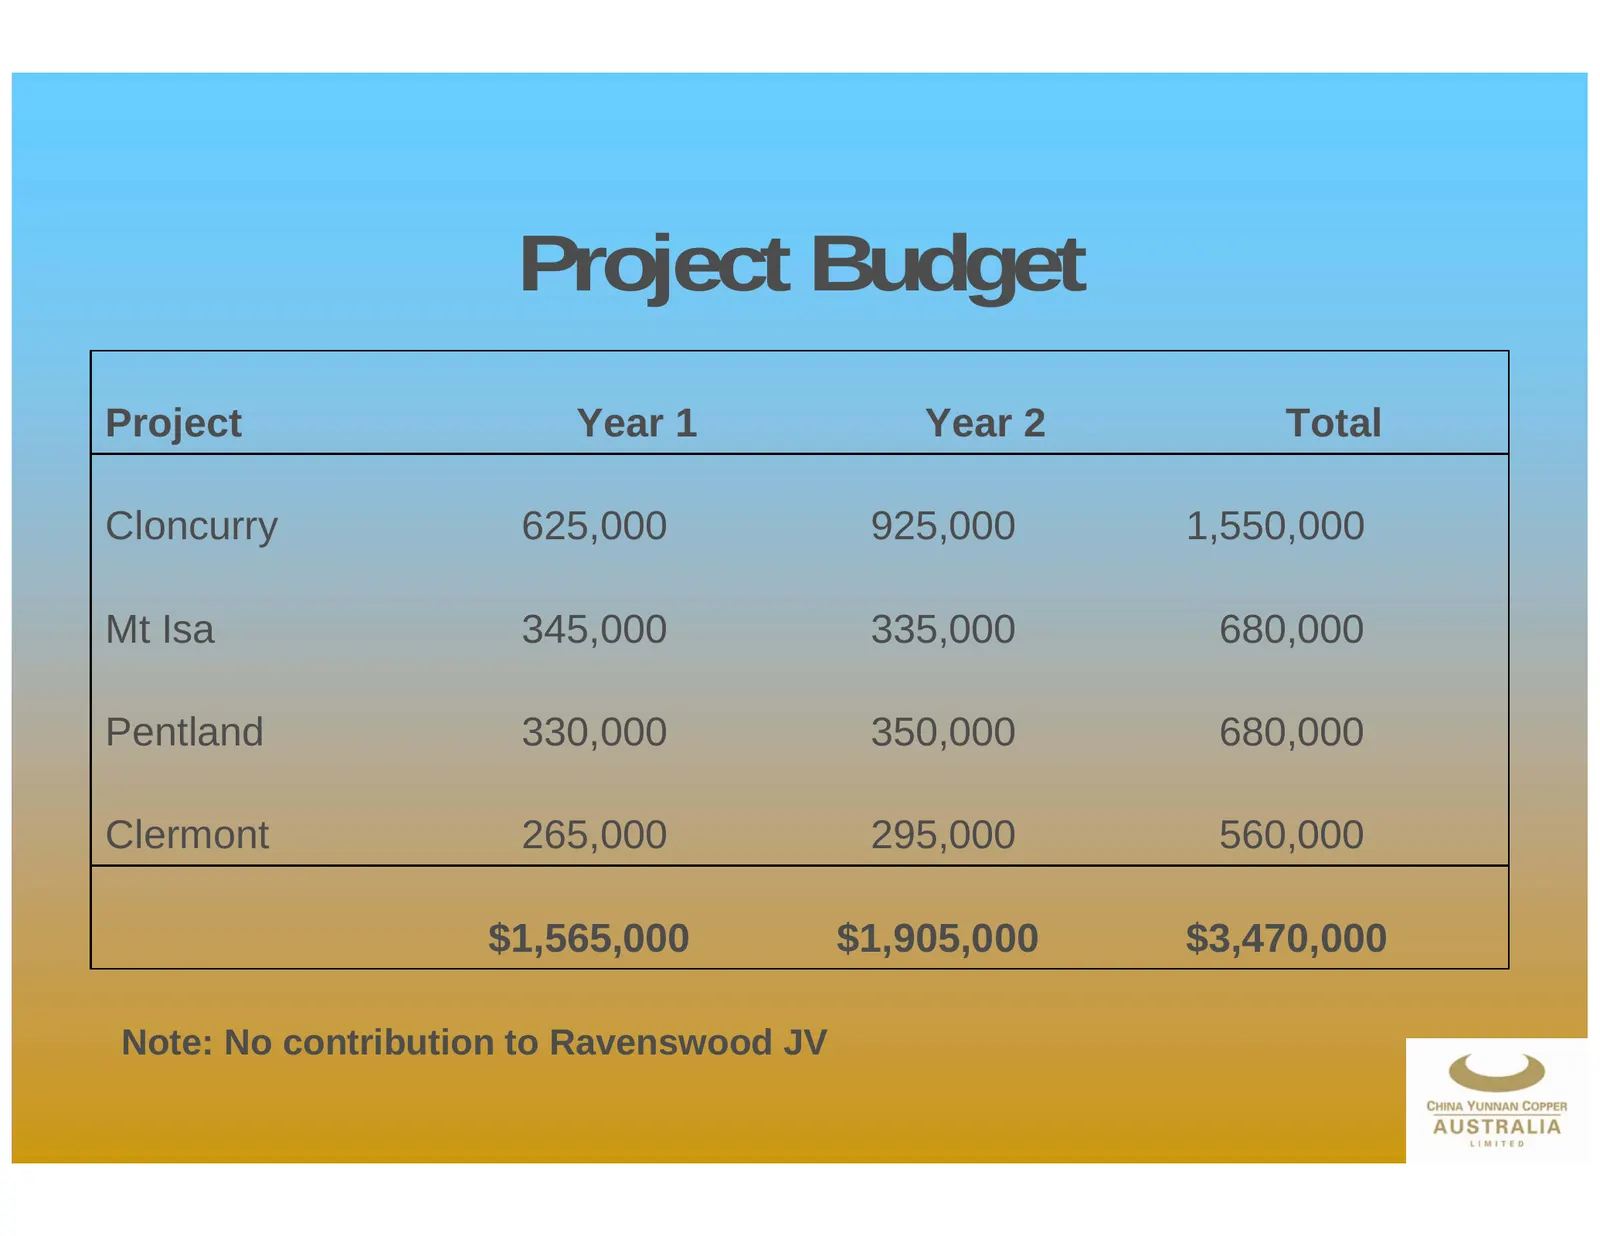
Project Budget Project Year 1 Year 2 Total Cloncurry 625,000 925,000 1,550,000 Mt Isa 345,000 335,000 680,000 Pentland 330,000 350,000 680,000 Clermont 265,000 295,000 560,000 $1,565,000 $1,905,000 $3,470,000 Note: No contribution to Ravenswood JV 20
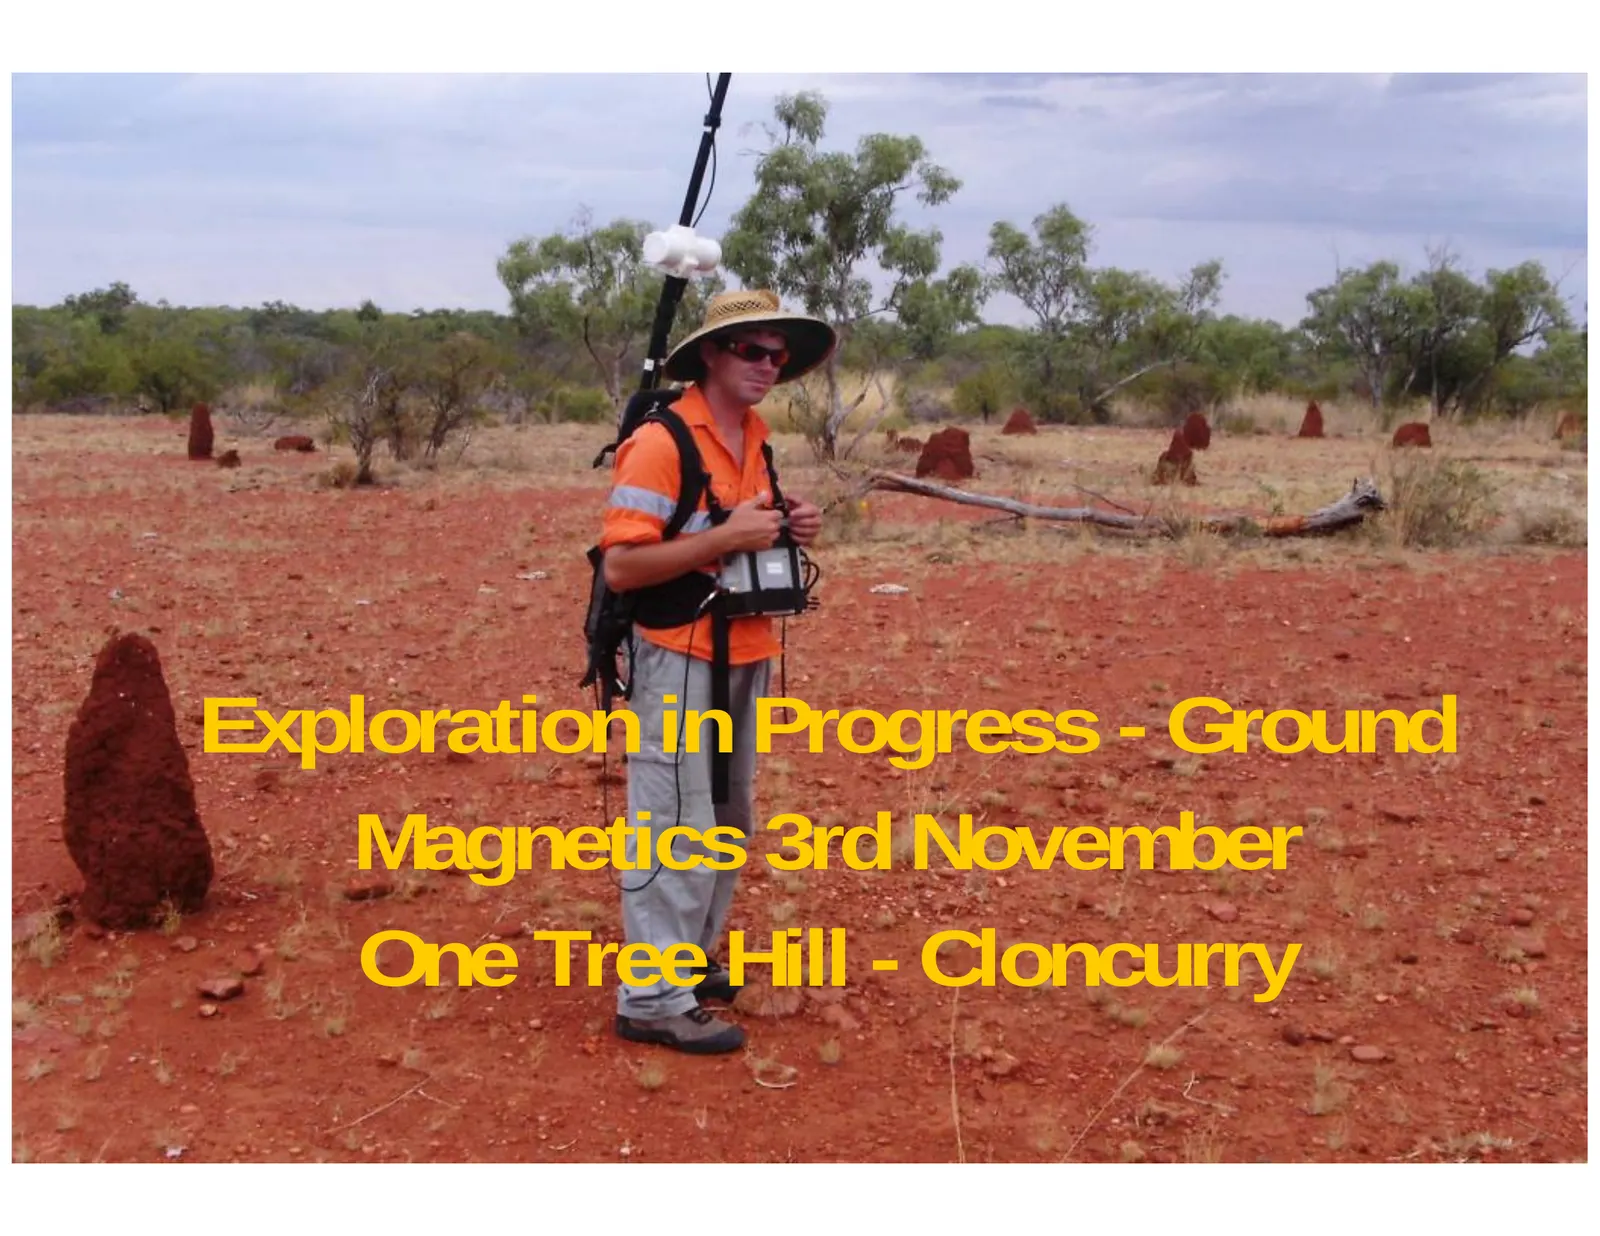
Slide 21: Exploration in Progress - Ground Magnetics One Tree Hill
Exploration in Progress - Ground Magnetics 3rd November One Tree Hill - Cloncurry Data: LME 21
Slide 22: Will the Mining Boom and Demand for Minerals Continue?
Will the Mining Boom and Demand for Minerals Continue? Use Copper as an example Data: LME 22
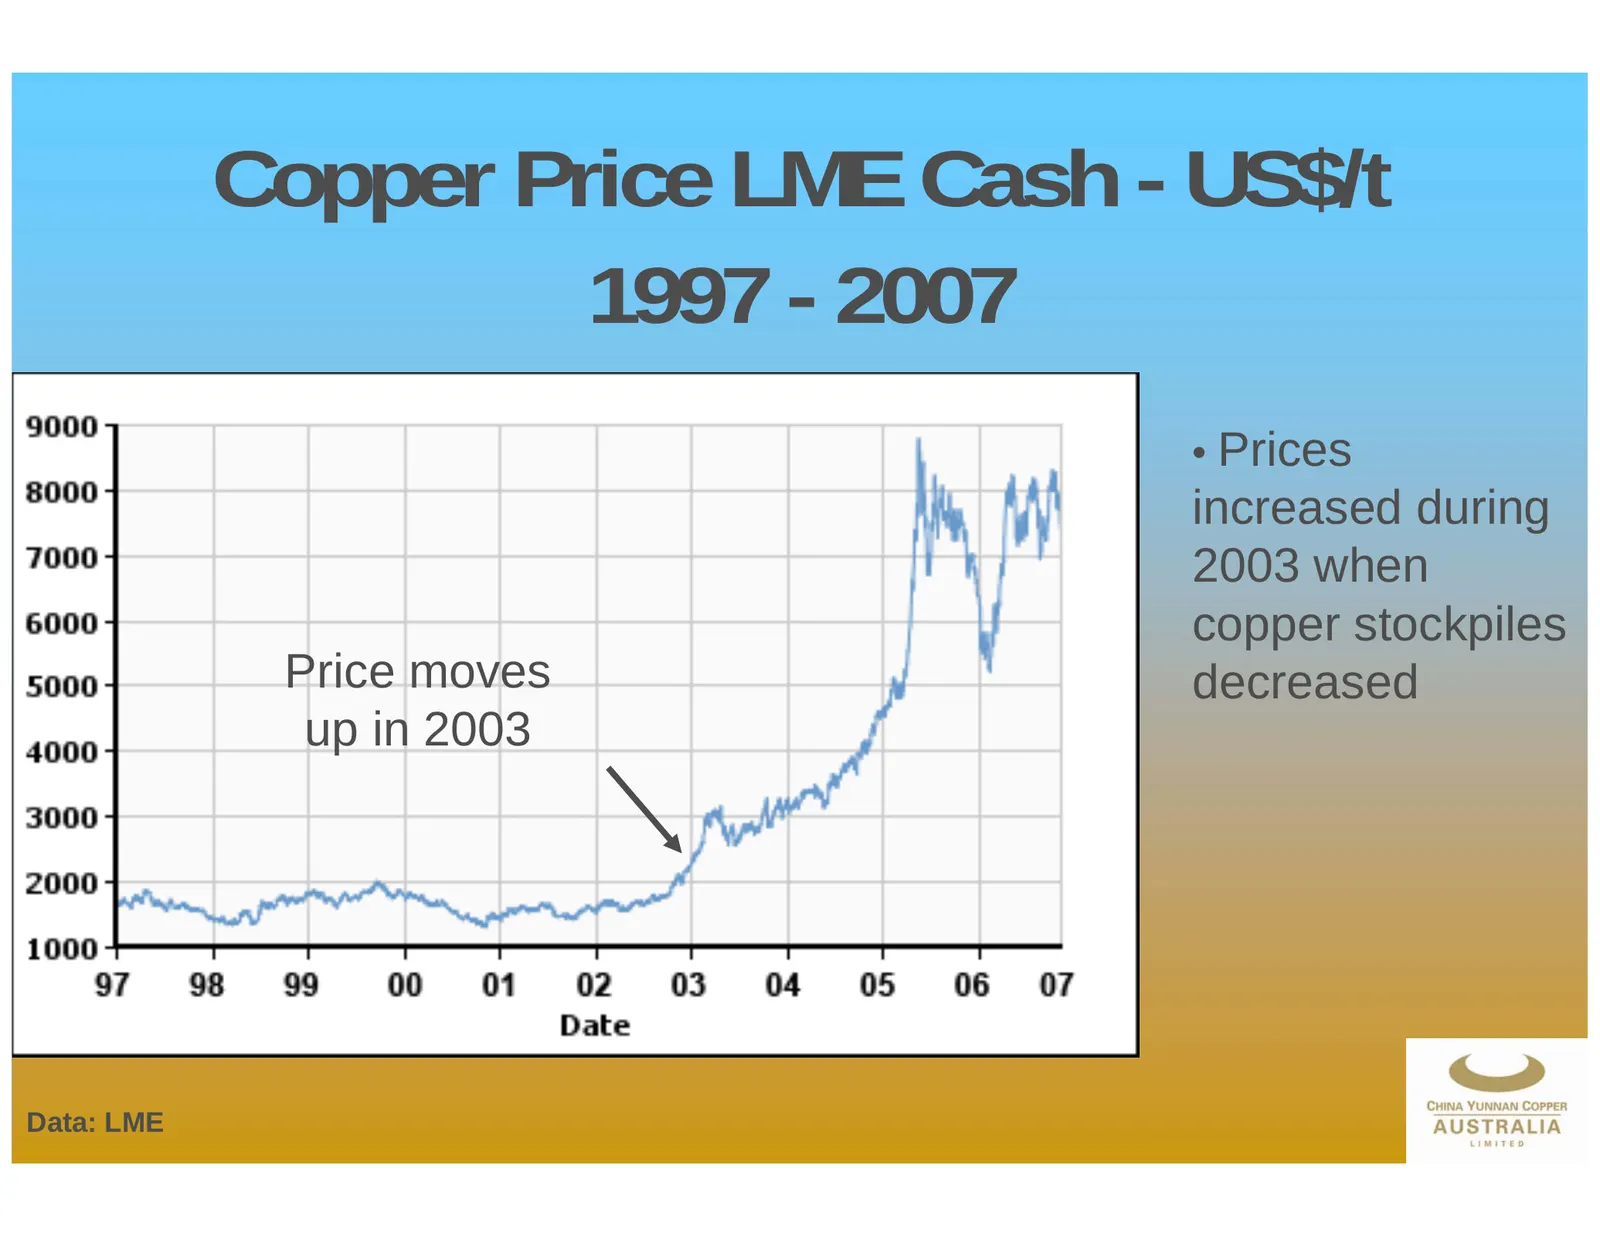
Slide 23: Copper Price LME Cash - US$/t
Copper Price LME Cash - US$/t 1997 - 2007 • Prices increased during 2003 when copper stockpiles Price moves decreased up in 2003 Data: LME 23
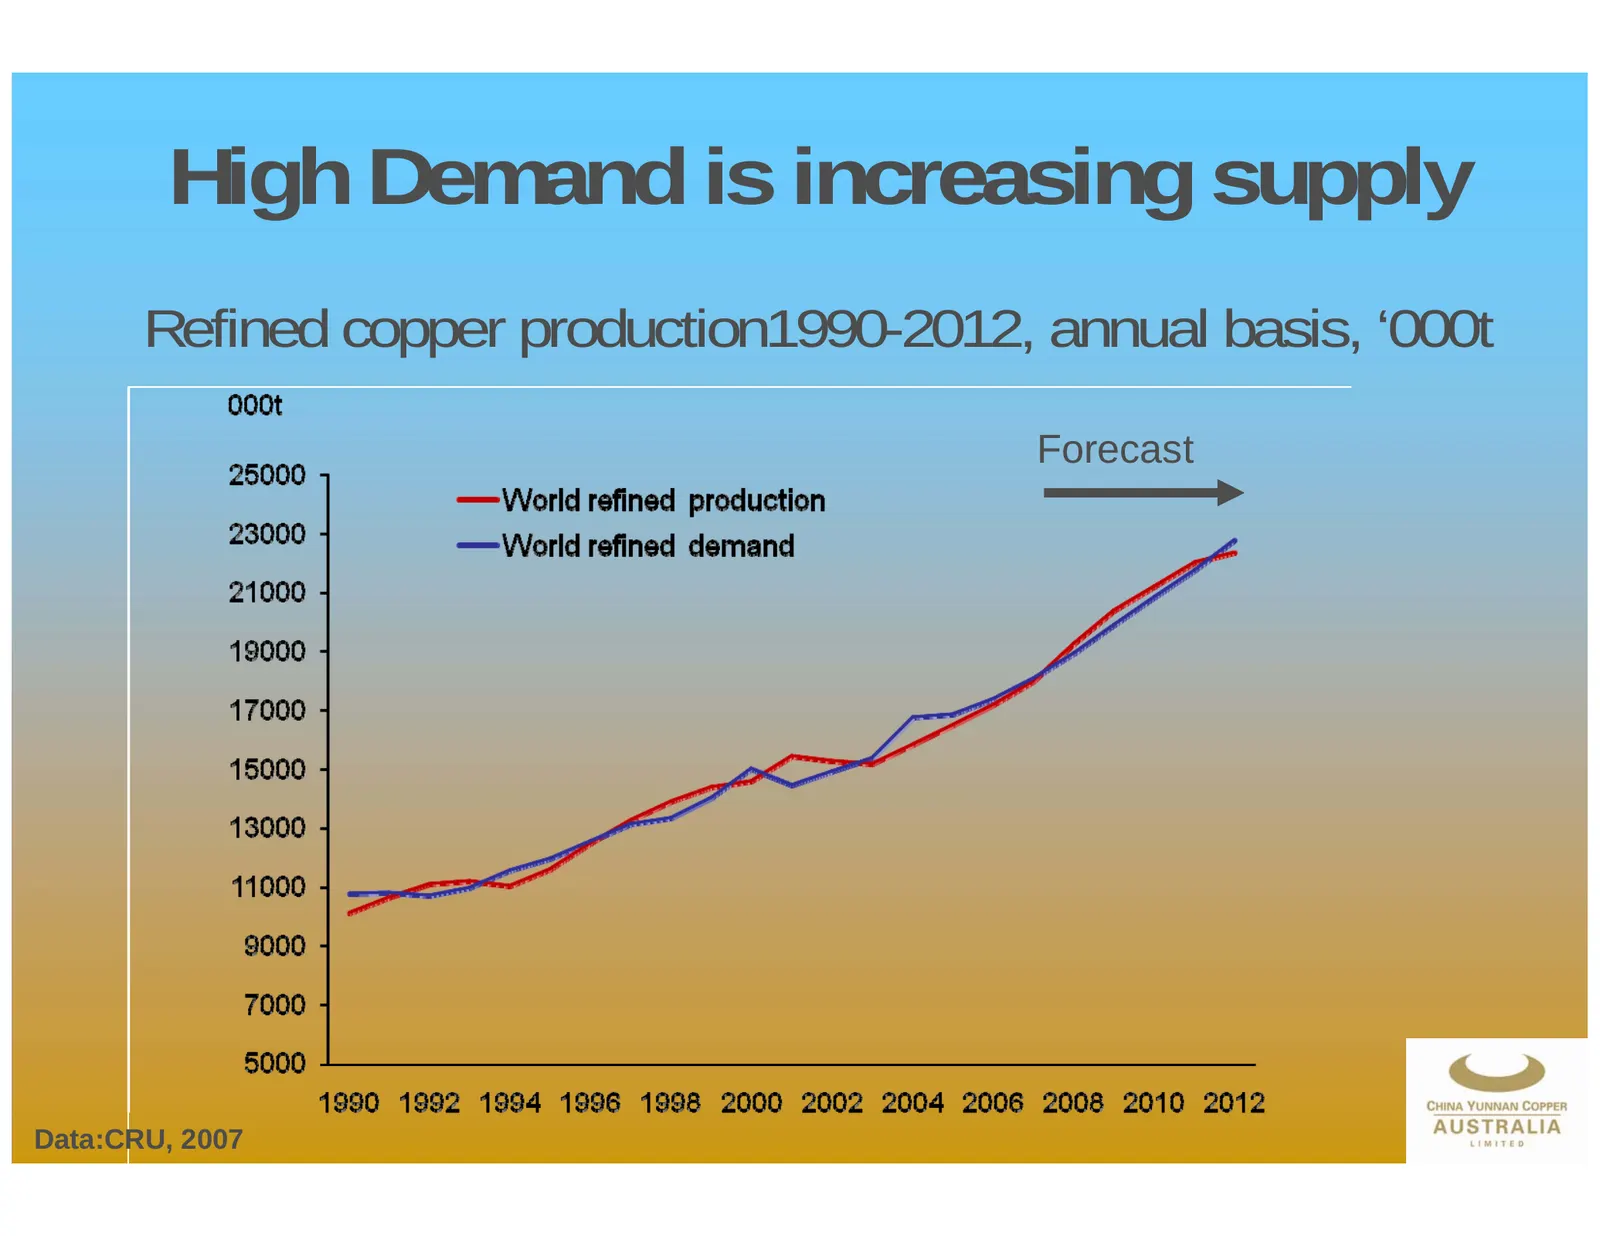
Slide 24: High Demand is increasing supply
High Demand is increasing supply Refined copper production1990-2012, annual basis, ‘000t Forecast 24 Data:CRU, 2007
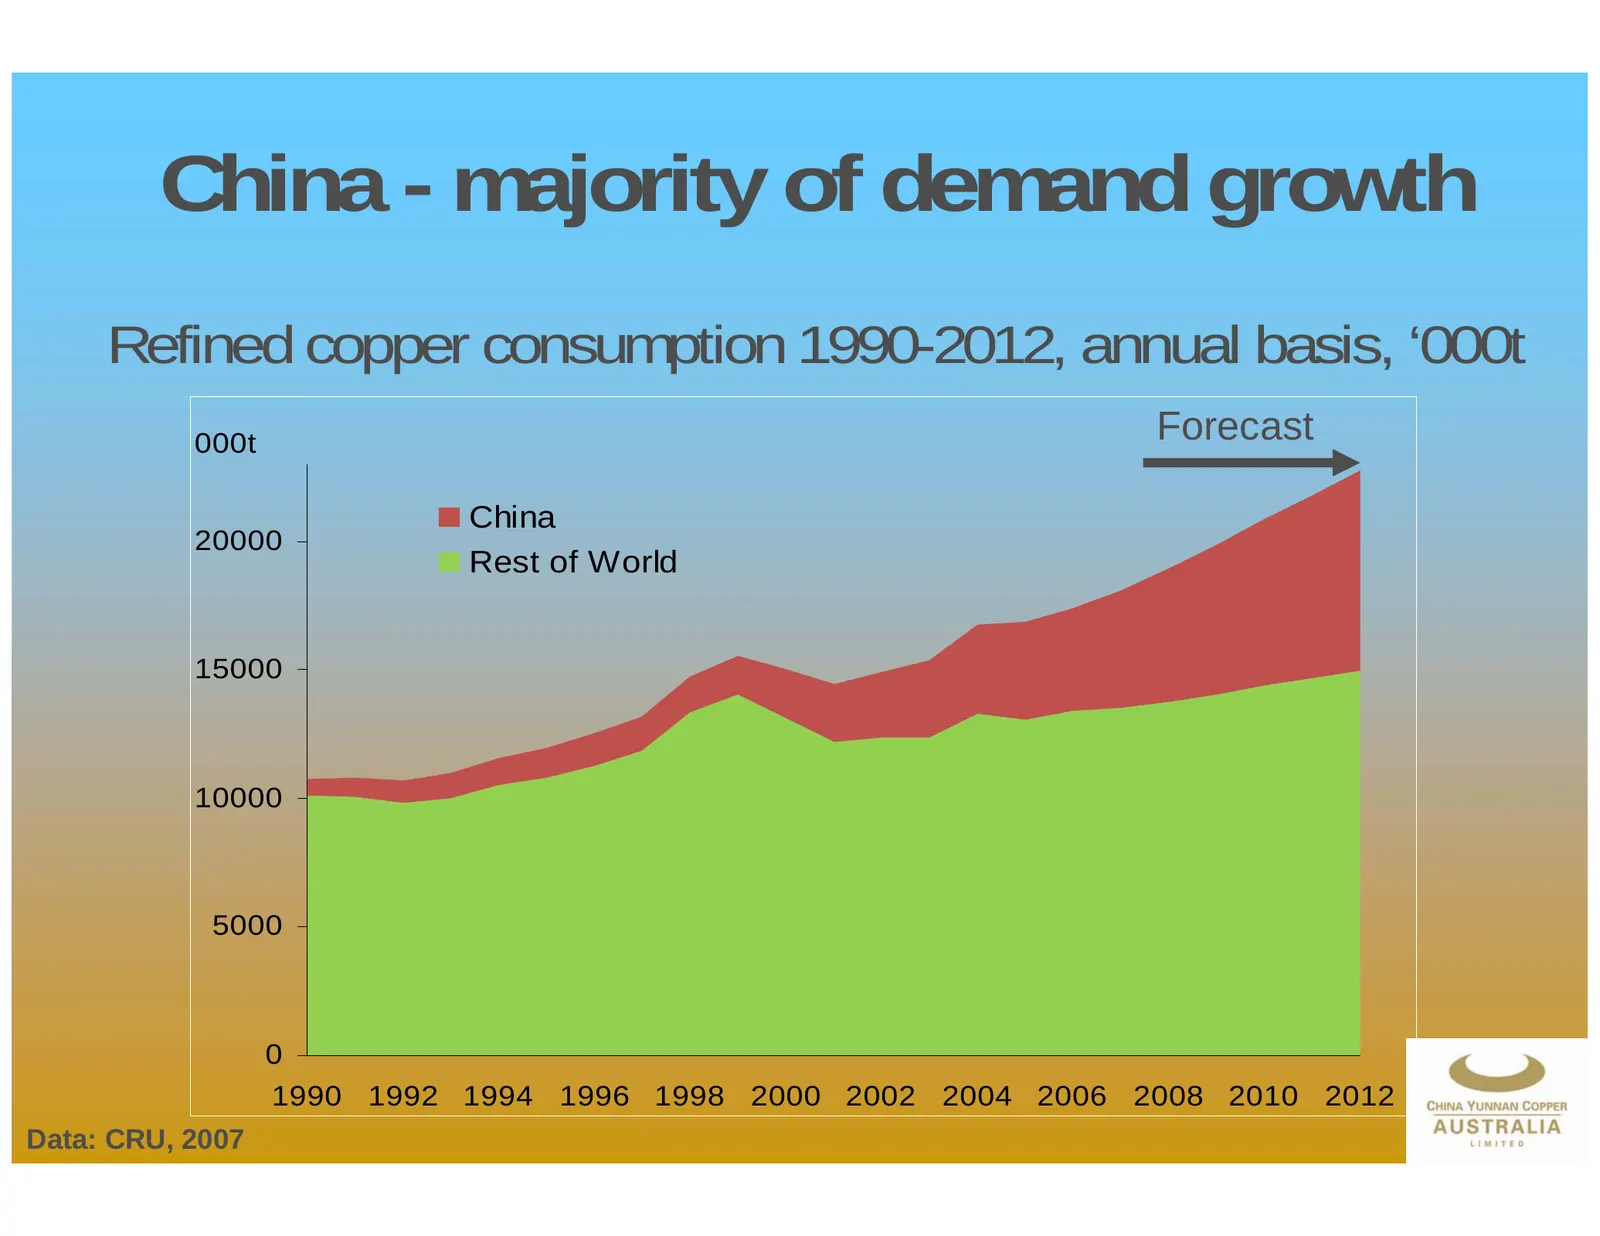
Slide 25: China - majority of demand growth
China - majority of demand growth Refined copper consumption 1990-2012, annual basis, ‘000t 000t Forecast China 20000 Rest of World 15000 10000 5000 0 1990 1992 1994 1996 1998 2000 2002 2004 2006 2008 2010 2012 25 Data: CRU, 2007
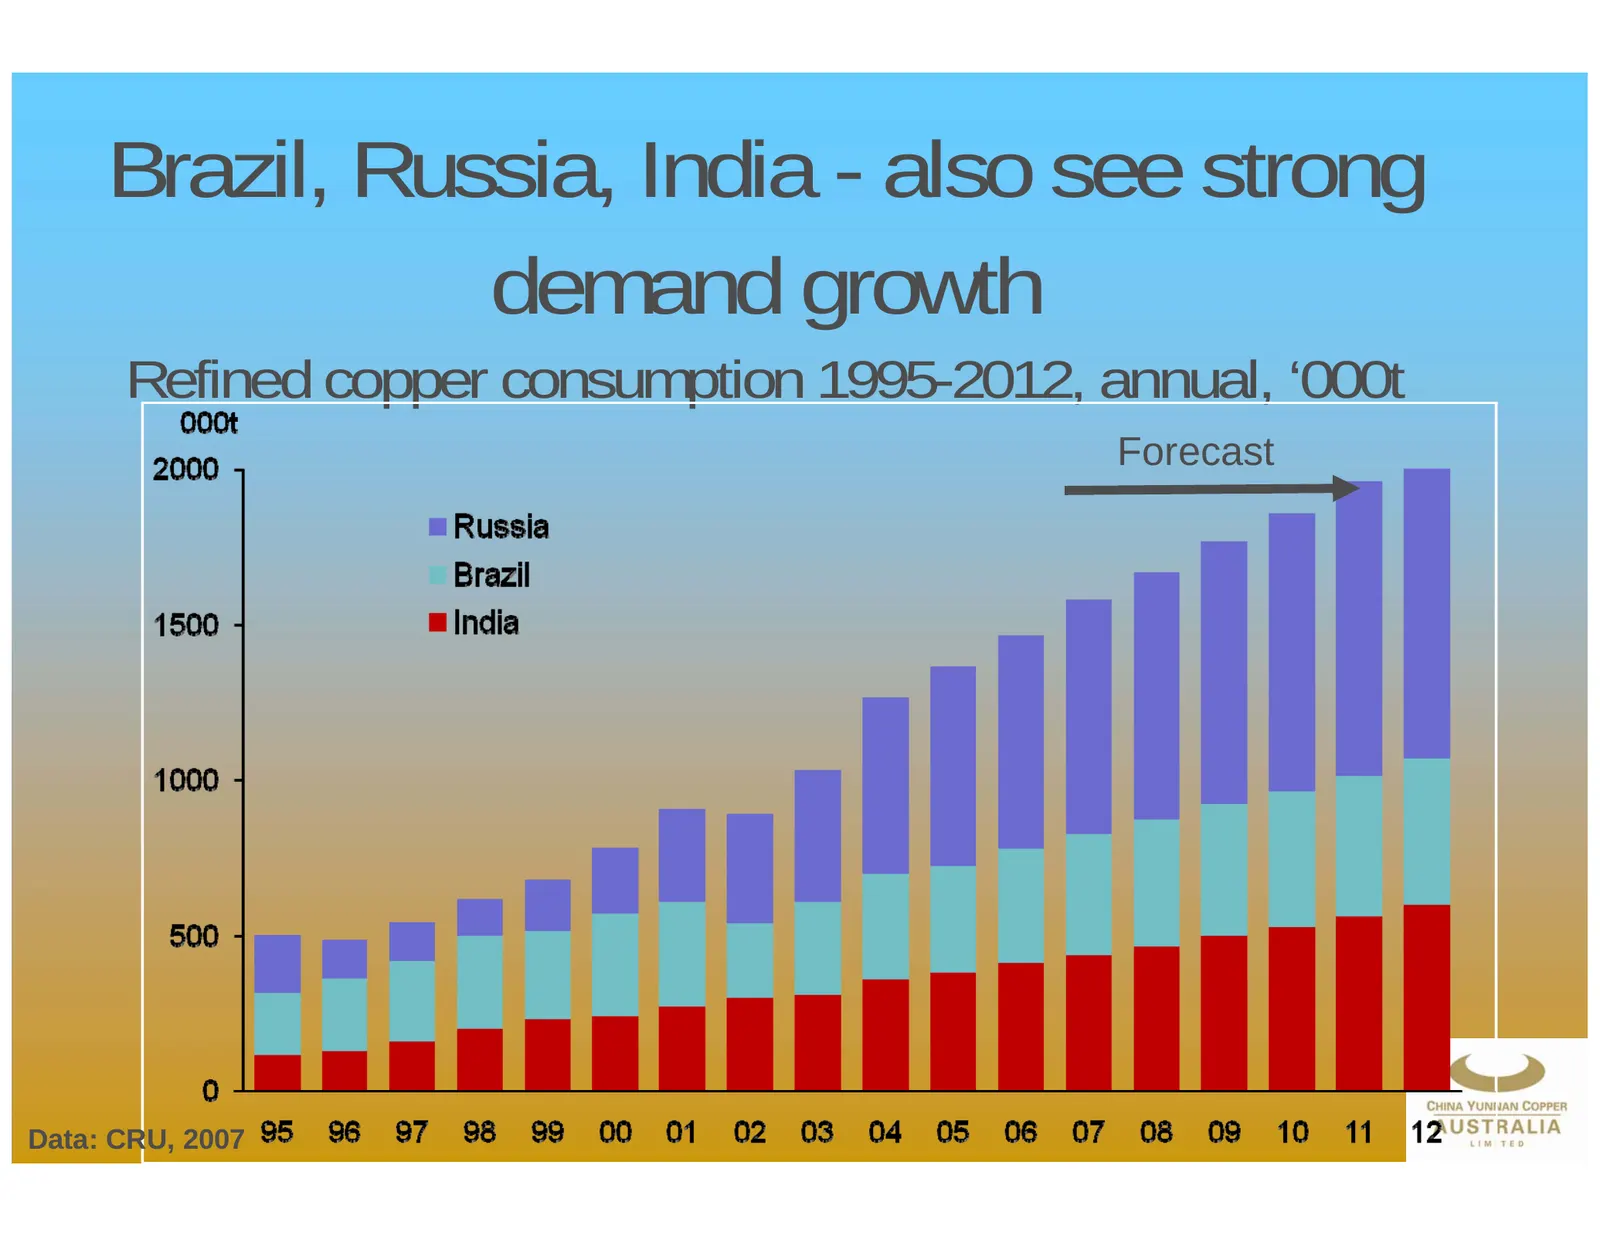
Slide 26: Brazil, Russia, India - also see strong demand growth
Brazil, Russia, India - also see strong demand growth Refined copper consumption 1995-2012, annual, ‘000t Forecast 26 Data: CRU, 2007
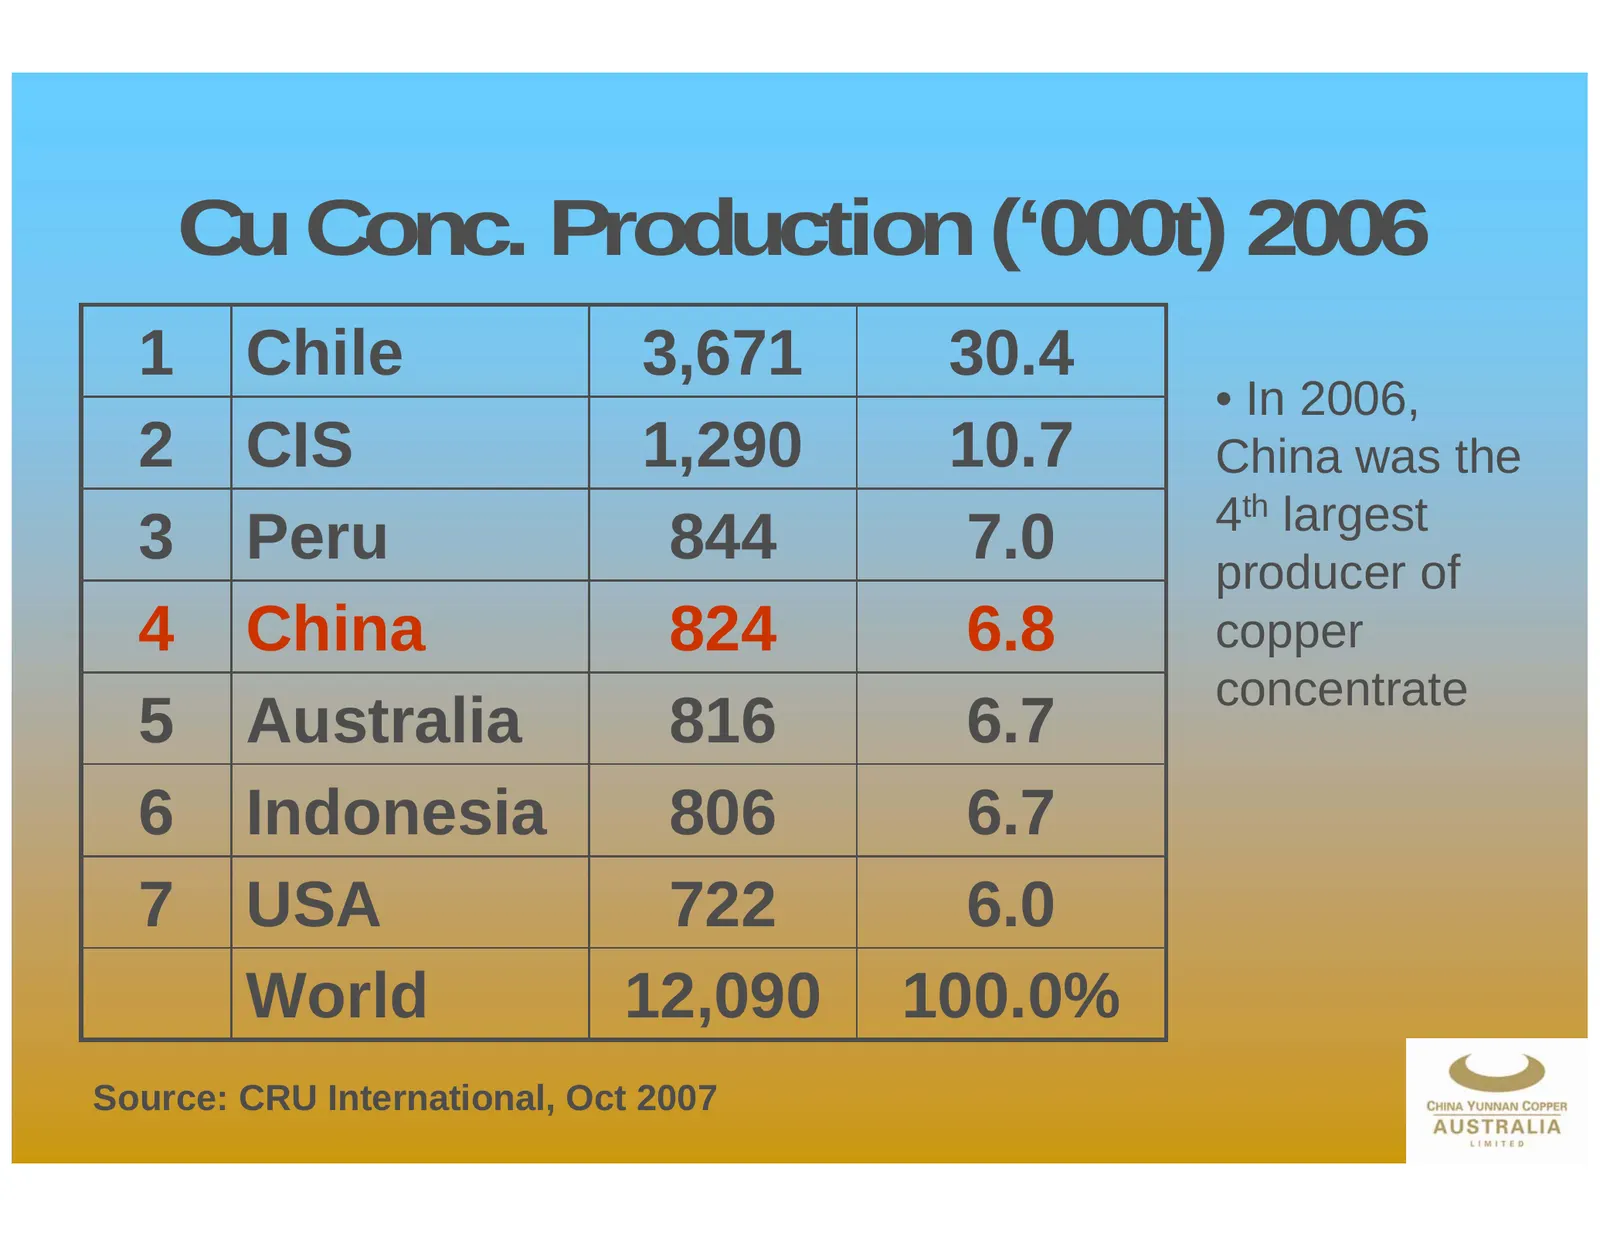
Slide 27: Cu Conc. Production ('000t) 2006
Cu Conc. Production (‘000t) 2006 1 Chile 3,671 30.4 • In 2006, 2 CIS 1,290 10.7 China was the 4th largest 3 Peru 844 7.0 producer of 4 China 824 6.8 copper concentrate 5 Australia 816 6.7 6 Indonesia 806 6.7 7 USA 722 6.0 World 12,090 100.0% Source: CRU International, Oct 2007 27
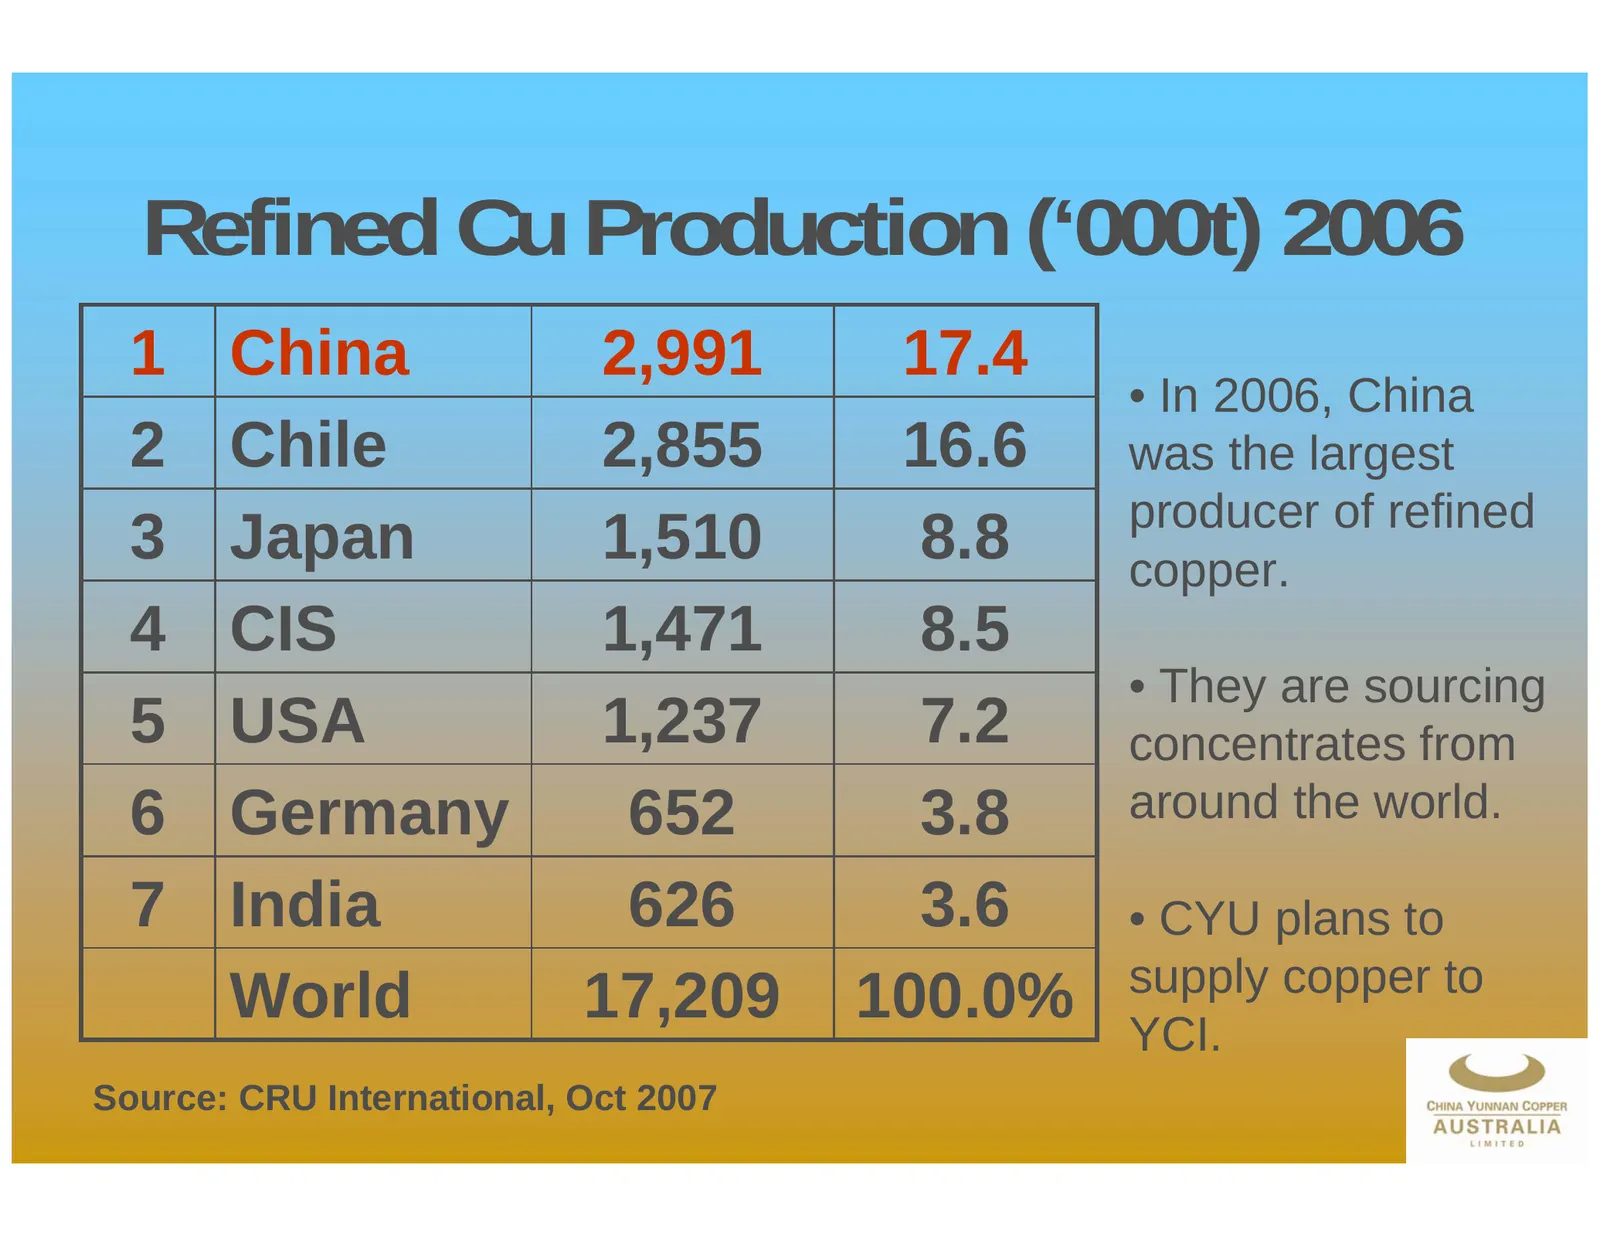
Slide 28: Refined Cu Production ('000t) 2006
Refined Cu Production (‘000t) 2006 1 China 2,991 17.4 • In 2006, China 2 Chile 2,855 16.6 was the largest producer of refined 3 Japan 1,510 8.8 copper. 4 CIS 1,471 8.5 • They are sourcing 5 USA 1,237 7.2 concentrates from 6 Germany 652 3.8 around the world. 7 India 626 3.6 • CYU plans to supply copp
Slide 29: Countries size by GDP % (nominal) 2006
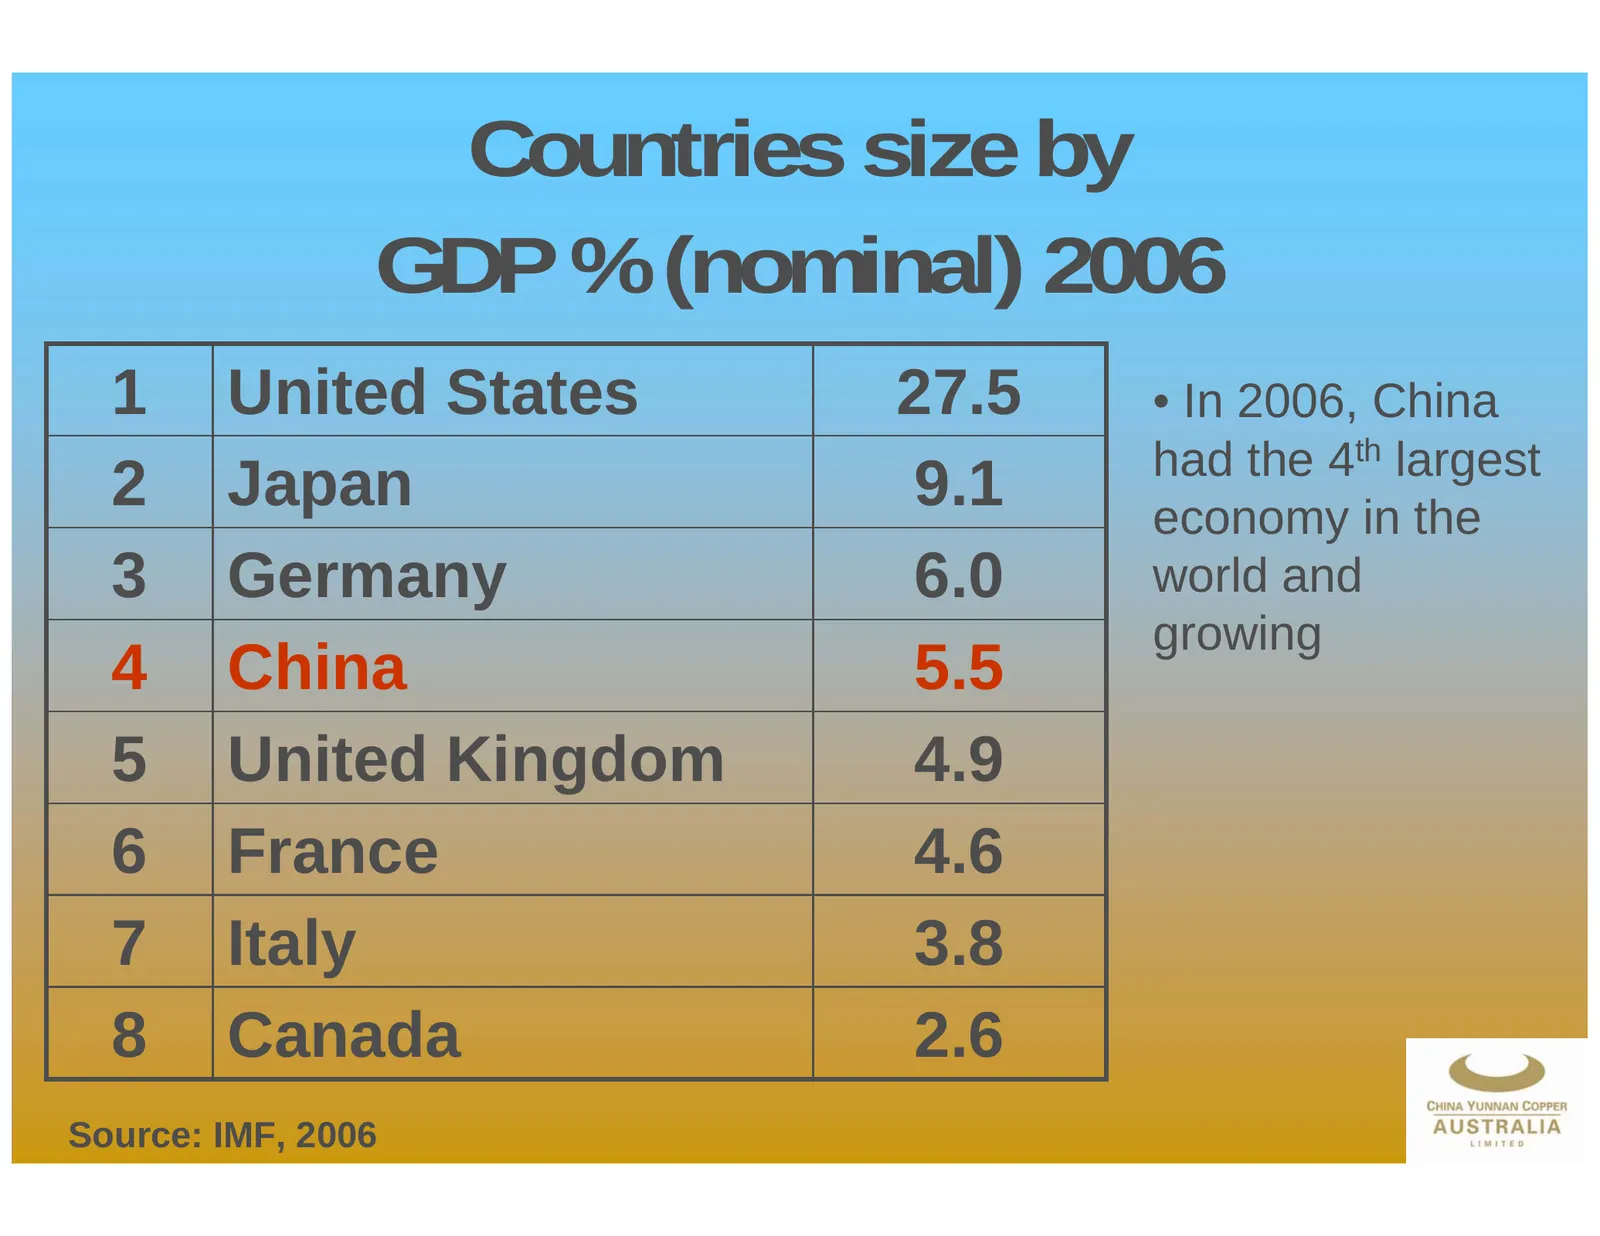
Countries size by GDP % (nominal) 2006 1 United States 27.5 • In 2006, China had the 4th largest 2 Japan 9.1 economy in the 3 Germany 6.0 world and growing 4 China 5.5 5 United Kingdom 4.9 6 France 4.6 7 Italy 3.8 8 Canada 2.6 29 Source: IMF, 2006
Slide 30: Real GDP% Growth
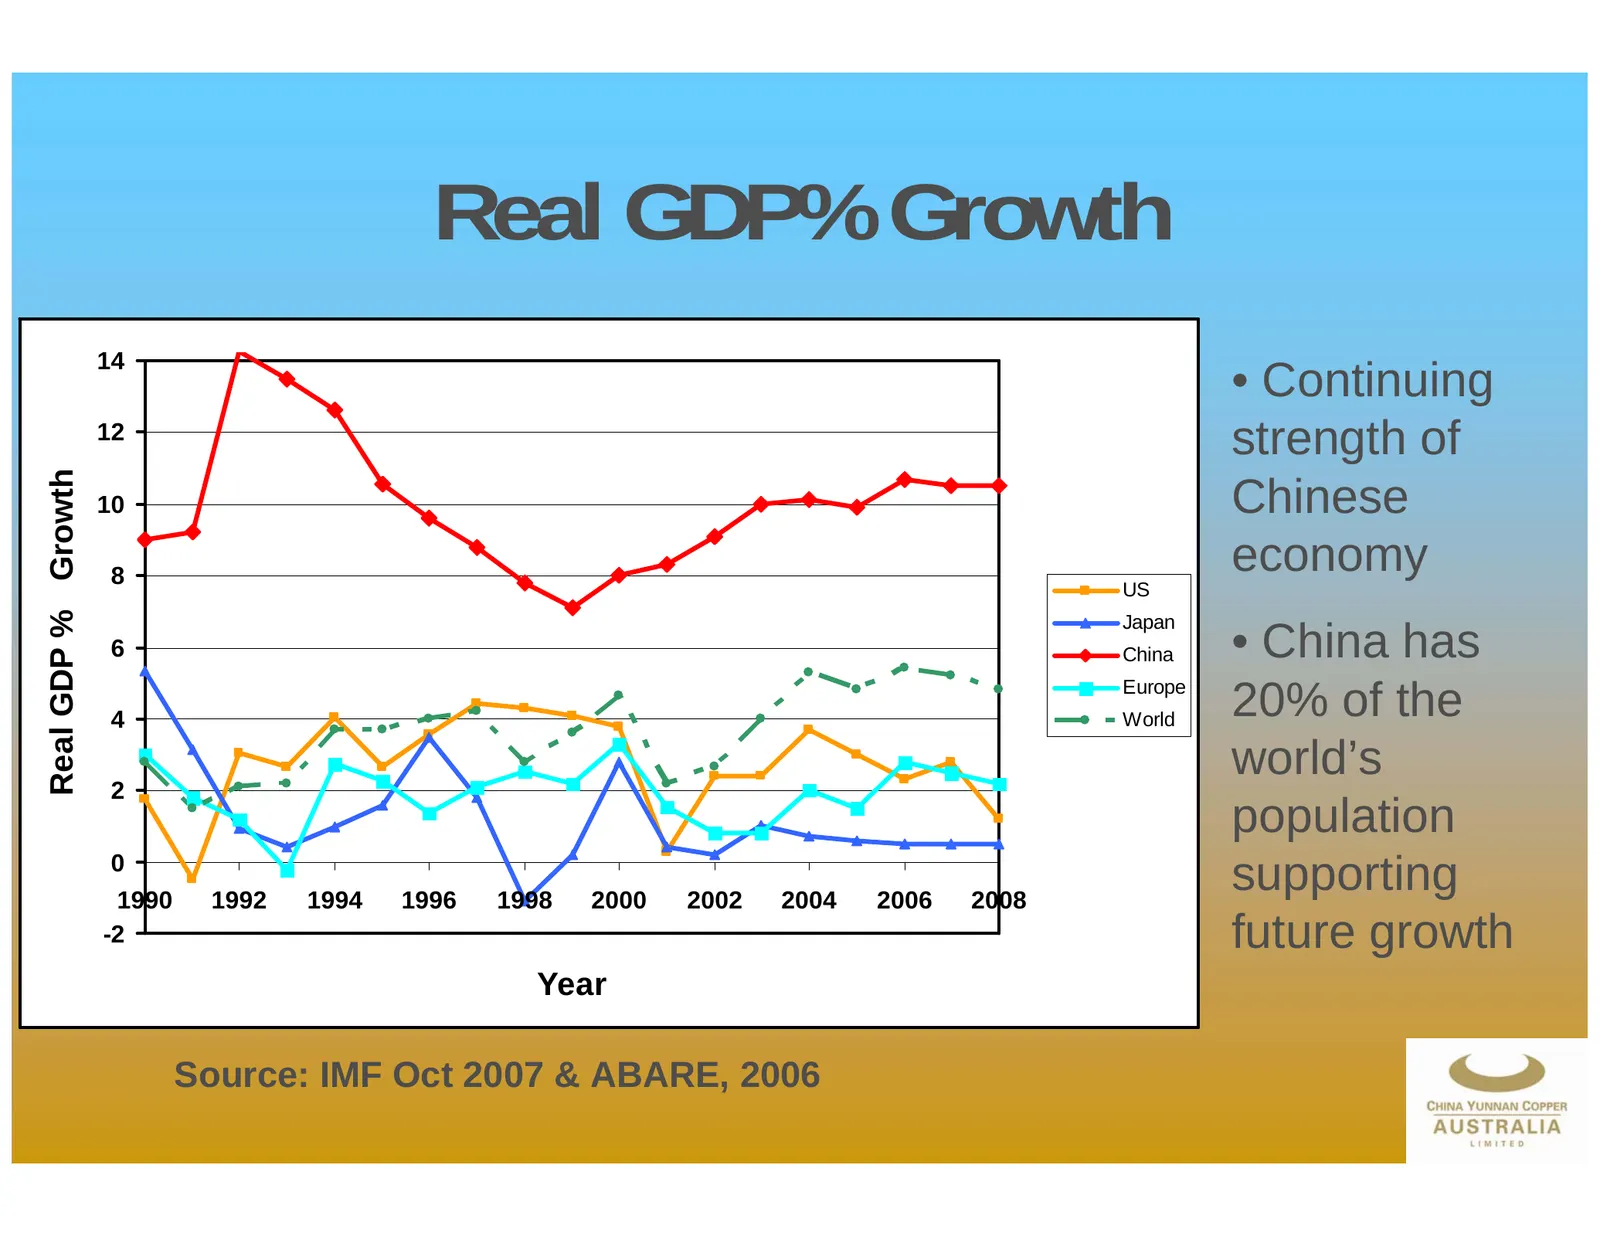
Real GDP% Growth 14 • Continuing 12 strength of Real GDP % Growth 10 Chinese 8 economy US Japan 6 China • China has Europe 4 World 20% of the world’s 2 population 0 1990 1992 1994 1996 1998 2000 2002 2004 2006 2008 supporting -2 future growth Year Source: IMF Oct 2007 & ABARE, 2006 30
Slide 31: Why Invest in CYU?
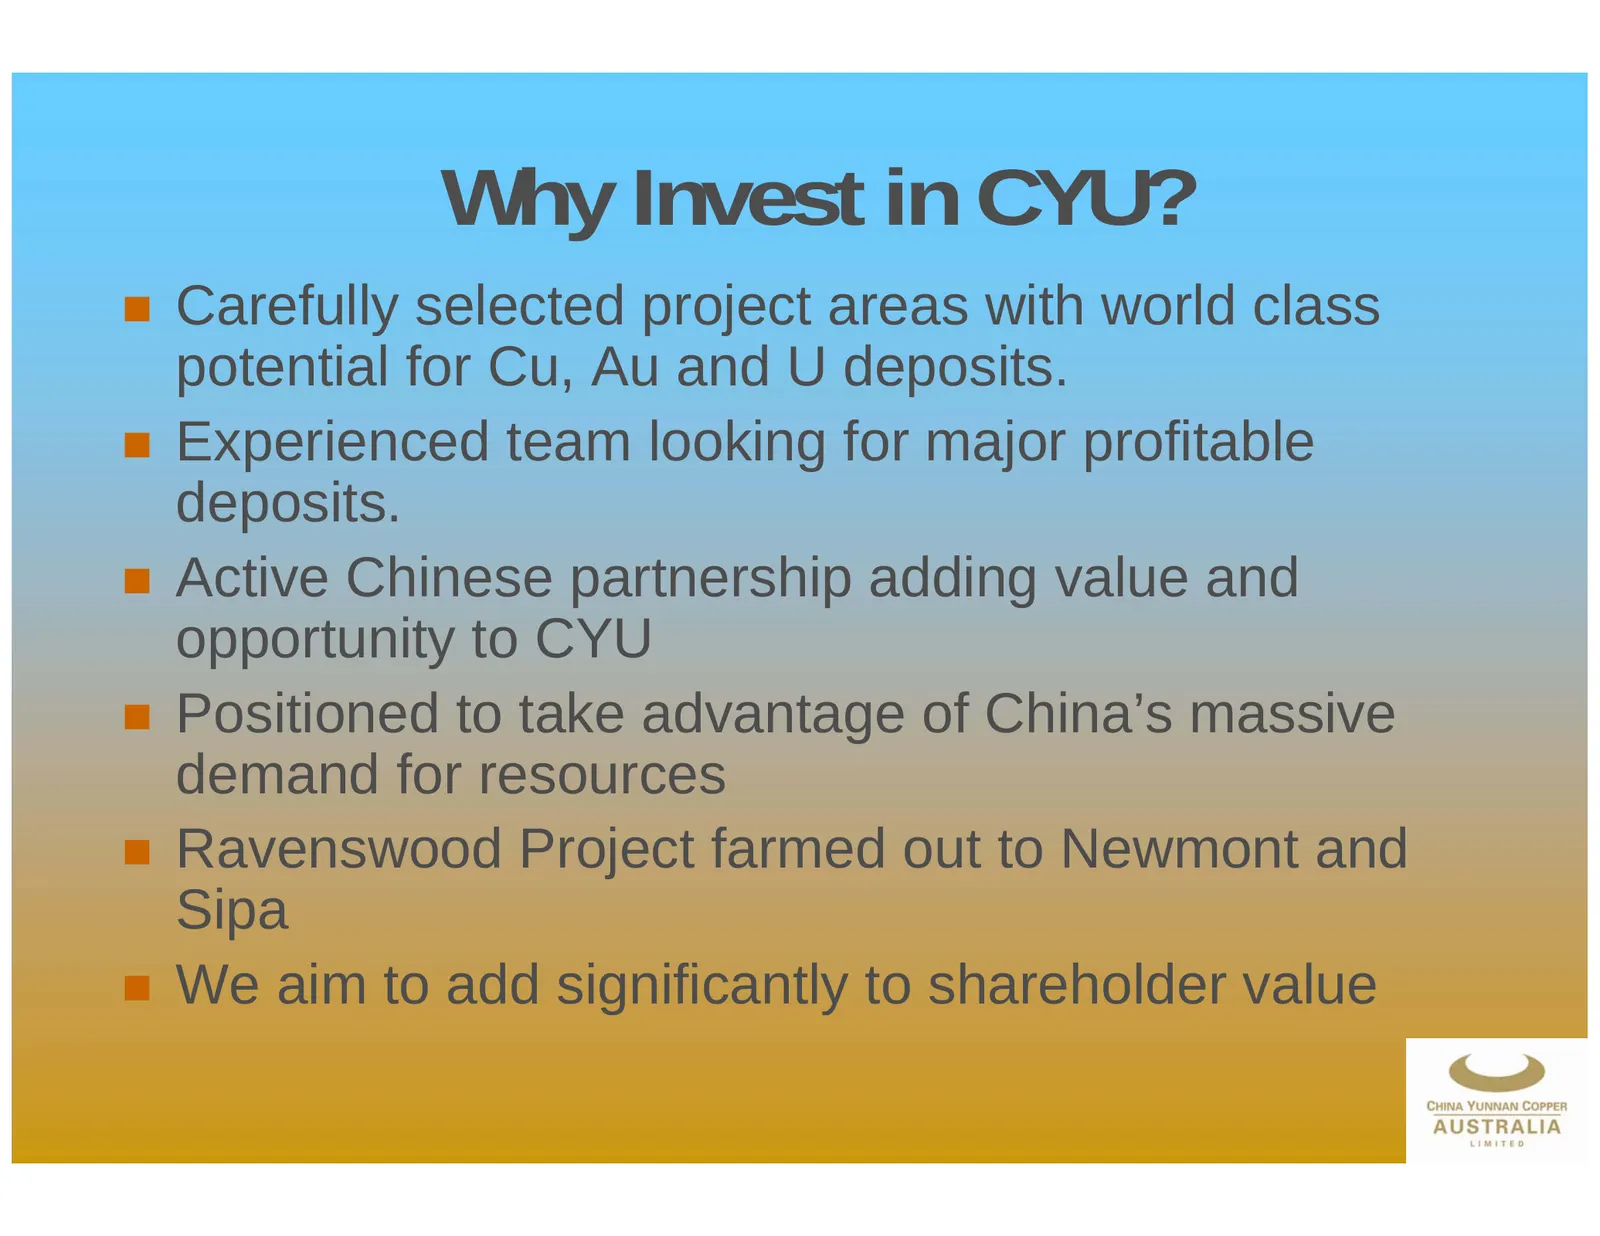
Why Invest in CYU? Carefully selected project areas with world class potential for Cu, Au and U deposits. Experienced team looking for major profitable deposits. Active Chinese partnership adding value and opportunity to CYU Positioned to take advantage of China’s massive demand for resource
Slide 32: A partnership with a competitive edge
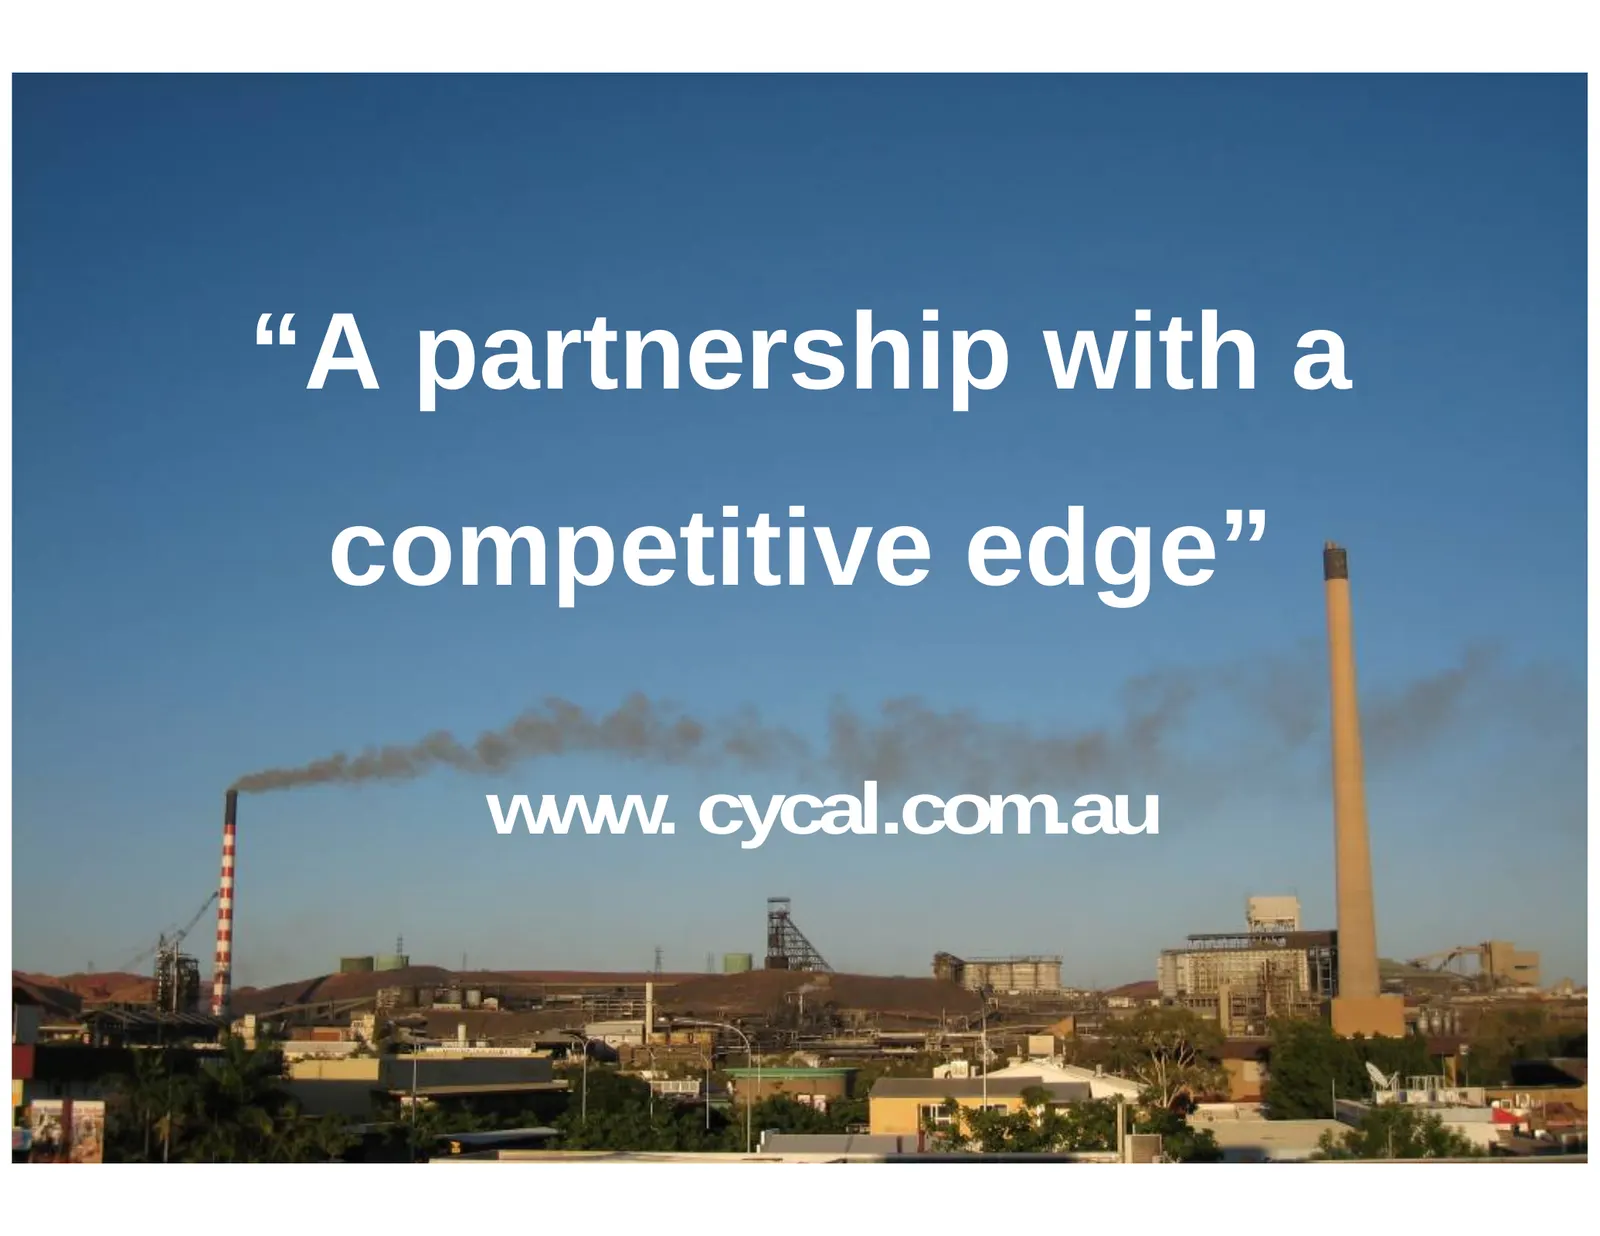
“A partnership with a competitive edge” www. cycal.com.au 32
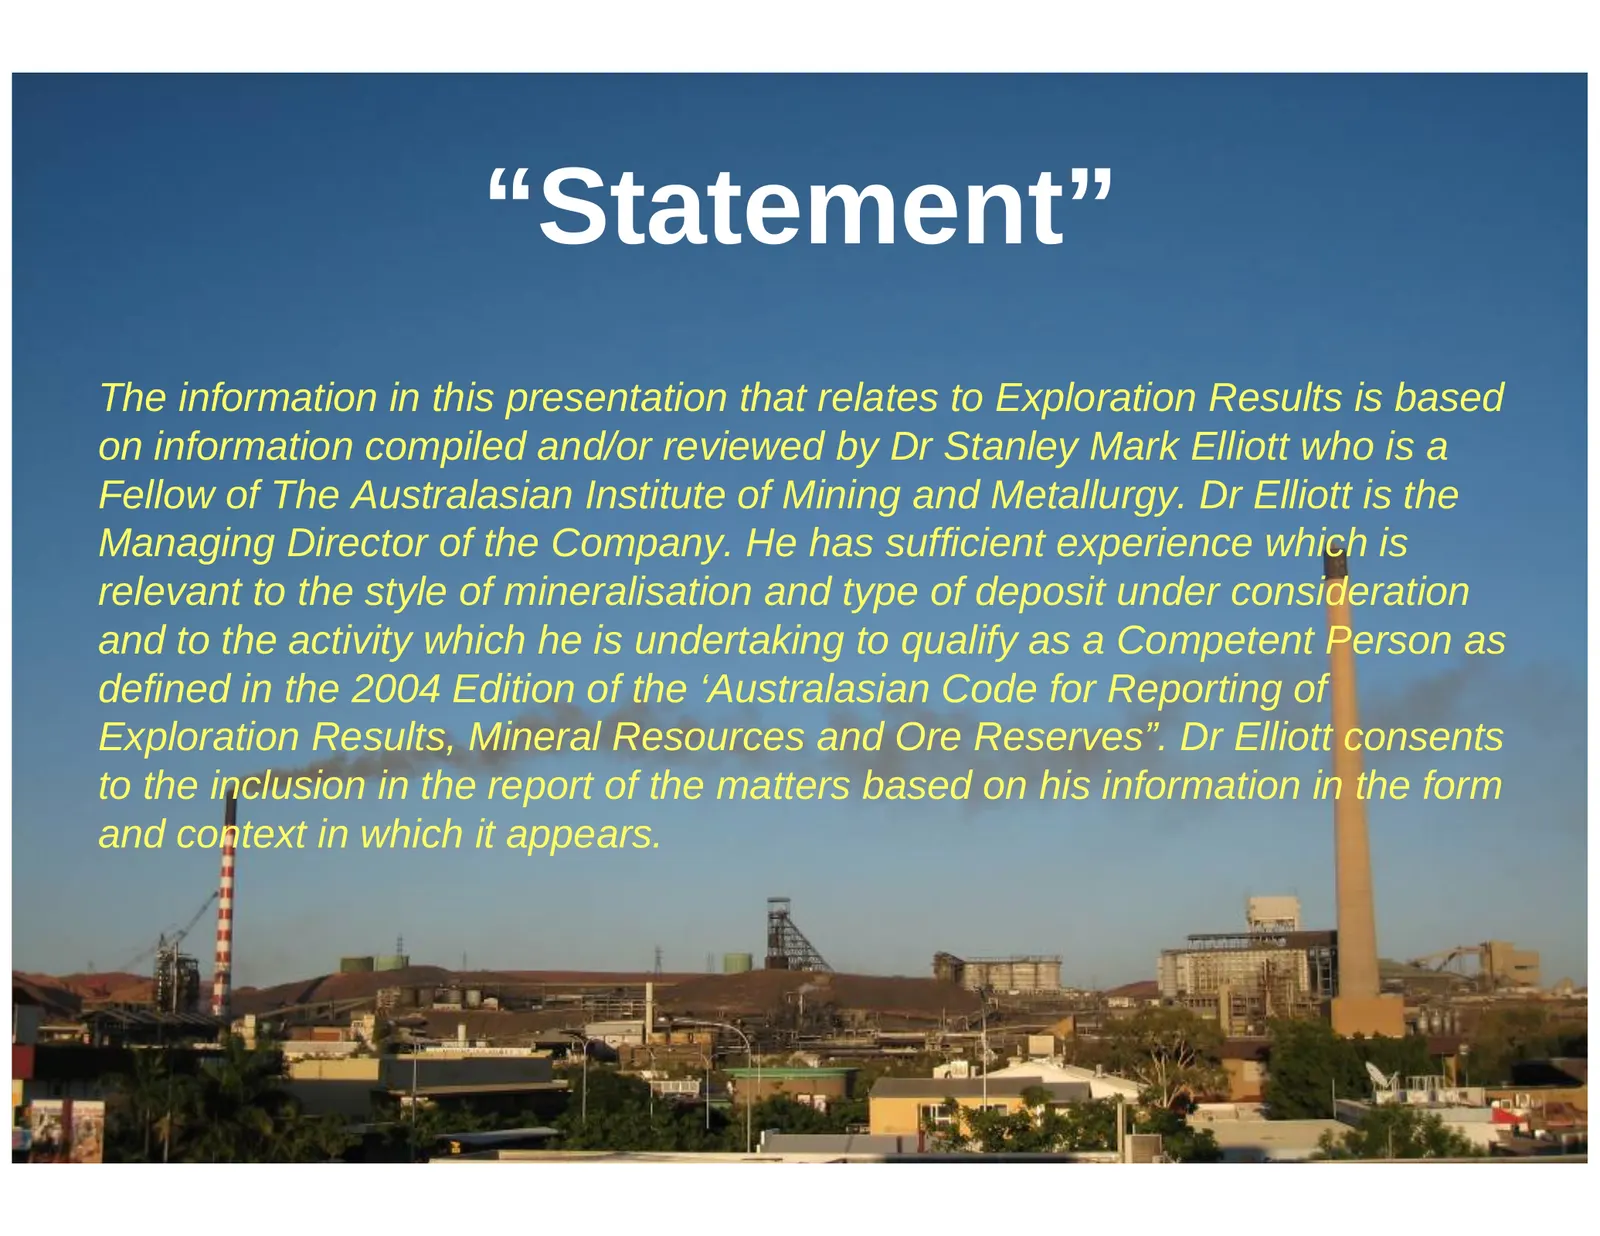
Slide 33: Statement
“Statement” The information in this presentation that relates to Exploration Results is based on information compiled and/or reviewed by Dr Stanley Mark Elliott who is a Fellow of The Australasian Institute of Mining and Metallurgy. Dr Elliott is the Managing Director of the Company. He has sufficie
Source: Internet Archive copy of aukingmining.com
More decks from AuKing Mining Ltd
 Merger or Acquisition (October 2026)12 slides · Oct 14, 2026
 Gold Coast Investor Conference 202623 slides · Jul 7, 2026
 Investor Presentation (June 2026)24 slides · Jun 11, 2026
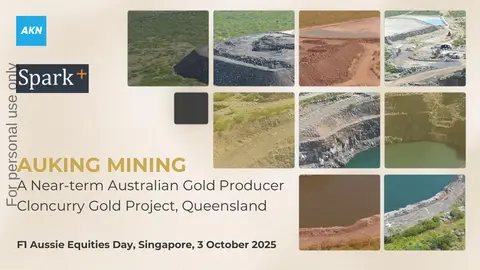 F1 Aussie Equities Day, Singapore 202522 slides · Oct 3, 2025
 Noosa Mining Conference 202521 slides · Jul 23, 2025
 Noosa Mining Conference 202313 slides · Nov 15, 2023