Fidelity Bancorp — Merger or Acquisition (July 2012)
16 slides from Fidelity Bancorp's merger presentation, Jul 20, 2012
Slide 1: Accelerating Growth in Pittsburgh: Acquisition of Fidelity Bancorp, Inc.
Exhibit 99.1 By all accounts, better. Accelerating Growth in Pittslourgh Acquisition of Fidelity Bancorp, Inc. July 20, 2012 FIDELITY [C Bancorp, Inc.
Slide 2: Forward-Looking Statements
Forward-Looking Statements Forward-looking statements in this presentation relating to WesBanco’s plans, strategies, objectives, expectations, intentions and adequacy of resources, are made pursuant to the safe harbor provisions of the Private Securities Litigation Reform Act of 1995. The informatio
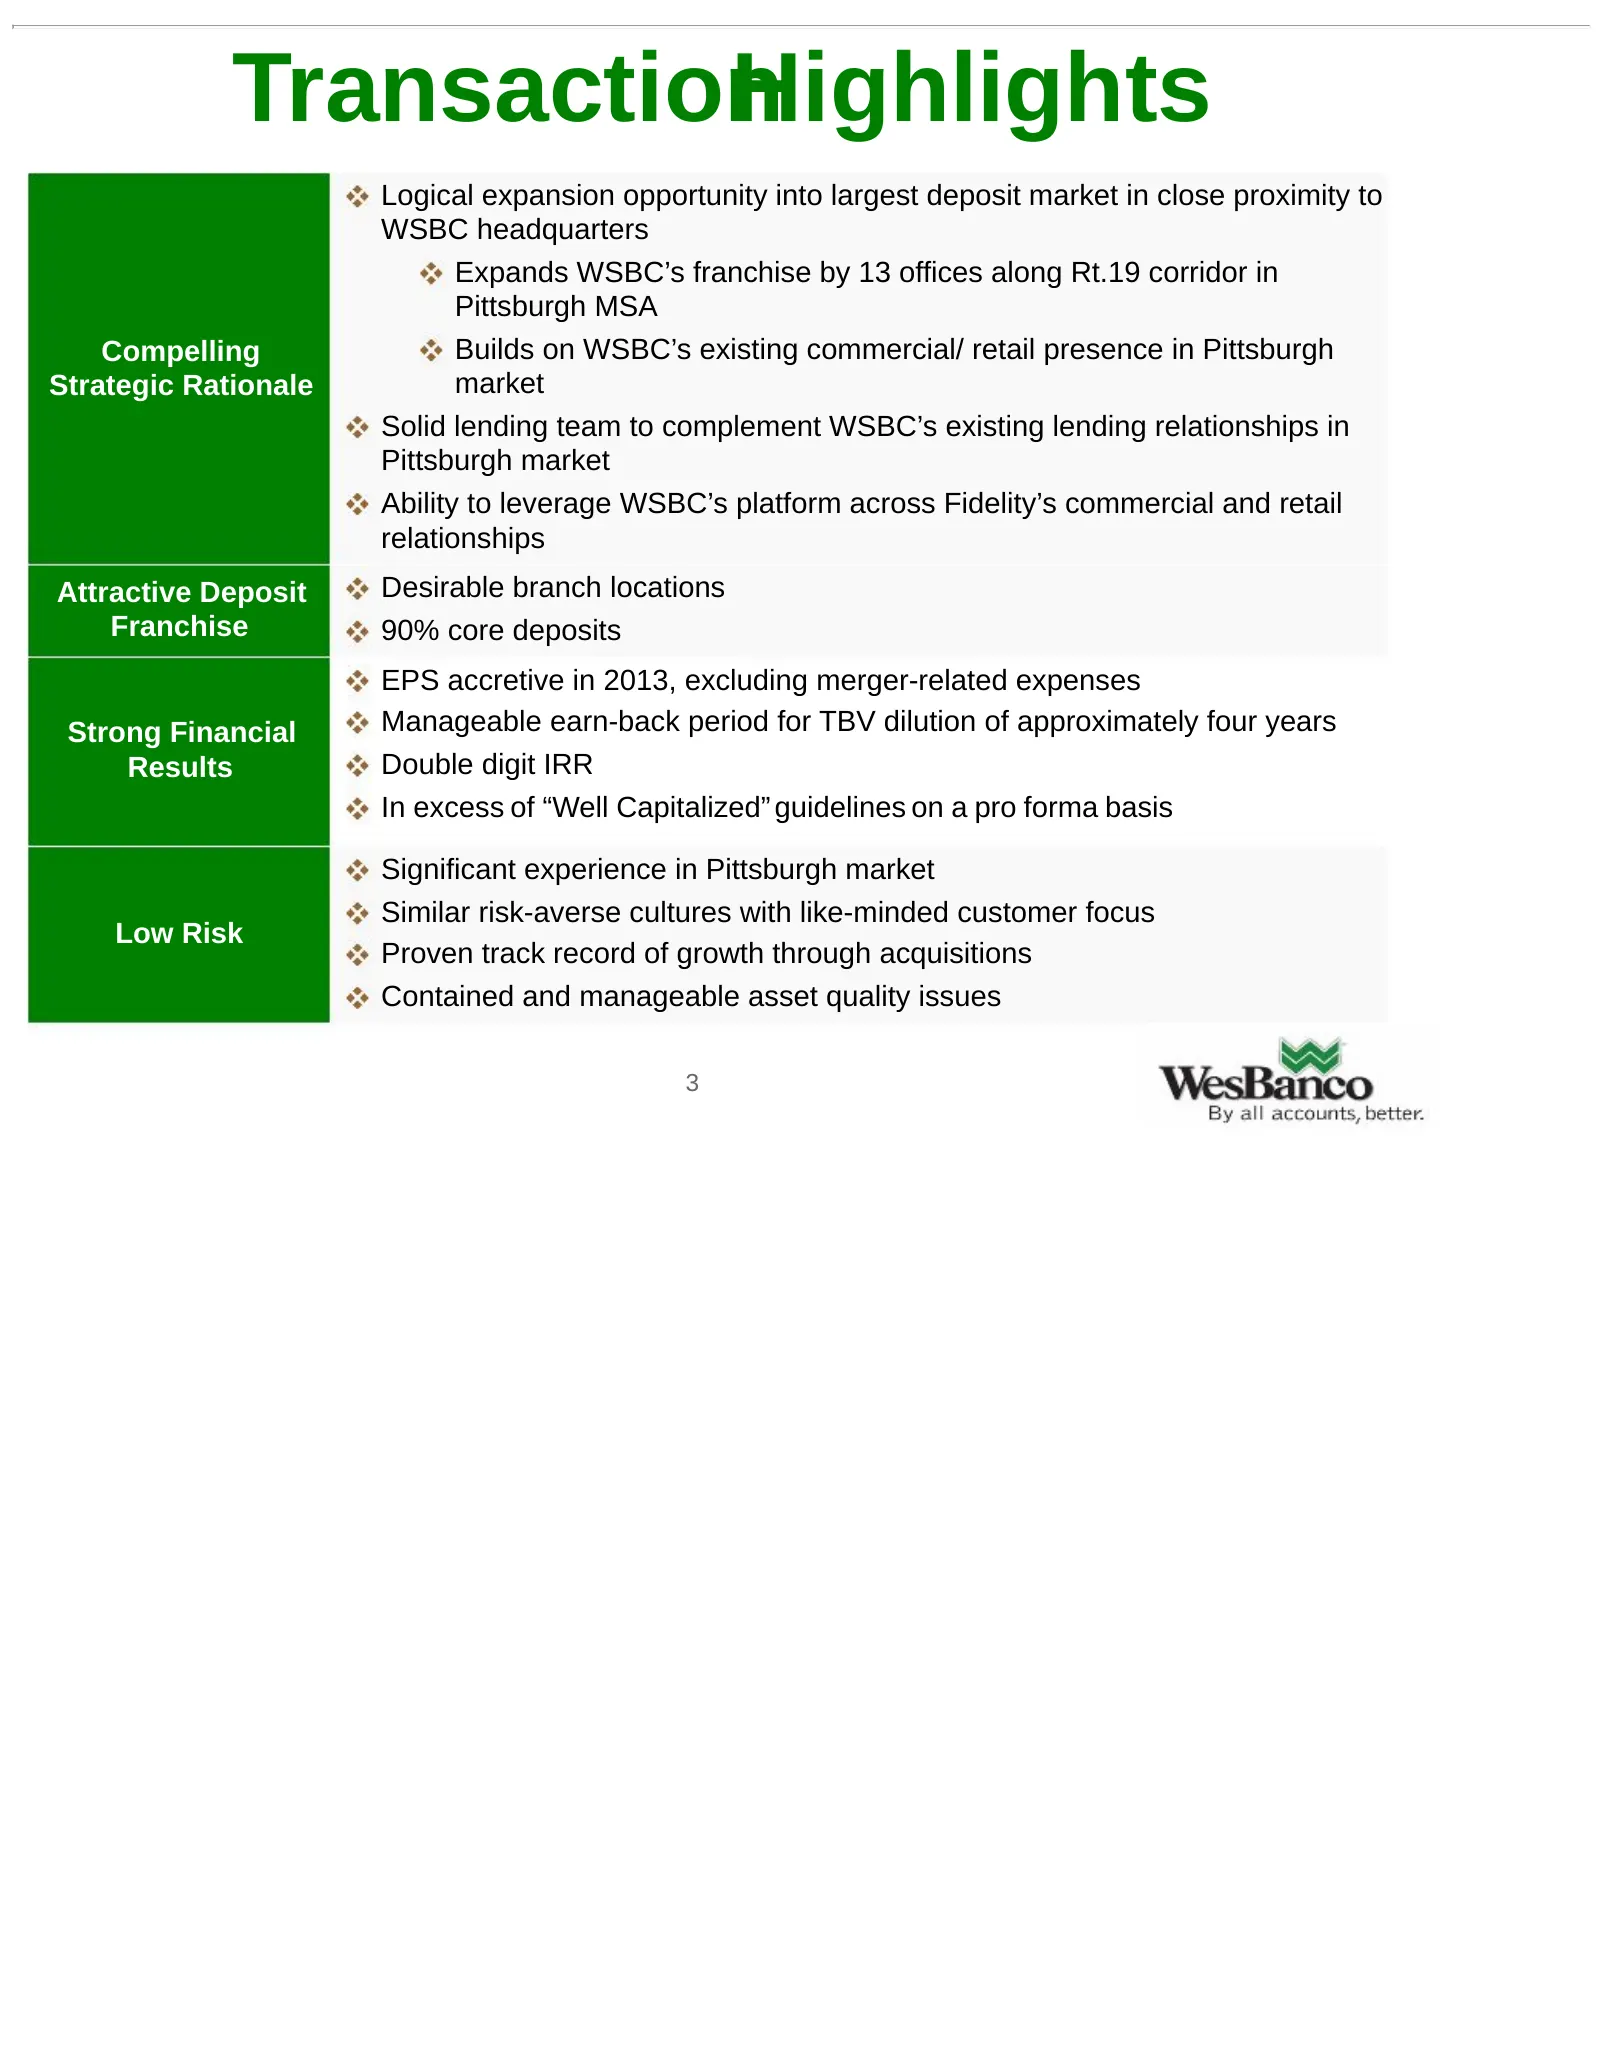
Slide 3: Transaction Highlights
Transaction Highlights Logical expansion opportunity into largest deposit market in close proximity to WSBC headquarters Expands WSBC’s franchise by 13 offices along Rt.19 corridor in Pittsburgh MSA Compelling Builds on WSBC’s existing commercial/ retail presence in Pittsburgh Strategic Rationale ma
Slide 4: Fidelity Bancorp, Inc. Overview
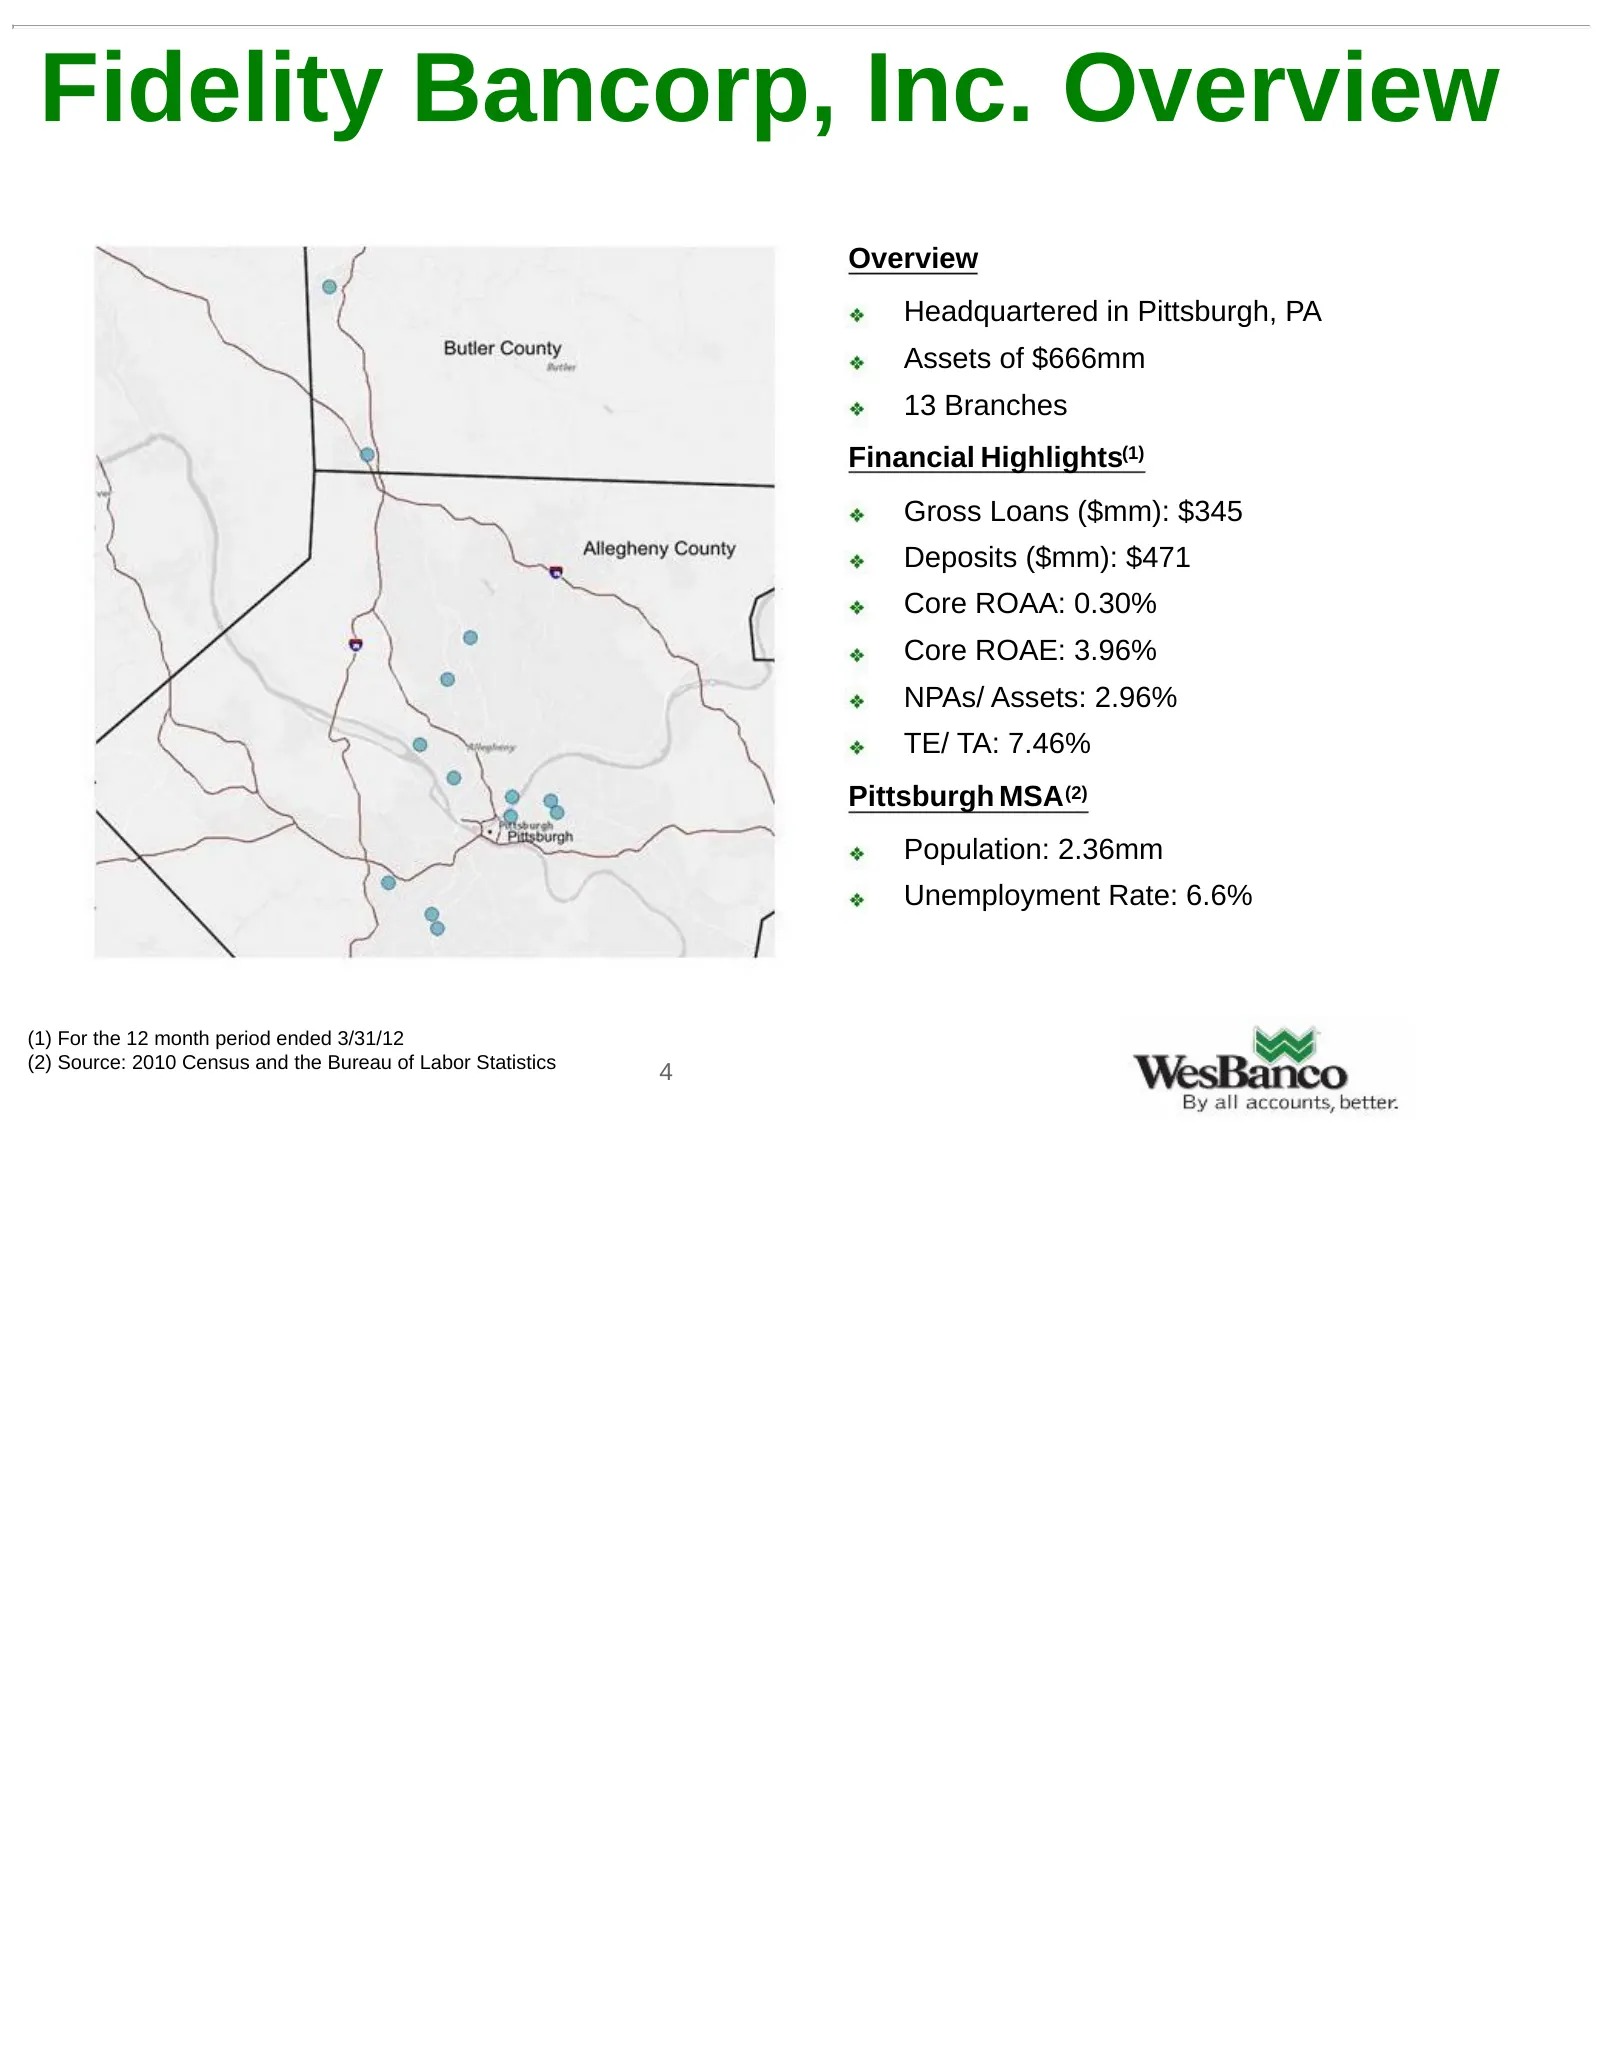
Fidelity Bancorp, Inc. Overview Overview Headquartered in Pittsburgh, PA Assets of $666mm 13 Branches Financial Highlights(1) Gross Loans ($mm): $345 Deposits ($mm): $471 Core ROAA: 0.30% Core ROAE: 3.96% NPAs/ Assets: 2.96% TE/ TA: 7.46% Pittsburgh MSA (2) Population: 2.36mm Unemployment Rate: 6.6%
Slide 5: Logical Market Extension
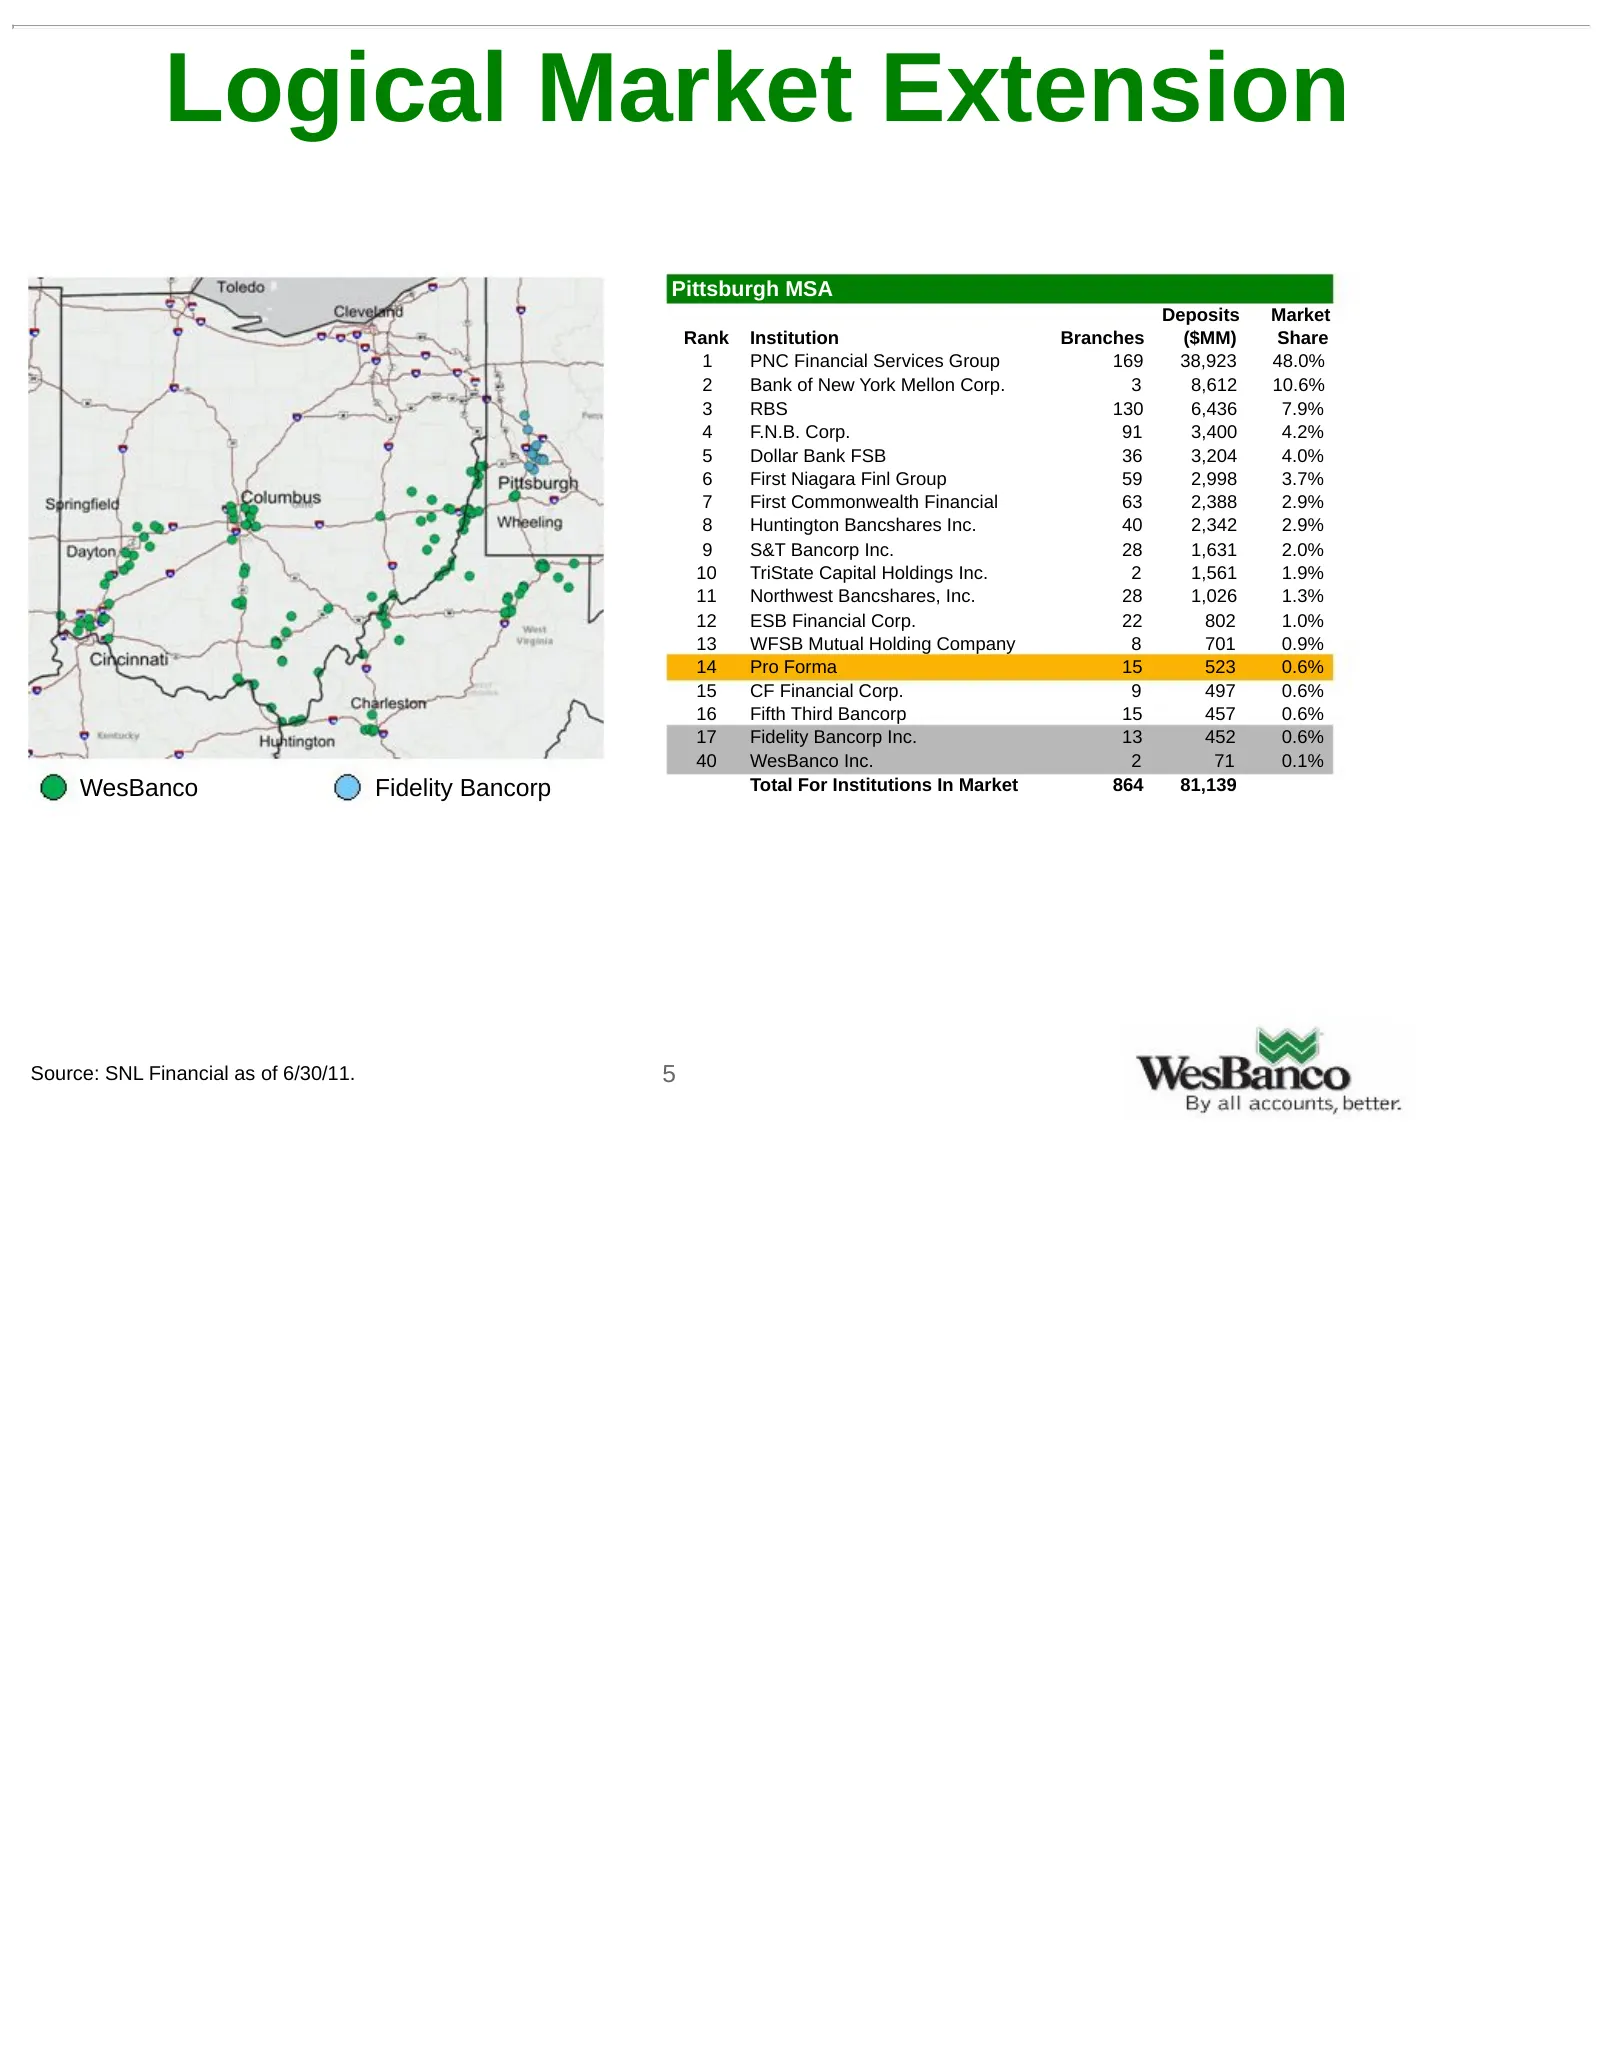
Logical Market Extension Pittsburgh MSA Deposits Market Rank Institution Branches ($MM) Share 1 PNC Financial Services Group 169 38,923 48.0% 2 Bank of New York Mellon Corp. 3 8,612 10.6% 3 RBS 130 6,436 7.9% 4 F.N.B. Corp. 91 3,400 4.2% 5 Dollar Bank FSB 36 3,204 4.0% 6 First Niagara Finl Group 59
Slide 6: Market Highlights
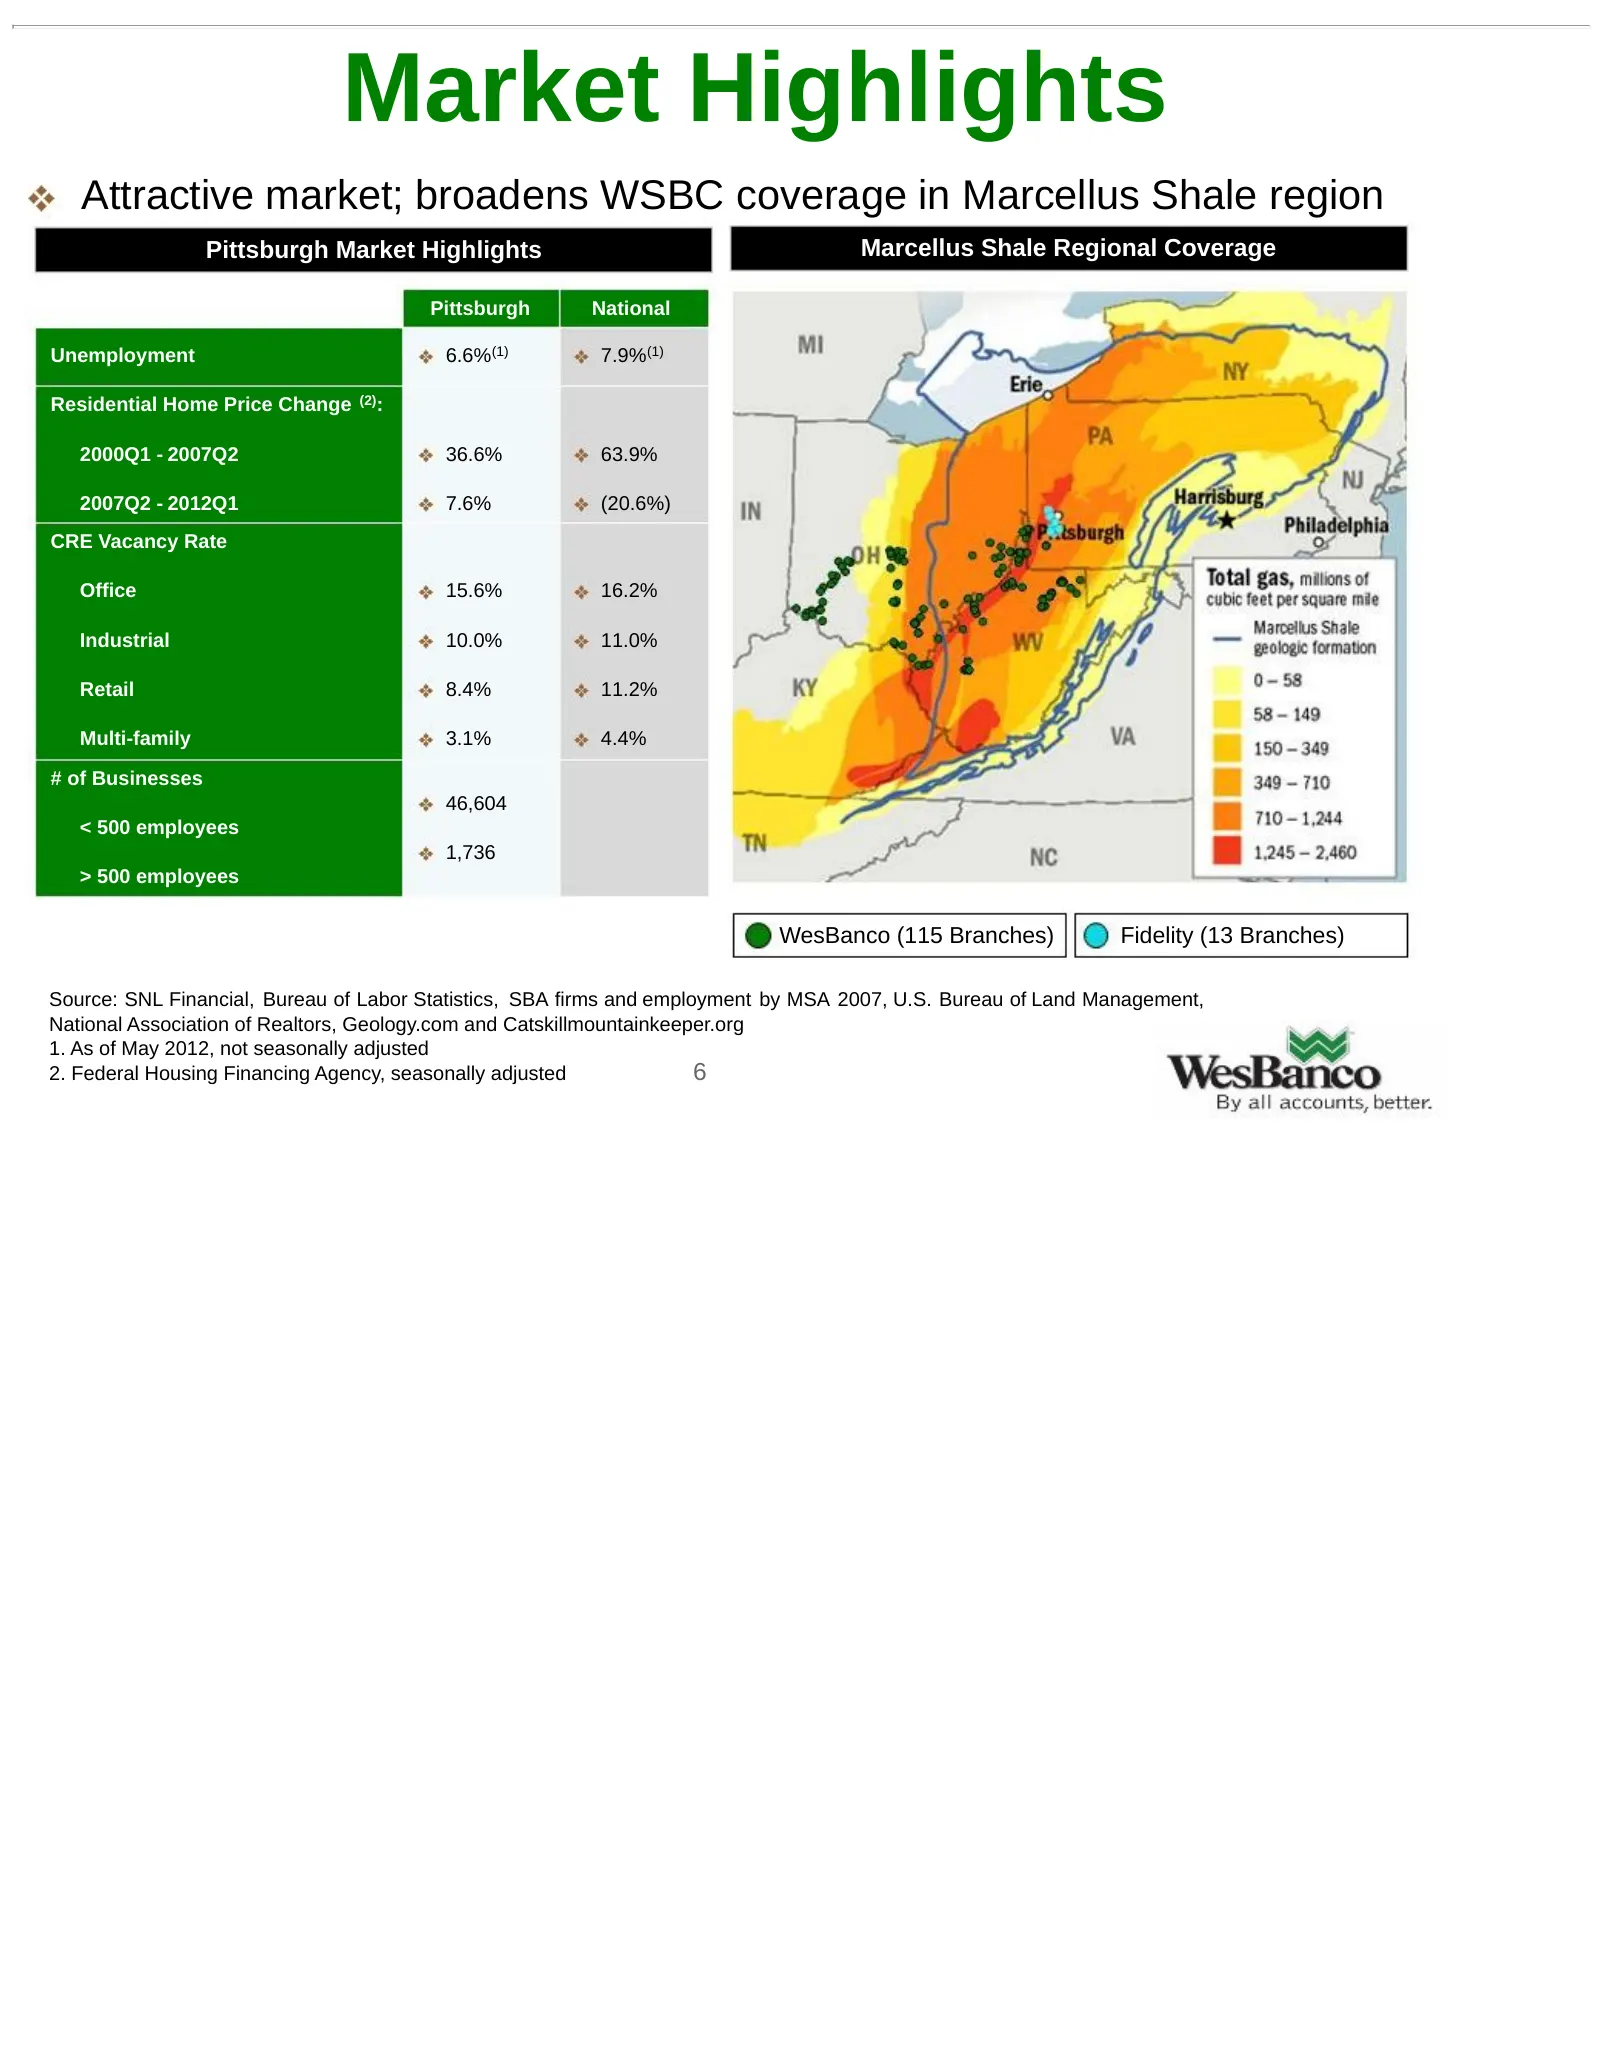
Market Highlights Attractive market; broadens WSBC coverage in Marcellus Shale region Pittsburgh Market Highlights Marcellus Shale Regional Coverage Pittsburgh National Unemployment 6.6%(1) 7.9%(1) Residential Home Price Change (2): 2000Q1 - 2007Q2 36.6% 63.9% 2007Q2 - 2012Q1 7.6% (20.6%) CRE Vacanc
Slide 7: Transaction Summary
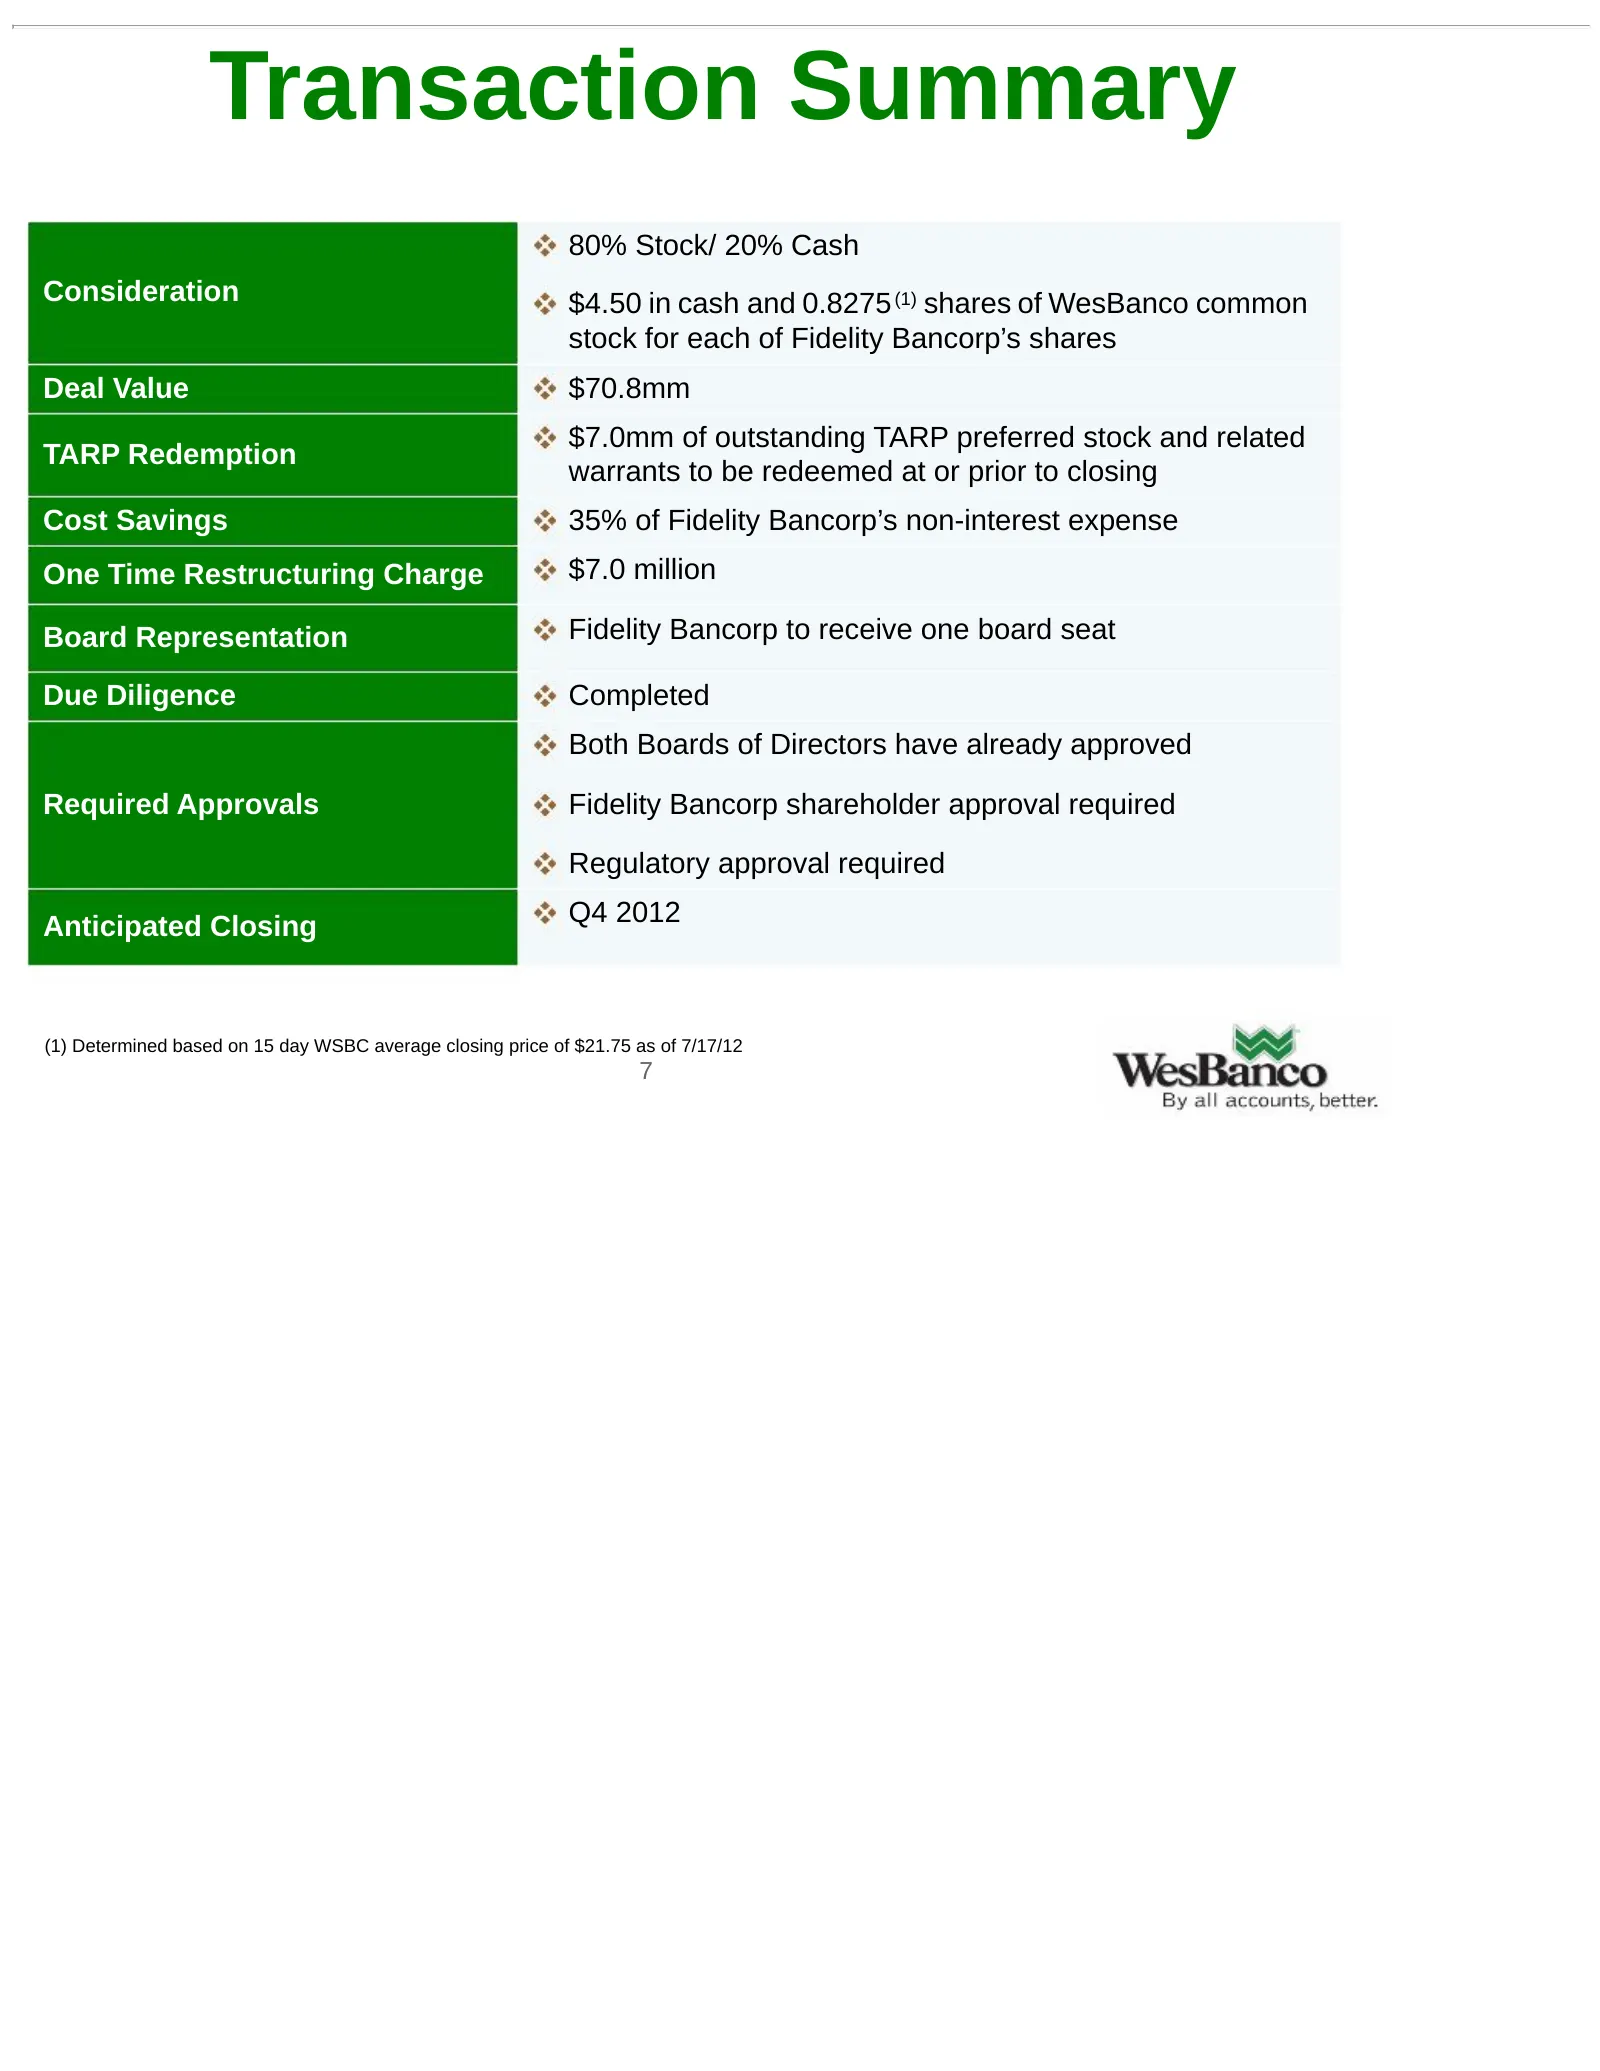
Transaction Summary 80% Stock/ 20% Cash Consideration $4.50 in cash and 0.8275 (1) shares of WesBanco common stock for each of Fidelity Bancorp’s shares Deal Value $70.8mm $7.0mm of outstanding TARP preferred stock and related TARP Redemption warrants to be redeemed at or prior to closing Cost Savin
Slide 8: Pro Forma Financial Impact
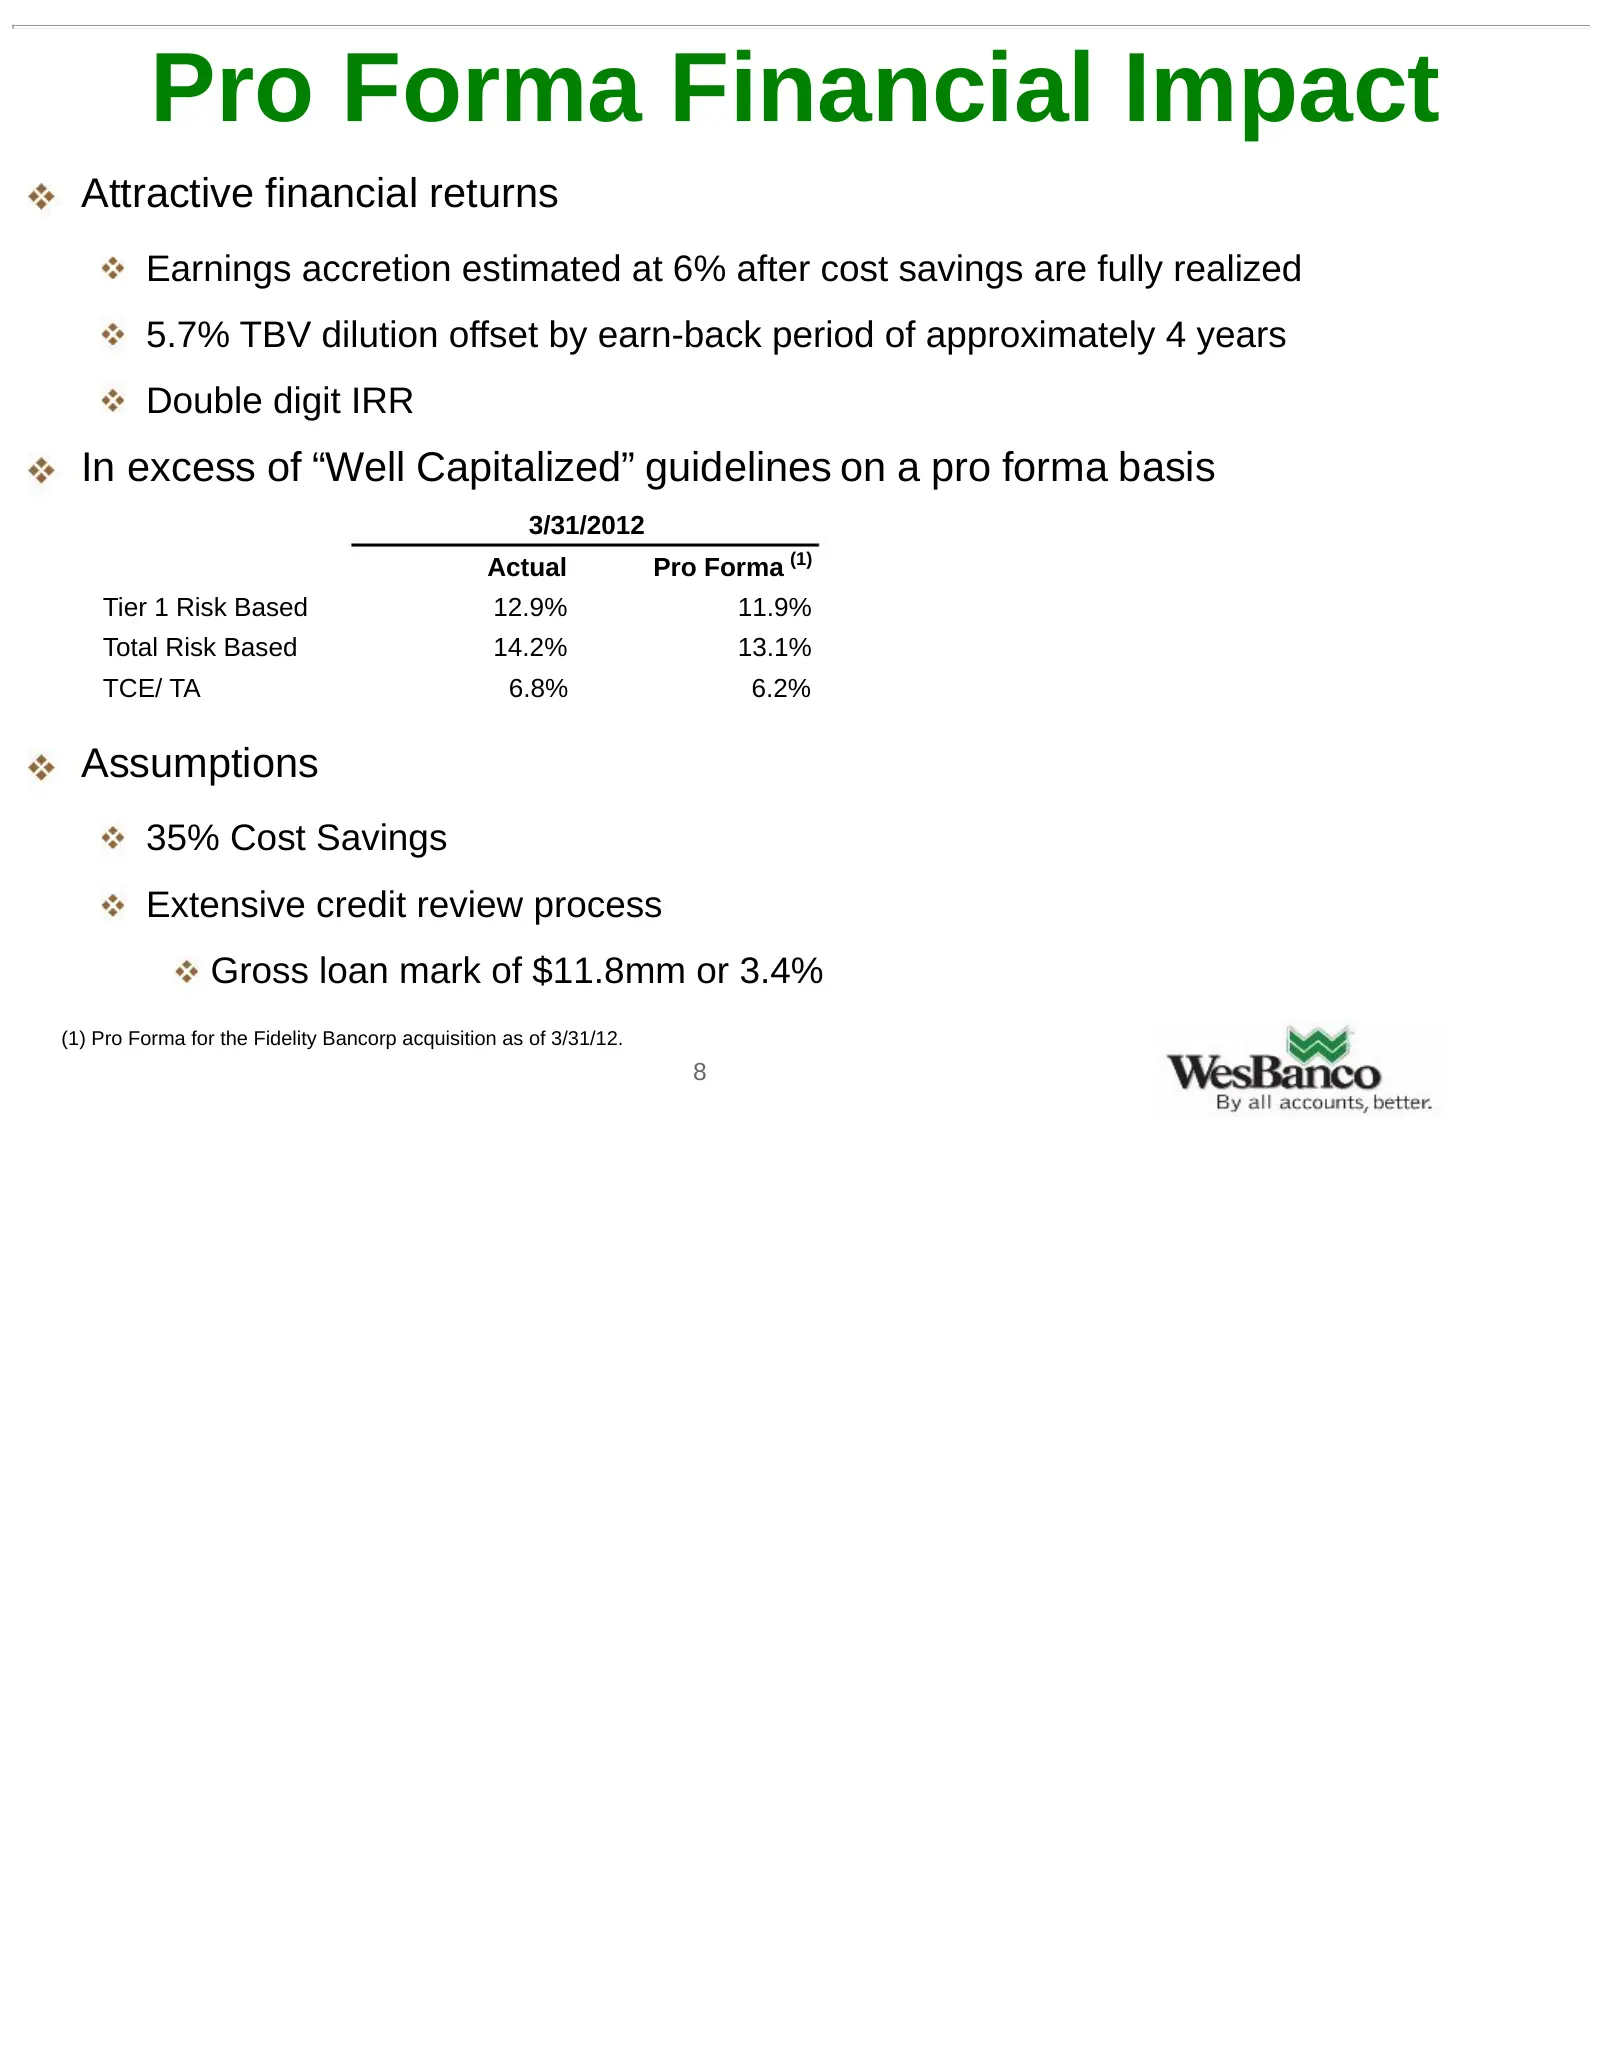
Pro Forma Financial Impact Attractive financial returns Earnings accretion estimated at 6% after cost savings are fully realized 5.7% TBV dilution offset by earn-back period of approximately 4 years Double digit IRR In excess of “Well Capitalized” guidelines on a pro forma basis 3/31/2012 Actual Pro
Slide 9: Pro Forma Deposits and Loans
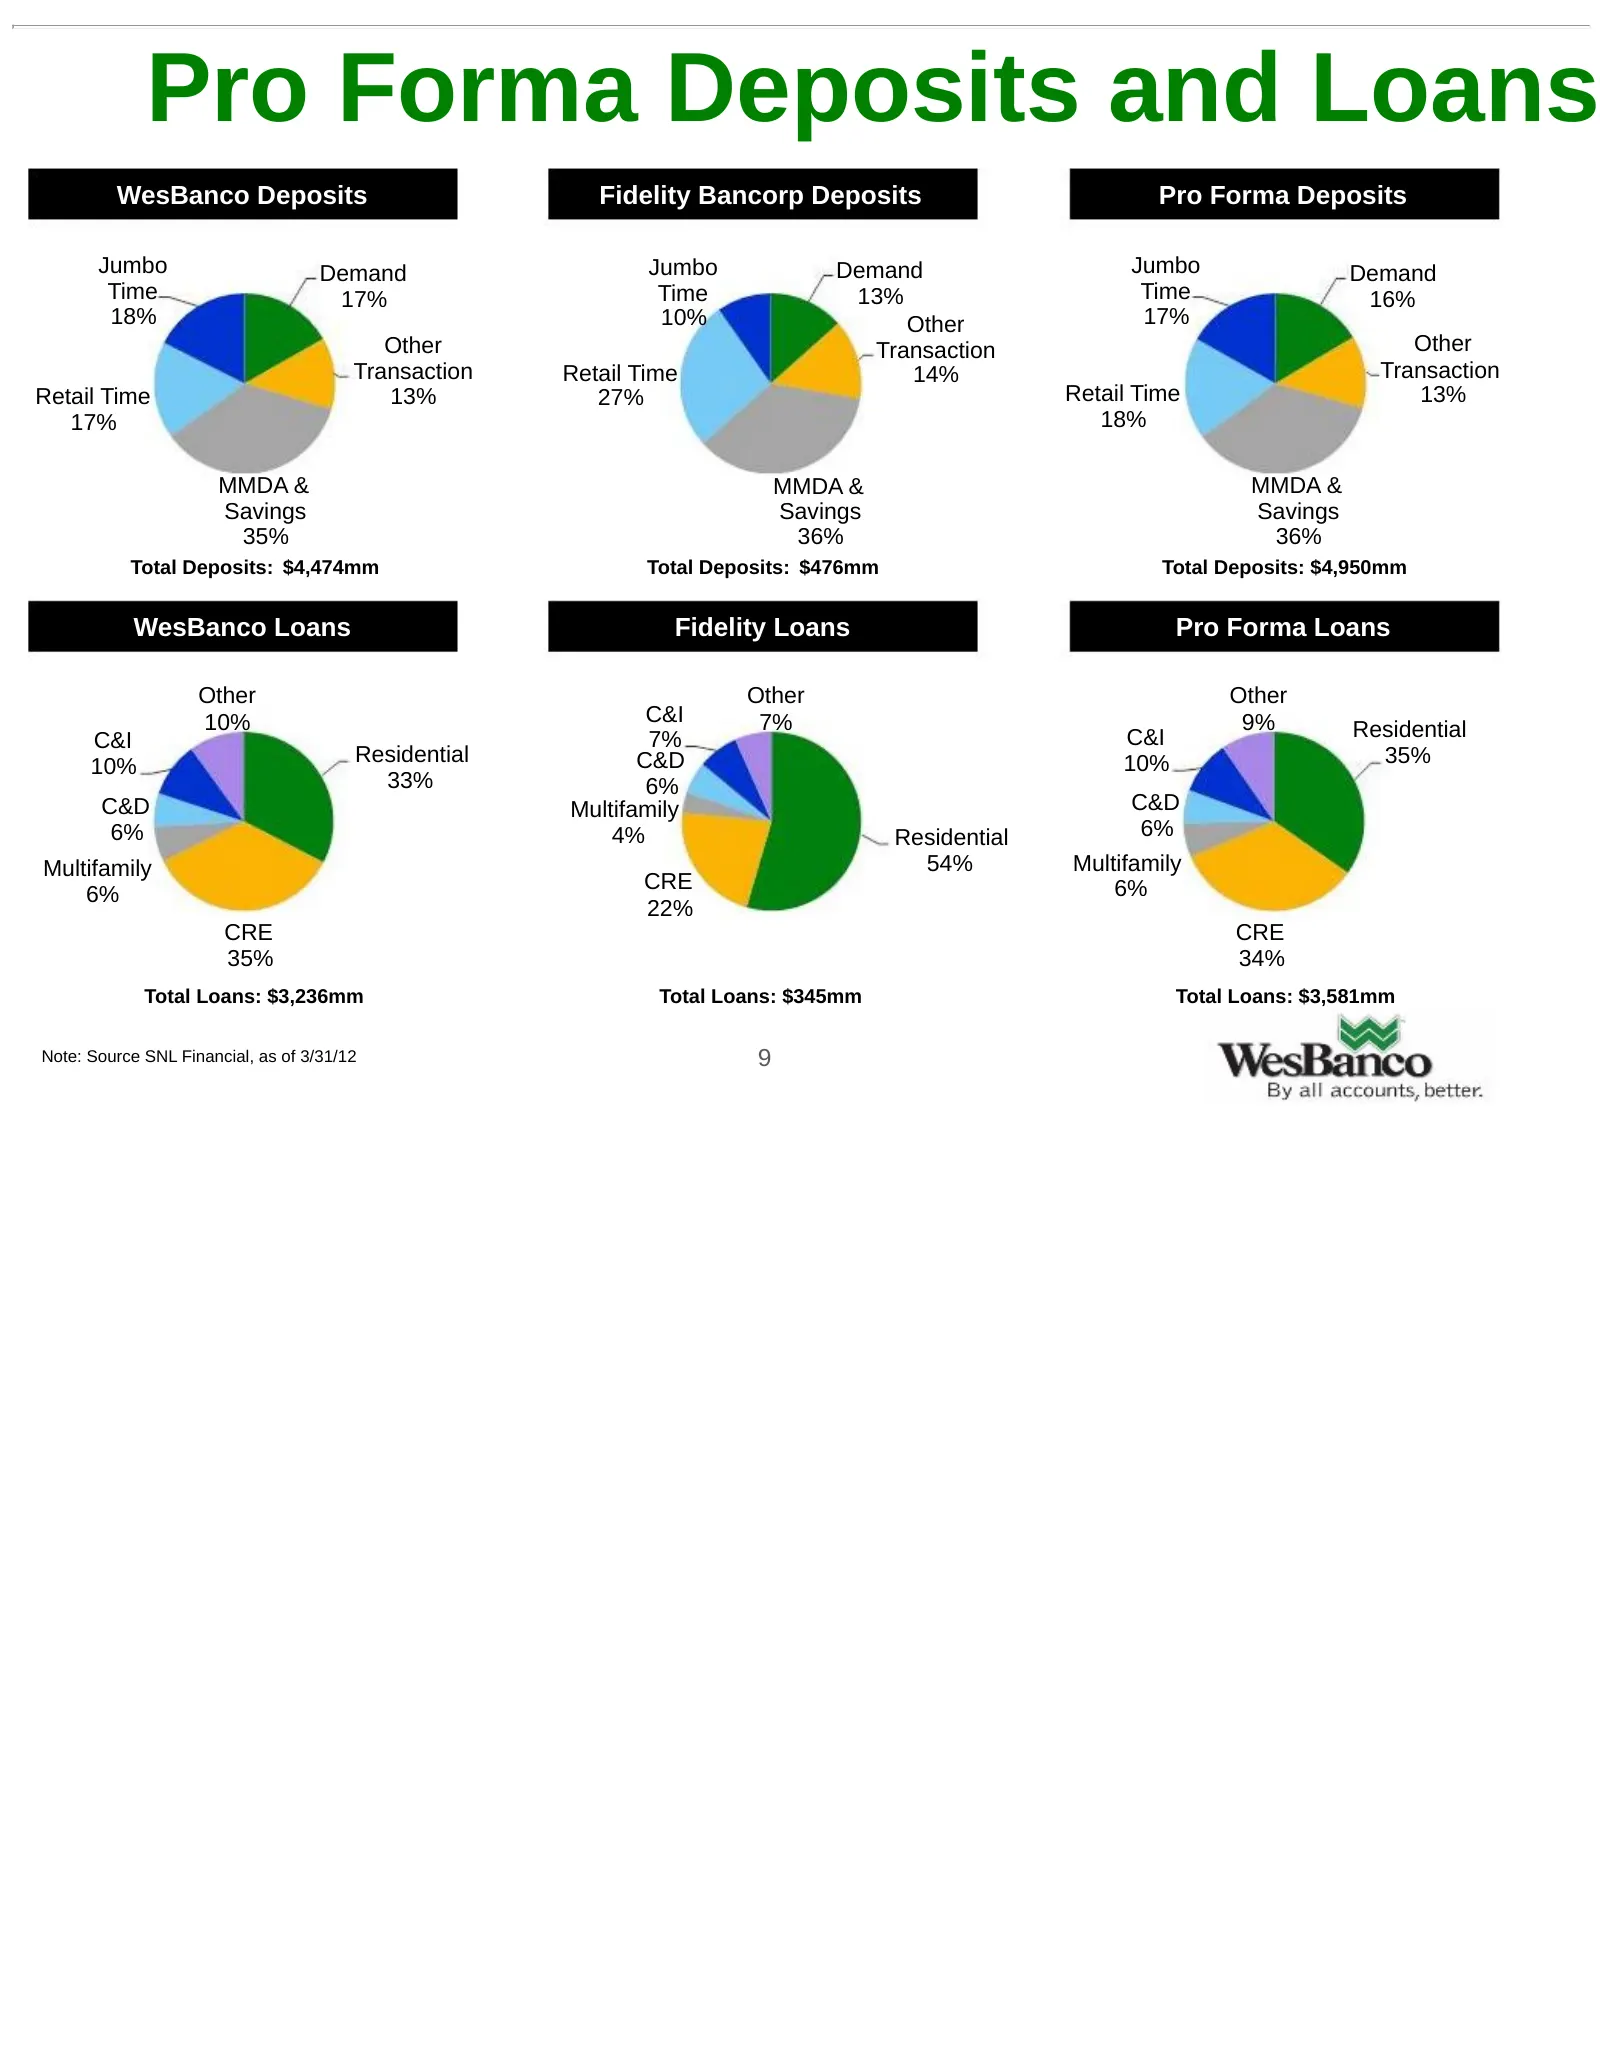
Pro Forma Deposits and Loans WesBanco Deposits Fidelity Bancorp Deposits Pro Forma Deposits Jumbo Demand Jumbo Demand Jumbo Demand Time 17% Time 13% Time 16% 18% 10% Other 17% Other Transaction Other Transaction Retail Time 14% Transaction Retail Time 13% 27% Retail Time 13% 17% 18% MMDA & MMDA & MM
Slide 10: Pricing In Line With Recent Deals
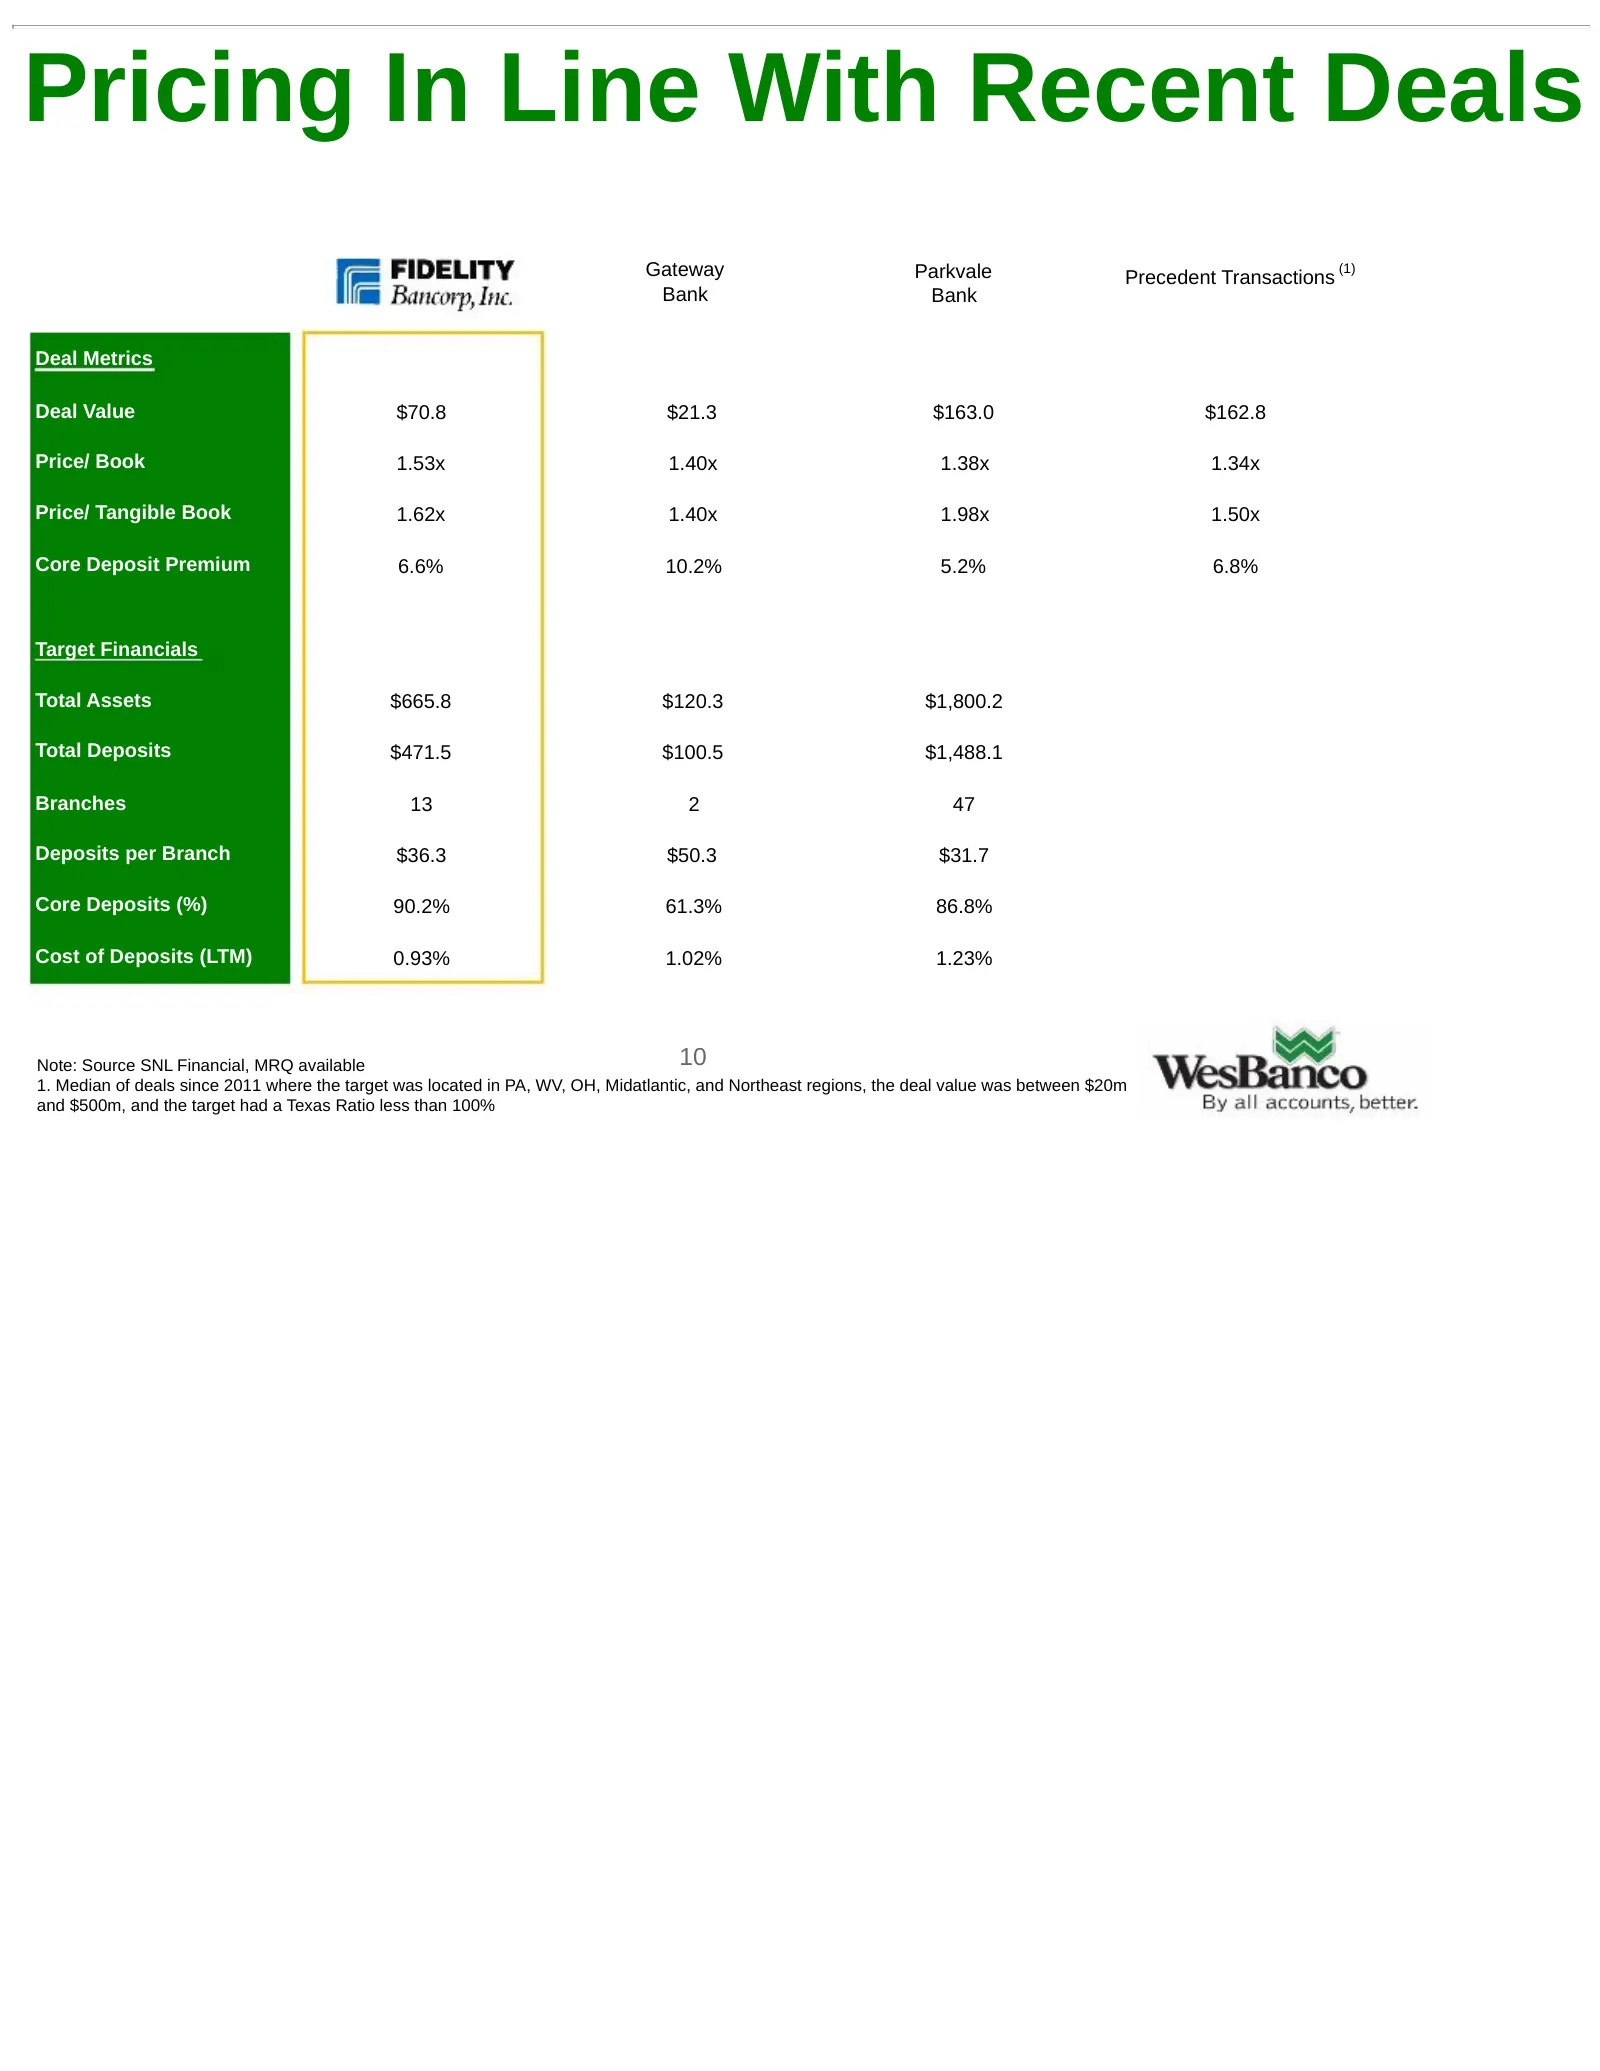
Pricing In Line With Recent Deals Gateway Parkvale Precedent Transactions (1) Bank Bank Deal Metrics Deal Value $70.8 $21.3 $163.0 $162.8 Price/ Book 1.53x 1.40x 1.38x 1.34x Price/ Tangible Book 1.62x 1.40x 1.98x 1.50x Core Deposit Premium 6.6% 10.2% 5.2% 6.8% Target Financials Total Assets $665.8 $
Slide 11: Proven Acquisition Track Record
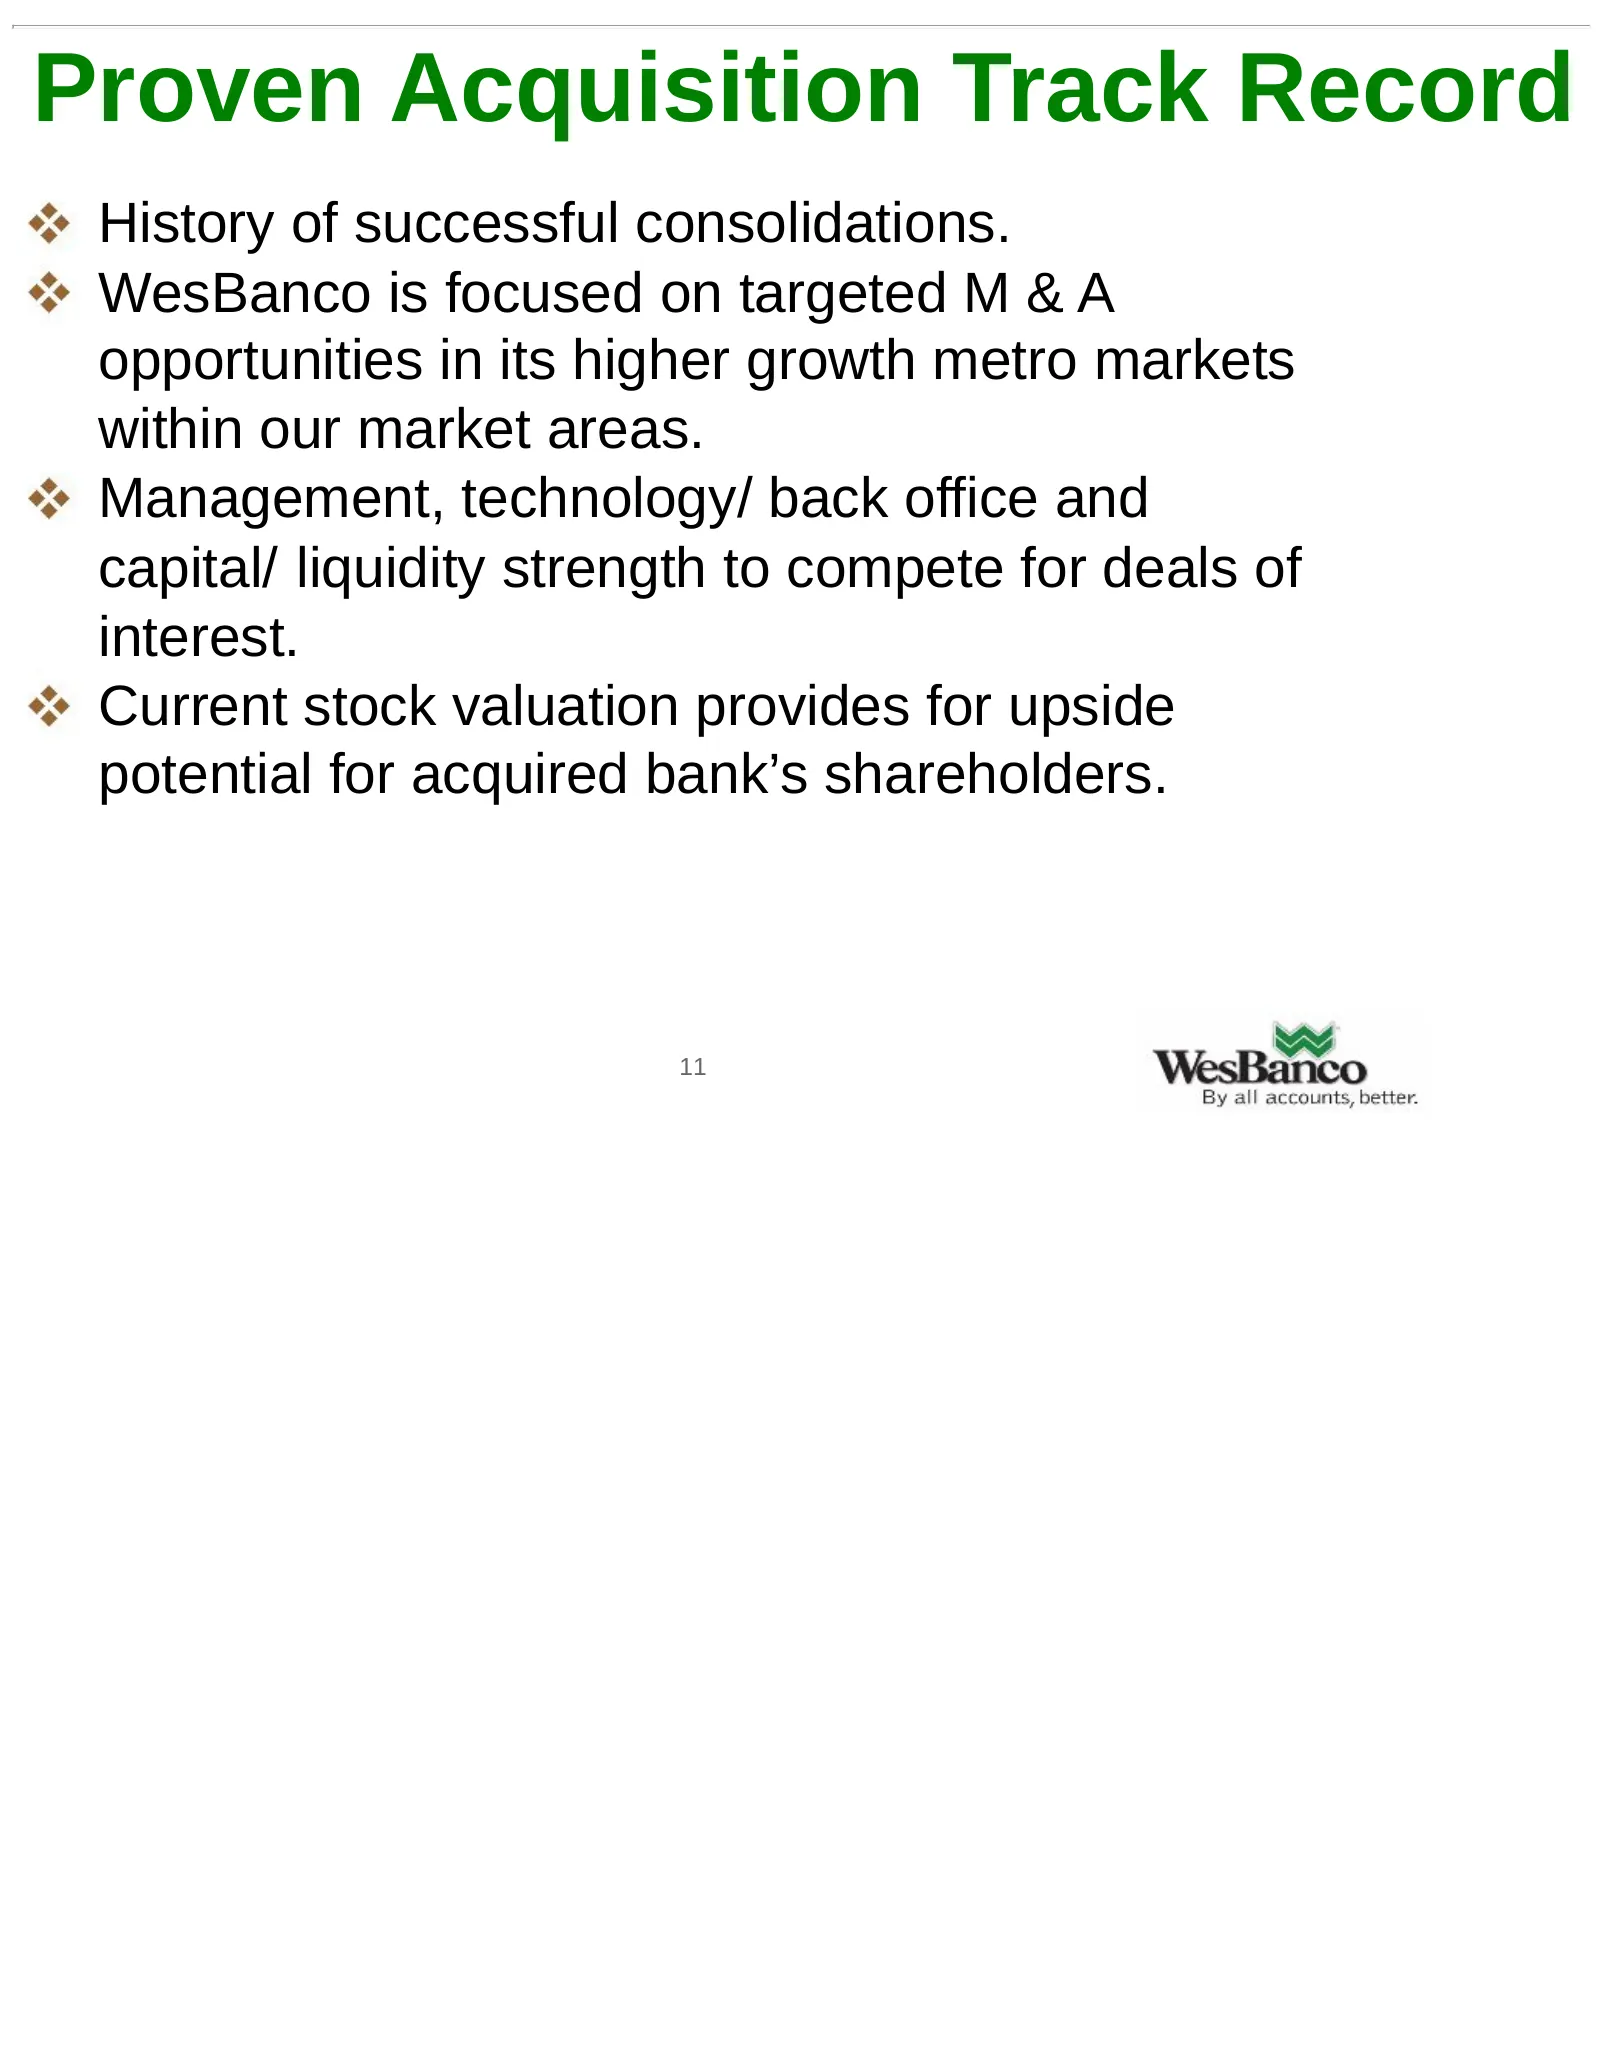
Proven Acquisition Track Record History of successful consolidations. WesBanco is focused on targeted M & A opportunities in its higher growth metro markets within our market areas. Management, technology/ back office and capital/ liquidity strength to compete for deals of interest. Current stock va
Slide 12: Summary
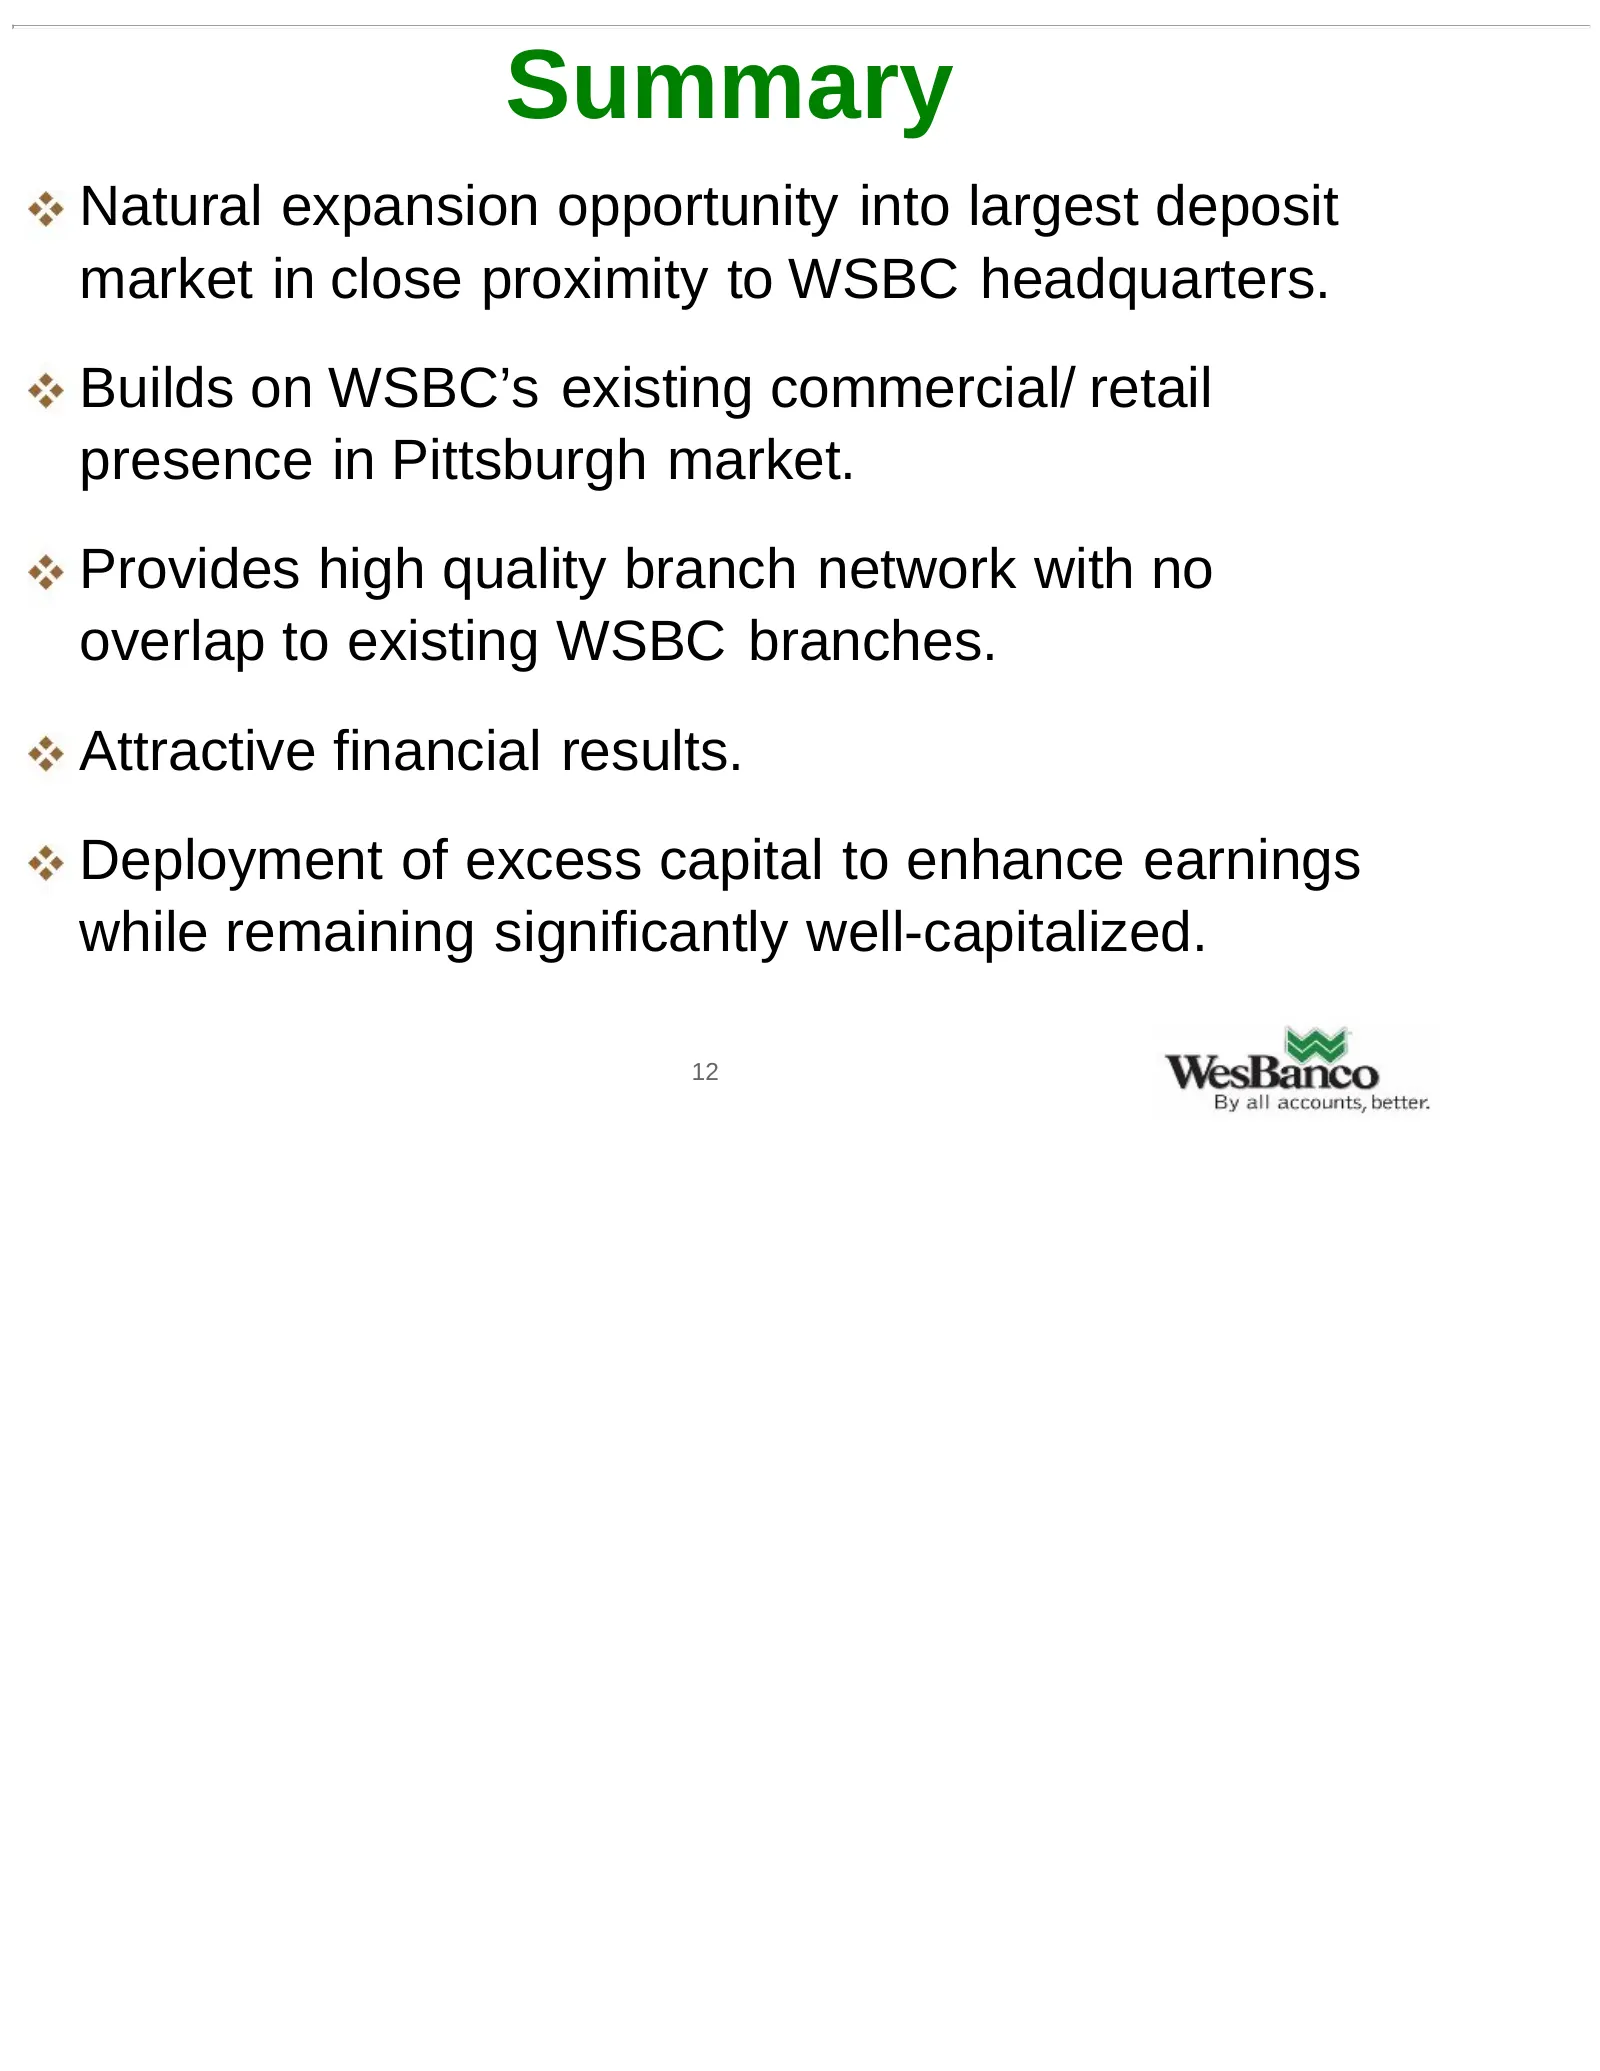
Summary Natural expansion opportunity into largest deposit market in close proximity to WSBC headquarters. Builds on WSBC’s existing commercial/ retail presence in Pittsburgh market. Provides high quality branch network with no overlap to existing WSBC branches. Attractive financial results. Deploym
Slide 13: Non-GAAP Financial Measures
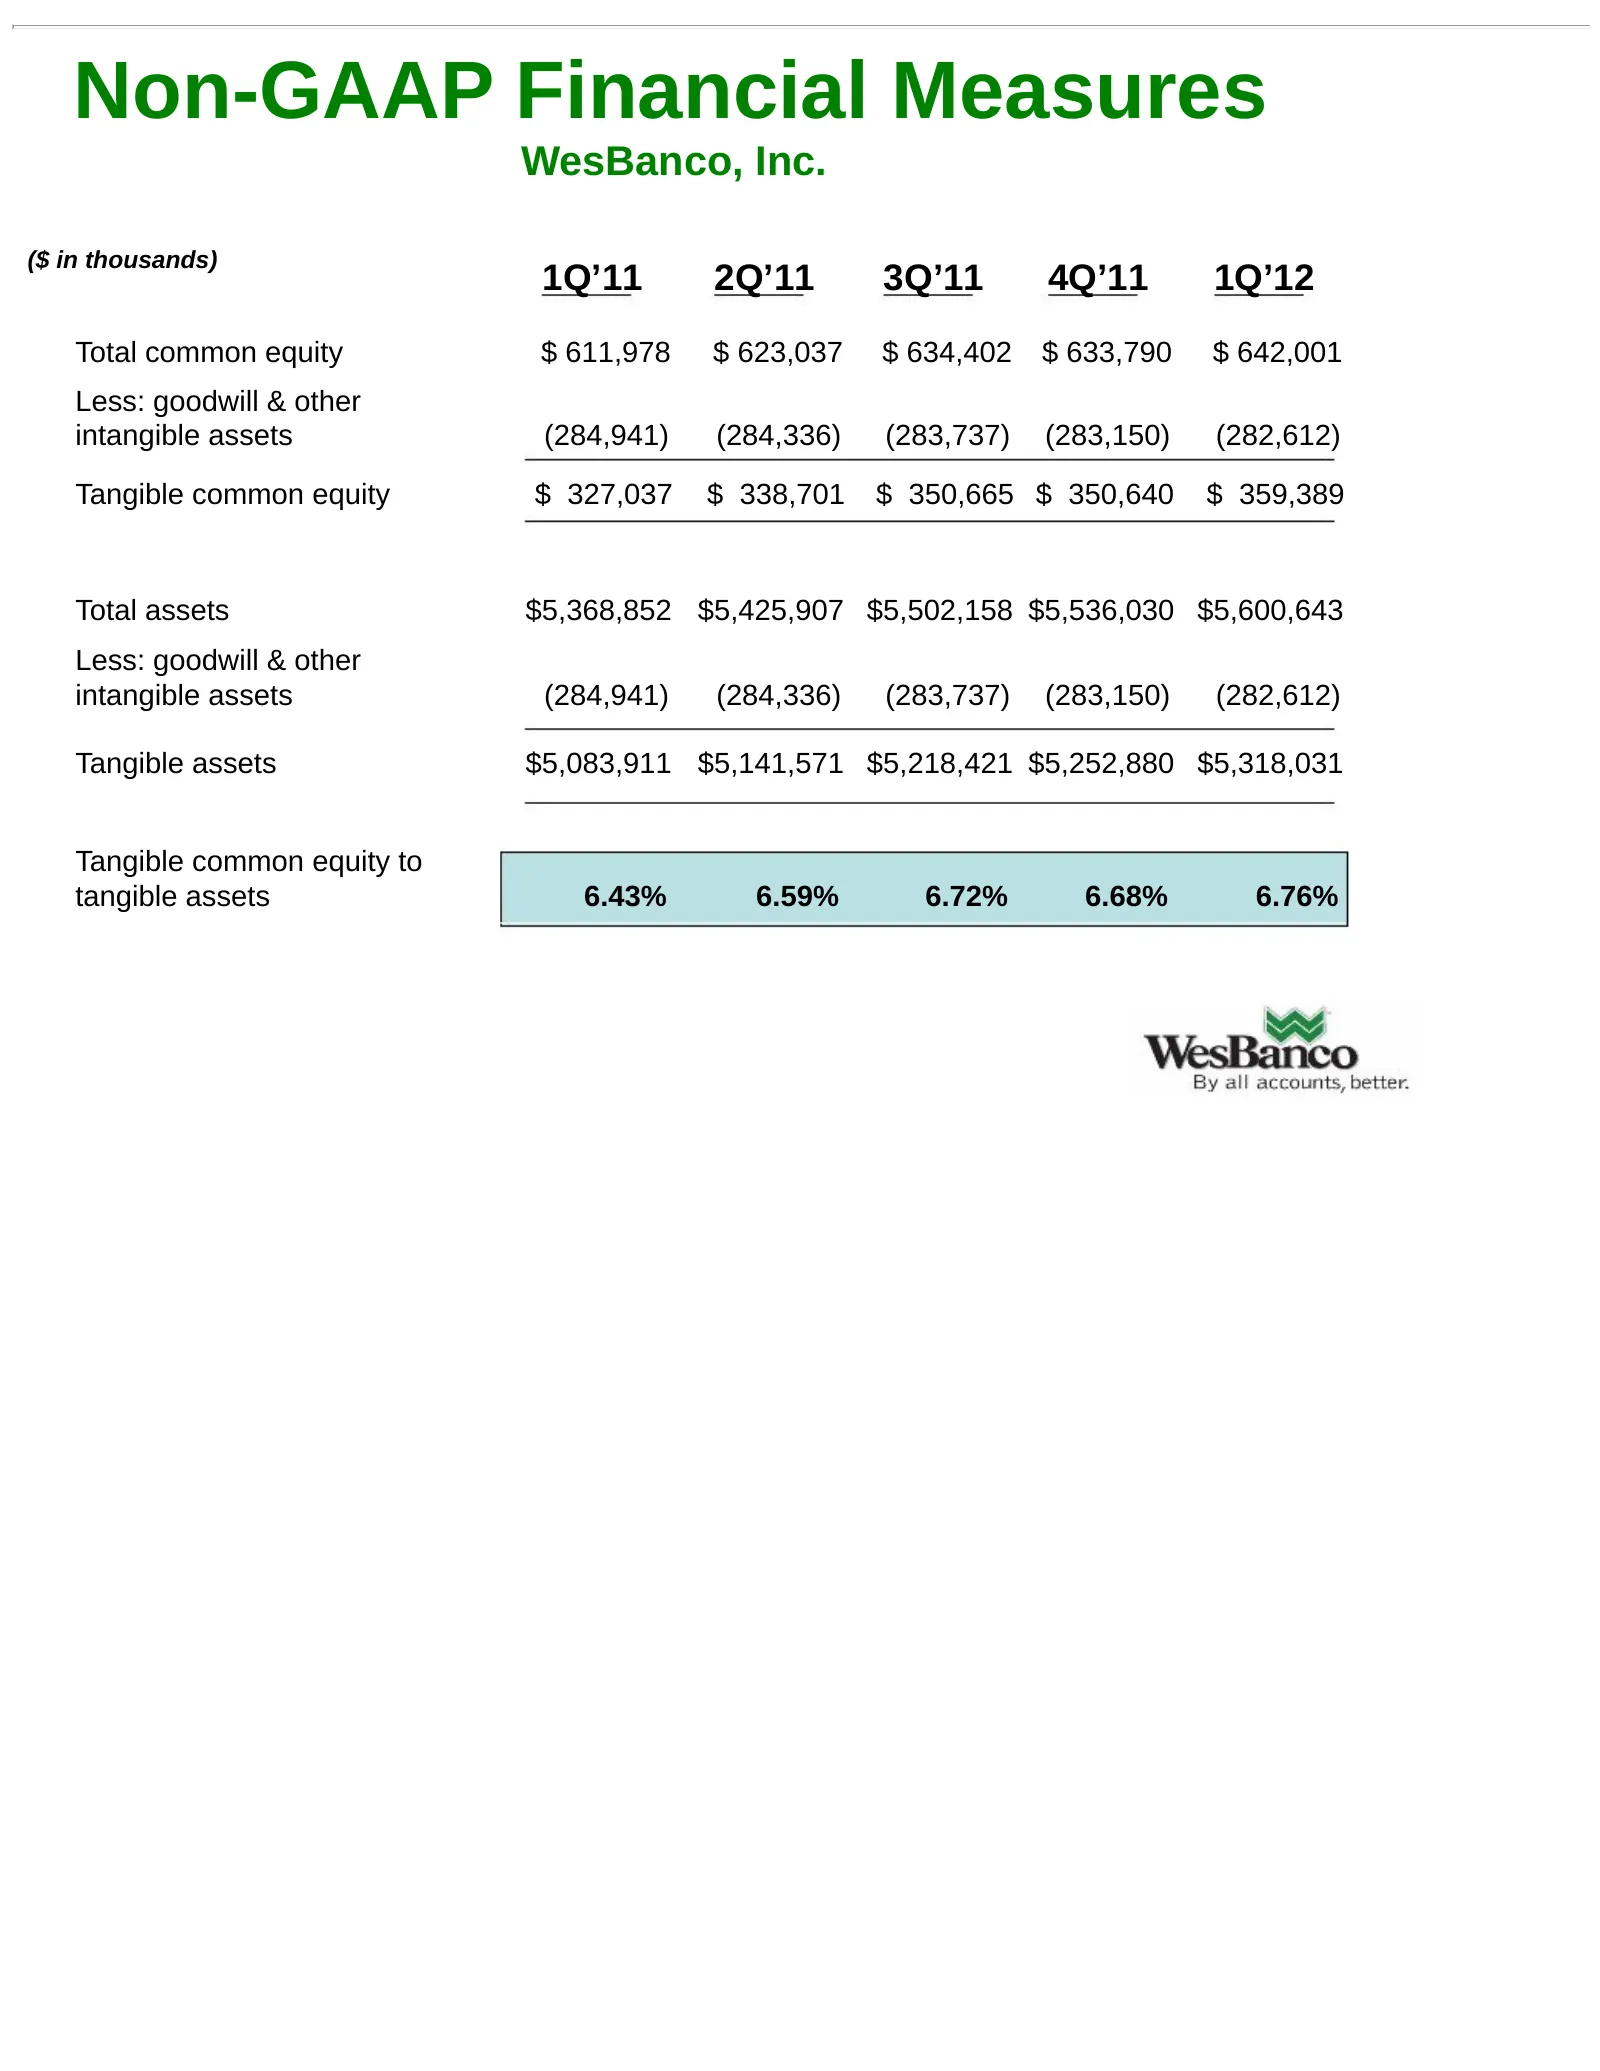
Non-GAAP Financial Measures WesBanco, Inc. ($ in thousands) 1Q’11 2Q’11 3Q’11 4Q’11 1Q’12 Total common equity $ 611,978 $ 623,037 $ 634,402 $ 633,790 $ 642,001 Less: goodwill & other intangible assets (284,941) (284,336) (283,737) (283,150) (282,612) Tangible common equity $ 327,037 $ 338,701 $ 350,
Slide 14: Non-GAAP Financial Measures
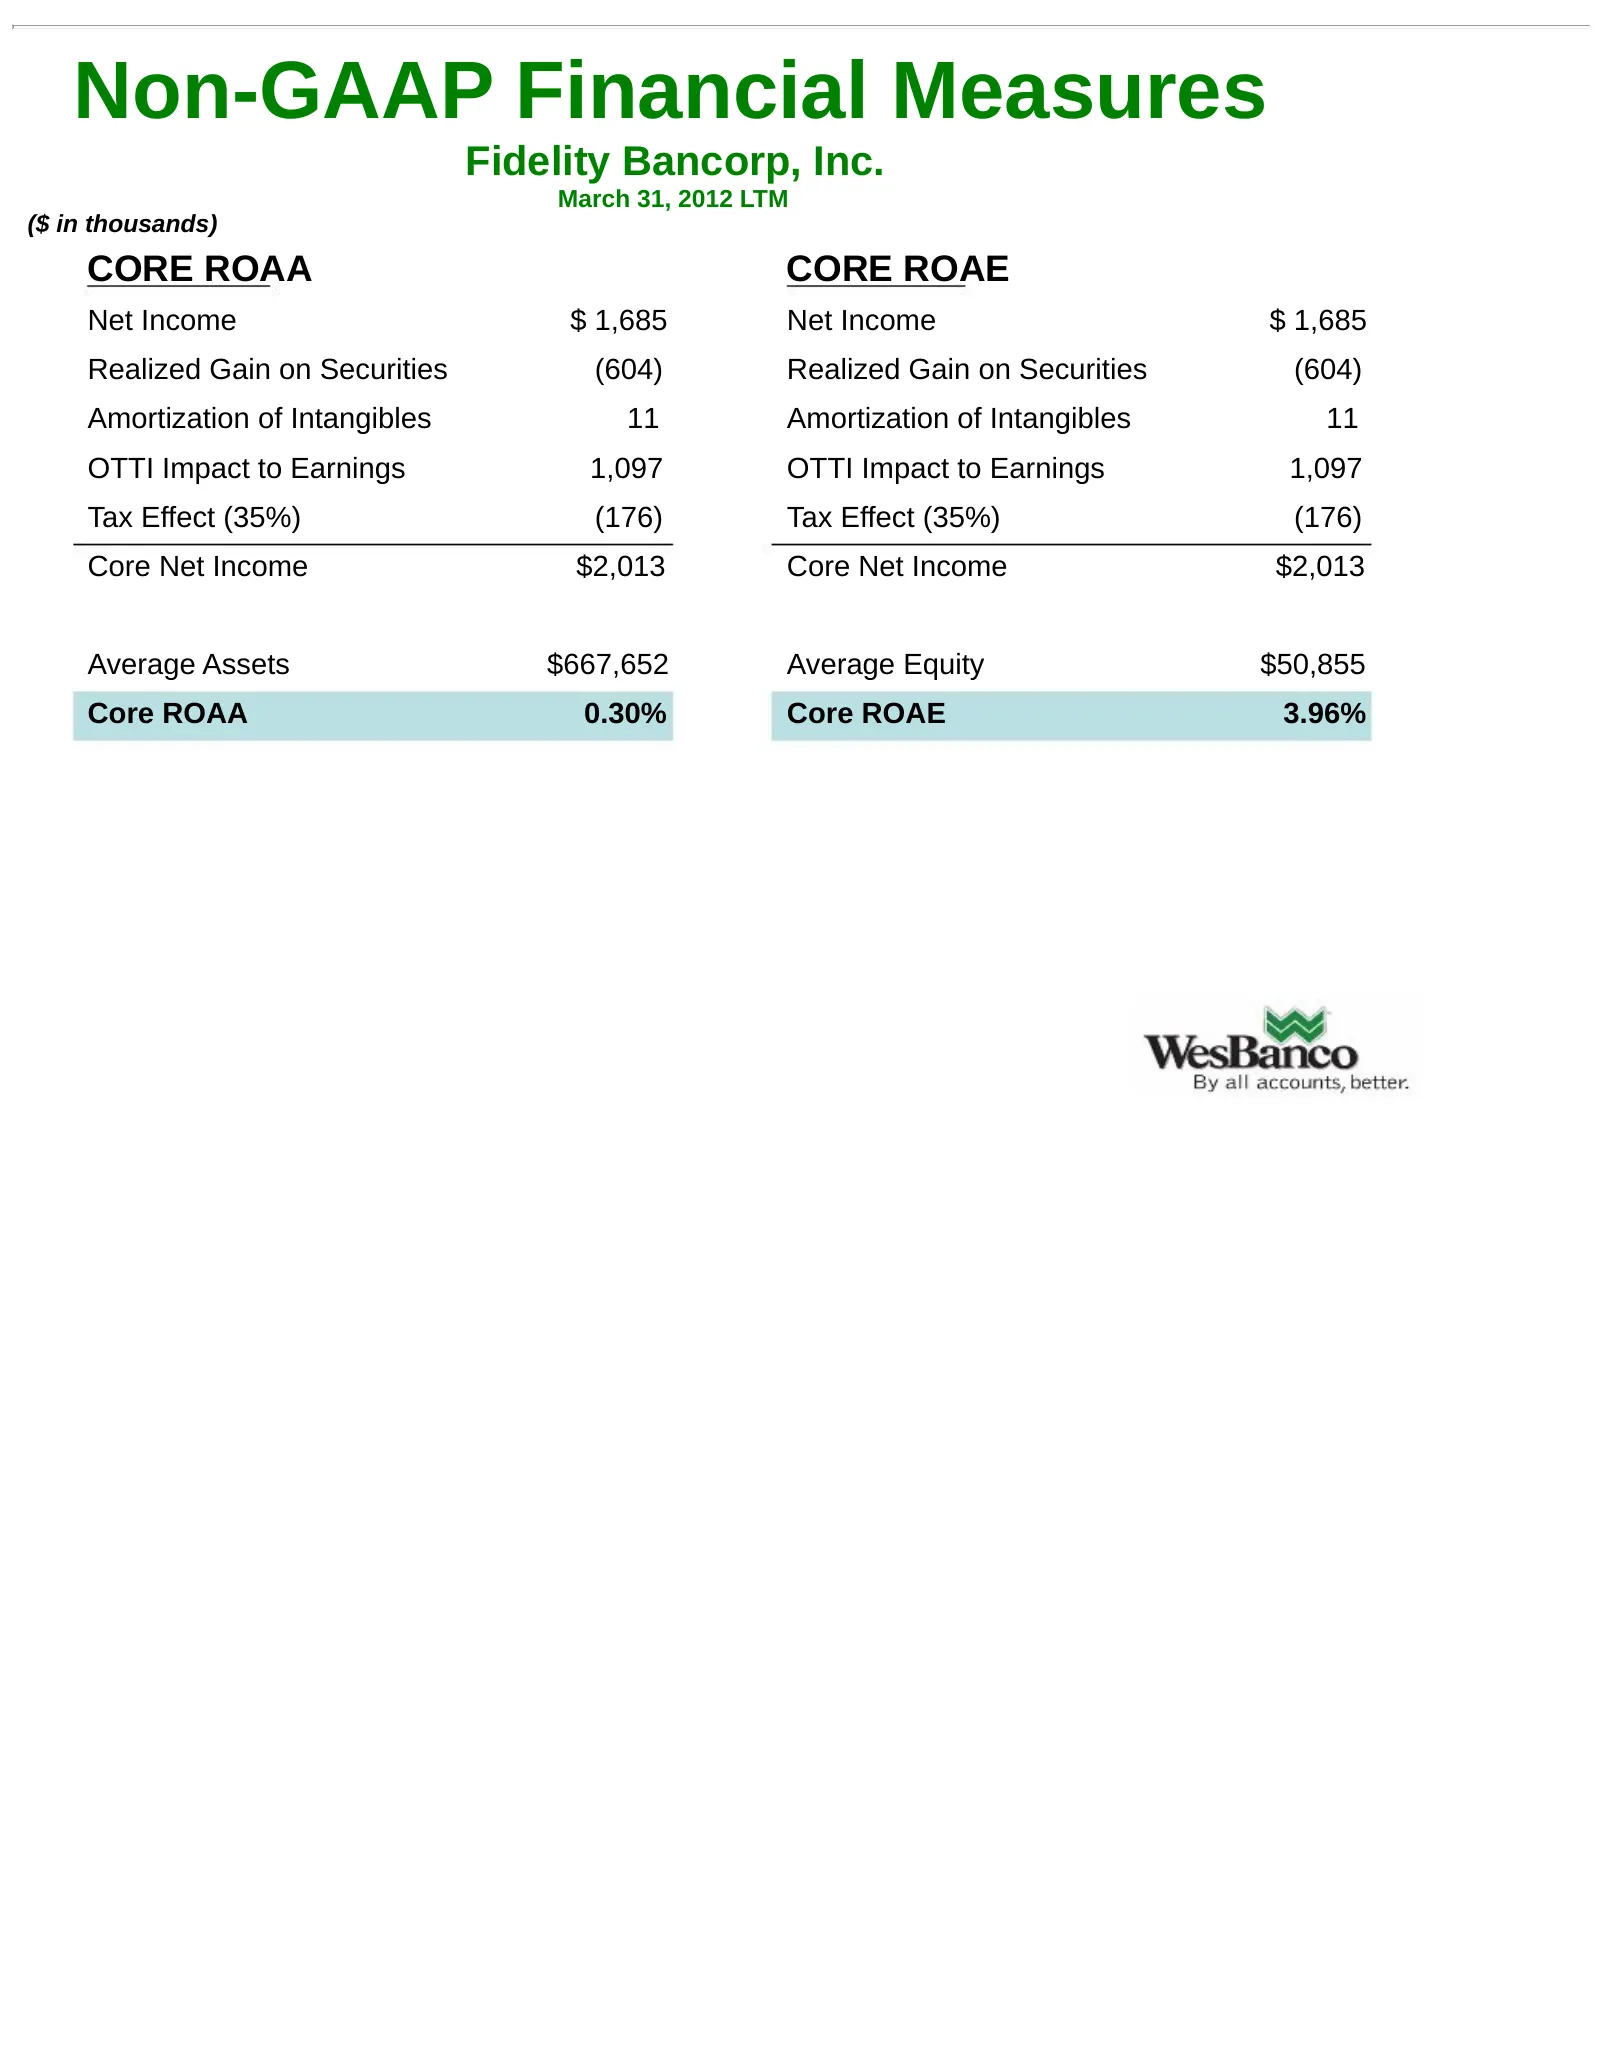
Non-GAAP Financial Measures Fidelity Bancorp, Inc. March 31, 2012 LTM ($ in thousands) CORE ROAA CORE ROAE Net Income $ 1,685 Net Income $ 1,685 Realized Gain on Securities (604) Realized Gain on Securities (604) Amortization of Intangibles 11 Amortization of Intangibles 11 OTTI Impact to Earnings 1
Slide 15: Non-GAAP Financial Measures
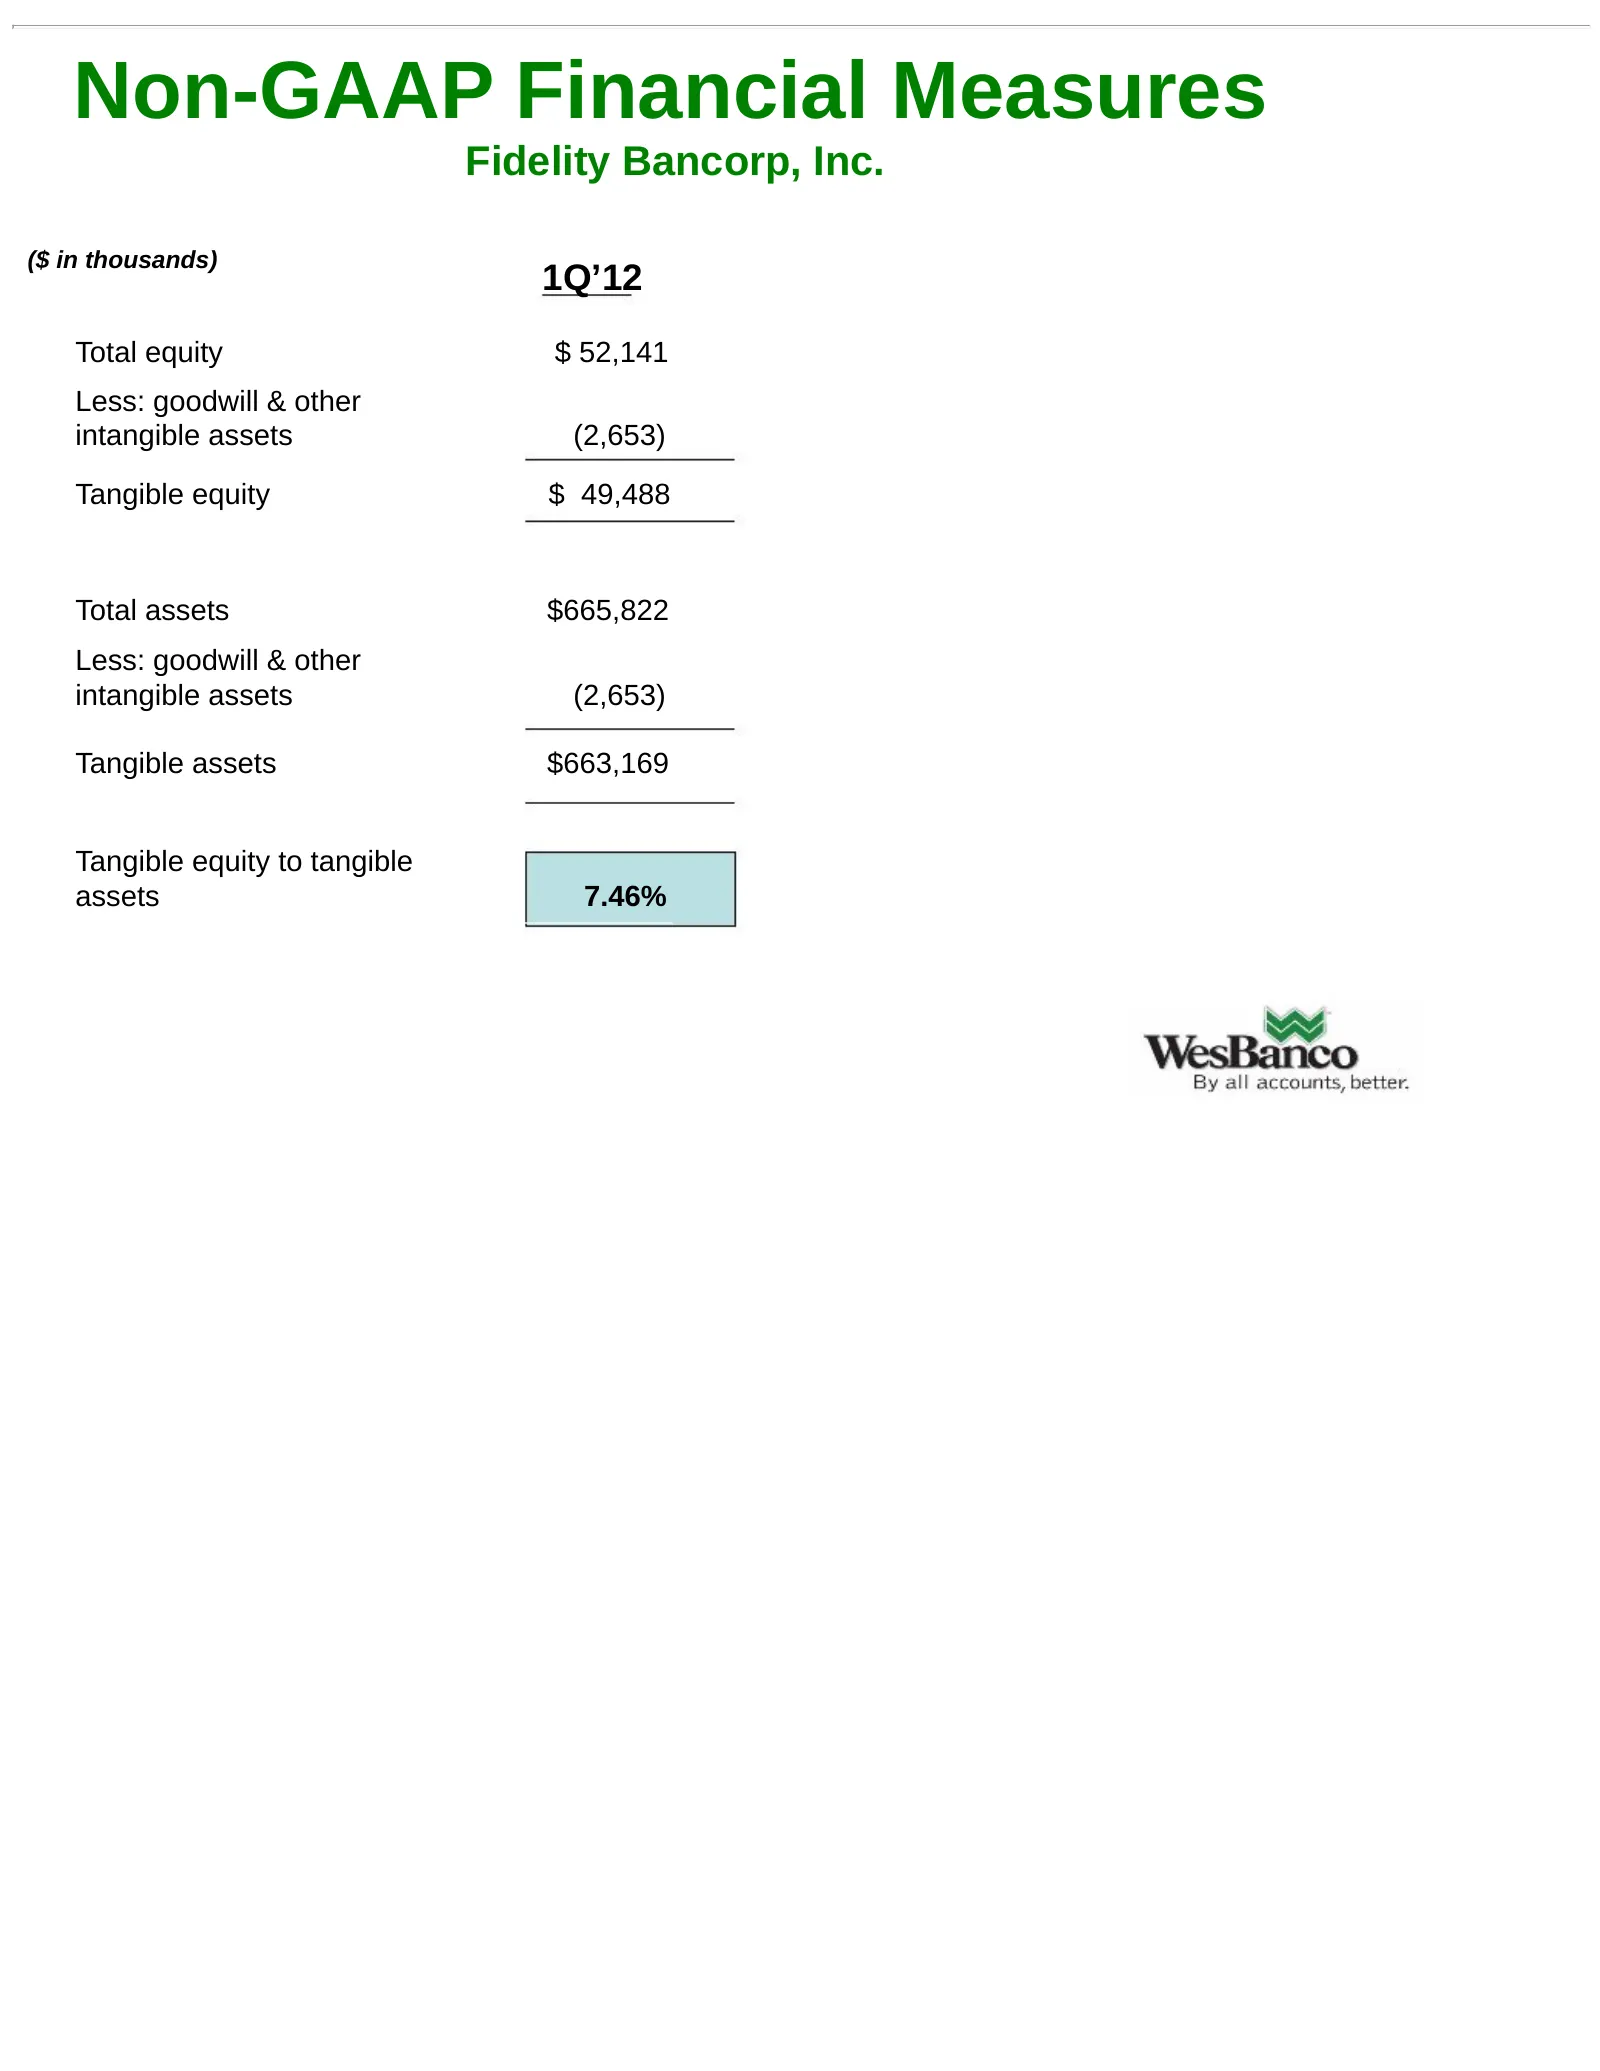
Non-GAAP Financial Measures Fidelity Bancorp, Inc. ($ in thousands) 1Q’12 Total equity $ 52,141 Less: goodwill & other intangible assets (2,653) Tangible equity $ 49,488 Total assets $665,822 Less: goodwill & other intangible assets (2,653) Tangible assets $663,169 Tangible equity to tangible assets

Slide 16: By all accounts, better.
By all accounts, better.
Source: SEC EDGAR · 425 filed Jul 20, 2012