Fidelity Bancorp — FBR Fall Investor Conference 2012
28 slides from Fidelity Bancorp's conference presentation, Nov 26, 2012
Slide 1: FBR Fall Investor Conference
FBR Fall Investor Conference November 27, 2012
Slide 2: Forward-looking statements
Forward-looking statements in this report relating to WesBanco’s plans, strategies, objectives, expectations, intentions and adequacy of resources, are made pursuant to the safe harbor provisions of the Private Securities Litigation Reform Act of 1995. The information contained in this report should
Slide 3: Proposed merger of WesBanco and Fidelity Bancorp legend
In connection with the proposed merger of WesBanco, Inc. and Fidelity Bancorp, Inc., WesBanco filed a registration statement on Form S-4 with the SEC on September 14, 2012. The registration statement included a proxy statement/prospectus and other relevant documents filed with the SEC in connection
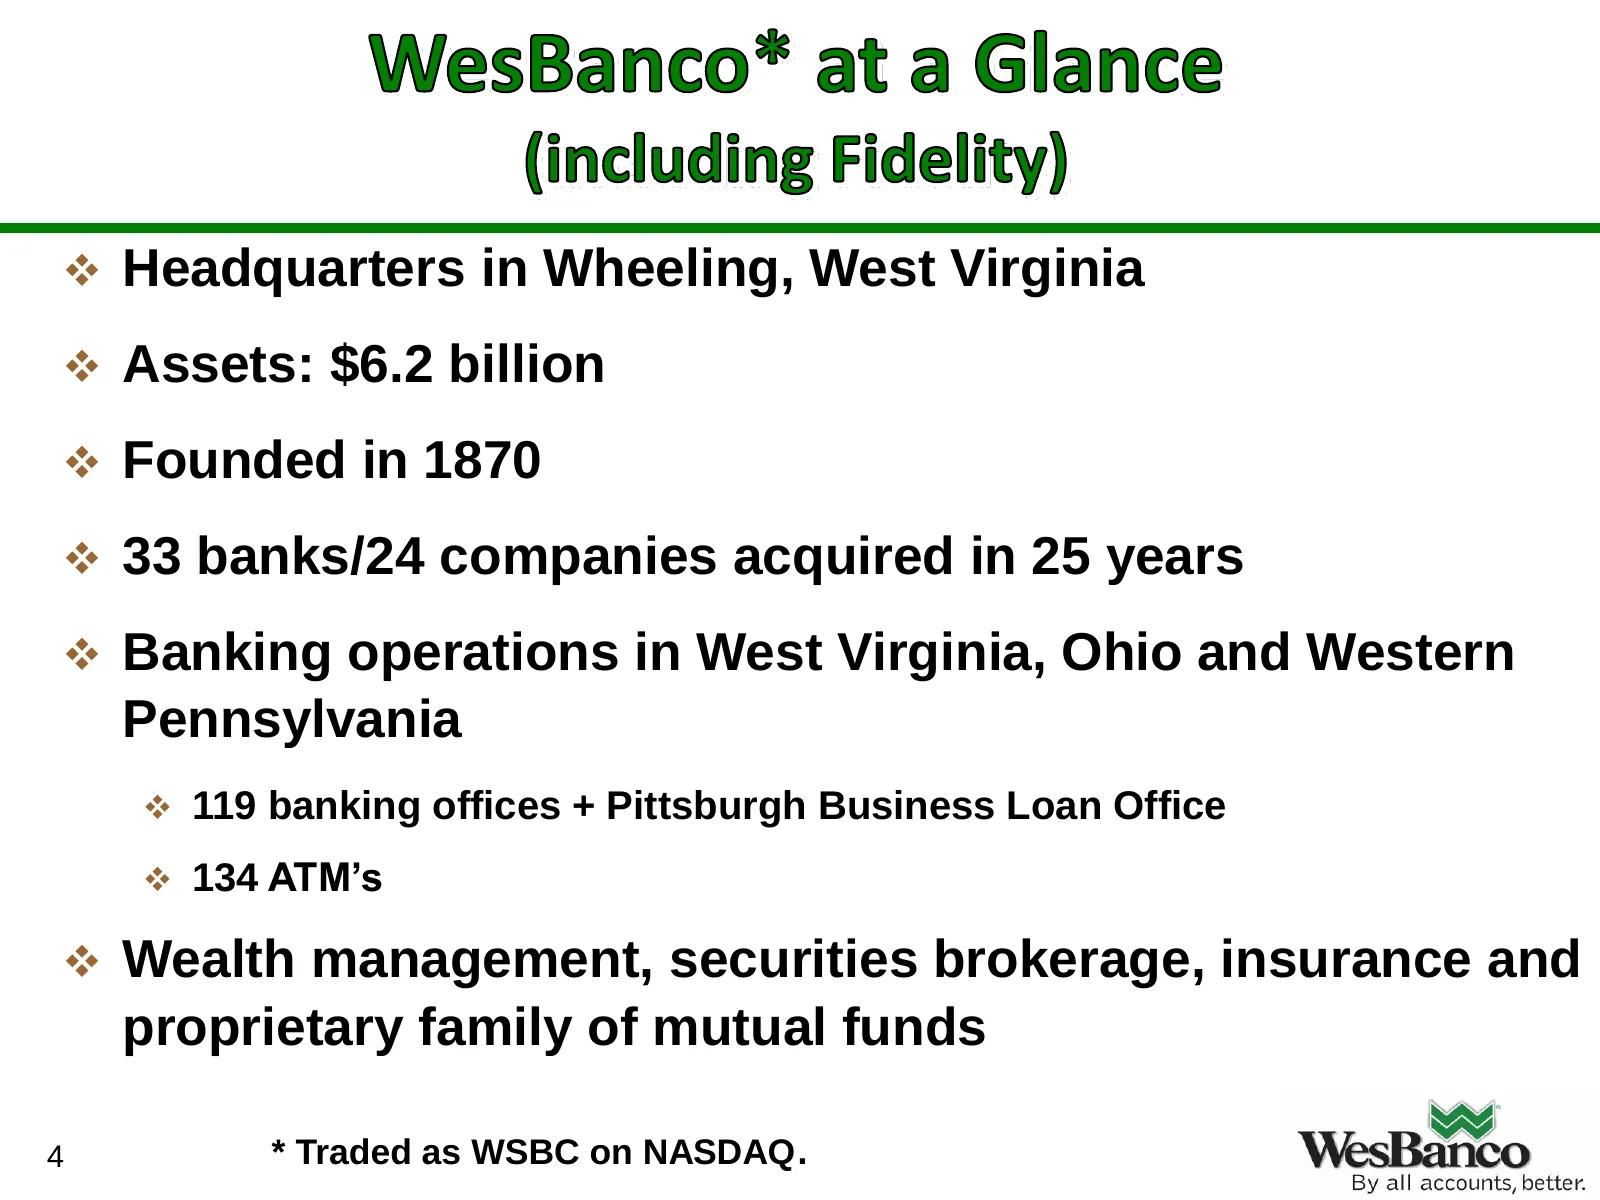
Slide 4: WesBanco at a glance
Headquarters in Wheeling, West Virginia Assets: $6.2 billion Founded in 1870 33 banks/24 companies acquired in 25 years Banking operations in West Virginia, Ohio and Western Pennsylvania 119 banking offices + Pittsburgh Business Loan Office 134 ATM’s Wealth management, securities bro
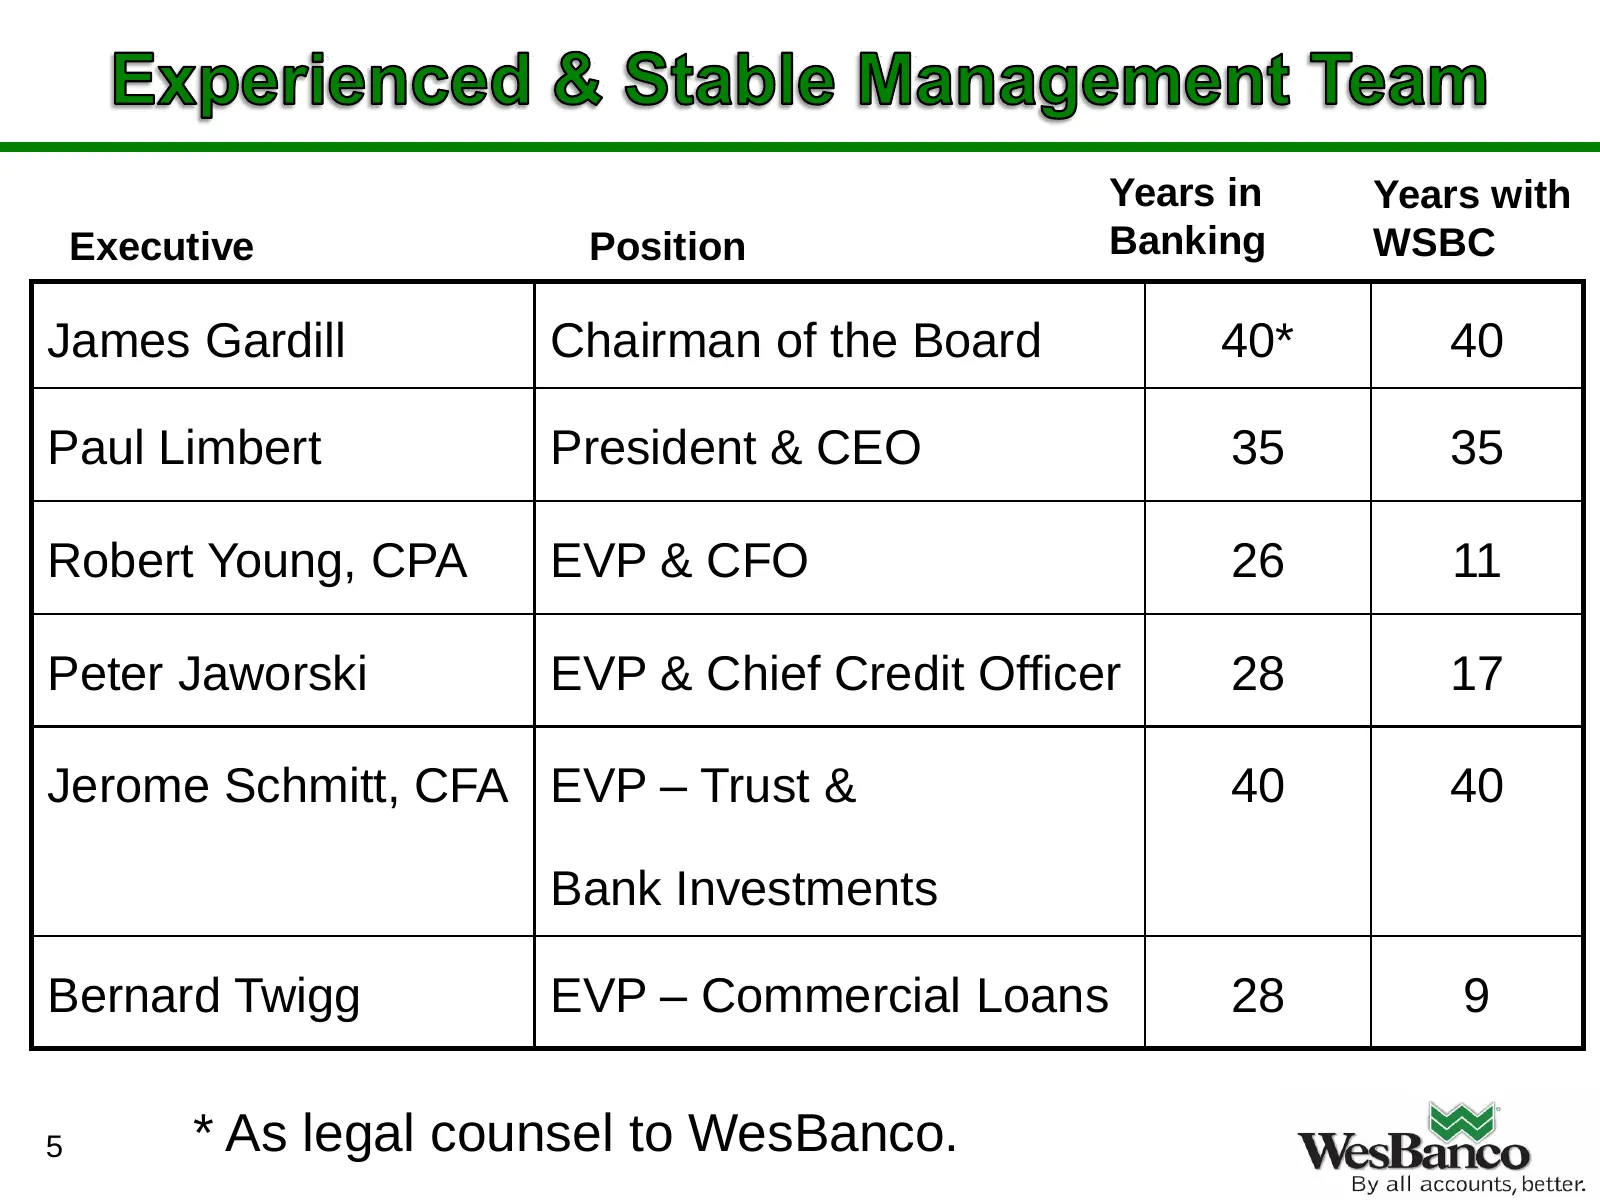
Slide 5: Executive management
Years in Years with Executive Position Banking WSBC James Gardill Chairman of the Board 40* 40 Paul Limbert President & CEO 35 35 Robert Young, CPA EVP & CFO 26 11 Peter Jaworski EVP & Chief Credit Officer 28 17 Jerome Schmitt, CFA EVP – Trust & 40 40 Bank Investments Bernard Twigg EVP – Commercial
Slide 6: Recent highlights
Increased dividends to shareholders 4 times in last 8 quarters totaling 28.6%. Continued growth in earnings and improved credit quality. Continued control of expenses. Continued growth in deposits and strong loan origination focus. Formed a private banking team to coordinate delivery of sp
Slide 7: Fidelity Bancorp acquisition rationale
Natural expansion opportunity into largest deposit market in close proximity to WSBC headquarters. Builds on WSBC’s existing commercial/retail presence in Pittsburgh market. Provides high quality branch network with no overlap to existing WSBC branches. Attractive financial results. Deploy
Slide 8: An Expanding Franchise in Contiguous Markets
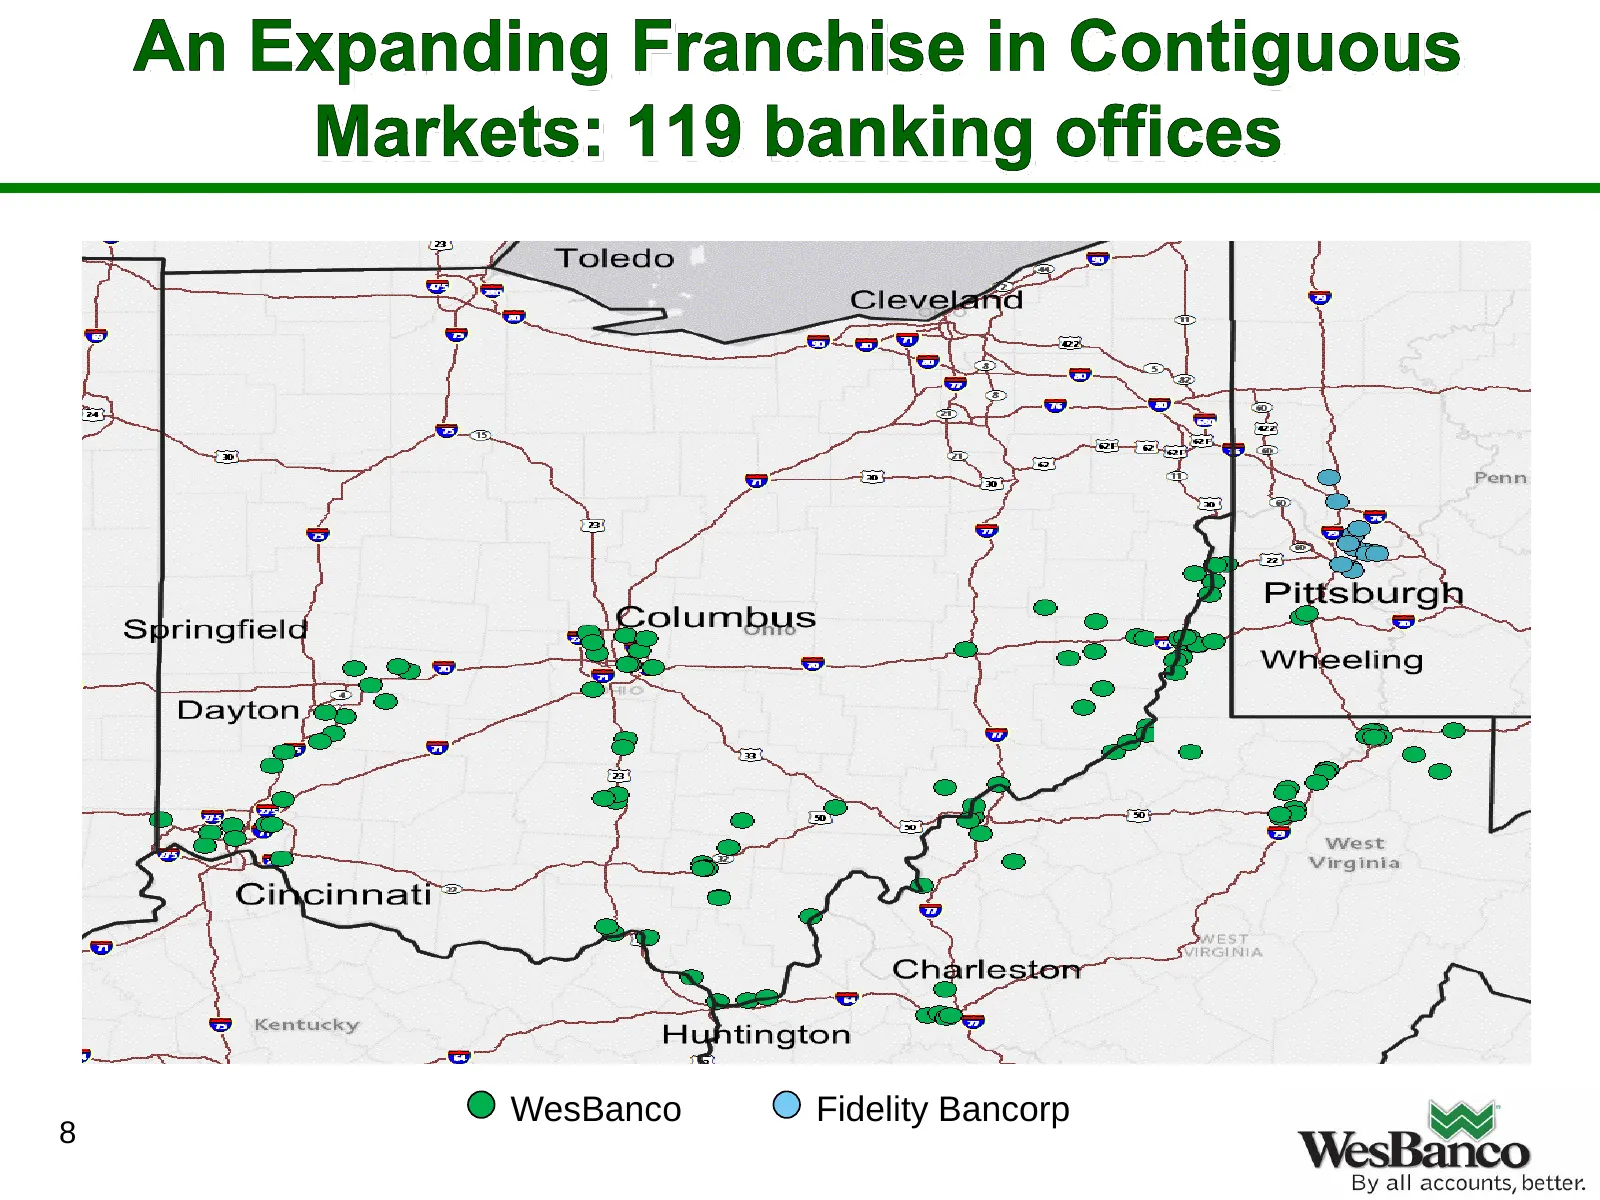
An Expanding Franchise in Contiguous Markets: 119 banking offices OFS eS e Y Toledo Zs ae Cleve ater fo i 2 ee eB O_o o. => Ape Set : Lg hg en elsh fst a SS ey = ; : tJ gv Pittsburgh Columbus of oe 3 oe ‘g Wheeling @ @ o = 4 *e @ i % a - a va We ars x 2 @ Virgi o -f e Charle. Ss - o a © Kentuck y A
Slide 9: Pittsburgh market expansion plan
With Fidelity we will have 15 offices and a loan production office in Western PA. Build upon community bank reputation of Fidelity. Separate market with a market president. Expect to grow to $1 billion in loans in next few years. Need to hire additional staffing Loan officers Treasury
Slide 10: Targeted M&A strategy
History of successful consolidations. WesBanco is focused on targeted M & A opportunities in its higher growth metro markets within our market areas. Management, technology/ back office and capital/ liquidity strength to compete for deals of interest. Current stock valuation provides for ups
Slide 11: Marcellus/Utica Shale Opportunity
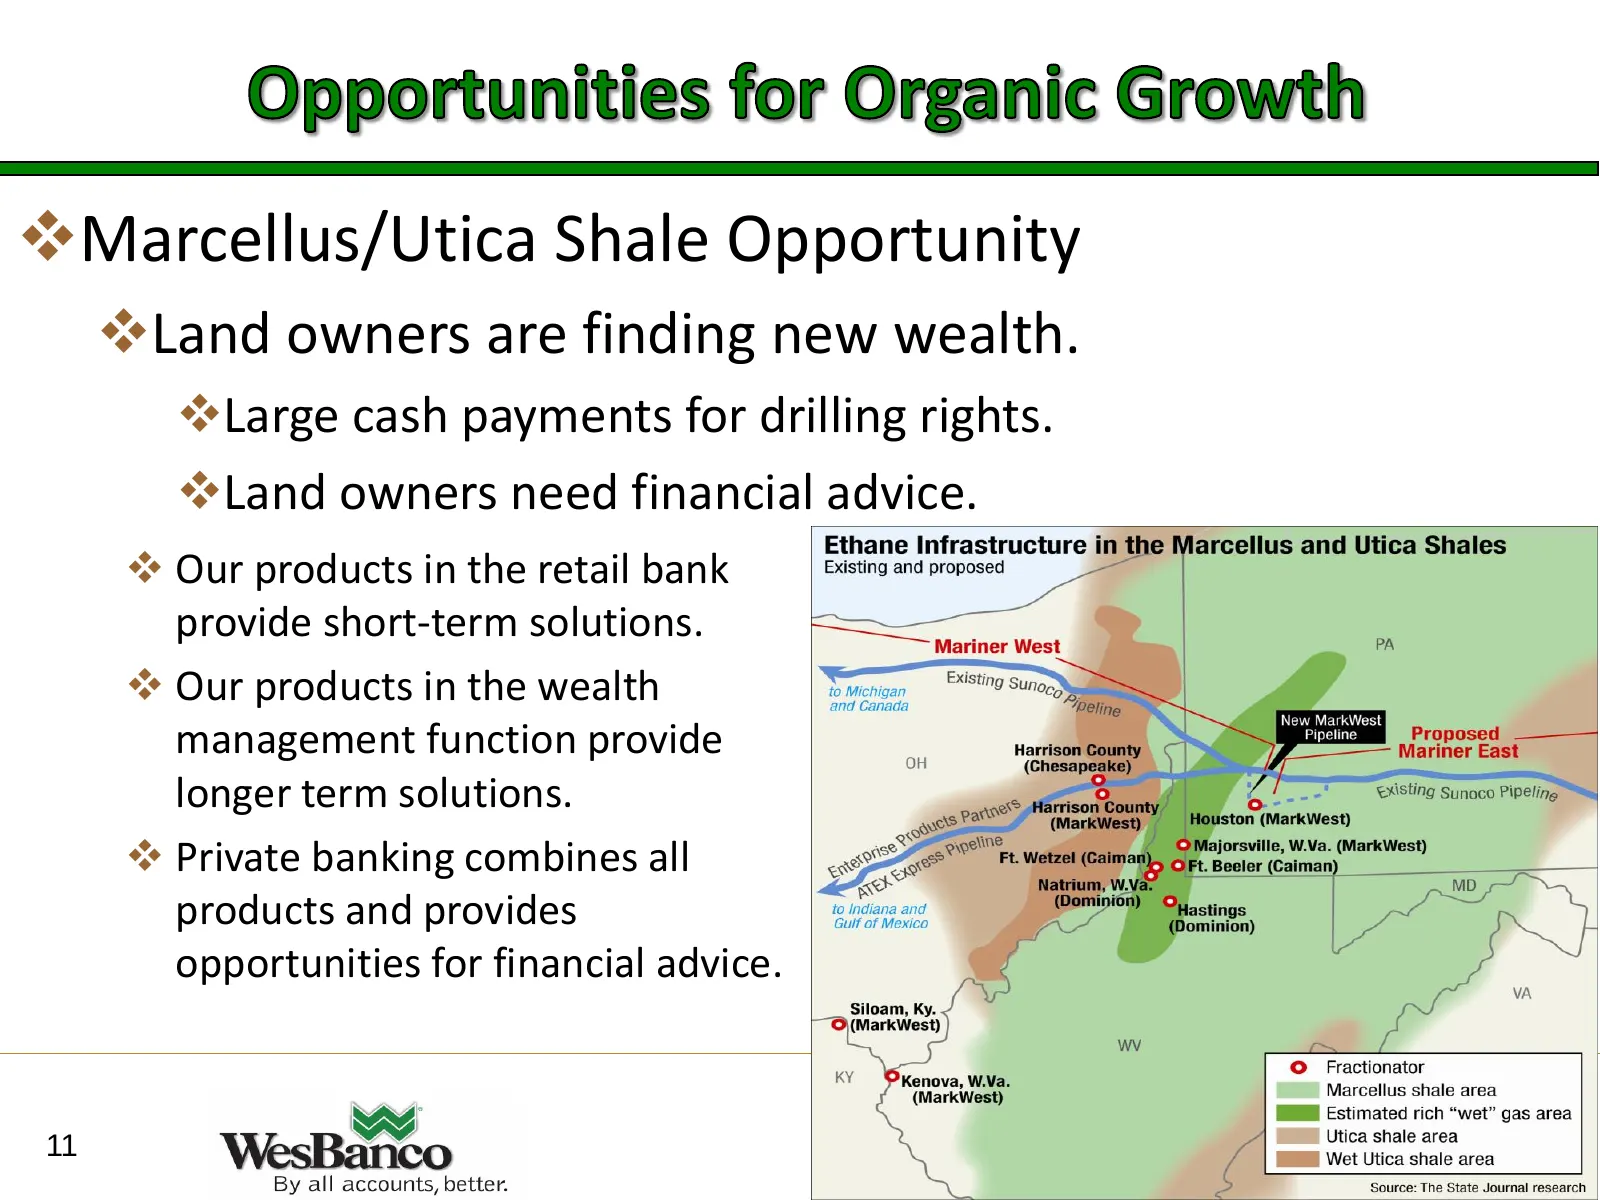
Marcellus/Utica Shale Opportunity Land owners are finding new wealth. Large cash payments for drilling rights. Land owners need financial advice. Our products in the retail bank provide short-term solutions. Our products in the wealth management function provide longer term solutions. Priv
Slide 12: Trust and wealth management
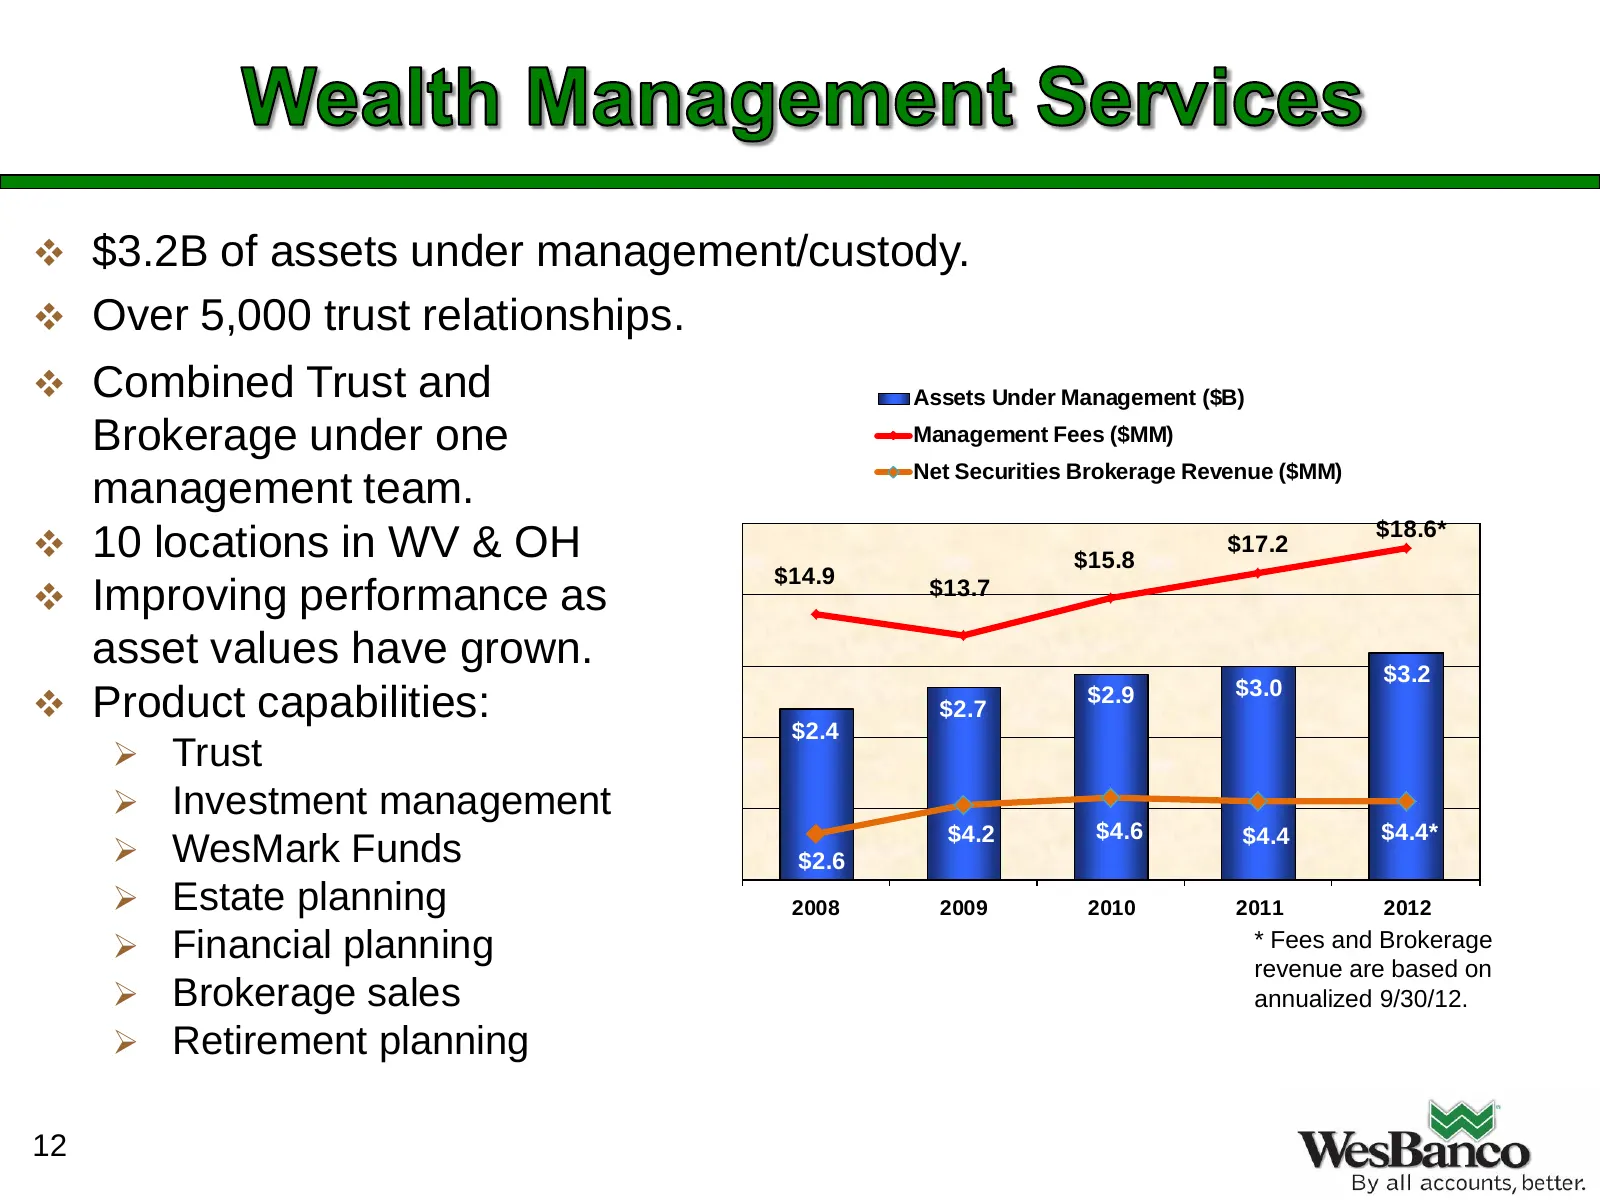
$3.2B of assets under management/custody. Over 5,000 trust relationships. Combined Trust and Assets Under Management ($B) Brokerage under one Management Fees ($MM) Net Securities Brokerage Revenue ($MM) management team. $18.6* 10 locations in WV & OH $15.8 $17.2 $14.9 Improving performance
Slide 13: Nine-month 2012 financial results
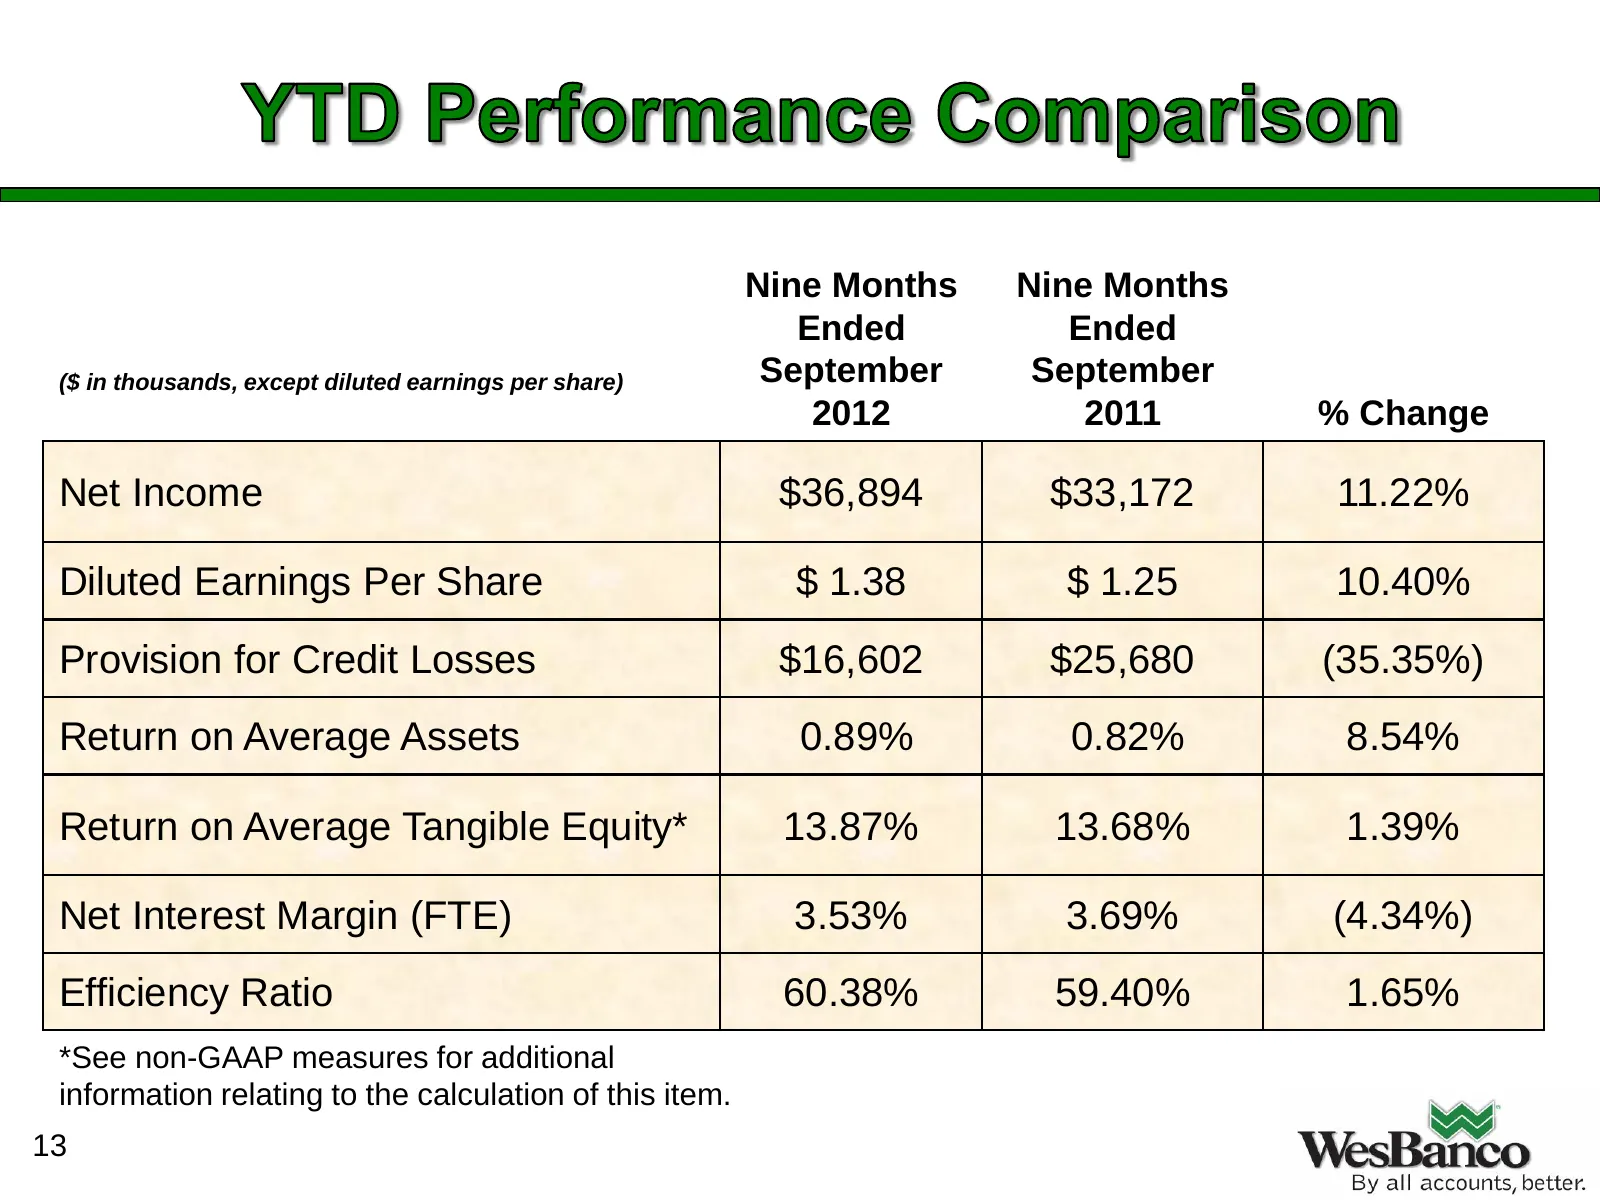
Nine Months Nine Months Ended Ended ($ in thousands, except diluted earnings per share)00’s September September except per share data) 2012 2011 % Change Net Income $36,894 $33,172 11.22% Diluted Earnings Per Share $ 1.38 $ 1.25 10.40% Provision for Credit Losses $16,602 $25,680 (35.35%) Return on A
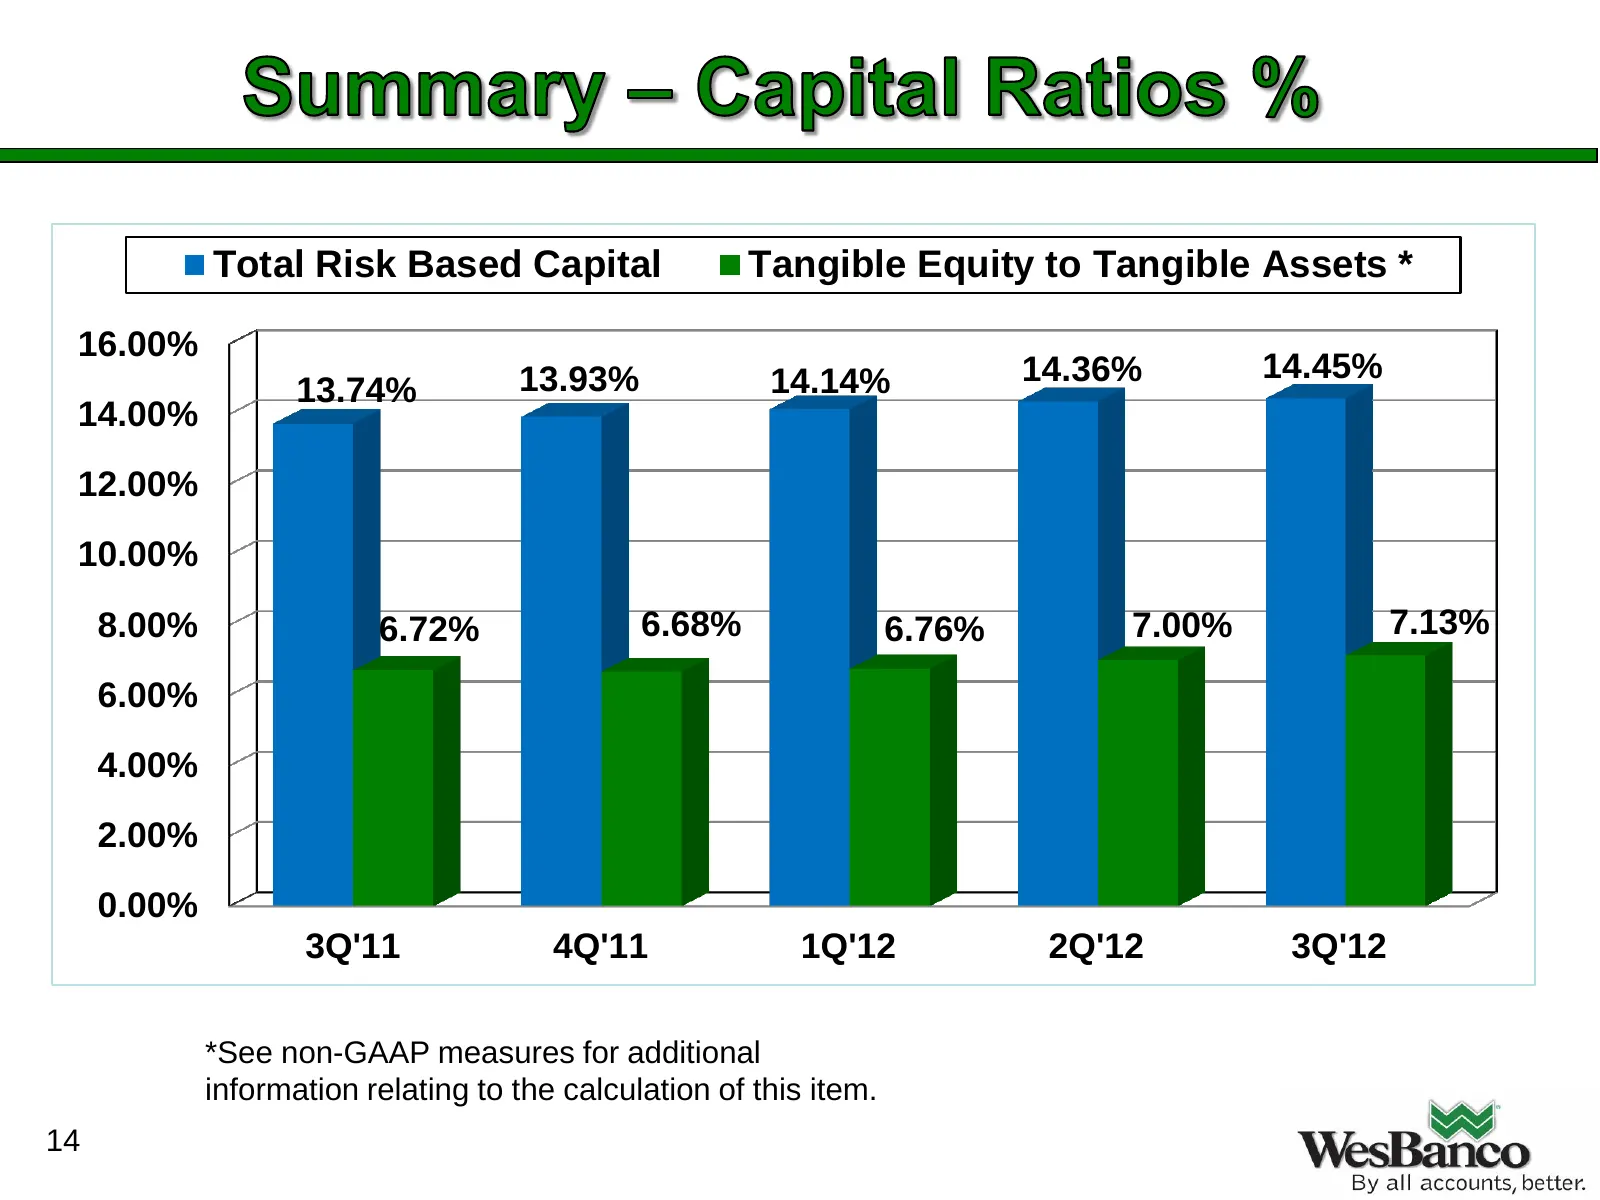
Slide 14: Total risk based capital and tangible equity
Total Risk Based Capital Tangible Equity to Tangible Assets * 16.00% 13.93% 14.14% 14.36% 14.45% 13.74% 14.00% 12.00% 10.00% 8.00% 6.72% 6.68% 6.76% 7.00% 7.13% 6.00% 4.00% 2.00% 0.00% 3Q'11 4Q'11 1Q'12 2Q'12 3Q'12 *See non-GAAP measures for additional information relating to the calculation of this
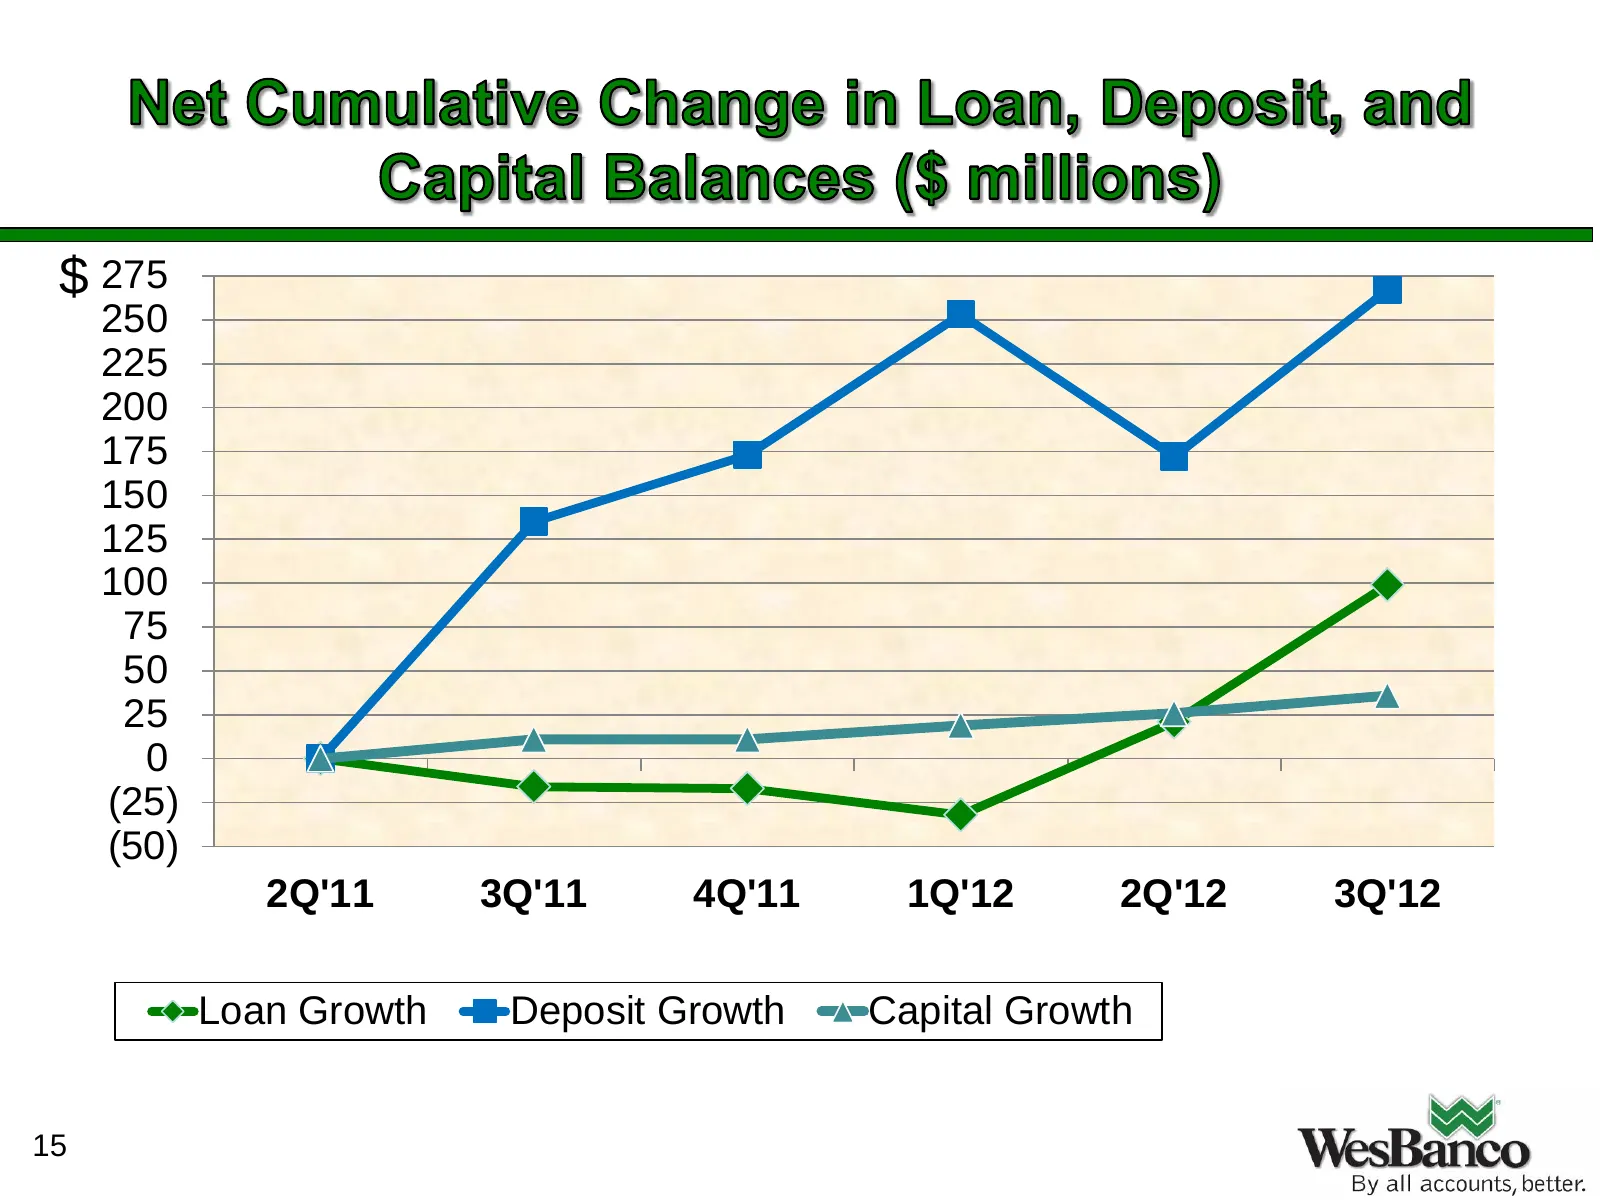
Slide 15: Loan, deposit and capital growth
$ 275 250 225 200 175 150 125 100 75 50 25 0 (25) (50) 2Q'11 3Q'11 4Q'11 1Q'12 2Q'12 3Q'12 Loan Growth Deposit Growth Capital Growth 15
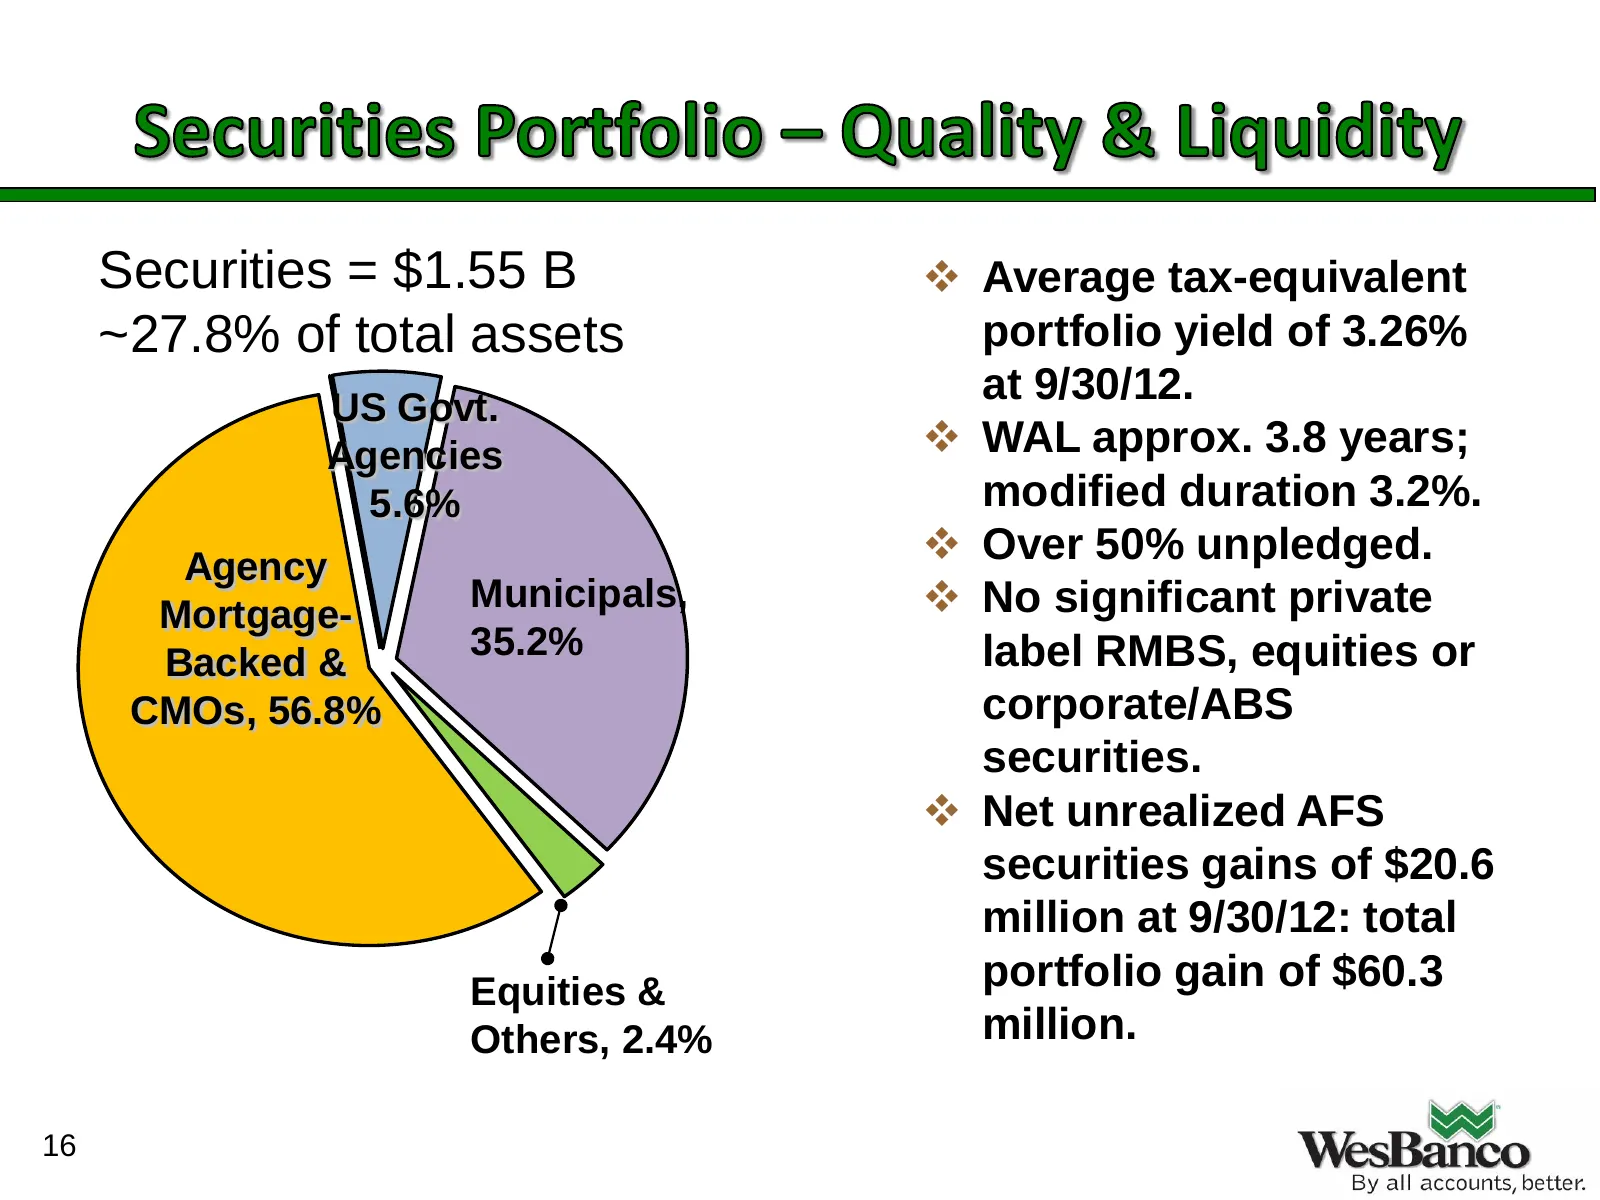
Slide 16: Securities portfolio
Securities = $1.55 B Average tax-equivalent ~27.8% of total assets portfolio yield of 3.26% US Govt. at 9/30/12. Agencies WAL approx. 3.8 years; 5.6% modified duration 3.2%. Agency Over 50% unpledged. Mortgage- Municipals, No significant private 35.2% label RMBS, equities or Backed & CMOs, 5
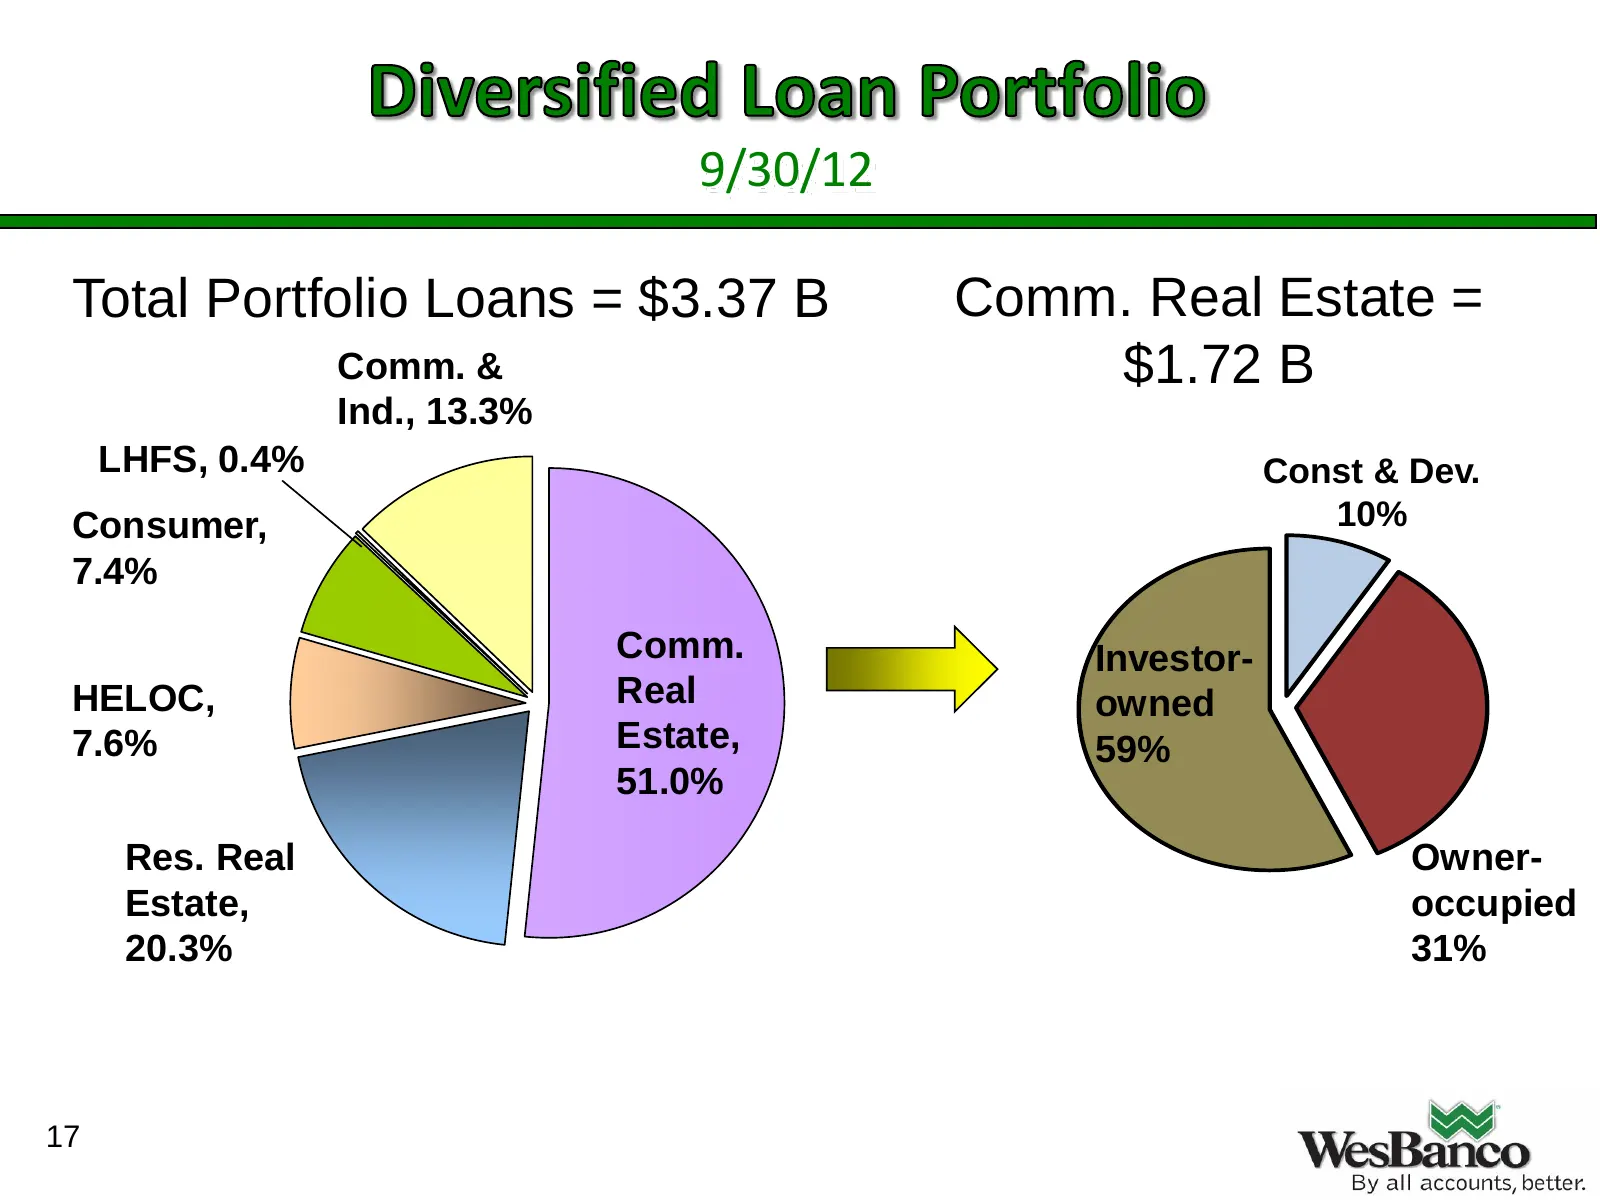
Slide 17: Total portfolio loans
9/30/12 Total Portfolio Loans = $3.37 B Comm. Real Estate = Comm. & $1.72 B Ind., 13.3% LHFS, 0.4% Const & Dev. Consumer, 10% 7.4% Comm. Investor- HELOC, Real owned 7.6% Estate, 59% 51.0% Res. Real Owner- Estate, occupied 20.3% 31% 17
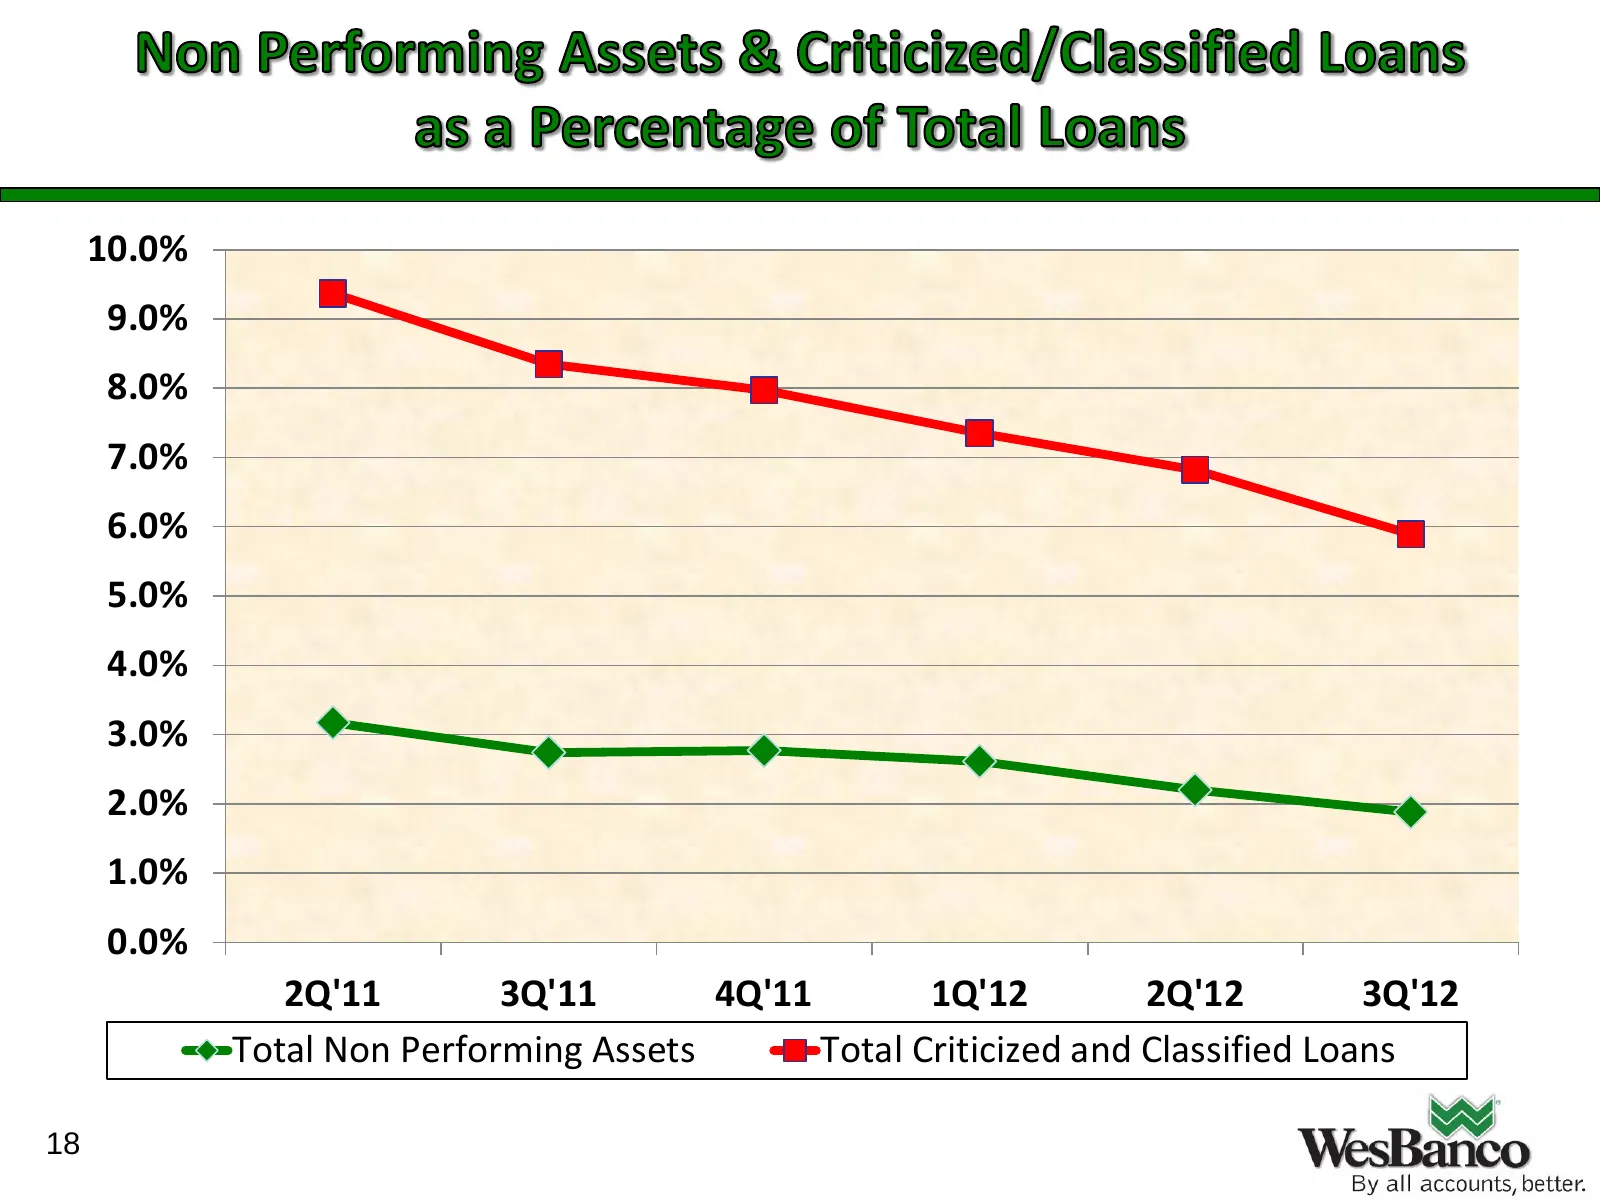
Slide 18: Non-performing assets and criticized loans
10.0% 9.0% 8.0% 7.0% 6.0% 5.0% 4.0% 3.0% 2.0% 1.0% 0.0% 2Q'11 3Q'11 4Q'11 1Q'12 2Q'12 3Q'12 Total Non Performing Assets Total Criticized and Classified Loans 18
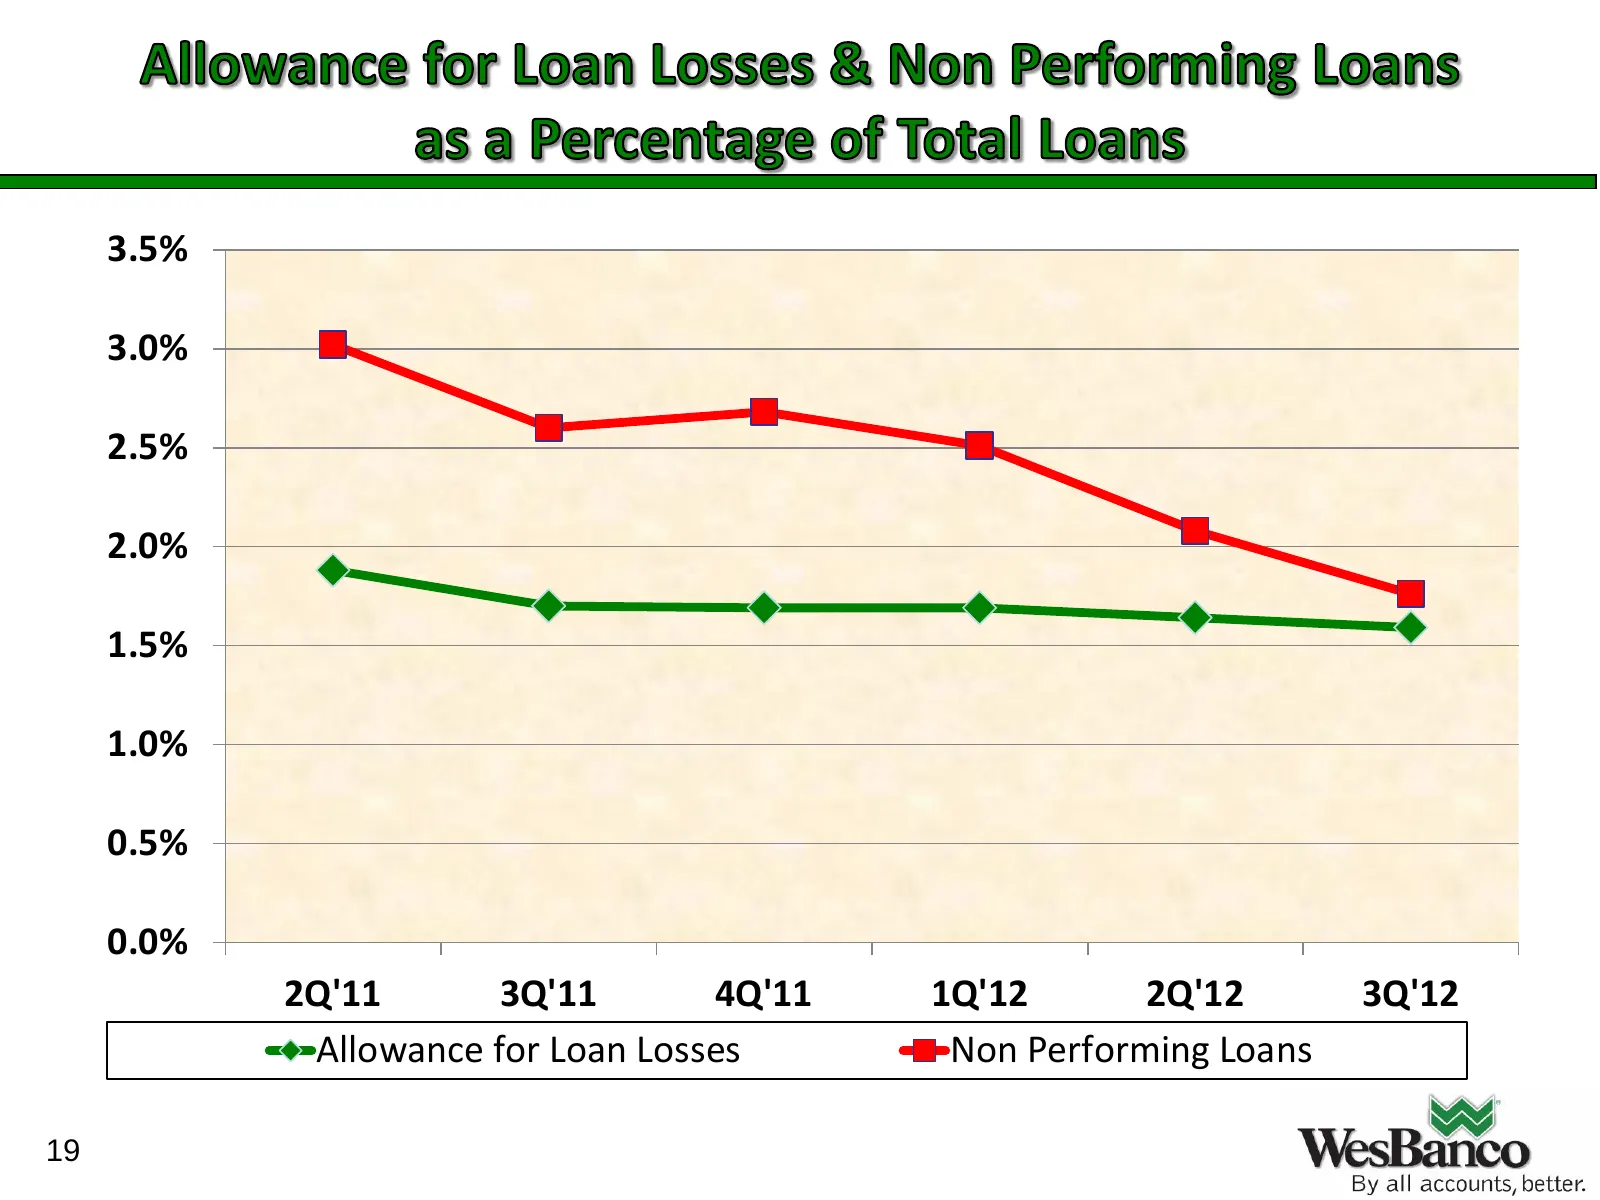
Slide 19: Allowance for loan losses and non-performing loans
3.5% 3.0% 2.5% 2.0% 1.5% 1.0% 0.5% 0.0% 2Q'11 3Q'11 4Q'11 1Q'12 2Q'12 3Q'12 Allowance for Loan Losses Non Performing Loans 19
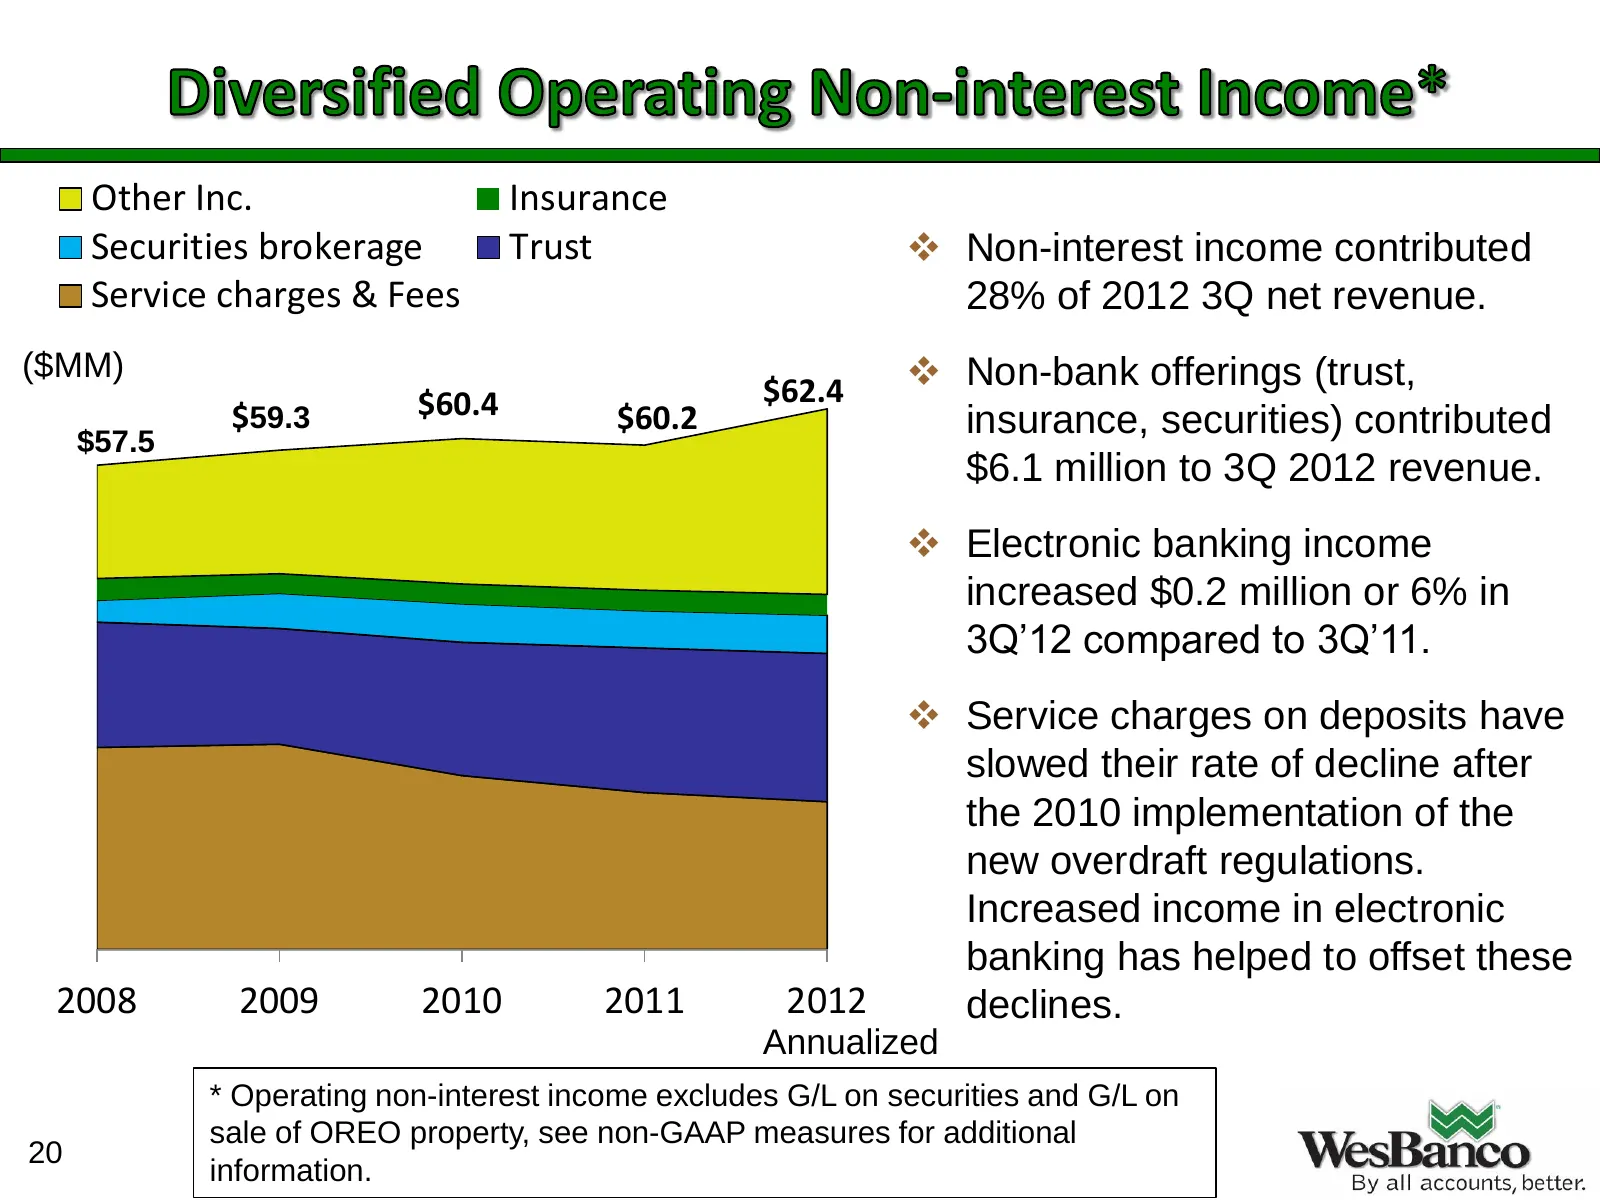
Slide 20: Non-interest income
Other Inc. Insurance Securities brokerage Trust Non-interest income contributed Service charges & Fees 28% of 2012 3Q net revenue. ($MM) $62.4 Non-bank offerings (trust, $59.3 $60.4 $60.2 $57.5 insurance, securities) contributed $6.1 million to 3Q 2012 revenue. Electronic banking income increa
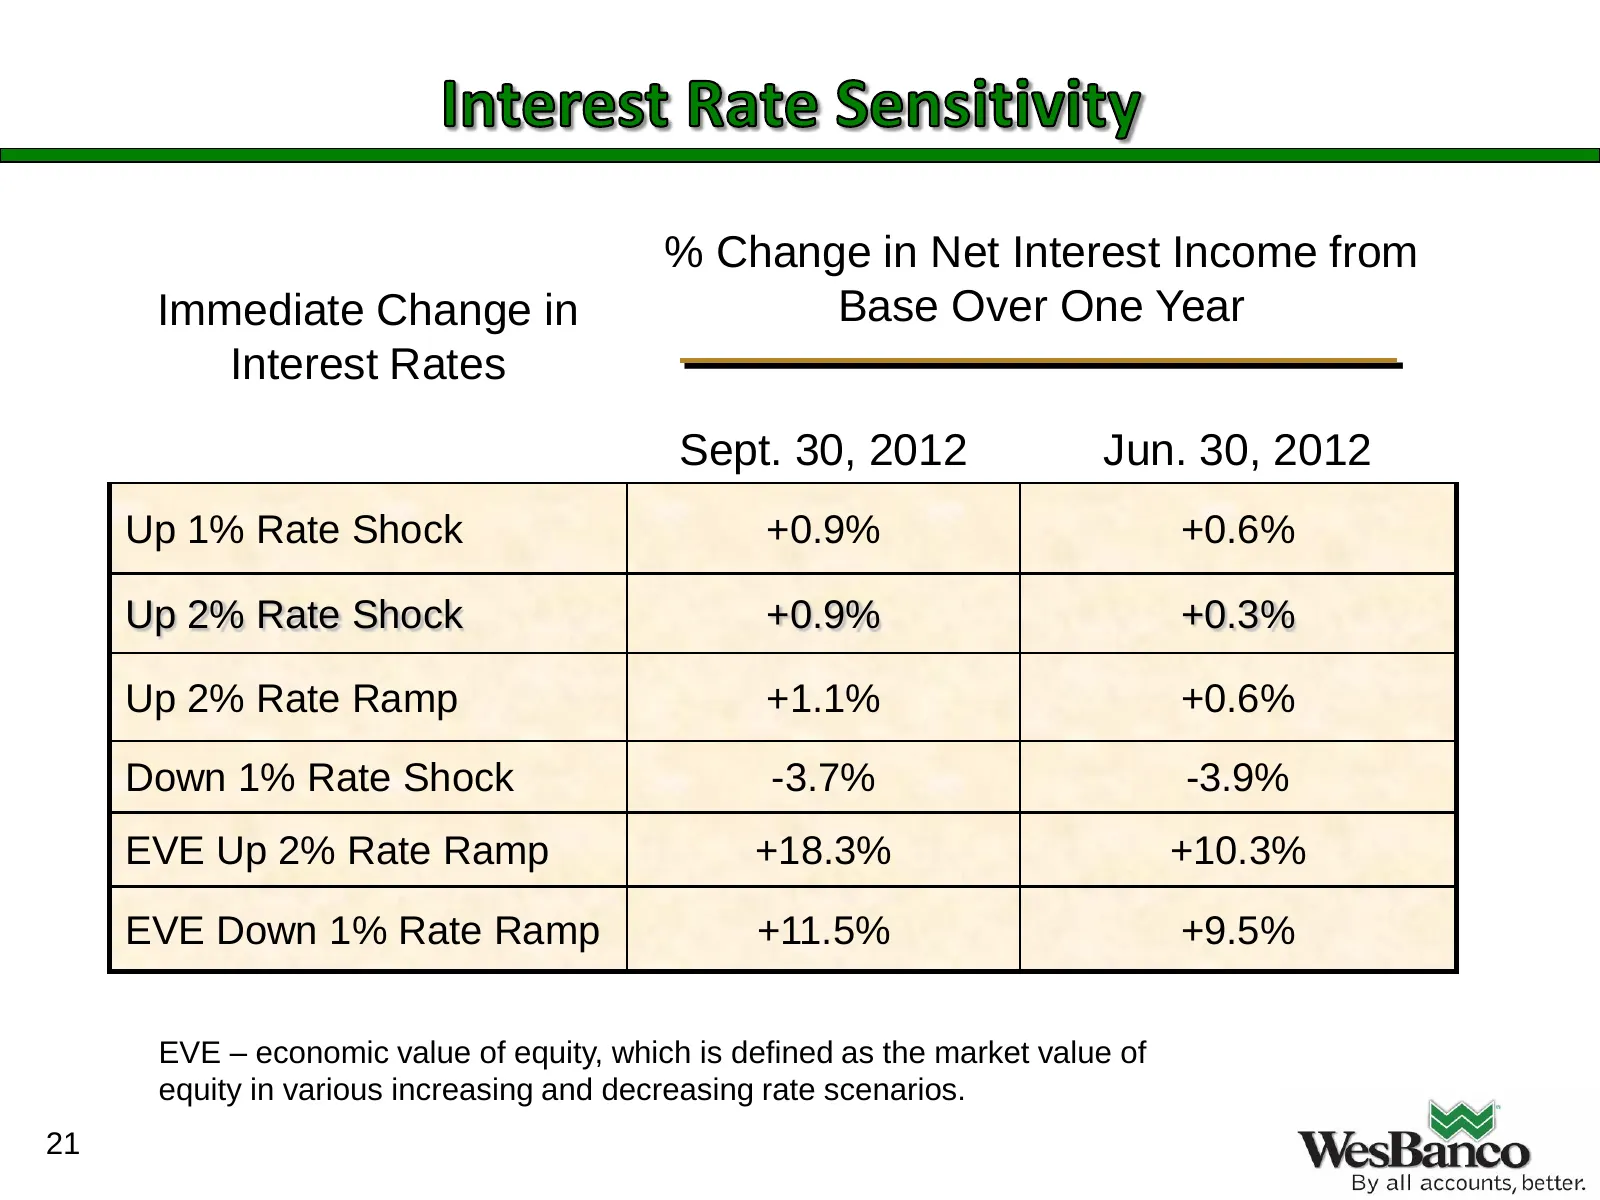
Slide 21: Interest rate sensitivity
% Change in Net Interest Income from Immediate Change in Base Over One Year Interest Rates Sept. 30, 2012 Jun. 30, 2012 Up 1% Rate Shock +0.9% +0.6% Up 2% Rate Shock +0.9% +0.3% Up 2% Rate Ramp +1.1% +0.6% Down 1% Rate Shock -3.7% -3.9% EVE Up 2% Rate Ramp +18.3% +10.3% EVE Down 1% Rate Ramp +11.5%
Slide 22: Summary of strengths
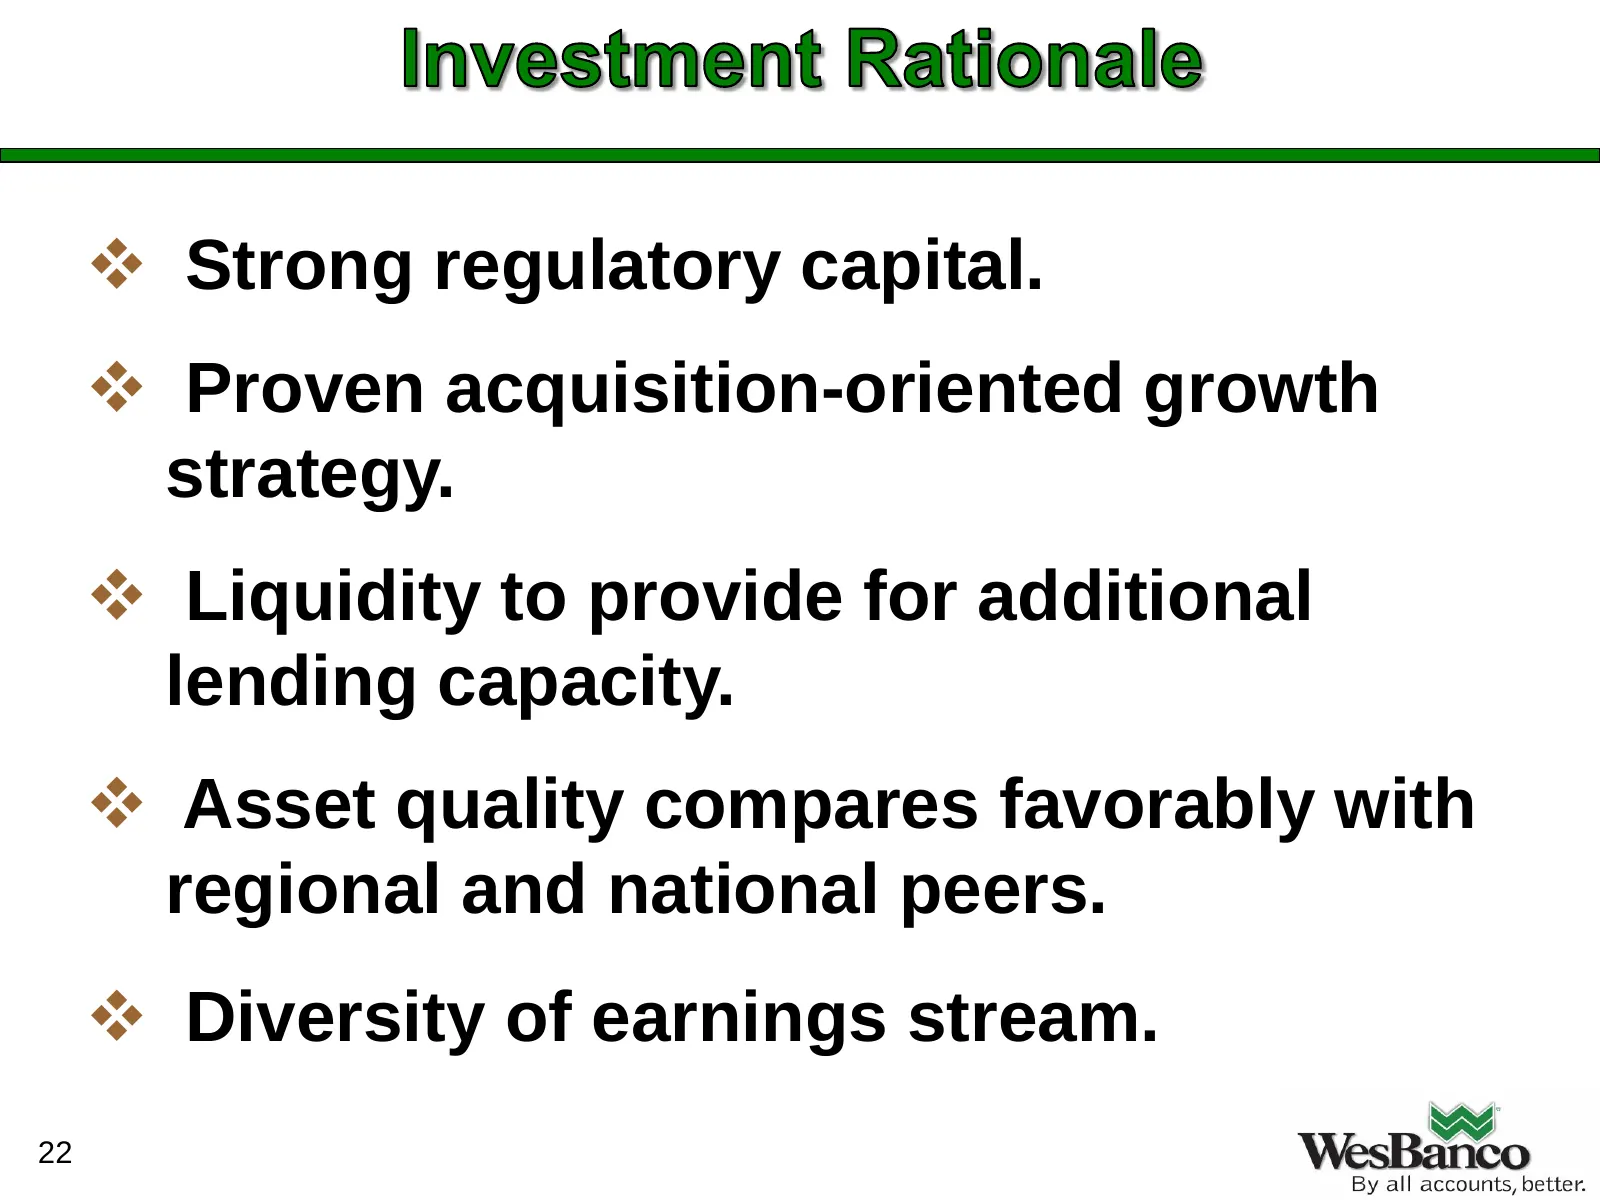
Strong regulatory capital. Proven acquisition-oriented growth strategy. Liquidity to provide for additional lending capacity. Asset quality compares favorably with regional and national peers. Diversity of earnings stream. 22
Slide 23: Loans by market
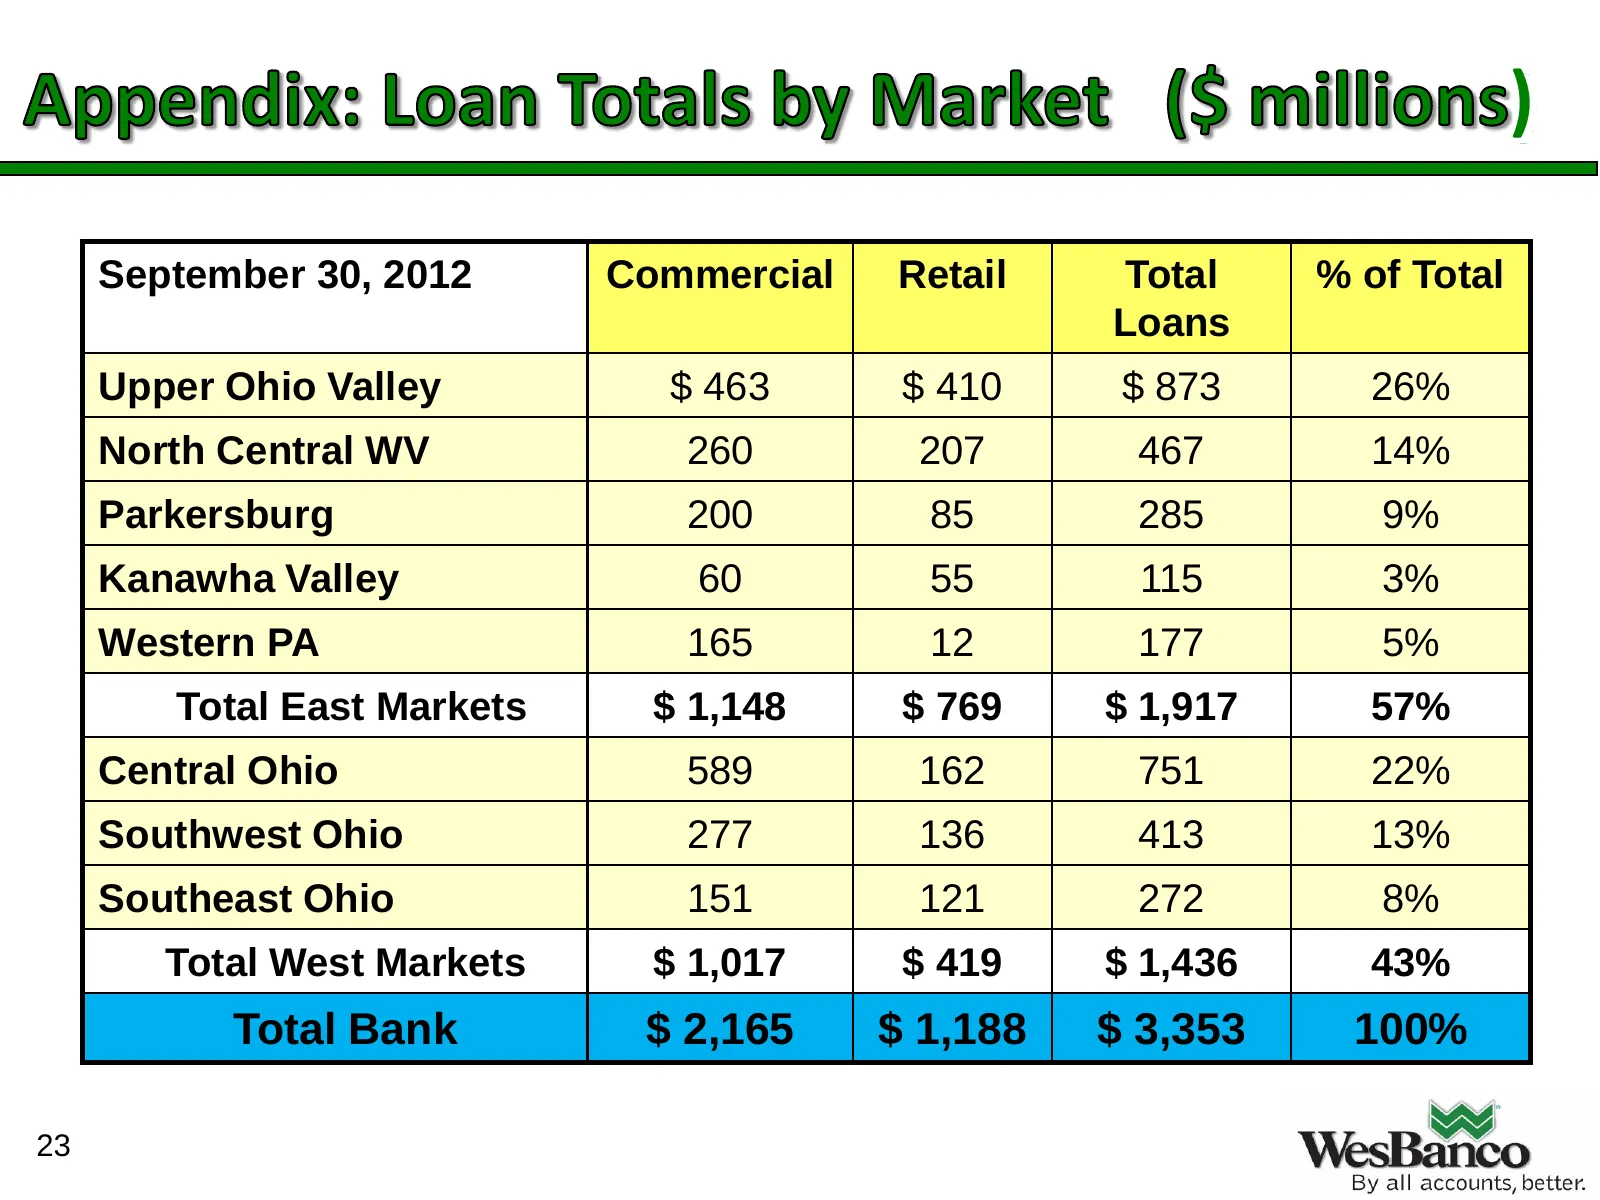
) September 30, 2012 Commercial Retail Total % of Total Loans Upper Ohio Valley $ 463 $ 410 $ 873 26% North Central WV 260 207 467 14% Parkersburg 200 85 285 9% Kanawha Valley 60 55 115 3% Western PA 165 12 177 5% Total East Markets $ 1,148 $ 769 $ 1,917 57% Central Ohio 589 162 751 22% Southwest Oh
Slide 24: Problem assets by region
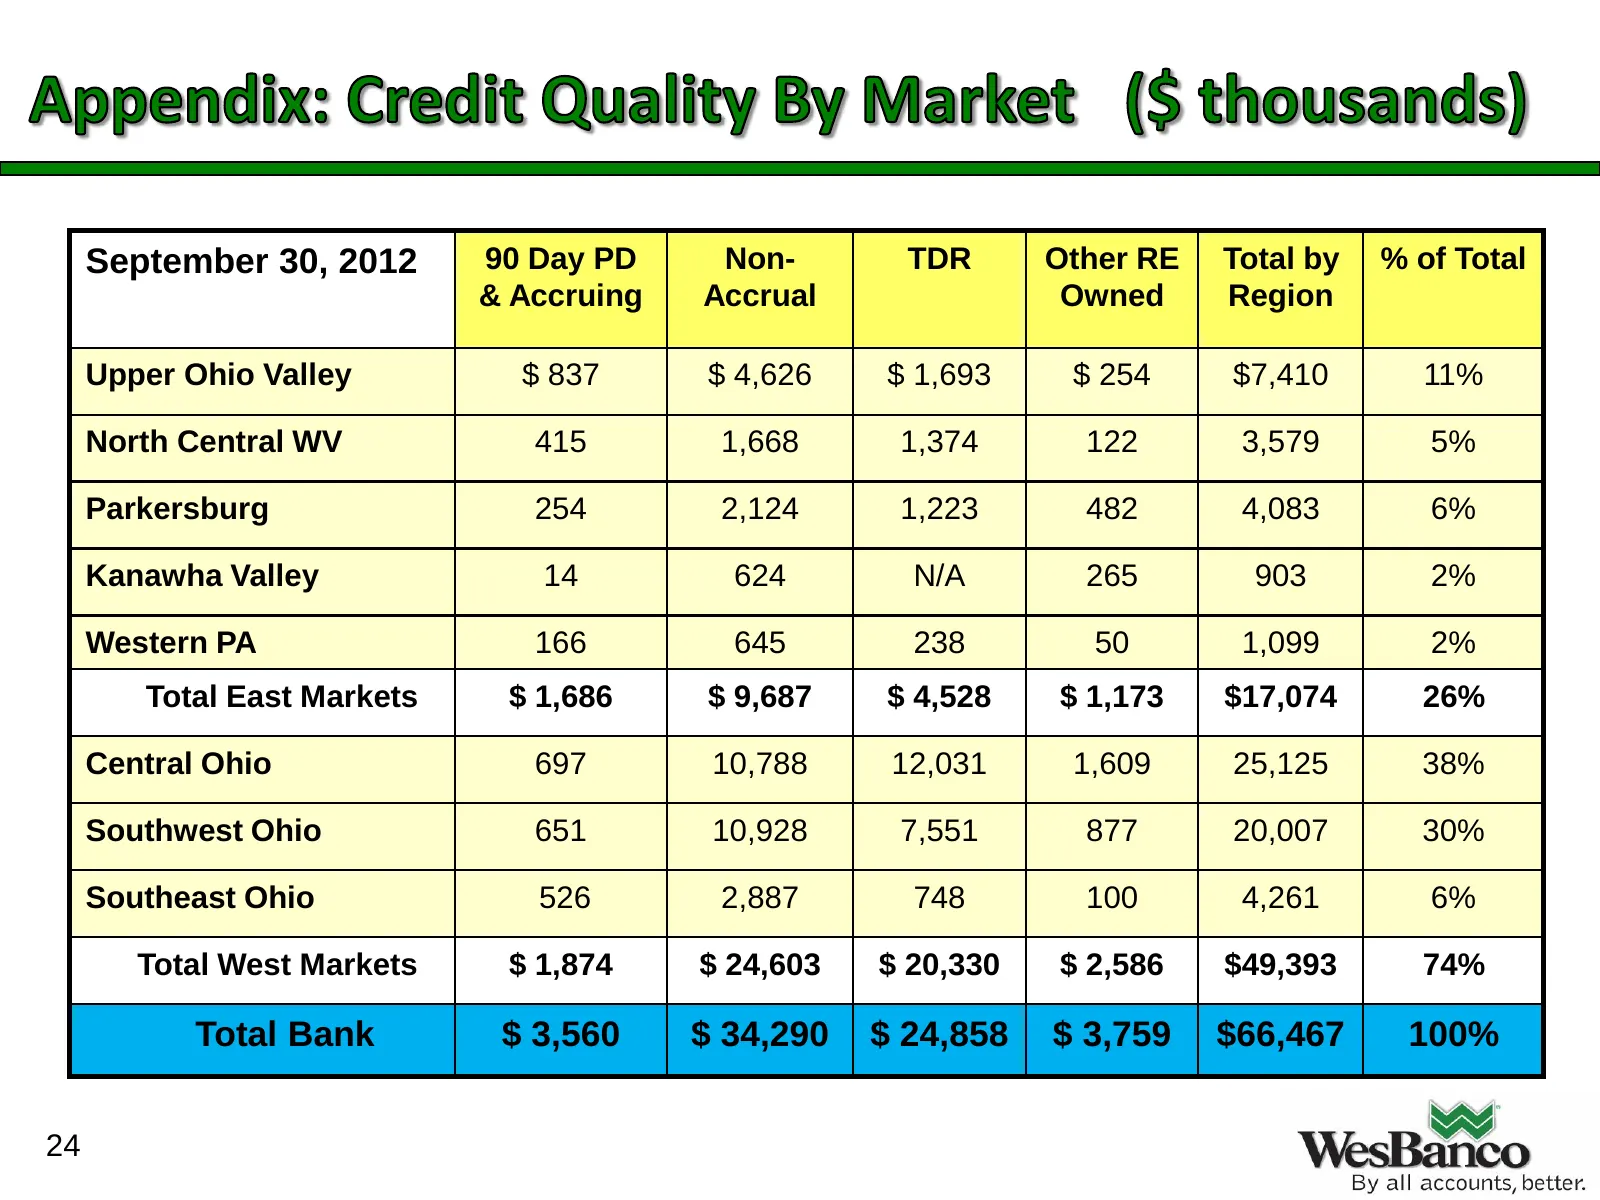
September 30, 2012 90 Day PD Non- TDR Other RE Total by % of Total & Accruing Accrual Owned Region Upper Ohio Valley $ 837 $ 4,626 $ 1,693 $ 254 $7,410 11% North Central WV 415 1,668 1,374 122 3,579 5% Parkersburg 254 2,124 1,223 482 4,083 6% Kanawha Valley 14 624 N/A 265 903 2% Western PA 166 645 2
Slide 25: Tangible equity to tangible assets reconciliation
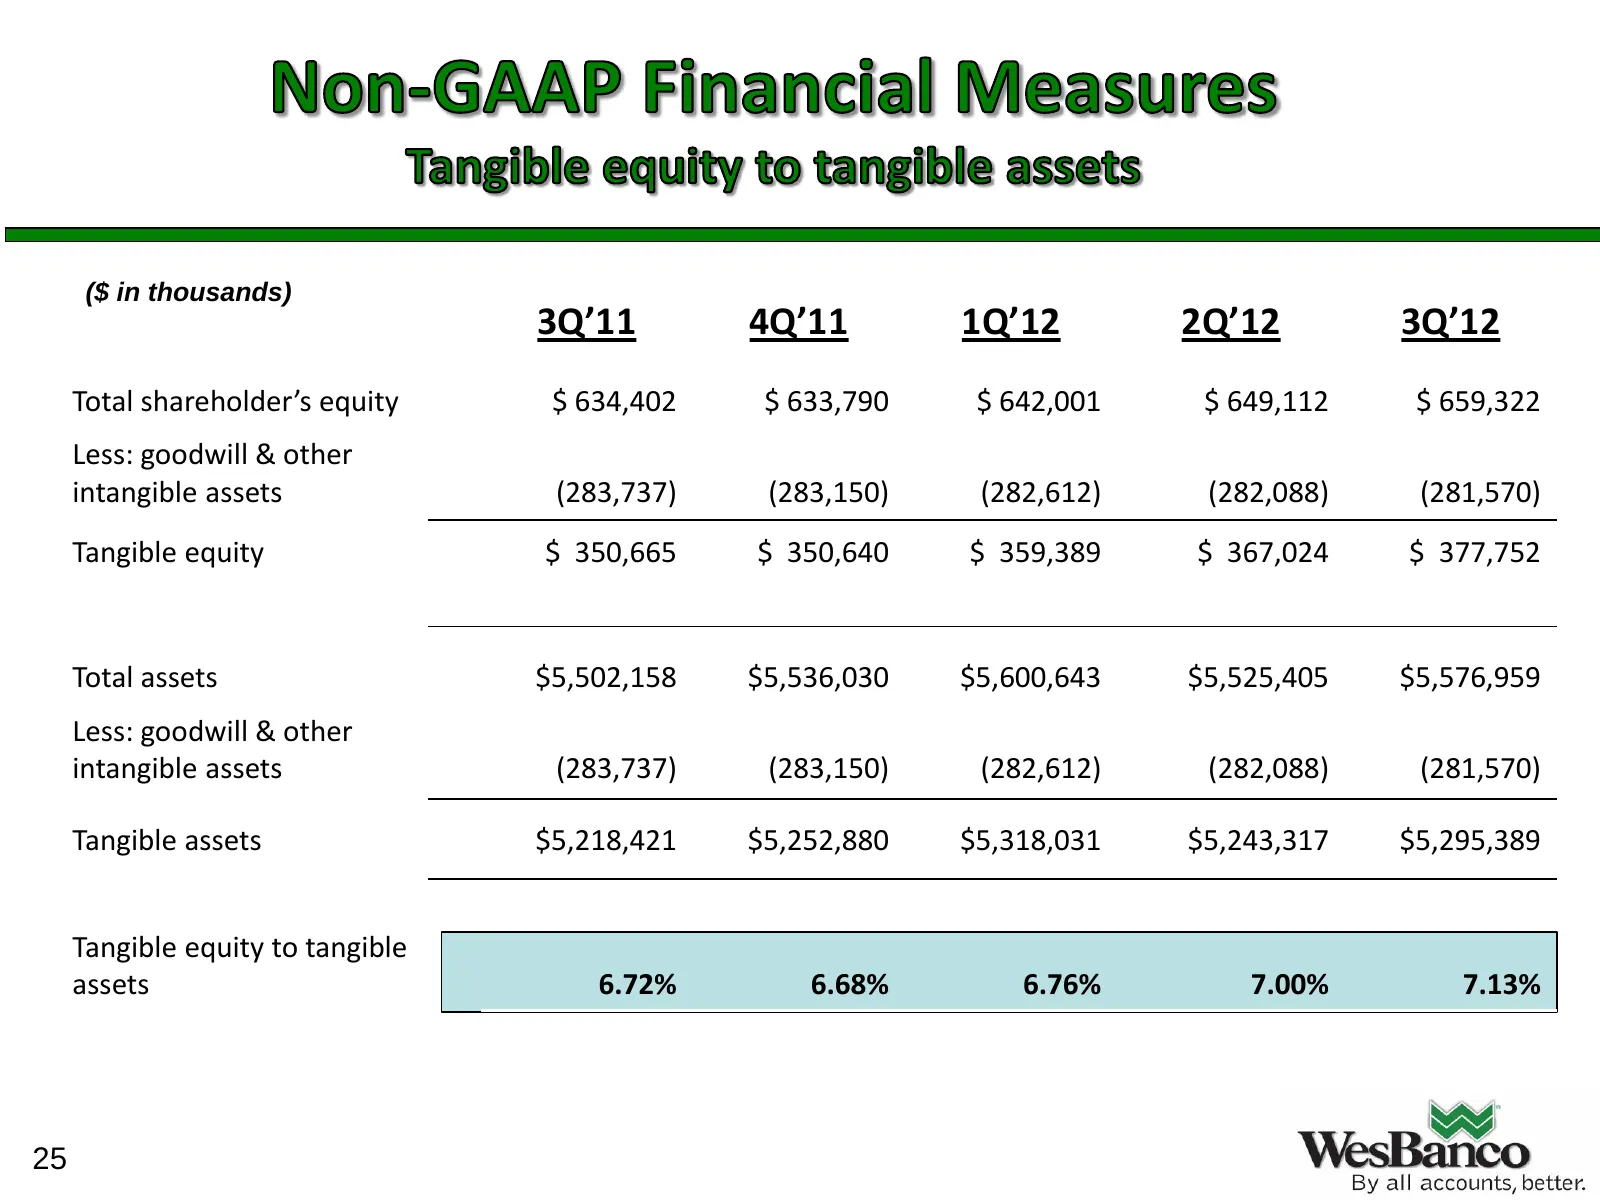
($ in thousands) 3Q’11 4Q’11 1Q’12 2Q’12 3Q’12 Total shareholder’s equity $ 634,402 $ 633,790 $ 642,001 $ 649,112 $ 659,322 Less: goodwill & other intangible assets (283,737) (283,150) (282,612) (282,088) (281,570) Tangible equity $ 350,665 $ 350,640 $ 359,389 $ 367,024 $ 377,752 Total assets $5,502
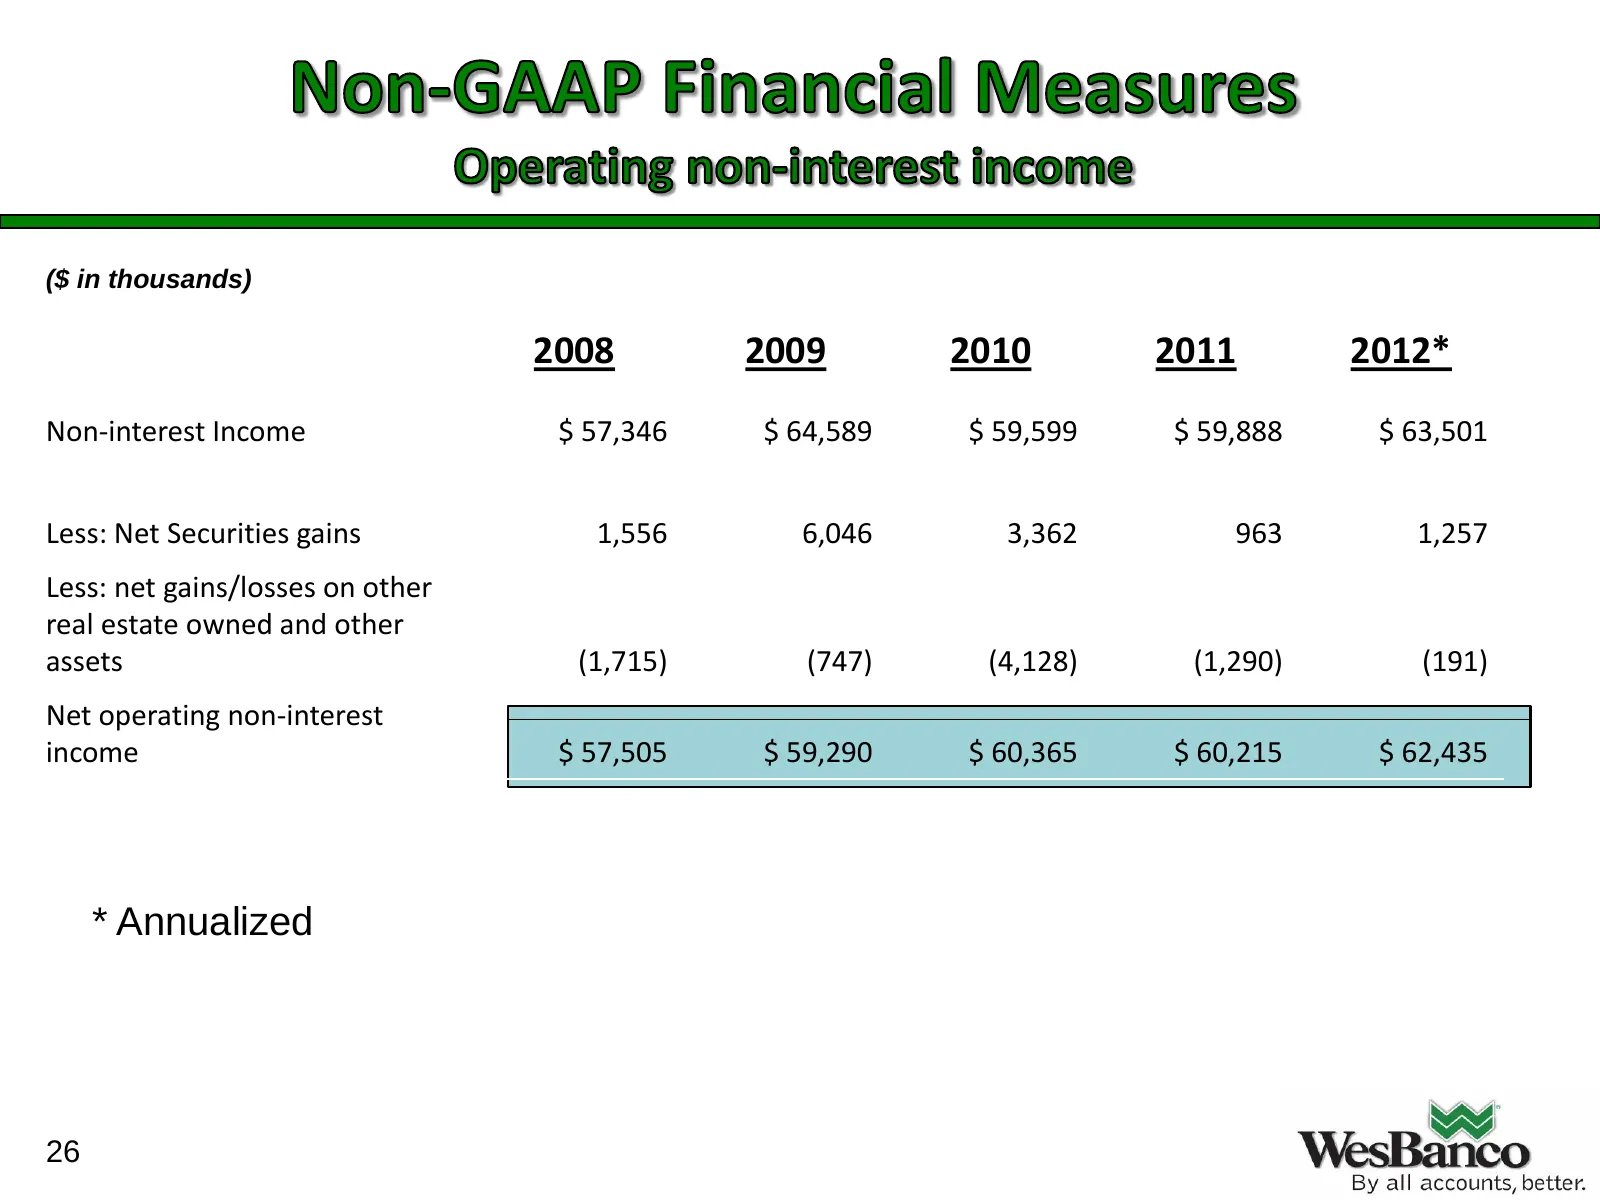
Slide 26: Operating non-interest income reconciliation
($ in thousands) 2008 2009 2010 2011 2012* Non-interest Income $ 57,346 $ 64,589 $ 59,599 $ 59,888 $ 63,501 Less: Net Securities gains 1,556 6,046 3,362 963 1,257 Less: net gains/losses on other real estate owned and other assets (1,715) (747) (4,128) (1,290) (191) Net operating non-interest income
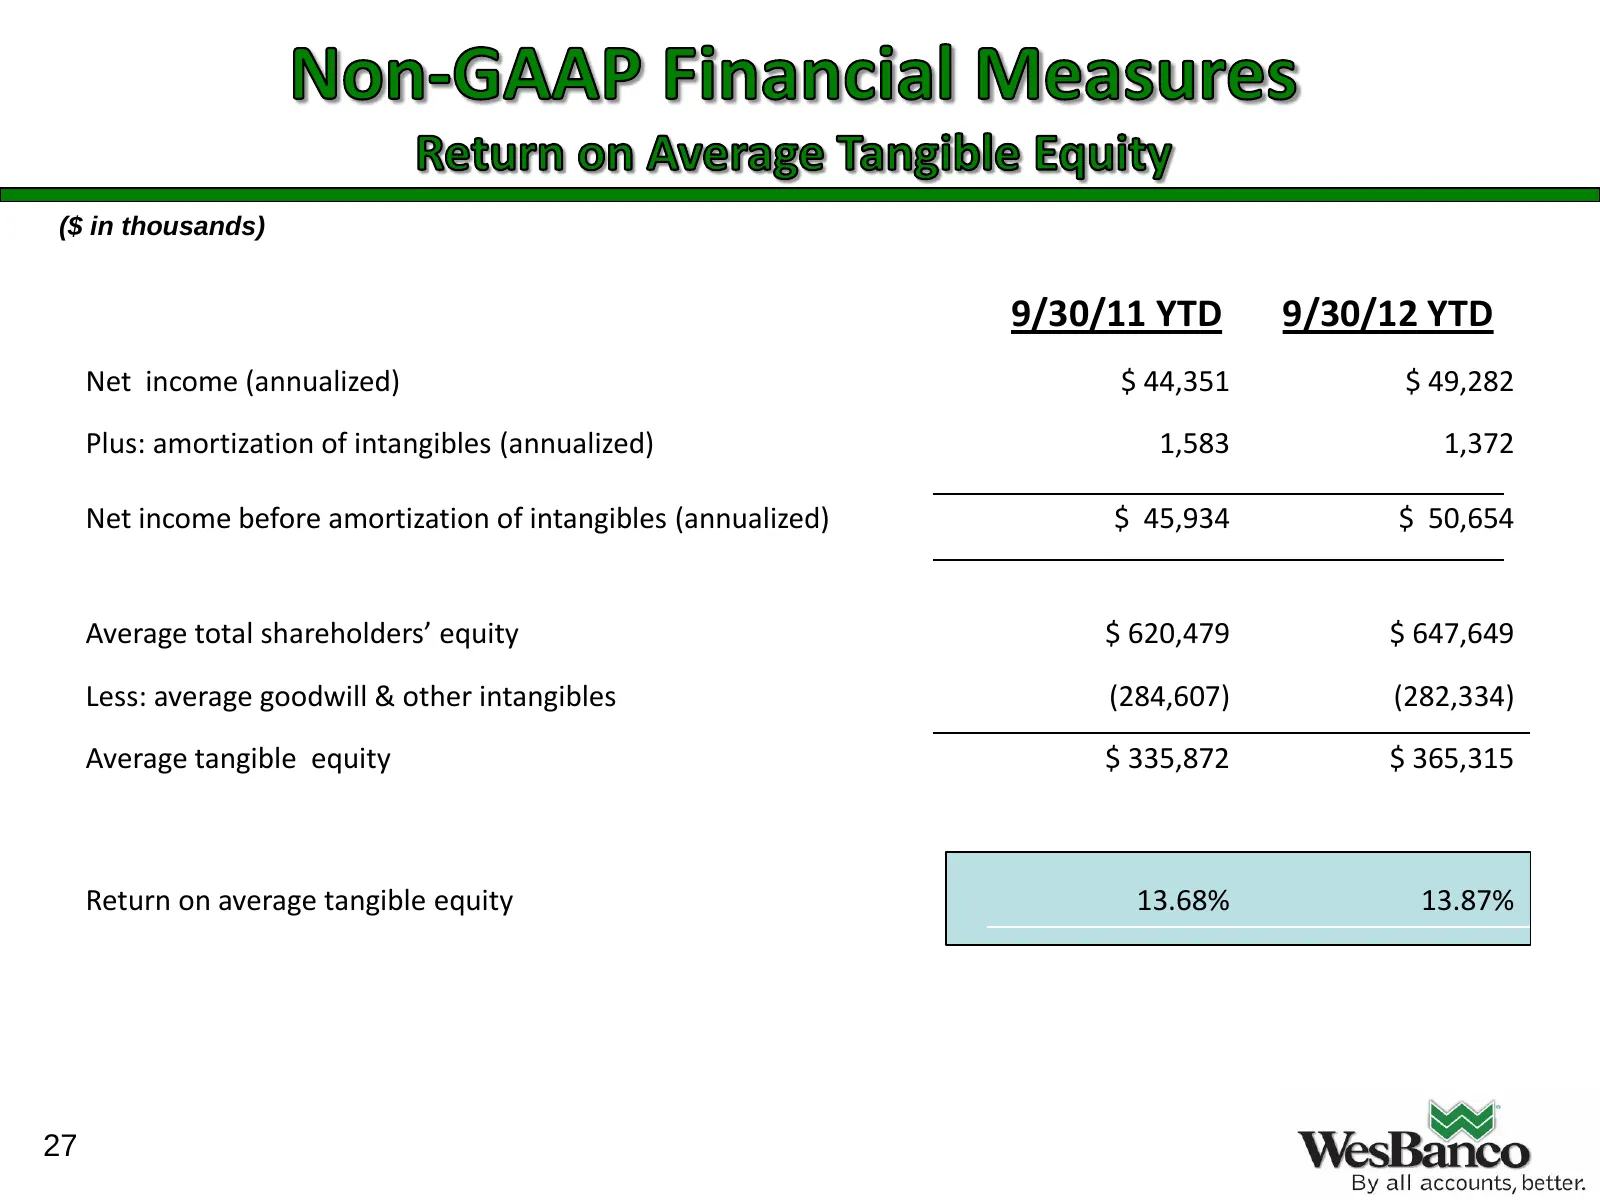
Slide 27: Return on average tangible equity reconciliation
($ in thousands) 9/30/11 YTD 9/30/12 YTD Net income (annualized) $ 44,351 $ 49,282 Plus: amortization of intangibles (annualized) 1,583 1,372 Net income before amortization of intangibles (annualized) $ 45,934 $ 50,654 Average total shareholders’ equity $ 620,479 $ 647,649 Less: average goodwill & o
Slide 28: WesBanco
28 WesBanco By all accounts, better.
Source: SEC EDGAR · 425 filed Nov 26, 2012