Enerpac Tool Group Corp. · NYSE:EPAC
Enerpac Tool — Investor Presentation (October 2025)
31 slides from Enerpac Tool's investor presentation, October 2025
Slide 1: Investor Overview October 2025
INVESTOR OVERVIEW OCTOBER 2025
Slide 2: Forward-Looking Statements and Non-GAAP Measures
Forward-Looking Statements and Non-GAAP Measures Statements made in this presentation that are not historical are forward-looking statements made pursuant to the provisions of the Private Securities Litigation Reform Act of 1995that involve risks and uncertainties. In addition to statements with res
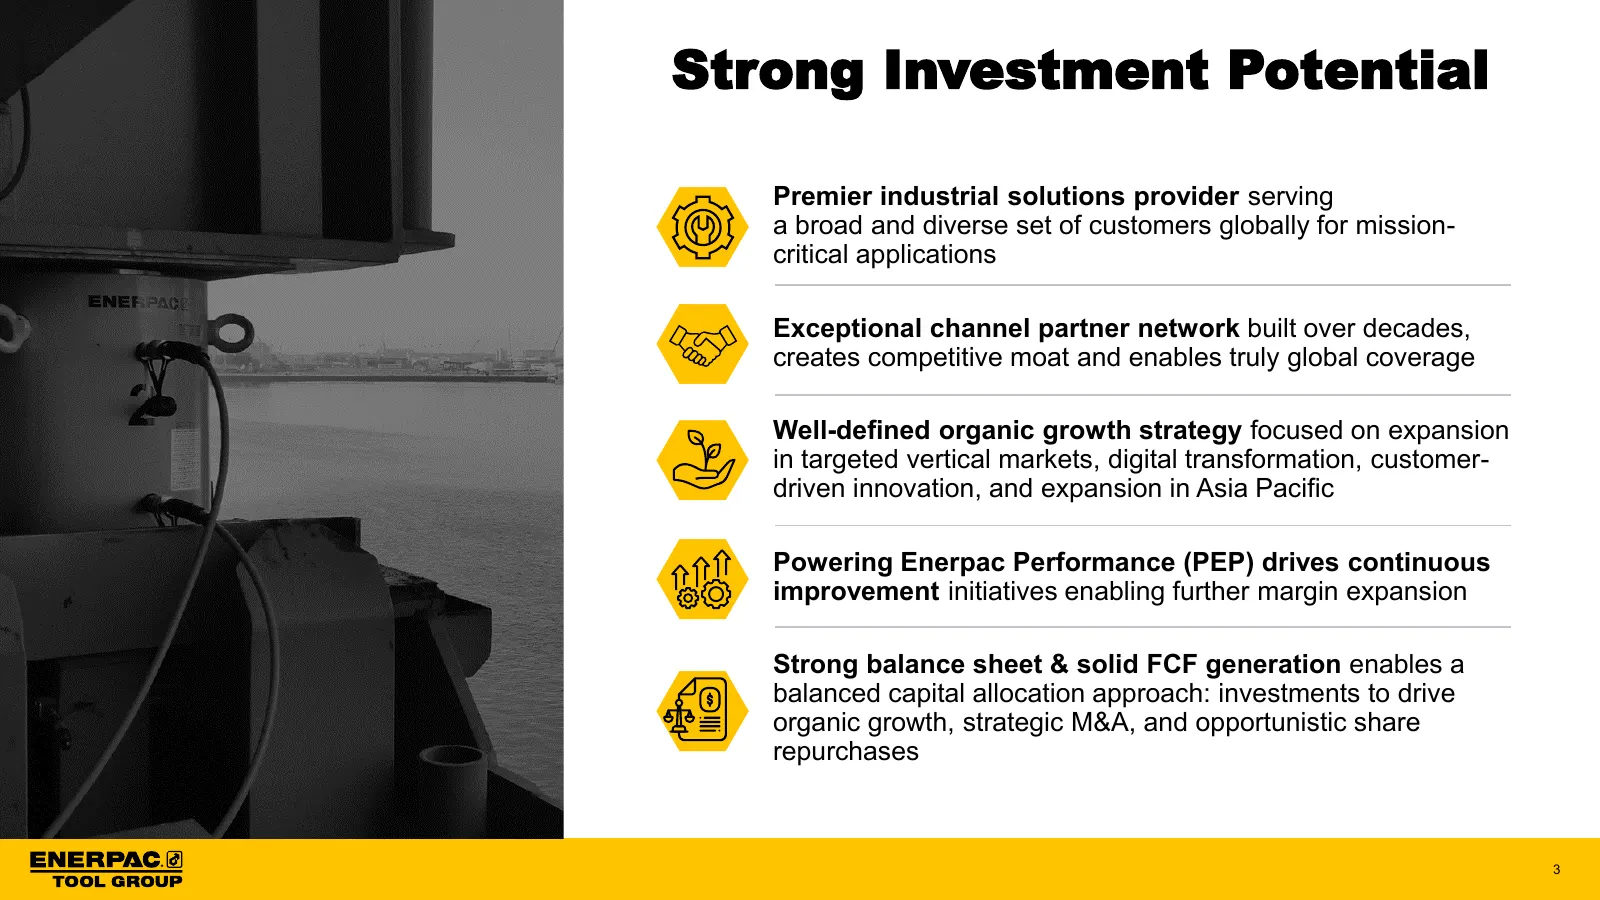
Slide 3: Strong Investment Potential
Strong Investment Potential Premier industrial solutions provider serving a broad and diverse set of customers globally for mission- critical applications Exceptional channel partner network built over decades, creates competitive moat and enables truly global coverage Well-defined organic growth st
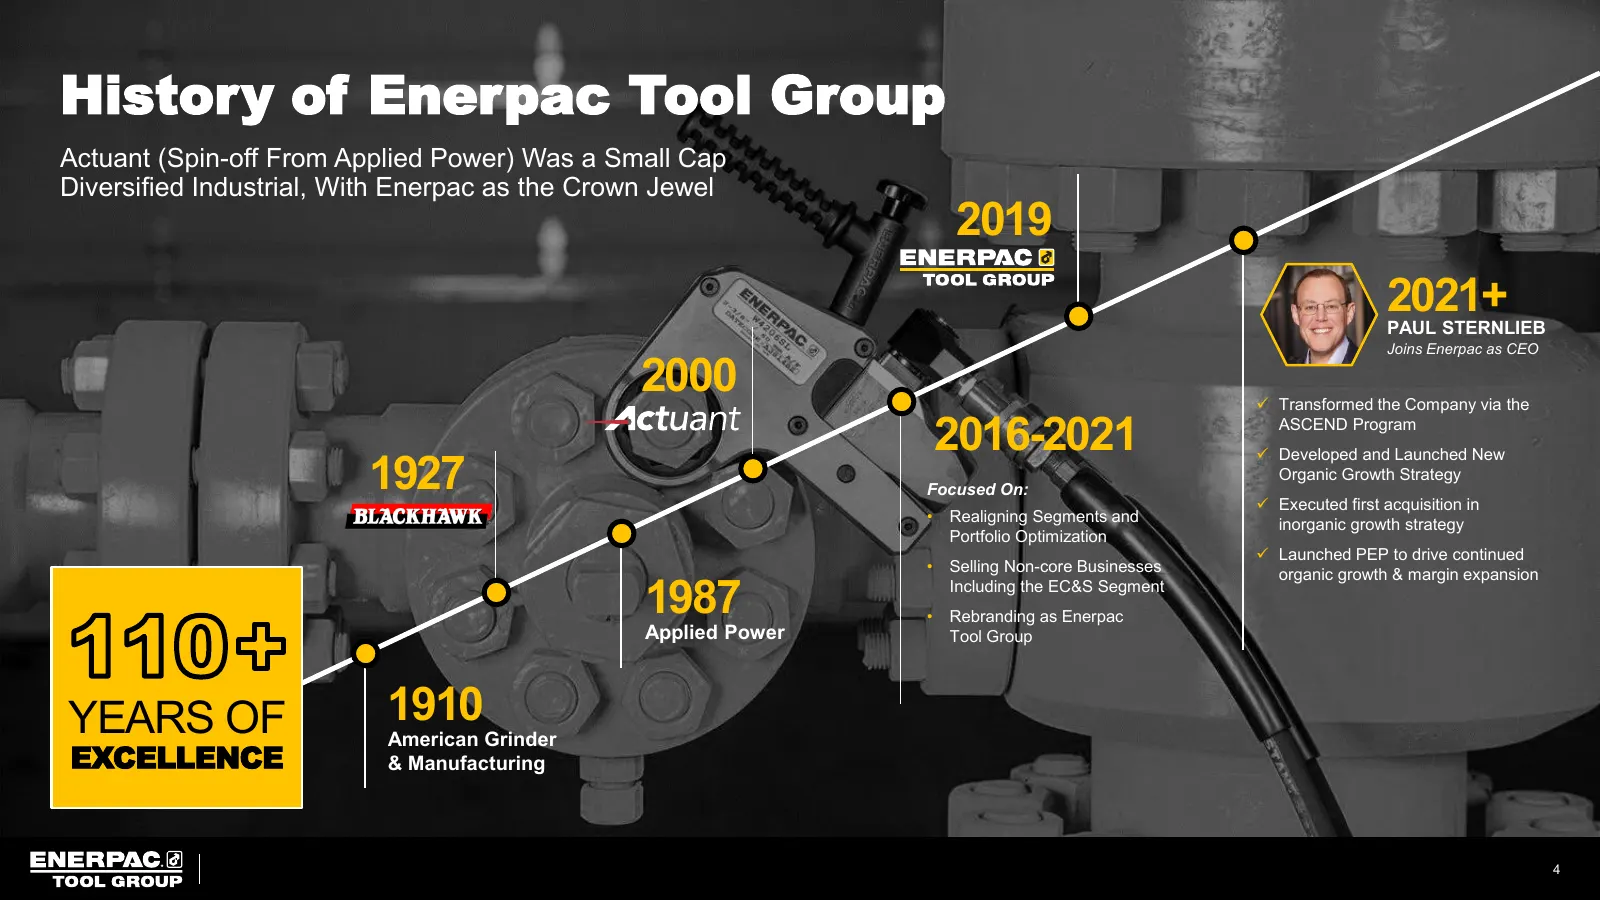
Slide 4: History of Enerpac Tool Group
History of Enerpac Tool Group Actuant (Spin-off From Applied Power) Was a Small Cap Diversified Industrial, With Enerpac as the Crown Jewel 2019 2021+ PAUL STERNLIEB Joins Enerpac as CEO 2000 ✓ Transformed the Company via the 2016-2021 ASCEND Program ✓ Developed and Launched New 1927 Focused On: Org
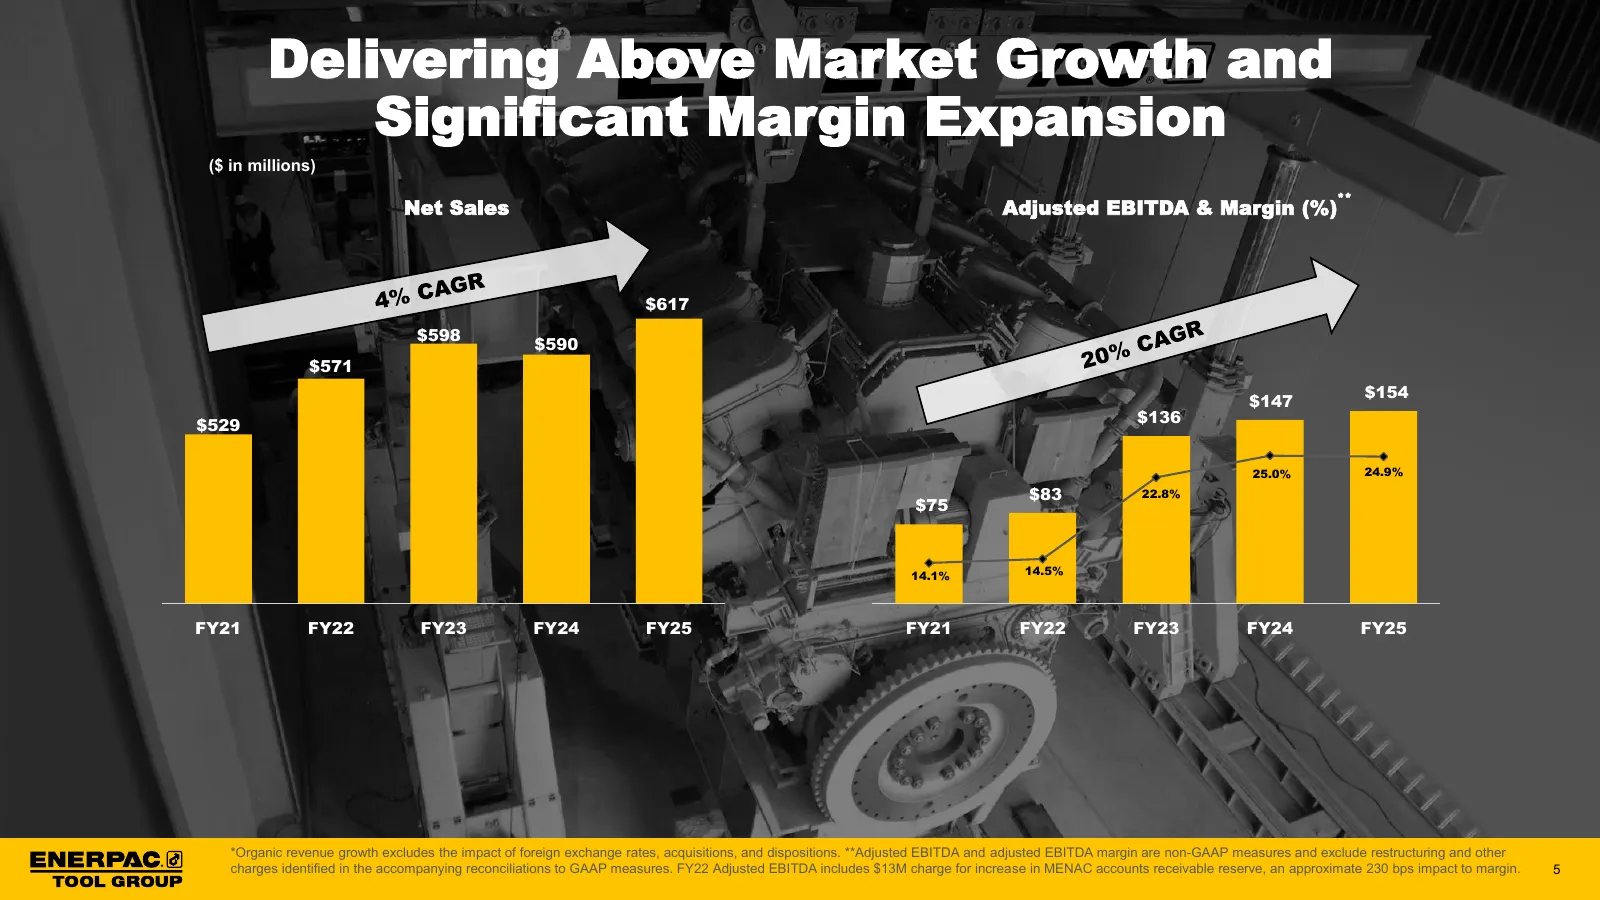
Slide 5: Delivering Above Market Growth and Significant Margin Expansion
Delivering Above Market Growth and Significant Margin Expansion ($ in millions) ** Net Sales Adjusted EBITDA & Margin (%) $617 $598 $590 $571 $154 $147 $529 $136 25.0% 24.9% $83 22.8% $75 14.1% 14.5% FY21 FY22 FY23 FY24 FY25 FY21 FY22 FY23 FY24 FY25 *Organic revenue growth excludes the impact of for
Slide 6: Business Overview
Business Overview ENERPAC @)
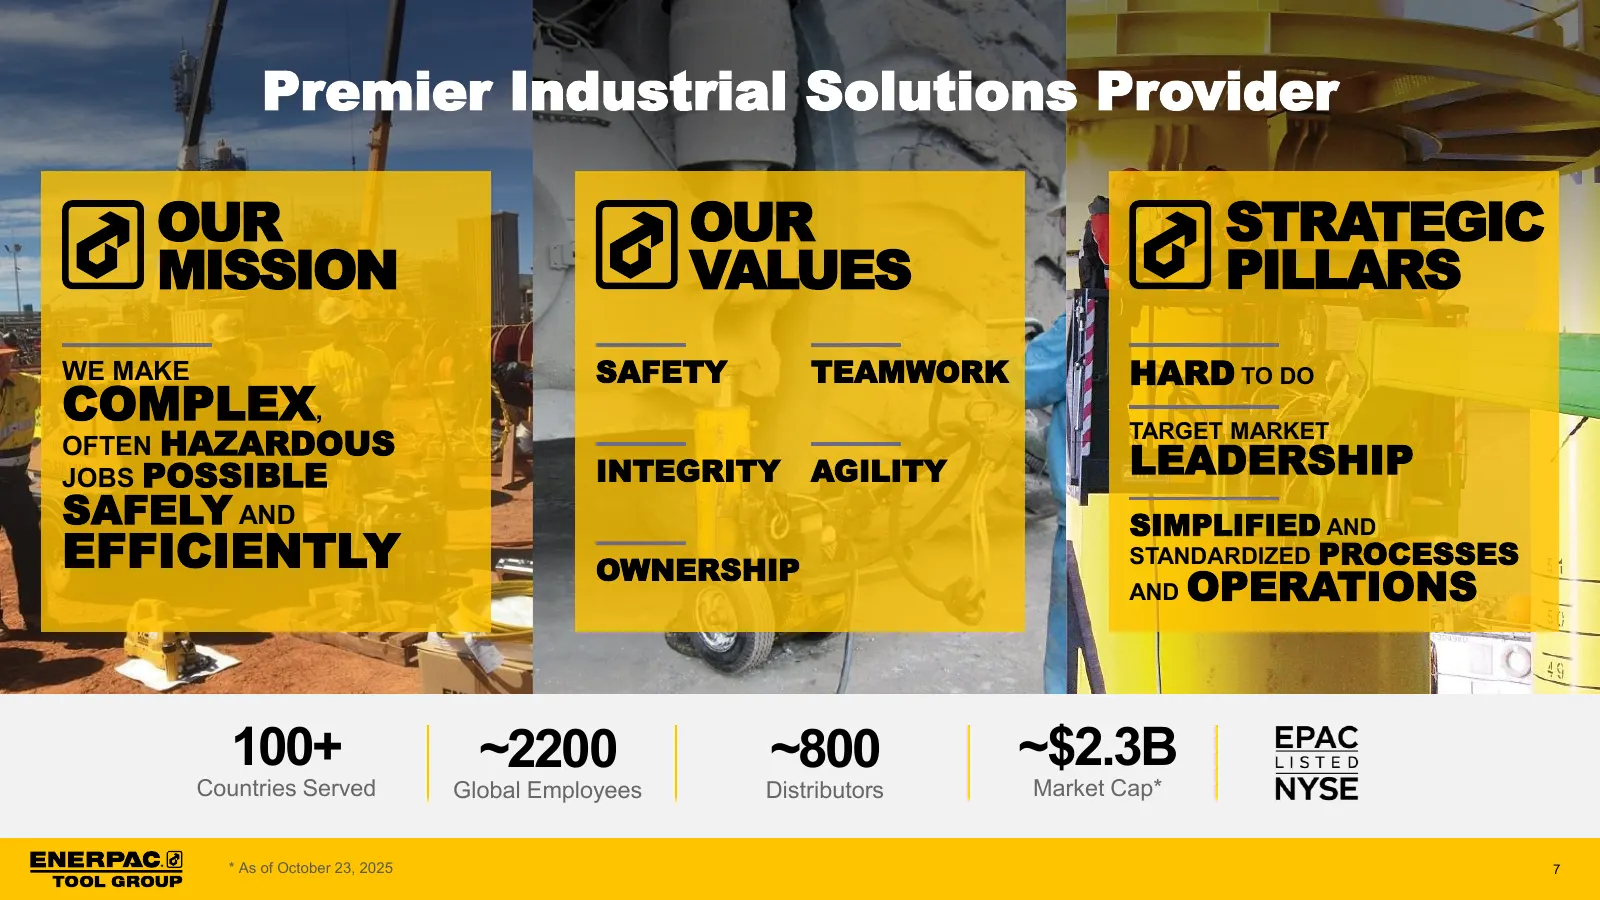
Slide 7: Premier Industrial Solutions Provider
Premier Industrial Solutions Provider OUR OUR STRATEGIC MISSION VALUES PILLARS WE MAKE SAFETY TEAMWORK HARD TO DO COMPLEX, OFTEN HAZARDOUS TARGET MARKET JOBS POSSIBLE INTEGRITY AGILITY LEADERSHIP SAFELY AND SIMPLIFIED AND EFFICIENTLY OWNERSHIP STANDARDIZED PROCESSES AND OPERATIONS 100+ ~2200 ~800 ~$
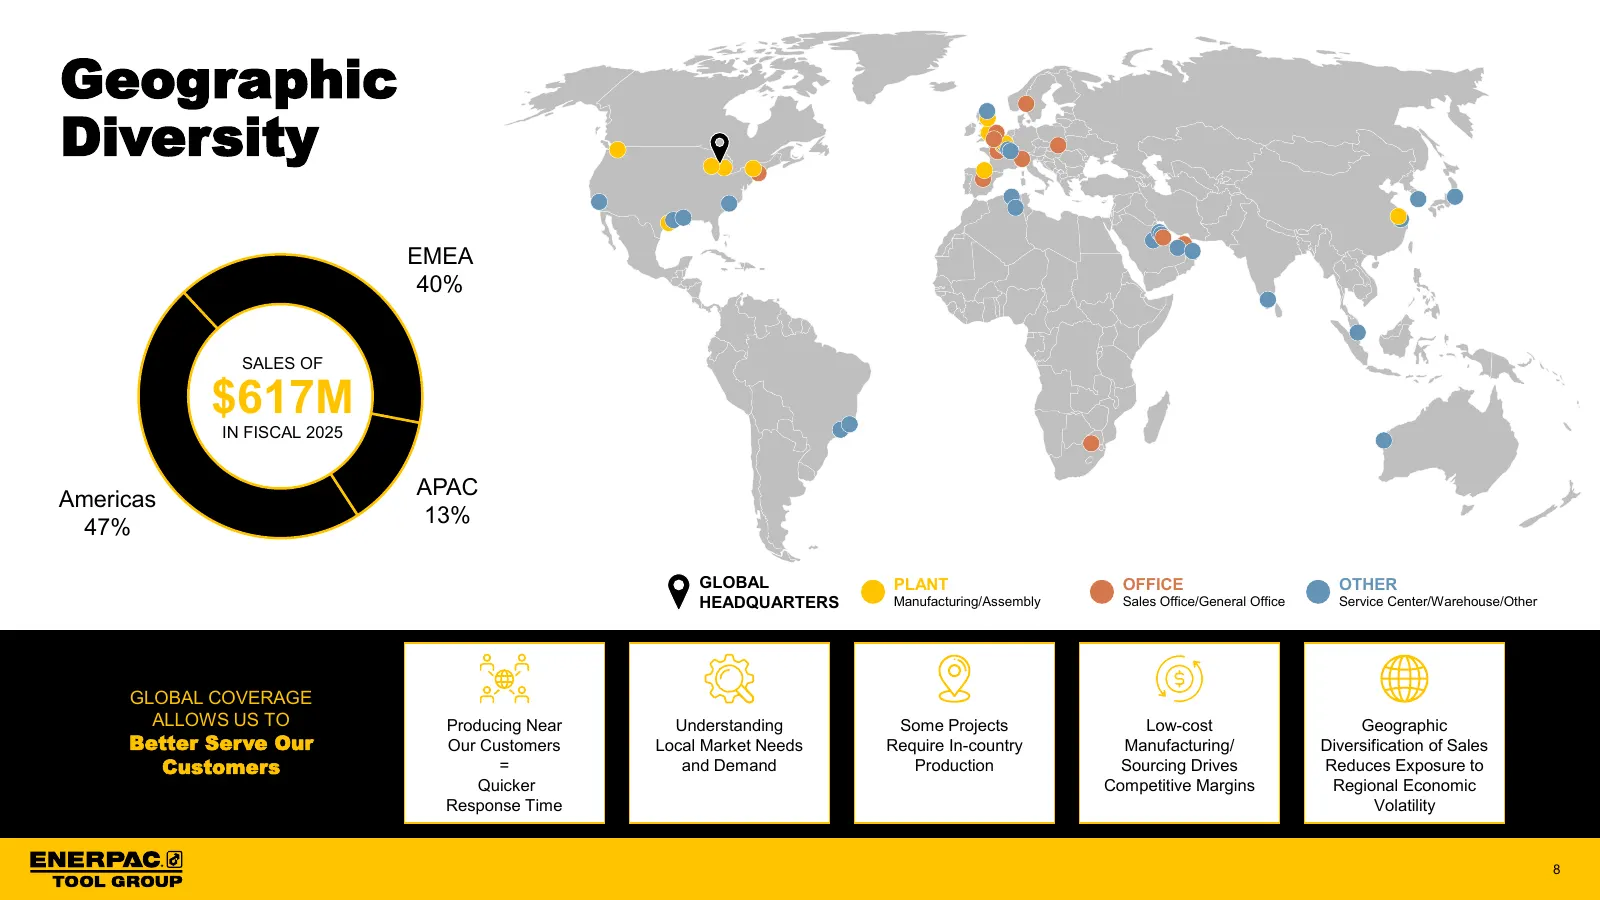
Slide 8: Geographic Diversity
Geographic Diversity EMEA 40% SALES OF $617M IN FISCAL 2025 APAC Americas 13% 47% GLOBAL PLANT OFFICE OTHER HEADQUARTERS Manufacturing/Assembly Sales Office/General Office Service Center/Warehouse/Other GLOBAL COVERAGE ALLOWS US TO Producing Near Understanding Some Projects Low-cost Geographic Bette
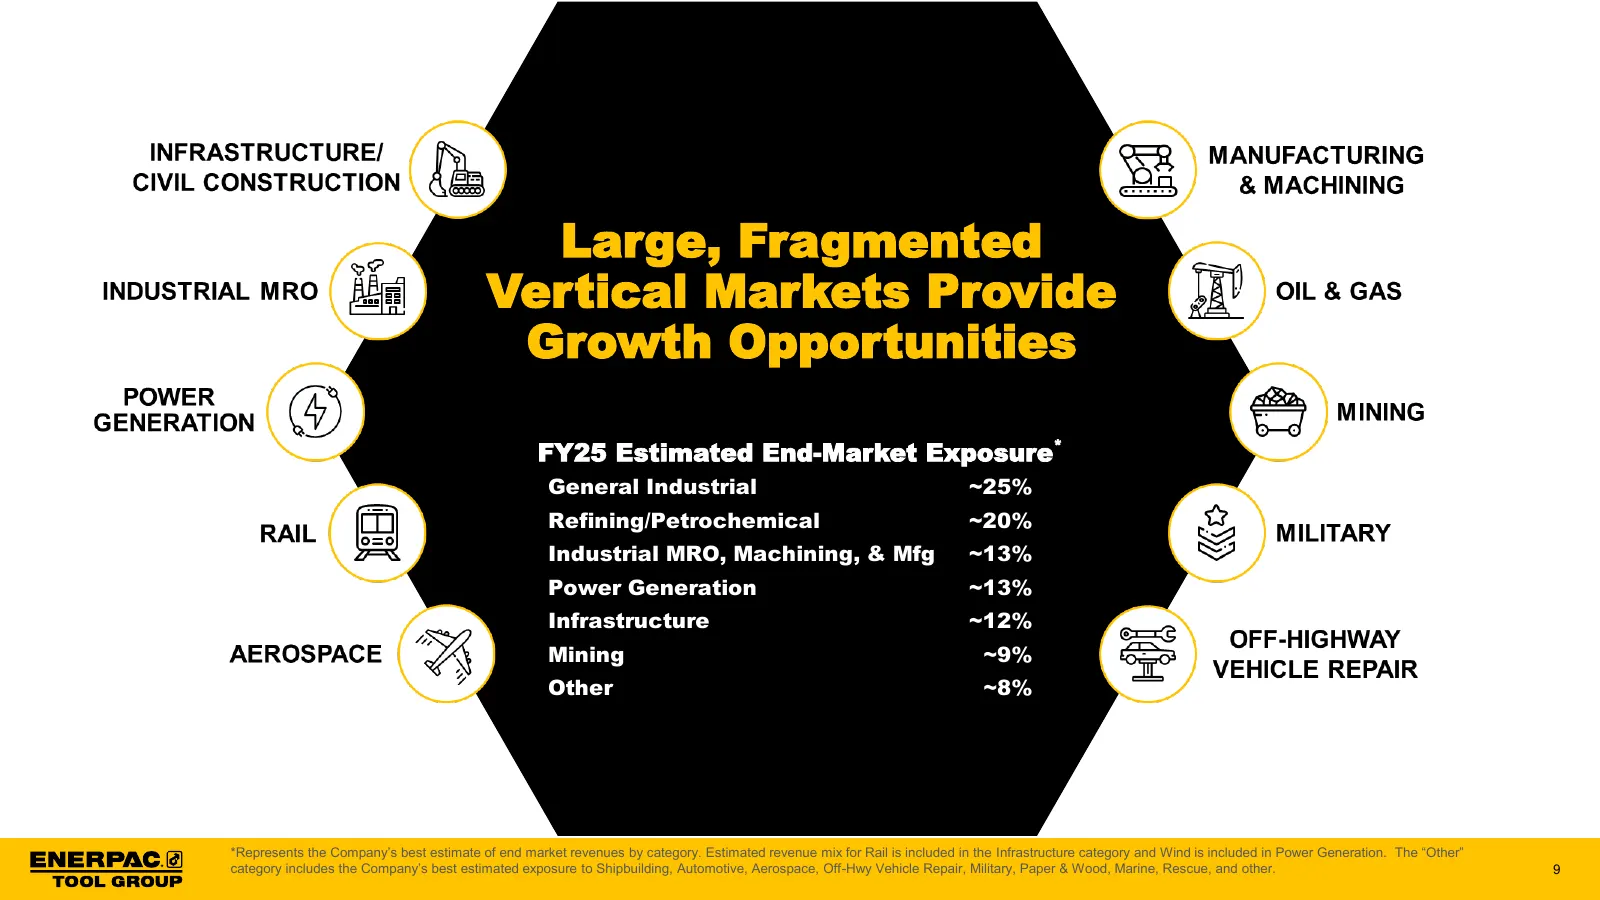
Slide 9: Large, Fragmented Vertical Markets Provide Growth Opportunities
Large, Fragmented Vertical Markets Provide Growth Opportunities FY25 Estimated End-Market Exposure* General Industrial ~25% Refining/Petrochemical ~20% Industrial MRO, Machining, & Mfg ~13% Power Generation ~13% Infrastructure ~12% Mining ~9% Other ~8% *Represents the Company’s best estimate of end
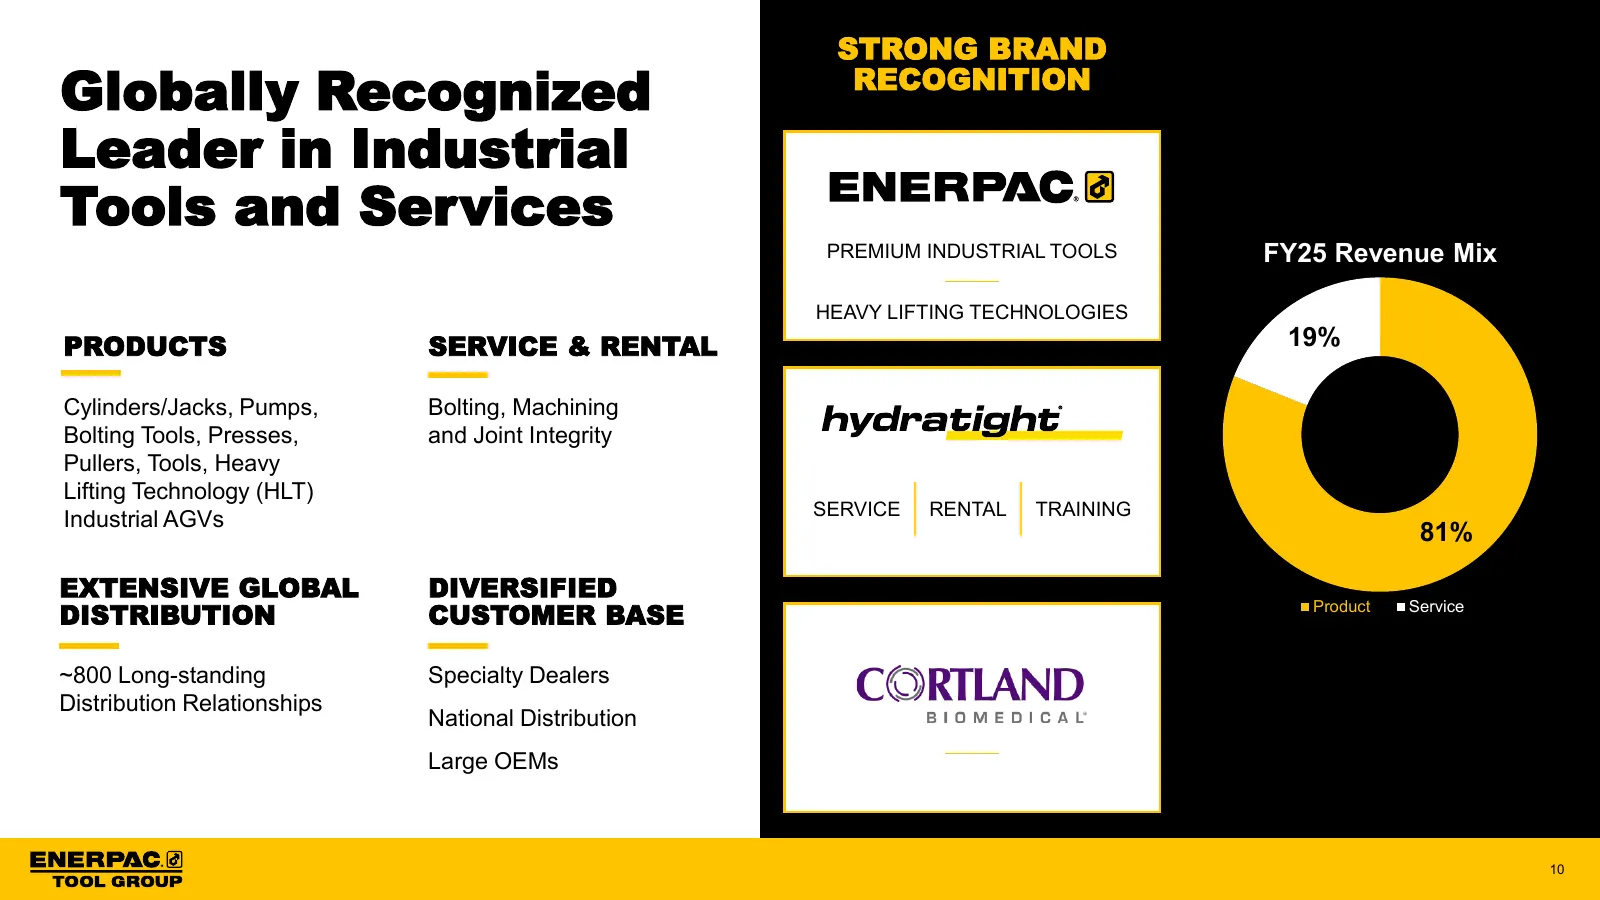
Slide 10: Globally Recognized Leader in Industrial Tools and Services
STRONG BRAND Globally Recognized RECOGNITION Leader in Industrial Tools and Services PREMIUM INDUSTRIAL TOOLS FY25 Revenue Mix HEAVY LIFTING TECHNOLOGIES PRODUCTS SERVICE & RENTAL 19% Cylinders/Jacks, Pumps, Bolting, Machining Bolting Tools, Presses, and Joint Integrity Pullers, Tools, Heavy Lifting
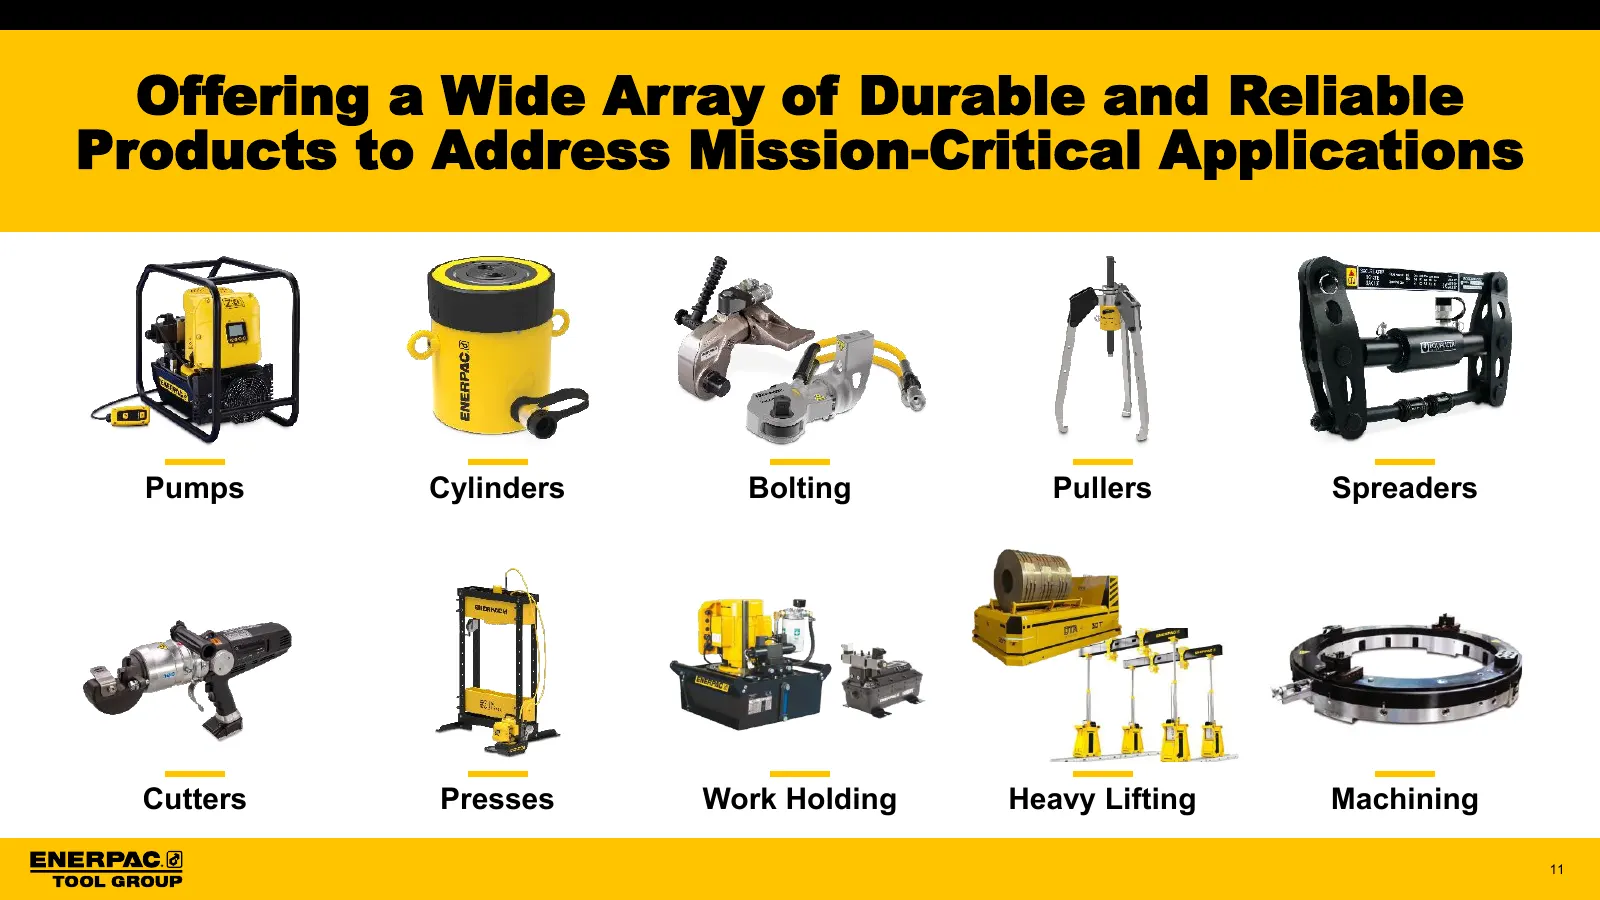
Slide 11: Offering a Wide Array of Durable and Reliable Products
Offering a Wide Array of Durable and Reliable Products to Address Mission-Critical Applications Pumps Cylinders Bolting Pullers Spreaders Cutters Presses Work Holding Heavy Lifting Machining 11
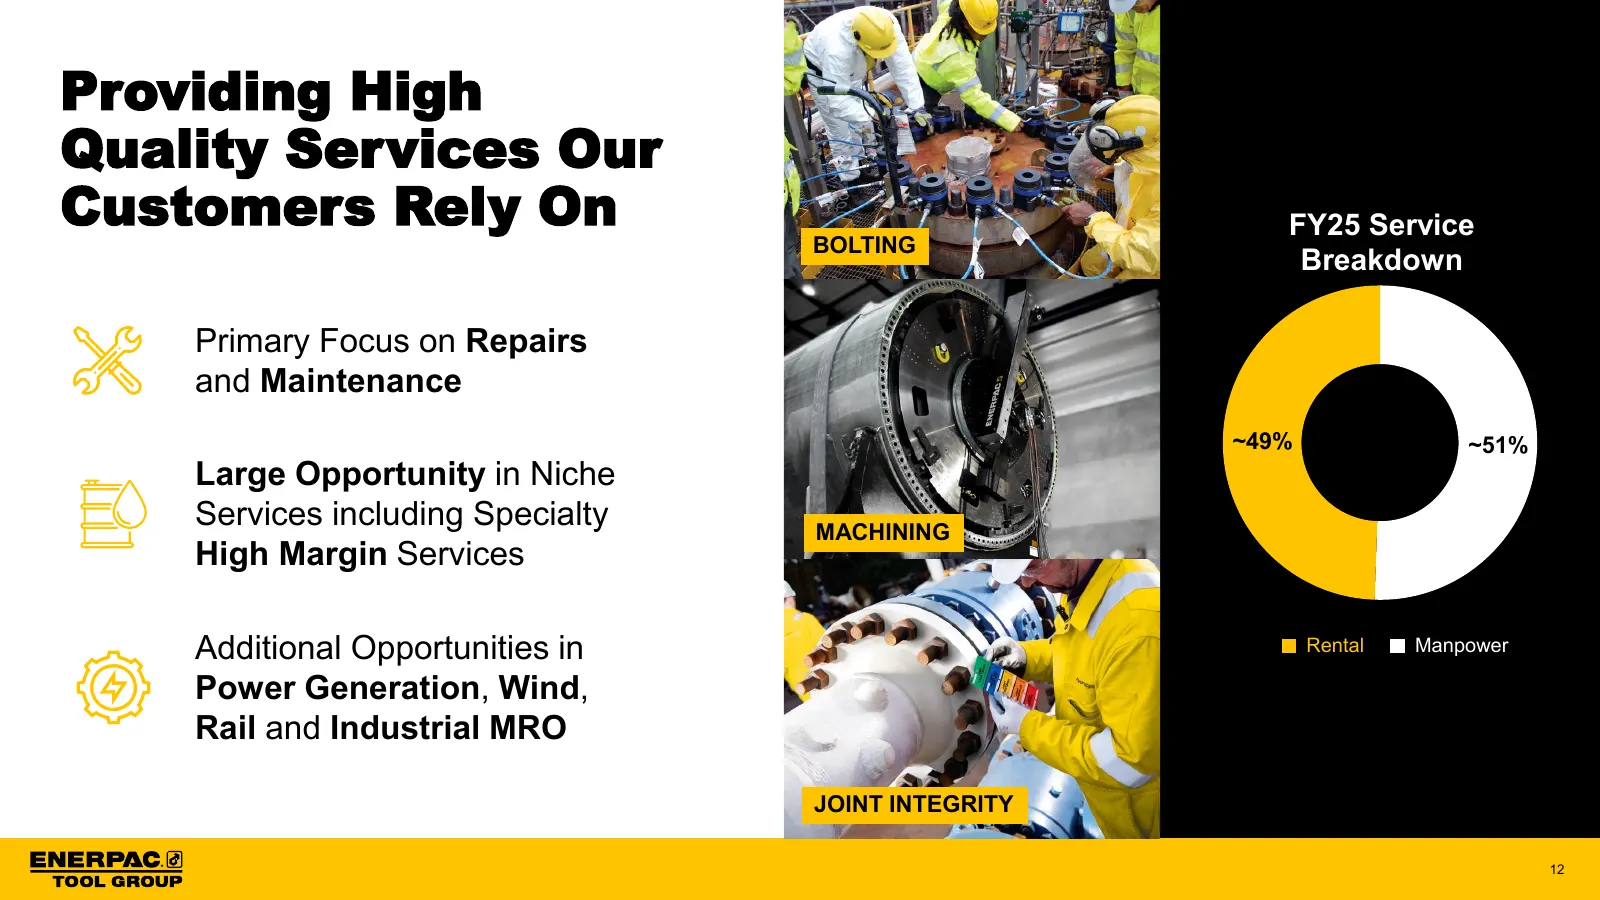
Slide 12: Providing High Quality Services Our Customers Rely On
Providing High Quality Services Our Customers Rely On FY25 Service BOLTING Breakdown Primary Focus on Repairs and Maintenance ~49% ~51% Large Opportunity in Niche Services including Specialty MACHINING High Margin Services Additional Opportunities in Rental Manpower Power Generation, Wind, Rail and
Slide 13: Enerpac's Competitive Advantage
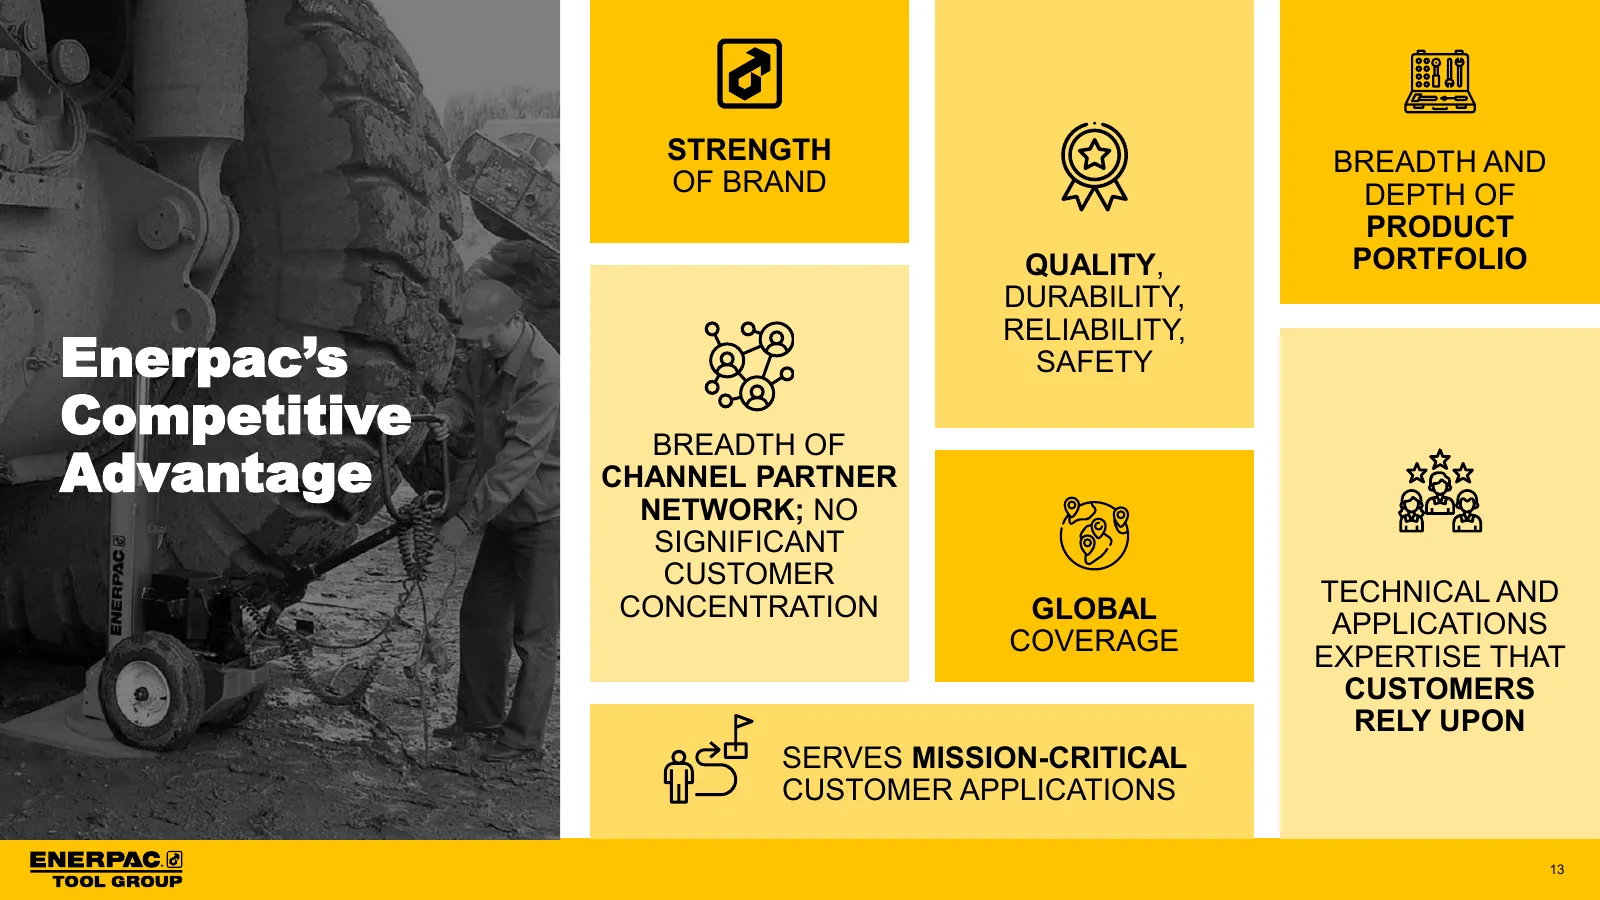
STRENGTH BREADTH AND OF BRAND DEPTH OF PRODUCT QUALITY, PORTFOLIO DURABILITY, RELIABILITY, Enerpac’s SAFETY Competitive BREADTH OF Advantage CHANNEL PARTNER NETWORK; NO SIGNIFICANT CUSTOMER TECHNICAL AND CONCENTRATION GLOBAL APPLICATIONS COVERAGE EXPERTISE THAT CUSTOMERS RELY UPON SERVES MISSION-CRI
Slide 14: Taking Enerpac to the Next Level of Growth & Profitability
Taking Enerpac to the Next Level of Growth & Profitability 14
Slide 15: Significant Market Opportunity
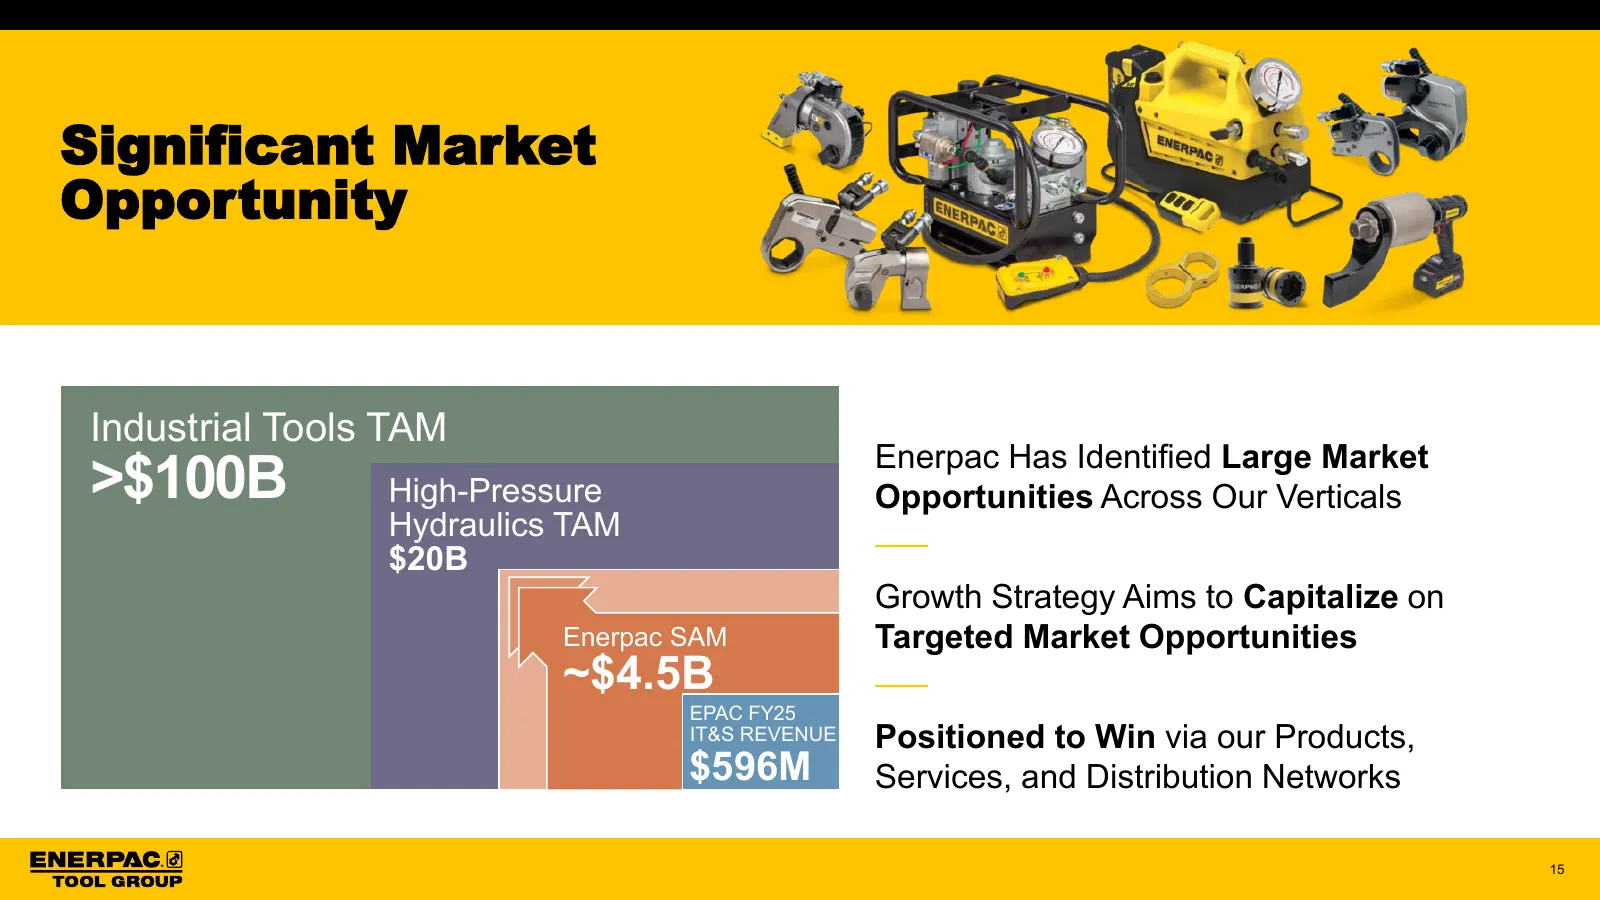
Significant Market Opportunity Industrial Tools TAM Enerpac Has Identified Large Market >$100B High-Pressure Opportunities Across Our Verticals Hydraulics TAM $20B Growth Strategy Aims to Capitalize on Enerpac SAM Targeted Market Opportunities ~$4.5B EPAC FY25 IT&S REVENUE Positioned to Win via our
Slide 16: Ambitious Growth Strategy Centered Around Four Key Pillars
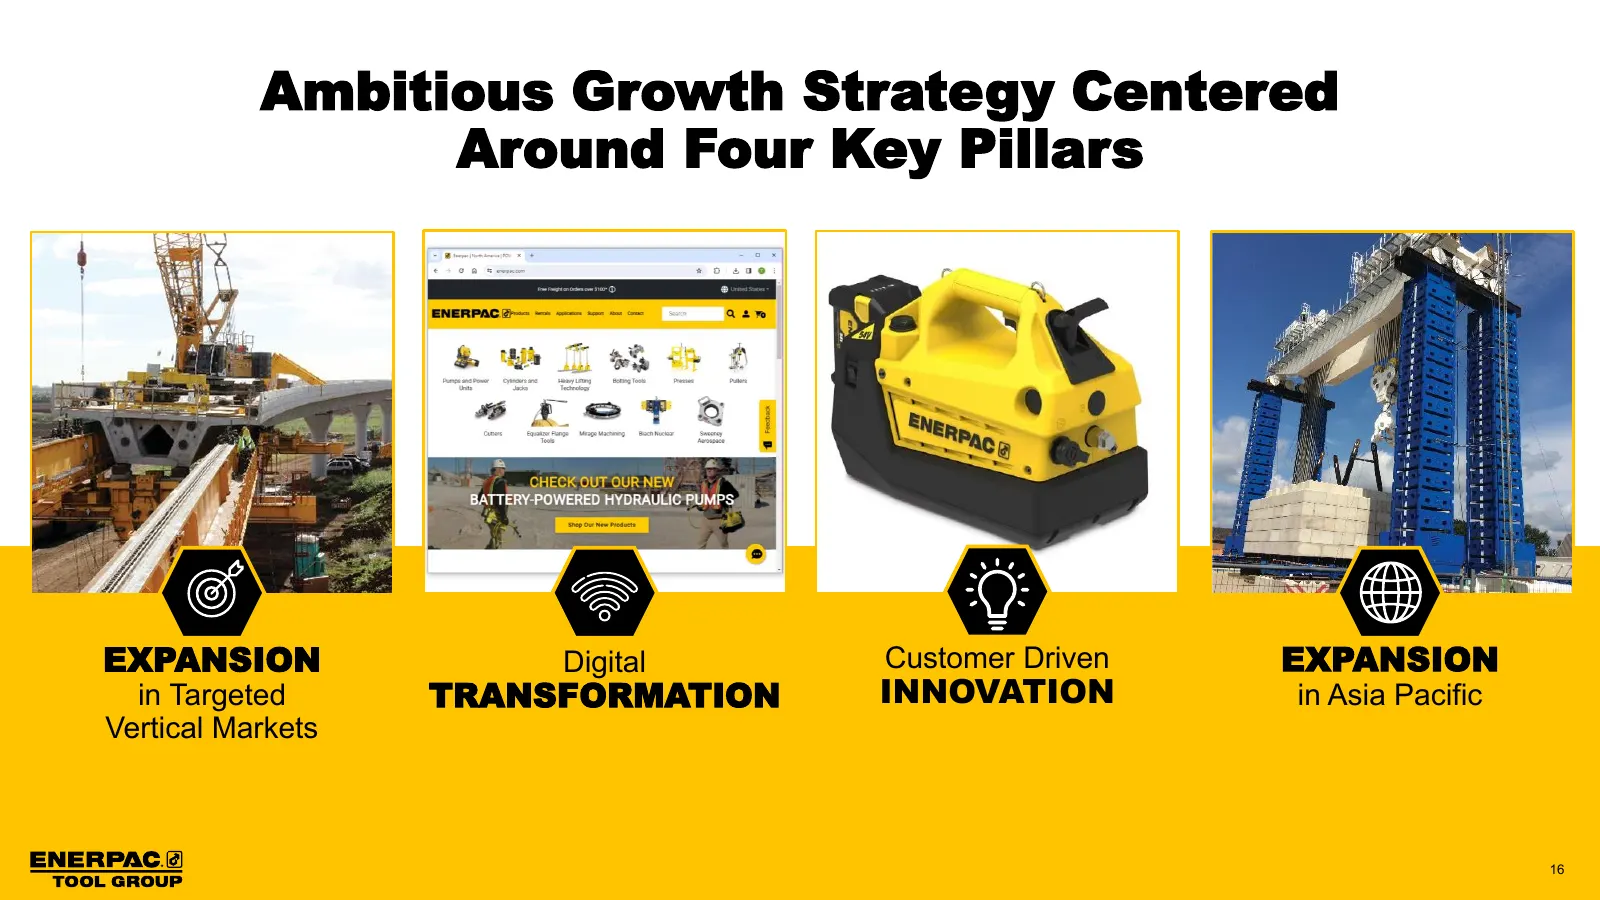
Ambitious Growth Strategy Centered Around Four Key Pillars EXPANSION Digital Customer Driven EXPANSION in Targeted TRANSFORMATION INNOVATION in Asia Pacific Vertical Markets 16
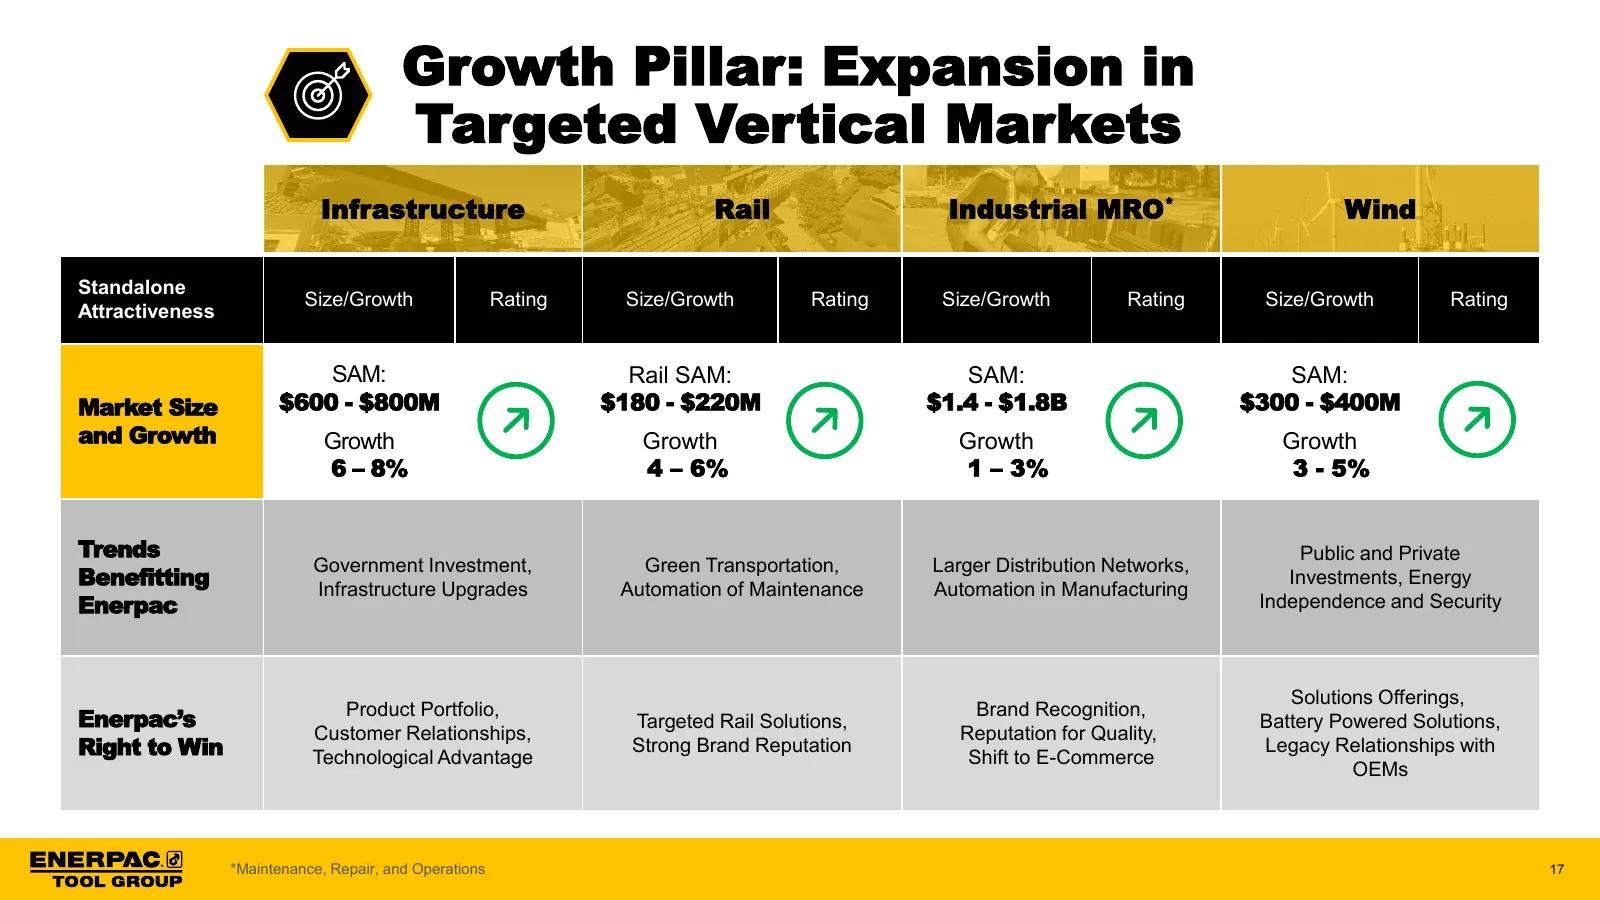
Slide 17: Growth Pillar: Expansion in Targeted Vertical Markets
Growth Pillar: Expansion in Targeted Vertical Markets Infrastructure Rail Industrial MRO* Wind Standalone Size/Growth Rating Size/Growth Rating Size/Growth Rating Size/Growth Rating Attractiveness SAM: Rail SAM: SAM: SAM: Market Size $600 - $800M $180 - $220M $1.4 - $1.8B $300 - $400M and Growth Gro
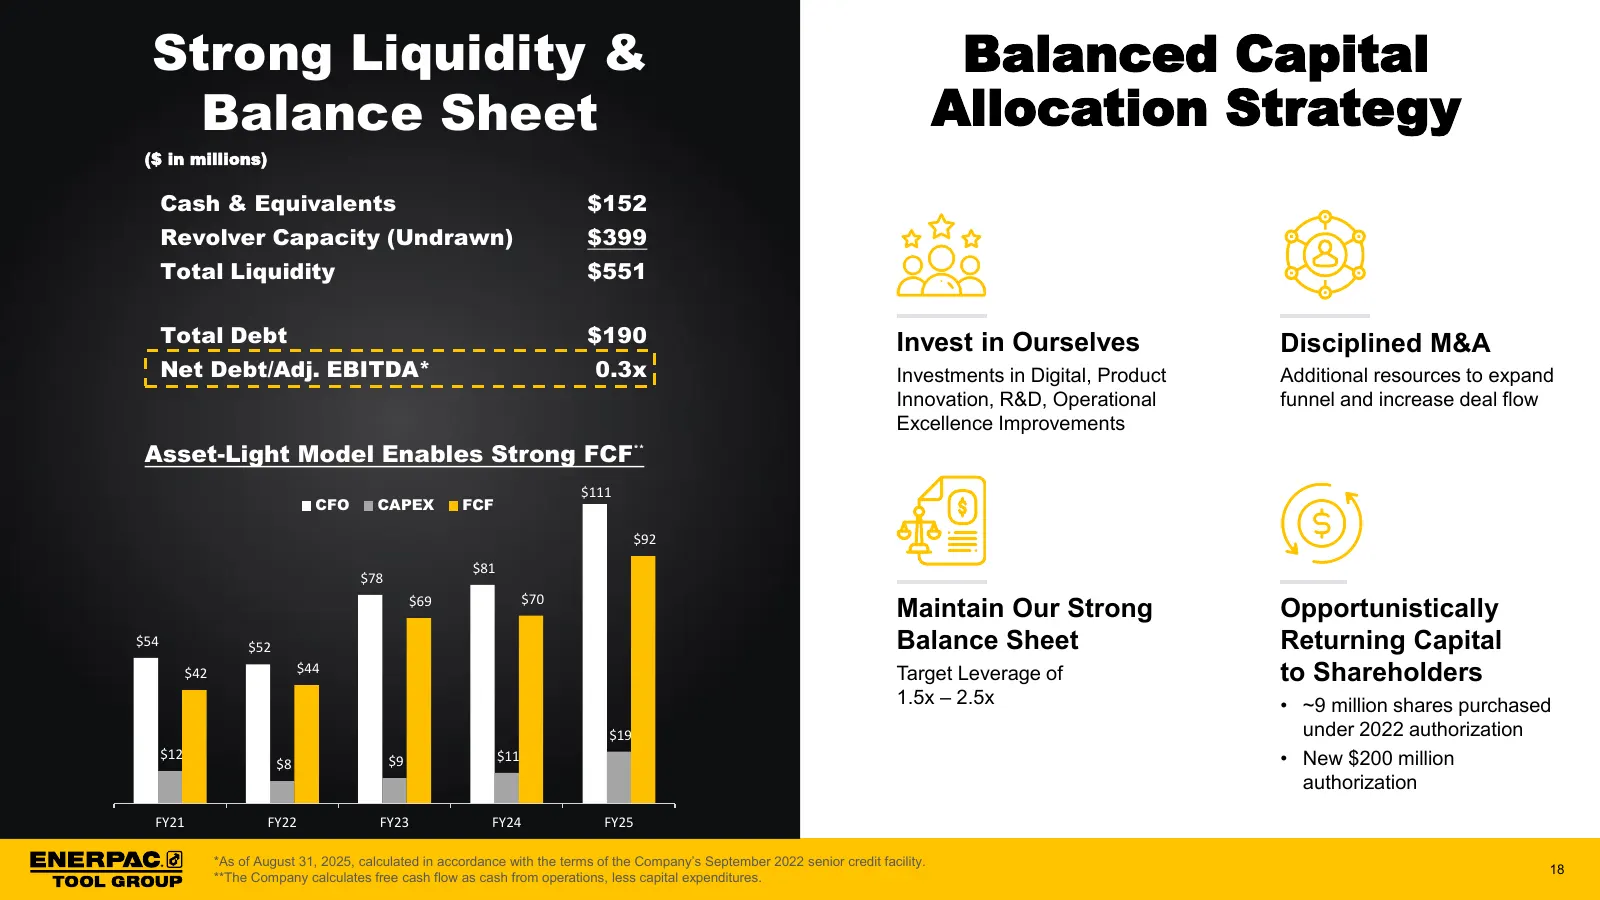
Slide 18: Strong Liquidity & Balance Sheet; Balanced Capital Allocation Strategy
Strong Liquidity & Balanced Capital Balance Sheet Allocation Strategy ($ in millions) Cash & Equivalents $152 Revolver Capacity (Undrawn) $399 Total Liquidity $551 Total Debt $190 Invest in Ourselves Disciplined M&A Net Debt/Adj. EBITDA* 0.3x Investments in Digital, Product Additional resources to e
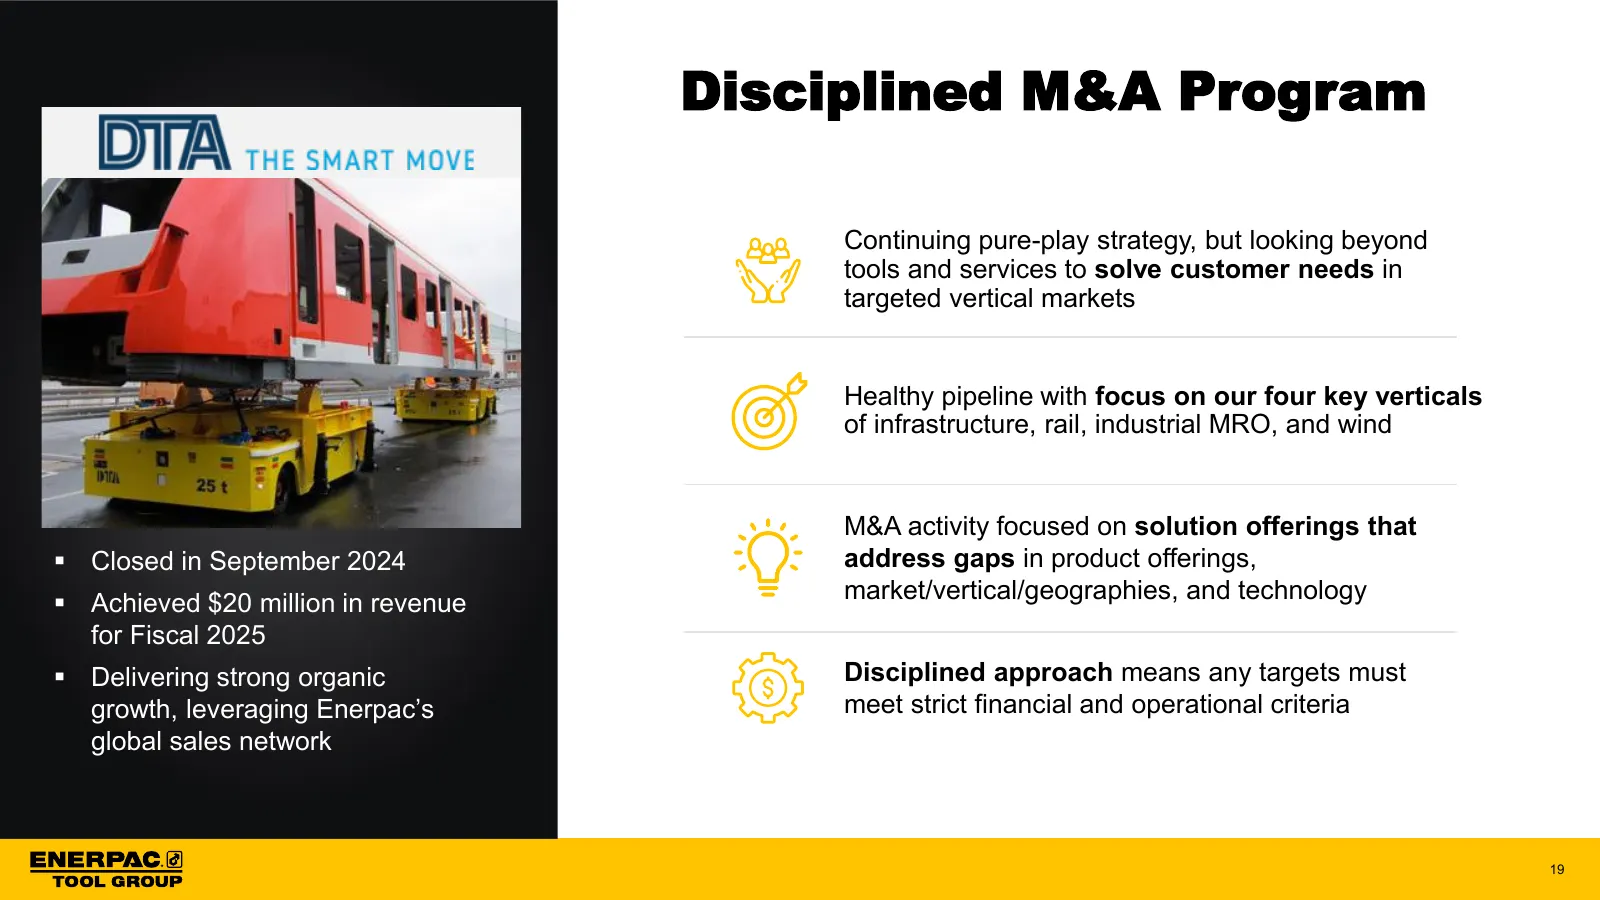
Slide 19: Disciplined M&A Program
Disciplined M&A Program Continuing pure-play strategy, but looking beyond tools and services to solve customer needs in targeted vertical markets Healthy pipeline with focus on our four key verticals of infrastructure, rail, industrial MRO, and wind M&A activity focused on solution offerings that ▪
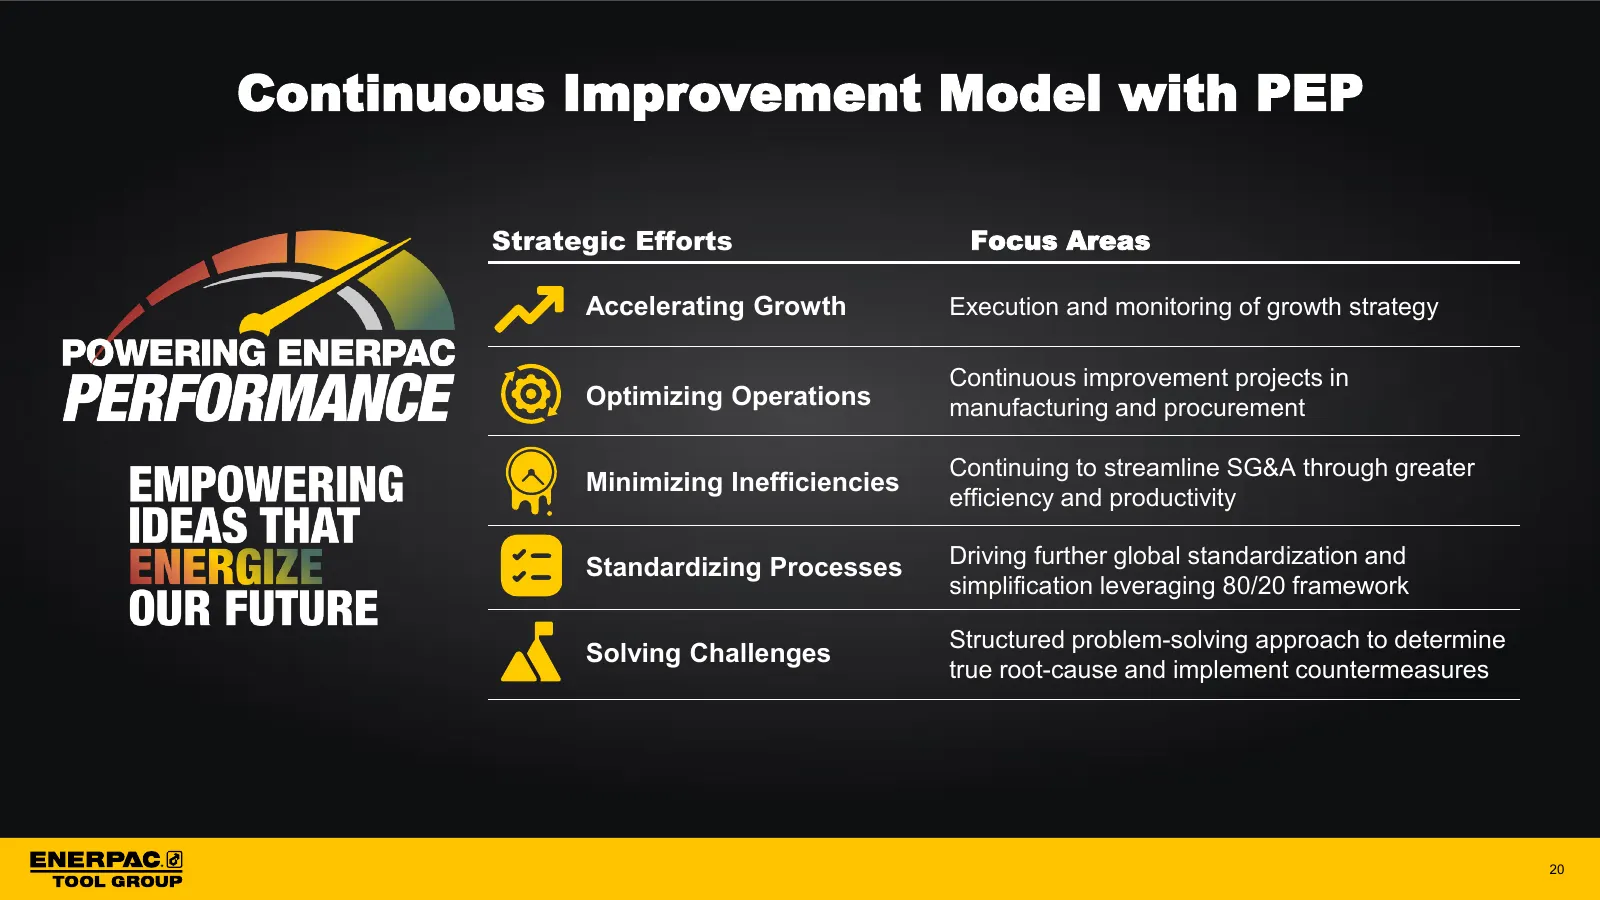
Slide 20: Continuous Improvement Model with PEP
Continuous Improvement Model with PEP Strategic Efforts Focus Areas Accelerating Growth Execution and monitoring of growth strategy Continuous improvement projects in Optimizing Operations manufacturing and procurement Continuing to streamline SG&A through greater Minimizing Inefficiencies efficienc
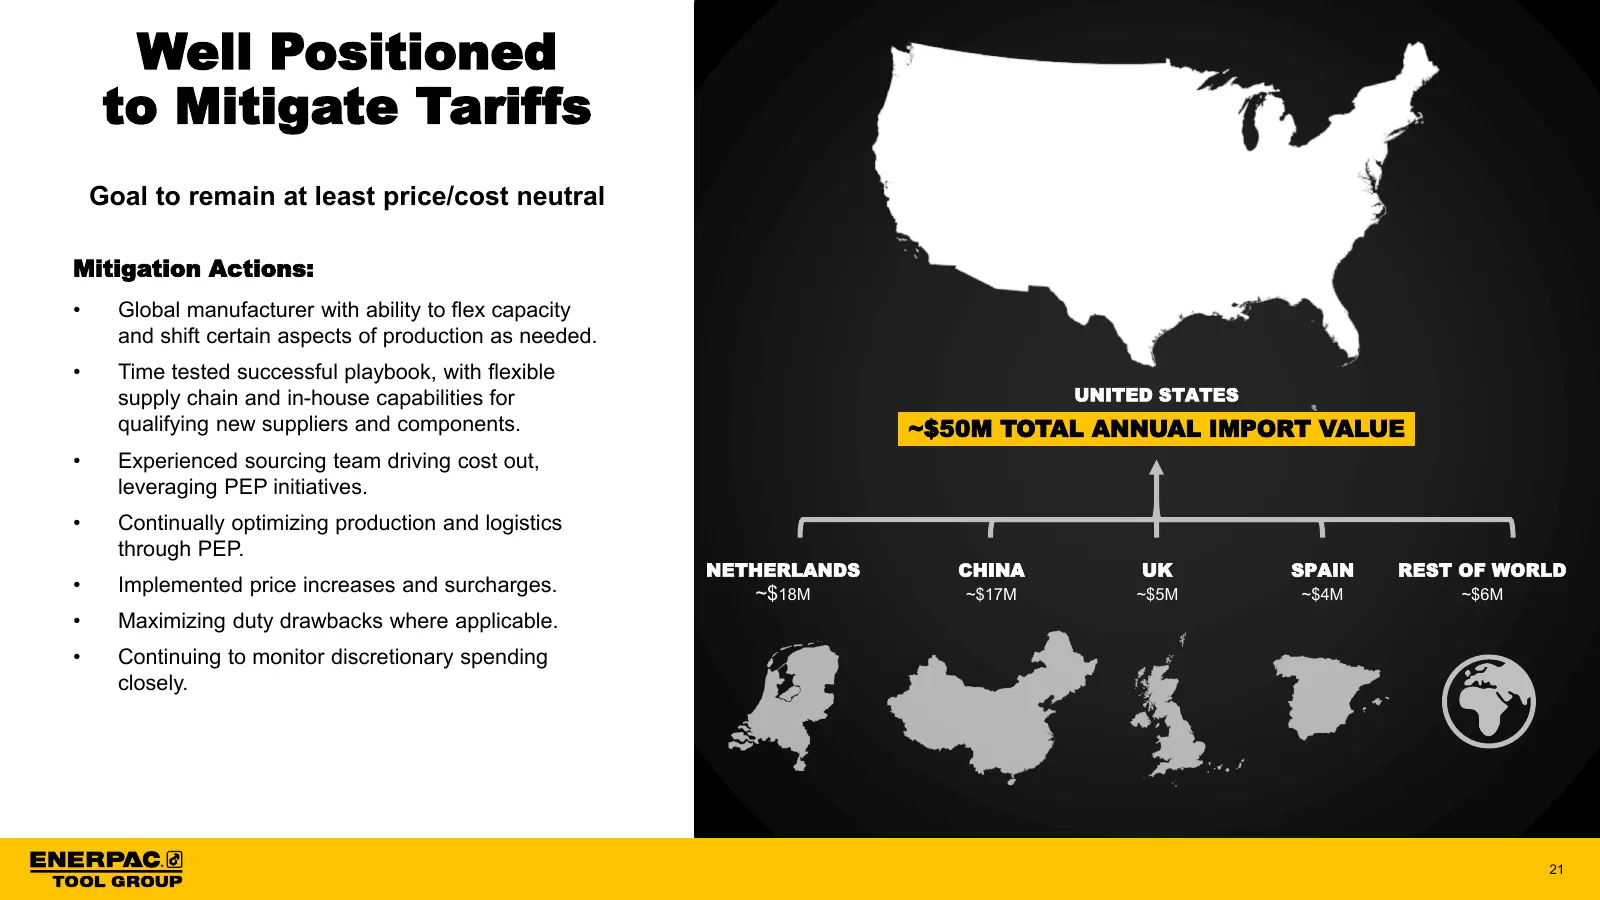
Slide 21: Well Positioned to Mitigate Tariffs
Well Positioned to Mitigate Tariffs Goal to remain at least price/cost neutral Mitigation Actions: • Global manufacturer with ability to flex capacity and shift certain aspects of production as needed. • Time tested successful playbook, with flexible supply chain and in-house capabilities for UNITED
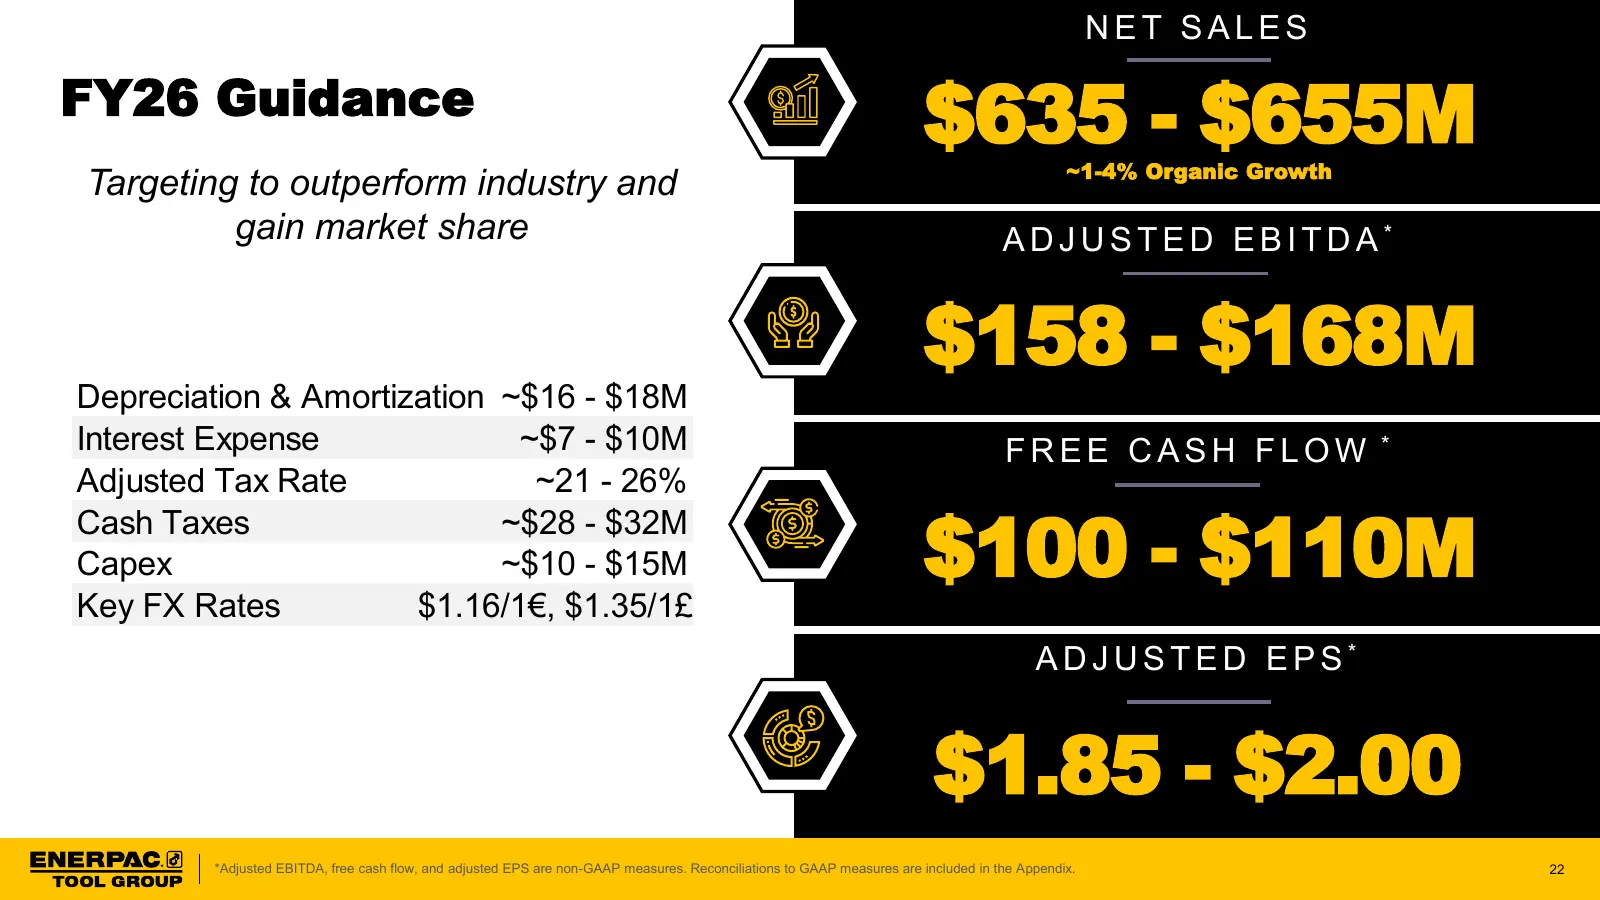
Slide 22: FY26 Guidance
NET SALES FY26 Guidance $635 - $655M ~1-4% Organic Growth Targeting to outperform industry and gain market share ADJUSTED EBITDA* $158 - $168M Depreciation & Amortization ~$16 - $18M Interest Expense ~$7 - $10M FREE CASH FLOW * Adjusted Tax Rate ~21 - 26% $100 - $110M Cash Taxes ~$28 - $32M Capex ~$
Slide 23: Appendix
Appendix ENERPAC @) TOOL GROUP
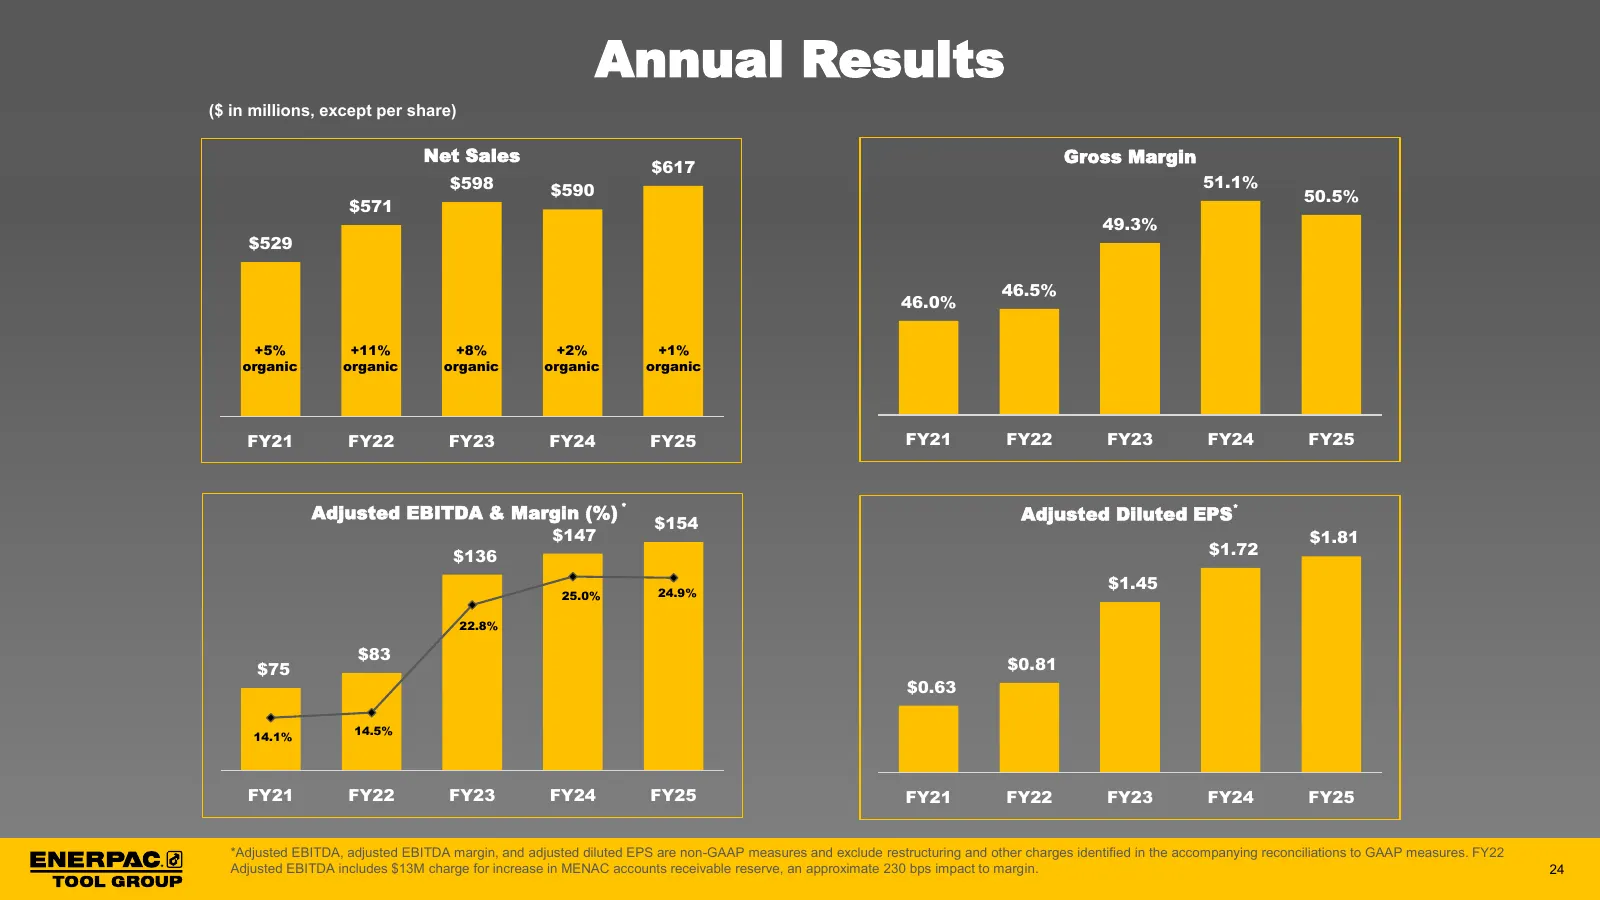
Slide 24: Annual Results
Annual Results ($ in millions, except per share) Net Sales Gross Margin $617 $598 51.1% $590 50.5% $571 49.3% $529 46.5% 46.0% +5% +11% +8% +2% +1% organic organic organic organic organic FY21 FY22 FY23 FY24 FY25 FY21 FY22 FY23 FY24 FY25 Adjusted EBITDA & Margin (%) * Adjusted Diluted EPS* $154 $147
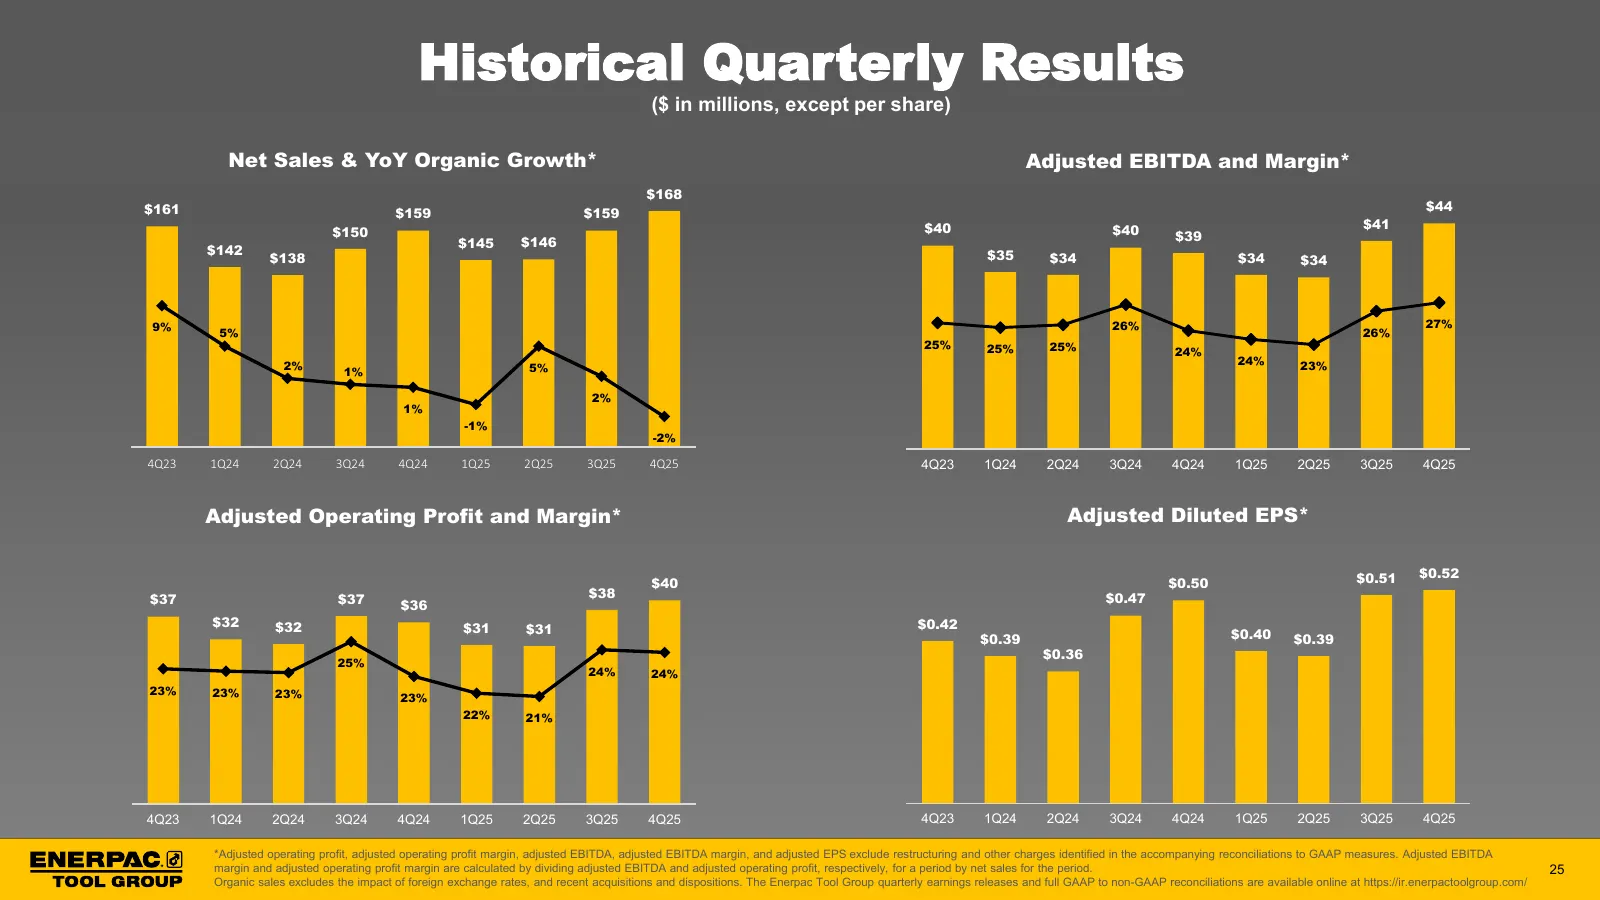
Slide 25: Historical Quarterly Results
Historical Quarterly Results ($ in millions, except per share) Net Sales & YoY Organic Growth* Adjusted EBITDA and Margin* $168 $161 $44 $159 $159 $40 $41 $150 $40 $39 $145 $146 $142 $35 $138 $34 $34 $34 9% 26% 27% 5% 26% 25% 25% 25% 24% 2% 24% 23% 1% 5% 2% 1% -1% -2% 4Q23 1Q24 2Q24 3Q24 4Q24 1Q25 2
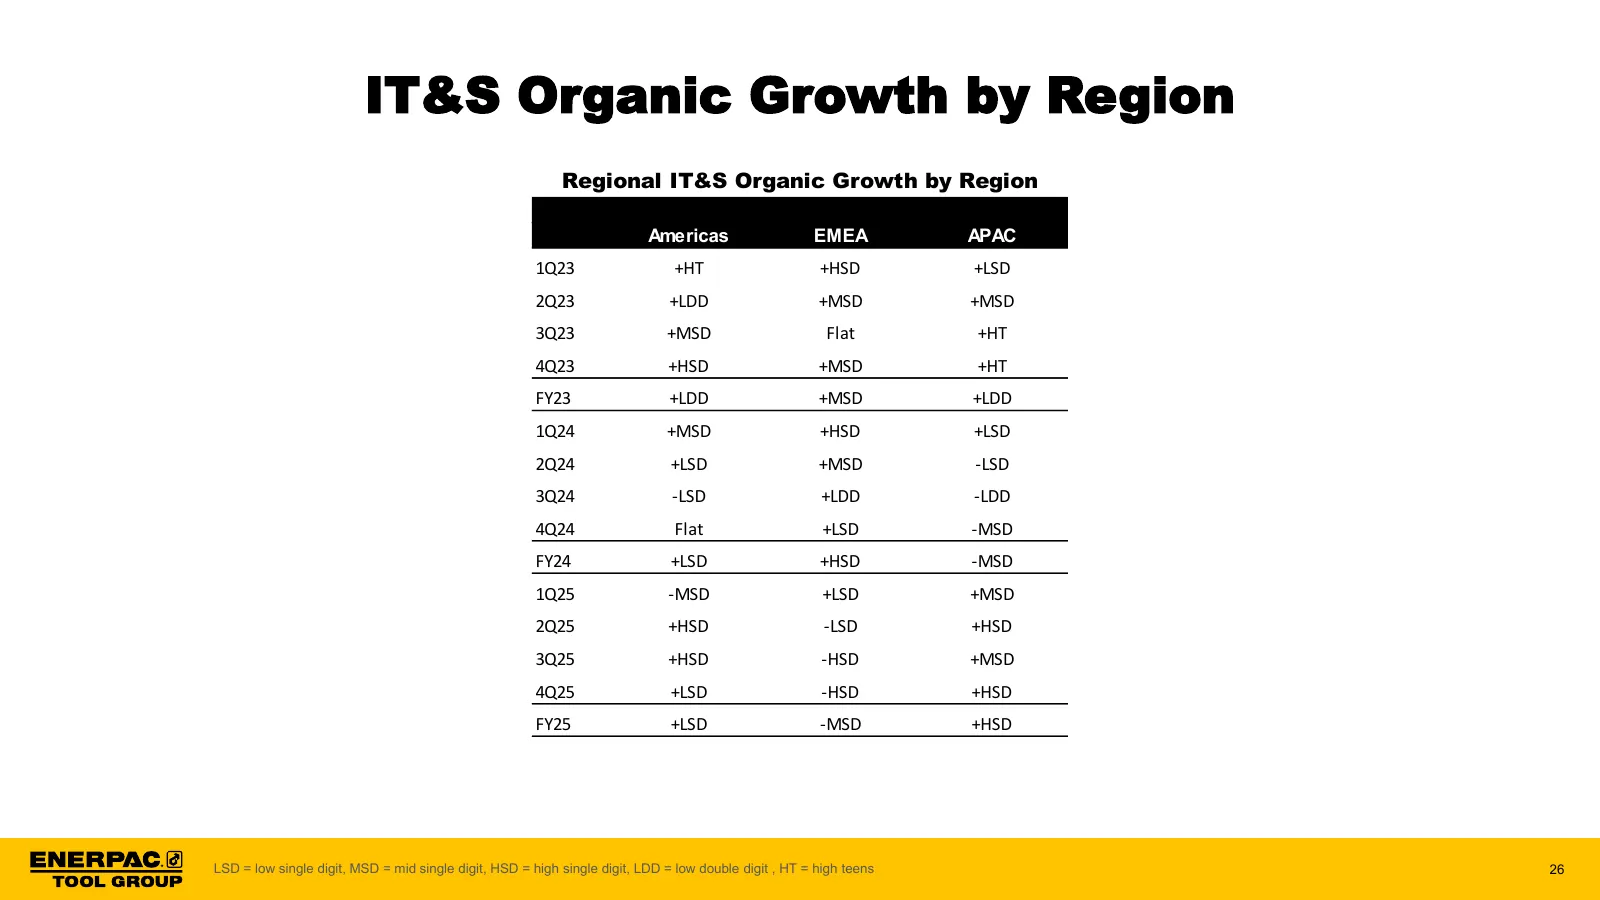
Slide 26: IT&S Organic Growth by Region
IT&S Organic Growth by Region Regional IT&S Organic Growth by Region Americas EMEA APAC 1Q23 +HT +HSD +LSD 2Q23 +LDD +MSD +MSD 3Q23 +MSD Flat +HT 4Q23 +HSD +MSD +HT FY23 +LDD +MSD +LDD 1Q24 +MSD +HSD +LSD 2Q24 +LSD +MSD -LSD 3Q24 -LSD +LDD -LDD 4Q24 Flat +LSD -MSD FY24 +LSD +HSD -MSD 1Q25 -MSD +LSD
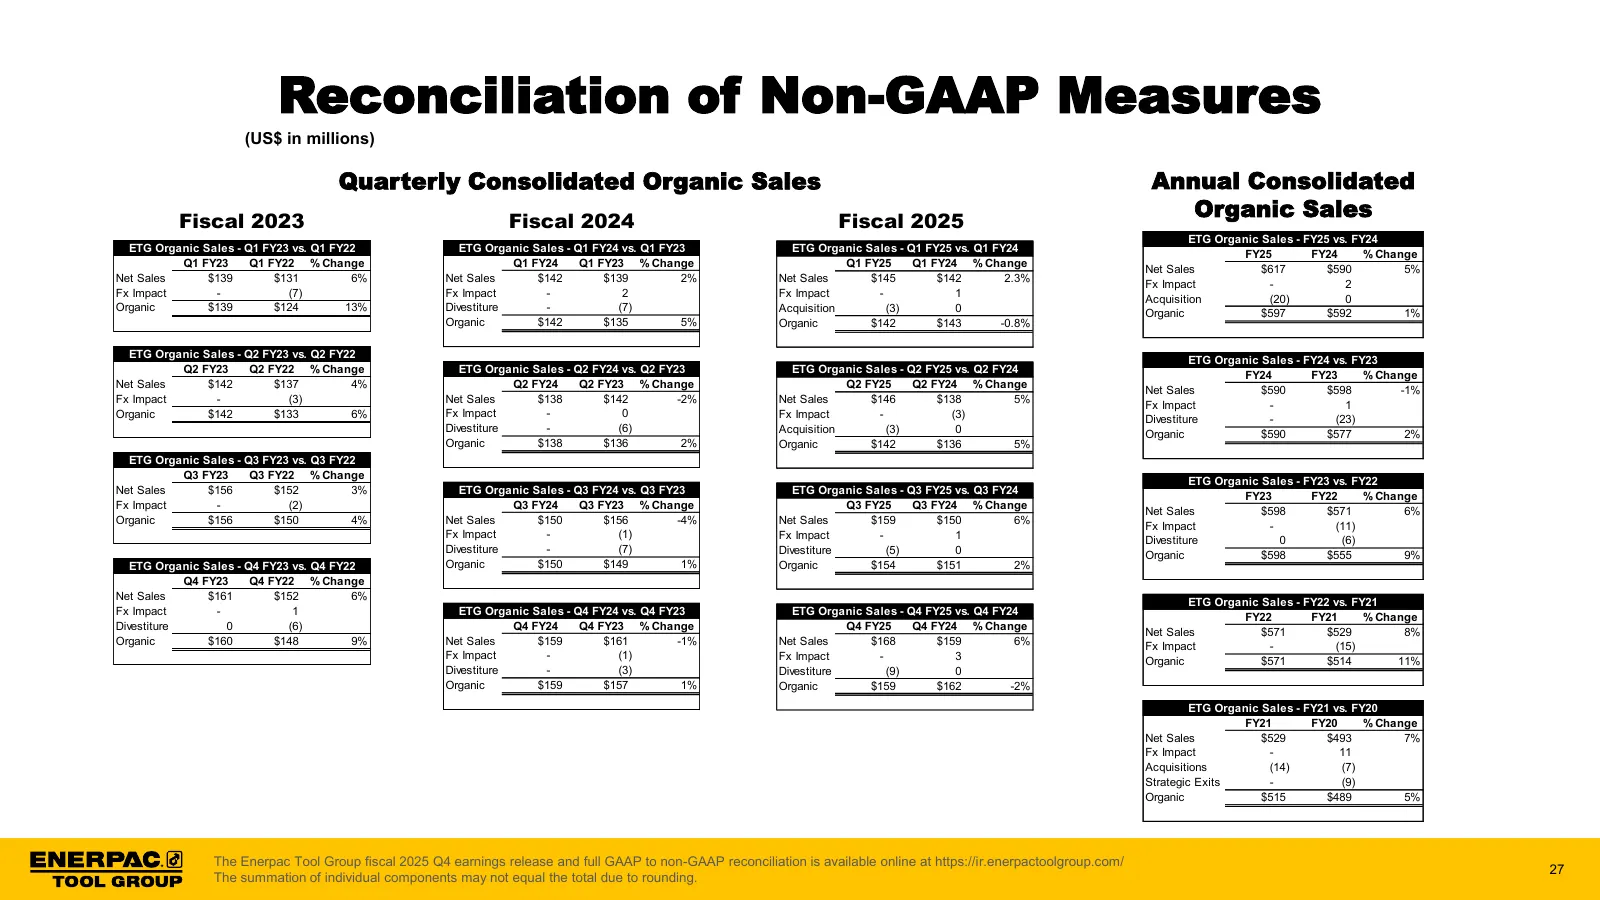
Slide 27: Reconciliation of Non-GAAP Measures
Reconciliation of Non-GAAP Measures (US$ in millions) Quarterly Consolidated Organic Sales Annual Consolidated Fiscal 2023 Fiscal 2024 Fiscal 2025 Organic Sales ETG Organic Sales - FY25 vs. FY24 ETG Organic Sales - Q1 FY23 vs. Q1 FY22 ETG Organic Sales - Q1 FY24 vs. Q1 FY23 ETG Organic Sales - Q1 FY
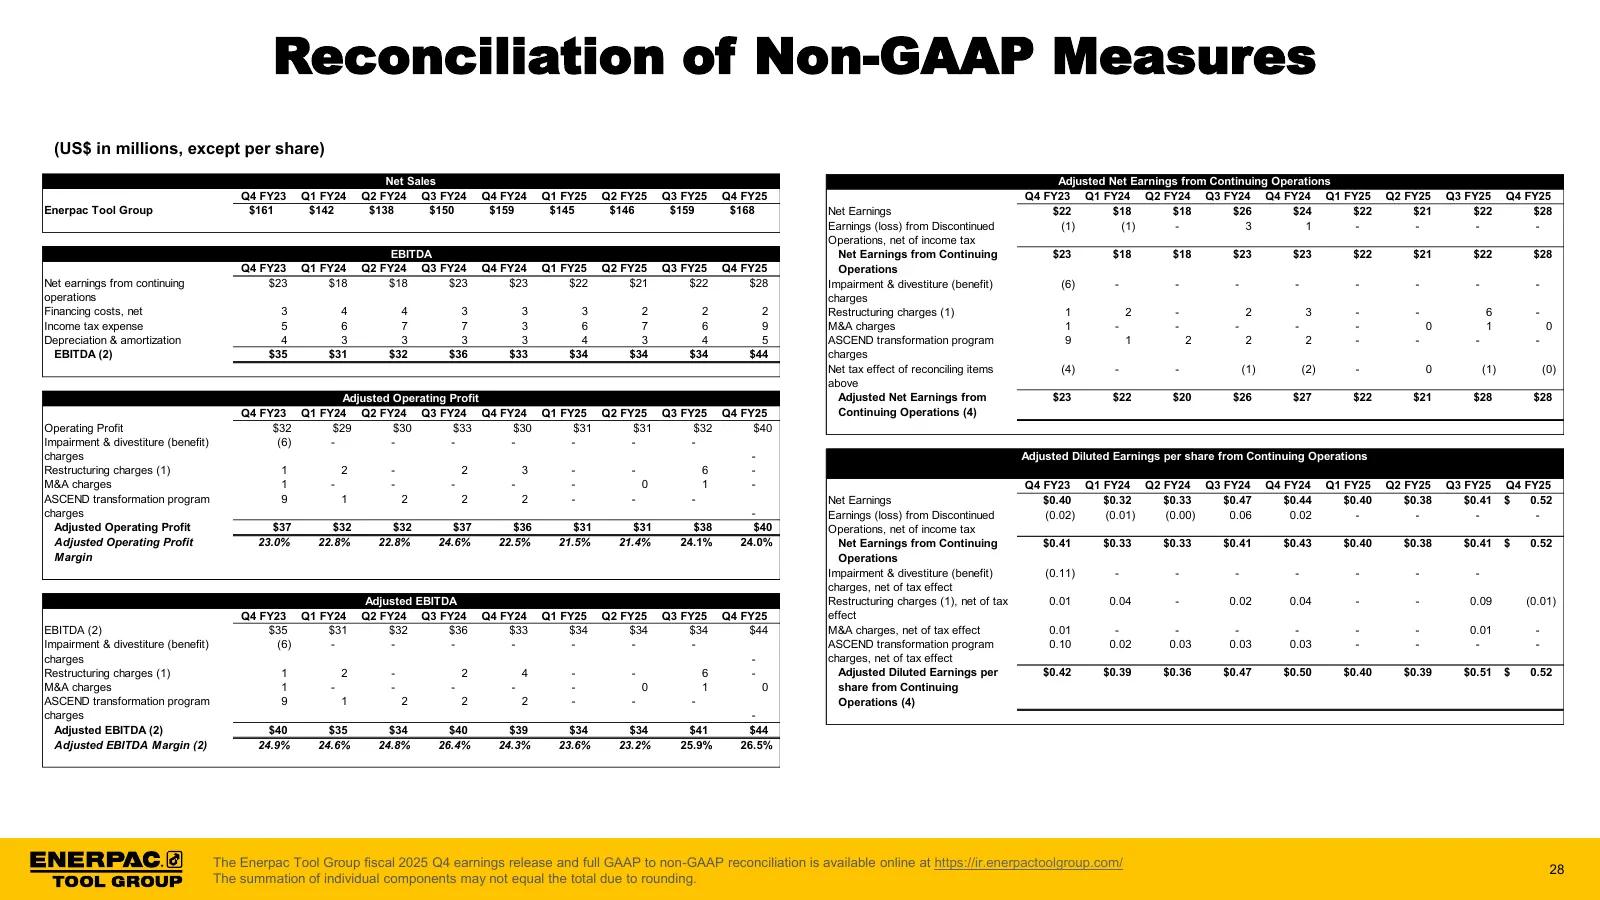
Slide 28: Reconciliation of Non-GAAP Measures
Reconciliation of Non-GAAP Measures (US$ in millions, except per share) Net Sales Adjusted Net Earnings from Continuing Operations Q4 FY23 Q1 FY24 Q2 FY24 Q3 FY24 Q4 FY24 Q1 FY25 Q2 FY25 Q3 FY25 Q4 FY25 Q4 FY23 Q1 FY24 Q2 FY24 Q3 FY24 Q4 FY24 Q1 FY25 Q2 FY25 Q3 FY25 Q4 FY25 Enerpac Tool Group $161 $
Slide 29: Reconciliation of Non-GAAP Measures
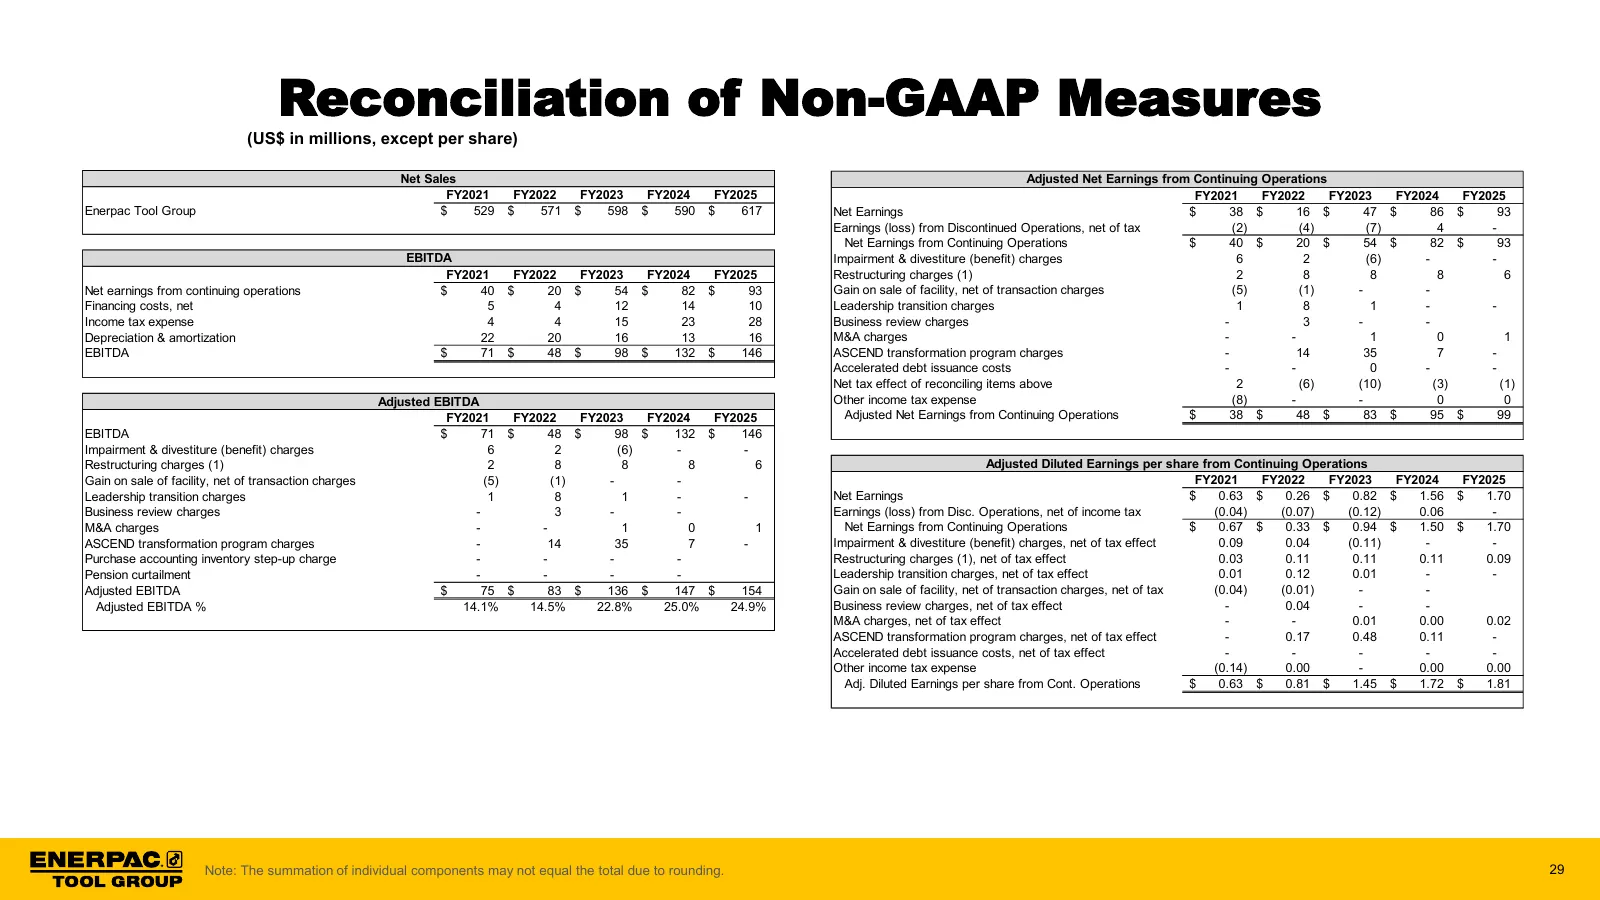
Reconciliation of Non-GAAP Measures (US$ in millions, except per share) Net Sales Adjusted Net Earnings from Continuing Operations FY2021 FY2022 FY2023 FY2024 FY2025 FY2021 FY2022 FY2023 FY2024 FY2025 Enerpac Tool Group $ 529 $ 571 $ 598 $ 590 $ 617 Net Earnings $ 38 $ 16 $ 47 $ 86 $ 93 Earnings (lo
Slide 30: Reconciliation of Non-GAAP Measures
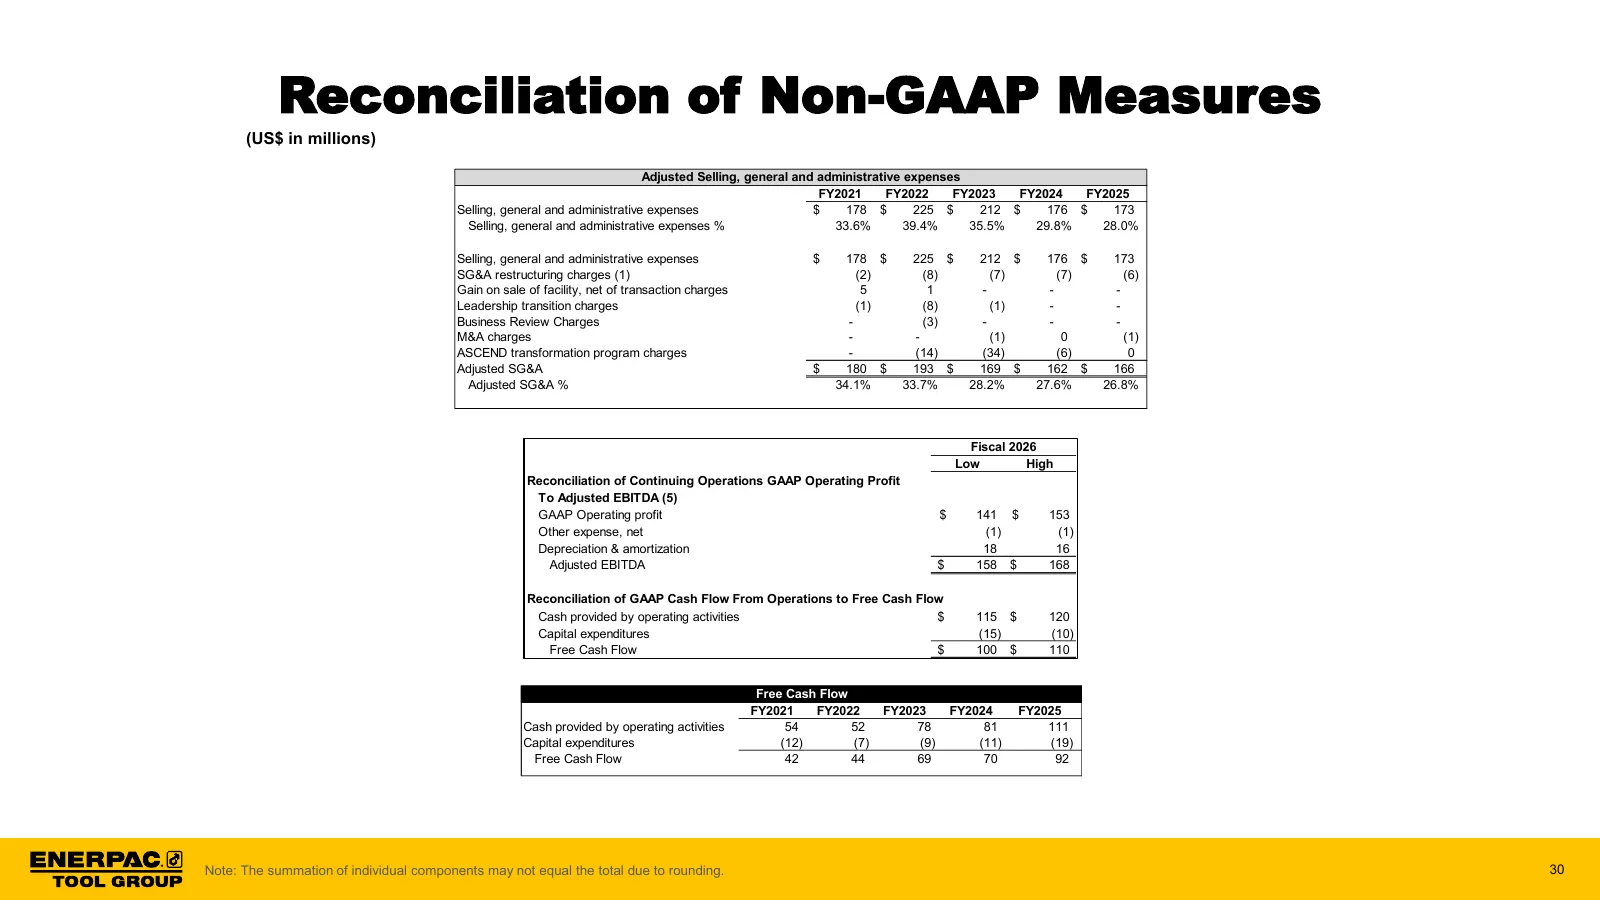
Reconciliation of Non-GAAP Measures (US$ in millions) Adjusted Selling, general and administrative expenses FY2021 FY2022 FY2023 FY2024 FY2025 Selling, general and administrative expenses $ 178 $ 225 $ 212 $ 176 $ 173 Selling, general and administrative expenses % 33.6% 39.4% 35.5% 29.8% 28.0% Selli
Slide 31: Reconciliation of Non-GAAP Measures
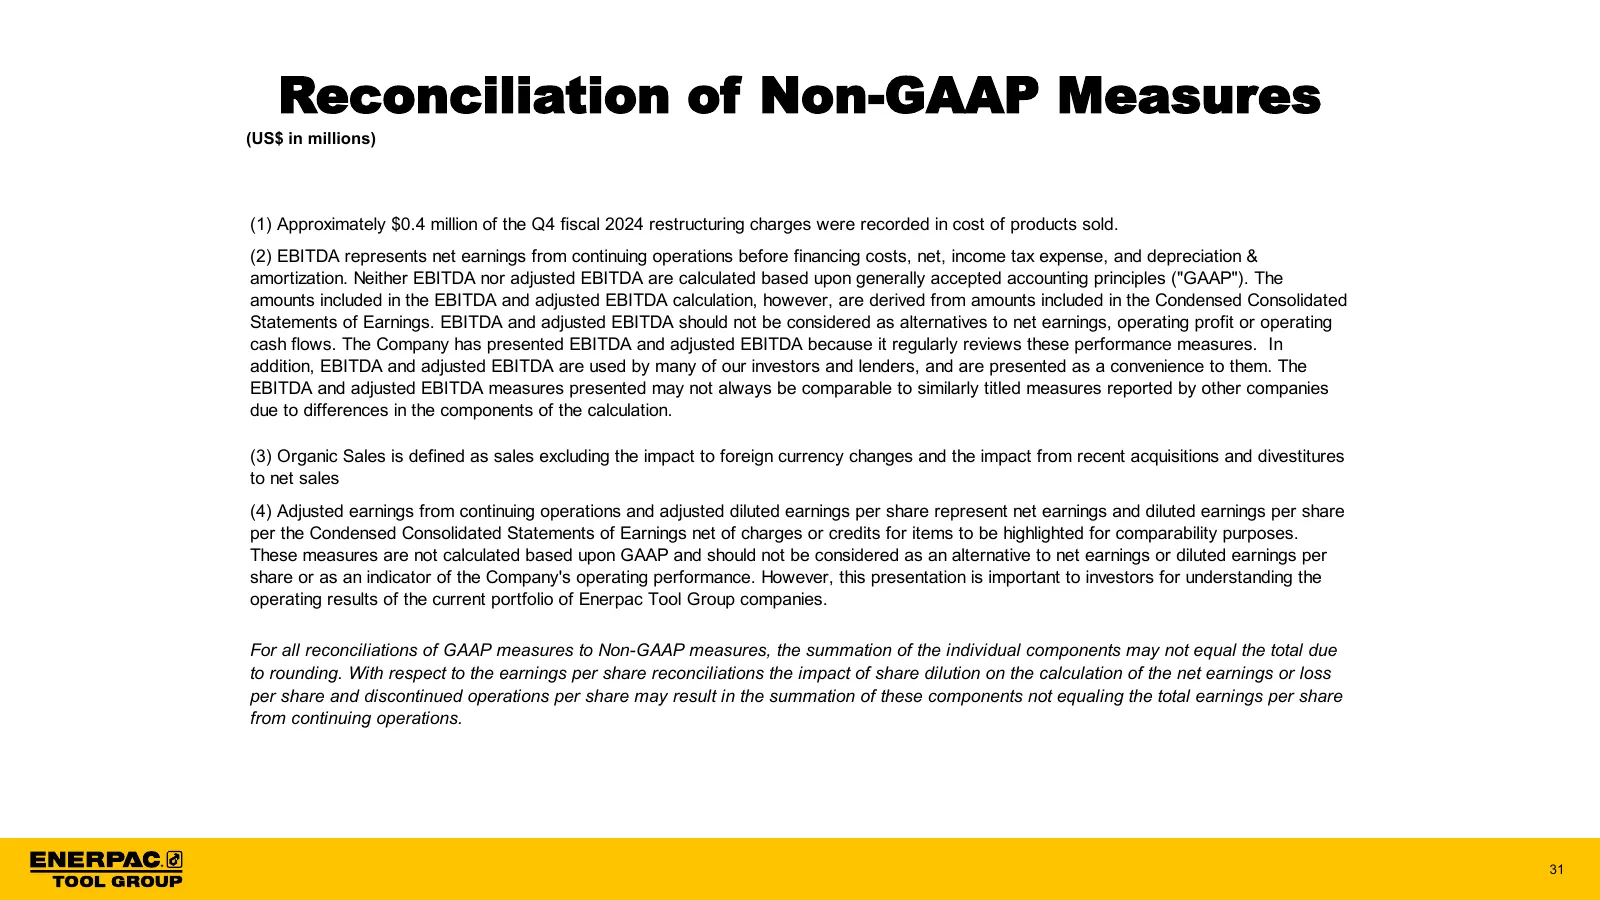
Reconciliation of Non-GAAP Measures (US$ in millions) (1) Approximately $0.4 million of the Q4 fiscal 2024 restructuring charges were recorded in cost of products sold. (2) EBITDA represents net earnings from continuing operations before financing costs, net, income tax expense, and depreciation & a
Source: Internet Archive copy of s203.q4cdn.com
More decks from Enerpac Tool Group Corp.
 Investor Day (November 2026)124 slides · Nov 4, 2026
 Q4 2026 Earnings Presentation24 slides · Oct 29, 2026
 Investor Presentation (September 2026)38 slides · September 2026
 Investor Presentation (August 2026)37 slides · August 2026
 Q3 2026 Earnings Presentation22 slides · Jul 8, 2026
 Investor Presentation (April 2026)34 slides · April 2026