Rexel SA · EURONEXT:RXL
Rexel SA — Investor Day (December 2010)
87 slides from Rexel SA's investor day presentation, Dec 2, 2010
Slide 1: Investor Day 2010
INVESTOR DAY 2010 London, December 2
Slide 2: Summary
Summary 1. Rexel UK: A turnaround story 2. Rexel Group: Improved fundamentals 3. Rexel Group: A profitable growth strategy

Slide 3: Rexel UK: a turnaround story
Rexel UK: 1 a turnaround story Henri-Paul LASHKAR, Senior VP UK & Ireland John HOGAN, Managing Director Newey & Eyre Brian SMITHERS, Managing Director WF Electrical

Slide 4: Welcome to Rexel UK
Welcome to Rexel UK Henri-Paul LASCHKAR Senior Vice President Rexel UK & Ireland
Slide 5: Rexel UK in 2010
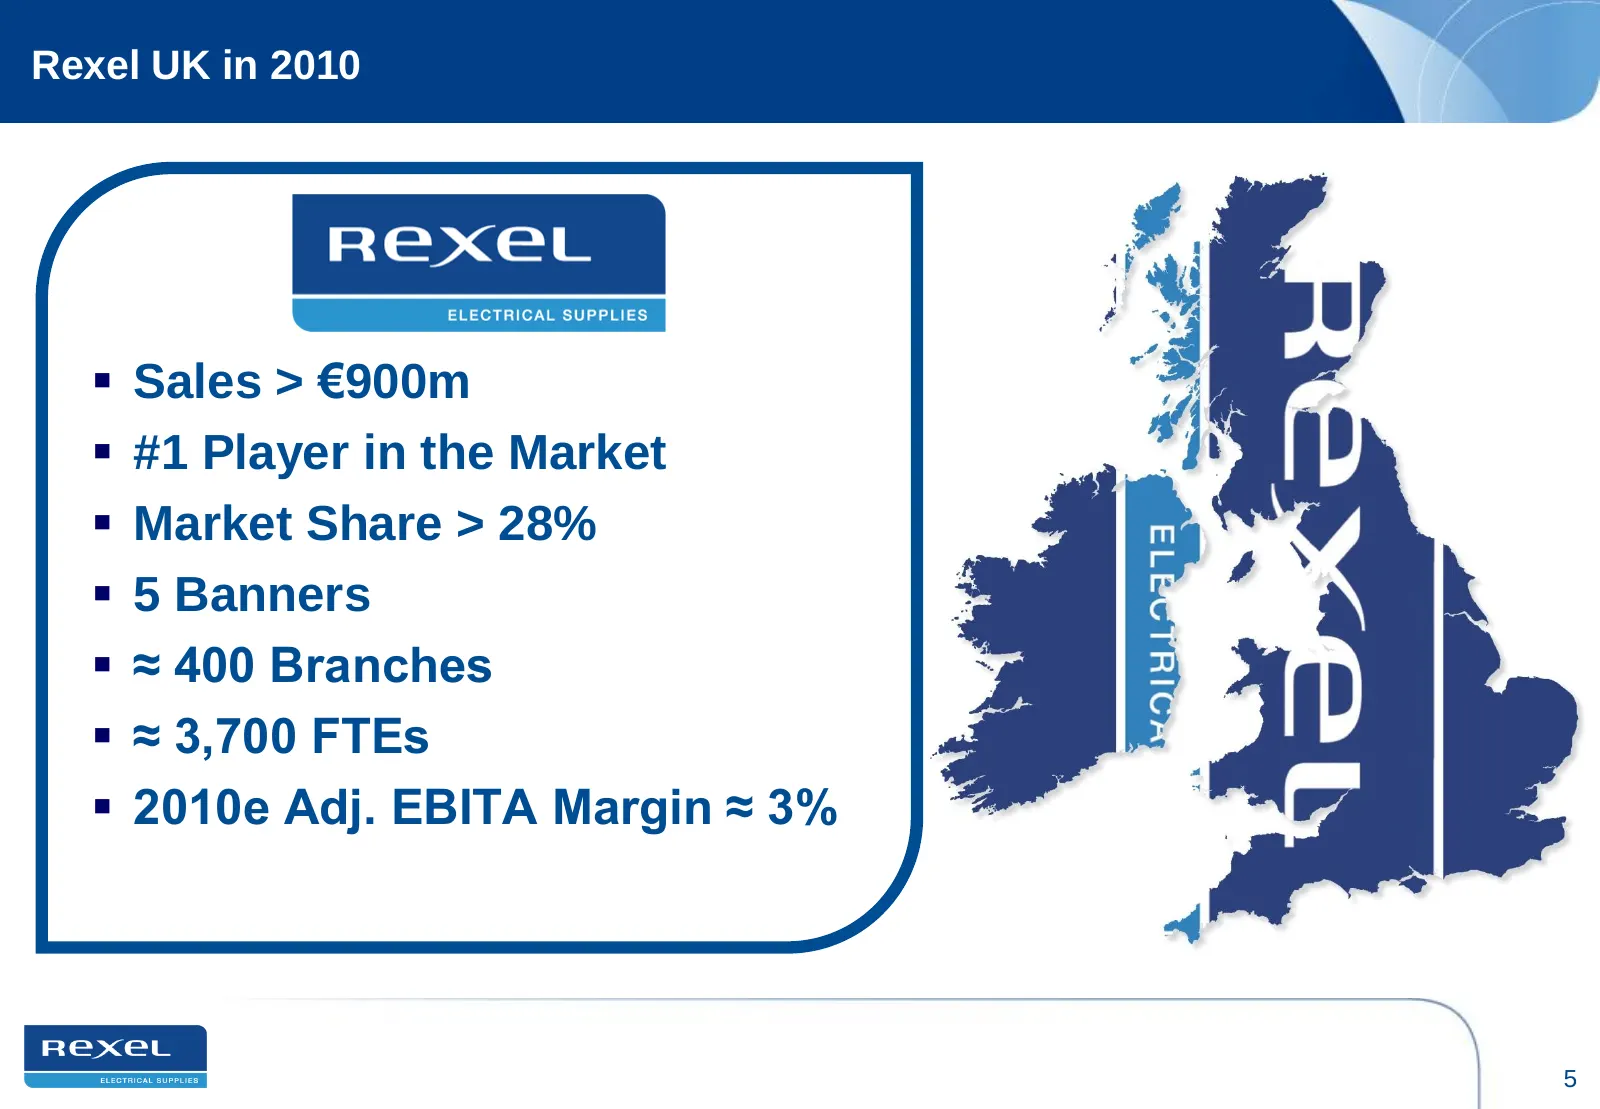
Rexel UK in 2010 Sales > €900m #1 Player in the Market Market Share > 28% 5 Banners ≈ 400 Branches ≈ 3,700 FTEs 2010e Adj. EBITA Margin ≈ 3% 5

Slide 6: Rexel UK 2008–2010: Creating a Leader
Rexel UK 2008–2010: Creating a Leader
Slide 7: Rexel and Hagemeyer in the UK Pre Acquisition
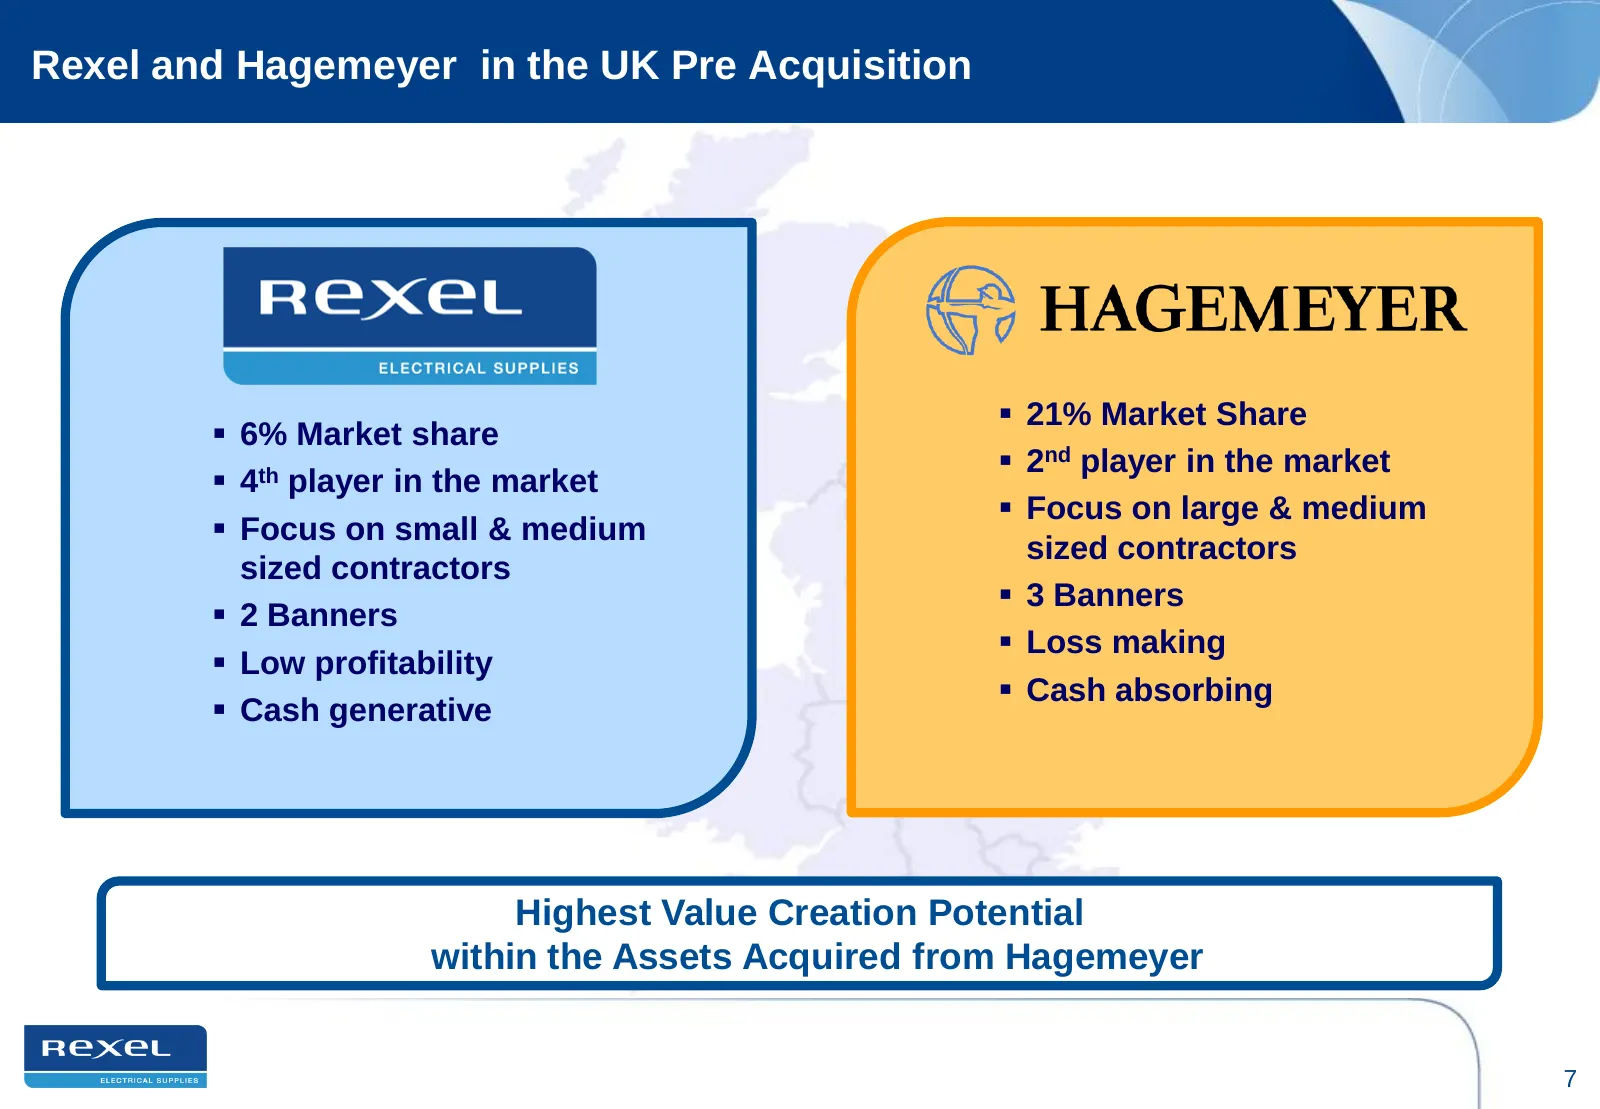
Rexel and Hagemeyer in the UK Pre Acquisition 21% Market Share 6% Market share 2nd player in the market 4th player in the market Focus on large & medium Focus on small & medium sized contractors sized contractors 3 Banners 2 Banners Loss making Low profitability Cash absorbing
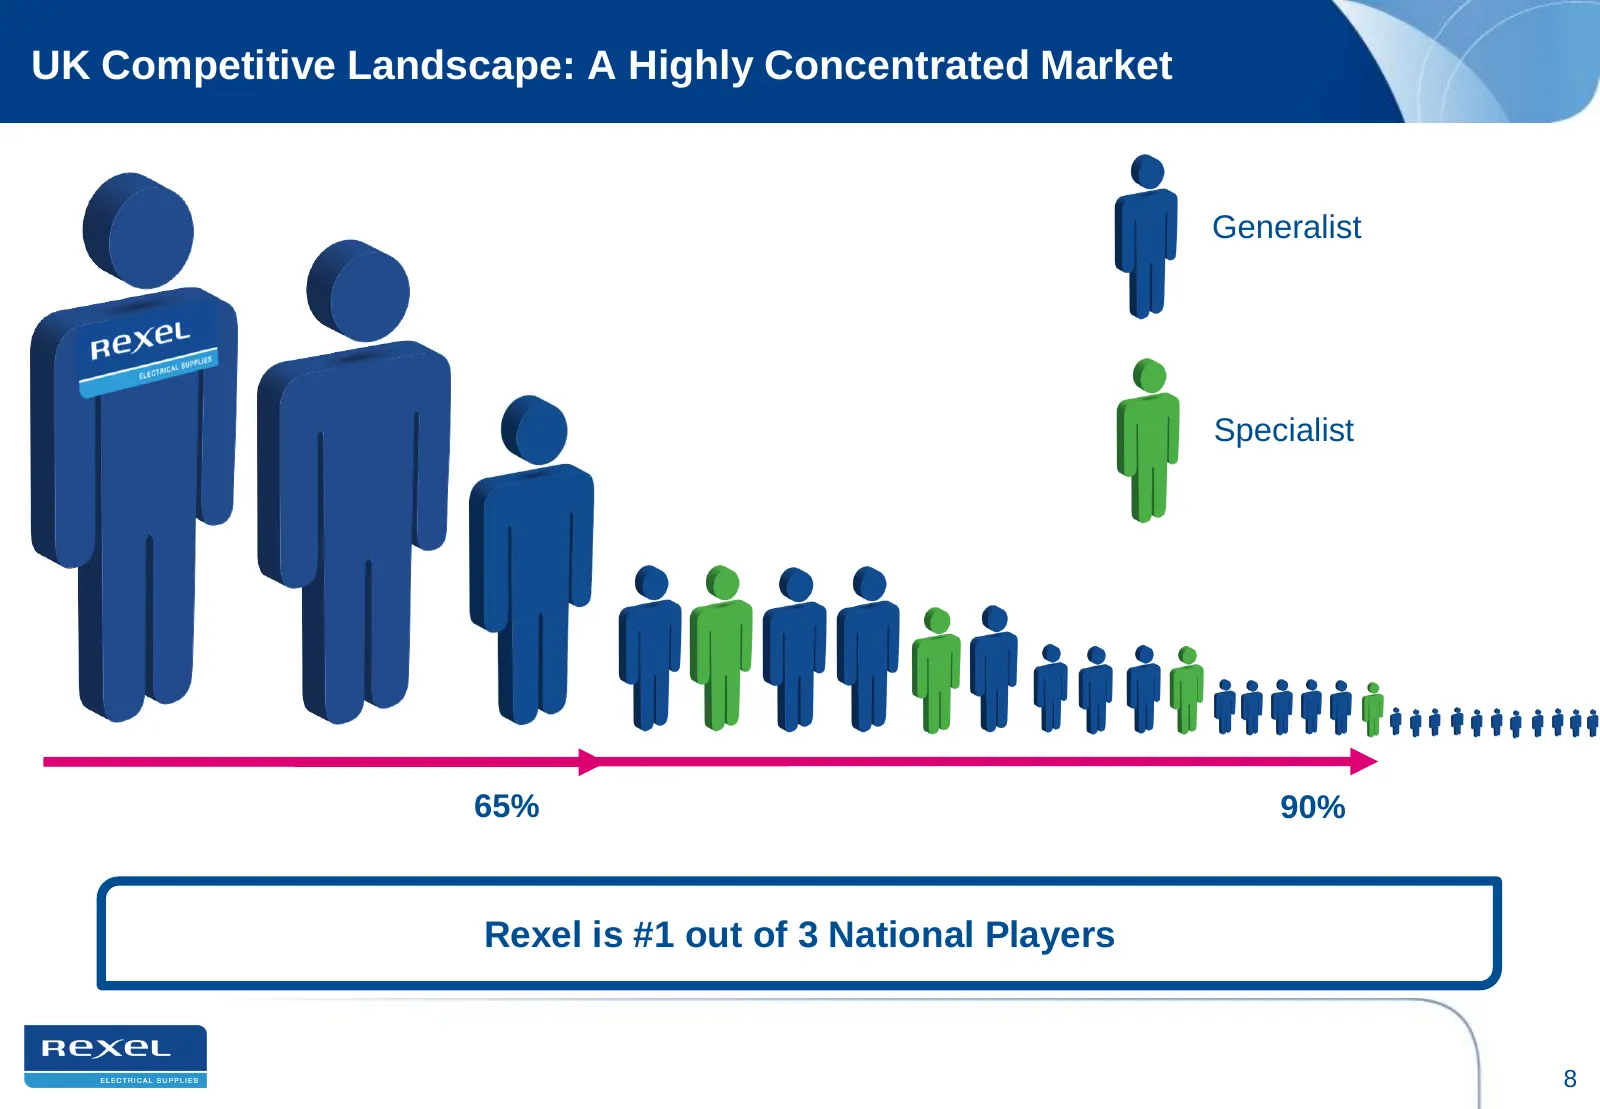
Slide 8: UK Competitive Landscape: A Highly Concentrated Market
UK Competitive Landscape: A Highly Concentrated Market Generalist Specialist 65% 90% Rexel is #1 out of 3 National Players 8
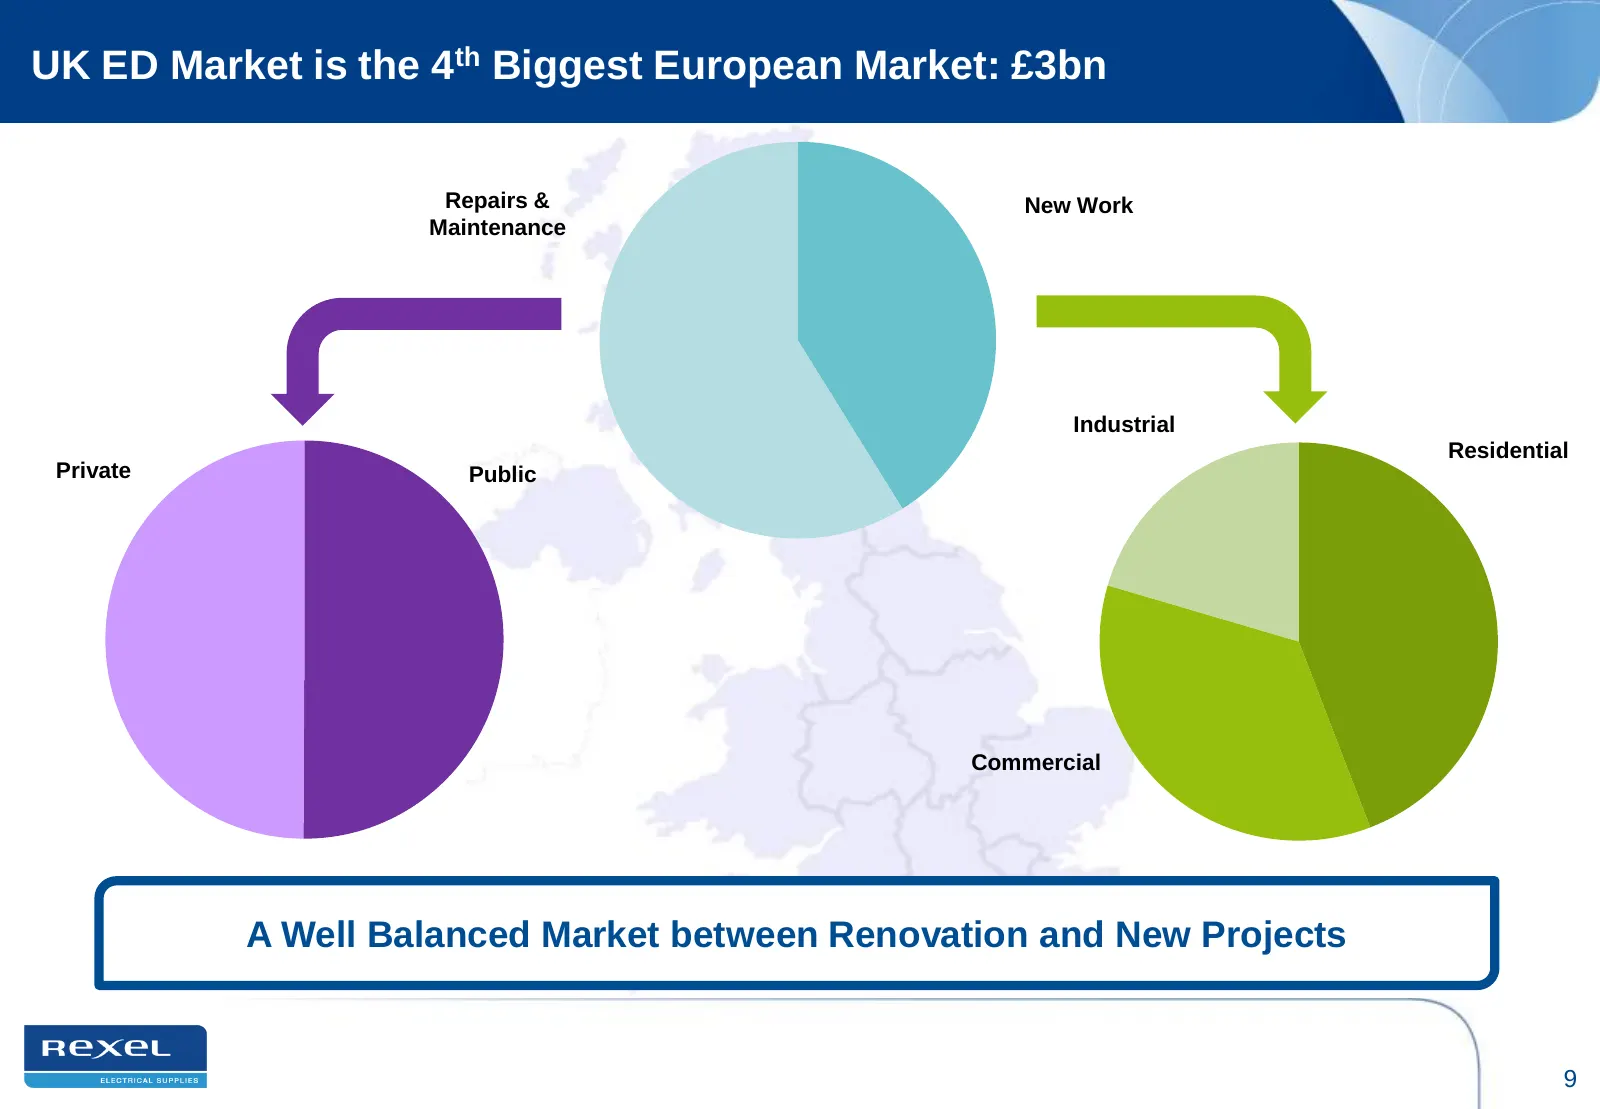
Slide 9: UK ED Market is the 4th Biggest European Market: £3bn
UK ED Market is the 4th Biggest European Market: £3bn Repairs & New Work Maintenance Industrial Residential Private Public Commercial A Well Balanced Market between Renovation and New Projects 9
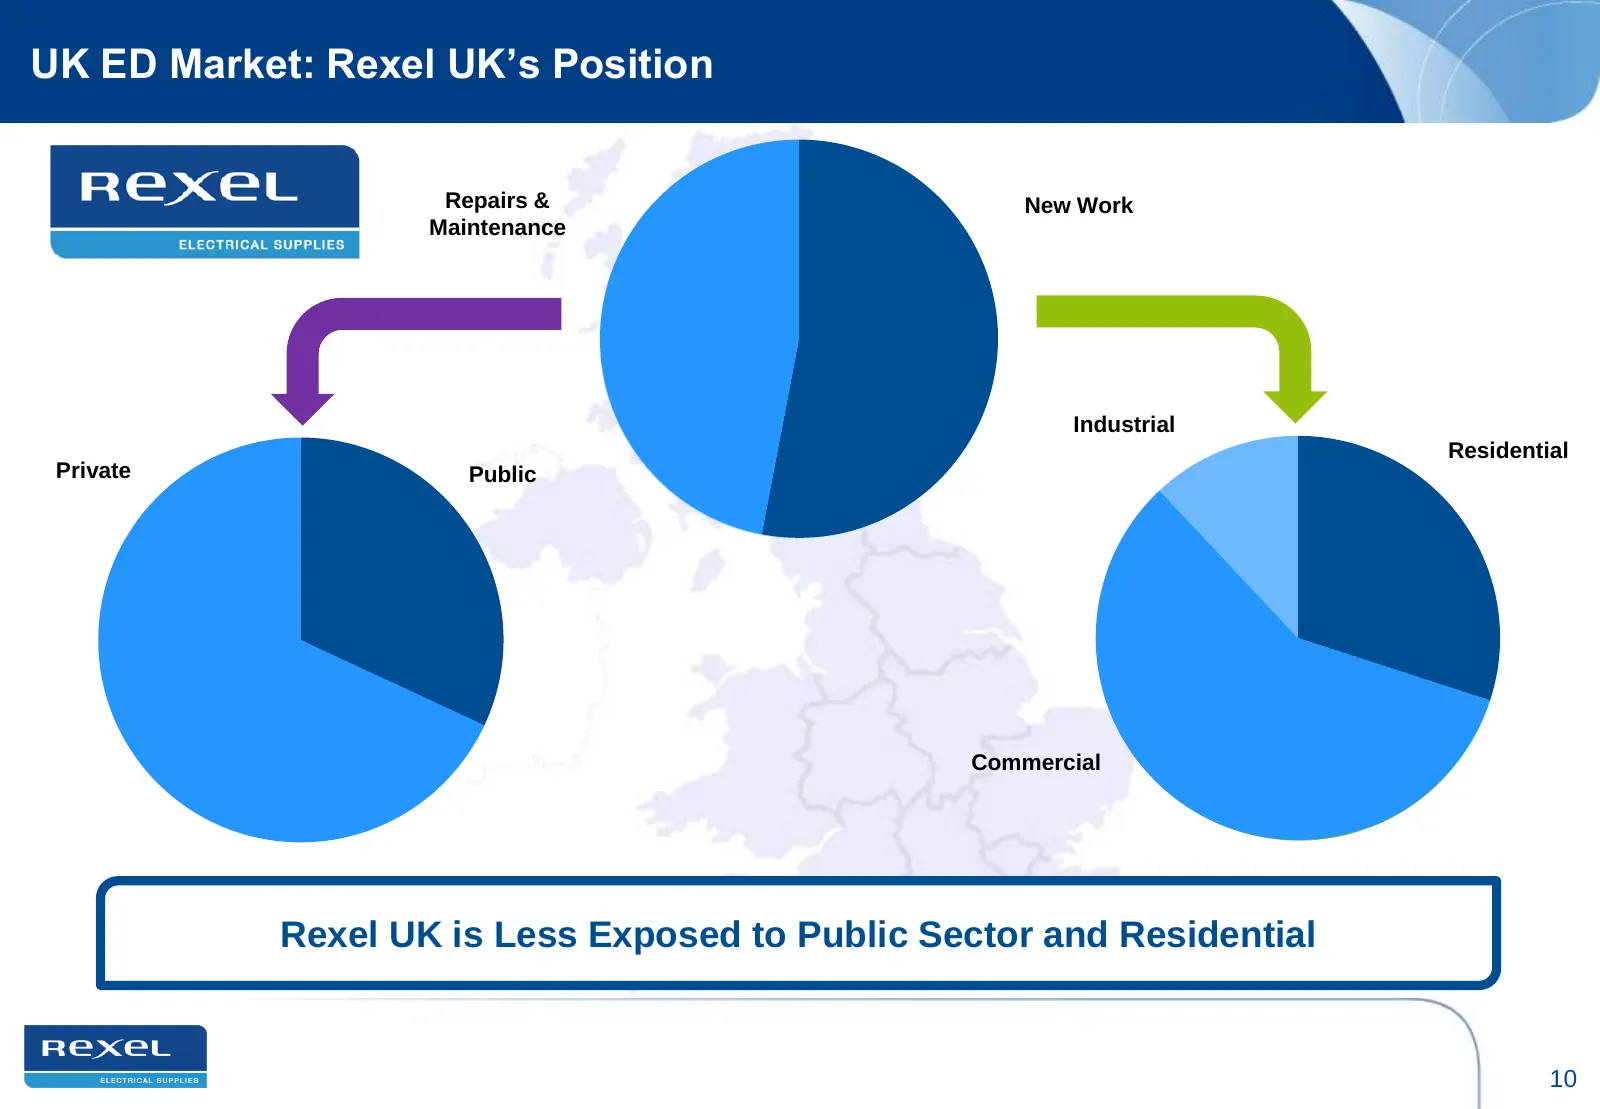
Slide 10: UK ED Market: Rexel UK's Position
UK ED Market: Rexel UK‟s Position Repairs & New Work Maintenance Industrial Residential Private Public Commercial Rexel UK is Less Exposed to Public Sector and Residential 10
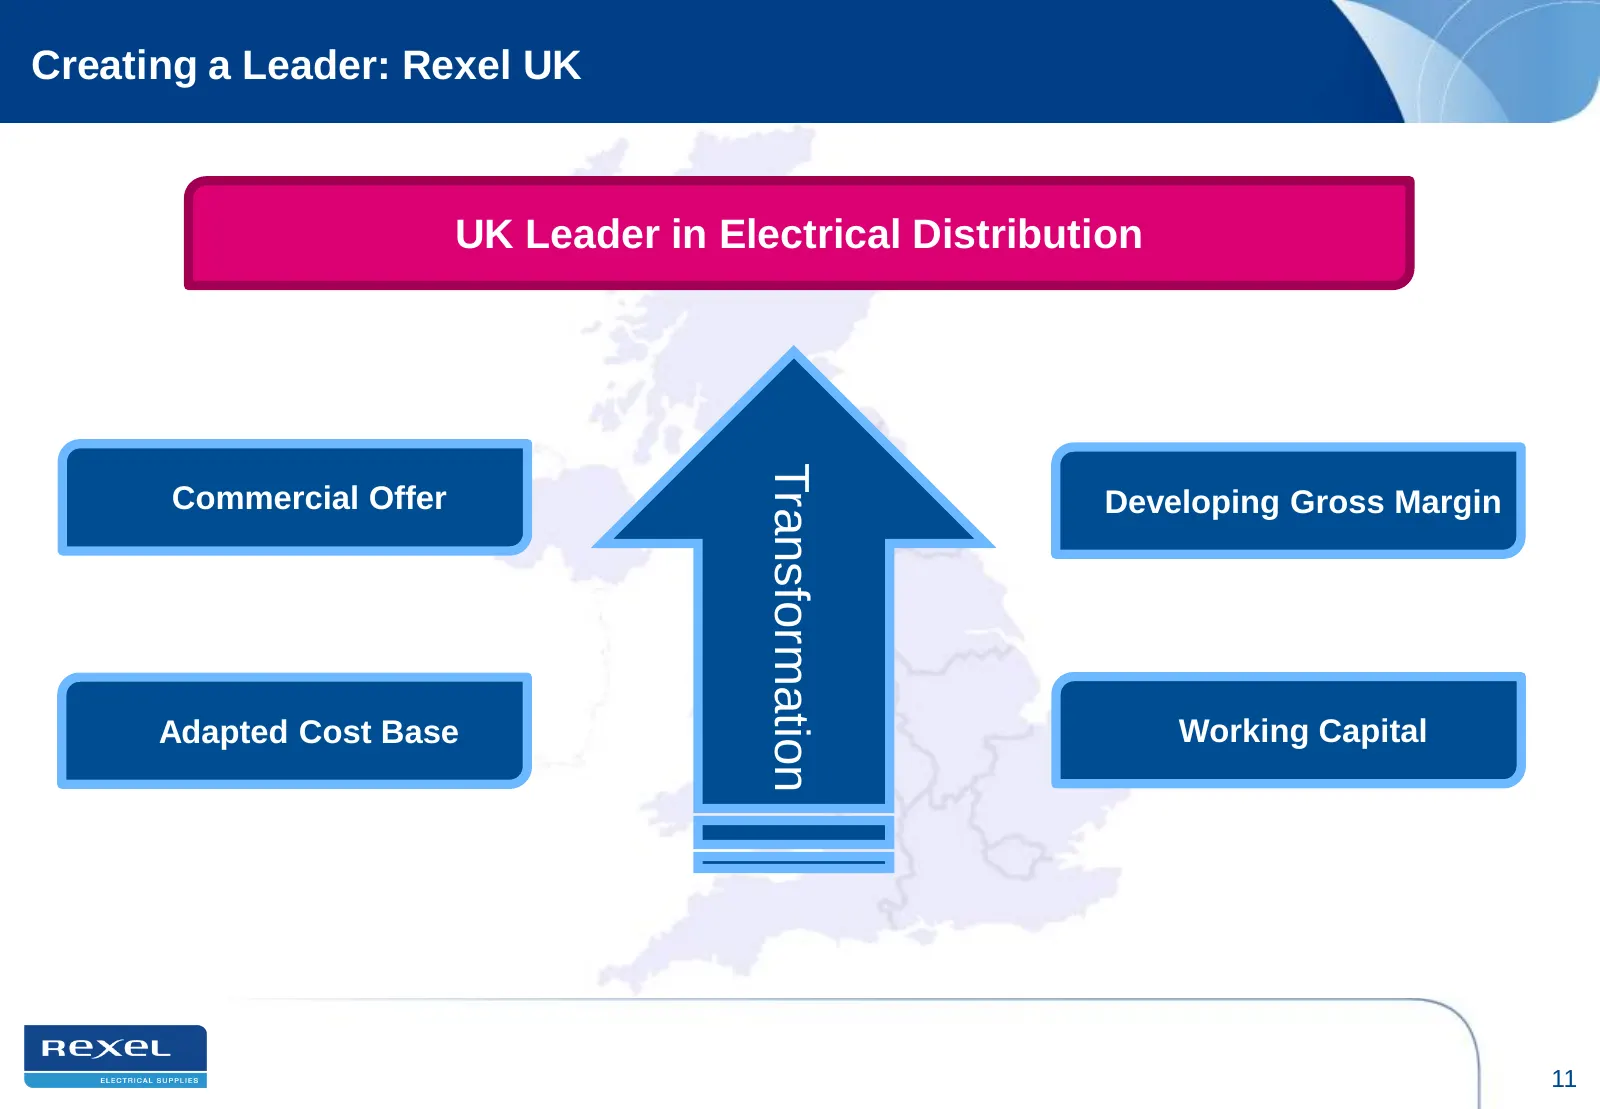
Slide 11: Creating a Leader: Rexel UK
Creating a Leader: Rexel UK Recession UK Leader in Electrical Distribution Transformation Commercial Offer Developing Gross Margin Adapted Cost Base Working Capital 11
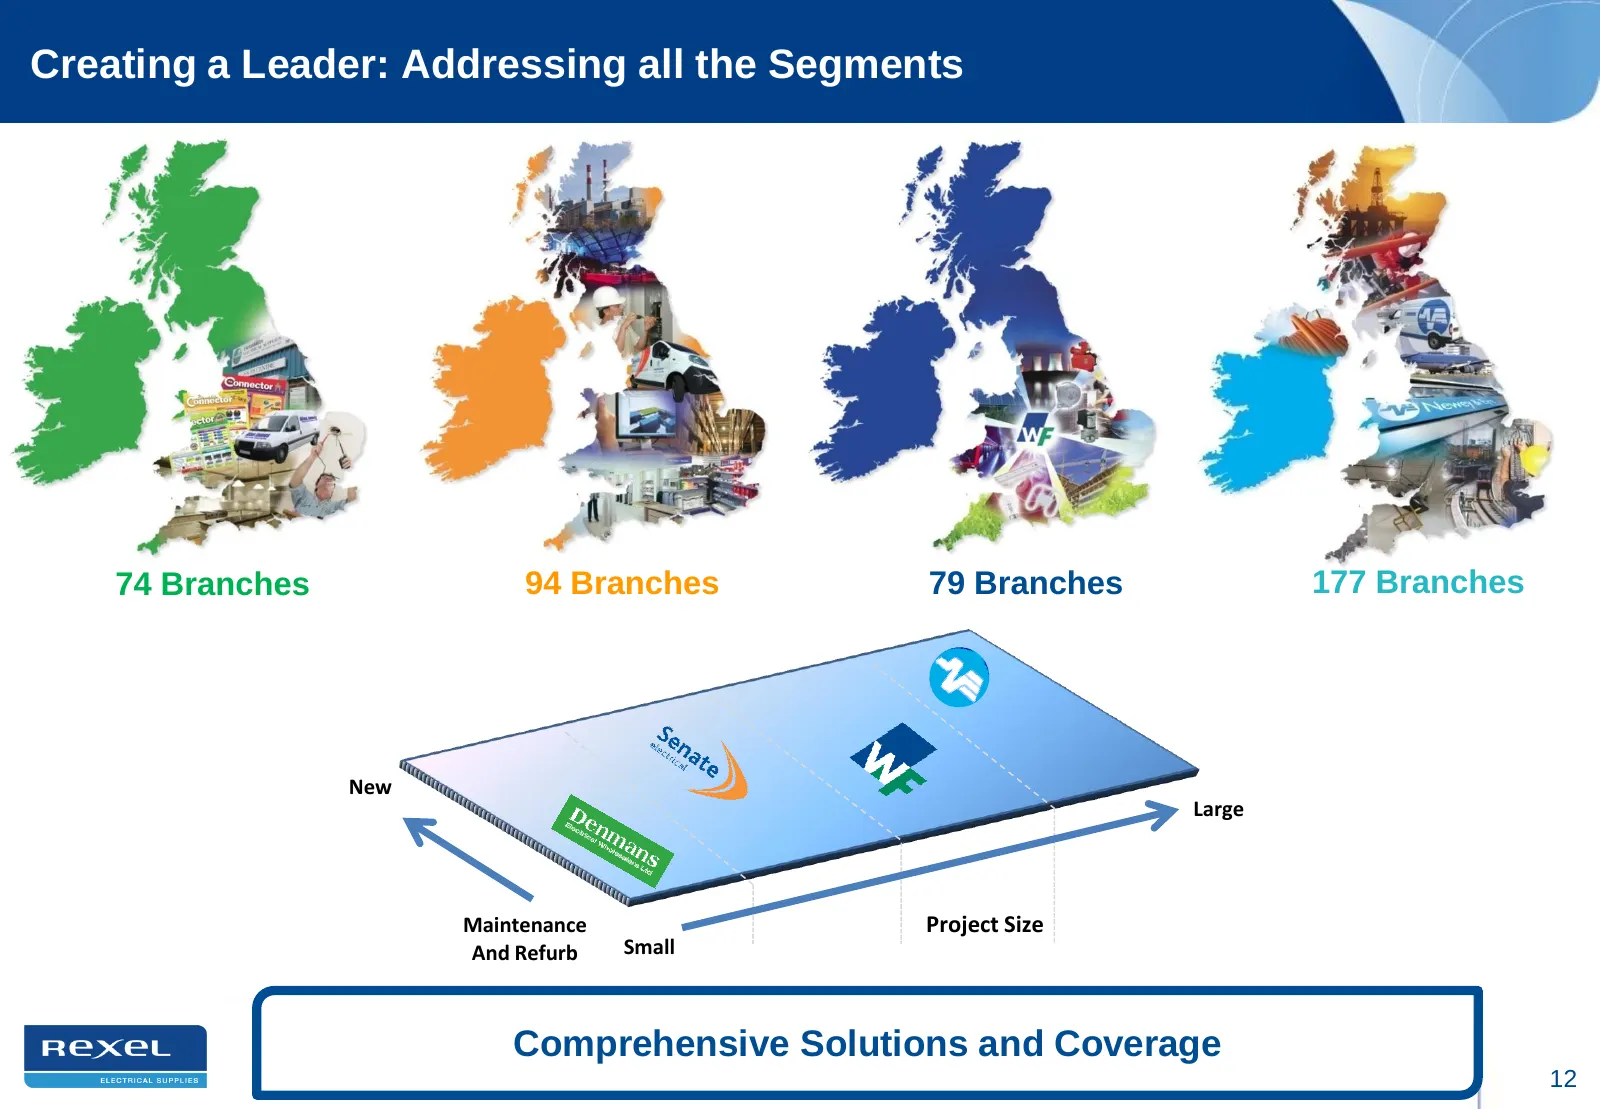
Slide 12: Creating a Leader: Addressing all the Segments
Creating a Leader: Addressing all the Segments 74 Branches 94 Branches 79 Branches 177 Branches New Large Maintenance Project Size And Refurb Small Comprehensive Solutions and Coverage 12
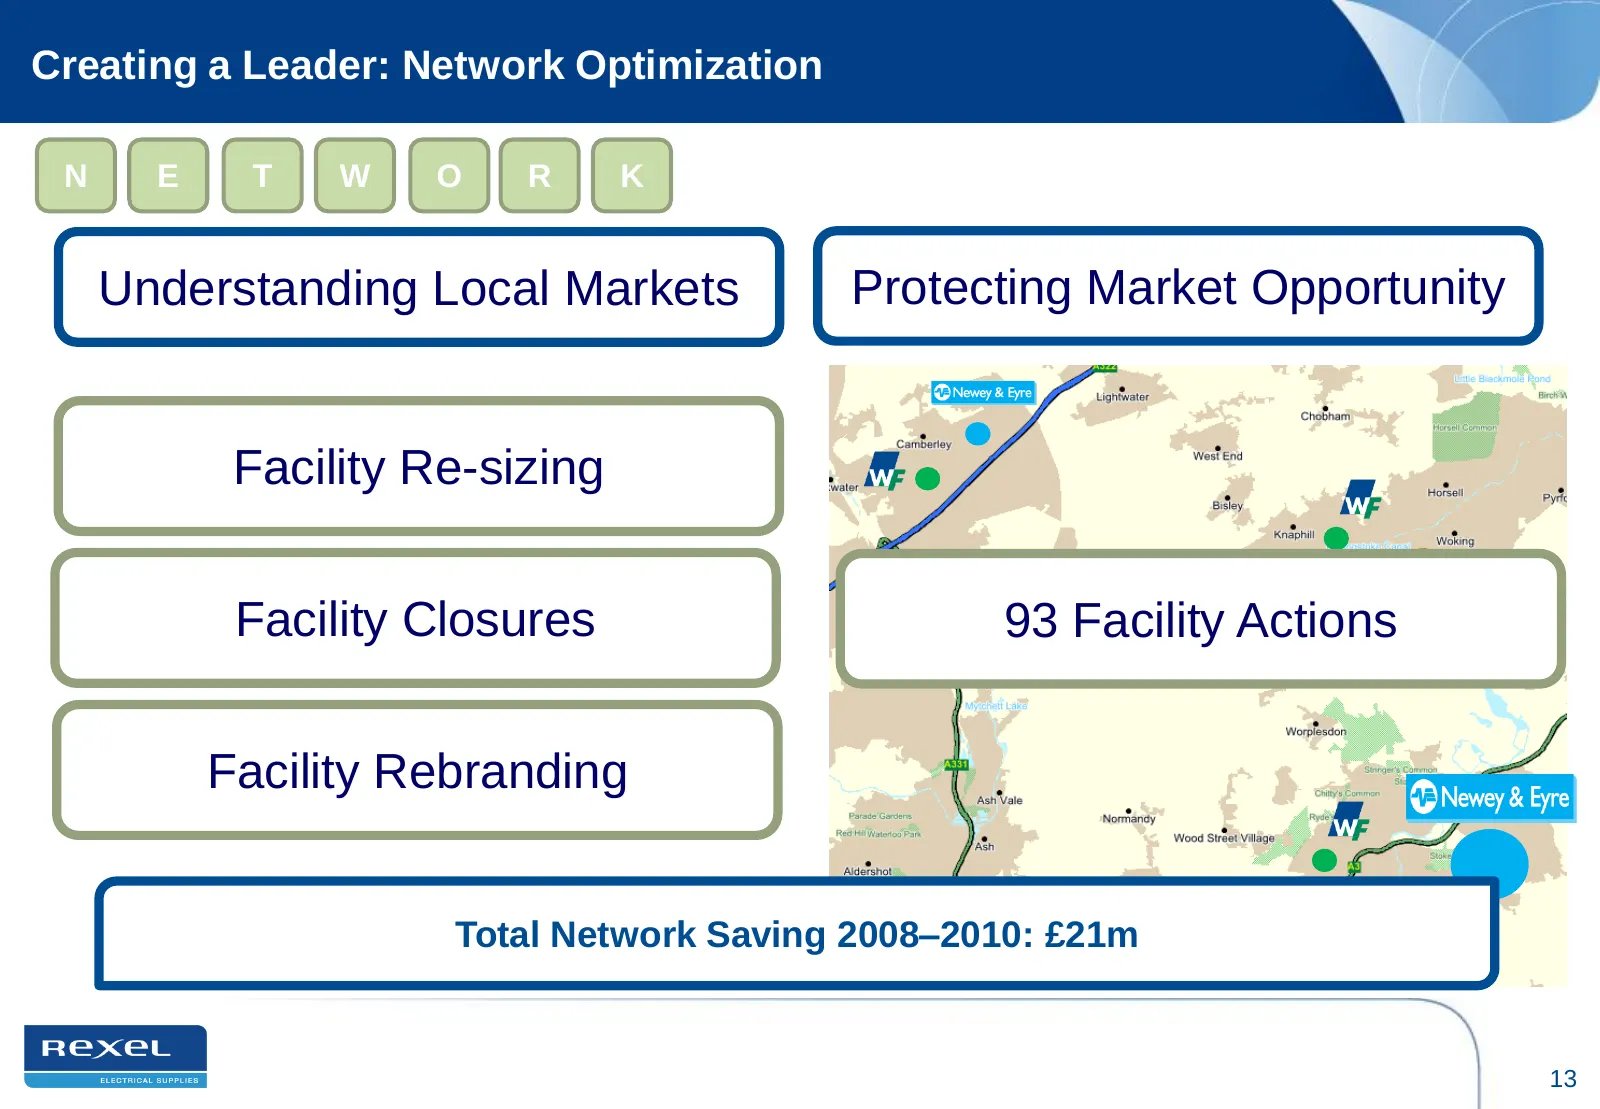
Slide 13: Creating a Leader: Network Optimization
Creating a Leader: Network Optimization N E T W O R K Understanding Local Markets Protecting Market Opportunity Facility Re-sizing Facility Closures 93 Facility Actions Facility Rebranding Total Network Saving 2008–2010: £21m 13
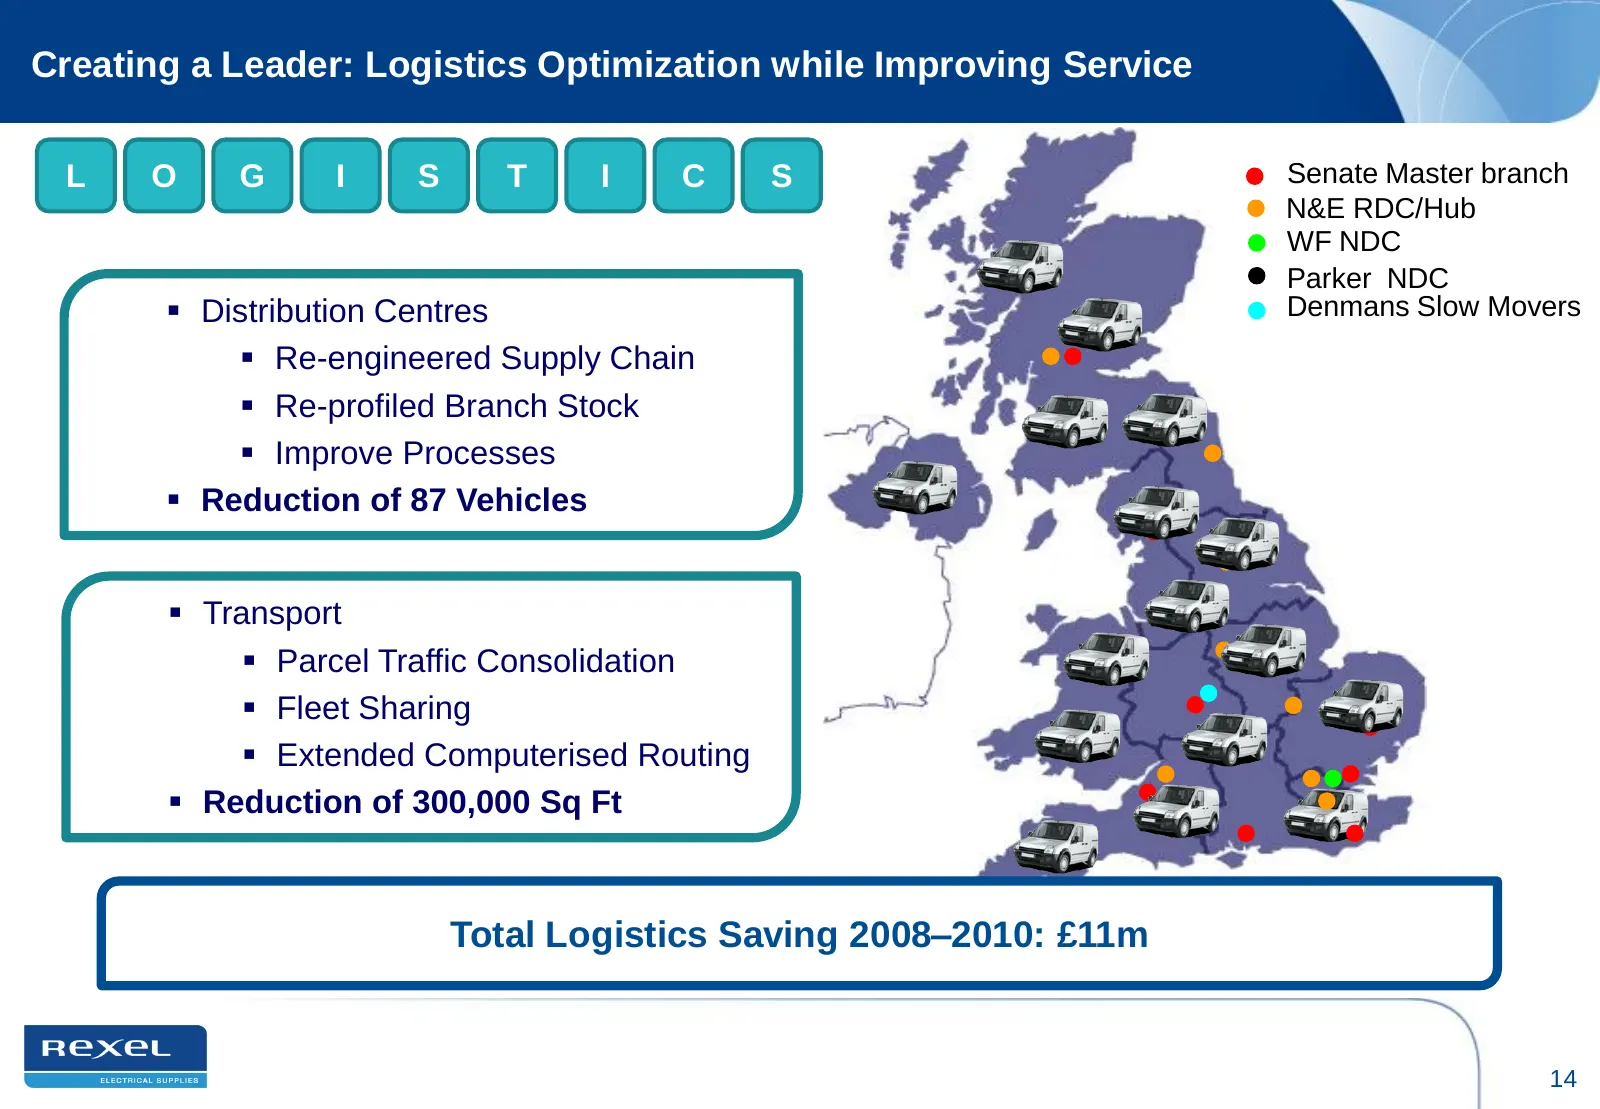
Slide 14: Creating a Leader: Logistics Optimization while Improving Service
Creating a Leader: Logistics Optimization while Improving Service L O G I S T I C S Senate Master branch N&E RDC/Hub WF NDC Parker NDC Distribution Centres Denmans Slow Movers Re-engineered Supply Chain Re-profiled Branch Stock Improve Processes Reduction of 87 Vehicles Transport Parce
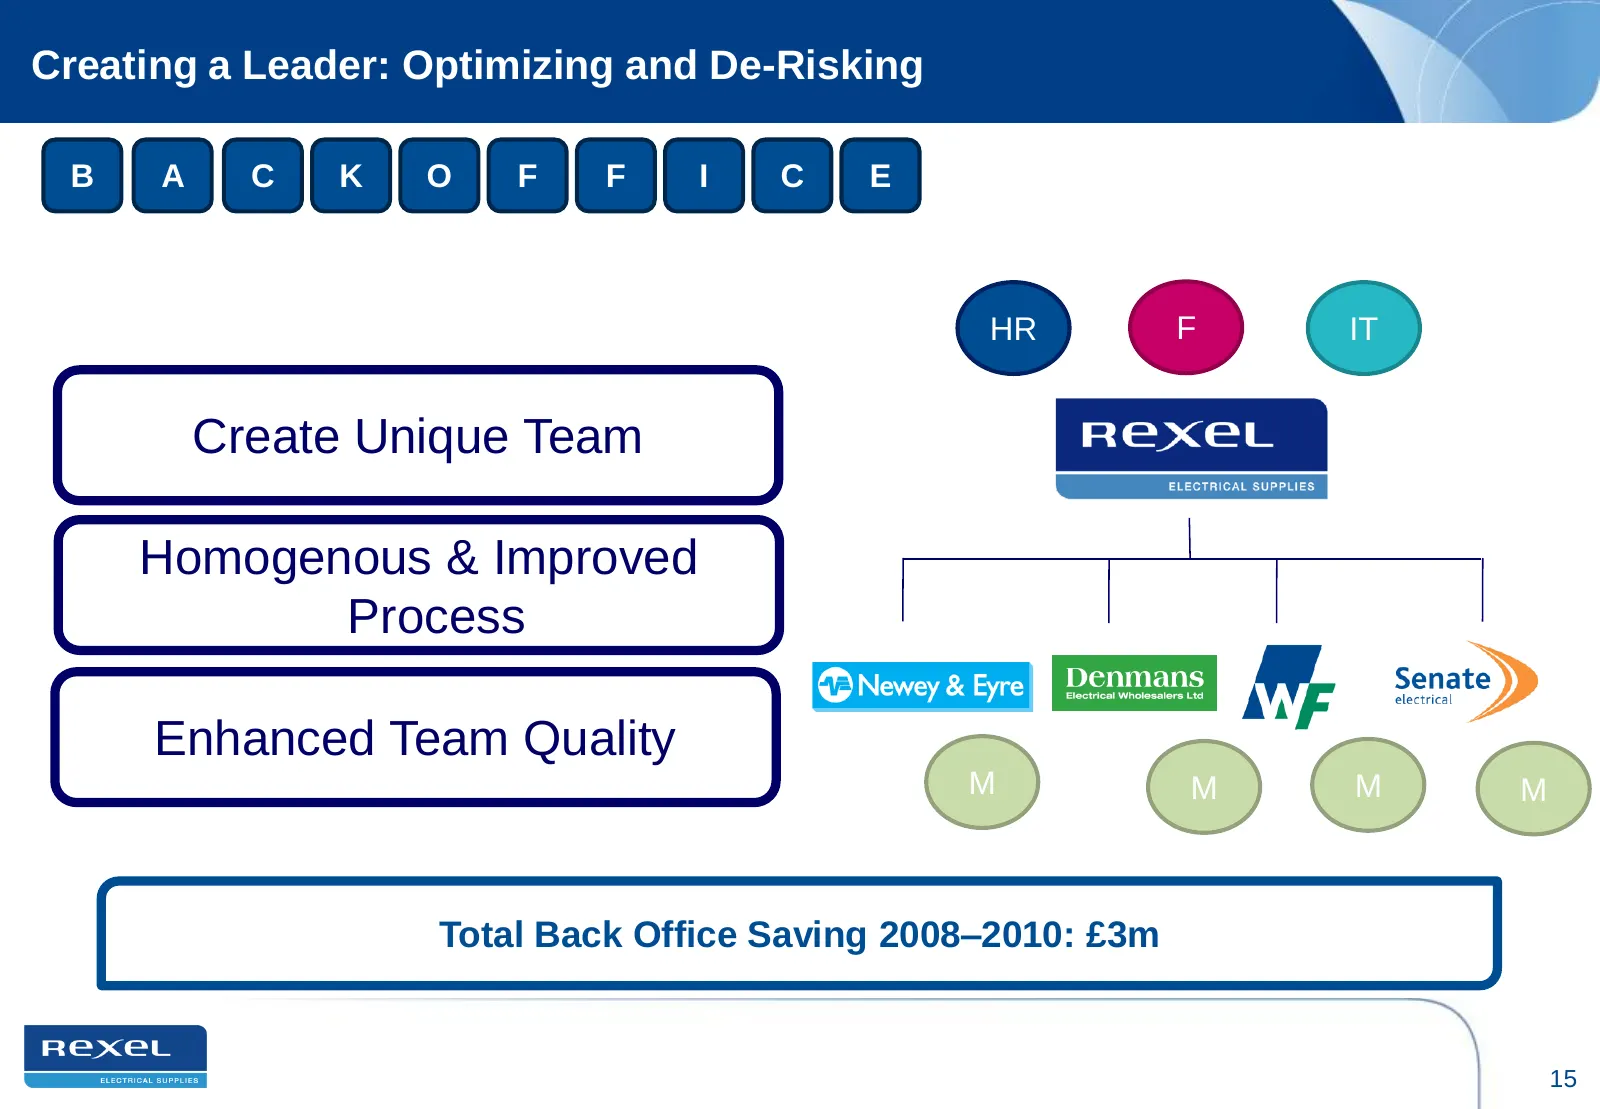
Slide 15: Creating a Leader: Optimizing and De-Risking
Creating a Leader: Optimizing and De-Risking B A C K O F F I C E HR F IT Create Unique Team Homogenous & Improved Process Enhanced Team Quality M M M M Total Back Office Saving 2008–2010: £3m 15
Slide 16: Creating a Leader: A Lean Organization
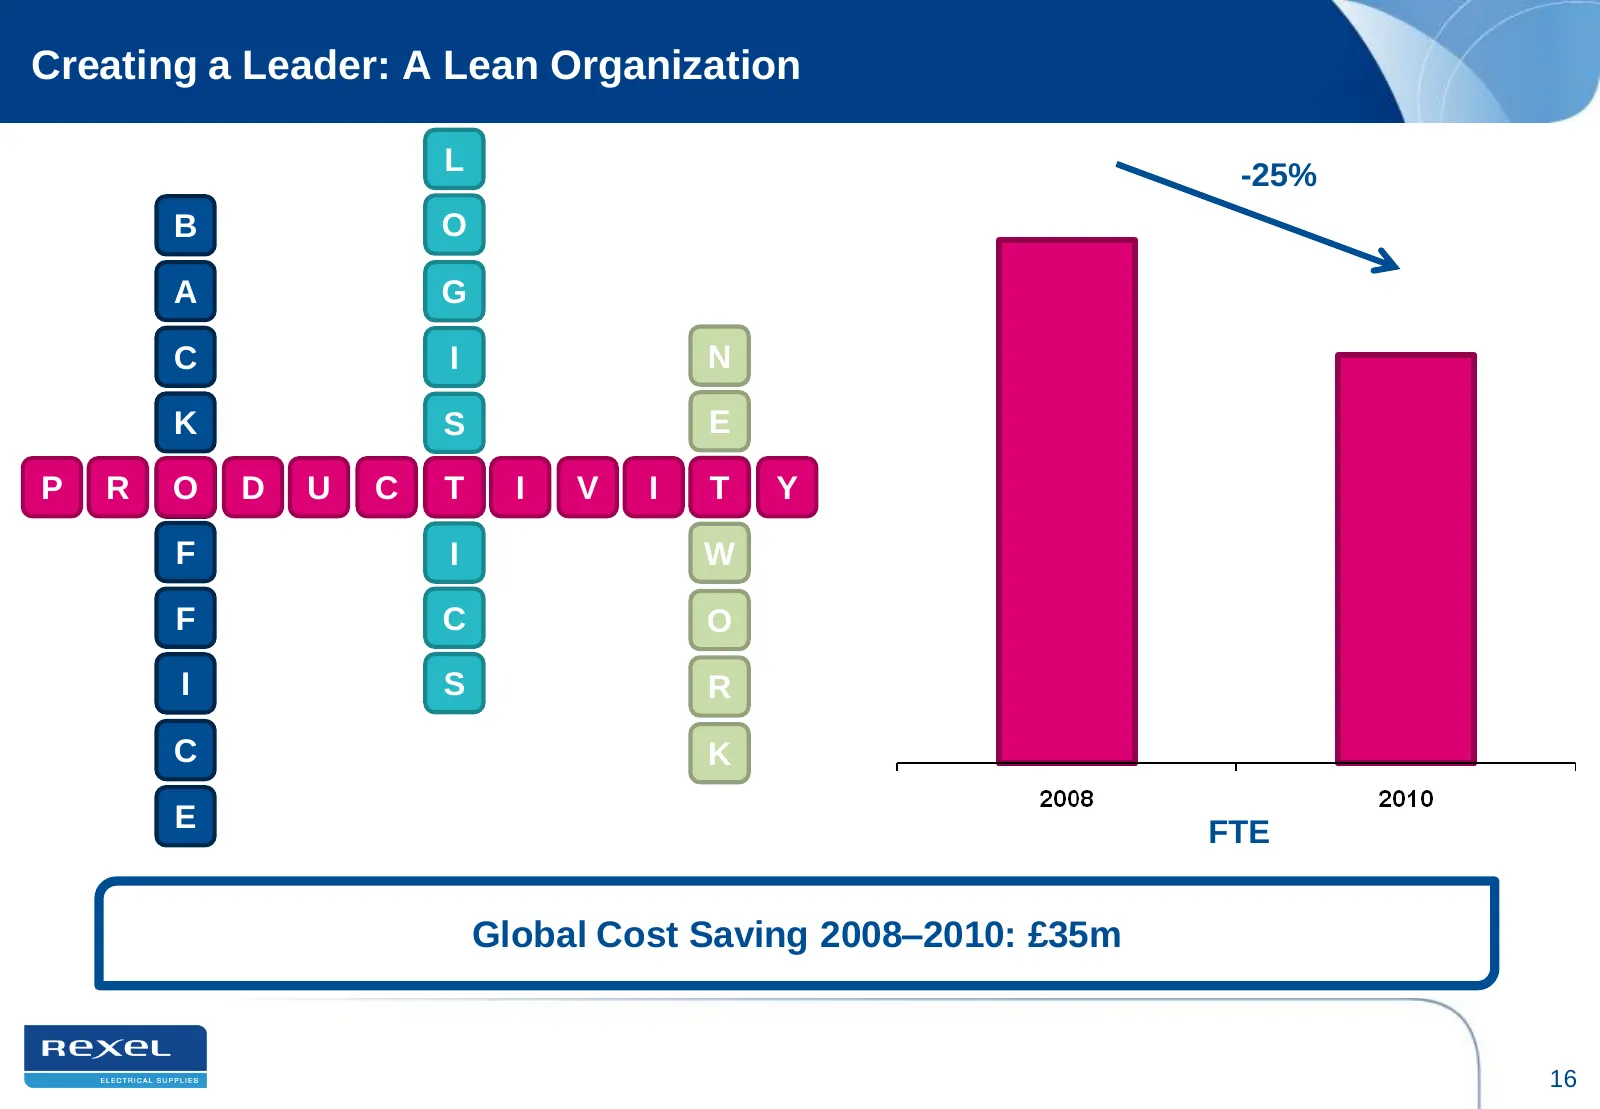
Creating a Leader: A Lean Organization L -25% B O A G C I N K S E P R O D U C T I V I T Y F I W F C O I S R C K E FTE Global Cost Saving 2008–2010: £35m 16
Slide 17: Creating a Leader: Margin Development – Purchasing
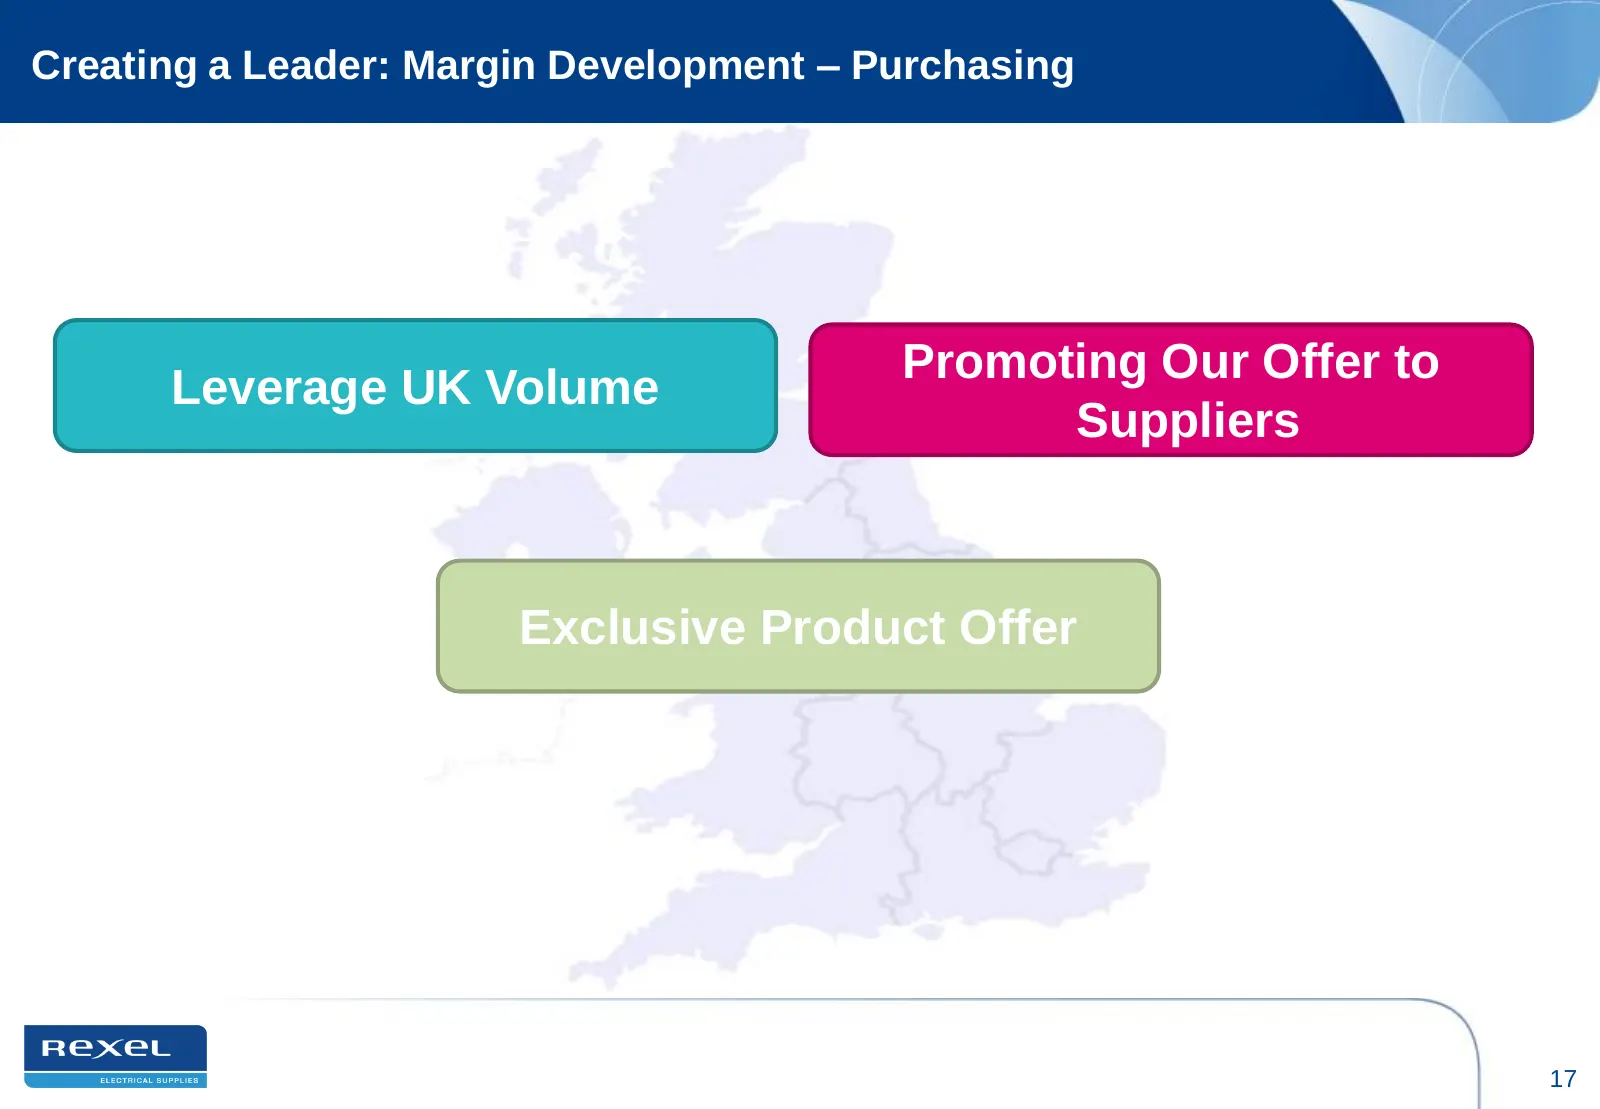
Creating a Leader: Margin Development – Purchasing Promoting Our Offer to Leverage UK Volume Suppliers Exclusive Product Offer 17
Slide 18: Creating a Leader: Margin Development – Sales
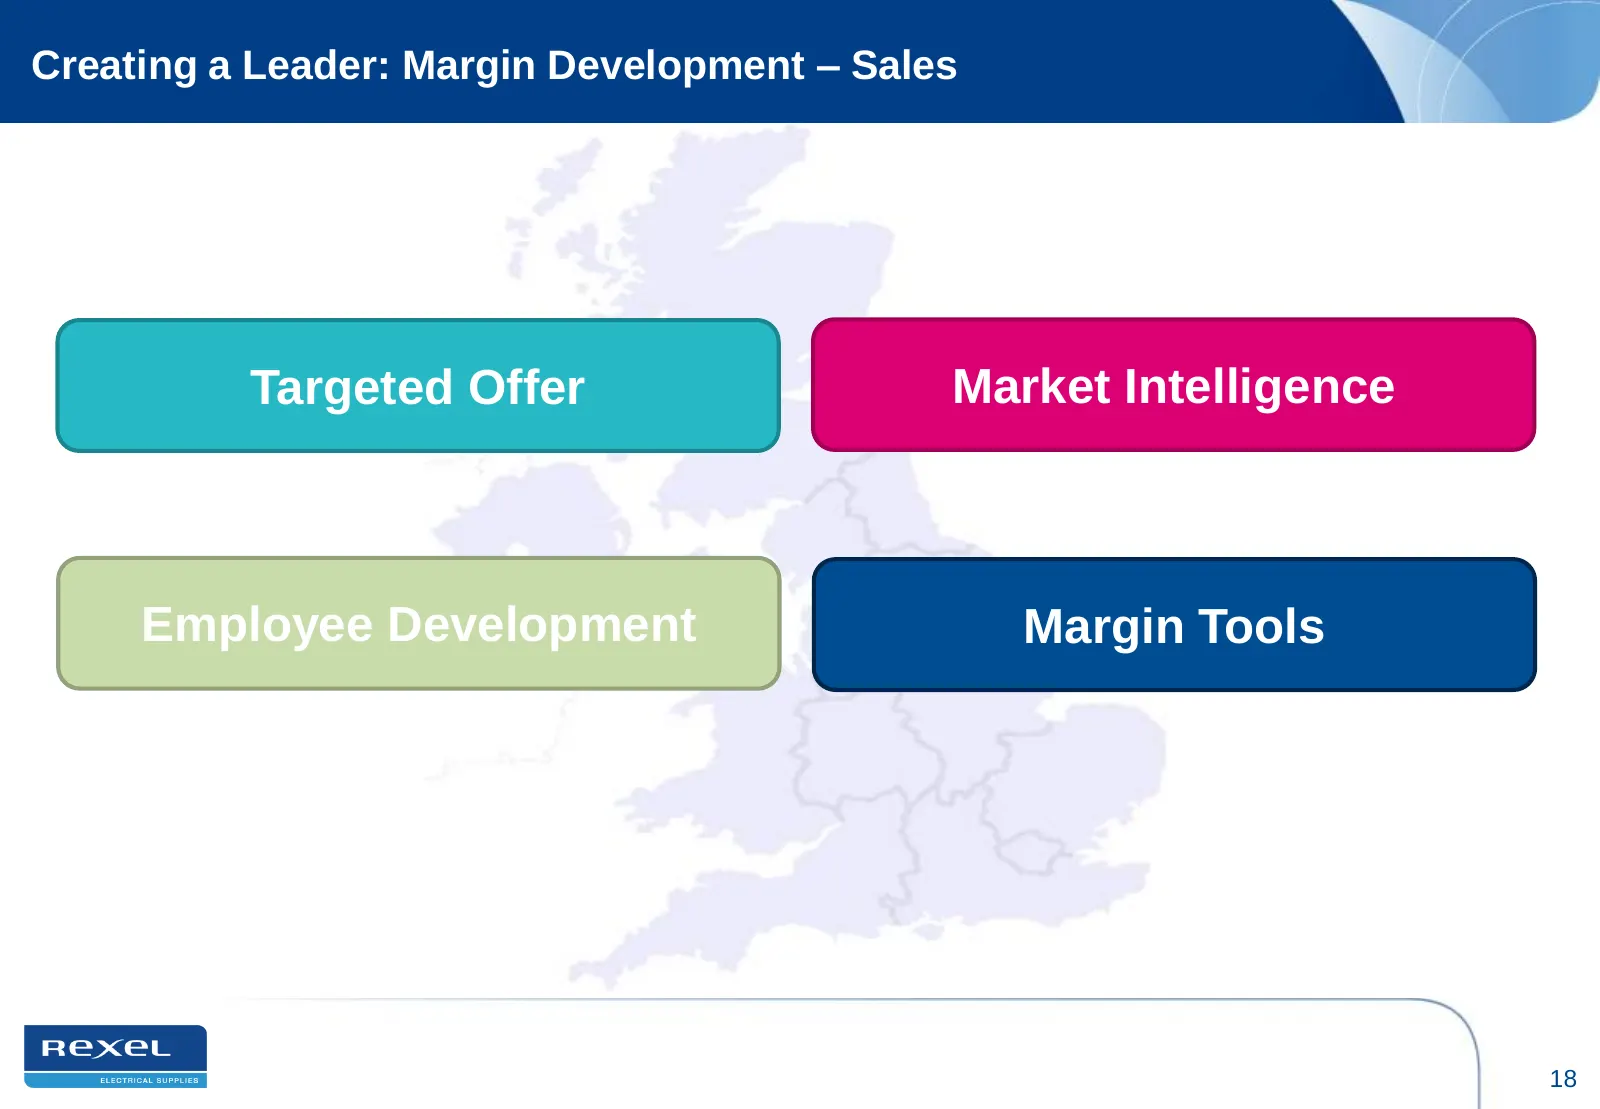
Creating a Leader: Margin Development – Sales Targeted Offer Market Intelligence Employee Development Margin Tools 18
Slide 19: Creating a Leader: Working Capital Optimization
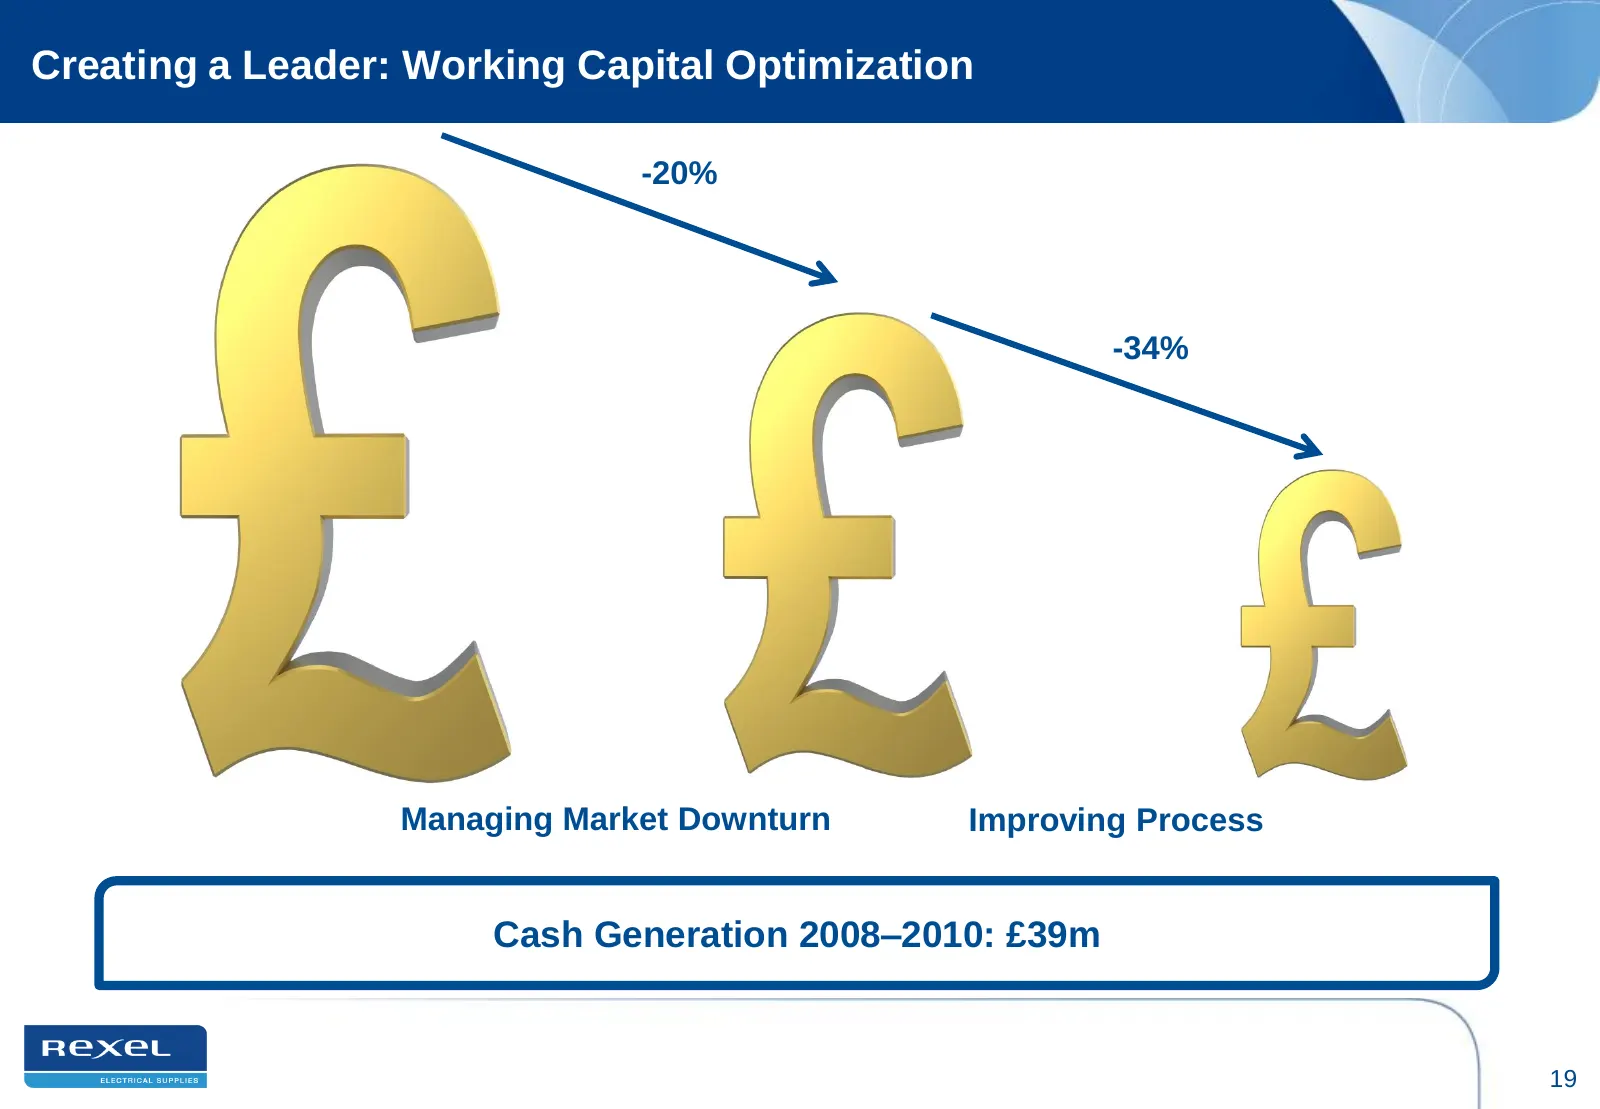
Creating a Leader: Working Capital Optimization -20% -34% Managing Market Downturn Improving Process Cash Generation 2008–2010: £39m 19
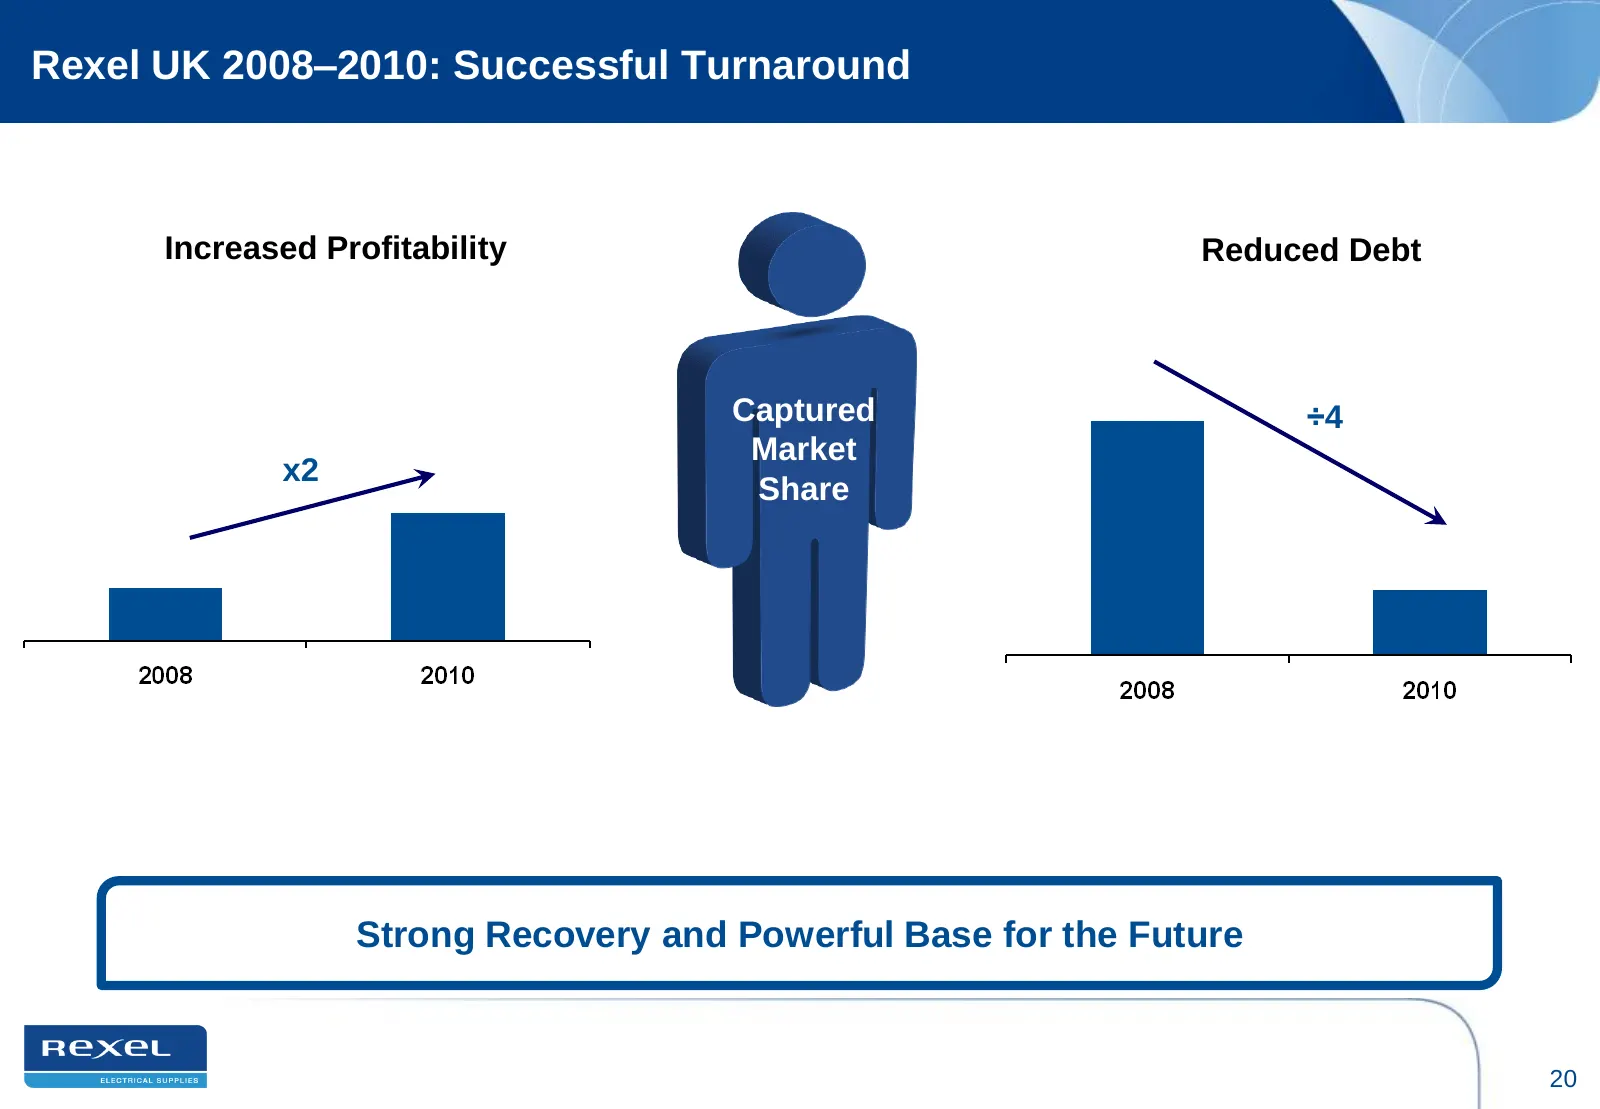
Slide 20: Rexel UK 2008–2010: Successful Turnaround
Rexel UK 2008–2010: Successful Turnaround Increased Profitability Reduced Debt Captured †4 Market x2 Share Strong Recovery and Powerful Base for the Future 20

Slide 21: Rexel UK 2011-2013: Making the Difference
Rexel UK 2011-2013: Making the Difference
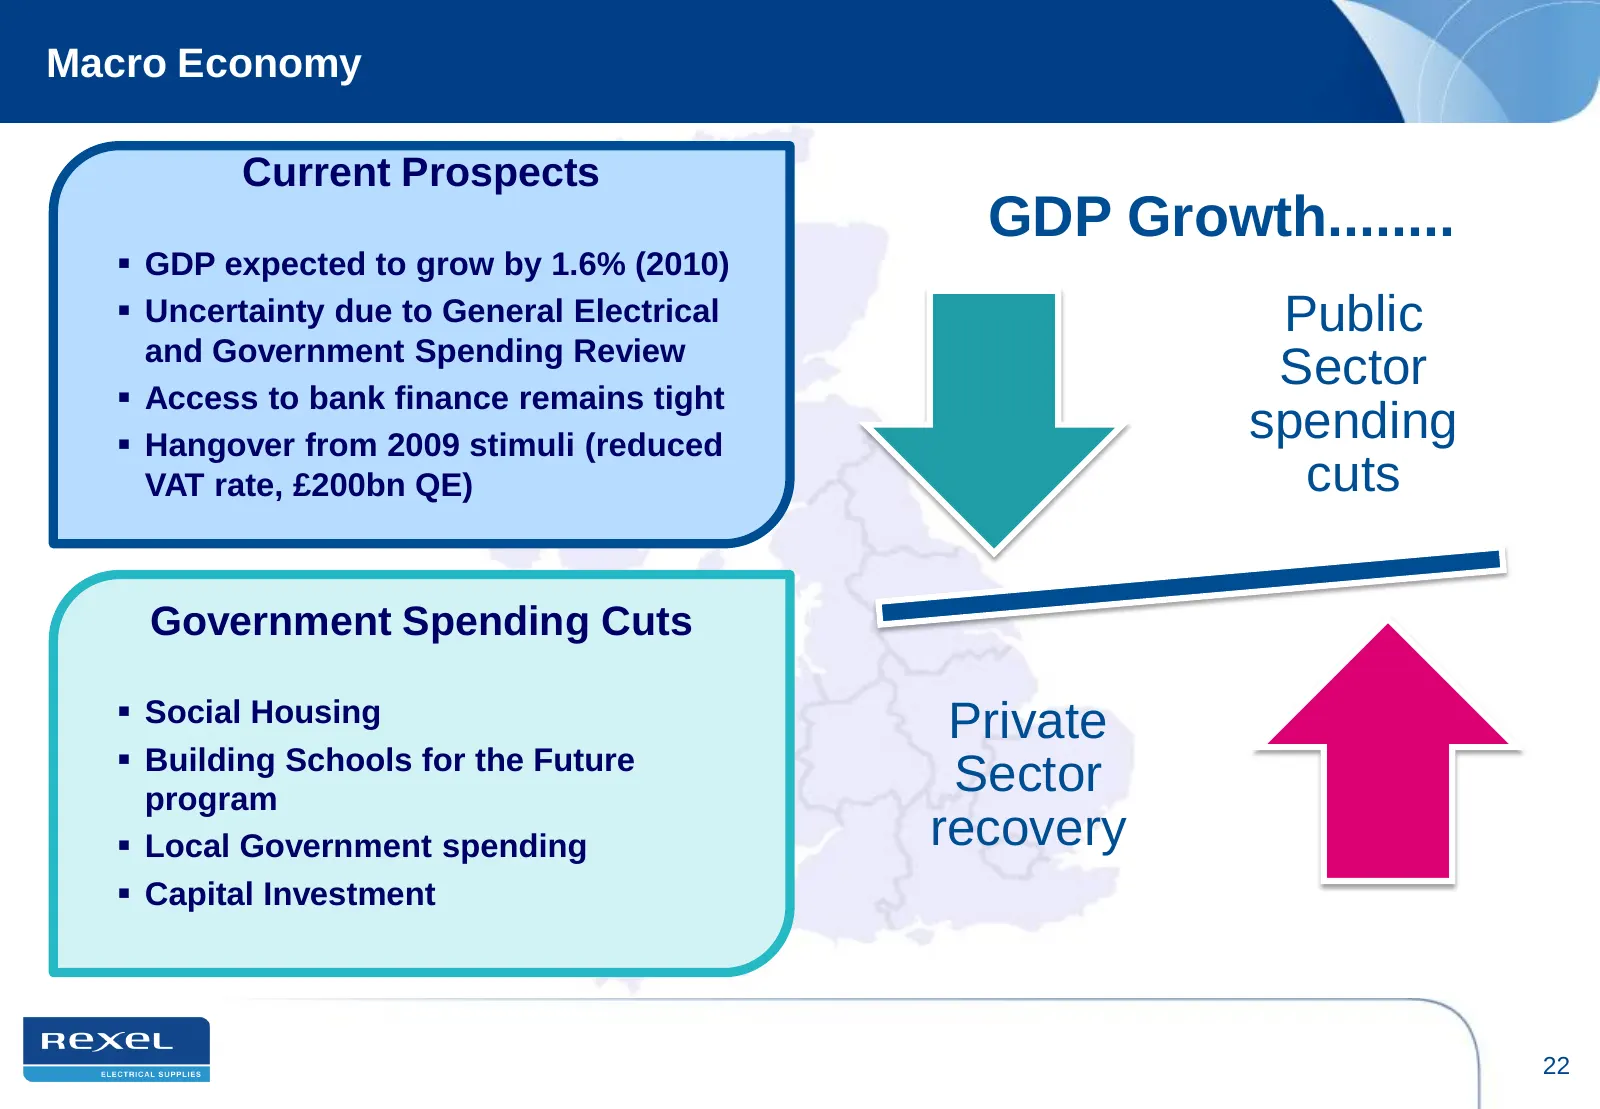
Slide 22: Macro Economy: Current Prospects
Macro Economy Current Prospects GDP Growth........ GDP expected to grow by 1.6% (2010) Uncertainty due to General Electrical Public and Government Spending Review Access to bank finance remains tight Sector Hangover from 2009 stimuli (reduced spending VAT rate, £200bn QE) cuts Government Spe
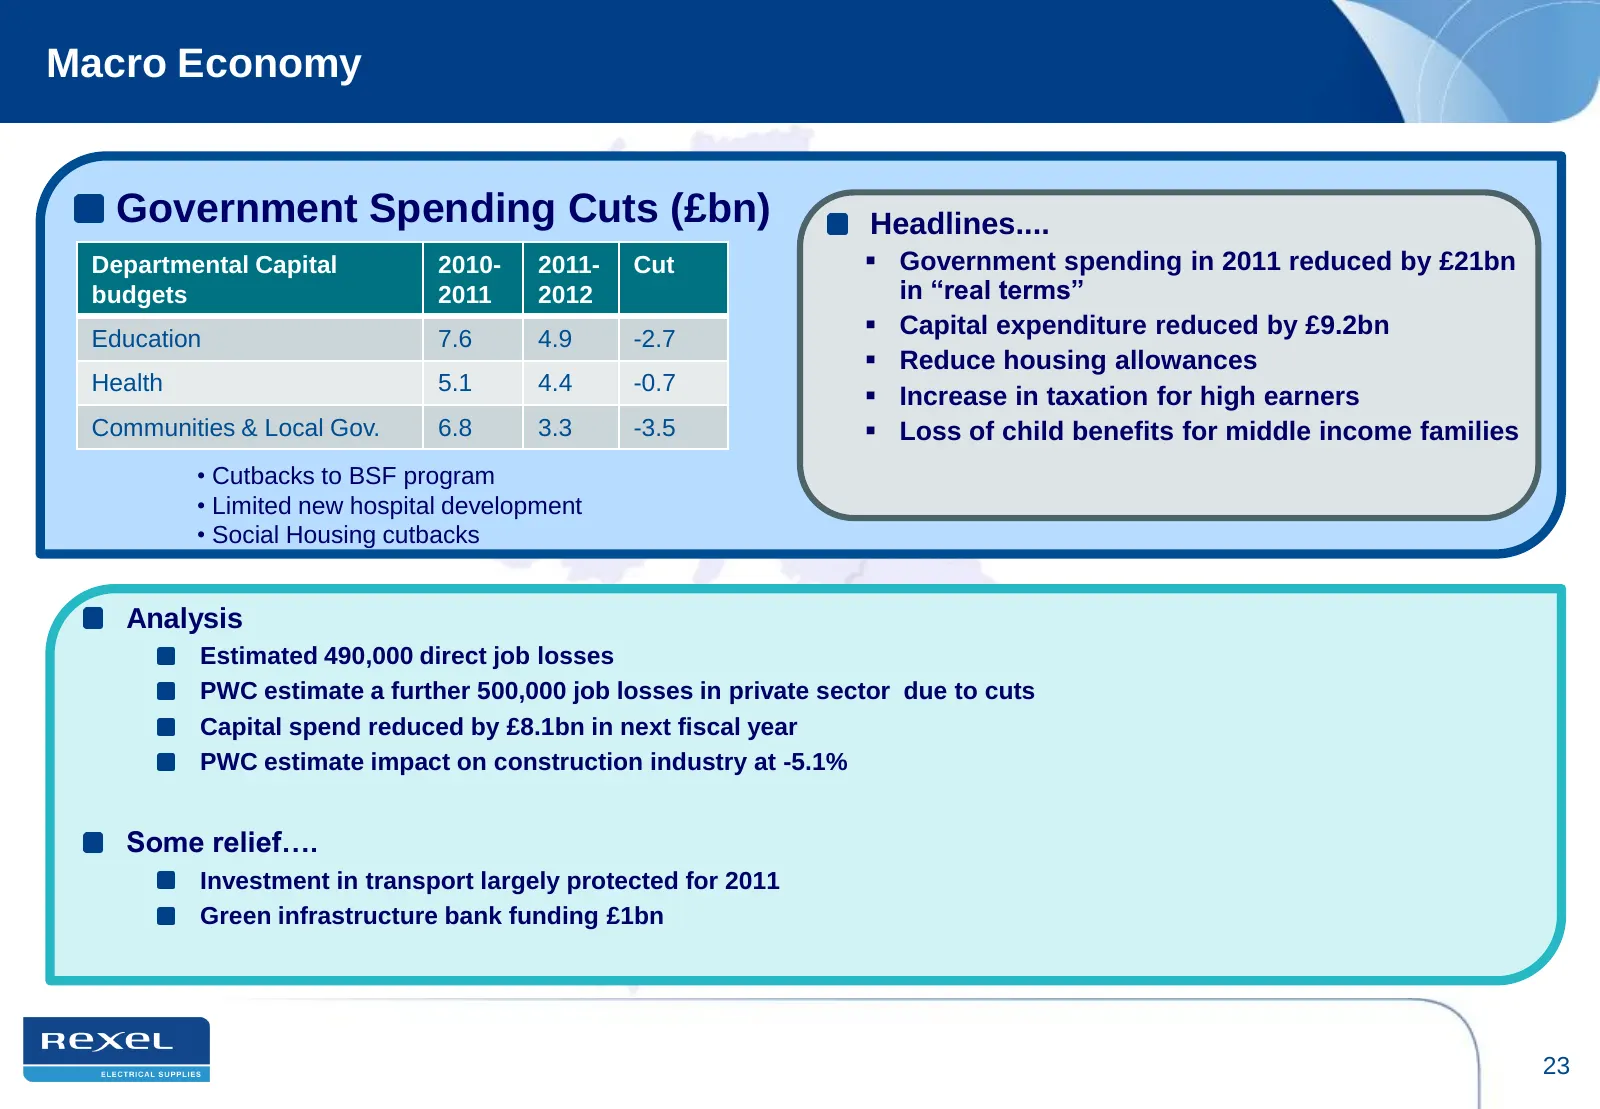
Slide 23: Macro Economy: Government Spending Cuts
Macro Economy Government Spending Cuts (£bn) Headlines.... Departmental Capital 2010- 2011- Cut Government spending in 2011 reduced by £21bn budgets 2011 2012 in “real terms” Education 7.6 4.9 -2.7 Capital expenditure reduced by £9.2bn Reduce housing allowances Health 5.1 4.4 -0.7 Increase i
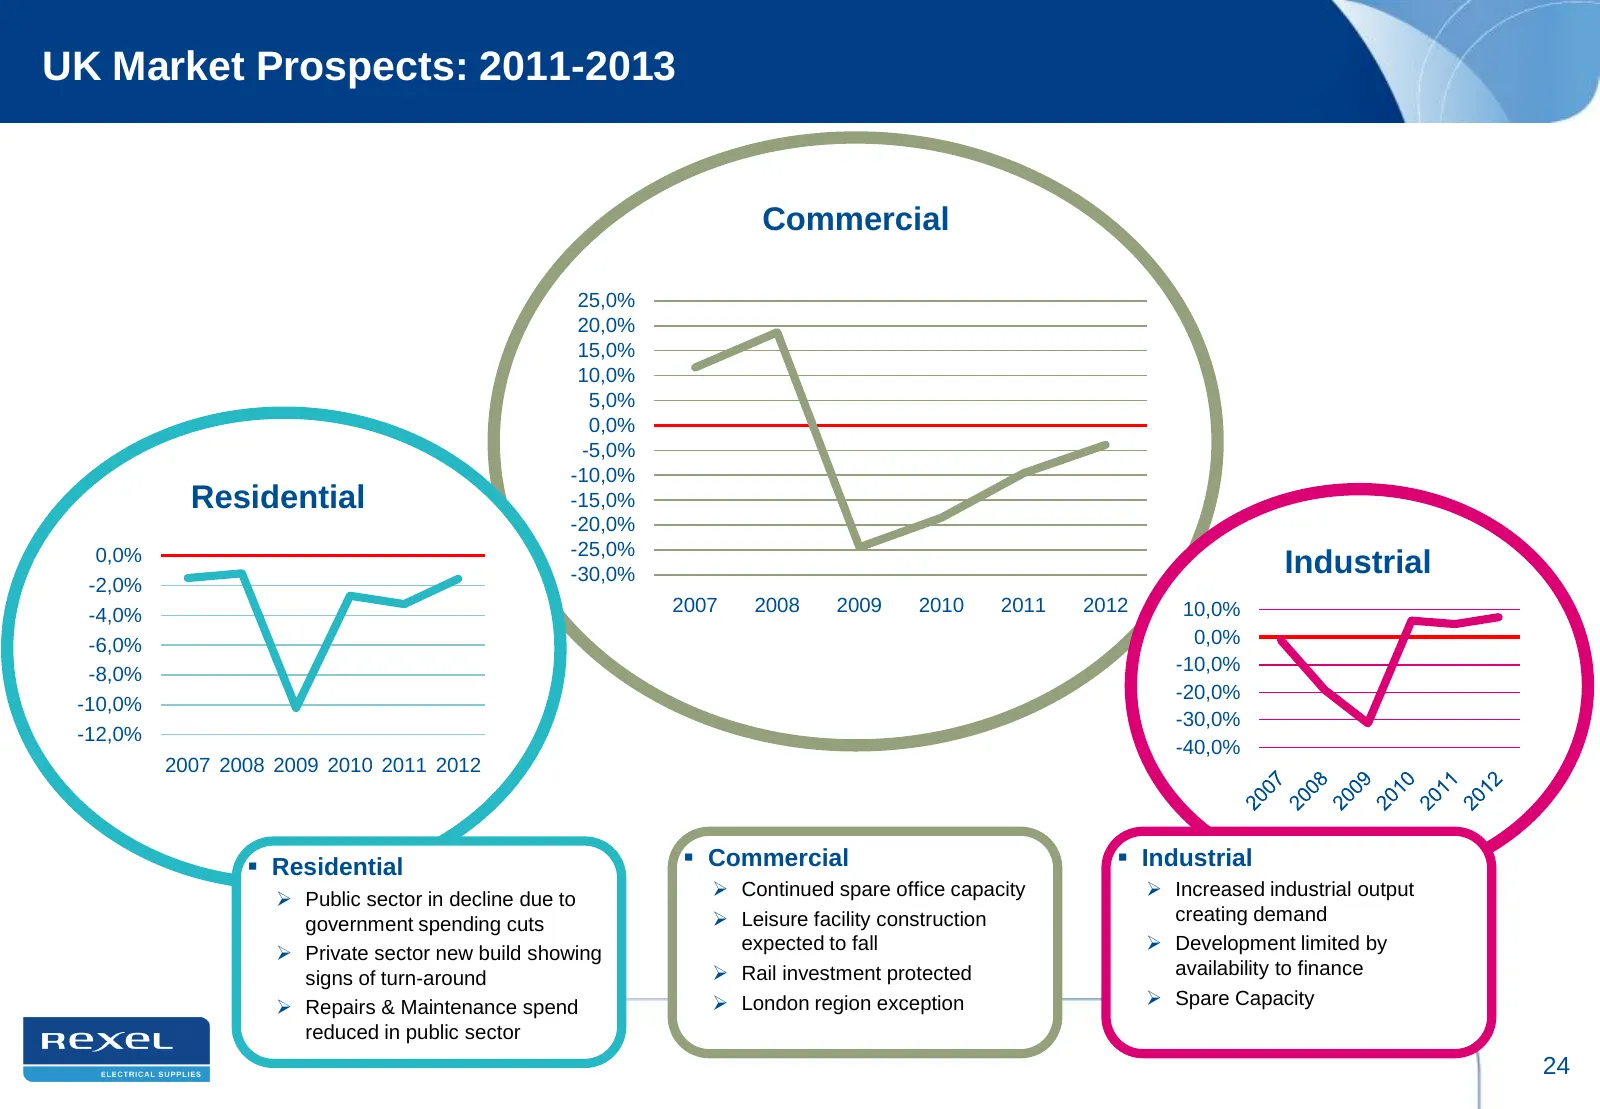
Slide 24: UK Market Prospects: 2011-2013
UK Market Prospects: 2011-2013 Commercial 25,0% 20,0% 15,0% 10,0% 5,0% 0,0% -5,0% -10,0% Residential -15,0% -20,0% 0,0% -25,0% -30,0% Industrial -2,0% -4,0% 2007 2008 2009 2010 2011 2012 10,0% -6,0% 0,0% -10,0% -8,0% -20,0% -10,0% -30,0% -12,0% -40,0% 2007 2008 2009 2010 2011 2012 Residential Co
Slide 25: Improving Market Conditions
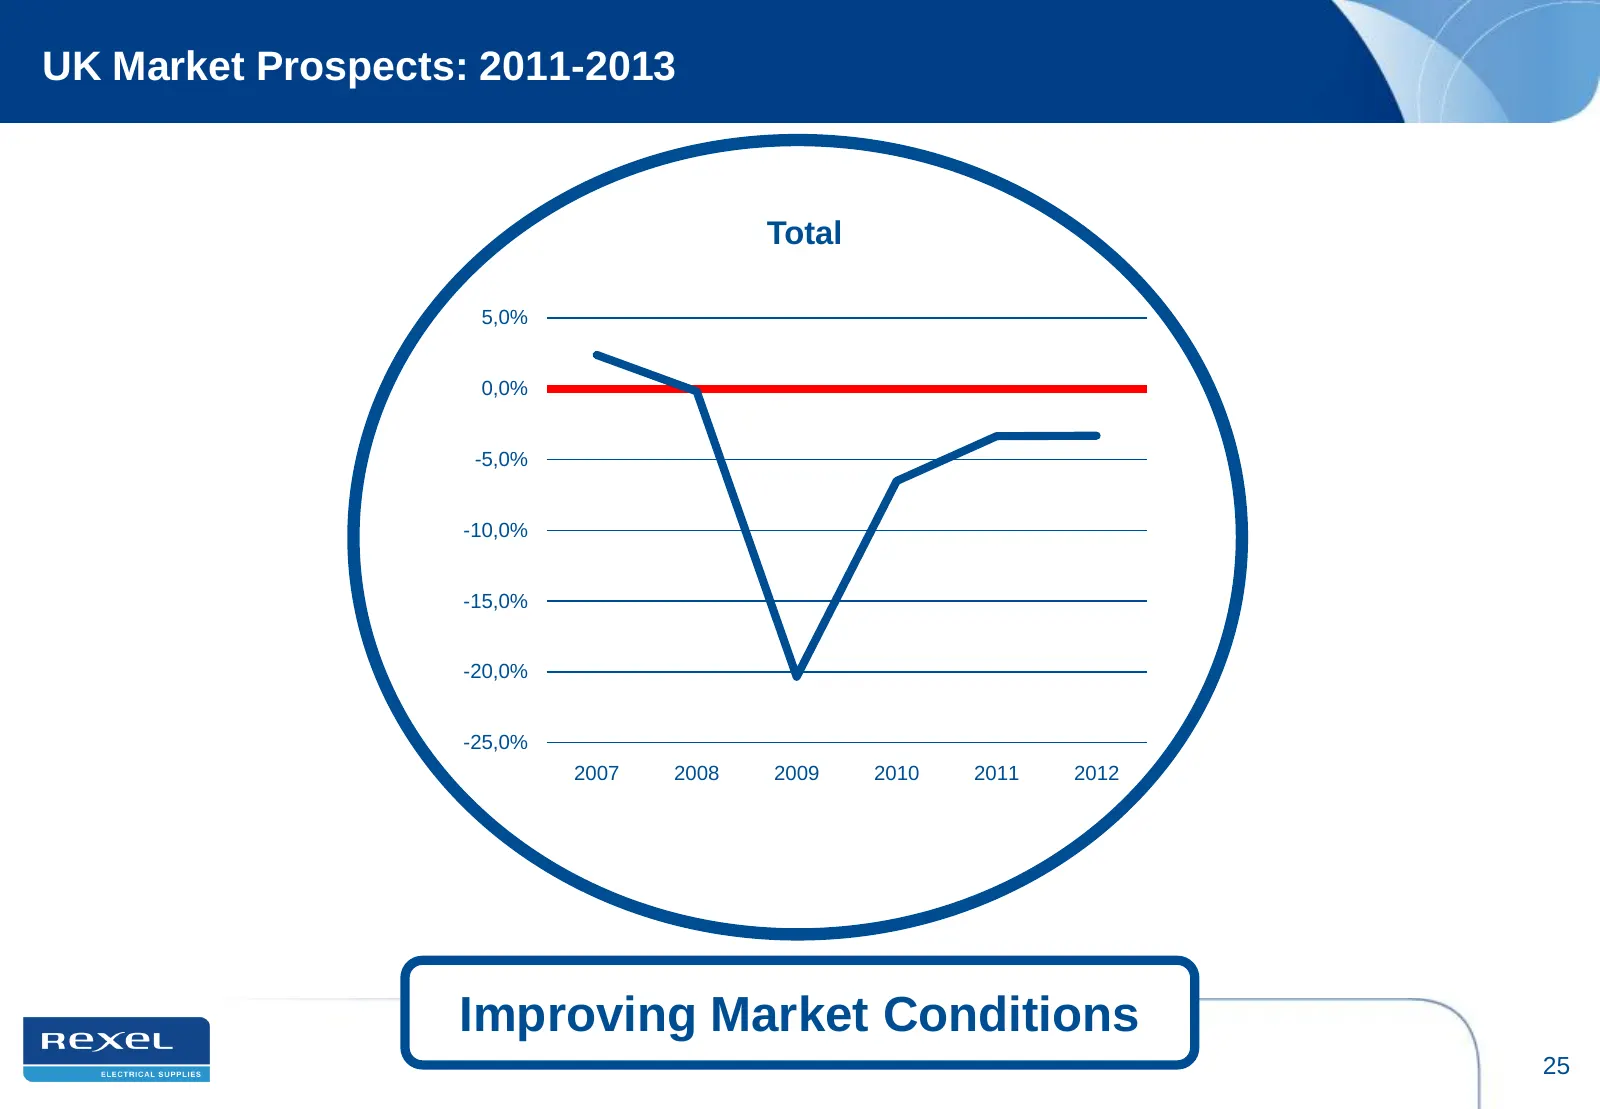
UK Market Prospects: 2011-2013 Total 5,0% 0,0% -5,0% -10,0% -15,0% -20,0% -25,0% 2007 2008 2009 2010 2011 2012 Improving Market Conditions 25
Slide 26: Our Strategy: Continue to Gain Core Business Market Share
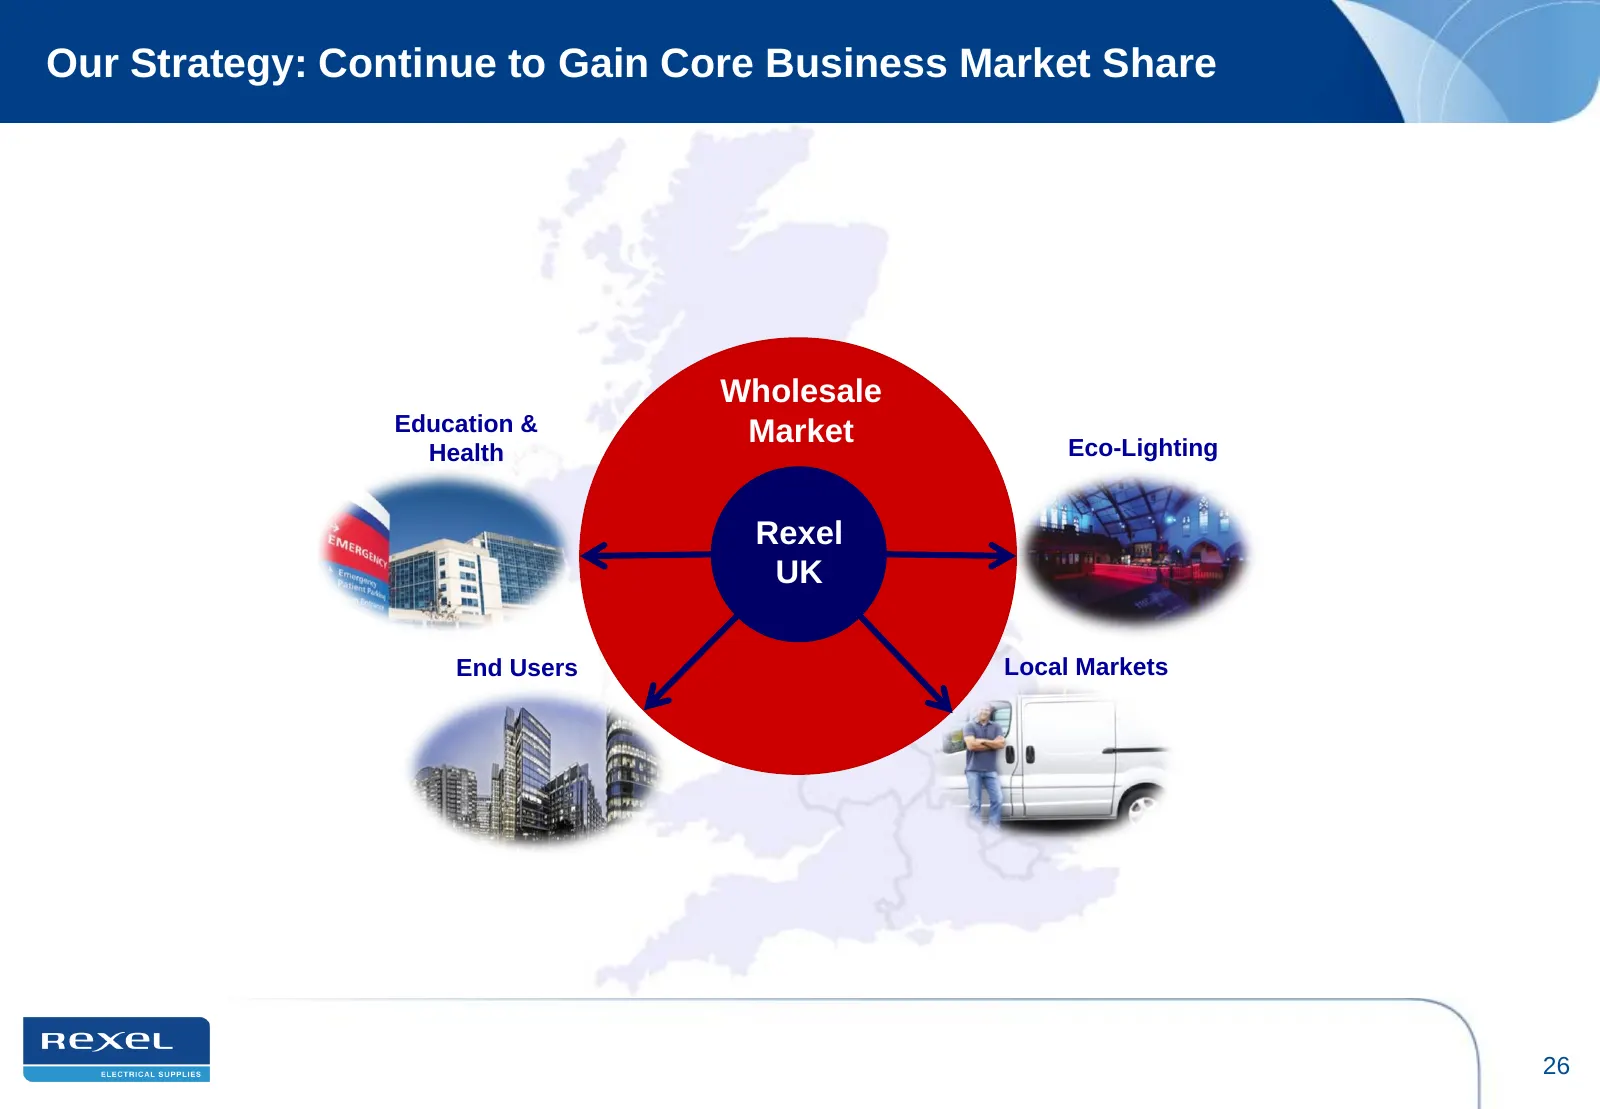
Our Strategy: Continue to Gain Core Business Market Share Wholesale Education & Market Health Eco-Lighting Rexel UK End Users Local Markets 26
Slide 27: Eco-Lighting
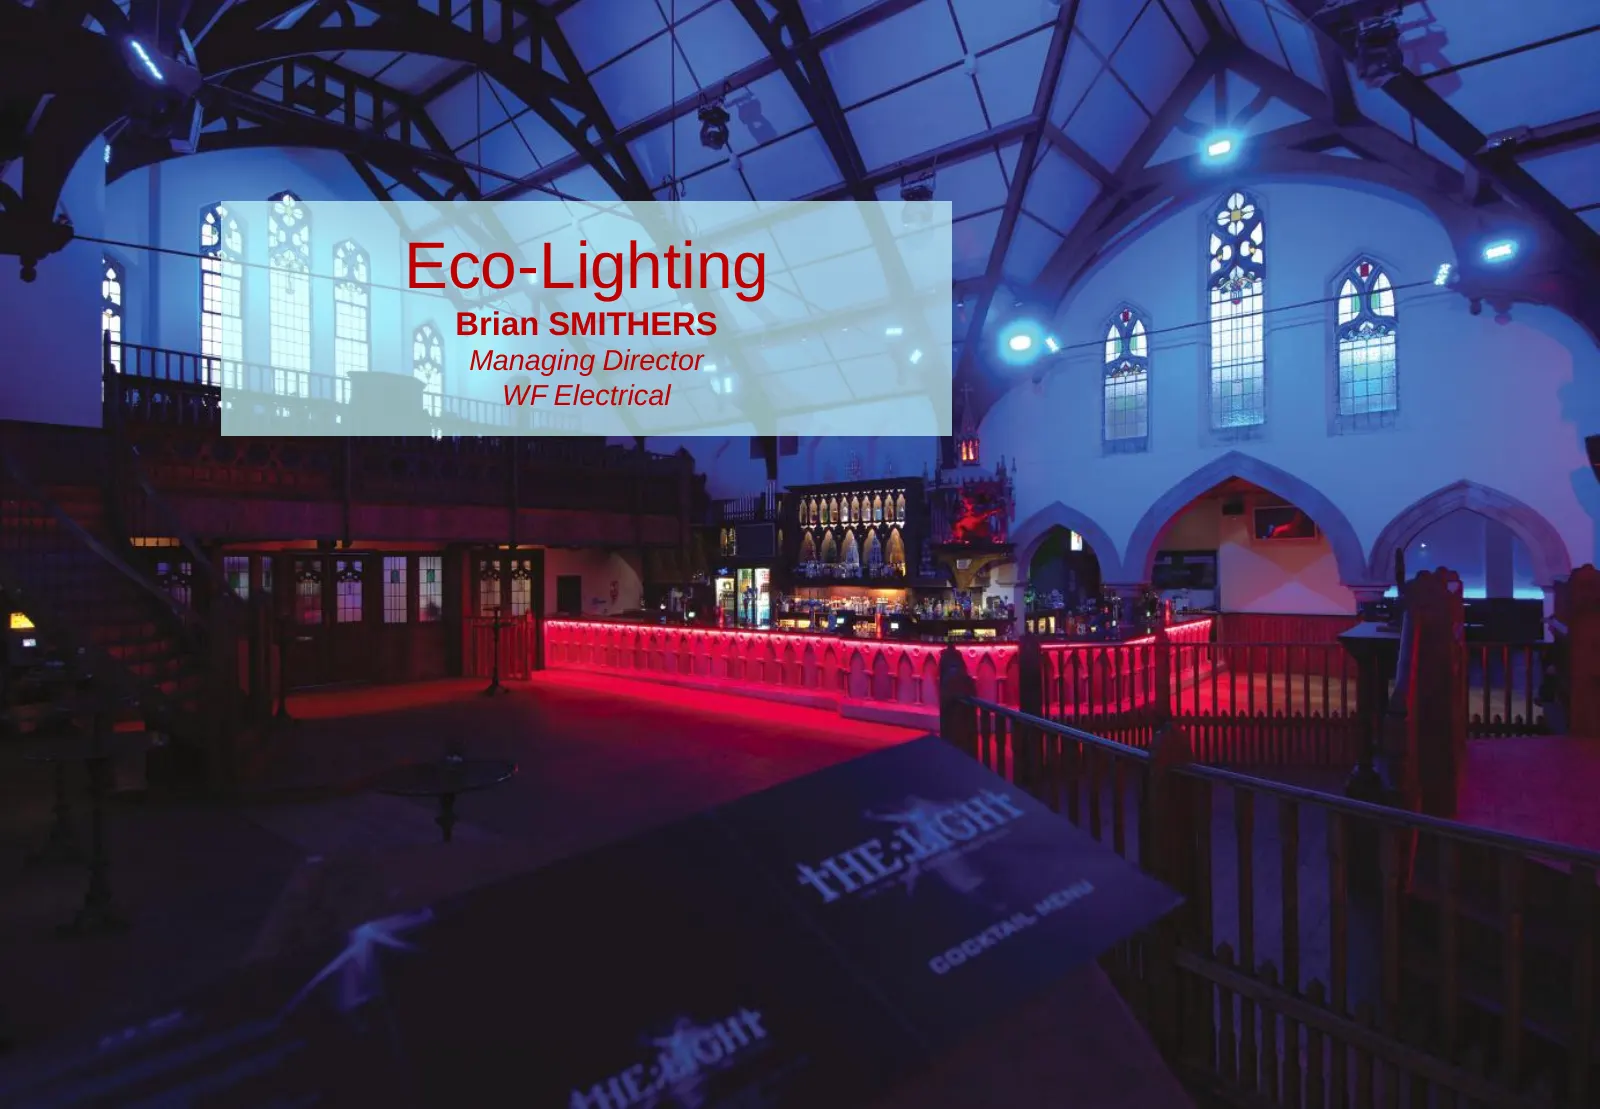
Eco-Lighting Brian SMITHERS Managing Director WF Electrical
Slide 28: Becoming an Energy-Efficient Solutions Provider
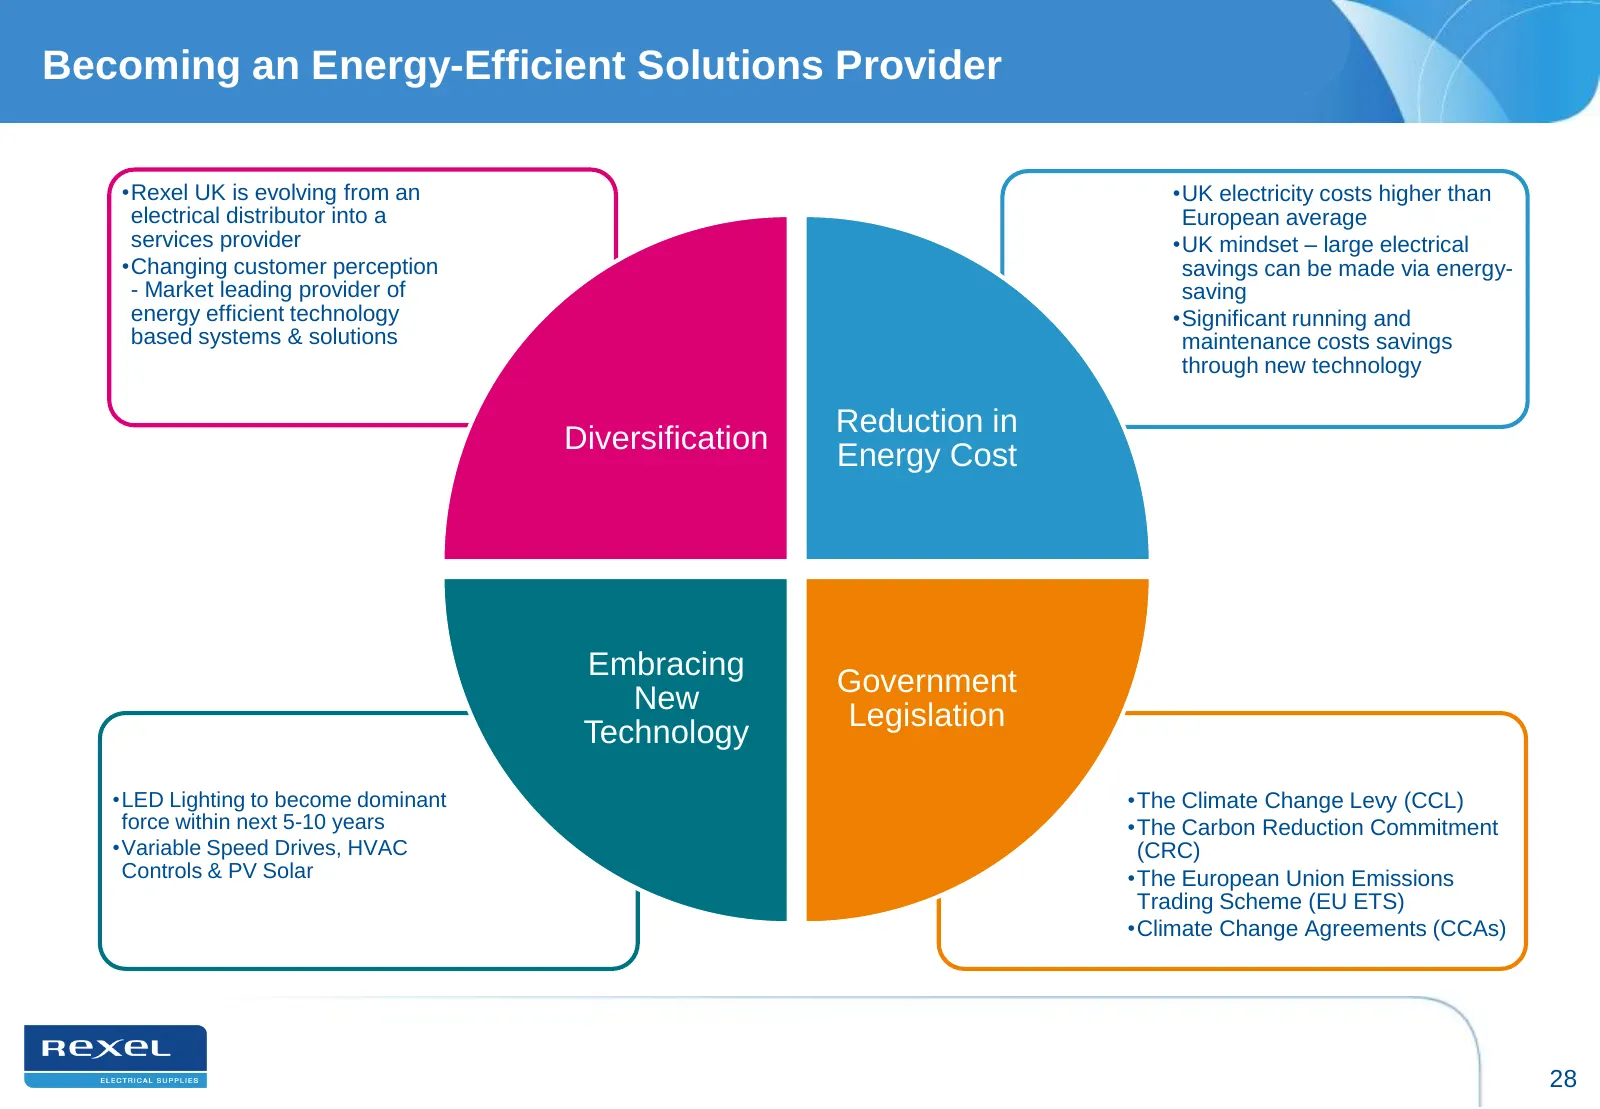
Becoming an Energy-Efficient Solutions Provider •Rexel UK is evolving from an •UK electricity costs higher than electrical distributor into a European average services provider •UK mindset – large electrical •Changing customer perception savings can be made via energy- - Market leading provider of s
Slide 29: The Light Source Market
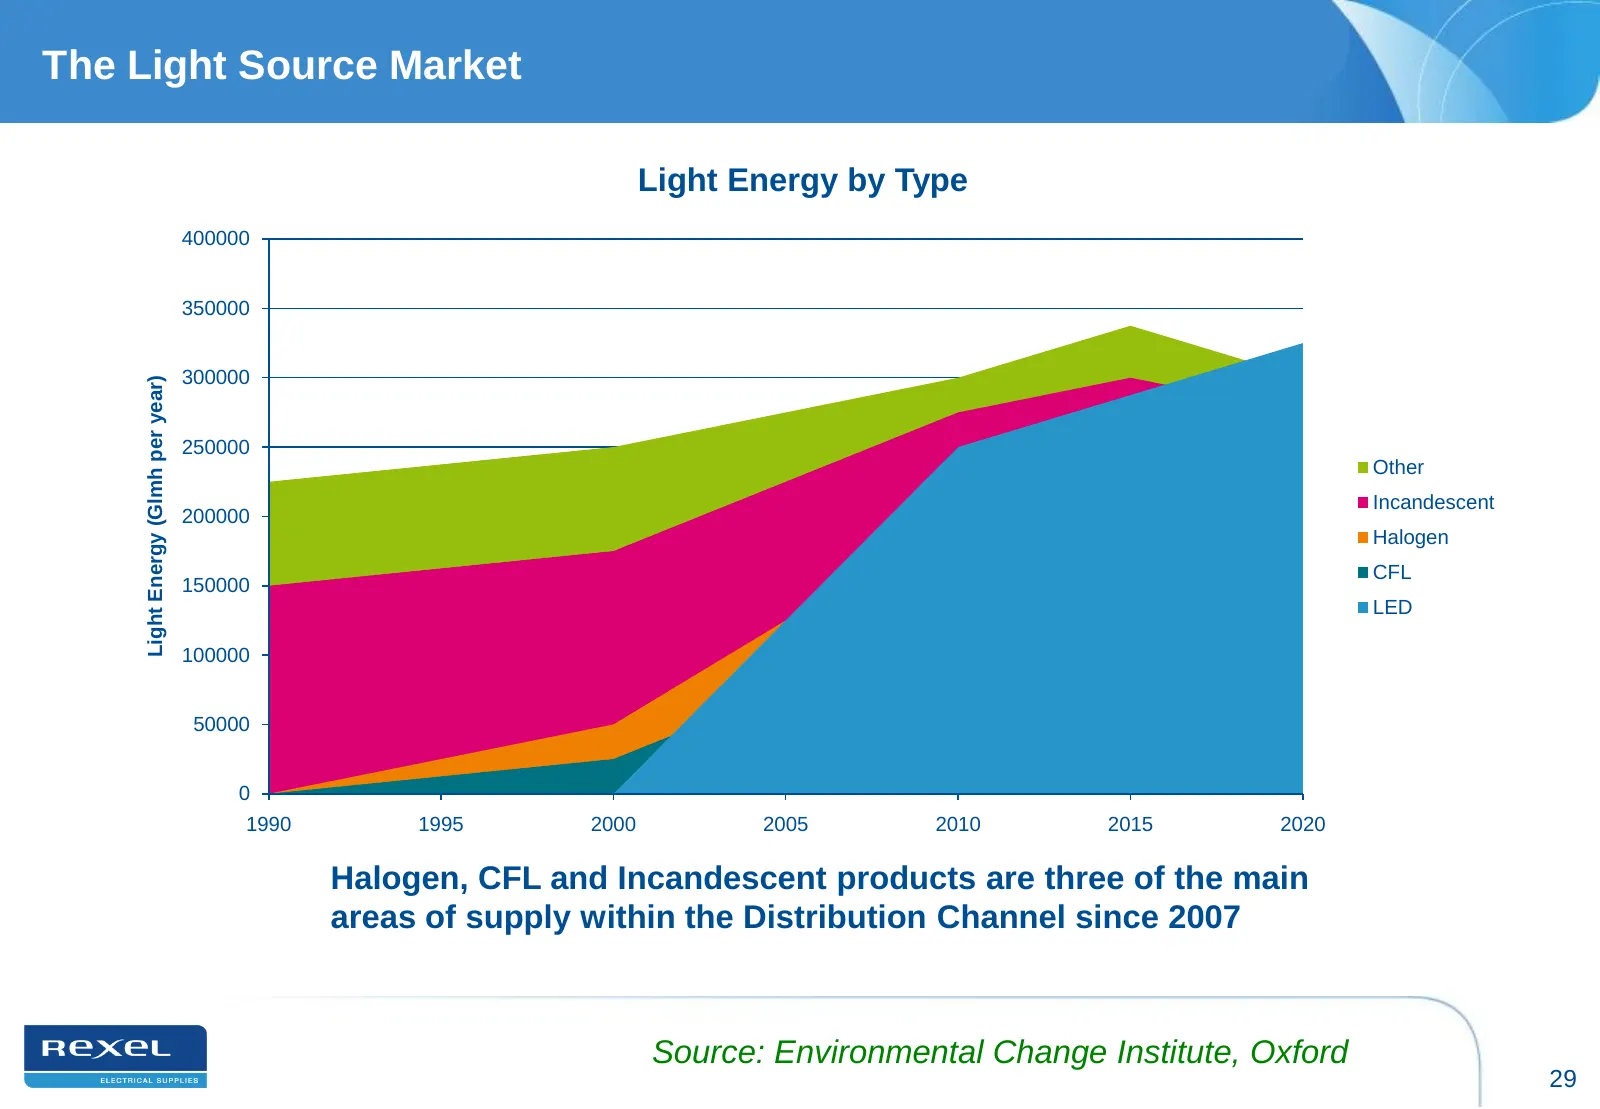
The Light Source Market Light Energy by Type 400000 350000 300000 Light Energy (Glmh per year) 250000 Other Incandescent 200000 Halogen CFL 150000 LED 100000 50000 0 1990 1995 2000 2005 2010 2015 2020 Halogen, CFL and Incandescent products are three of the main areas of supply within the Distributio
Slide 30: Market Opportunities
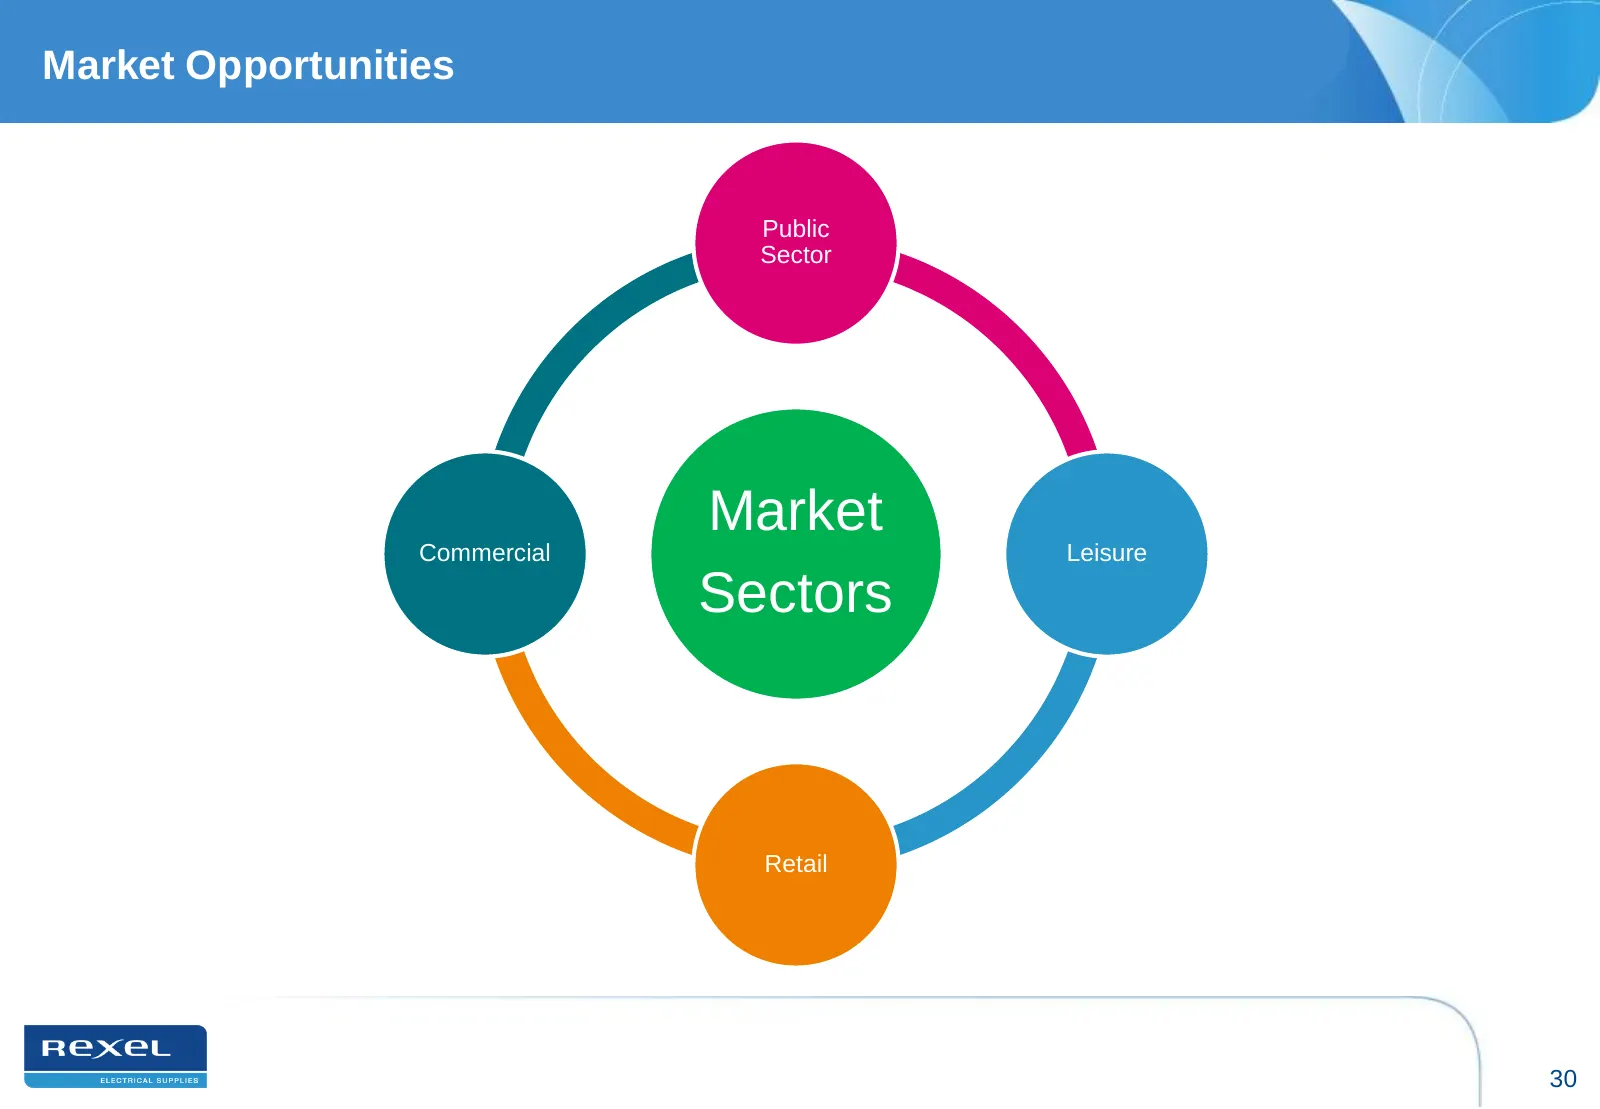
Market Opportunities Public Sector Market Commercial Leisure Sectors Retail 30
Slide 31: Coventry Golf Club
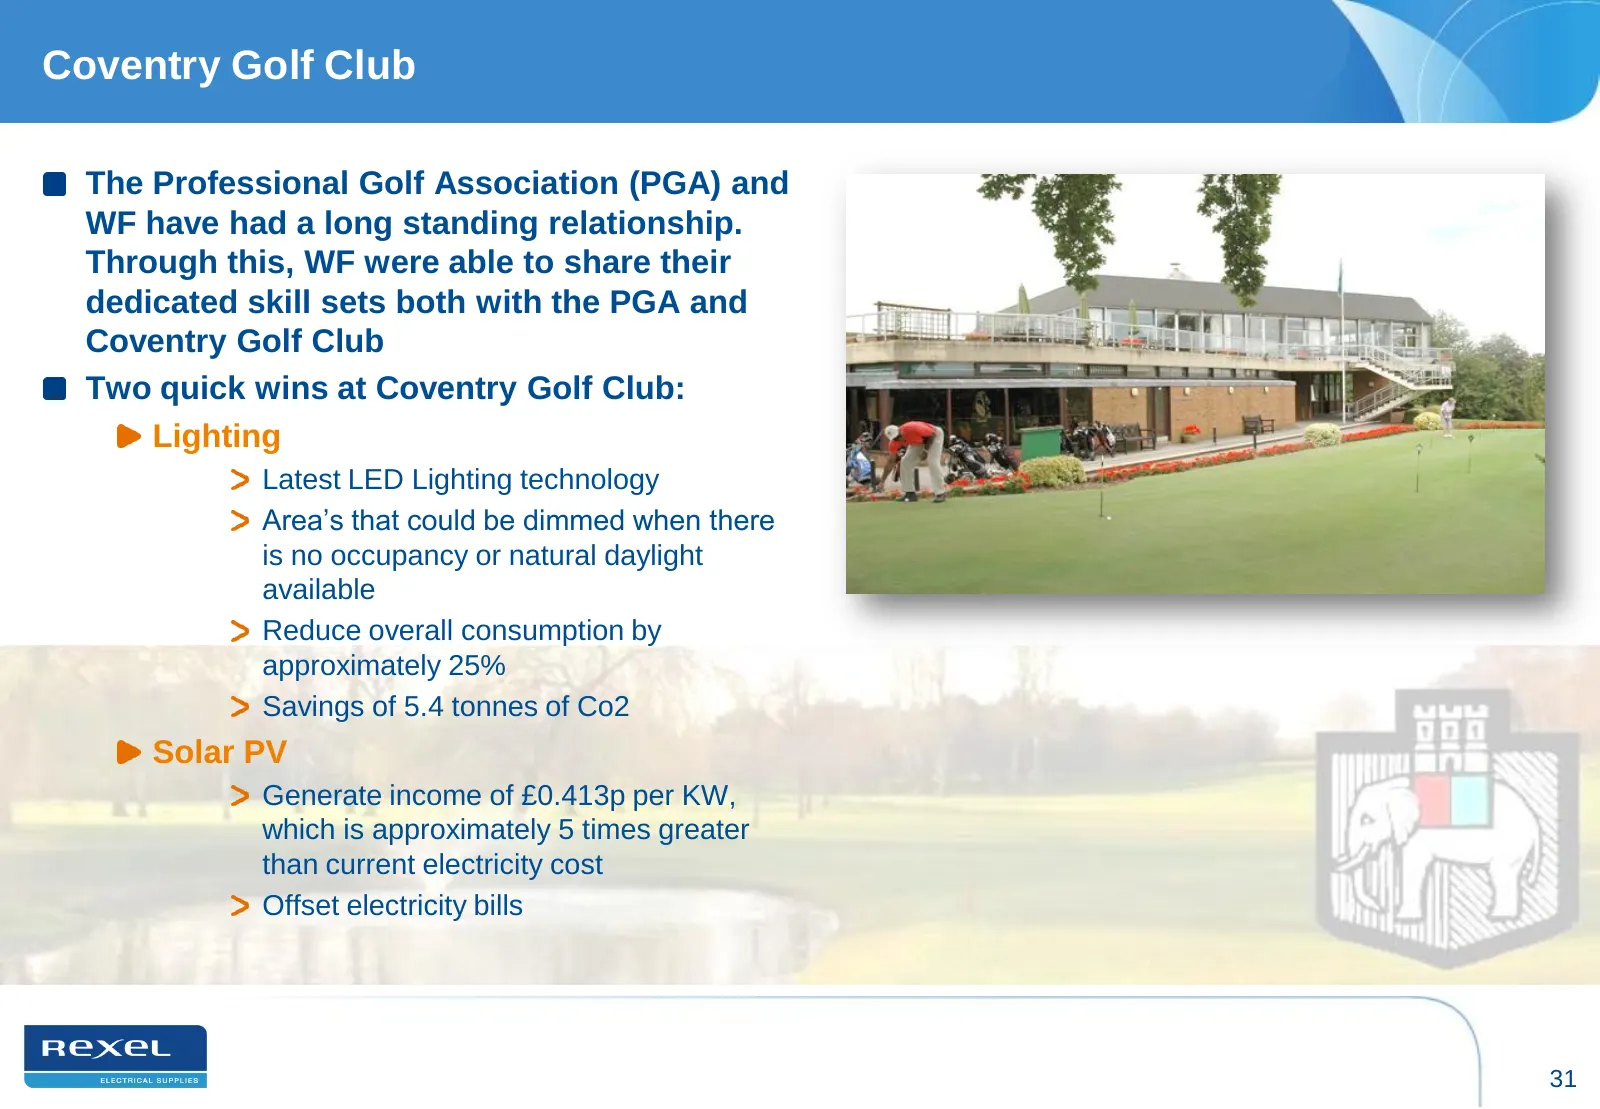
Coventry Golf Club The Professional Golf Association (PGA) and WF have had a long standing relationship. Through this, WF were able to share their dedicated skill sets both with the PGA and Coventry Golf Club Two quick wins at Coventry Golf Club: Lighting Latest LED Lighting technology Area’s that c
Slide 32: Thames Barrier
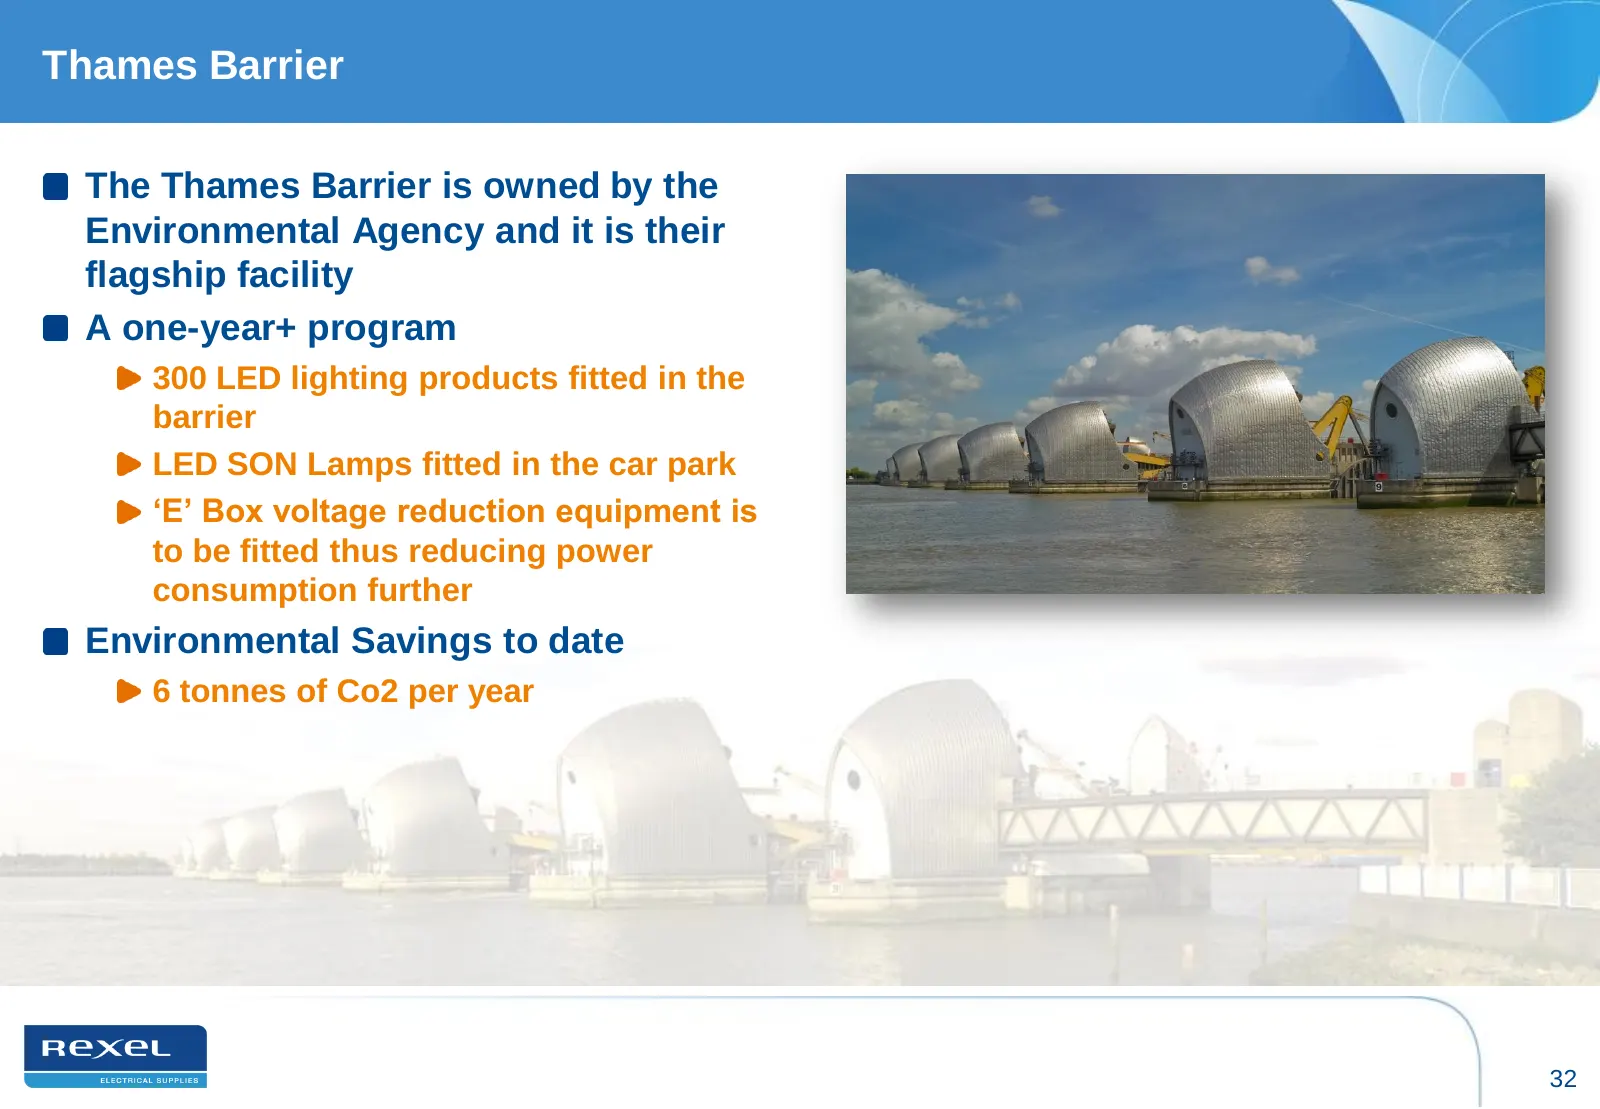
Thames Barrier The Thames Barrier is owned by the Environmental Agency and it is their flagship facility A one-year+ program 300 LED lighting products fitted in the barrier LED SON Lamps fitted in the car park „E‟ Box voltage reduction equipment is to be fitted thus reducing power consumption furthe
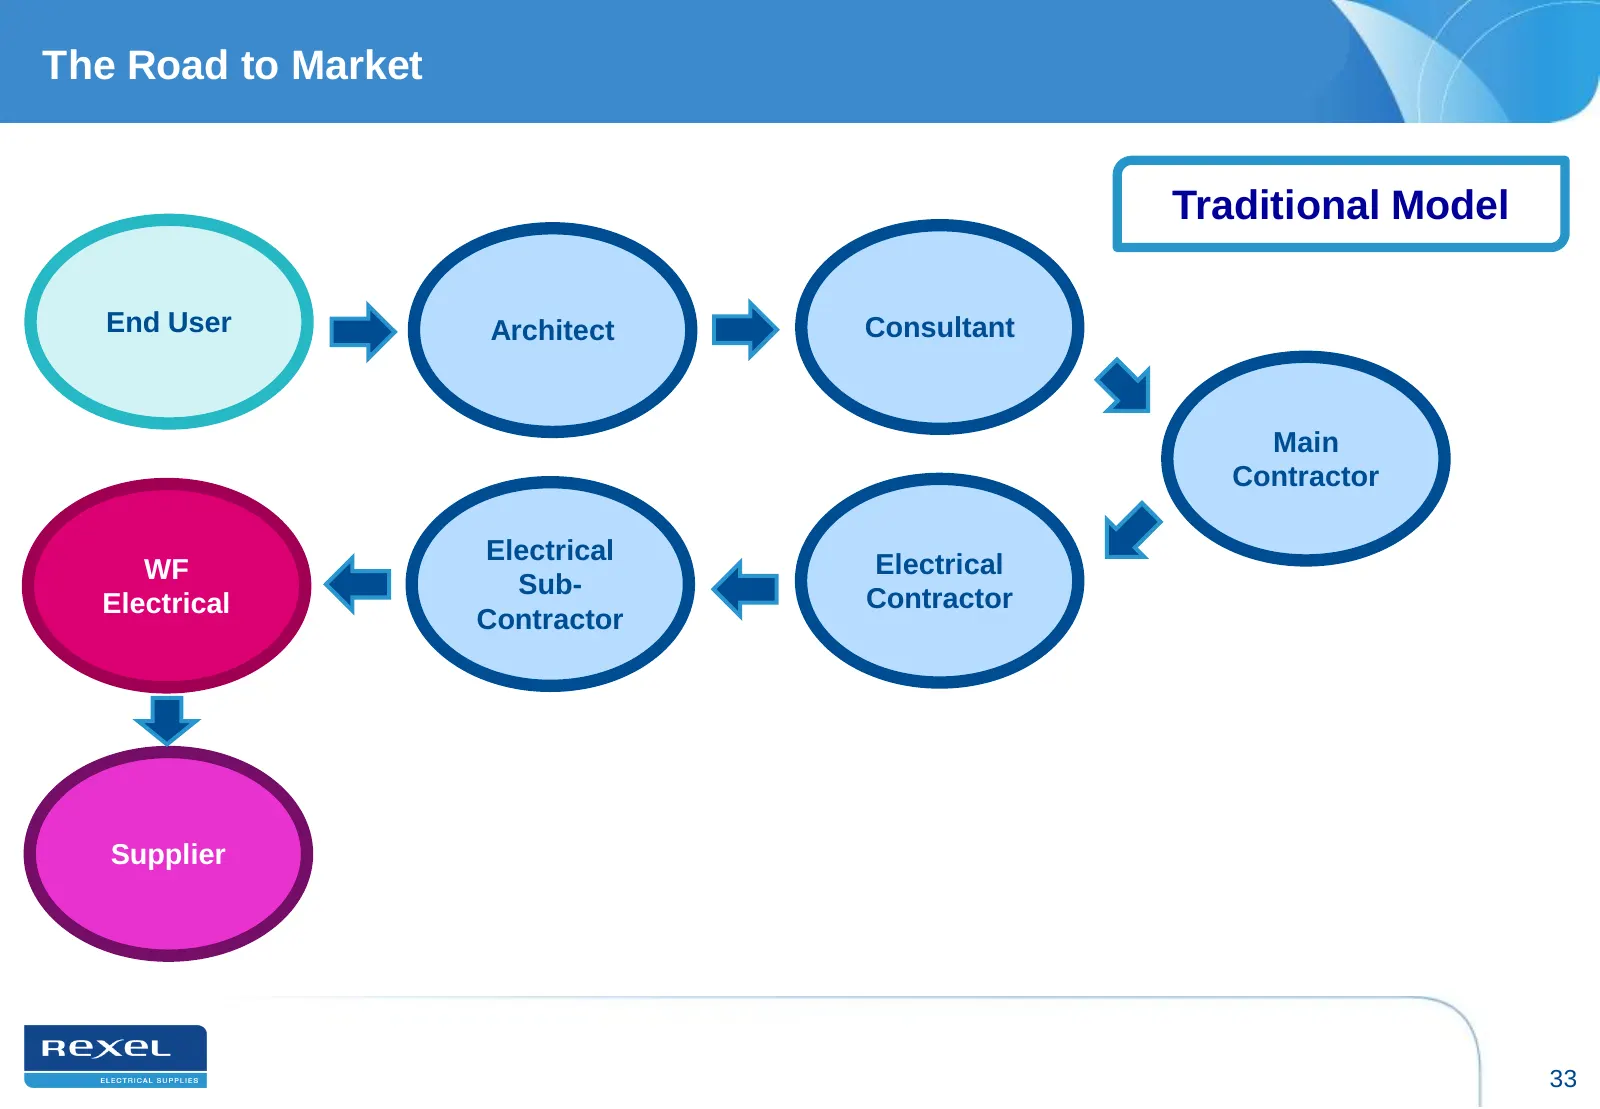
Slide 33: The Road to Market: Traditional Model
The Road to Market Traditional Model End User Architect Consultant Main Contractor Electrical Electrical WF Sub- Contractor Electrical Contractor Supplier 33
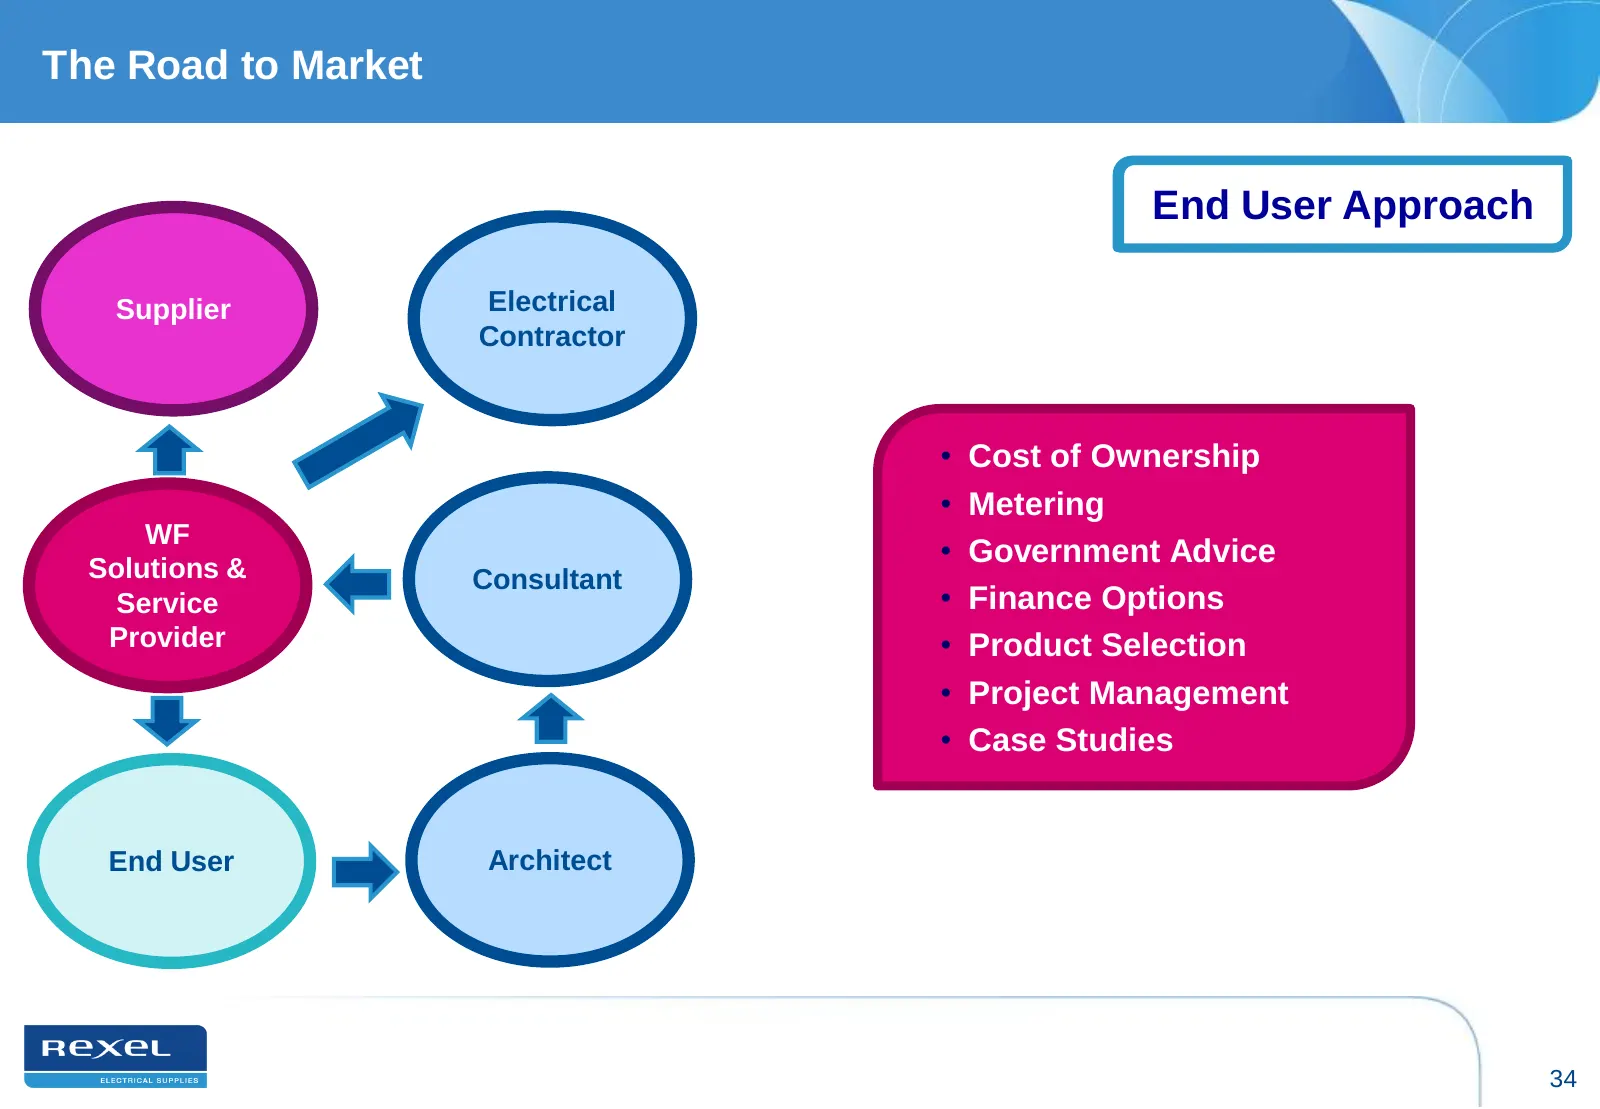
Slide 34: The Road to Market: New Approach
The Road to Market Traditional End Model User Approach Supplier Electrical Contractor • Cost of Ownership • Metering WF • Government Advice Solutions & Consultant Service • Finance Options Provider • Product Selection • Project Management • Case Studies End User Architect 34
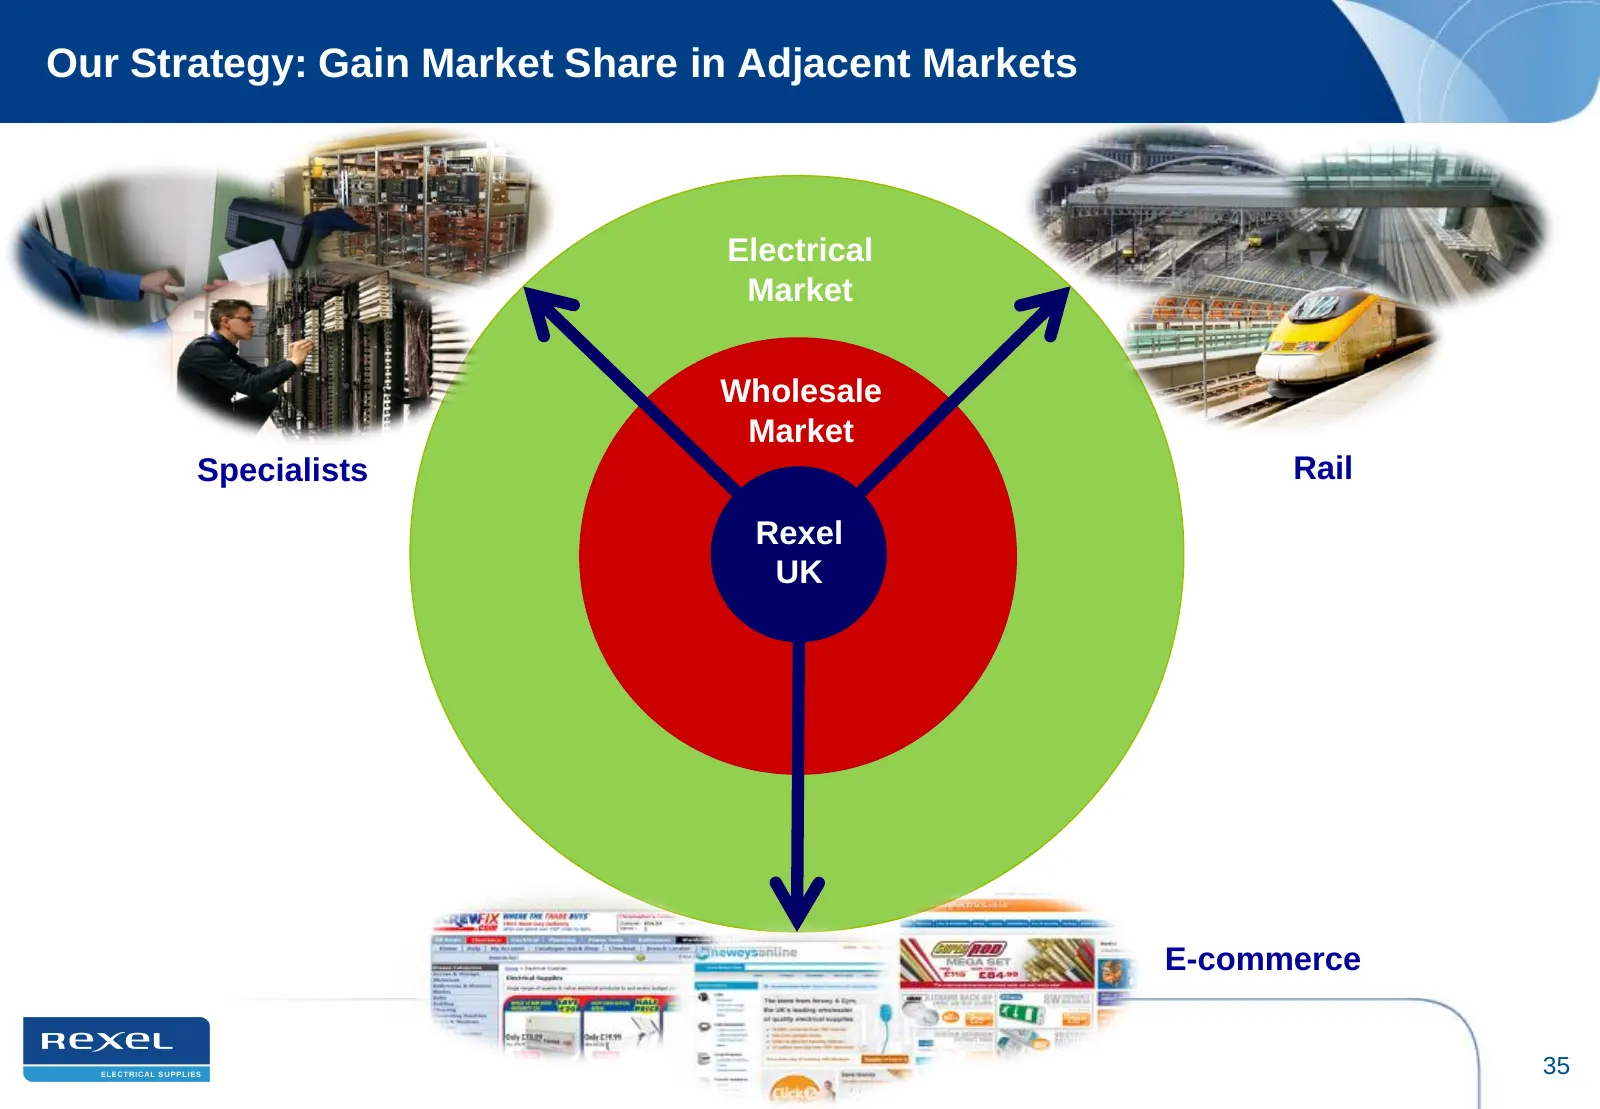
Slide 35: Our Strategy: Gain Market Share in Adjacent Markets
Our Strategy: Gain Market Share in Adjacent Markets Electrical Market Wholesale Market Specialists Rail Rexel UK E-commerce 35
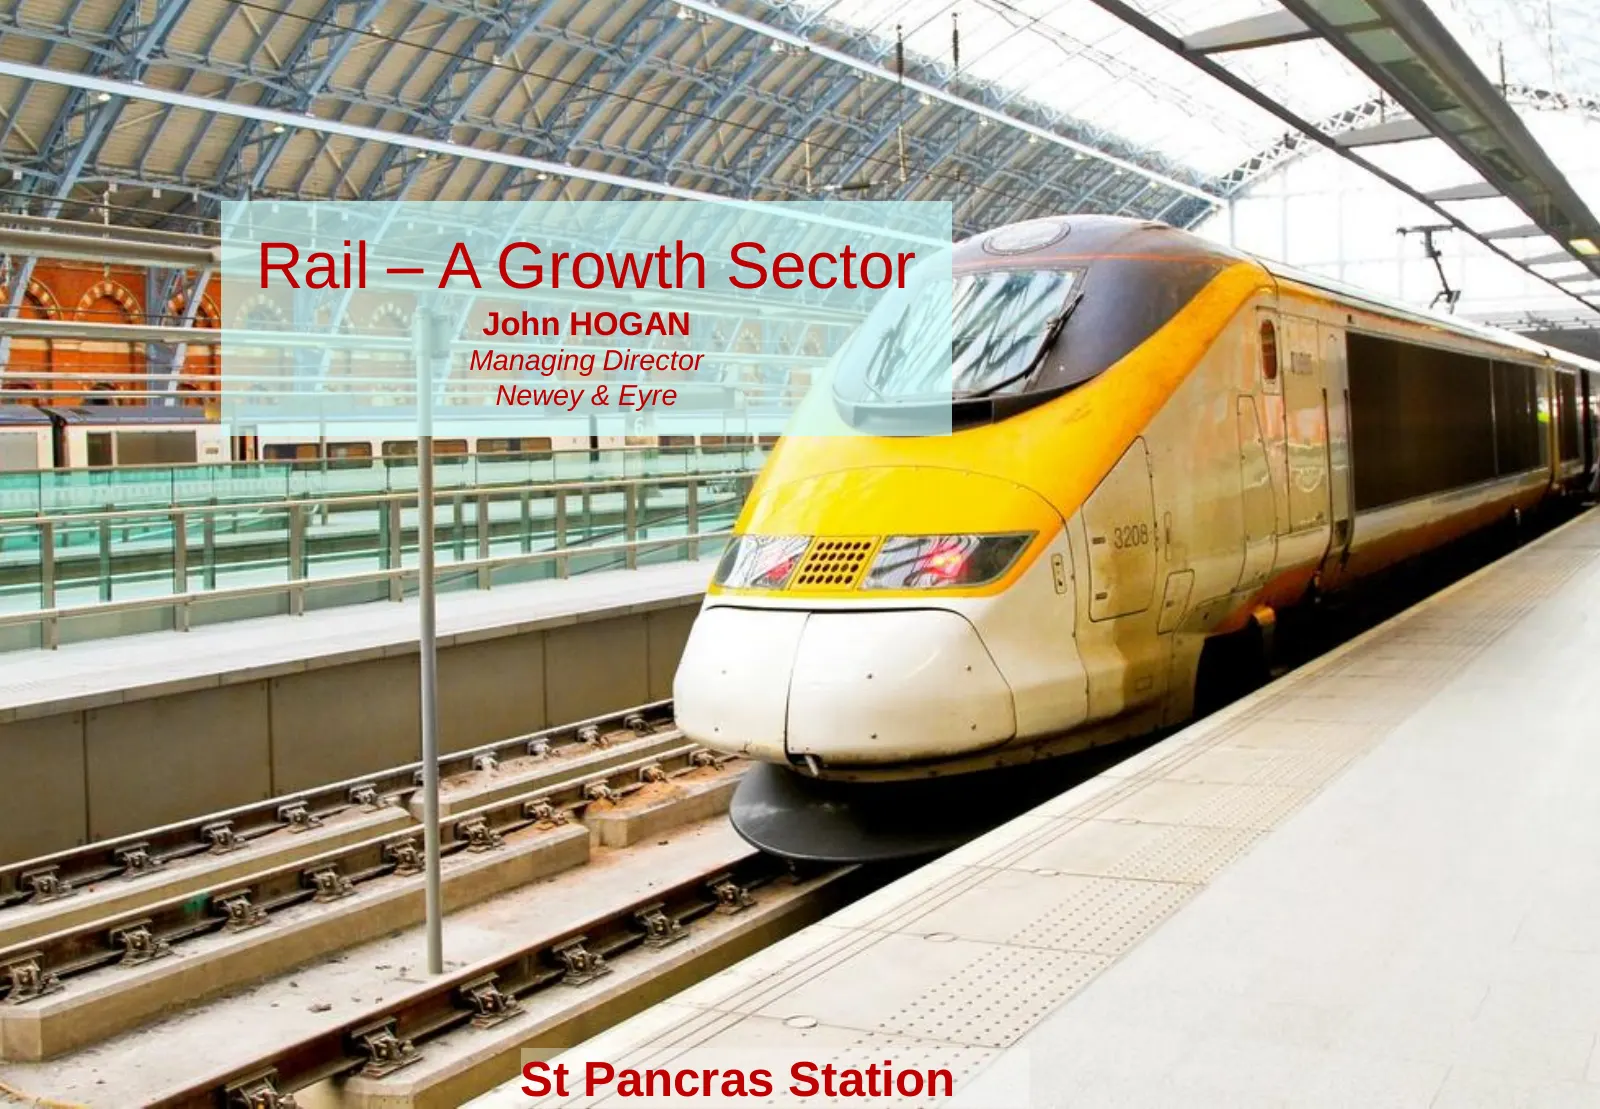
Slide 36: Rail – A Growth Sector
Rail – A Growth Sector John HOGAN Managing Director Newey & Eyre St Pancras Station
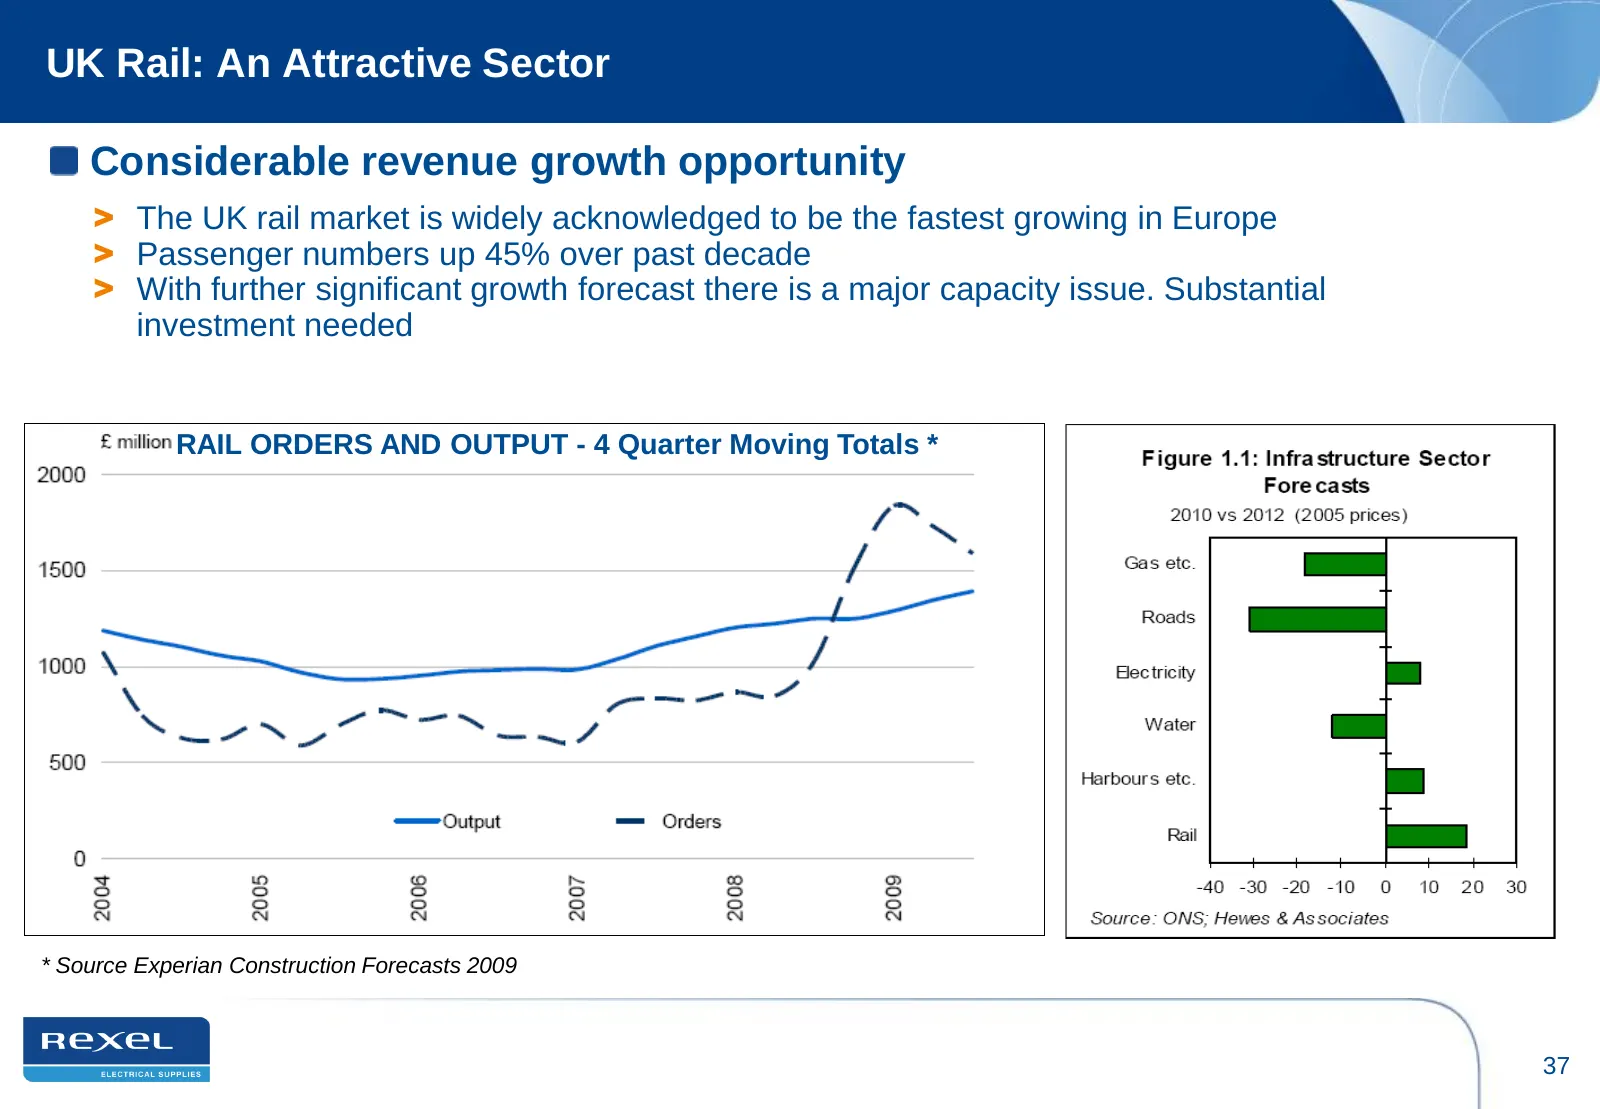
Slide 37: UK Rail: An Attractive Sector
UK Rail: An Attractive Sector Considerable revenue growth opportunity > The UK rail market is widely acknowledged to be the fastest growing in Europe > Passenger numbers up 45% over past decade > With further significant growth forecast there is a major capacity issue. Substantial investment needed
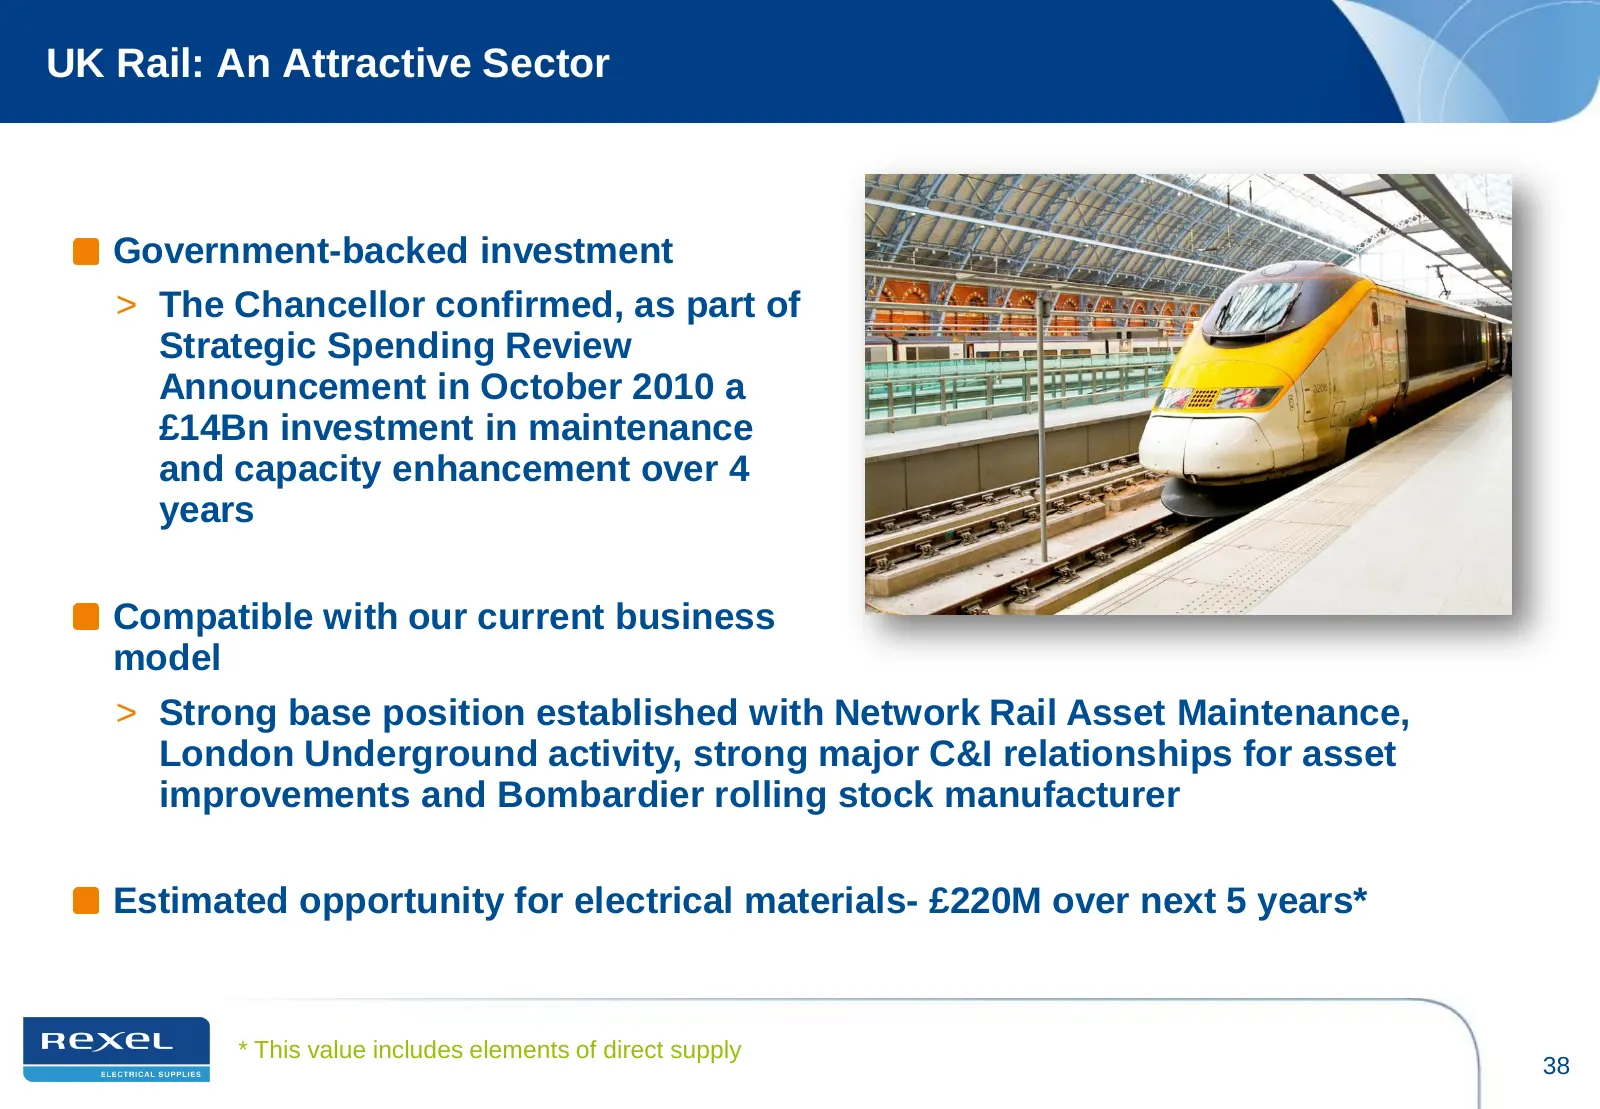
Slide 38: UK Rail: An Attractive Sector
UK Rail: An Attractive Sector Government-backed investment > The Chancellor confirmed, as part of Strategic Spending Review Announcement in October 2010 a £14Bn investment in maintenance and capacity enhancement over 4 years Compatible with our current business model > Strong base position establish
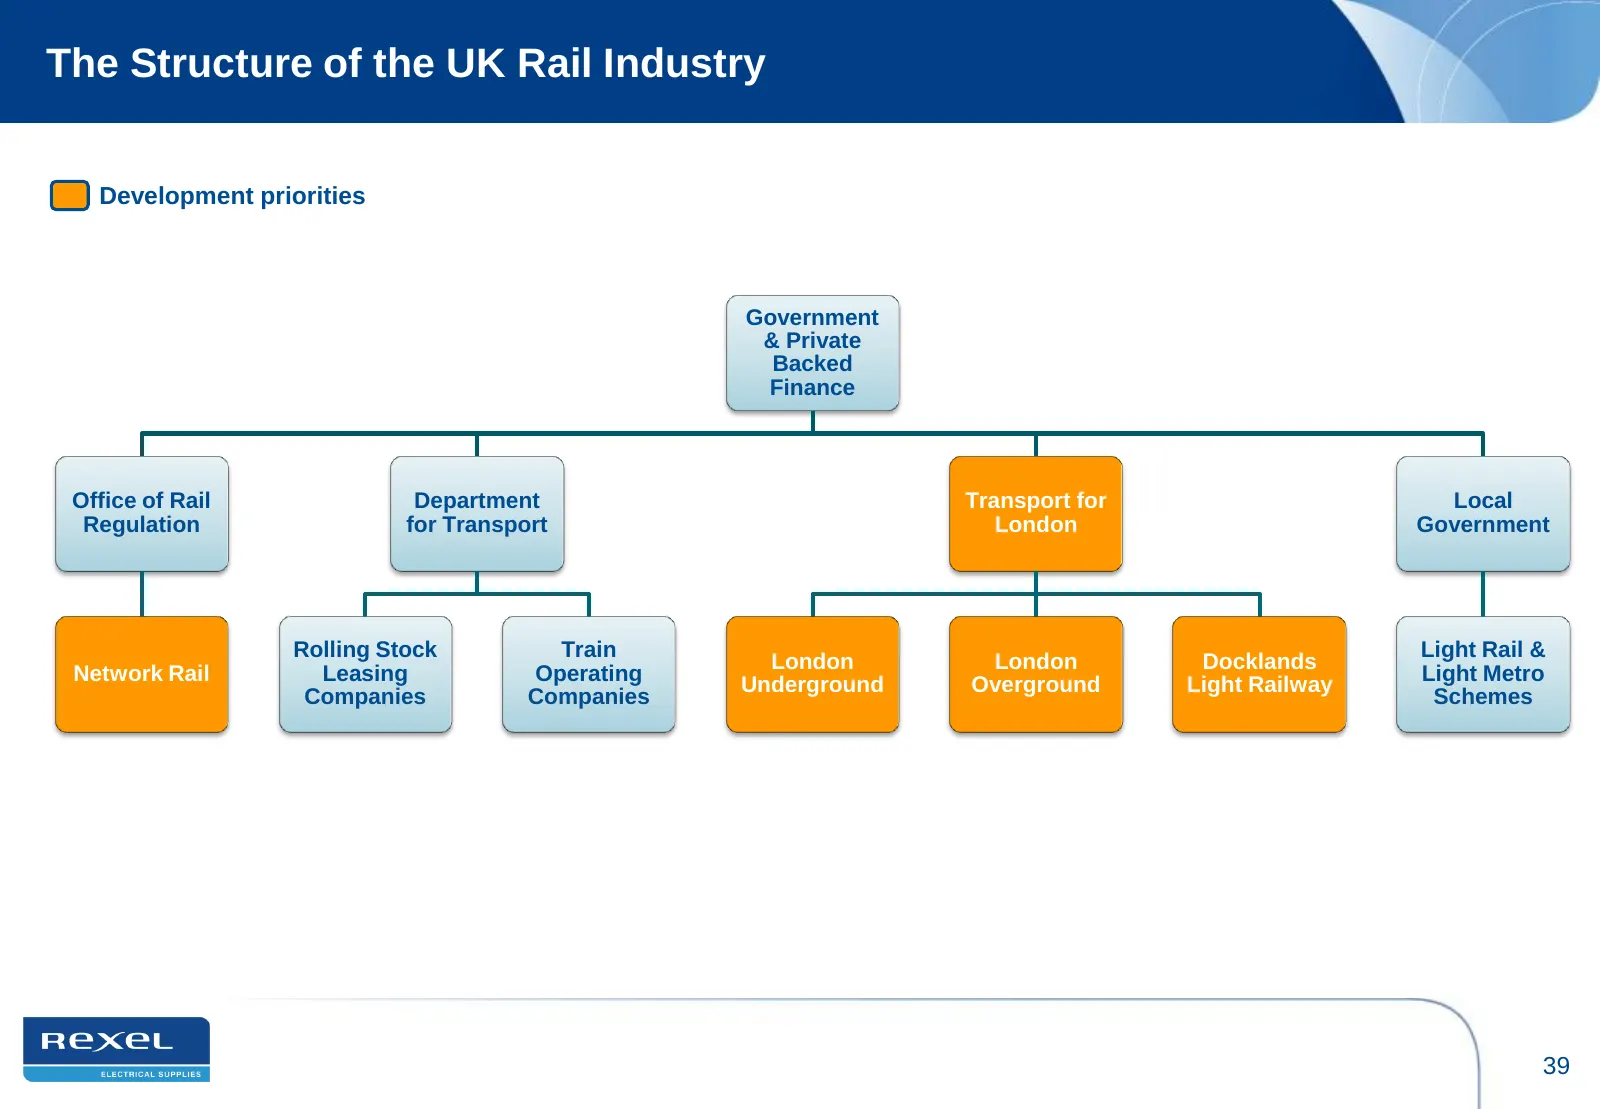
Slide 39: The Structure of the UK Rail Industry
The Structure of the UK Rail Industry Development priorities Government & Private Backed Finance Office of Rail Department Transport for Local Regulation for Transport London Government Rolling Stock Train Light Rail & London London Docklands Network Rail Leasing Operating Light Metro Underground Ov
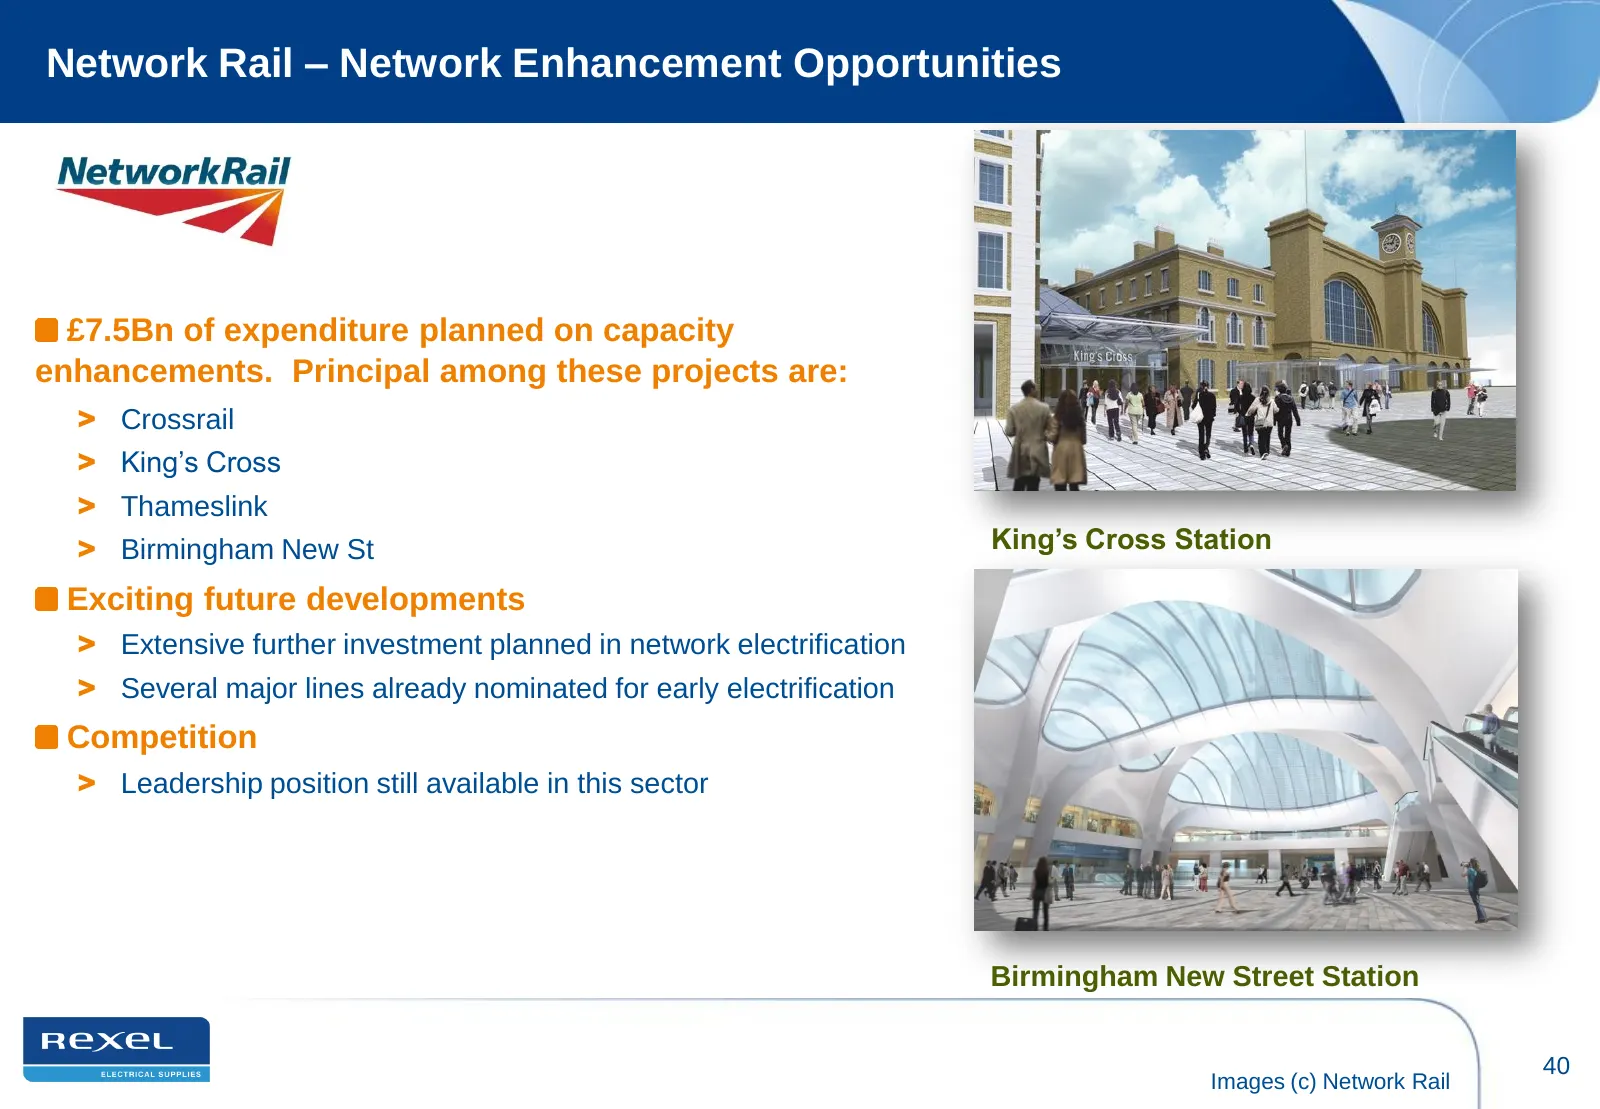
Slide 40: Network Rail – Network Enhancement Opportunities
Network Rail – Network Enhancement Opportunities £7.5Bn of expenditure planned on capacity enhancements. Principal among these projects are: > Crossrail > King’s Cross > Thameslink > Birmingham New St King‟s Cross Station Exciting future developments > Extensive further investment planned in network
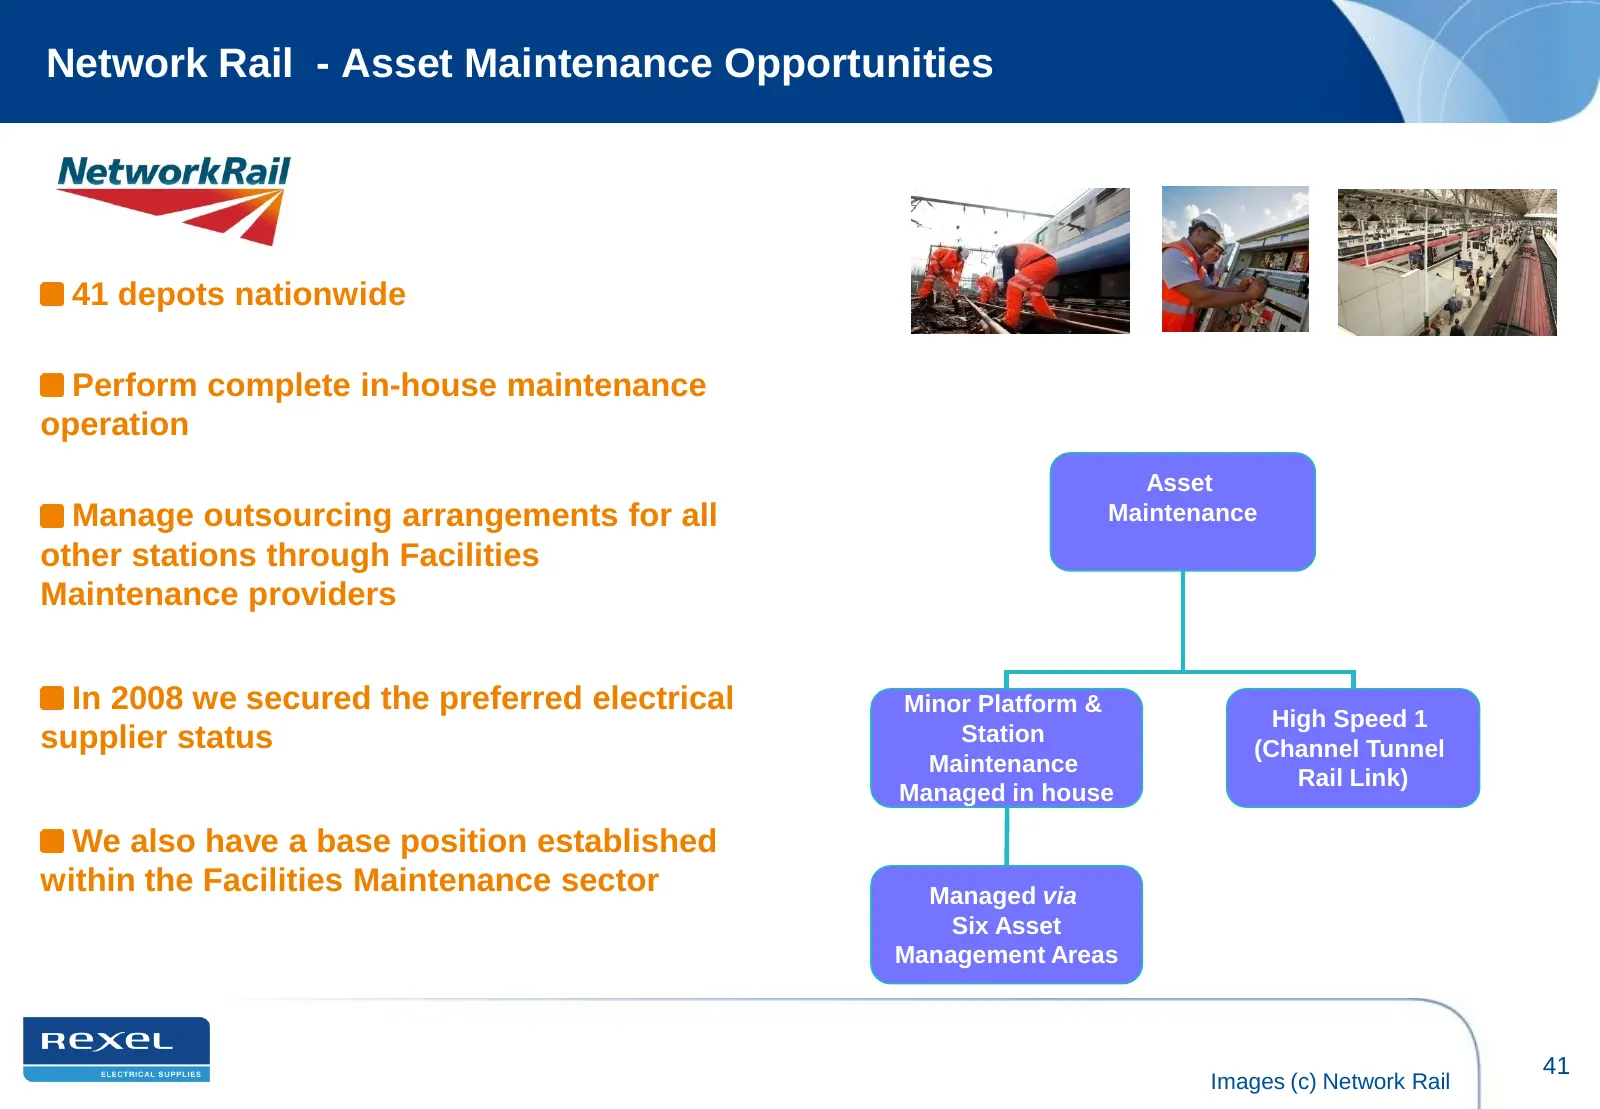
Slide 41: Network Rail - Asset Maintenance Opportunities
Network Rail - Asset Maintenance Opportunities 41 depots nationwide Perform complete in-house maintenance operation Asset Manage outsourcing arrangements for all Maintenance other stations through Facilities Maintenance providers In 2008 we secured the preferred electrical Minor Platform & High Spee
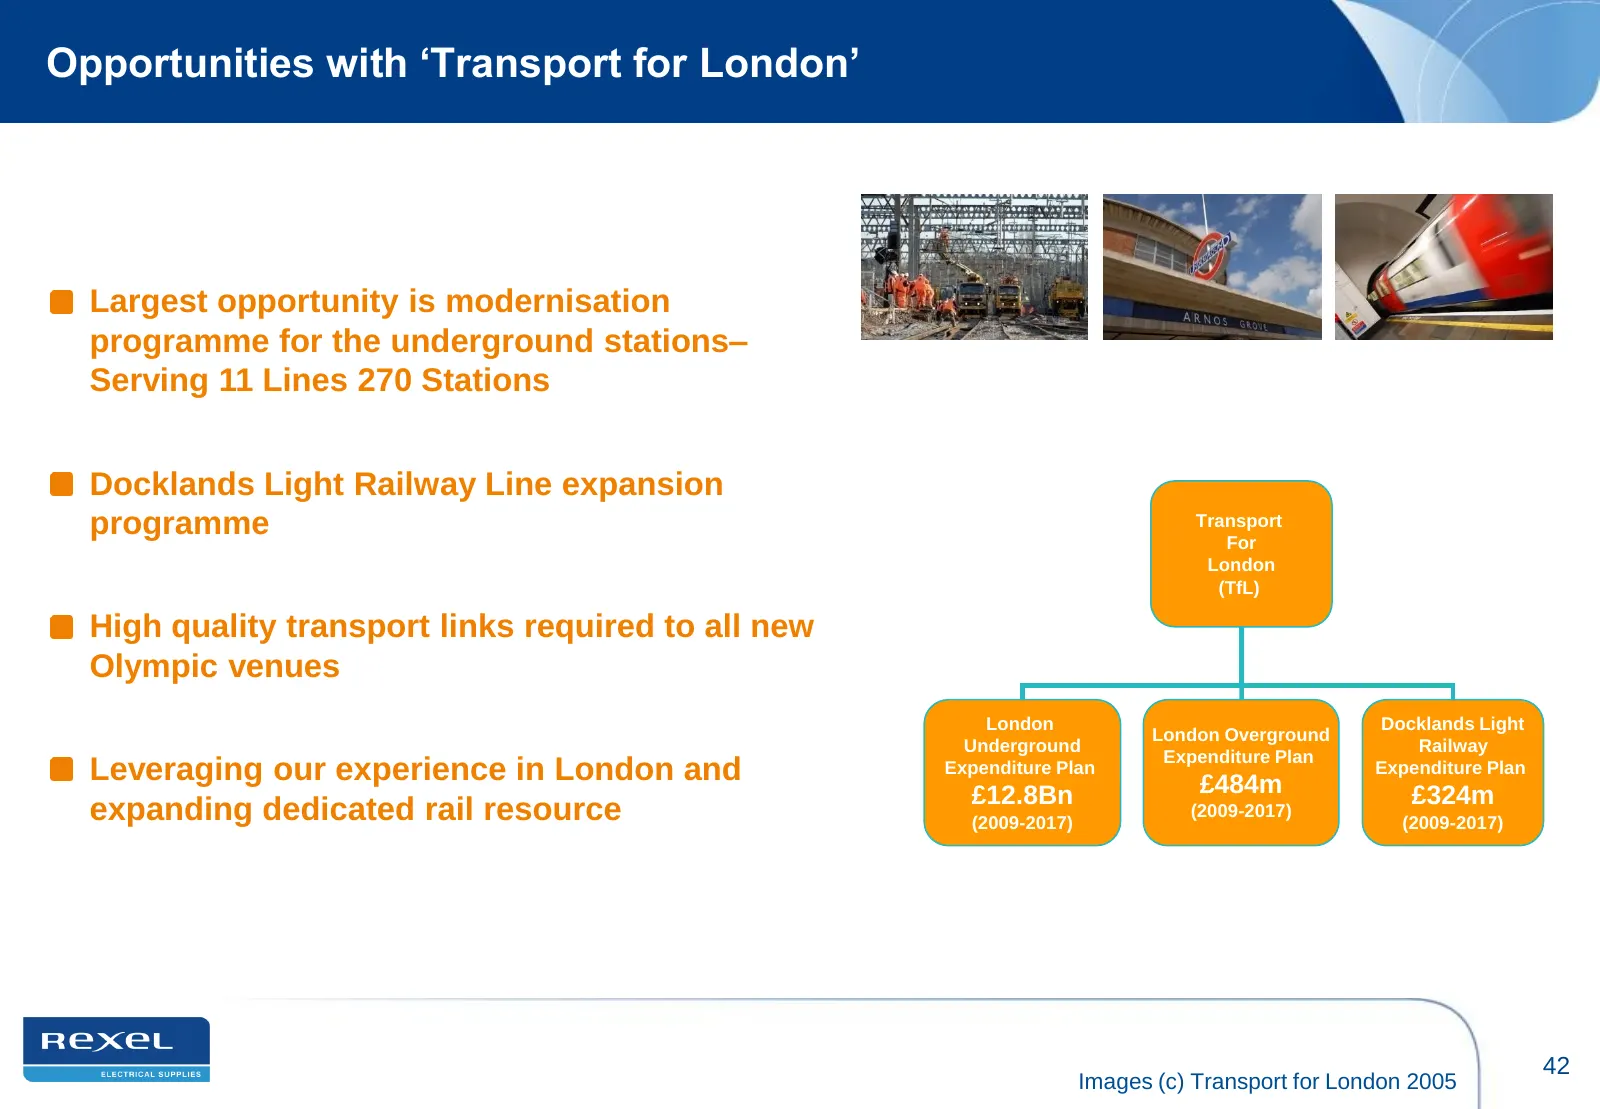
Slide 42: Opportunities with Transport for London
Opportunities with „Transport for London‟ Largest opportunity is modernisation programme for the underground stations– Serving 11 Lines 270 Stations Docklands Light Railway Line expansion programme Transport For London (TfL) High quality transport links required to all new Olympic venues London Dock
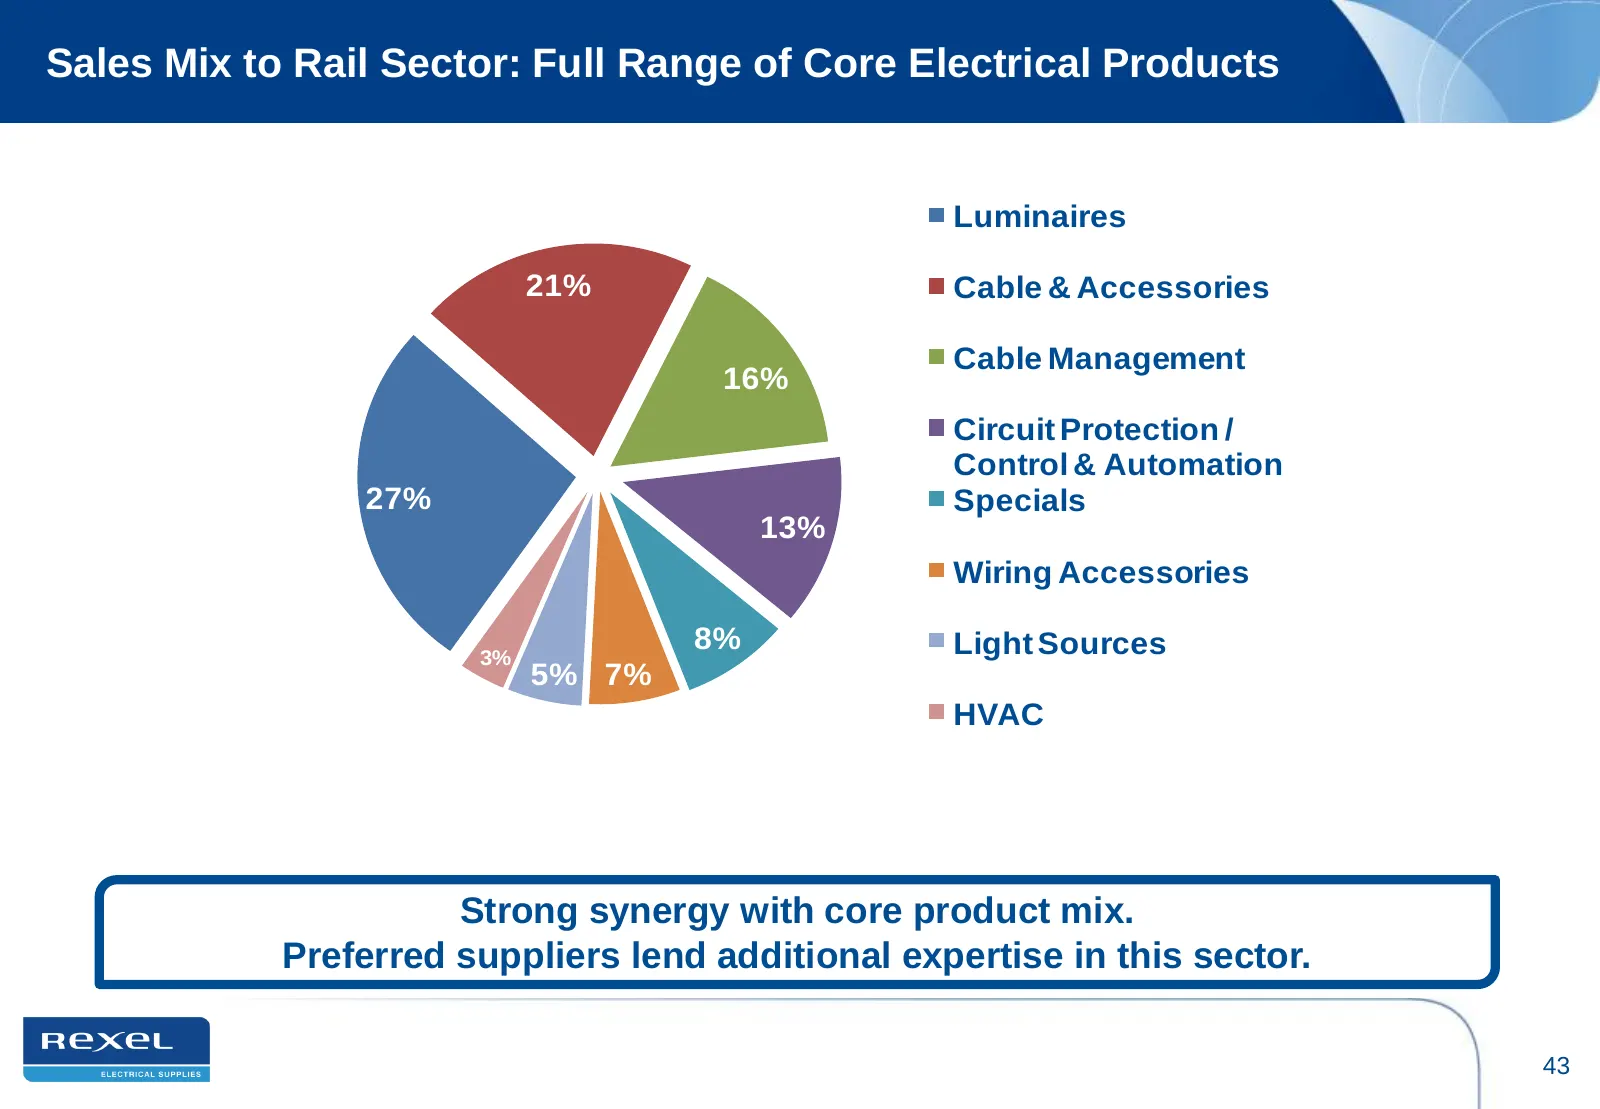
Slide 43: Sales Mix to Rail Sector: Full Range of Core Electrical Products
Sales Mix to Rail Sector: Full Range of Core Electrical Products Luminaires 21% Cable & Accessories Cable Management 16% Circuit Protection / Control & Automation 27% Specials 13% Wiring Accessories 8% Light Sources 3% 5% 7% HVAC Strong synergy with core product mix. Preferred suppliers lend additio
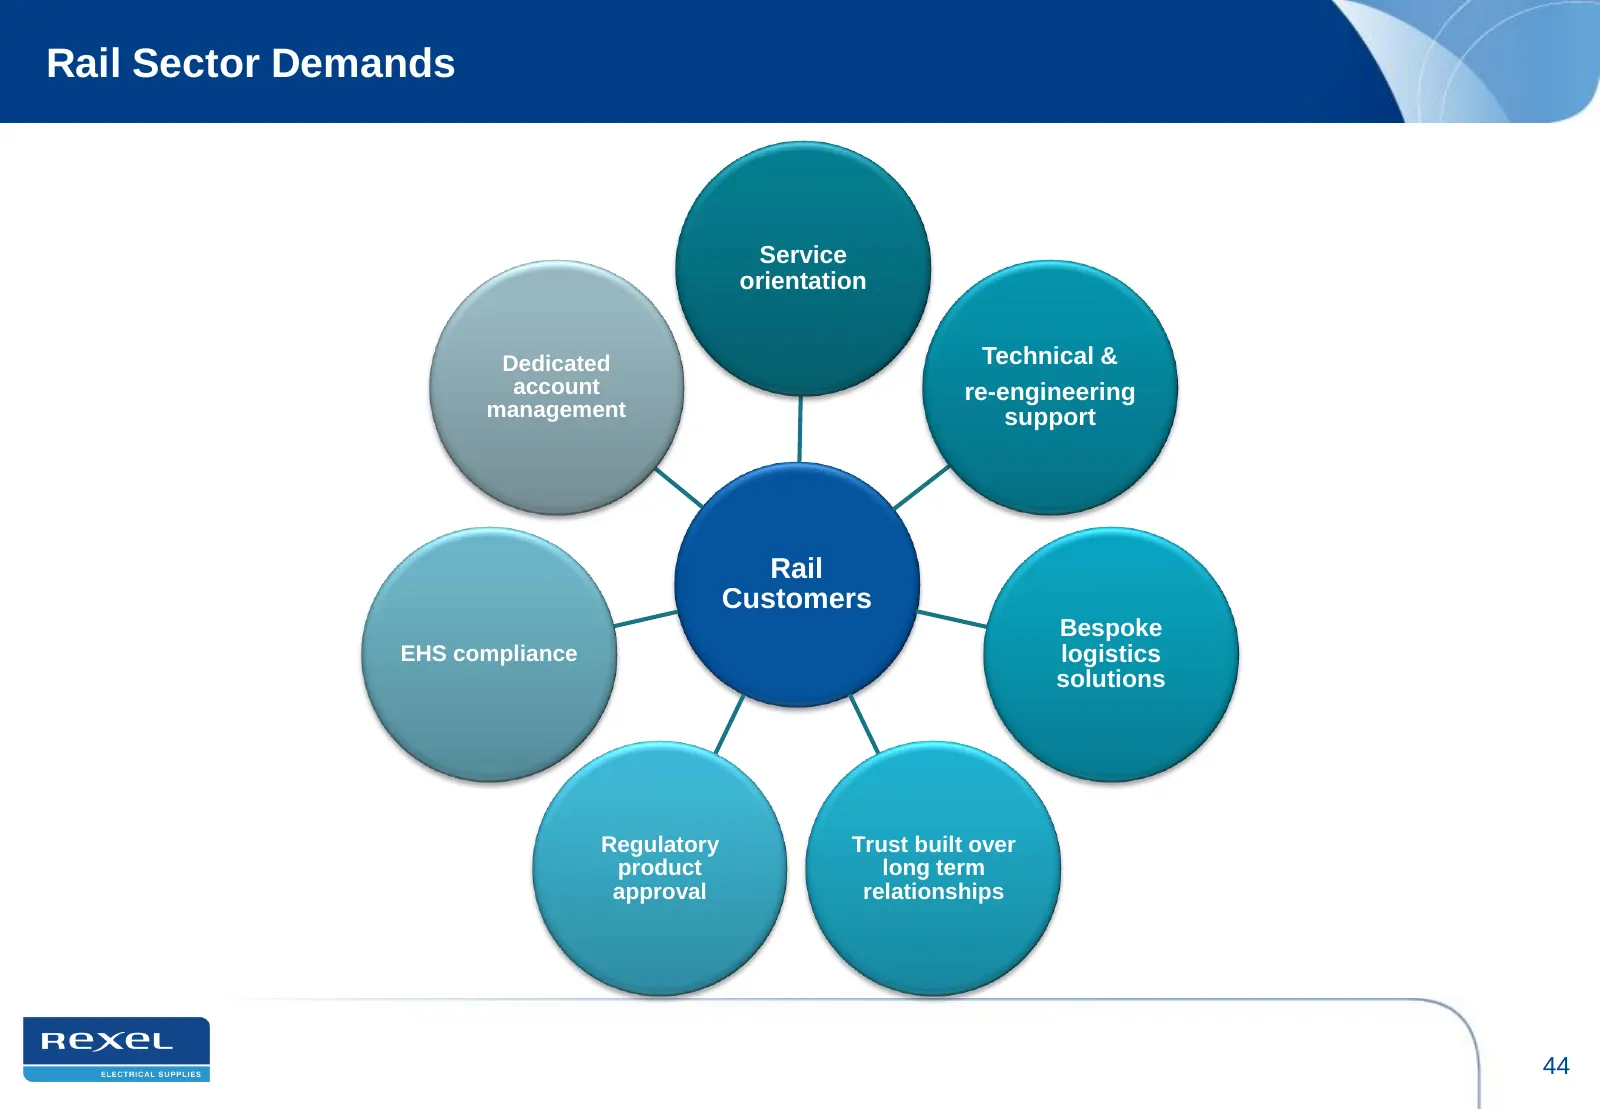
Slide 44: Rail Sector Demands
Rail Sector Demands Service orientation Dedicated Technical & account re-engineering management support Rail Customers Bespoke EHS compliance logistics solutions Regulatory Trust built over product long term approval relationships 44
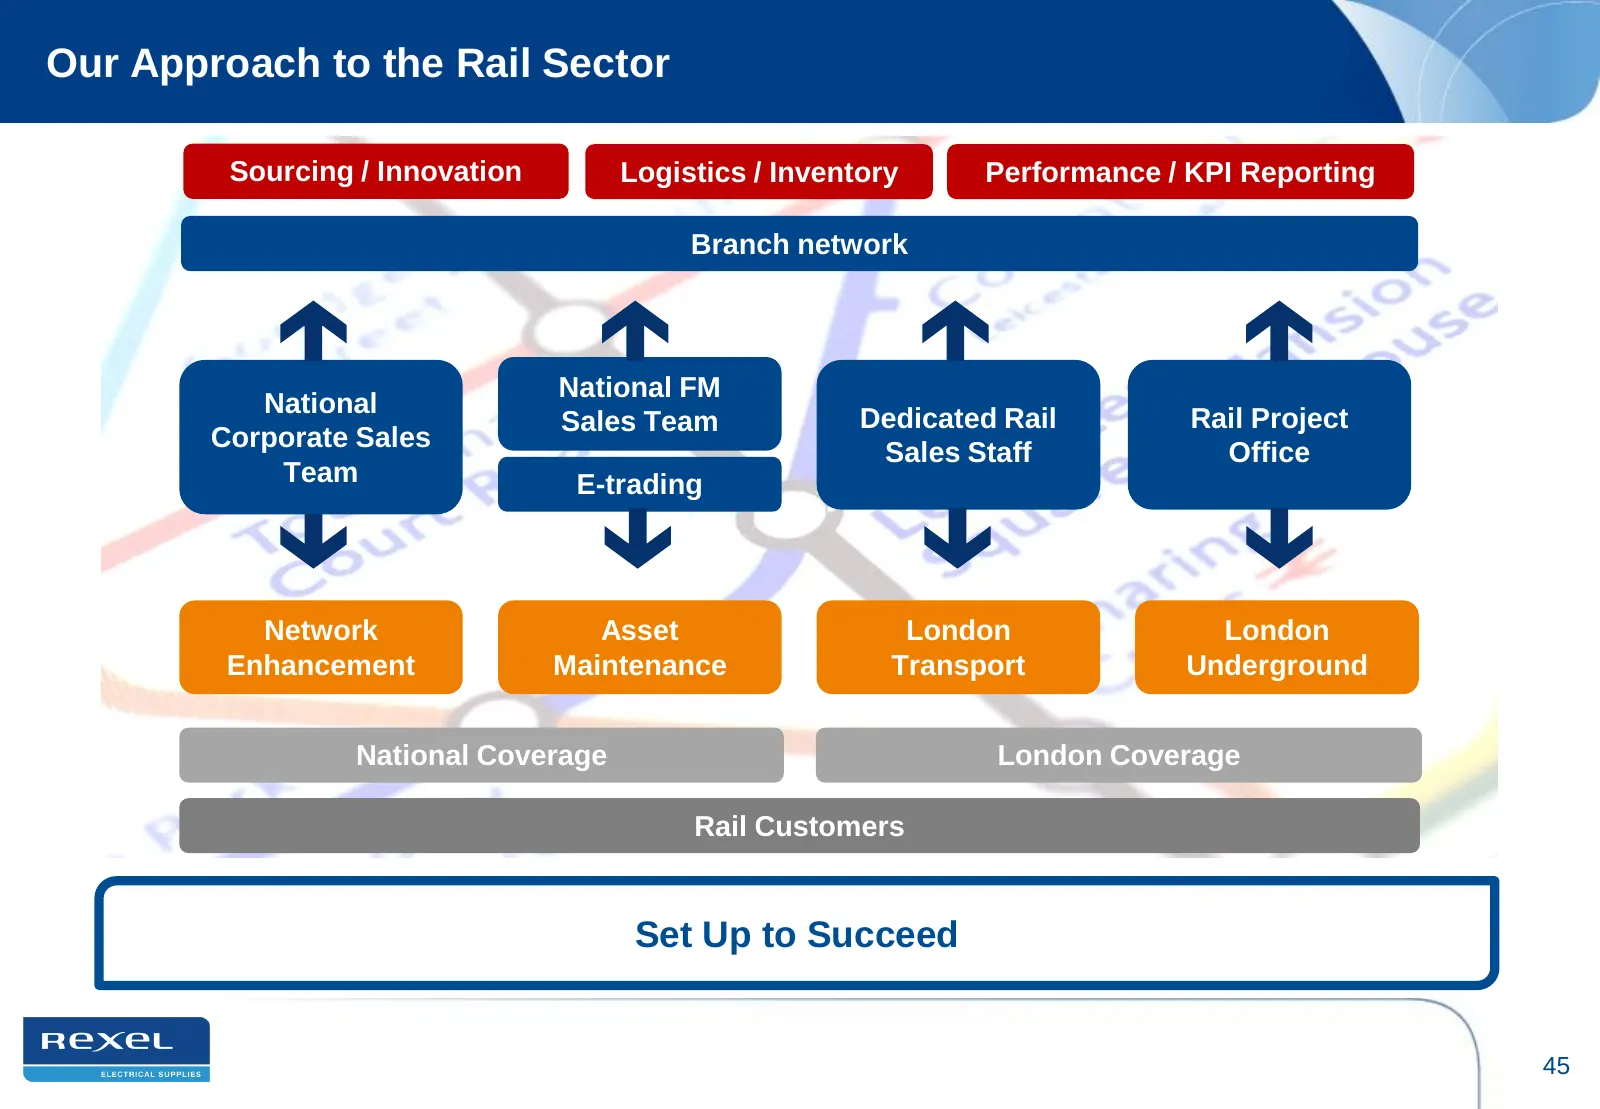
Slide 45: Our Approach to the Rail Sector
Our Approach to the Rail Sector Sourcing / Innovation Logistics / Inventory Performance / KPI Reporting Branch network National FM National Sales Team Dedicated Rail Rail Project Corporate Sales Sales Staff Office Team E-trading Network Asset London London Enhancement Maintenance Transport Undergrou

Slide 46
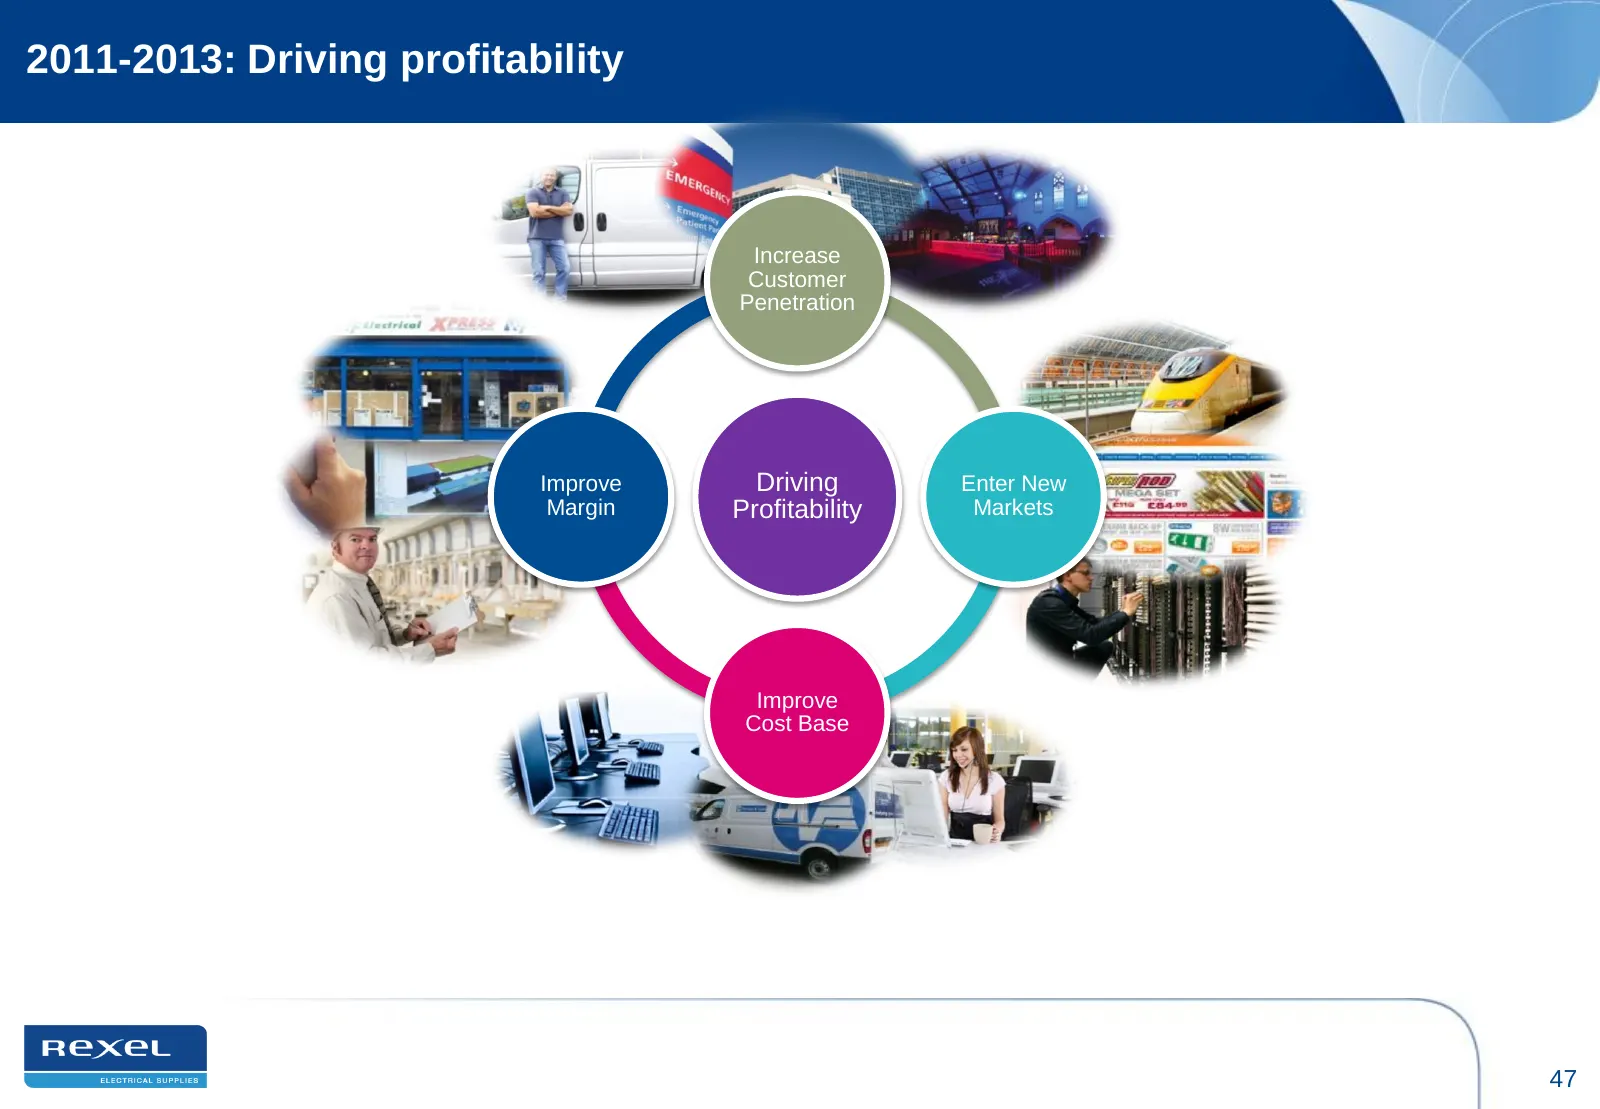
Slide 47: 2011-2013: Driving profitability
2011-2013: Driving profitability Increase Customer Penetration Improve Driving Enter New Margin Profitability Markets Improve Cost Base 47
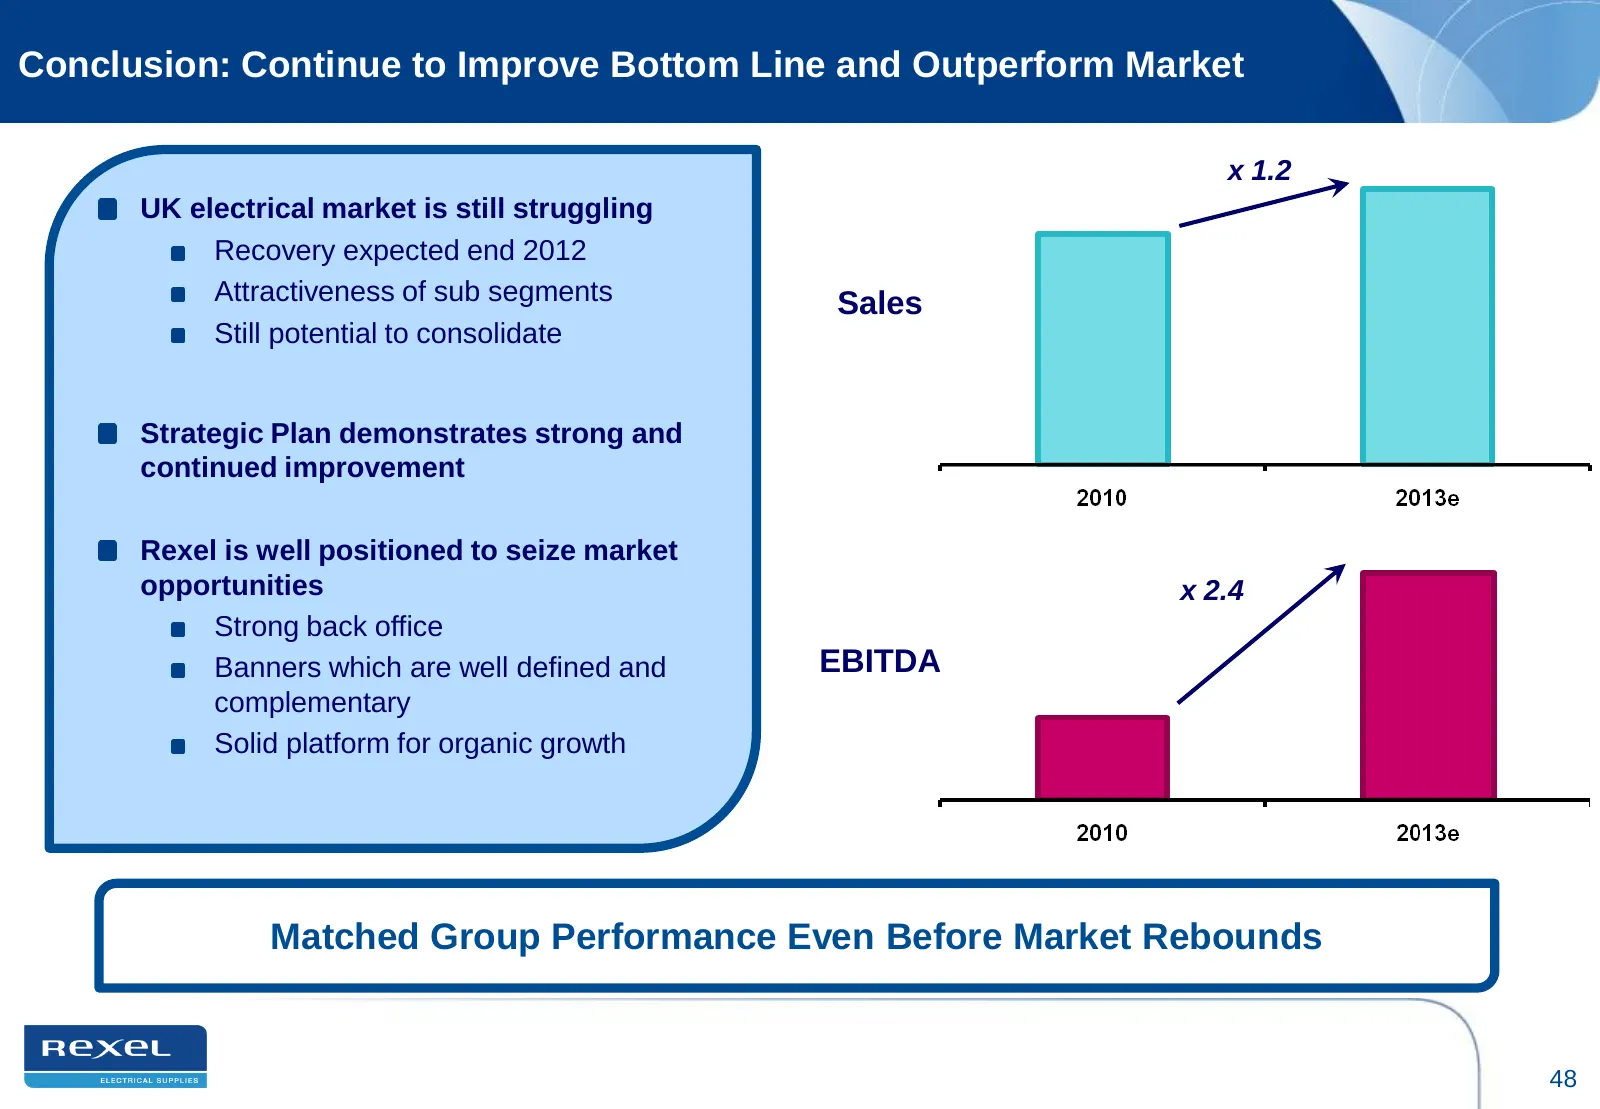
Slide 48: Conclusion: Continue to Improve Bottom Line and Outperform Market
Conclusion: Continue to Improve Bottom Line and Outperform Market x 1.2 UK electrical market is still struggling Recovery expected end 2012 Attractiveness of sub segments Sales Still potential to consolidate Strategic Plan demonstrates strong and continued improvement Rexel is well positioned to sei
Slide 49: Rexel Group: improved fundamentals
Rexel Group: 2 improved fundamentals Jean-Charles PAUZE, Chairman & CEO
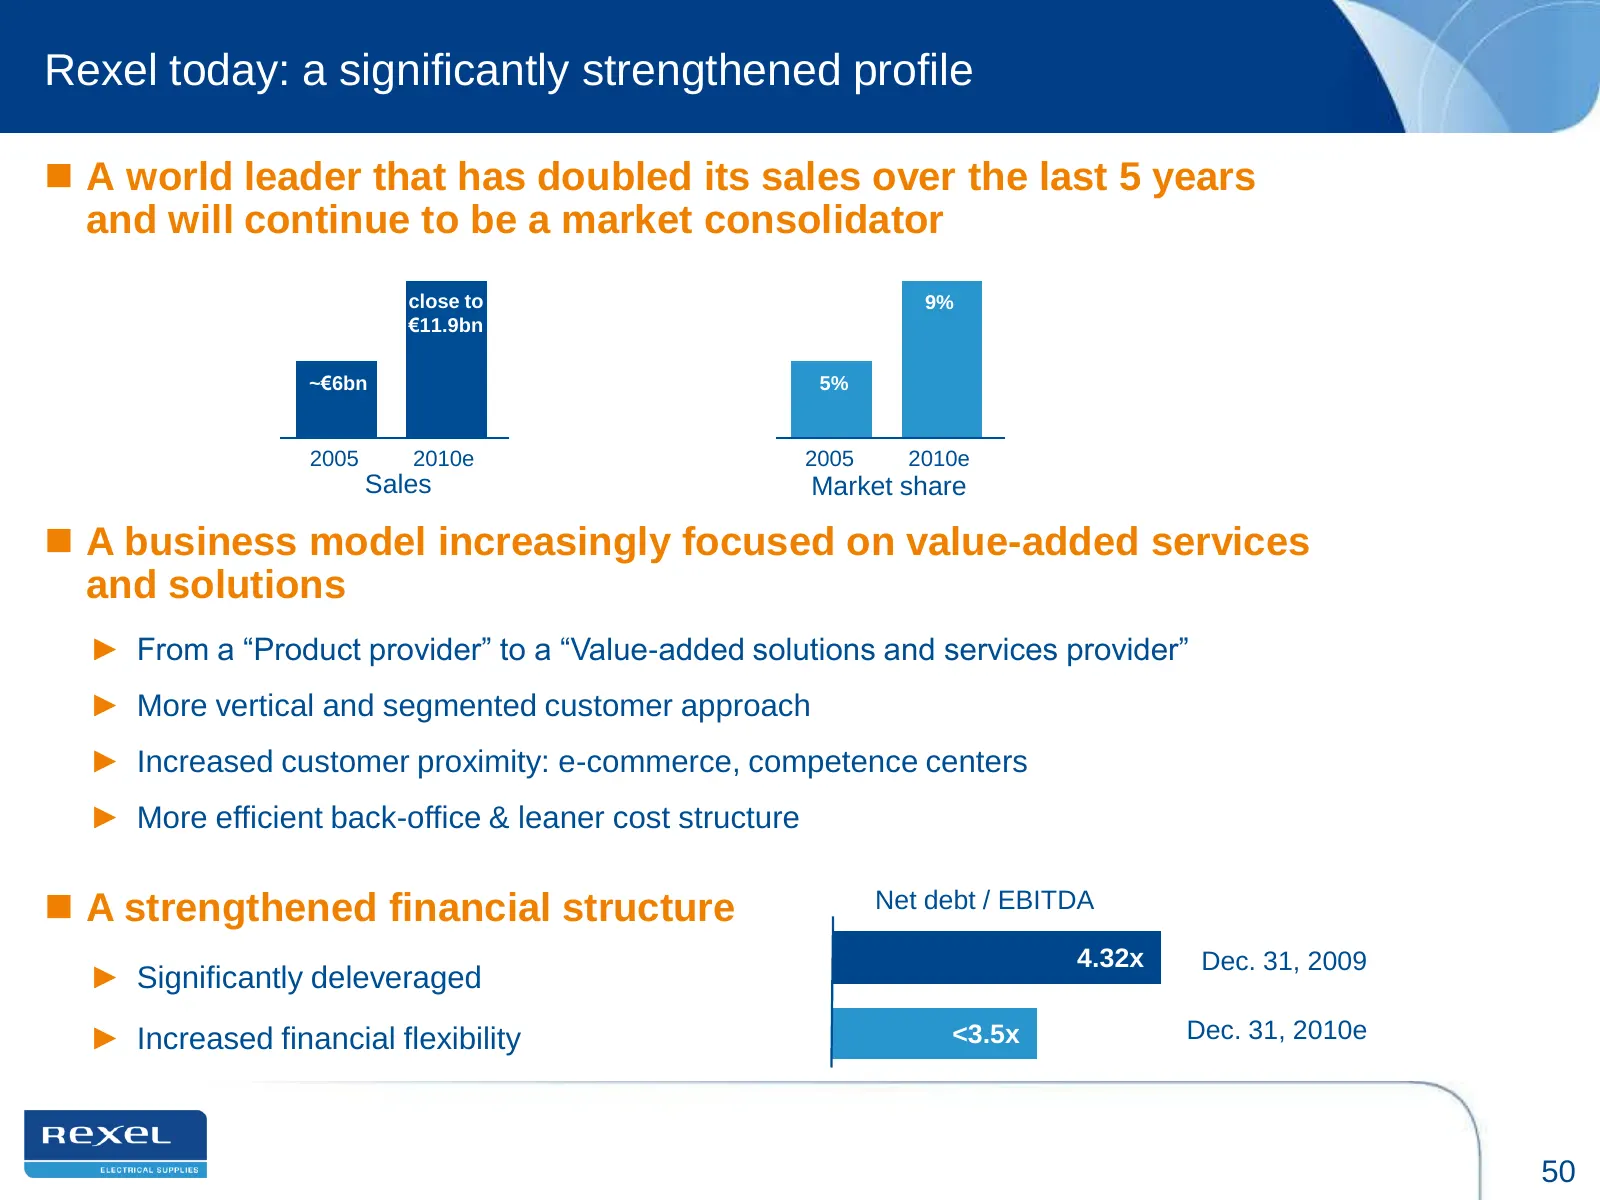
Slide 50: Rexel today: a significantly strengthened profile
Rexel today: a significantly strengthened profile A world leader that has doubled its sales over the last 5 years and will continue to be a market consolidator close to 9% €11.9bn ~€6bn 5% 2005 2010e 2005 2010e Sales Market share A business model increasingly focused on value-added services and
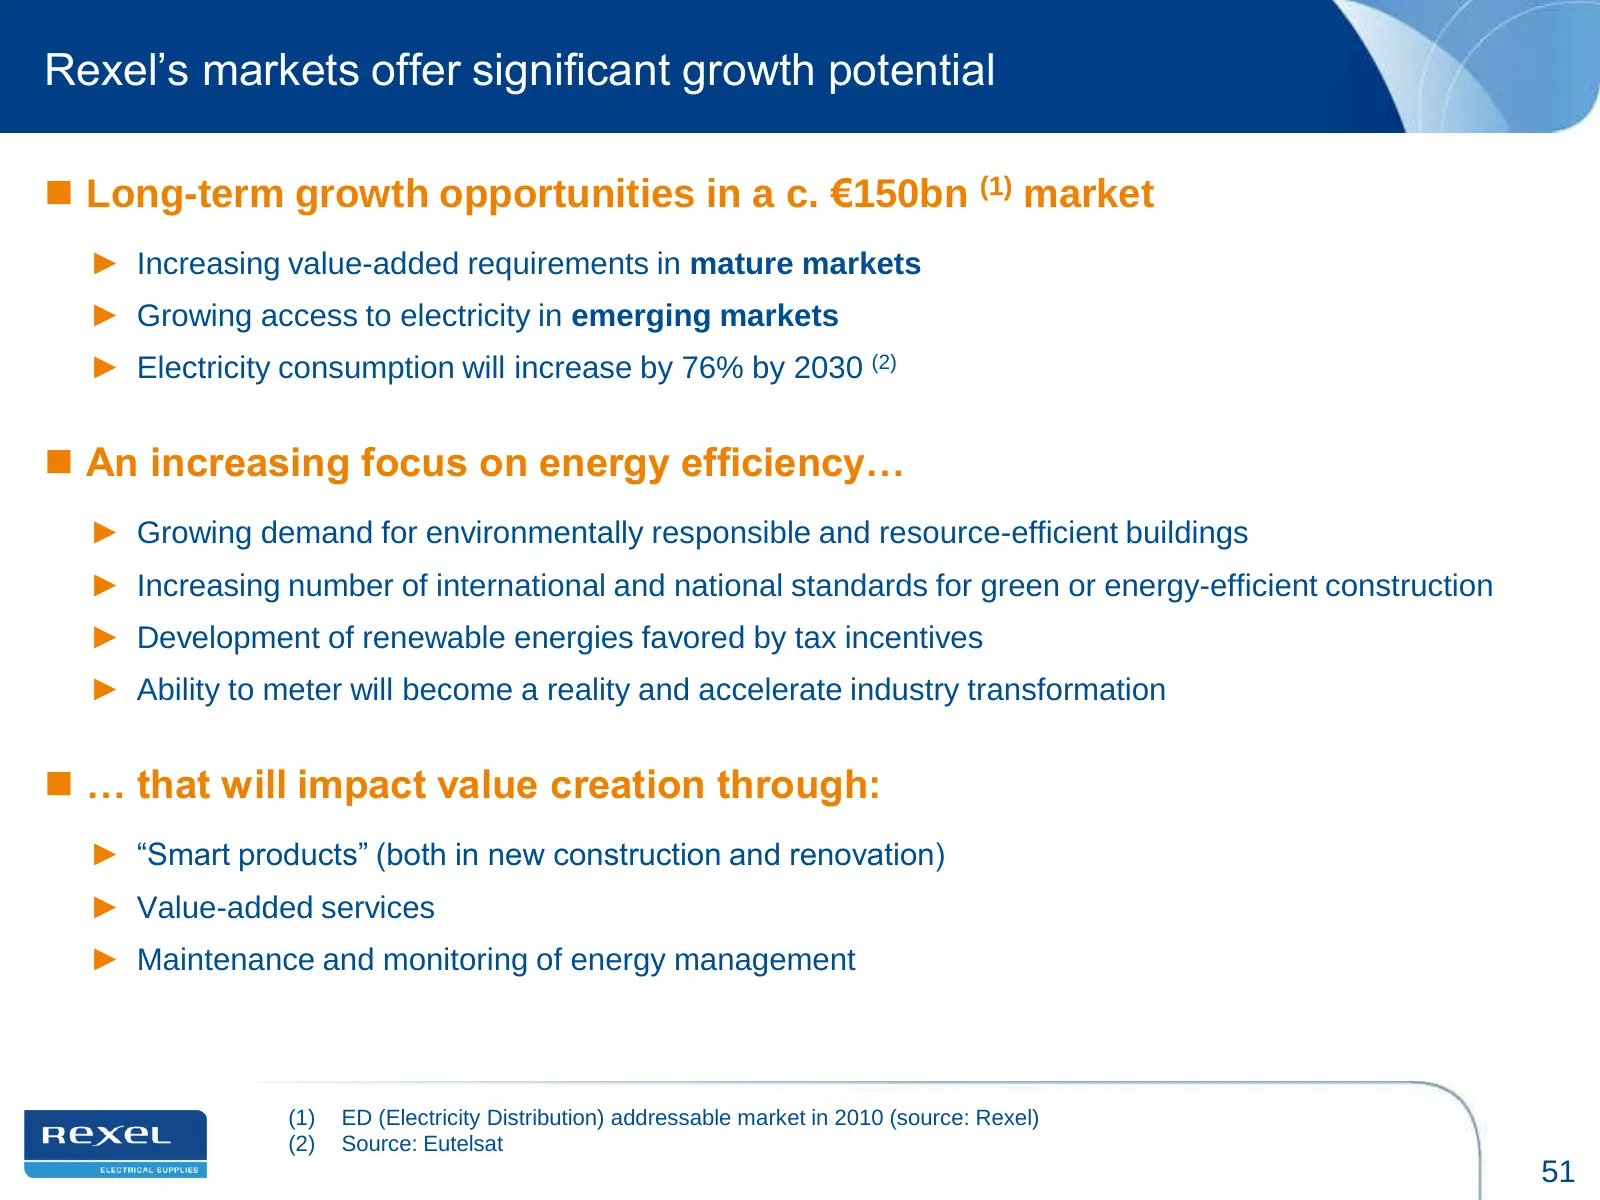
Slide 51: Rexel's markets offer significant growth potential
Rexel‟s markets offer significant growth potential Long-term growth opportunities in a c. €150bn (1) market ► Increasing value-added requirements in mature markets ► Growing access to electricity in emerging markets ► Electricity consumption will increase by 76% by 2030 (2) An increasing focus o
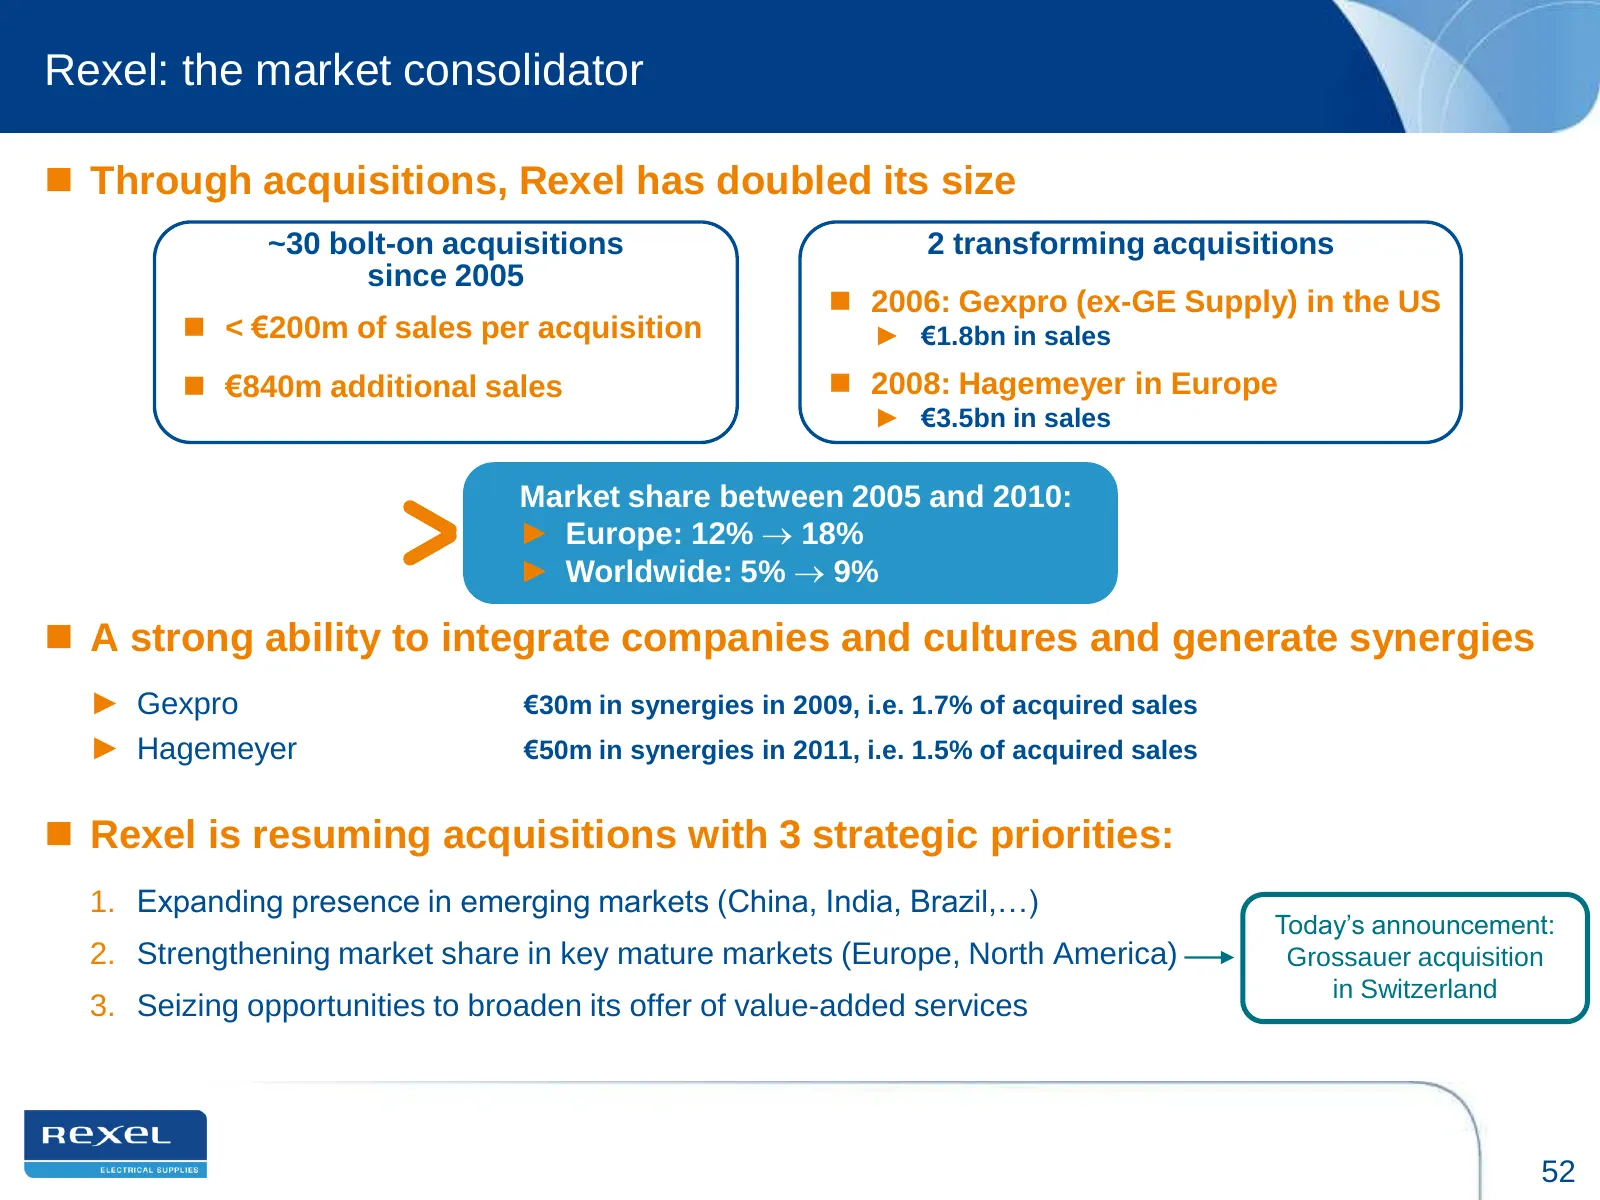
Slide 52: Rexel: the market consolidator
Rexel: the market consolidator Through acquisitions, Rexel has doubled its size ~30 bolt-on acquisitions 2 transforming acquisitions since 2005 2006: Gexpro (ex-GE Supply) in the US < €200m of sales per acquisition ► €1.8bn in sales €840m additional sales 2008: Hagemeyer in Europe ► €3.5bn
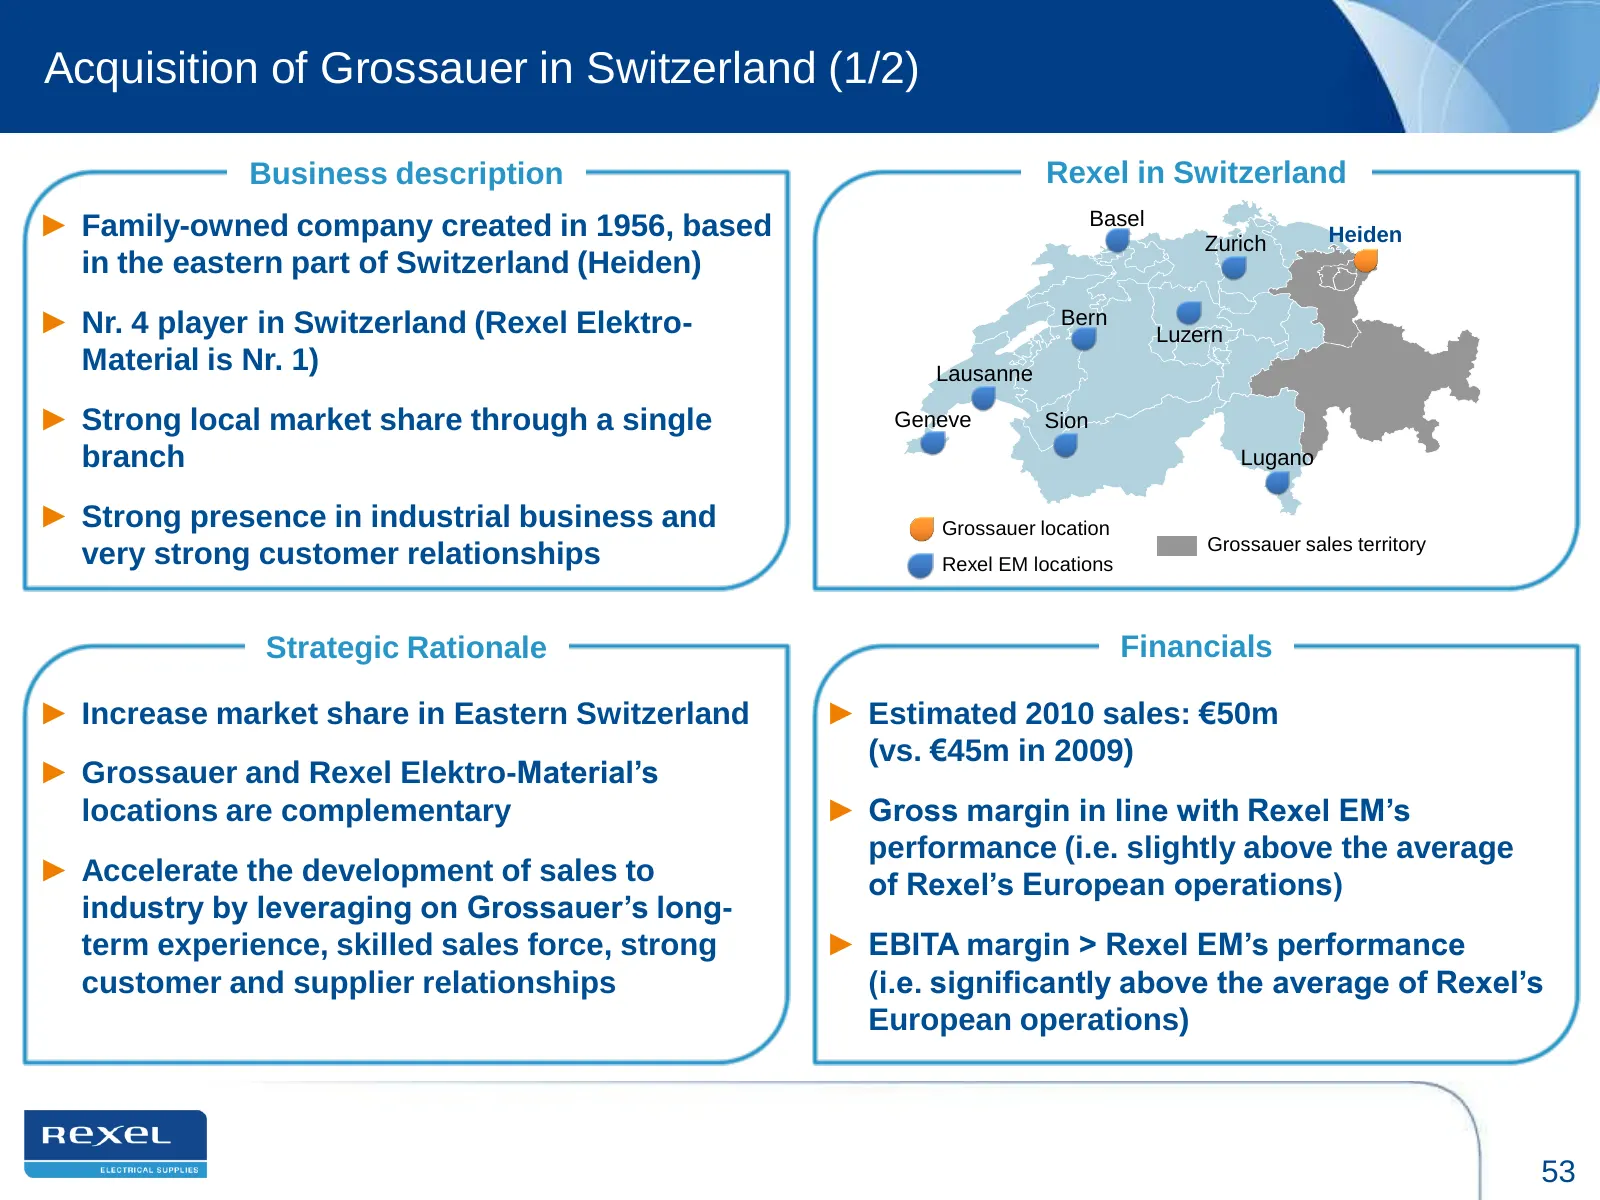
Slide 53: Acquisition of Grossauer in Switzerland (1/2)
Acquisition of Grossauer in Switzerland (1/2) Business description Rexel in Switzerland ► Family-owned company created in 1956, based Basel Zurich Heiden in the eastern part of Switzerland (Heiden) ► Nr. 4 player in Switzerland (Rexel Elektro- Bern Luzern Material is Nr. 1) Lausanne ► Strong local m
Slide 54: Acquisition of Grossauer in Switzerland (2/2)
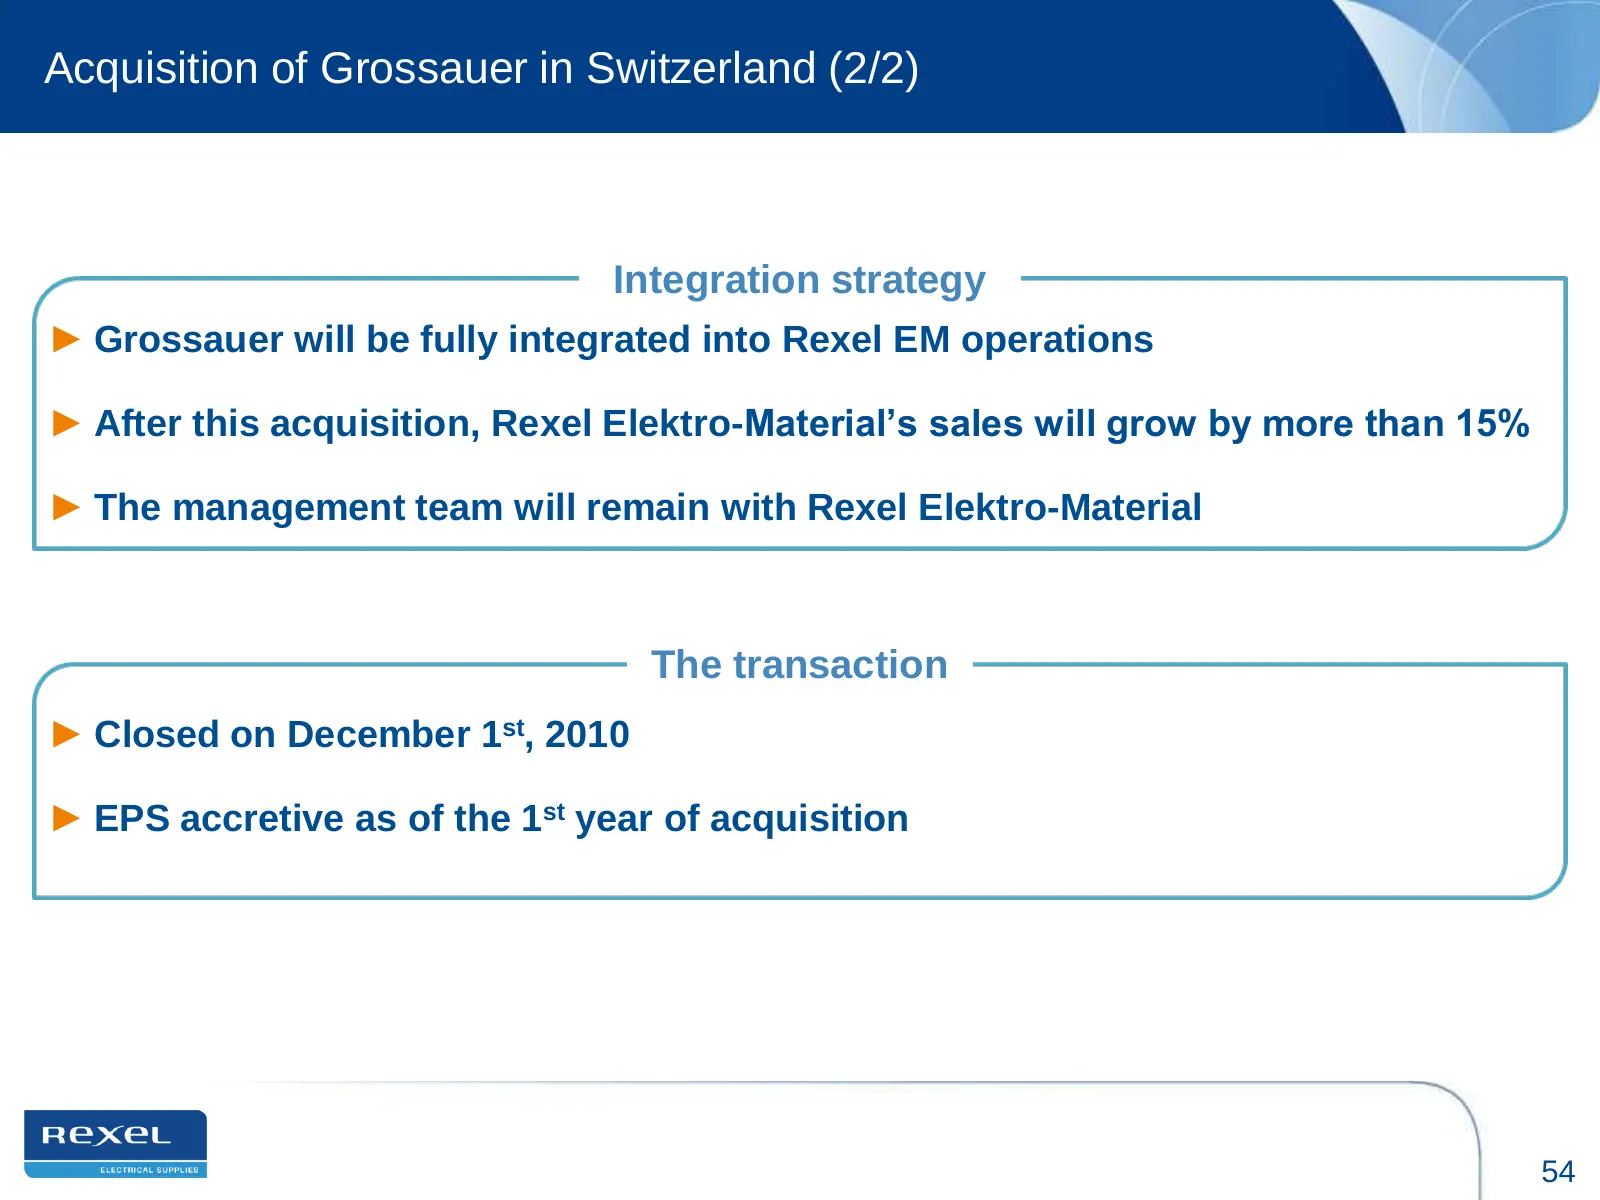
Acquisition of Grossauer in Switzerland (2/2) Integration strategy ► Grossauer will be fully integrated into Rexel EM operations ► After this acquisition, Rexel Elektro-Material’s sales will grow by more than 15% ► The management team will remain with Rexel Elektro-Material The transaction ► Closed
Slide 55: Rexel serves a well-balanced mix of customers and end-markets
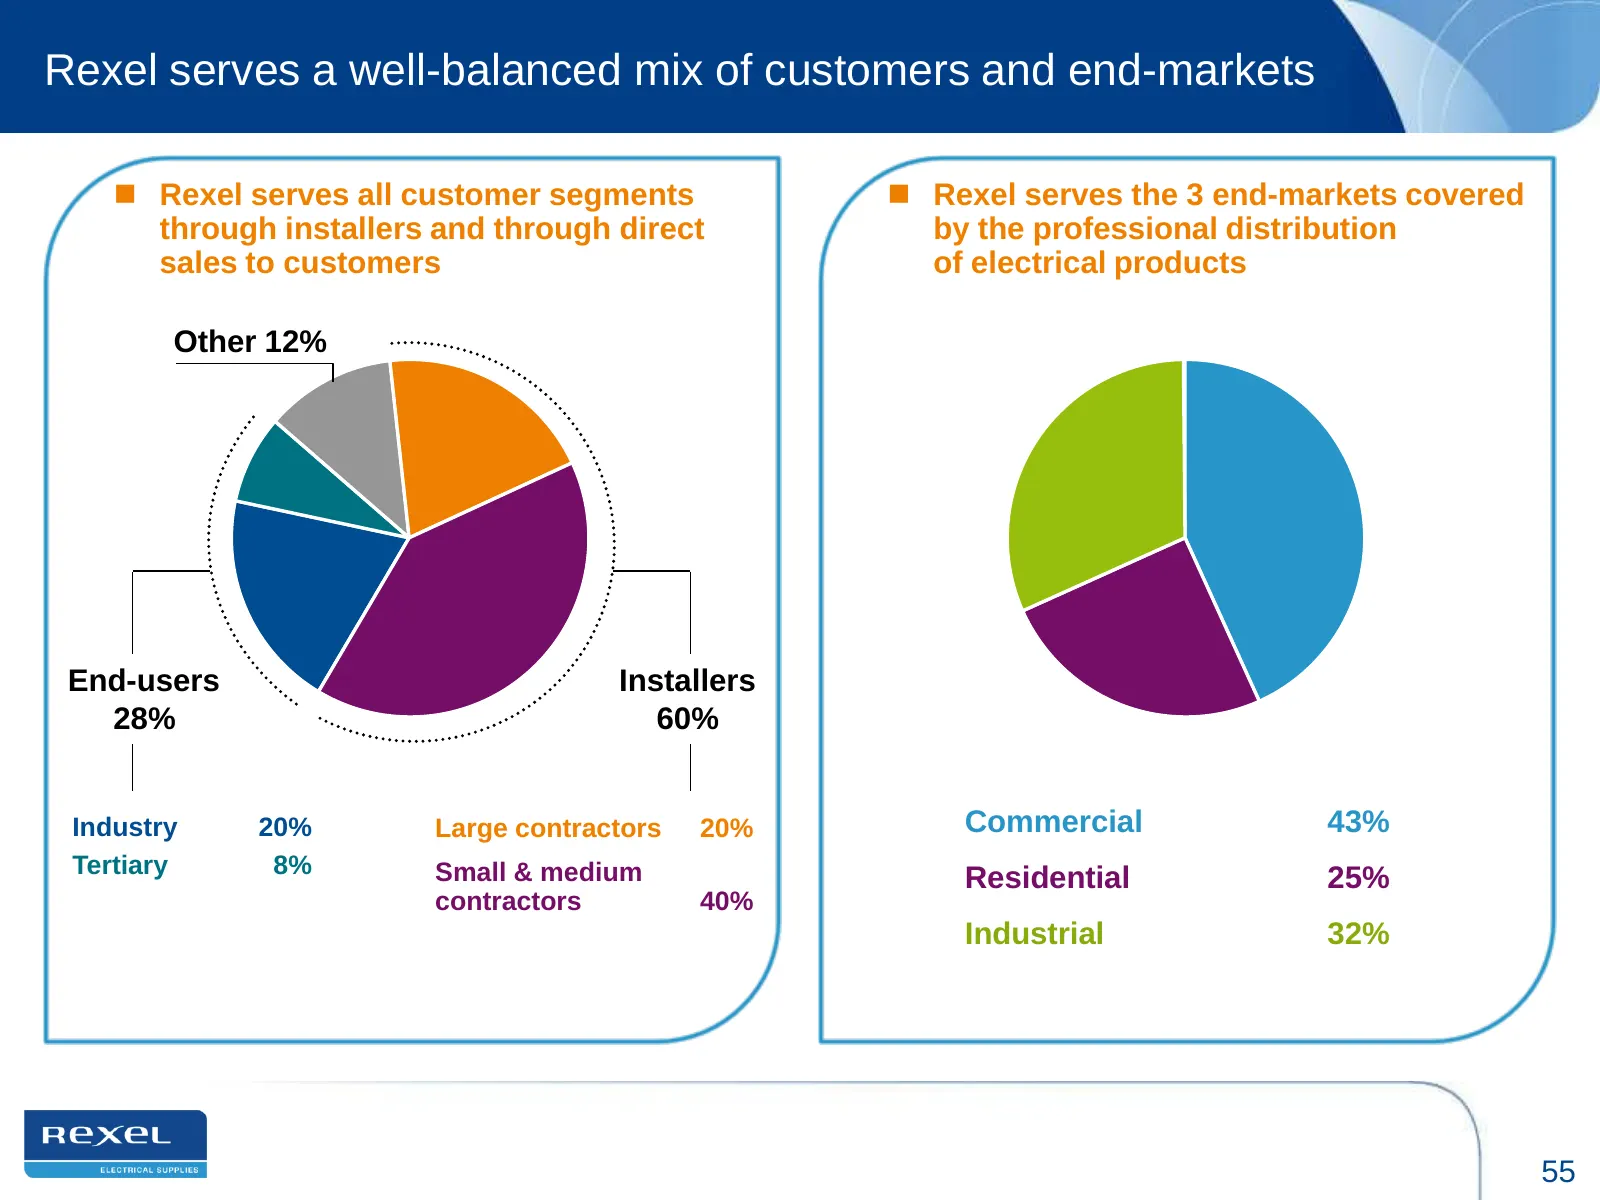
Rexel serves a well-balanced mix of customers and end-markets Rexel serves all customer segments Rexel serves the 3 end-markets covered through installers and through direct by the professional distribution sales to customers of electrical products Other 12% End-users Installers 28% 60% Industry
Slide 56: Rexel has strong relationships with its suppliers
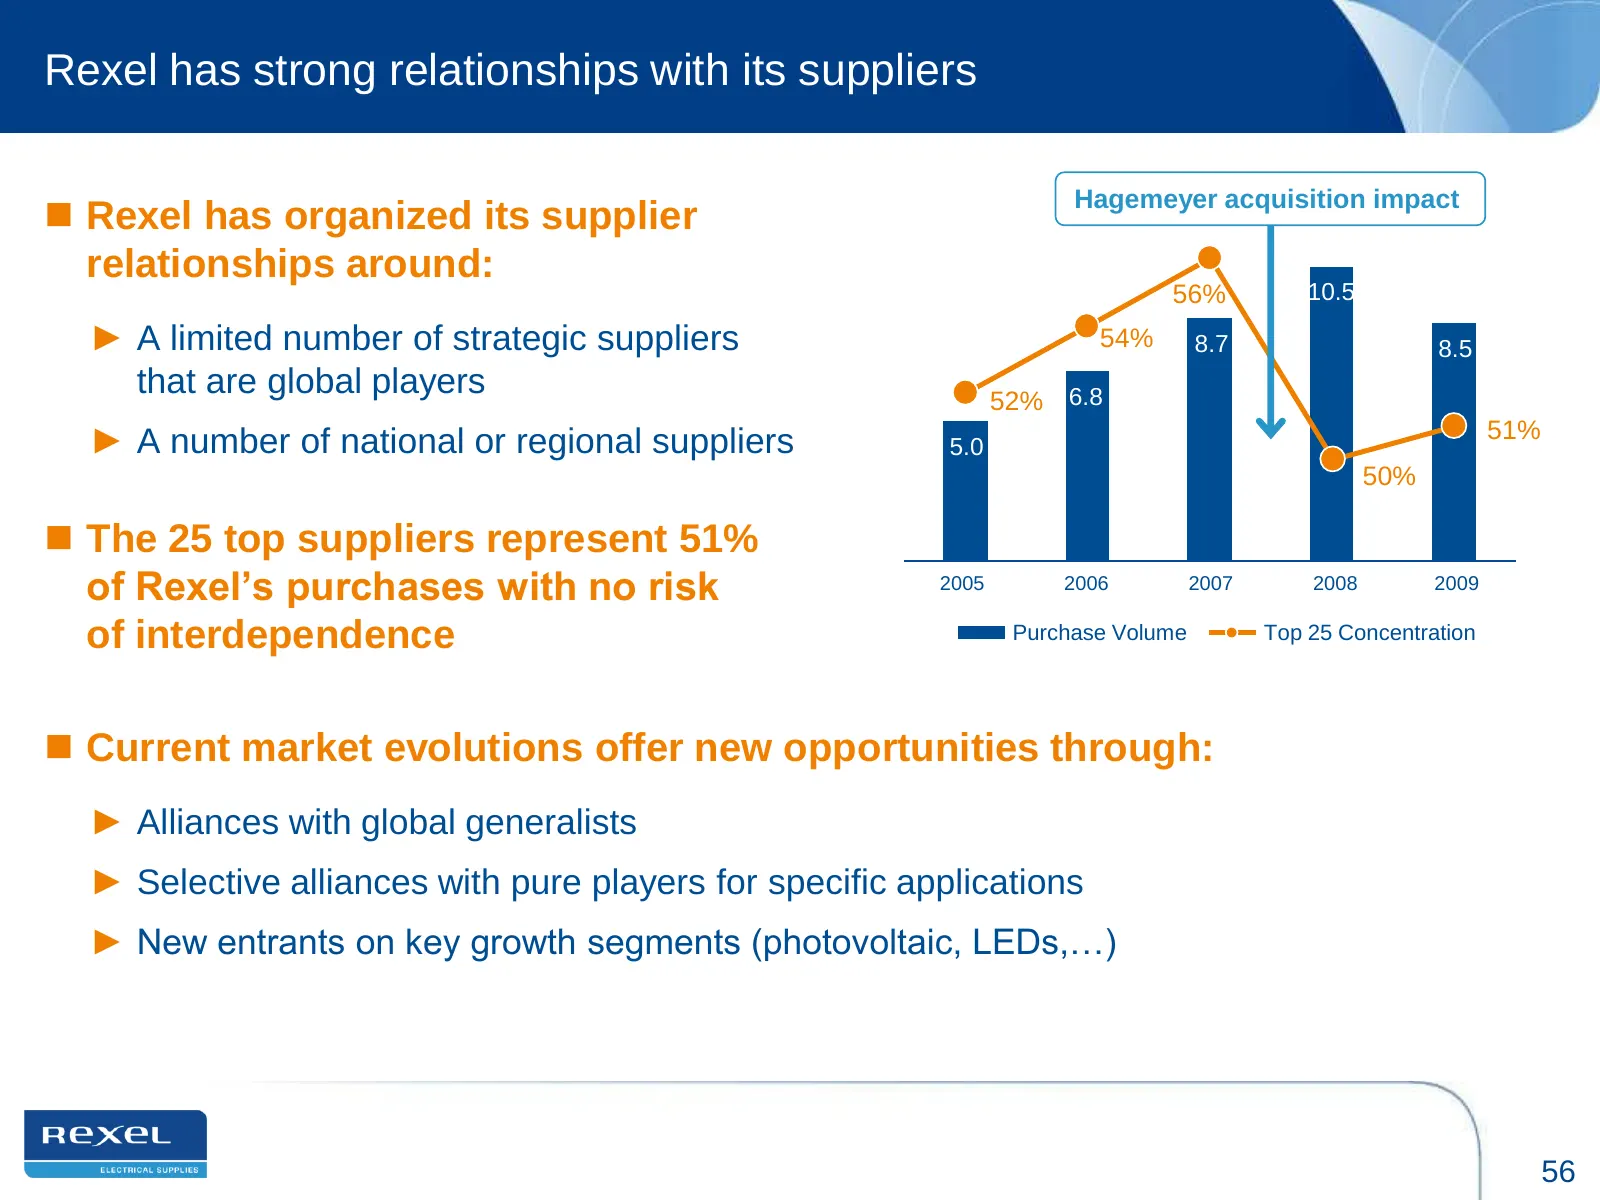
Rexel has strong relationships with its suppliers Hagemeyer acquisition impact Rexel has organized its supplier relationships around: 56% 10.5 ► A limited number of strategic suppliers 54% 8.7 8.5 that are global players 52% 6.8 51% ► A number of national or regional suppliers 5.0 50% The 25 top
Slide 57: Rexel: a leaner and more flexible cost structure
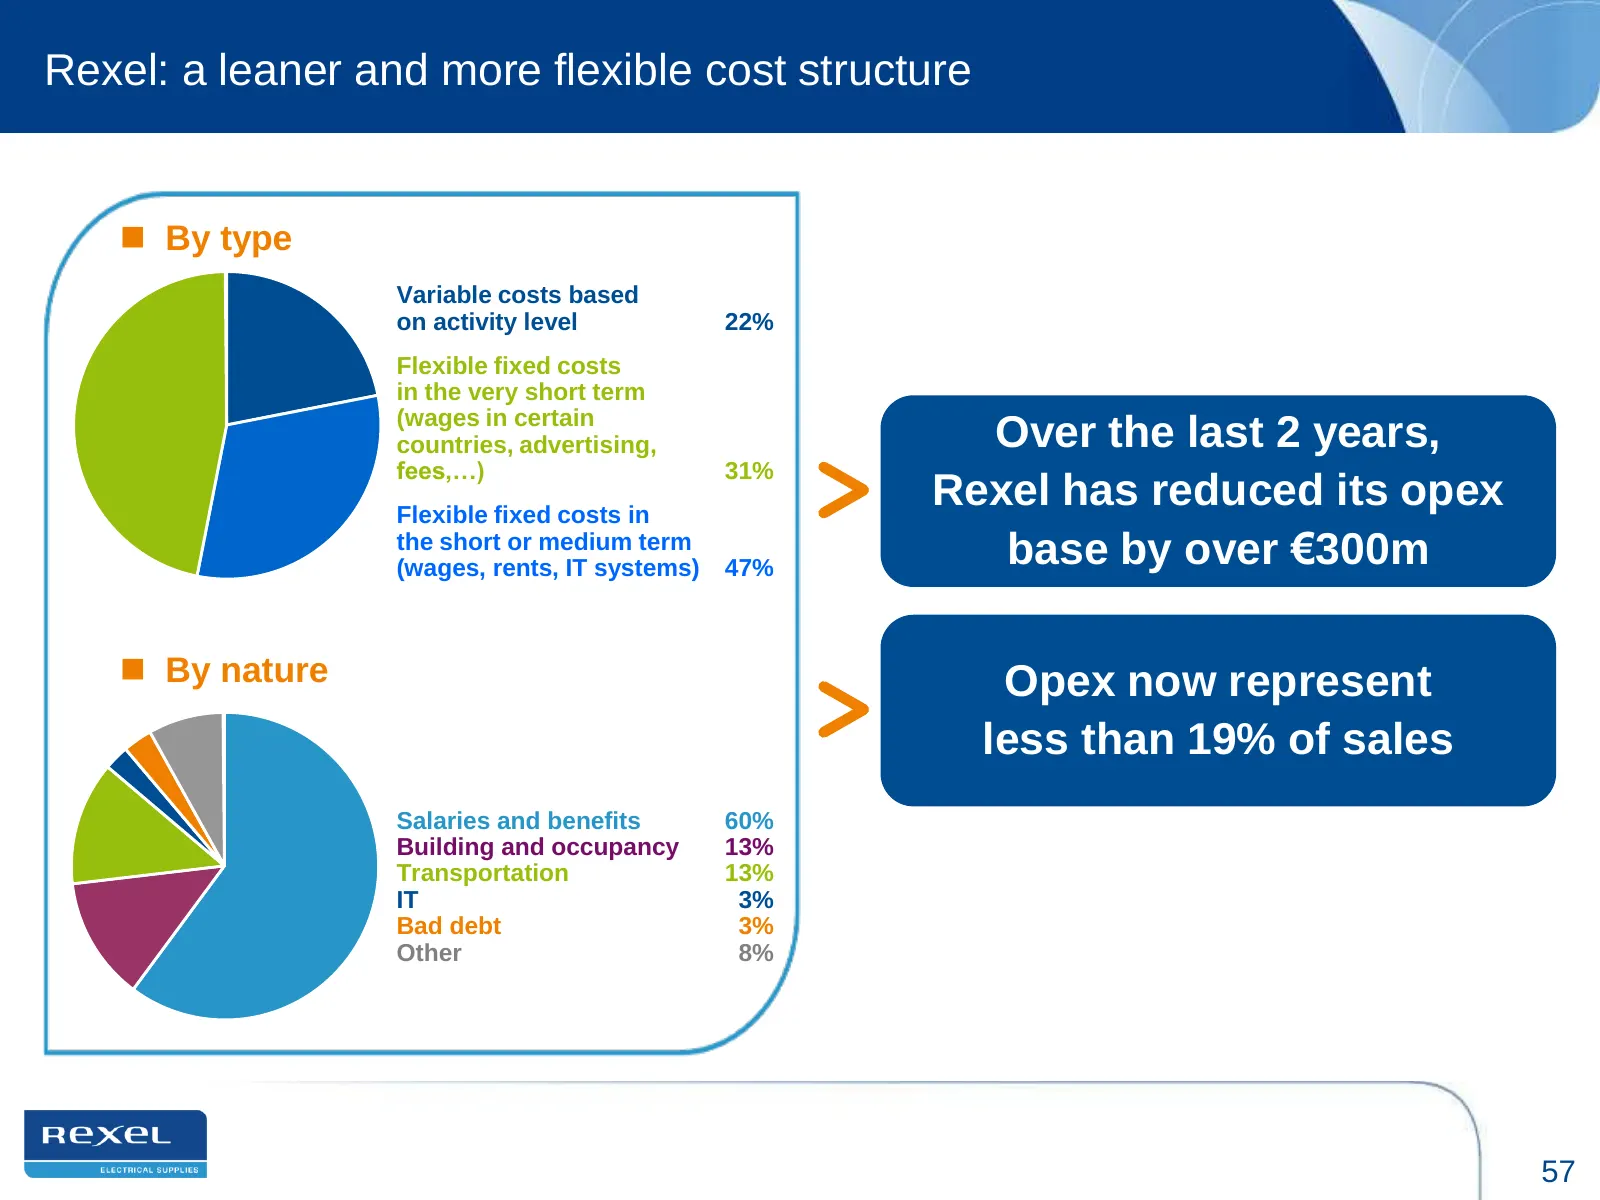
Rexel: a leaner and more flexible cost structure By type Variable costs based on activity level 22% Flexible fixed costs in the very short term (wages in certain countries, advertising, Over the last 2 years, fees,…) 31% Flexible fixed costs in Rexel has reduced its opex the short or medium term (
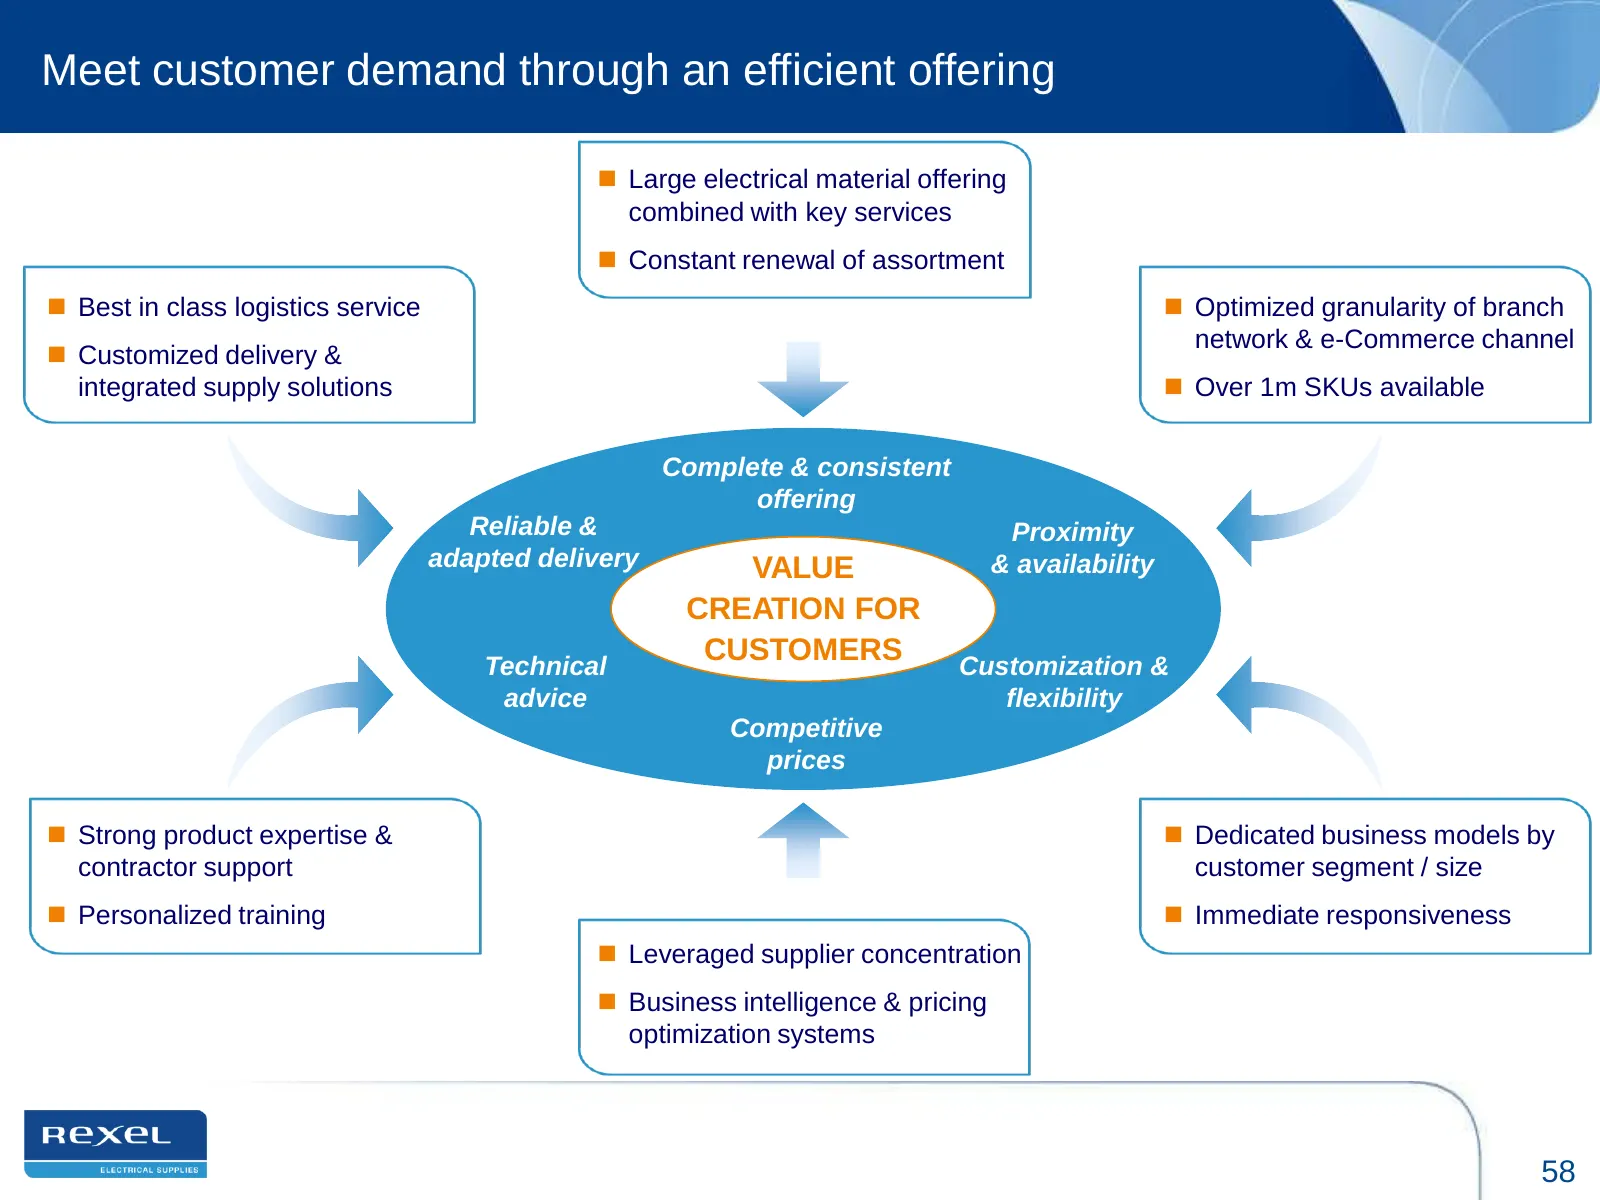
Slide 58: Meet customer demand through an efficient offering
Meet customer demand through an efficient offering Large electrical material offering combined with key services Constant renewal of assortment Best in class logistics service Optimized granularity of branch network & e-Commerce channel Customized delivery & integrated supply solutions O
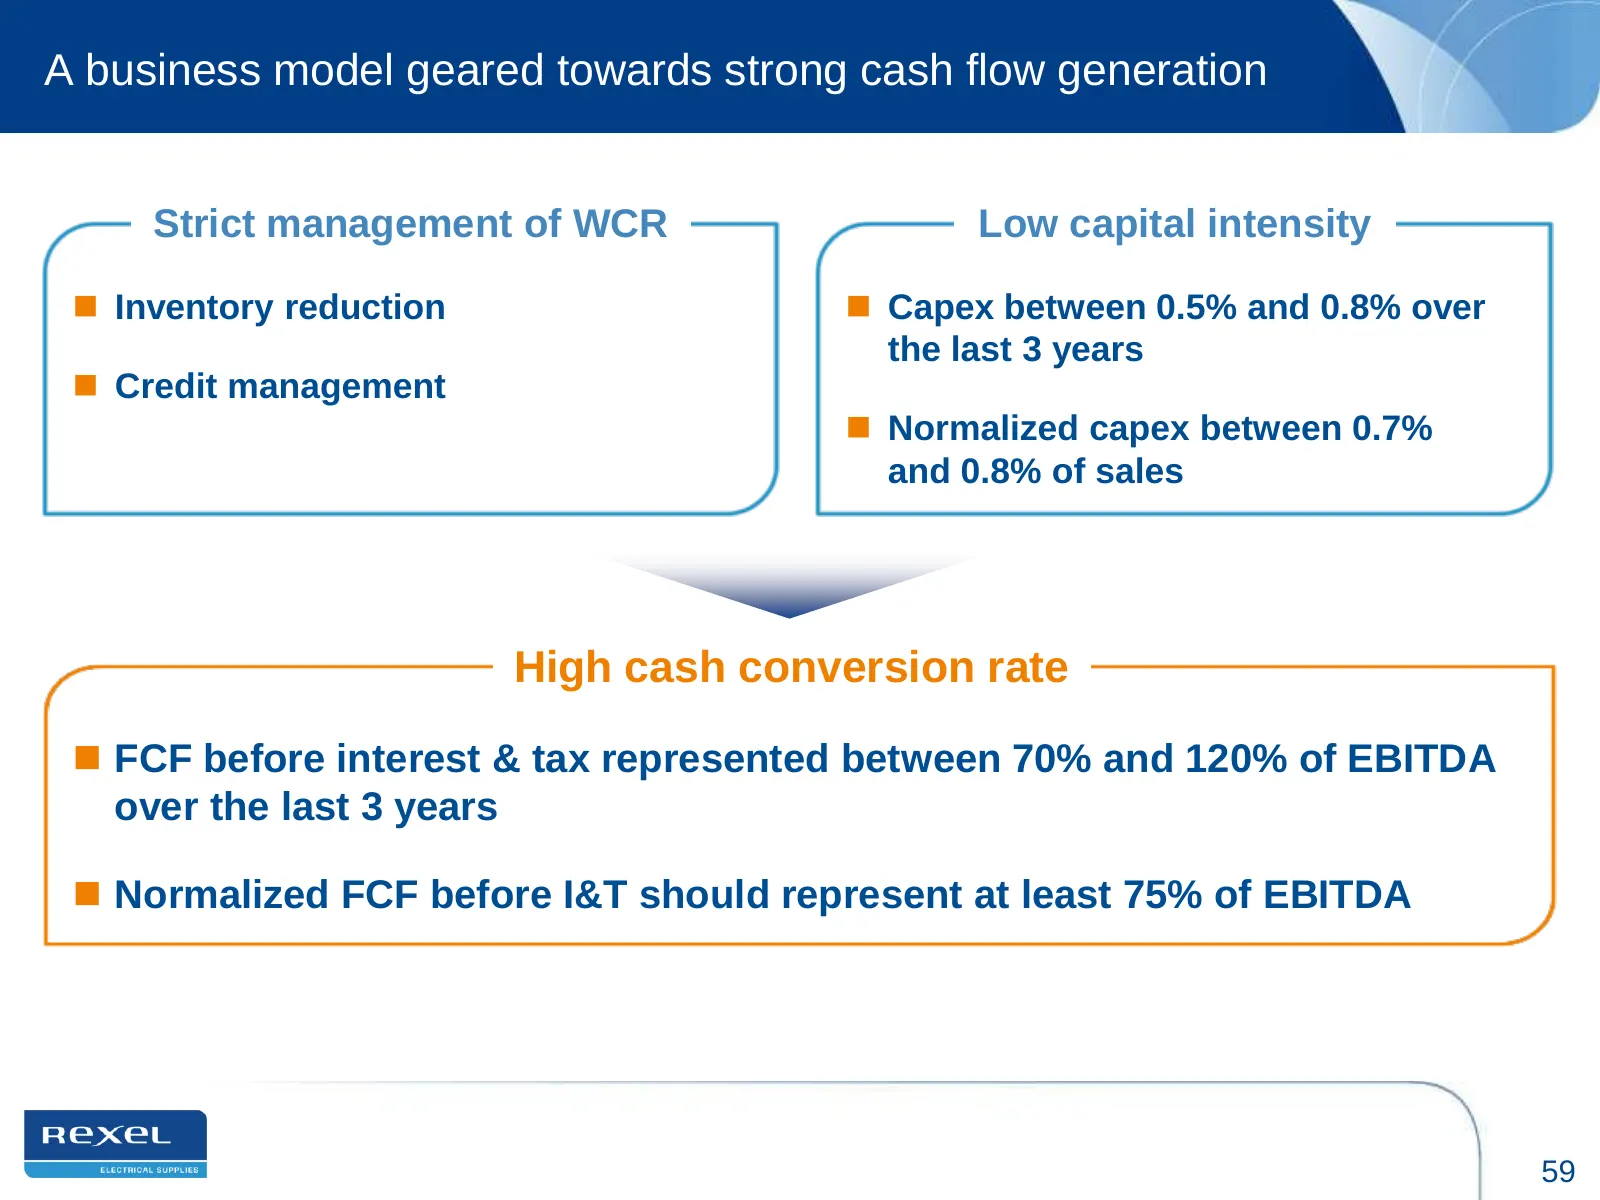
Slide 59: A business model geared towards strong cash flow generation
A business model geared towards strong cash flow generation Strict management of WCR Low capital intensity Inventory reduction Capex between 0.5% and 0.8% over the last 3 years Credit management Normalized capex between 0.7% and 0.8% of sales High cash conversion rate FCF before interest &
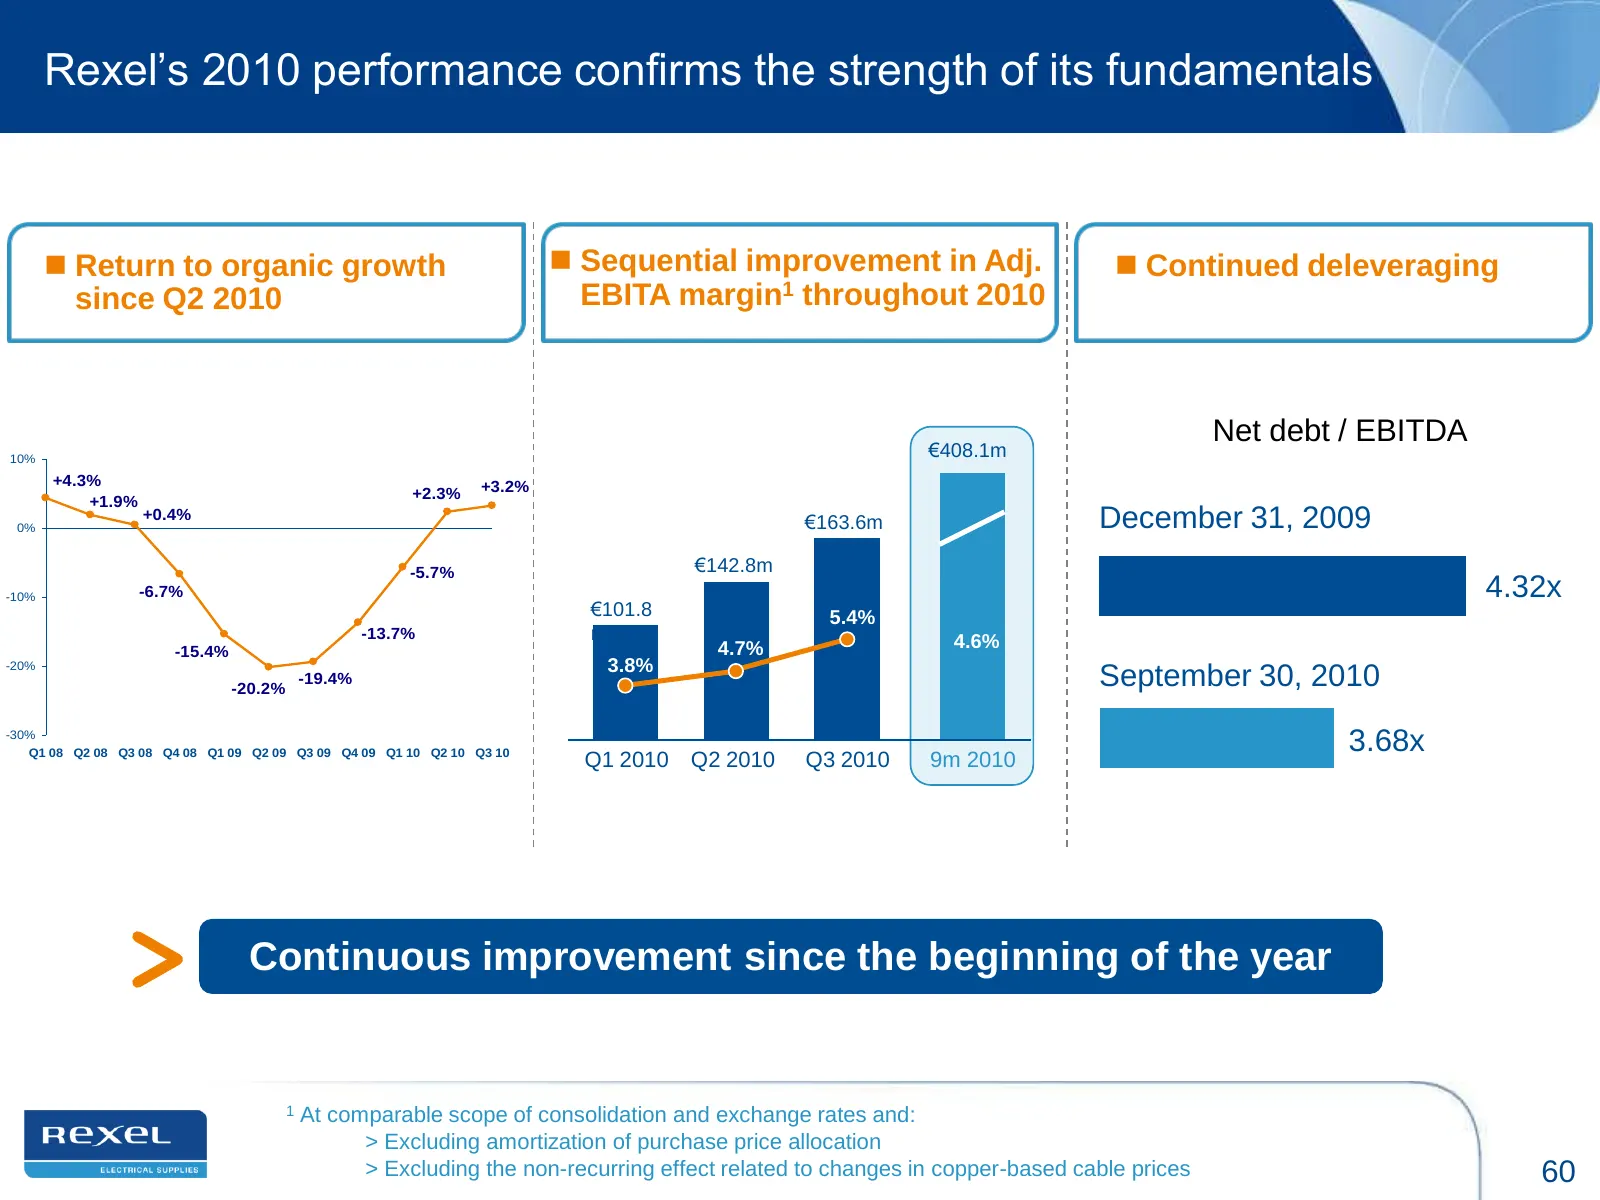
Slide 60: Rexel's 2010 performance confirms the strength of its fundamentals
Rexel‟s 2010 performance confirms the strength of its fundamentals Return to organic growth Sequential improvement in Adj. Continued deleveraging since Q2 2010 EBITA margin1 throughout 2010 Net debt / EBITDA 10% €408.1m +4.3% +3.2% +1.9% +2.3% 0% +0.4% €163.6m December 31, 2009 -5.7% €142.8m -
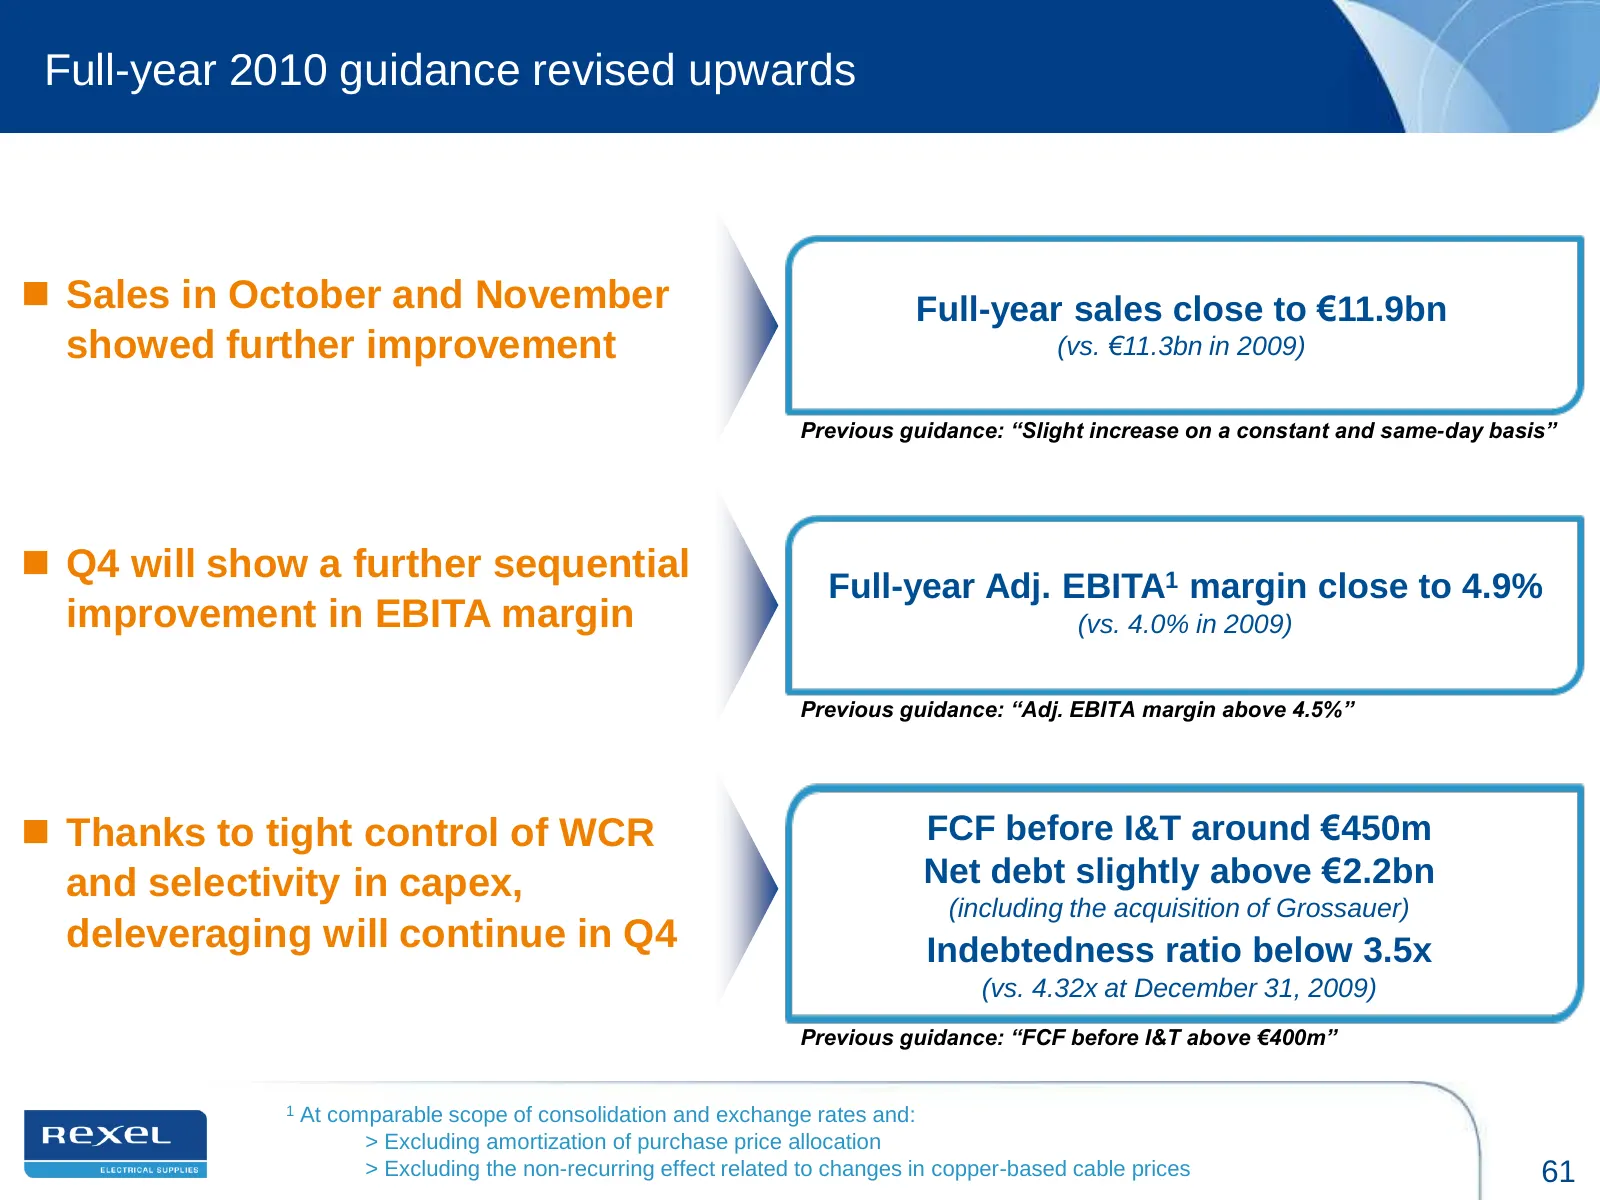
Slide 61: Full-year 2010 guidance revised upwards
Full-year 2010 guidance revised upwards Sales in October and November Full-year sales close to €11.9bn showed further improvement (vs. €11.3bn in 2009) Previous guidance: “Slight increase on a constant and same-day basis” Q4 will show a further sequential Full-year Adj. EBITA1 margin close to 4.
Slide 62: Rexel Group: A profitable growth strategy
Rexel Group: 3 A profitable growth strategy Pascal MARTIN, Management Board Member, Business Development and Corporate Operations Michel FAVRE, Management Board member, Group CFO
Slide 63: Backdrop of differentiated macro trends
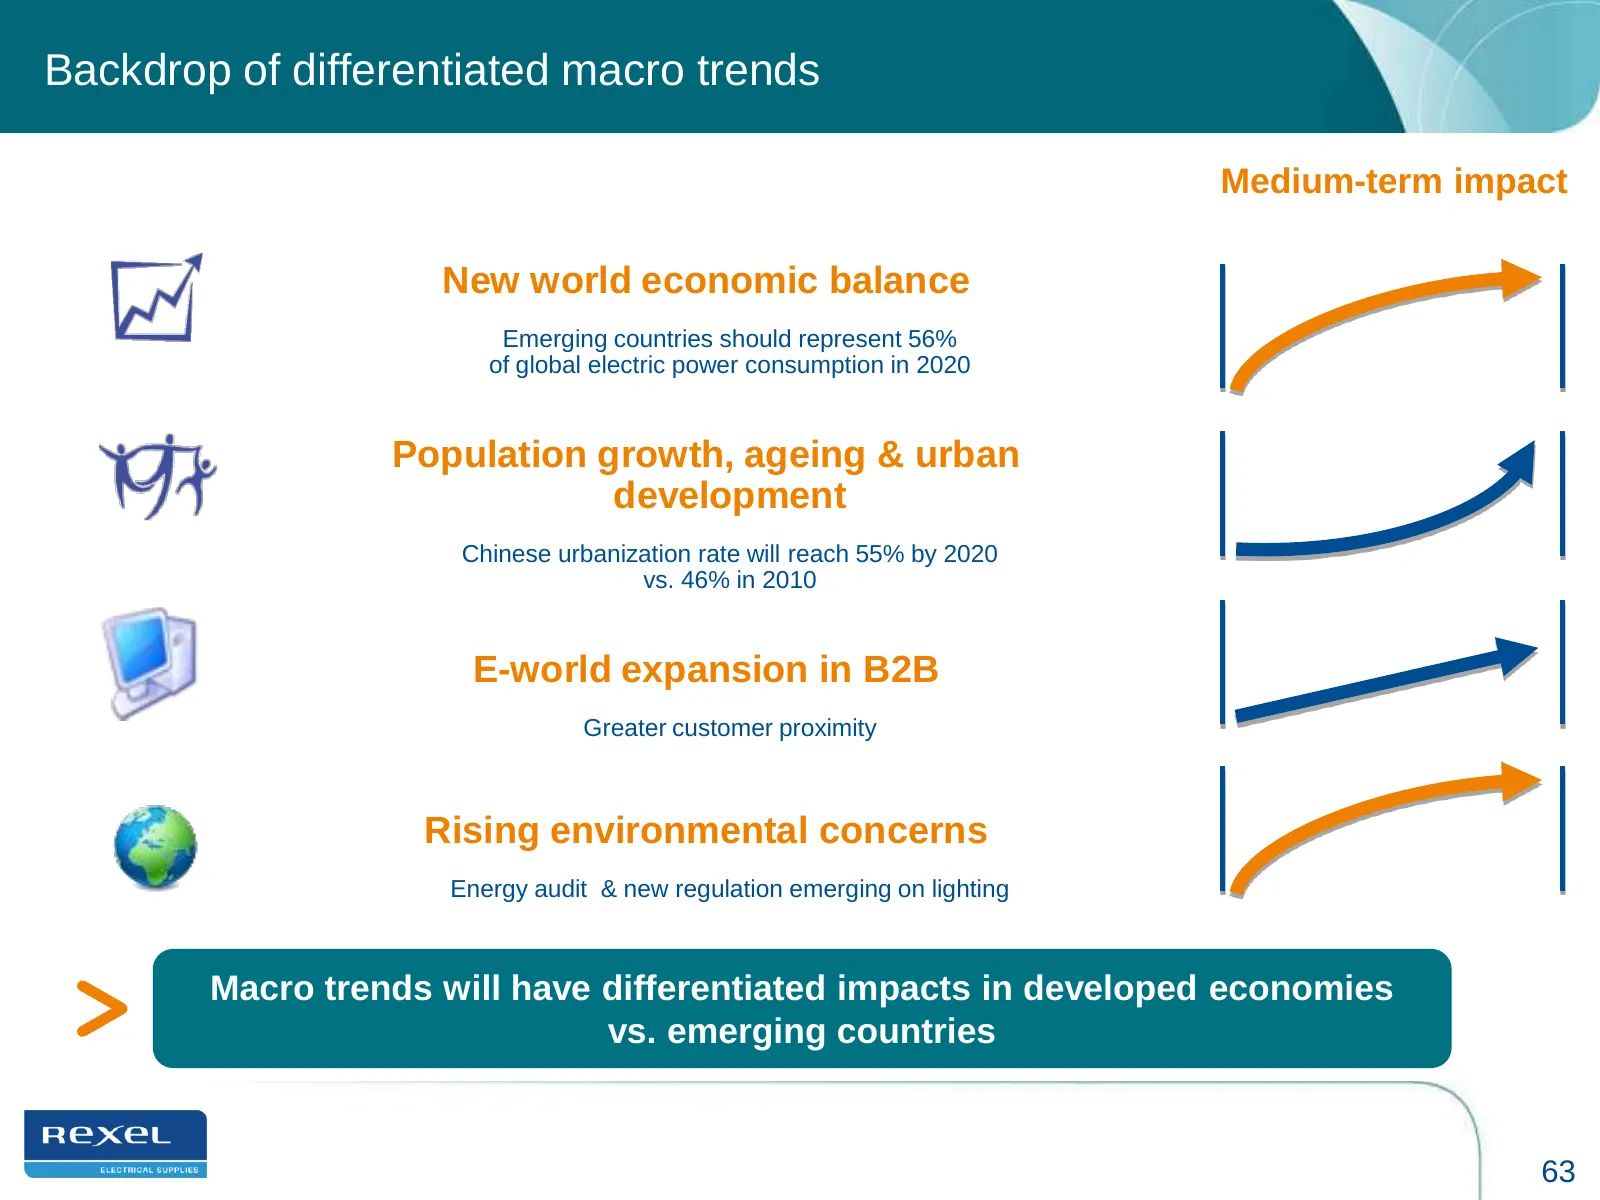
Backdrop of differentiated macro trends Medium-term impact New world economic balance Emerging countries should represent 56% of global electric power consumption in 2020 Population growth, ageing & urban development Chinese urbanization rate will reach 55% by 2020 vs. 46% in 2010 E-world expansion
Slide 64: Emerging markets offer strong growth potential
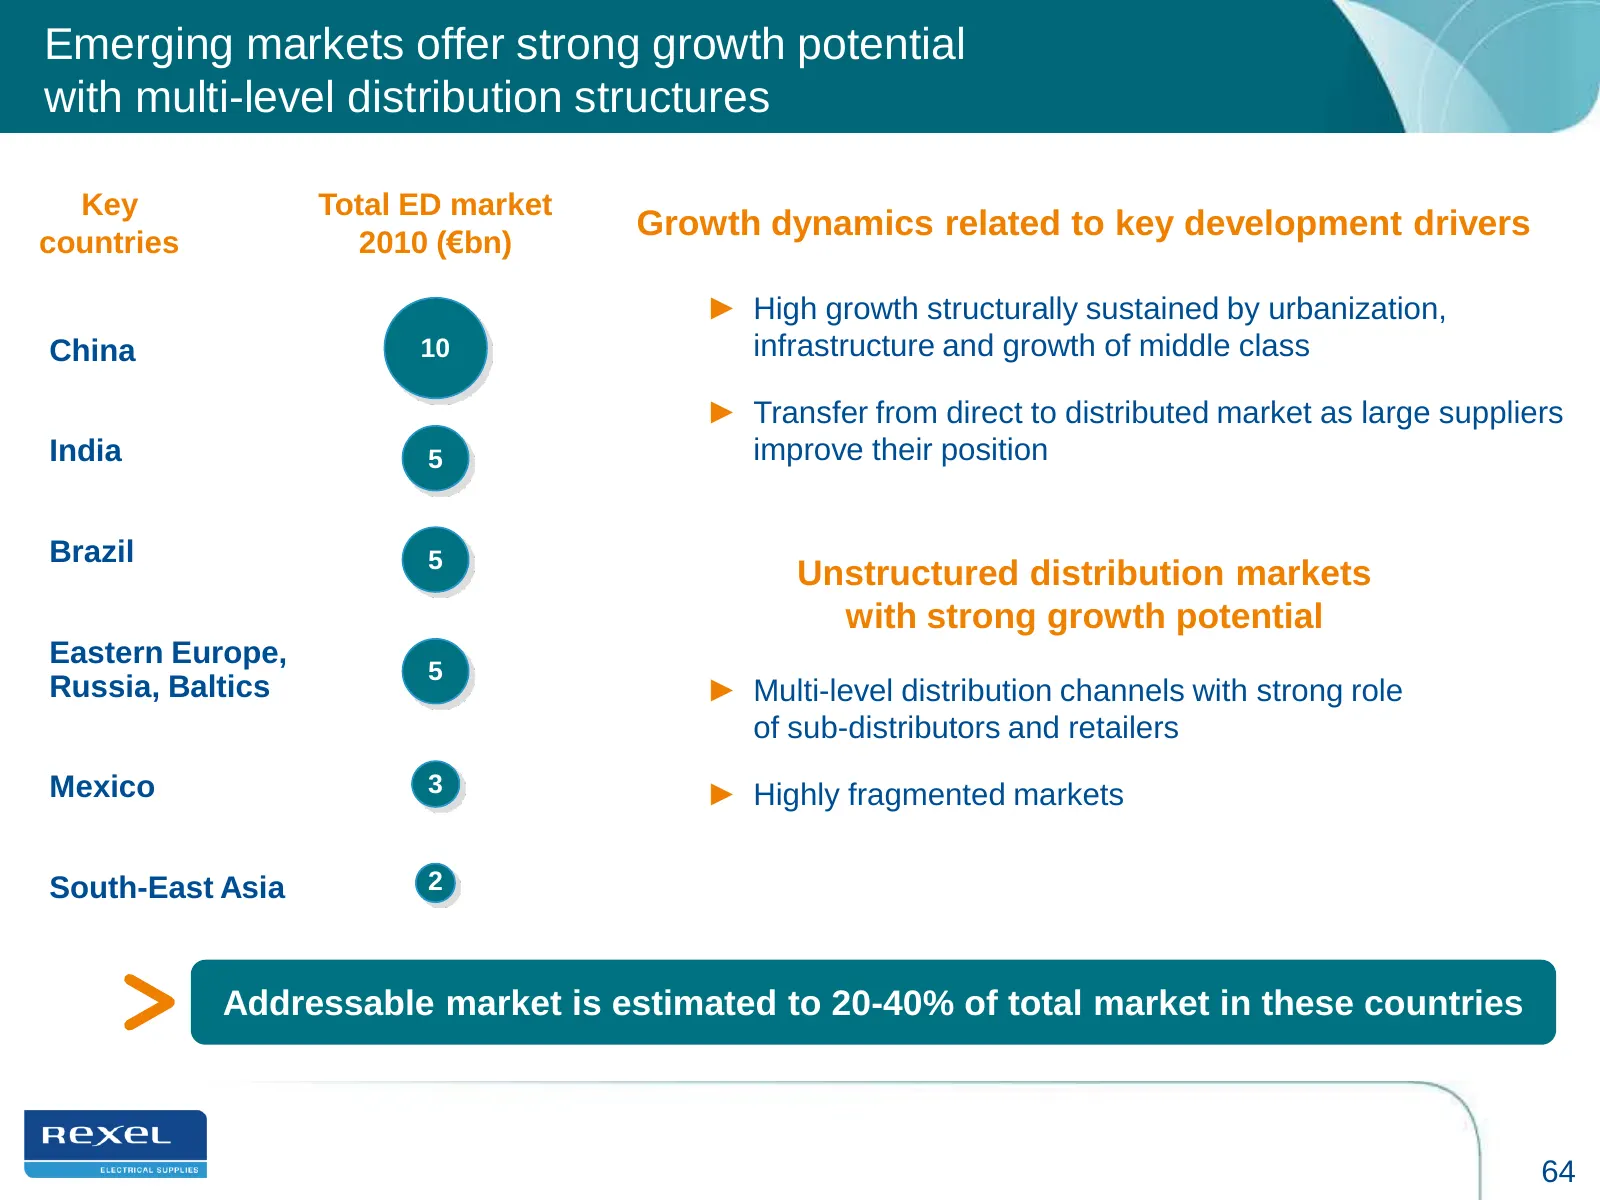
Emerging markets offer strong growth potential with multi-level distribution structures Key Total ED market countries 2010 (€bn) Growth dynamics related to key development drivers ► High growth structurally sustained by urbanization, China 10 infrastructure and growth of middle class ► Transfer from
Slide 65: Emerging markets: a key growth driver
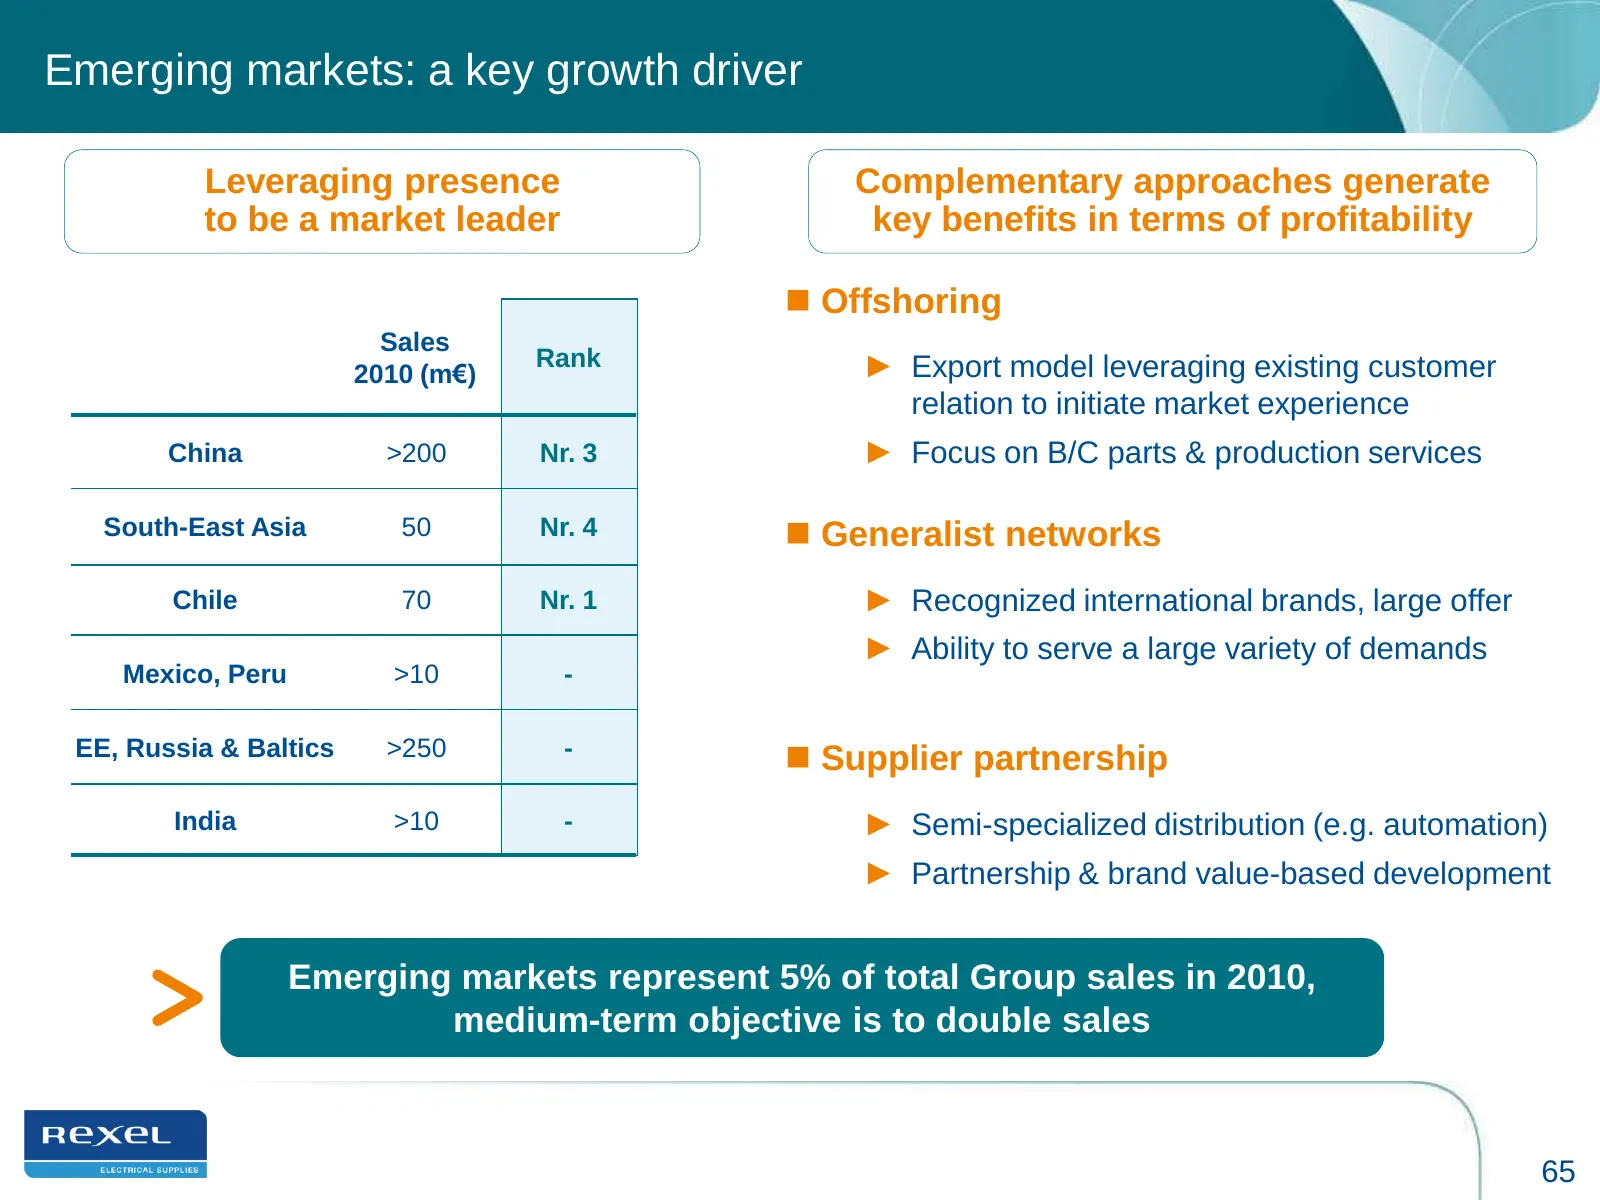
Emerging markets: a key growth driver Leveraging presence Complementary approaches generate to be a market leader key benefits in terms of profitability Offshoring Sales Rank ► Export model leveraging existing customer 2010 (m€) relation to initiate market experience China >200 Nr. 3 ► Focus on B/
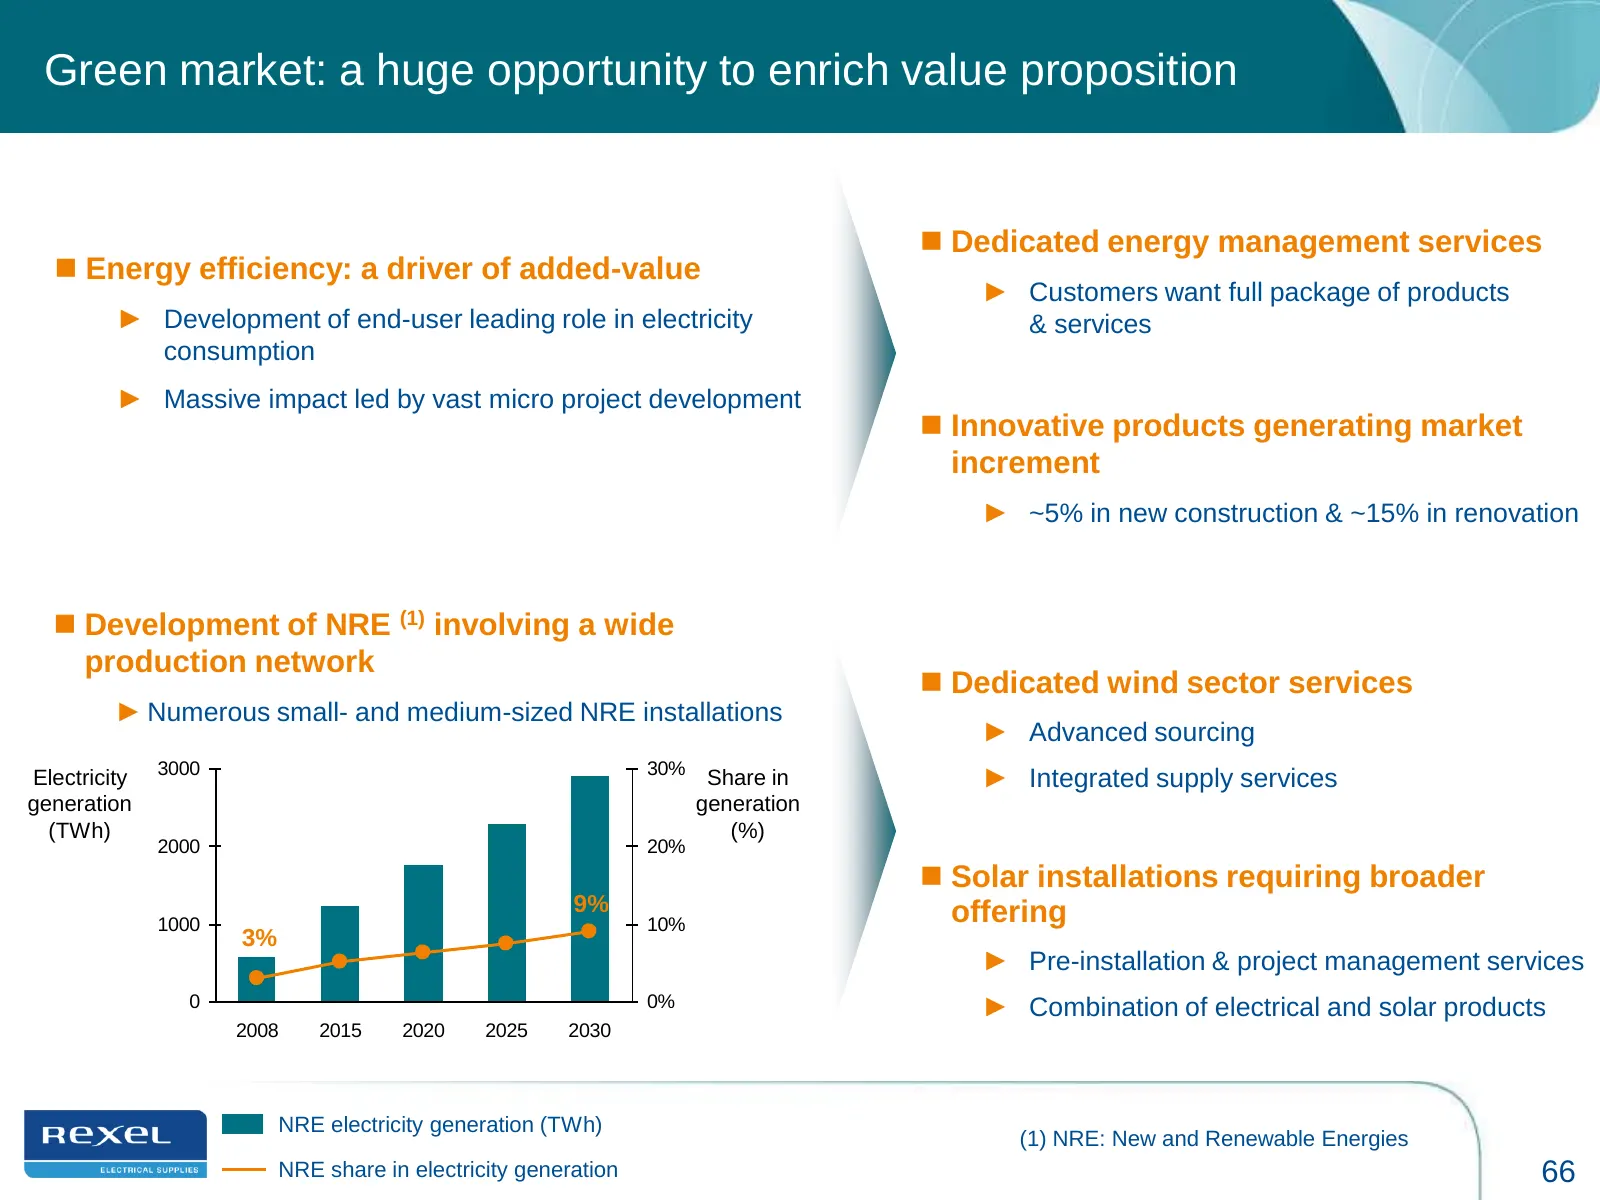
Slide 66: Green market: a huge opportunity to enrich value proposition
Green market: a huge opportunity to enrich value proposition Dedicated energy management services Energy efficiency: a driver of added-value ► Customers want full package of products ► Development of end-user leading role in electricity & services consumption ► Massive impact led by vast micro p
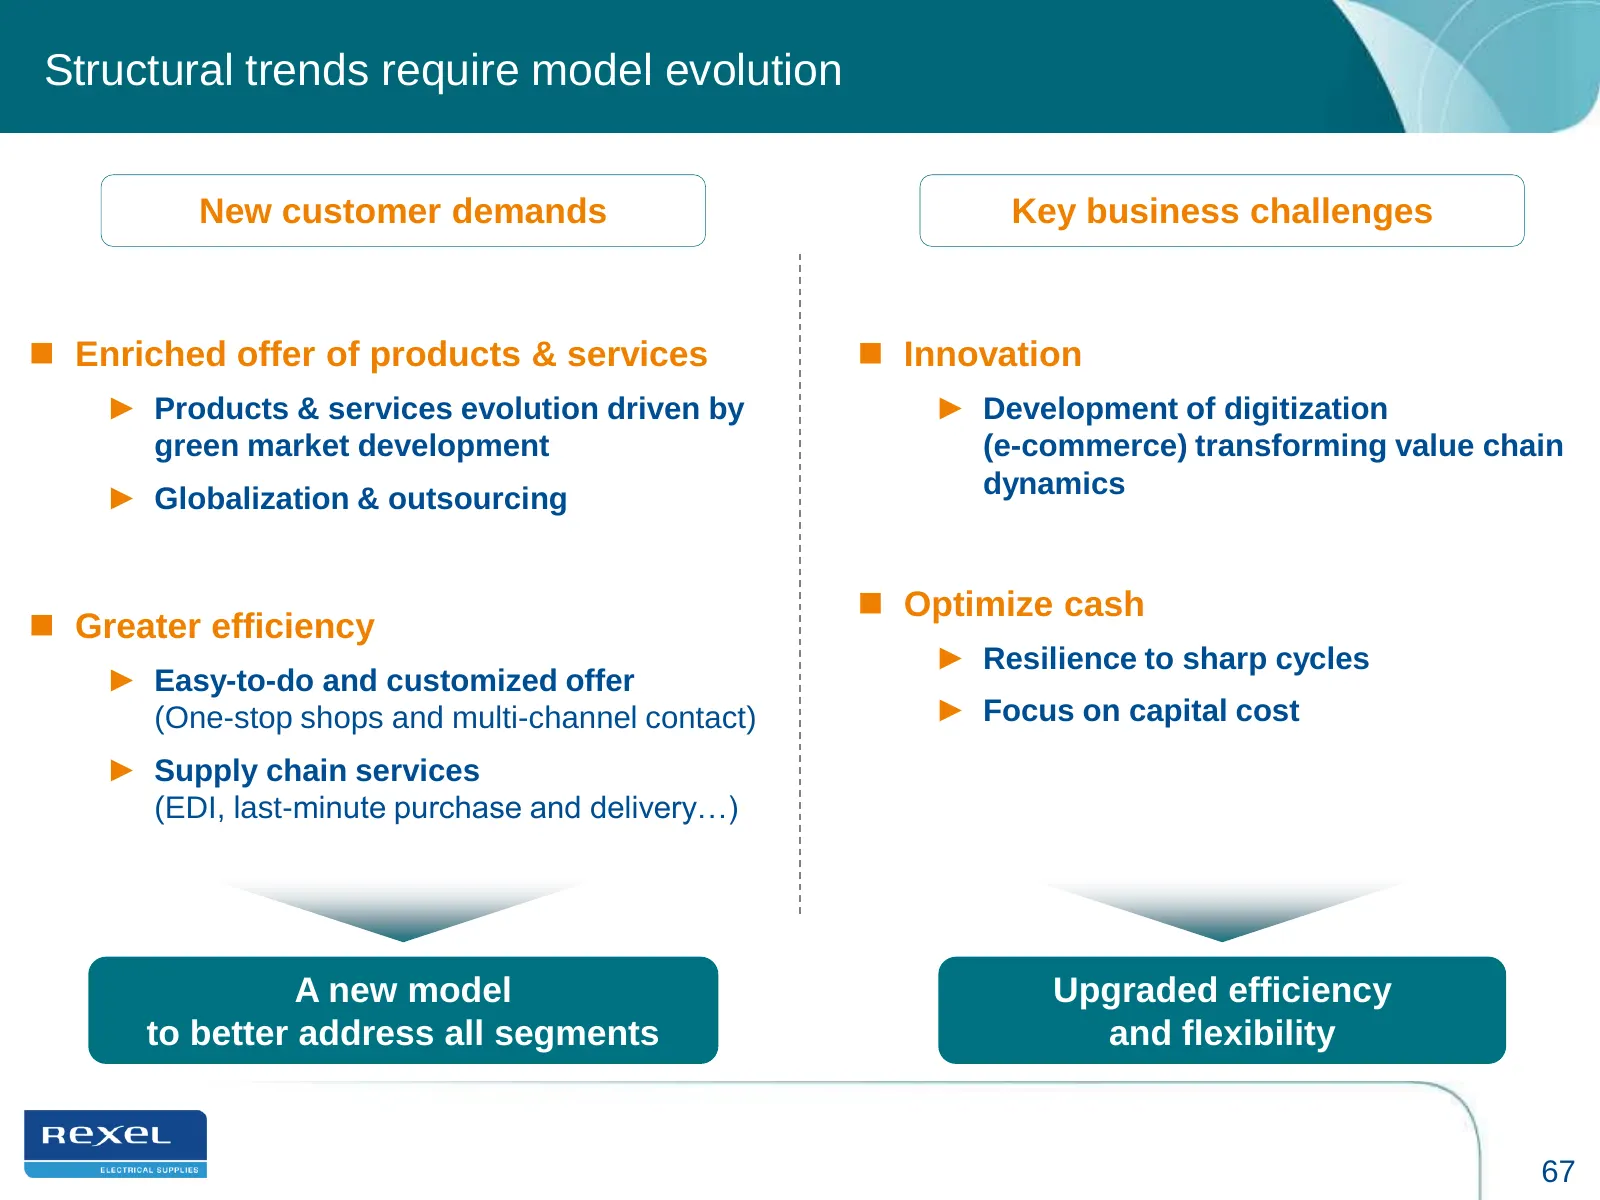
Slide 67: Structural trends require model evolution
Structural trends require model evolution New customer demands Key business challenges Enriched offer of products & services Innovation ► Products & services evolution driven by ► Development of digitization green market development (e-commerce) transforming value chain ► Globalization & outsour
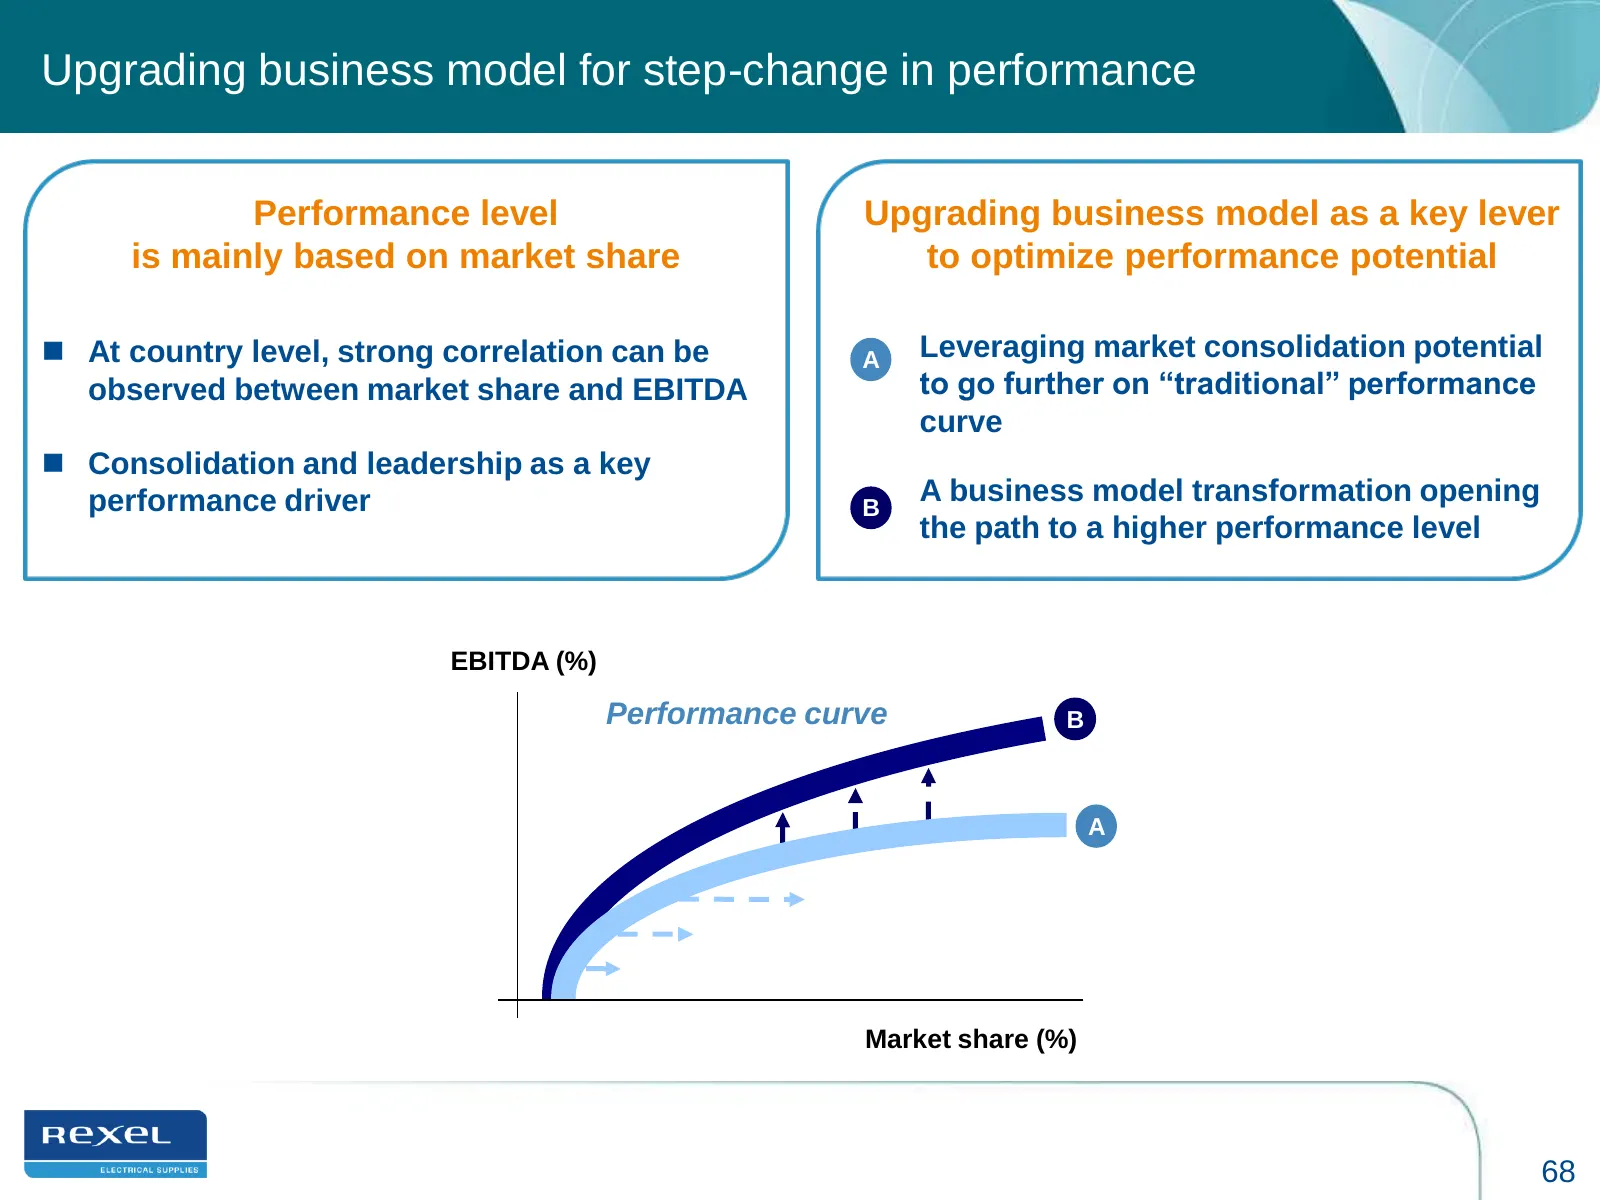
Slide 68: Upgrading business model for step-change in performance
Upgrading business model for step-change in performance Performance level Upgrading business model as a key lever is mainly based on market share to optimize performance potential At country level, strong correlation can be A Leveraging market consolidation potential observed between market share
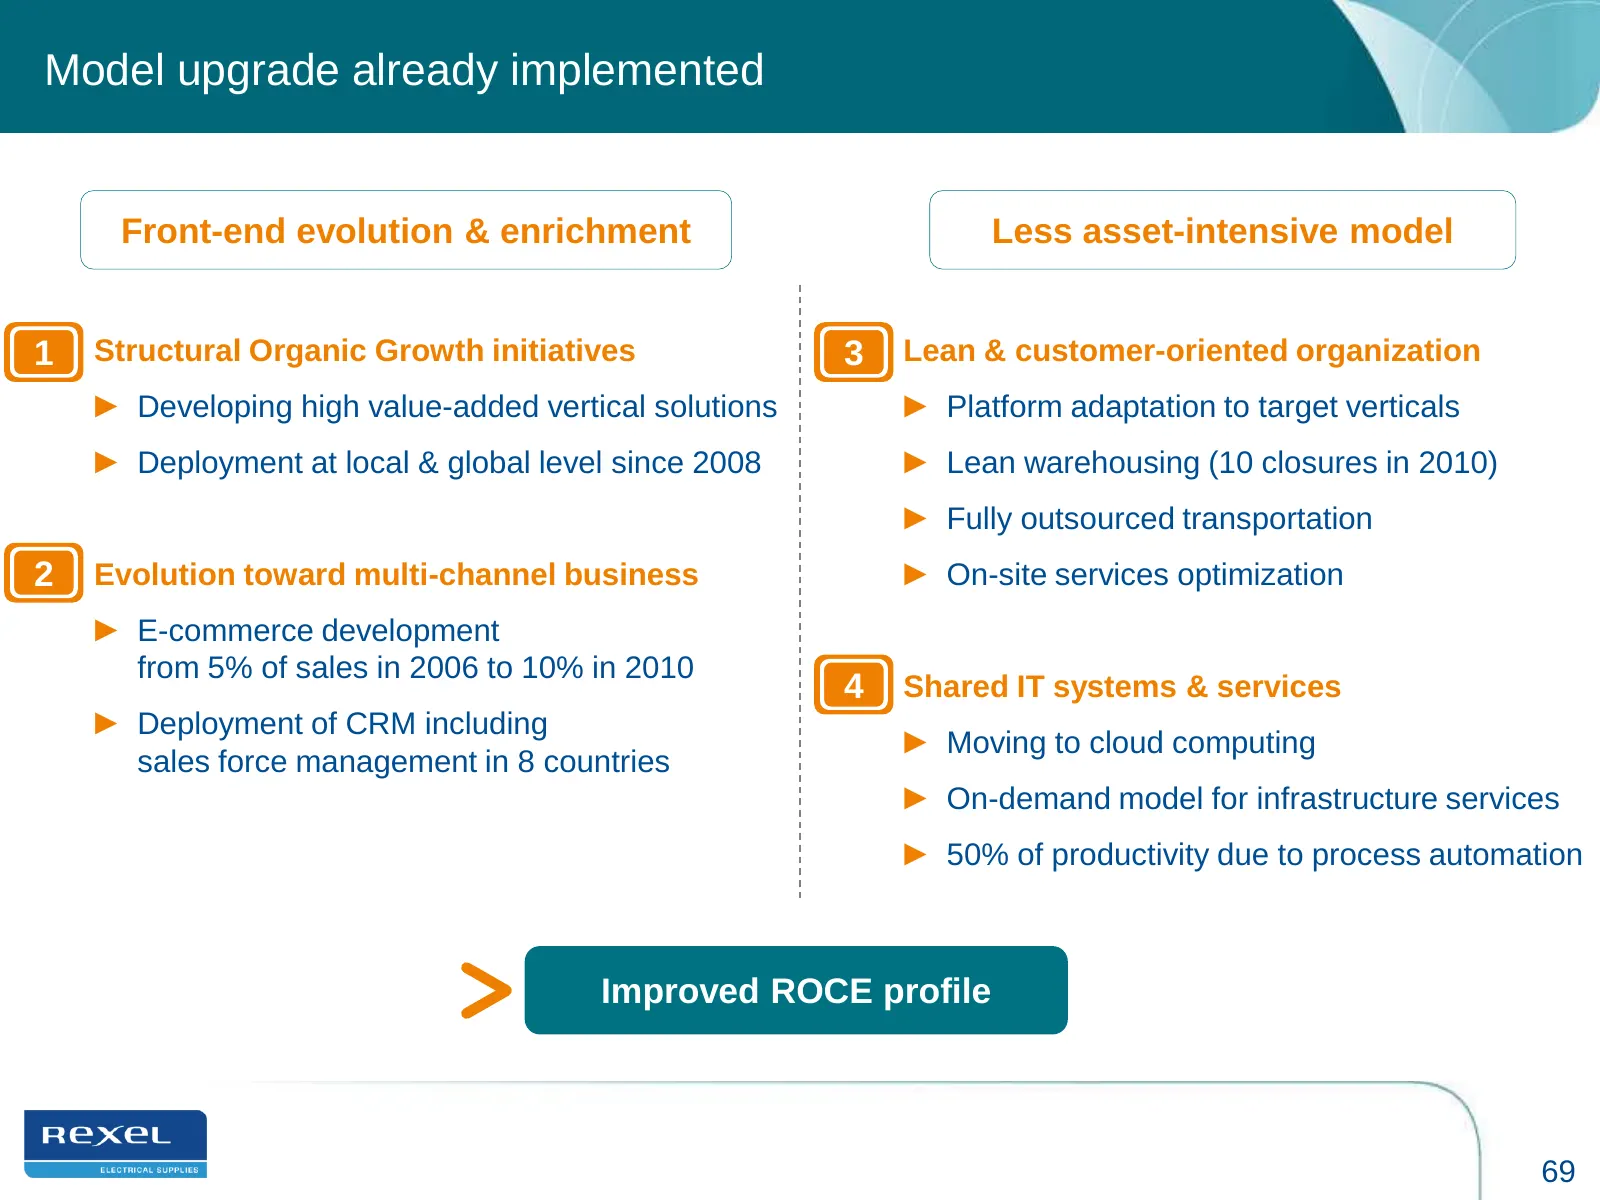
Slide 69: Model upgrade already implemented
Model upgrade already implemented Front-end evolution & enrichment Less asset-intensive model 1 Structural Organic Growth initiatives 3 Lean & customer-oriented organization ► Developing high value-added vertical solutions ► Platform adaptation to target verticals ► Deployment at local & global leve
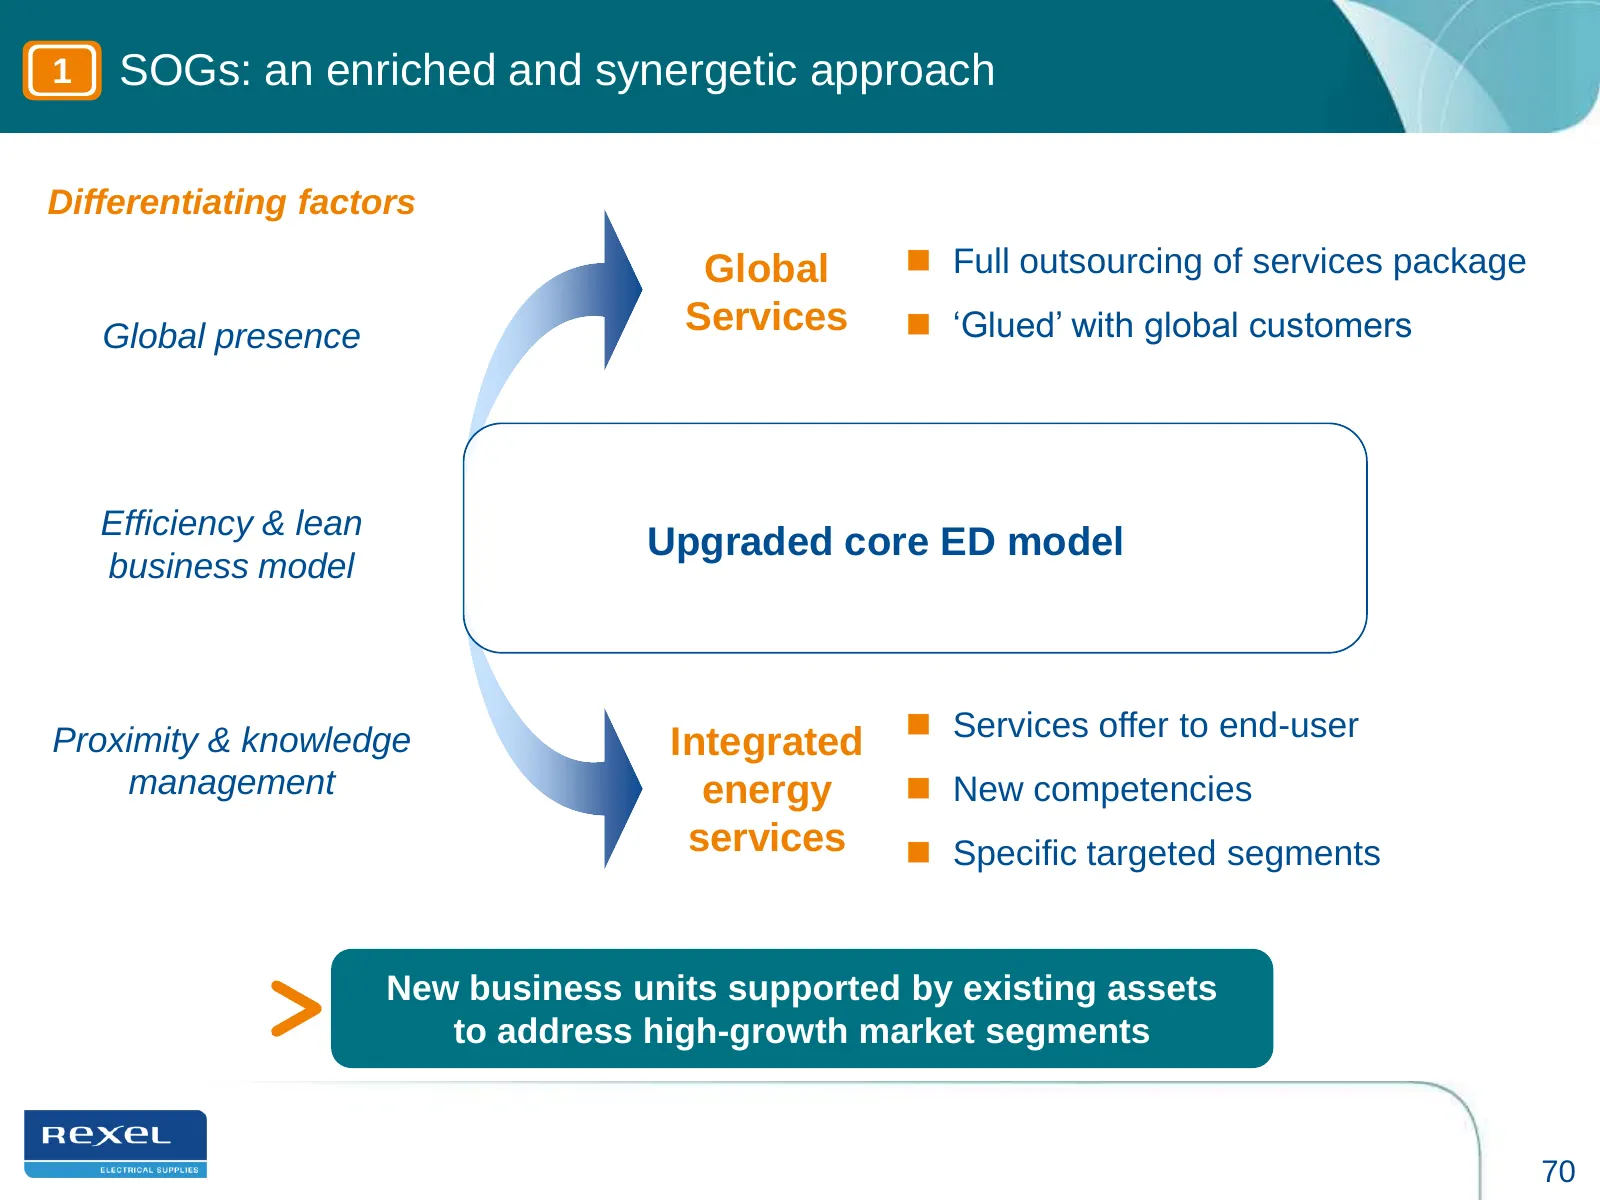
Slide 70: SOGs: an enriched and synergetic approach
1 SOGs: an enriched and synergetic approach Differentiating factors Global Full outsourcing of services package Global presence Services „Glued‟ with global customers Efficiency & lean Upgraded core ED model business model Proximity & knowledge Integrated Services offer to end-user management
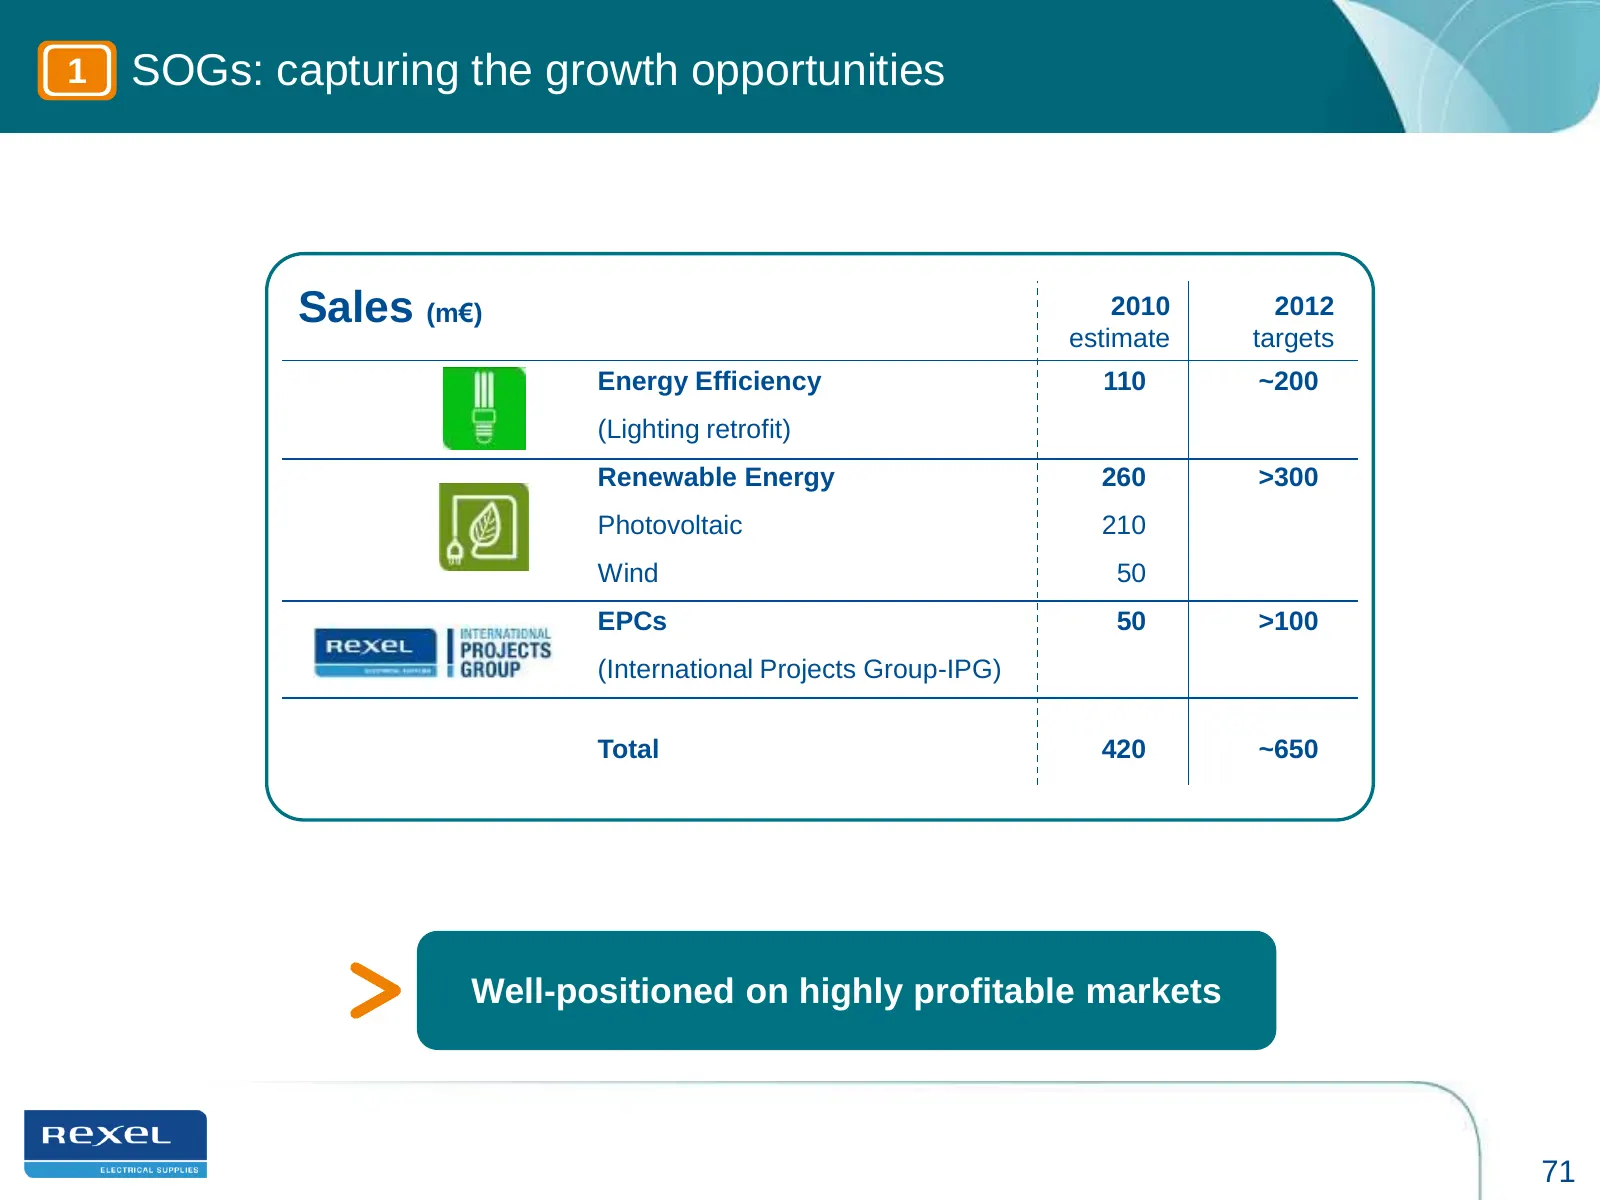
Slide 71: SOGs: capturing the growth opportunities
1 SOGs: capturing the growth opportunities Sales (m€) SOGs – Sales (€m) 2010 2012 estimate targets Energy Efficiency 110 ~200 (Lighting retrofit) Renewable Energy 260 >300 Photovoltaic 210 Wind 50 EPCs 50 >100 (International Projects Group-IPG) Total 420 ~650 Well-positioned on highly profitable mar
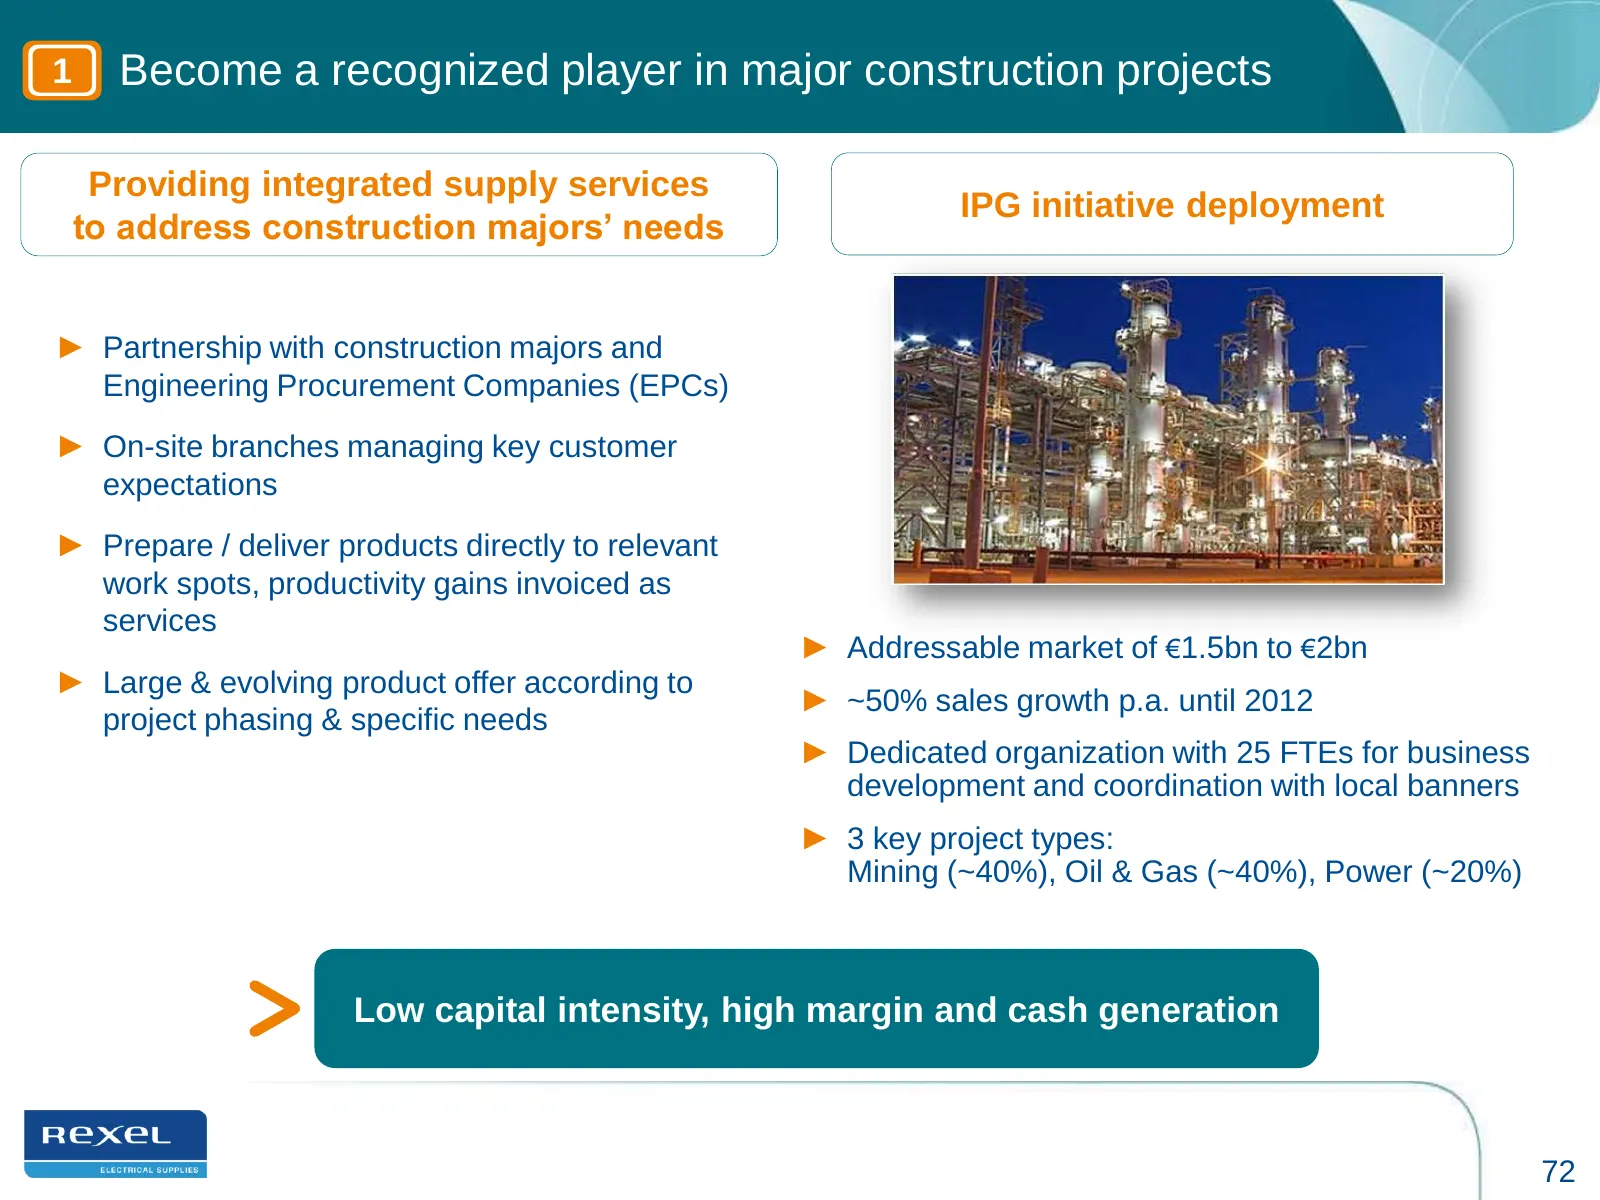
Slide 72: Become a recognized player in major construction projects
1 Become a recognized player in major construction projects Providing integrated supply services IPG initiative deployment to address construction majors’ needs ► Partnership with construction majors and Engineering Procurement Companies (EPCs) ► On-site branches managing key customer expectations ►
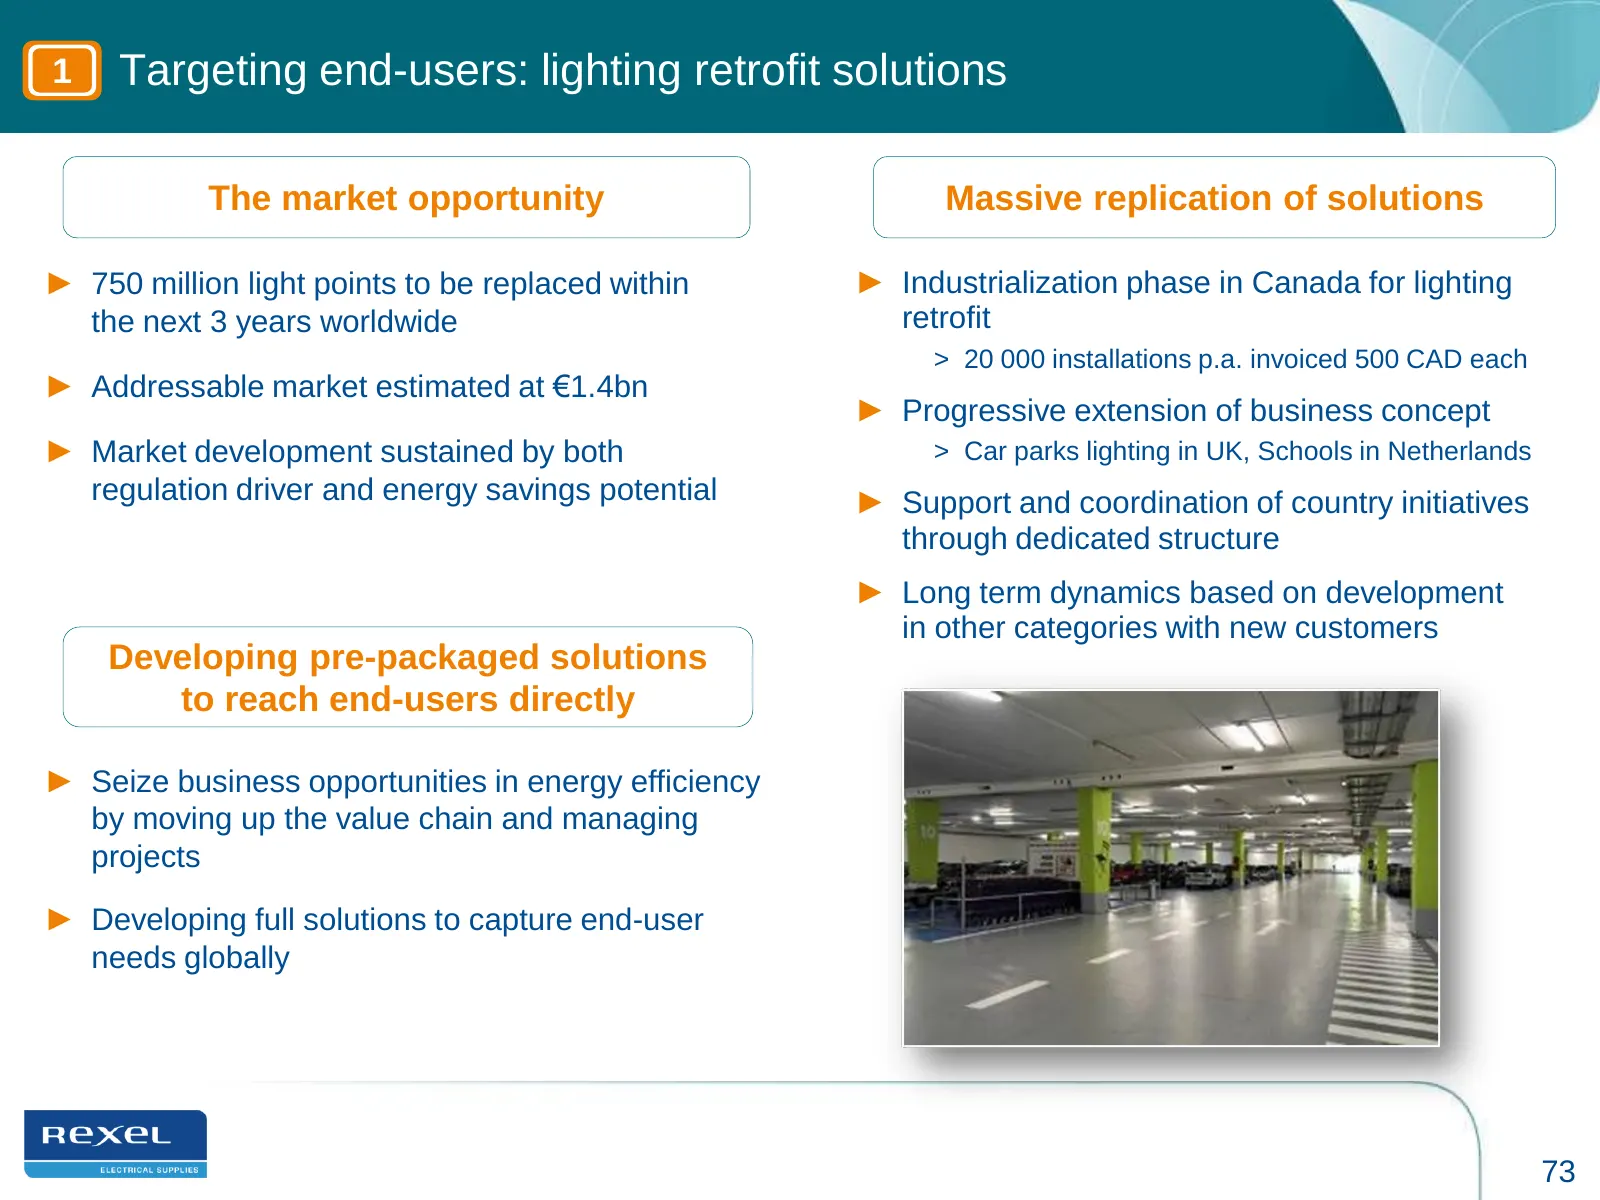
Slide 73: Targeting end-users: lighting retrofit solutions
1 Targeting end-users: lighting retrofit solutions The market opportunity Massive replication of solutions ► 750 million light points to be replaced within ► Industrialization phase in Canada for lighting the next 3 years worldwide retrofit > 20 000 installations p.a. invoiced 500 CAD each ► Address
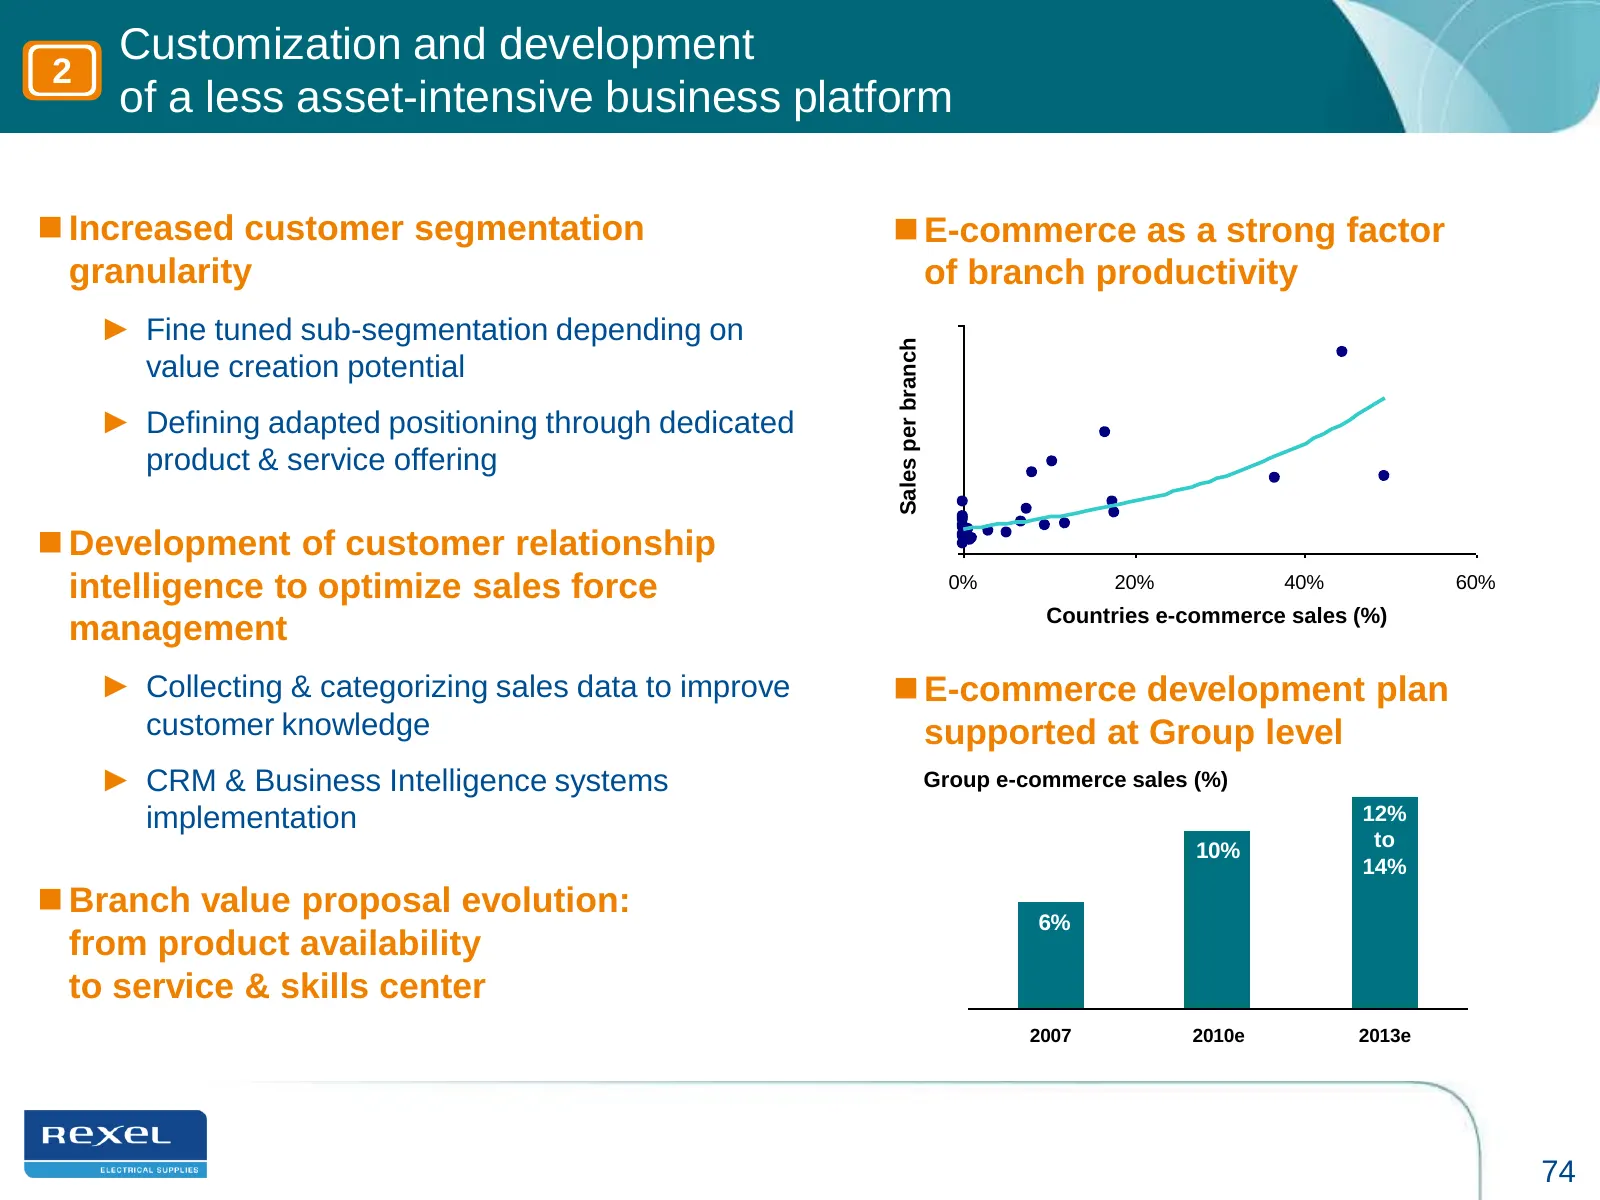
Slide 74: Customization and development of a less asset-intensive business platform
Customization and development 2 of a less asset-intensive business platform Increased customer segmentation E-commerce as a strong factor granularity of branch productivity ► Fine tuned sub-segmentation depending on Sales per branch value creation potential ► Defining adapted positioning through
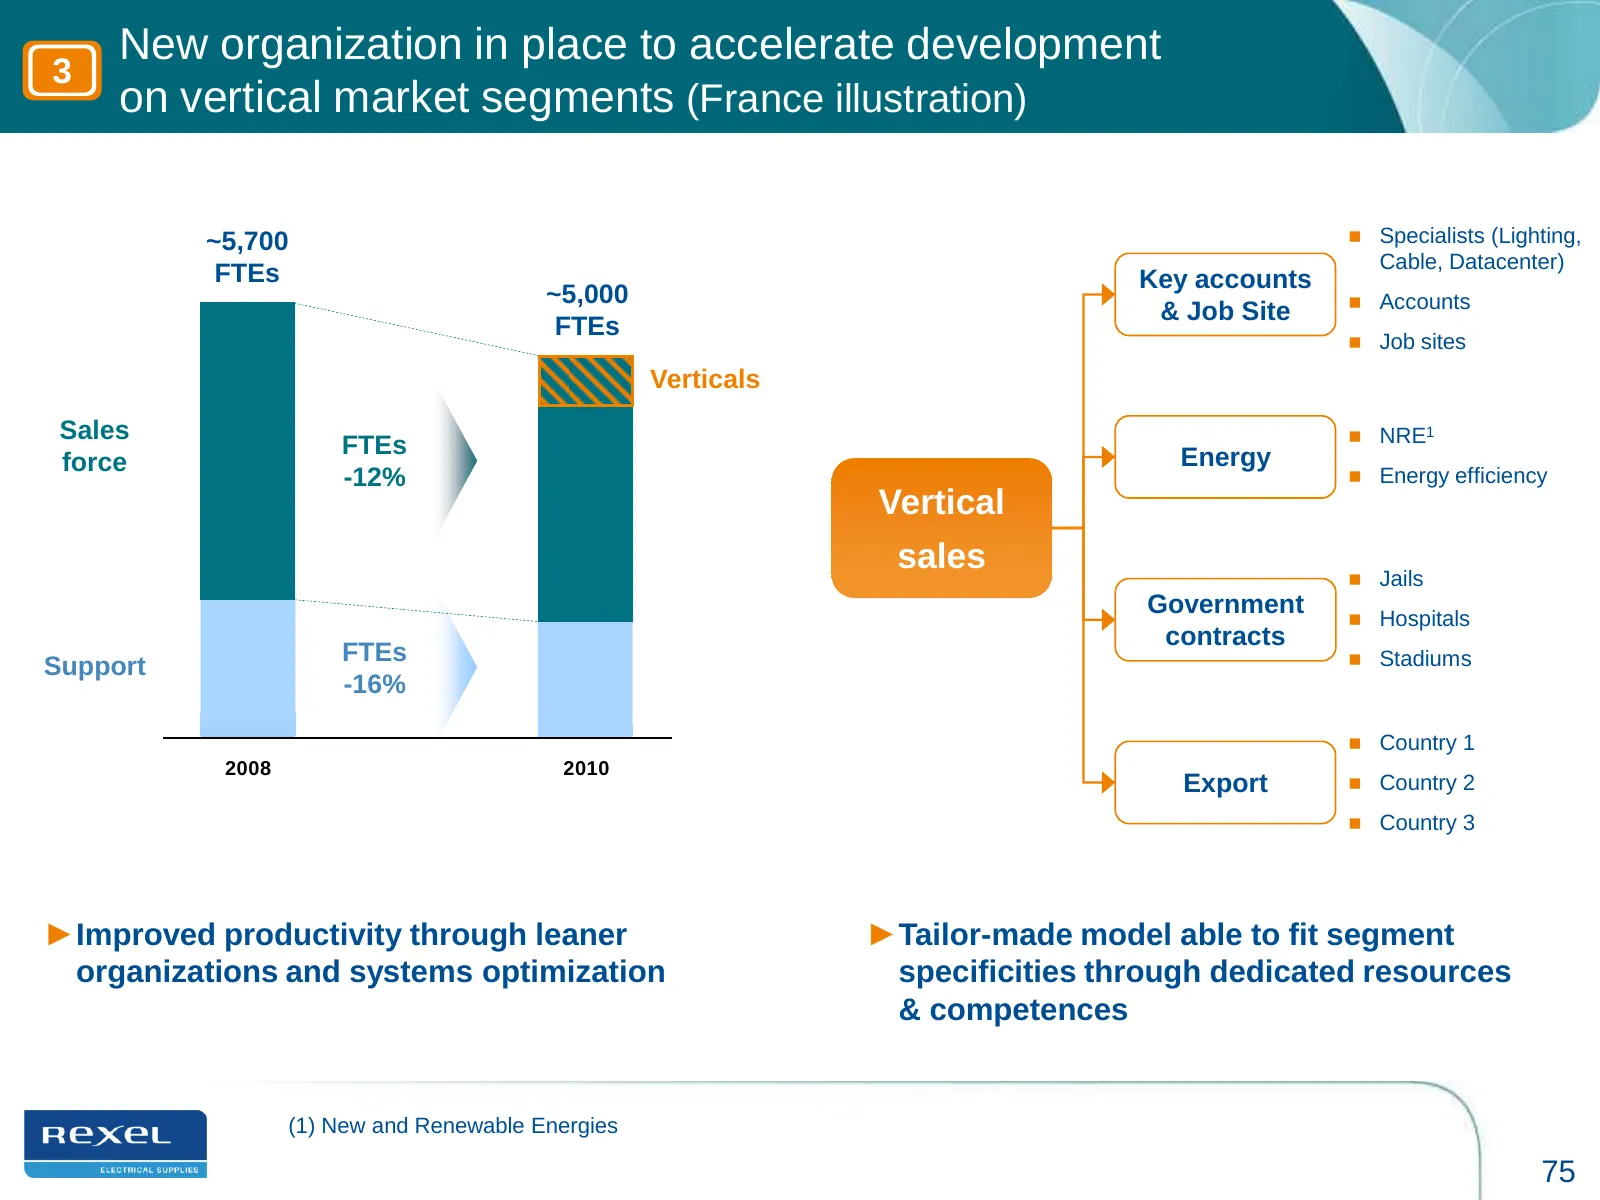
Slide 75: New organization in place to accelerate development on vertical market segments
New organization in place to accelerate development 3 on vertical market segments (France illustration) ~5,700 Specialists (Lighting, Cable, Datacenter) FTEs Key accounts ~5,000 Accounts & Job Site FTEs Job sites Verticals Sales NRE1 FTEs Energy force -12% Energy efficiency Vertical sales
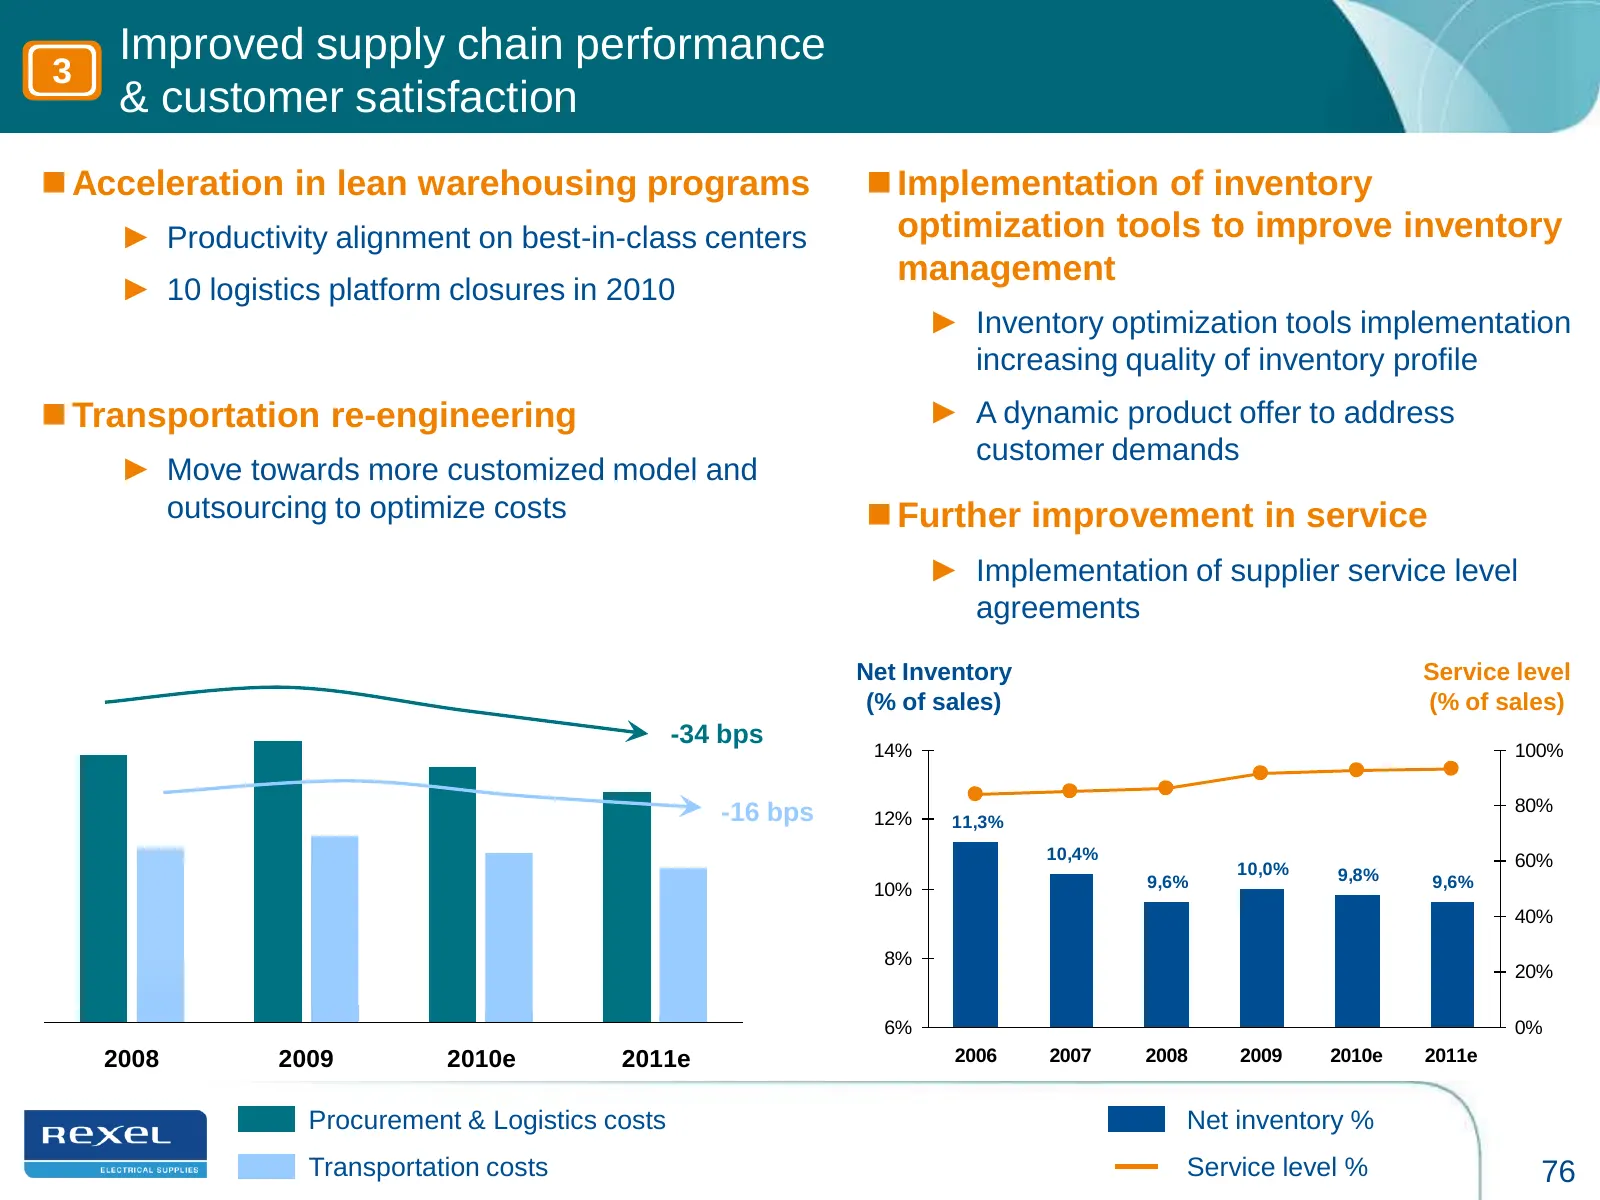
Slide 76: Improved supply chain performance & customer satisfaction
Improved supply chain performance 3 & customer satisfaction Acceleration in lean warehousing programs Implementation of inventory ► Productivity alignment on best-in-class centers optimization tools to improve inventory management ► 10 logistics platform closures in 2010 ► Inventory optimization
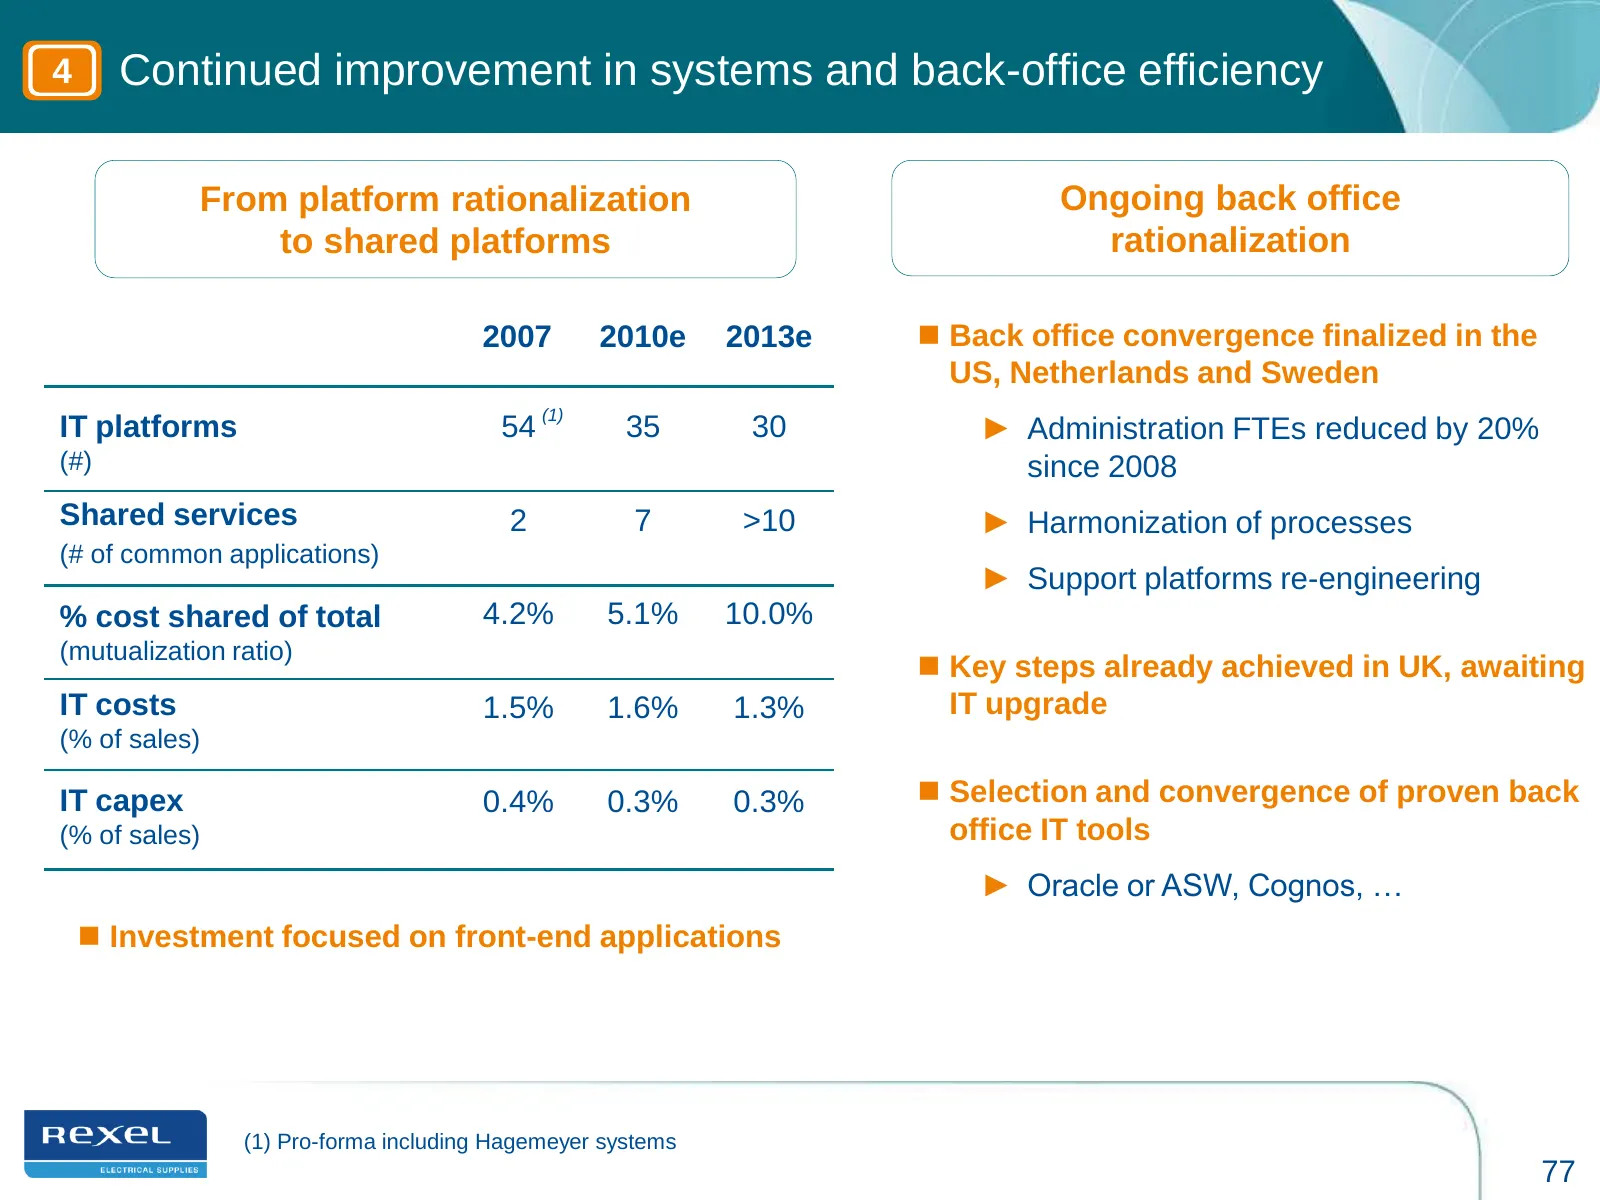
Slide 77: Continued improvement in systems and back-office efficiency
4 Continued improvement in systems and back-office efficiency From platform rationalization Ongoing back office to shared platforms rationalization 2007 2010e 2013e Back office convergence finalized in the US, Netherlands and Sweden (1) IT platforms 54 35 30 ► Administration FTEs reduced by 20% (#
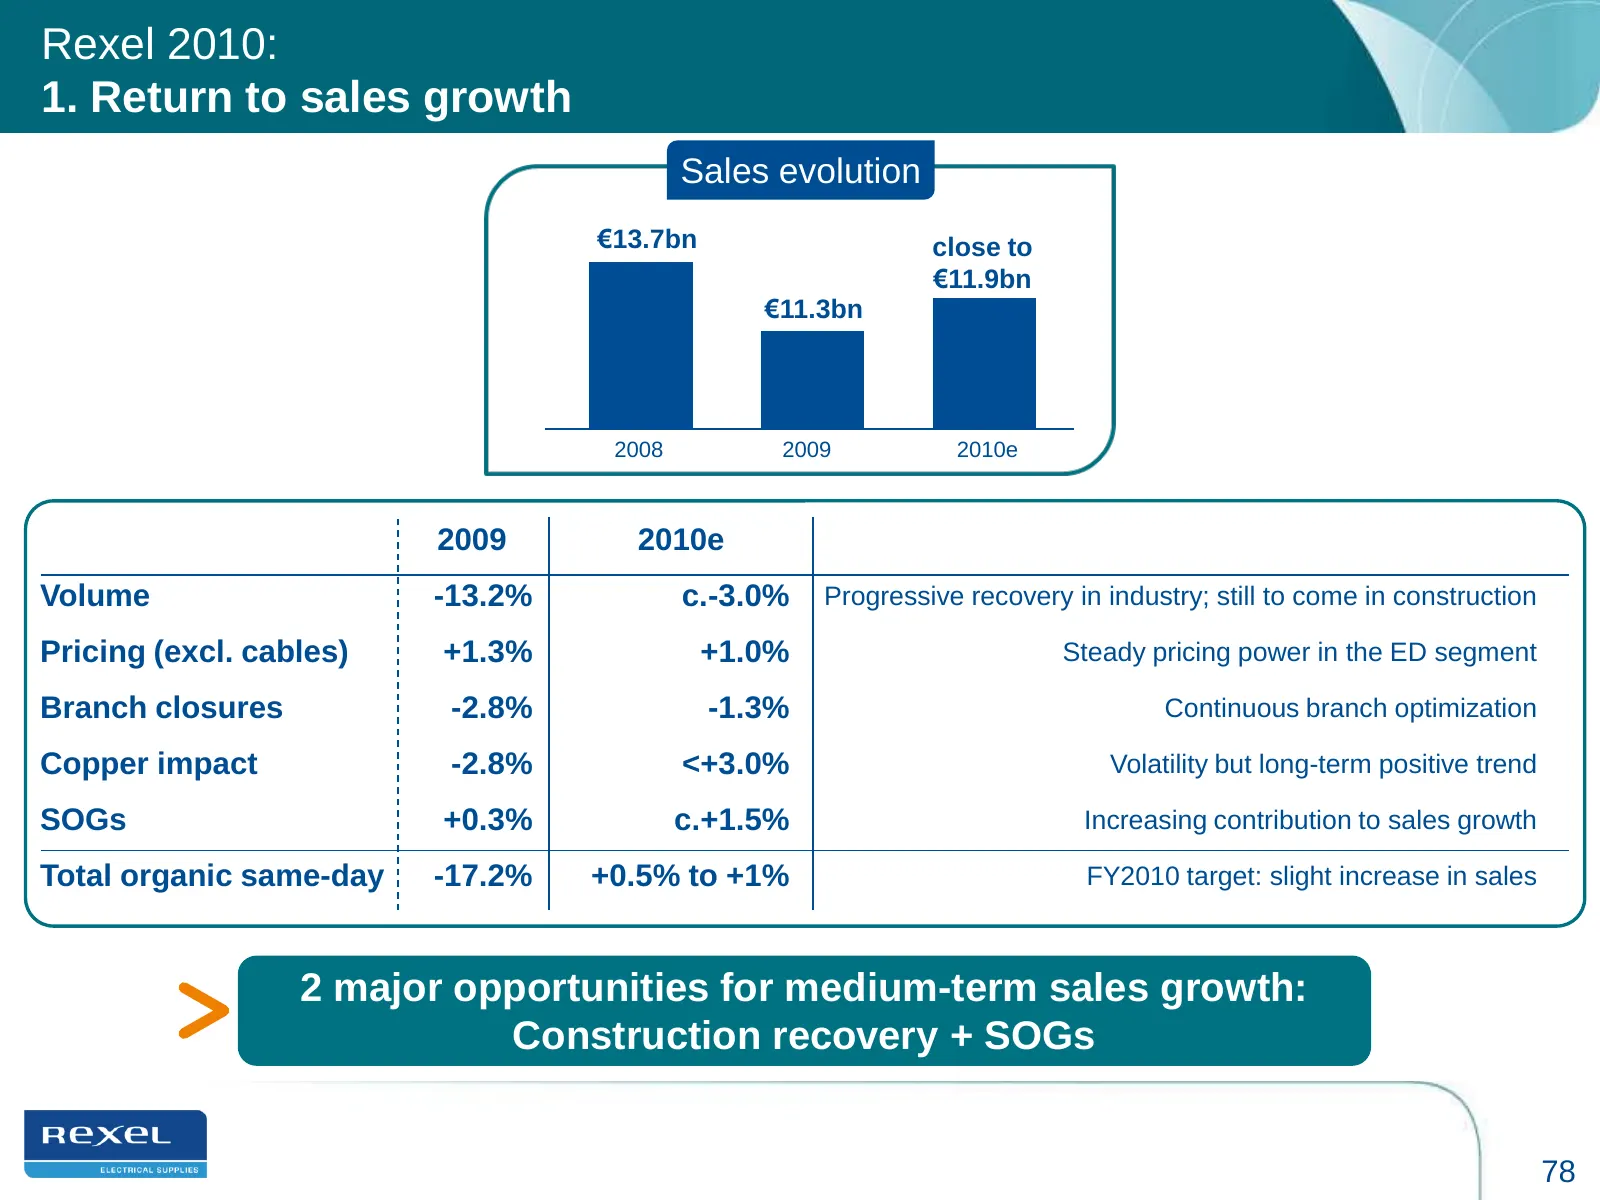
Slide 78: Rexel 2010: 1. Return to sales growth
Rexel 2010: 1. Return to sales growth Sales evolution €13.7bn close to €11.9bn €11.3bn 2008 2009 2010e 2009 2010e Volume -13.2% c.-3.0% Progressive recovery in industry; still to come in construction Pricing (excl. cables) +1.3% +1.0% Steady pricing power in the ED segment Branch closures -2.8% -1.3
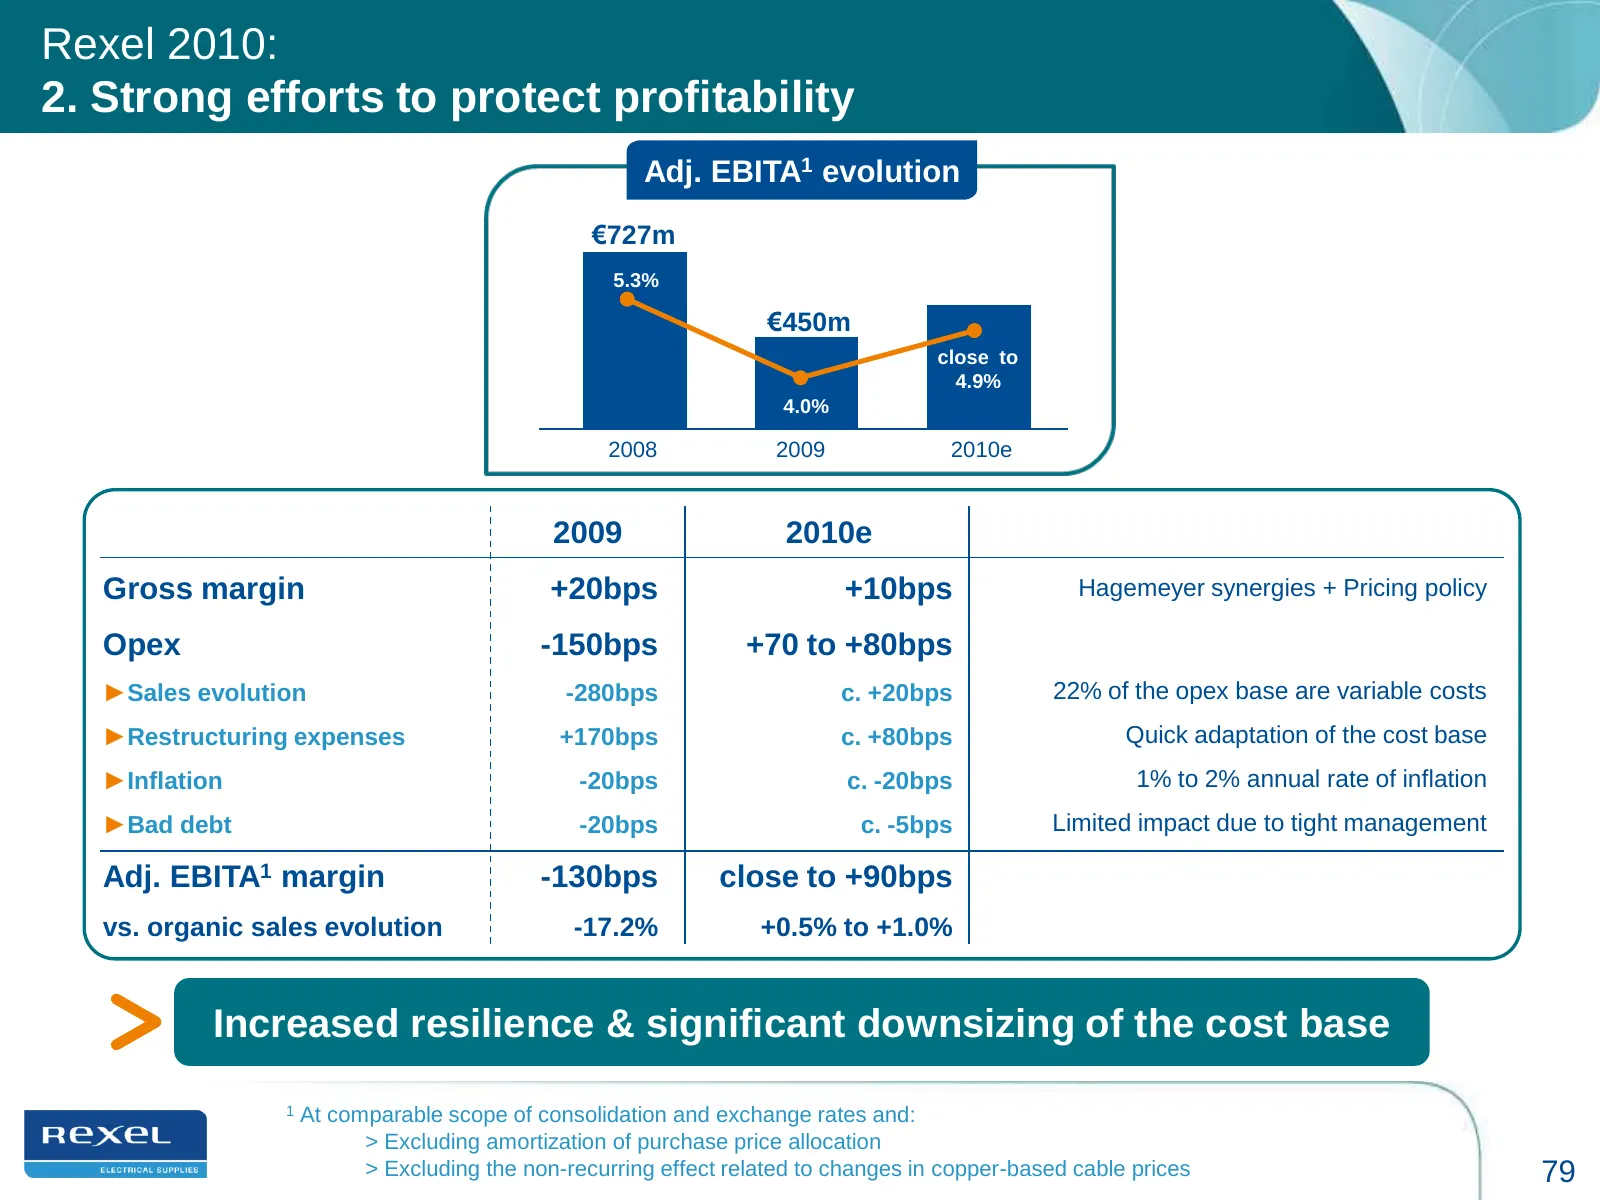
Slide 79: Rexel 2010: 2. Strong efforts to protect profitability
Rexel 2010: 2. Strong efforts to protect profitability Adj. EBITA1 evolution €727m 5.3% €450m 3.8% close to 4.9% 4.0% 2008 2009 2010e 2009 2010e Gross margin +20bps +10bps Hagemeyer synergies + Pricing policy Opex -150bps +70 to +80bps ►Sales evolution -280bps c. +20bps 22% of the opex base are vari
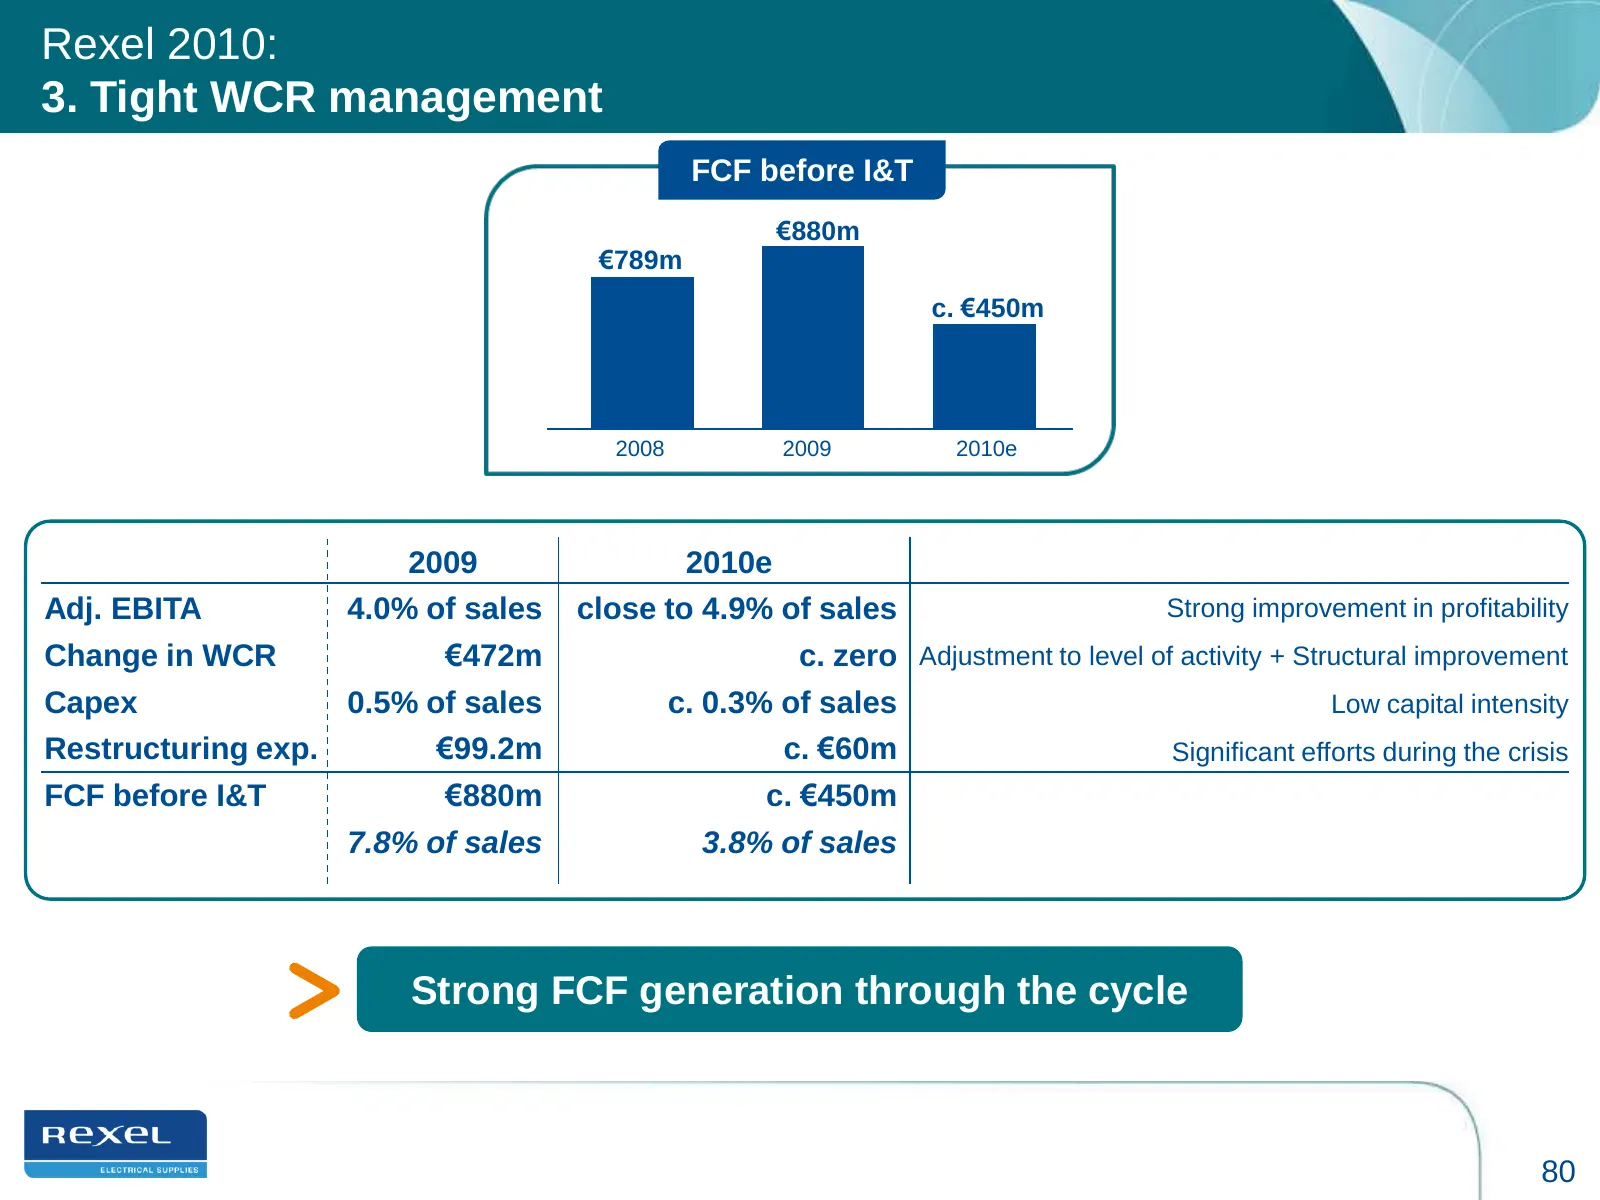
Slide 80: Rexel 2010: 3. Tight WCR management
Rexel 2010: 3. Tight WCR management FCF before I&T €880m €789m c. €450m 3.8% 2008 2009 2010e 2009 2010e Adj. EBITA 4.0% of sales close to 4.9% of sales Strong improvement in profitability Change in WCR €472m c. zero Adjustment to level of activity + Structural improvement Capex 0.5% of sales c. 0.3%
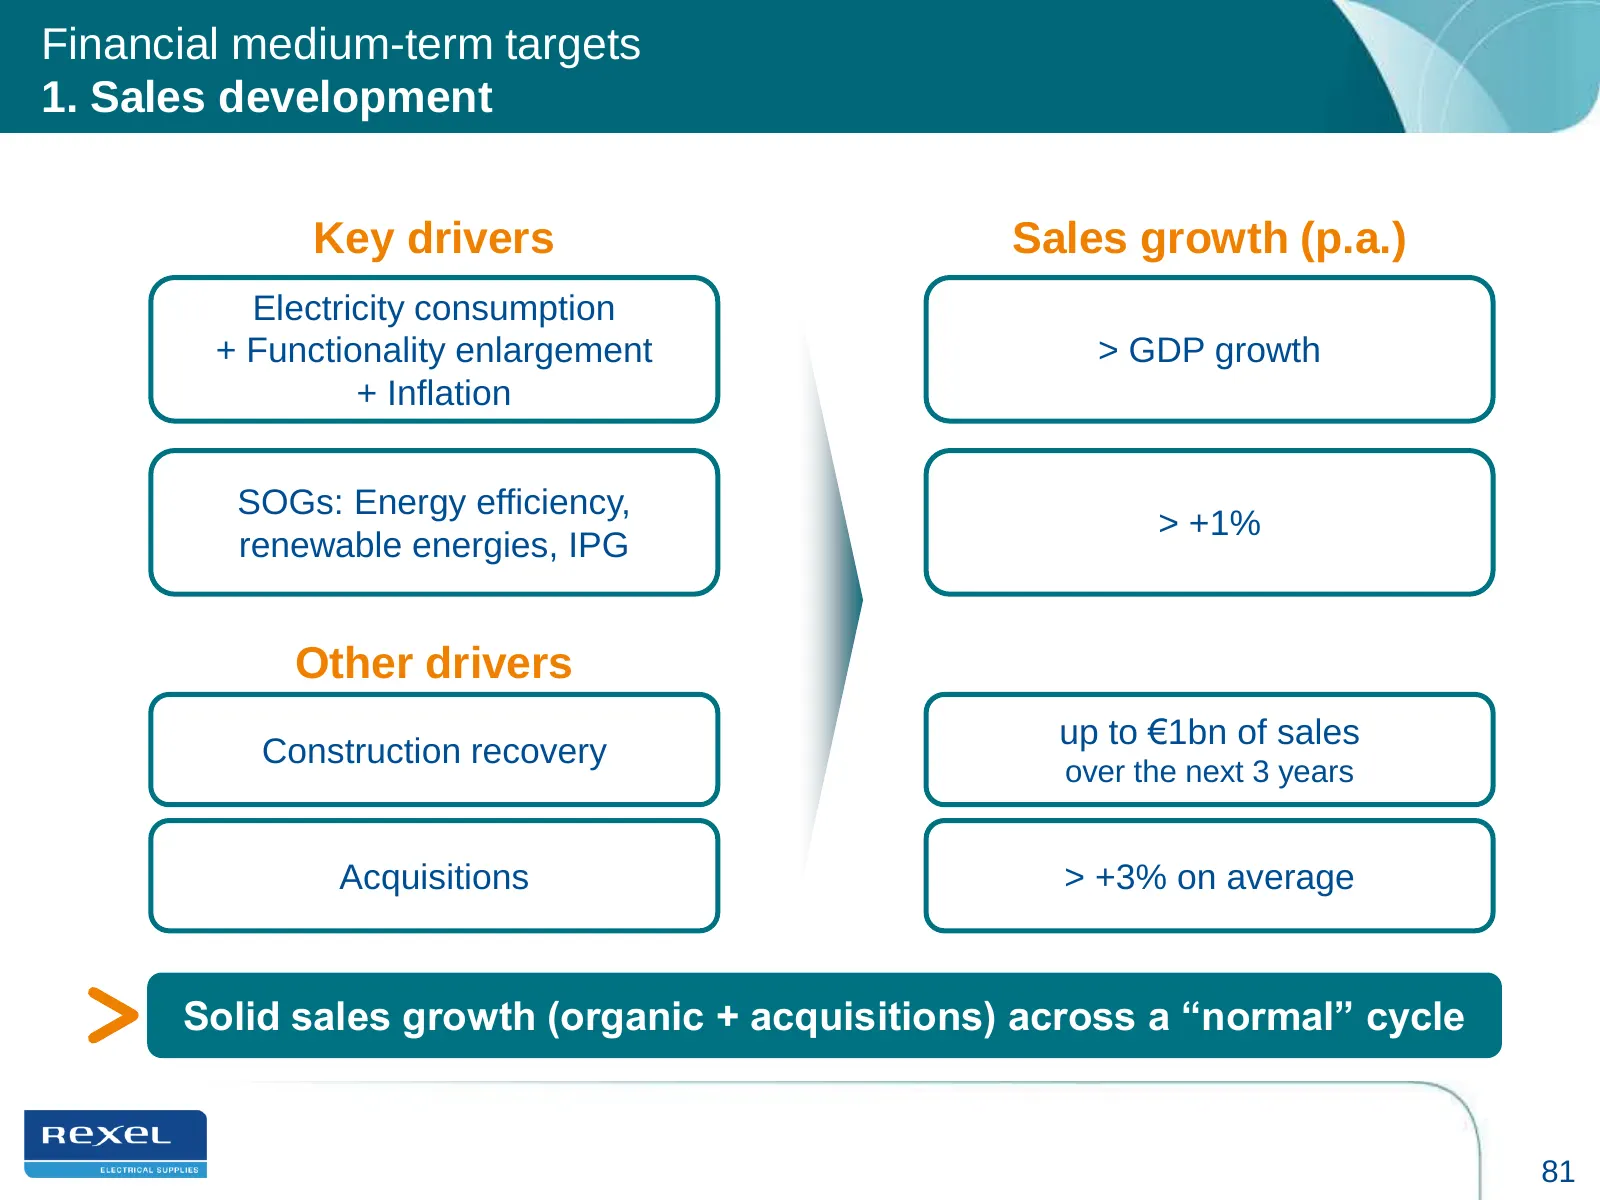
Slide 81: Financial medium-term targets: 1. Sales development
Financial medium-term targets 1. Sales development Key drivers Sales growth (p.a.) Electricity consumption + Functionality enlargement > GDP growth + Inflation SOGs: Energy efficiency, > +1% renewable energies, IPG Other drivers up to €1bn of sales Construction recovery over the next 3 years Acquisi
Slide 82: Financial medium-term targets: 2. Margin optimization
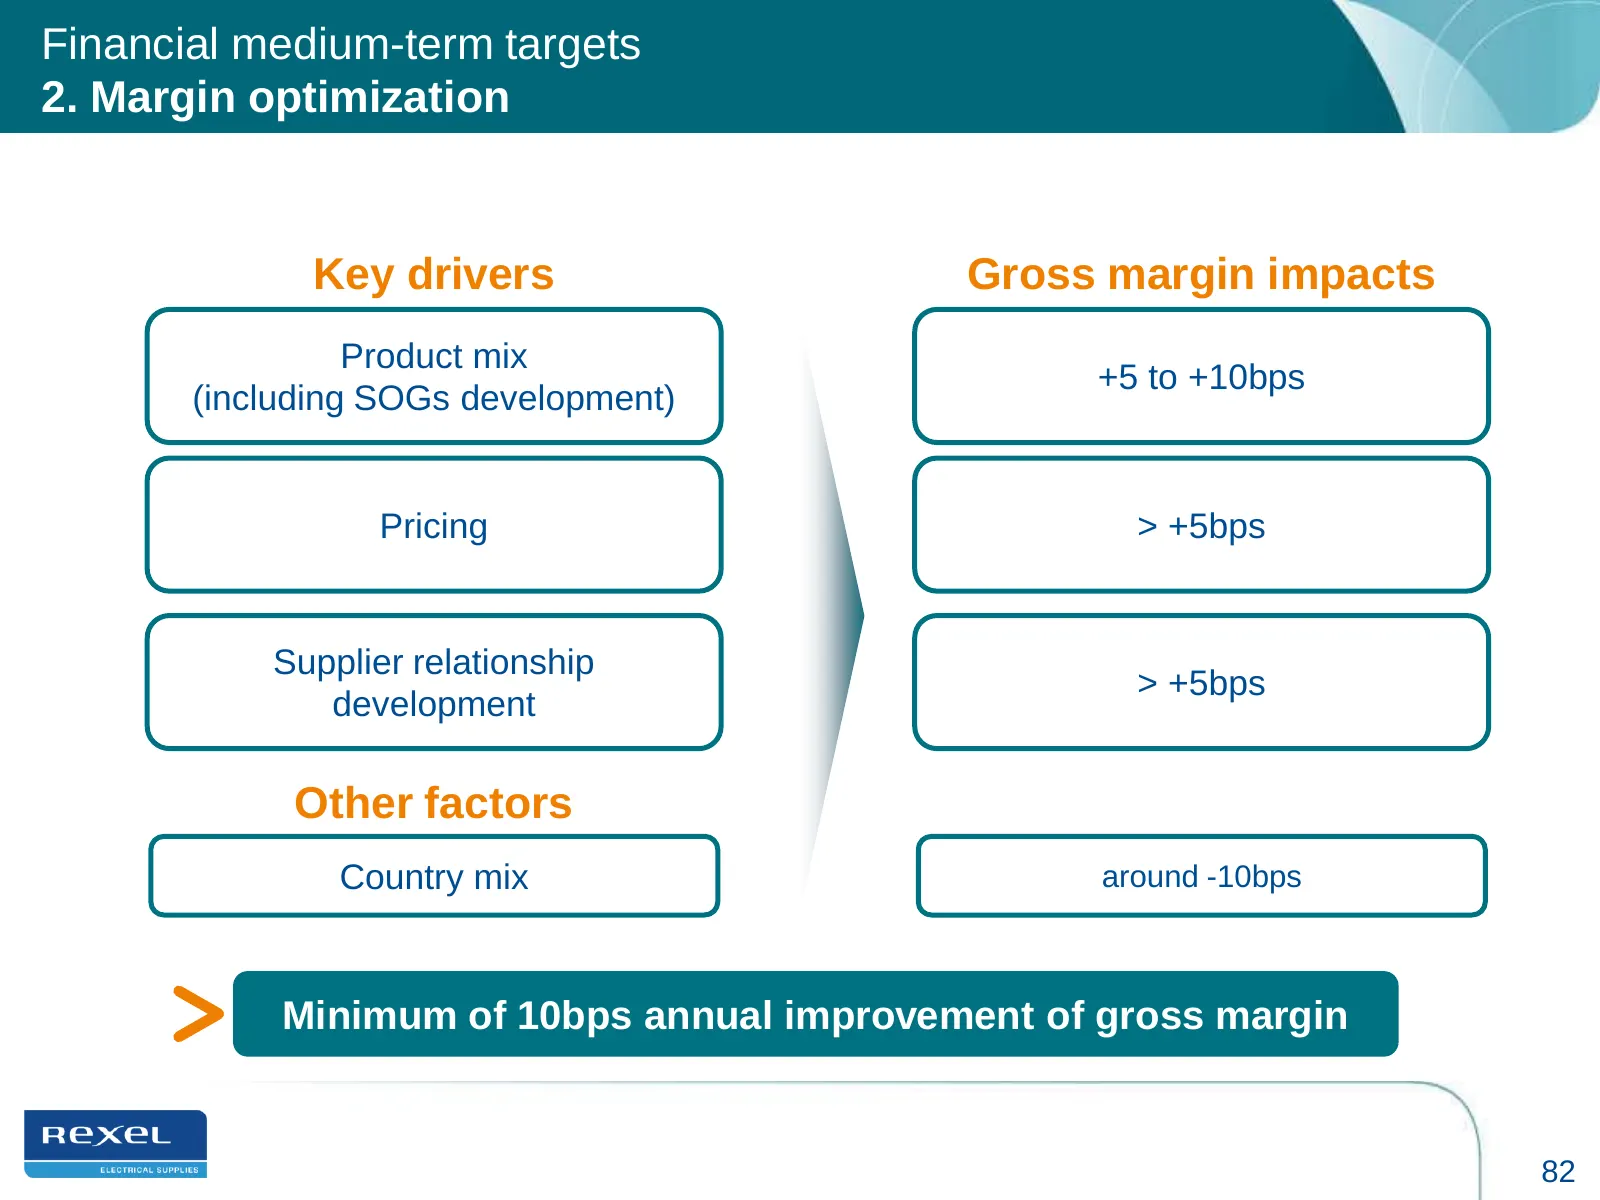
Financial medium-term targets 2. Margin optimization Key drivers Gross margin impacts Product mix +5 to +10bps (including SOGs development) Pricing > +5bps Supplier relationship > +5bps development Other factors Country mix around -10bps Minimum of 10bps annual improvement of gross margin 82
Slide 83: Financial medium-term targets: 3. Opex management
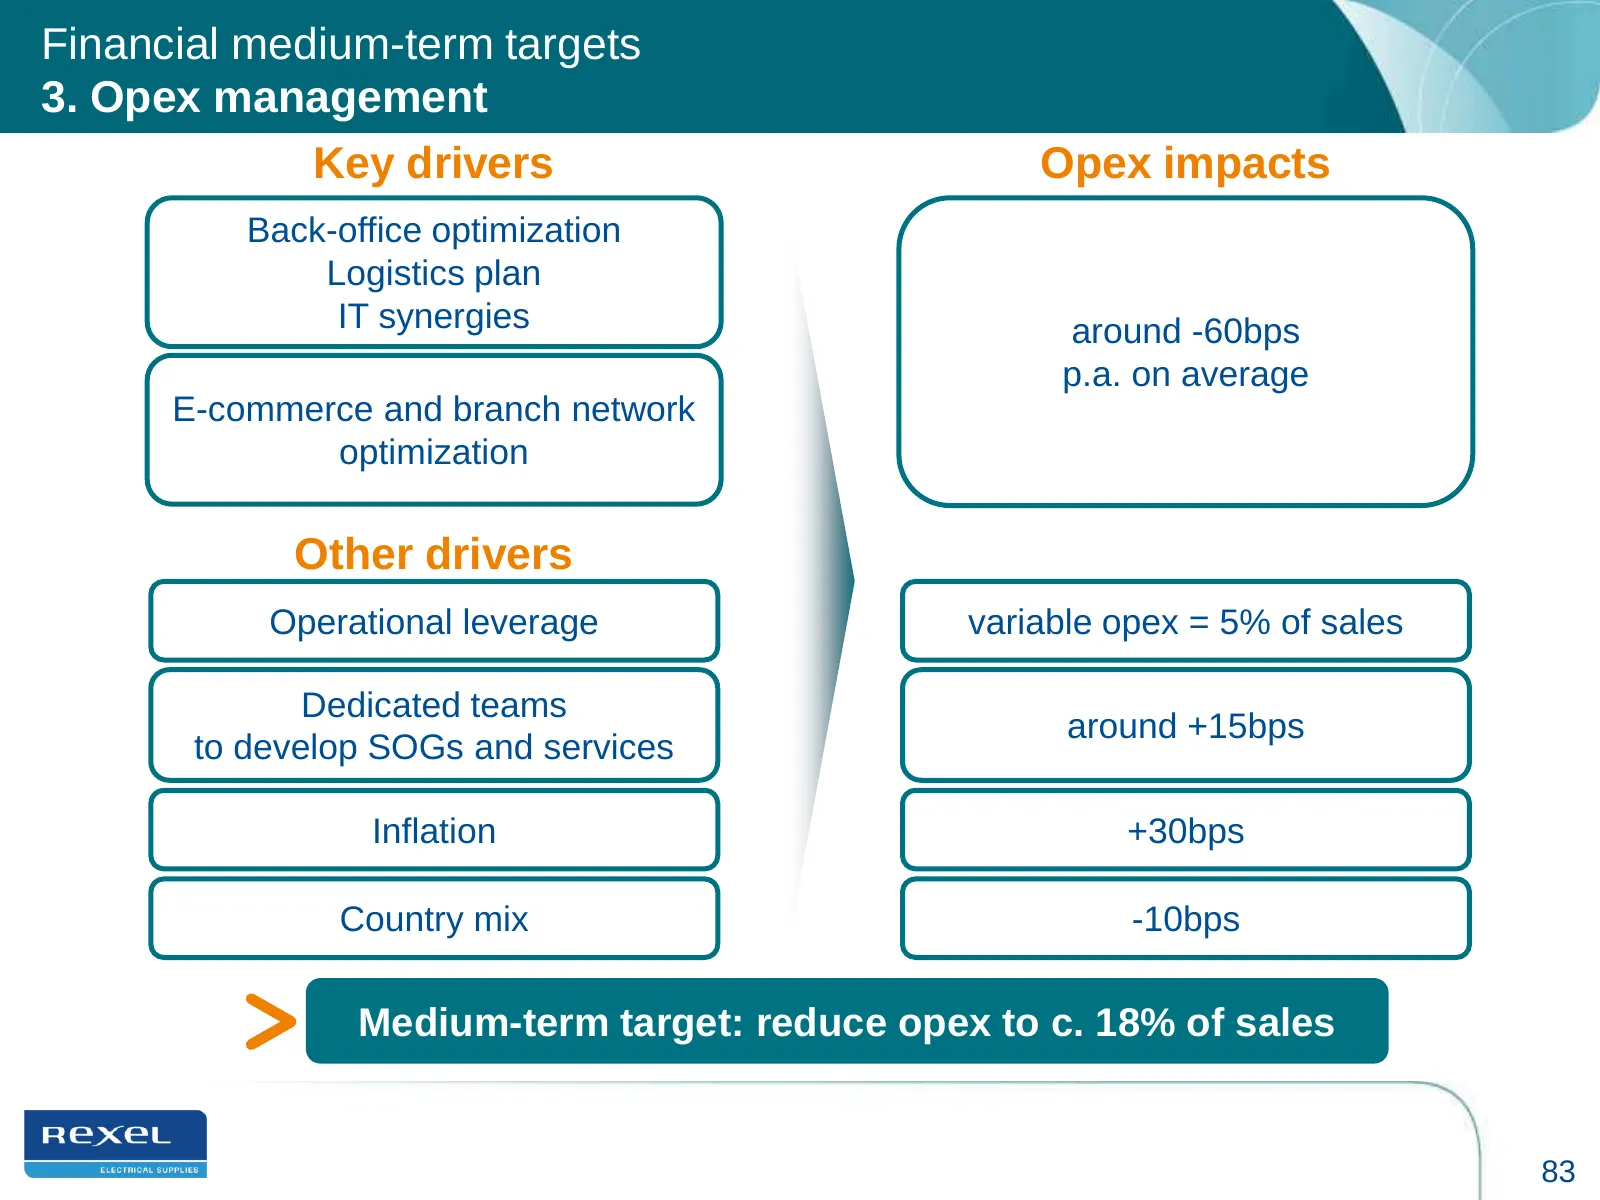
Financial medium-term targets 3. Opex management Key drivers Opex impacts Back-office optimization Logistics plan IT synergies around -60bps p.a. on average E-commerce and branch network optimization Other drivers Operational leverage variable opex = 5% of sales Dedicated teams around +15bps to deve
Slide 84: Financial medium-term targets: 4. Optimization of capital employed
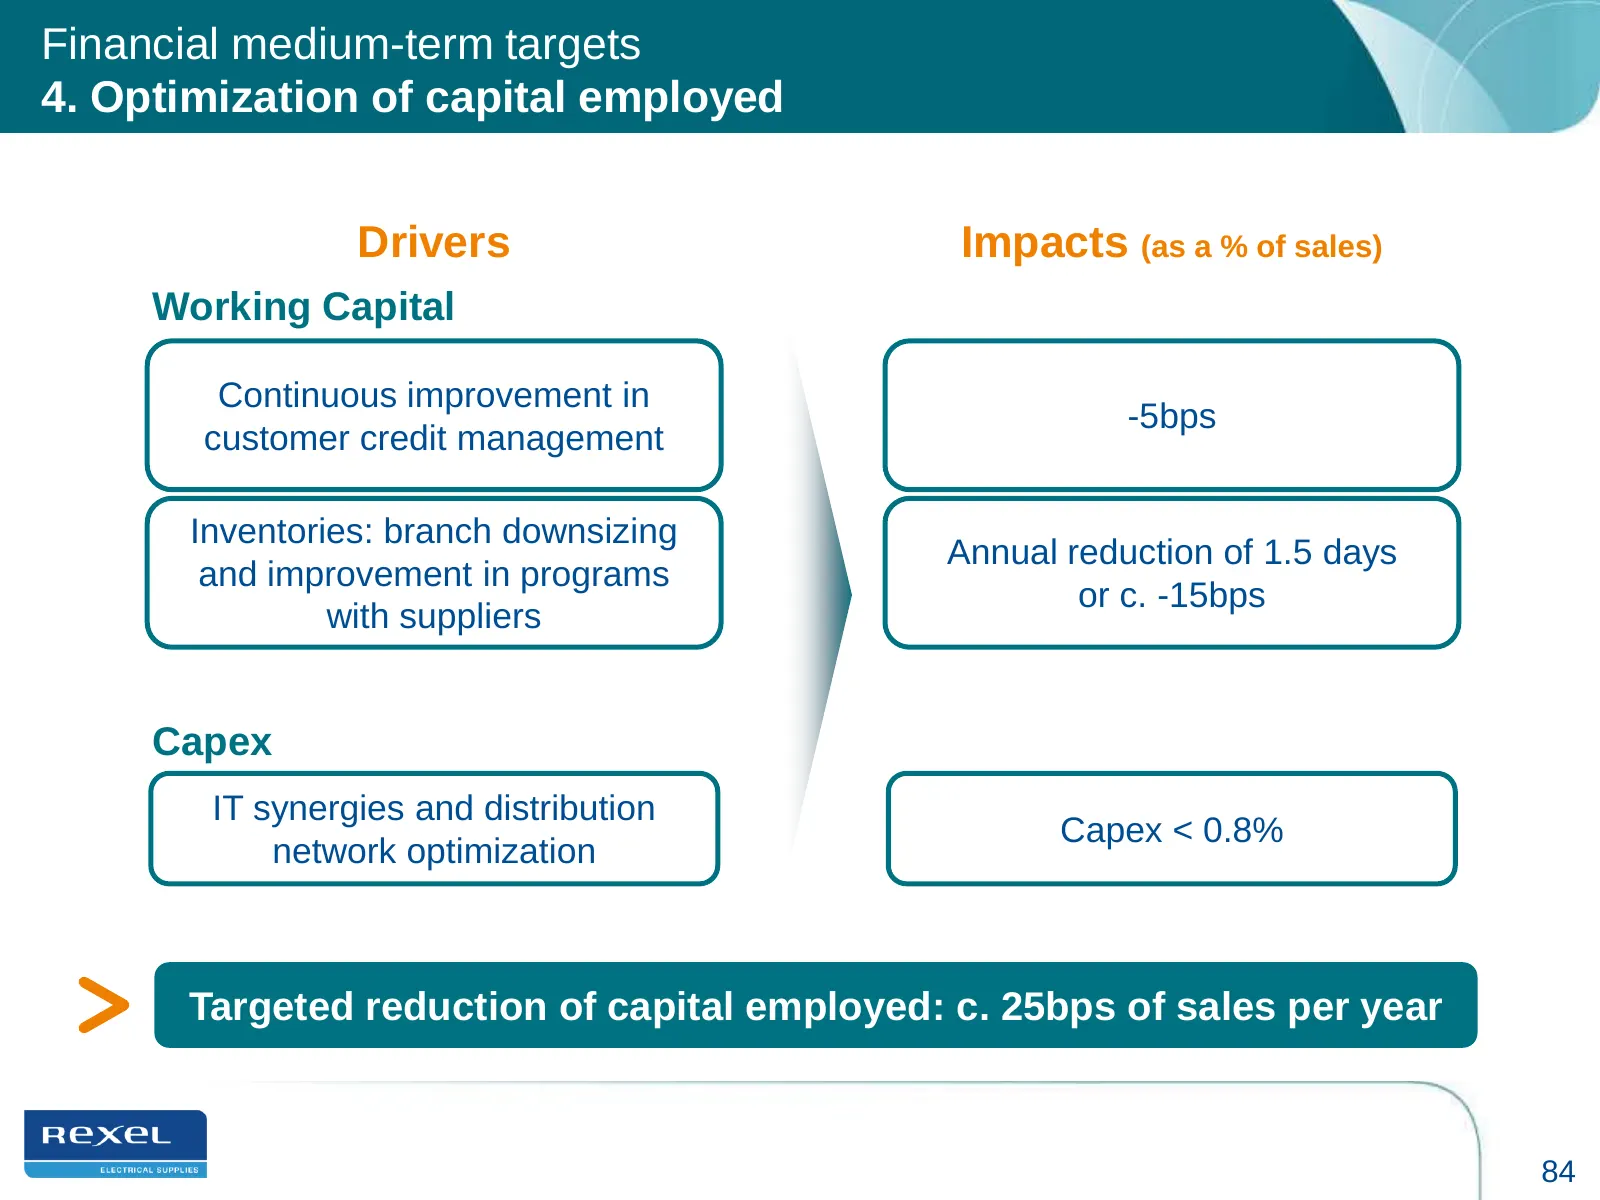
Financial medium-term targets 4. Optimization of capital employed Drivers Impacts (as a % of sales) Working Capital Continuous improvement in -5bps customer credit management Inventories: branch downsizing Annual reduction of 1.5 days and improvement in programs or c. -15bps with suppliers Capex IT
Slide 85: Rexel's medium-term financial targets
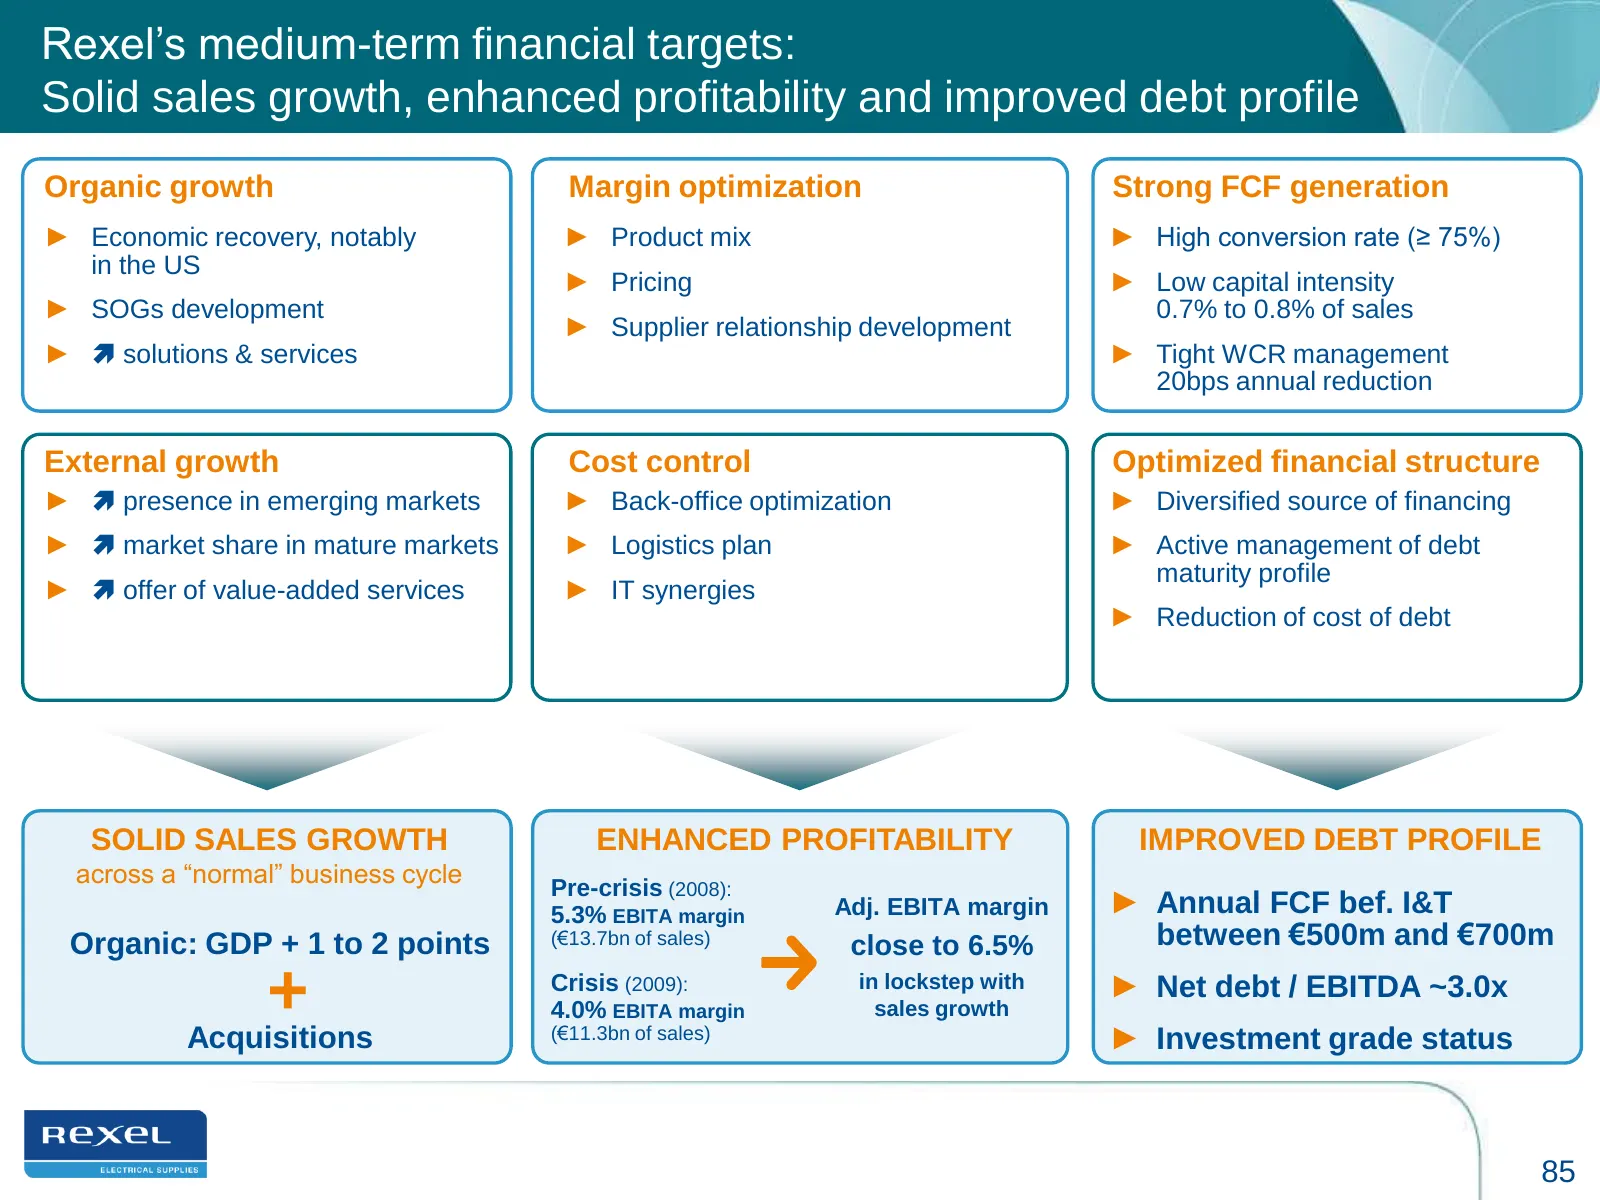
Rexel‟s medium-term financial targets: Solid sales growth, enhanced profitability and improved debt profile Organic growth Margin optimization Strong FCF generation ► Economic recovery, notably ► Product mix ► High conversion rate (≥ 75%) in the US ► Pricing ► Low capital intensity ► SOGs developmen
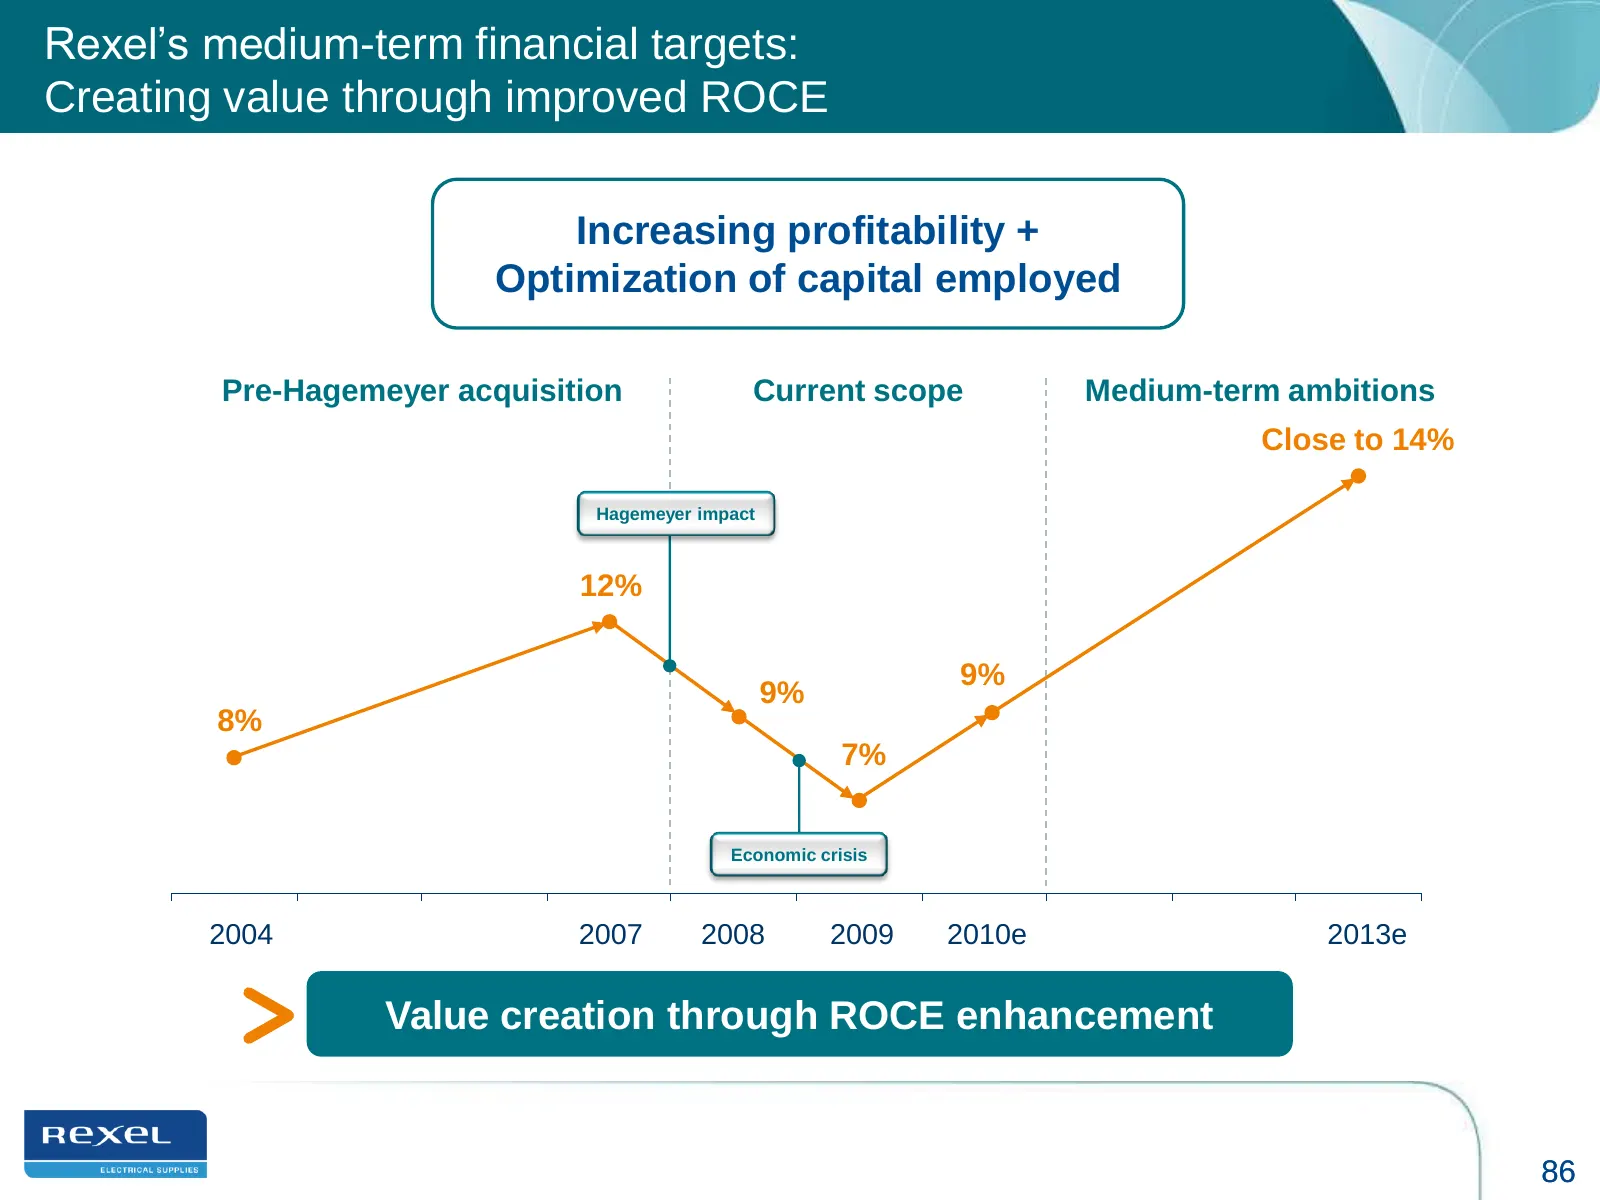
Slide 86: Rexel's medium-term financial targets: Creating value through improved ROCE
Rexel‟s medium-term financial targets: Creating value through improved ROCE Increasing profitability + Optimization of capital employed Pre-Hagemeyer acquisition Current scope Medium-term ambitions Close to 14% Hagemeyer impact 12% 9% 9% 8% 7% Economic crisis 2004 2007 2008 2009 2010e 2013e Value cr
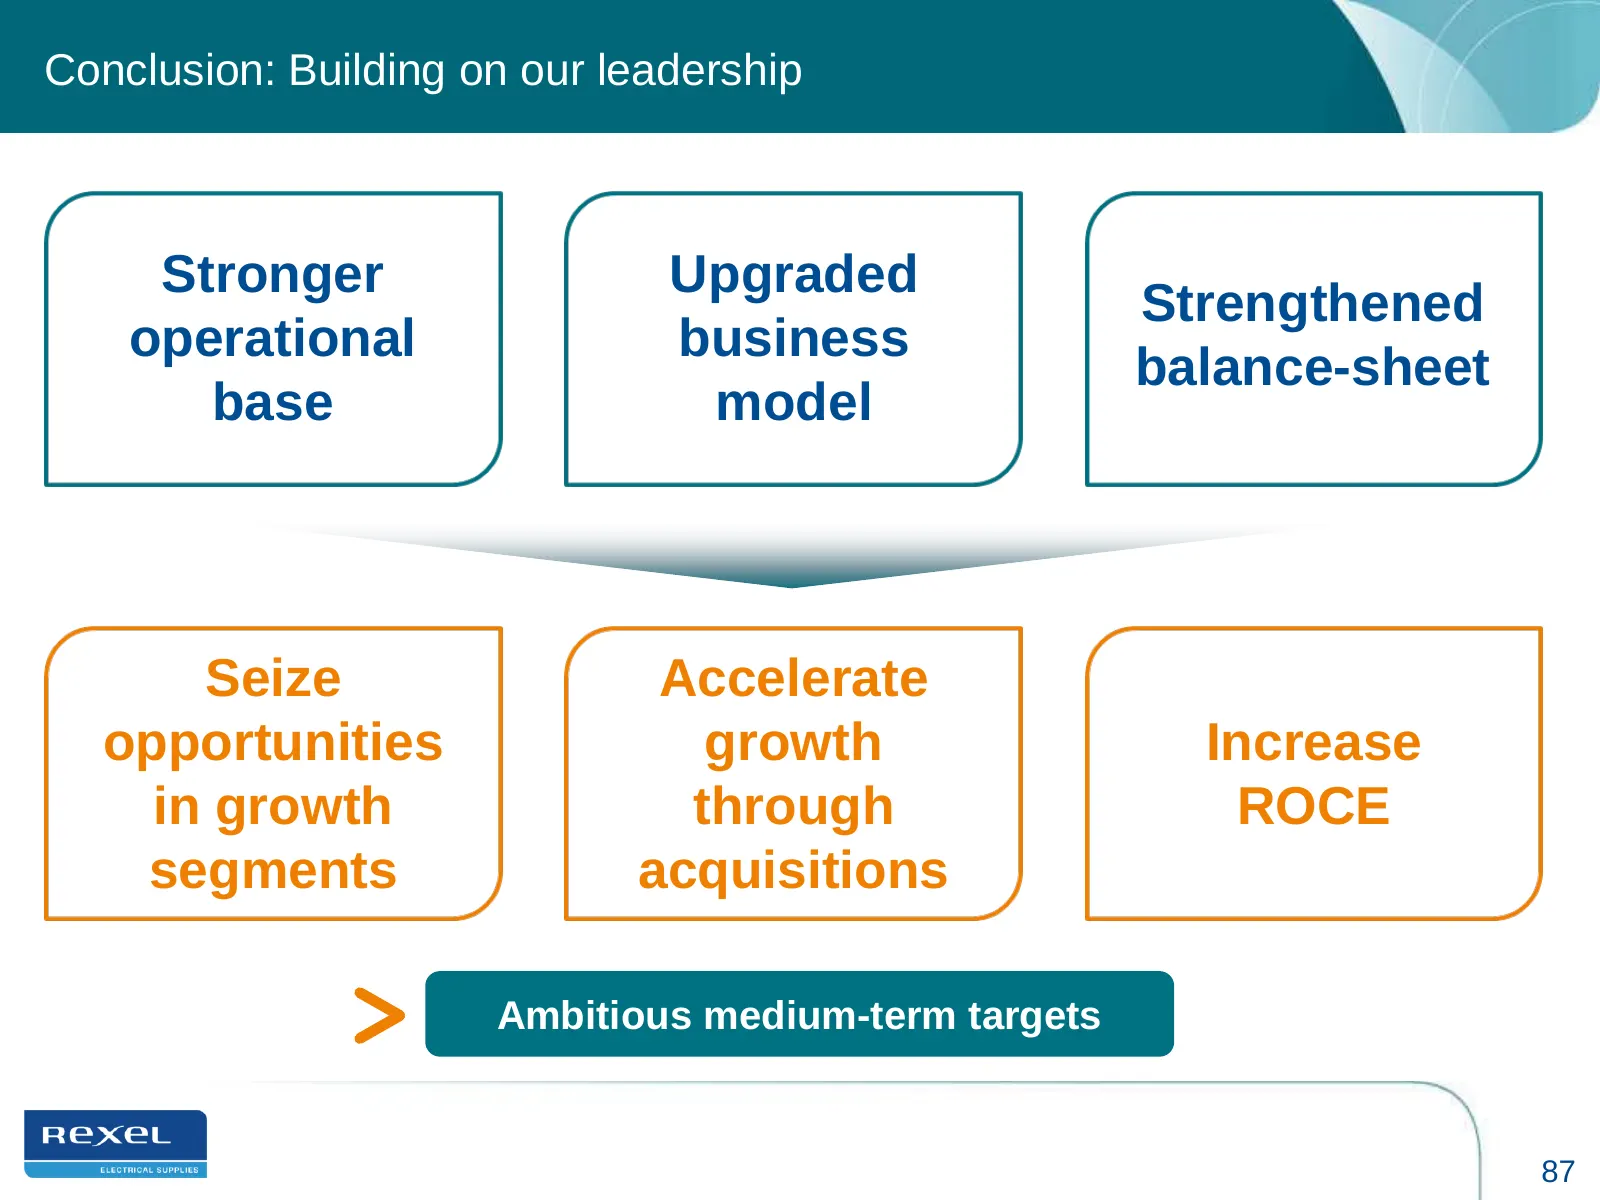
Slide 87: Conclusion: Building on our leadership
Conclusion: Building on our leadership Stronger Upgraded Strengthened operational business balance-sheet base model Seize Accelerate opportunities growth Increase in growth through ROCE segments acquisitions Ambitious medium-term targets 87
Source: Internet Archive copy of rexel.com
More decks from Rexel SA
 Q3 2026 Earnings Presentation13 slides · Oct 22, 2026
 Q2 2026 Earnings Presentation24 slides · Jul 27, 2026
 FY 2025 Earnings Presentation31 slides · Feb 11, 2026
 Q3 2025 Earnings Presentation15 slides · Oct 15, 2025
 Q2 2025 Earnings Presentation20 slides · Jul 28, 2025
 Q1 2025 Earnings Presentation16 slides · Apr 29, 2025