Sage Group plc · LSE:SGE
Sage — The Sage Group — FY2006 Earnings Presentation
41 slides from Sage's earnings presentation, November 2006
Slide 1: Results for the year ended 30 September 2006
Results for the year ended 30 September 2006
Slide 2: Agenda
Agenda Overview of the year Financial and regional review Business review and outlook 2
Slide 3: Highlights of the year
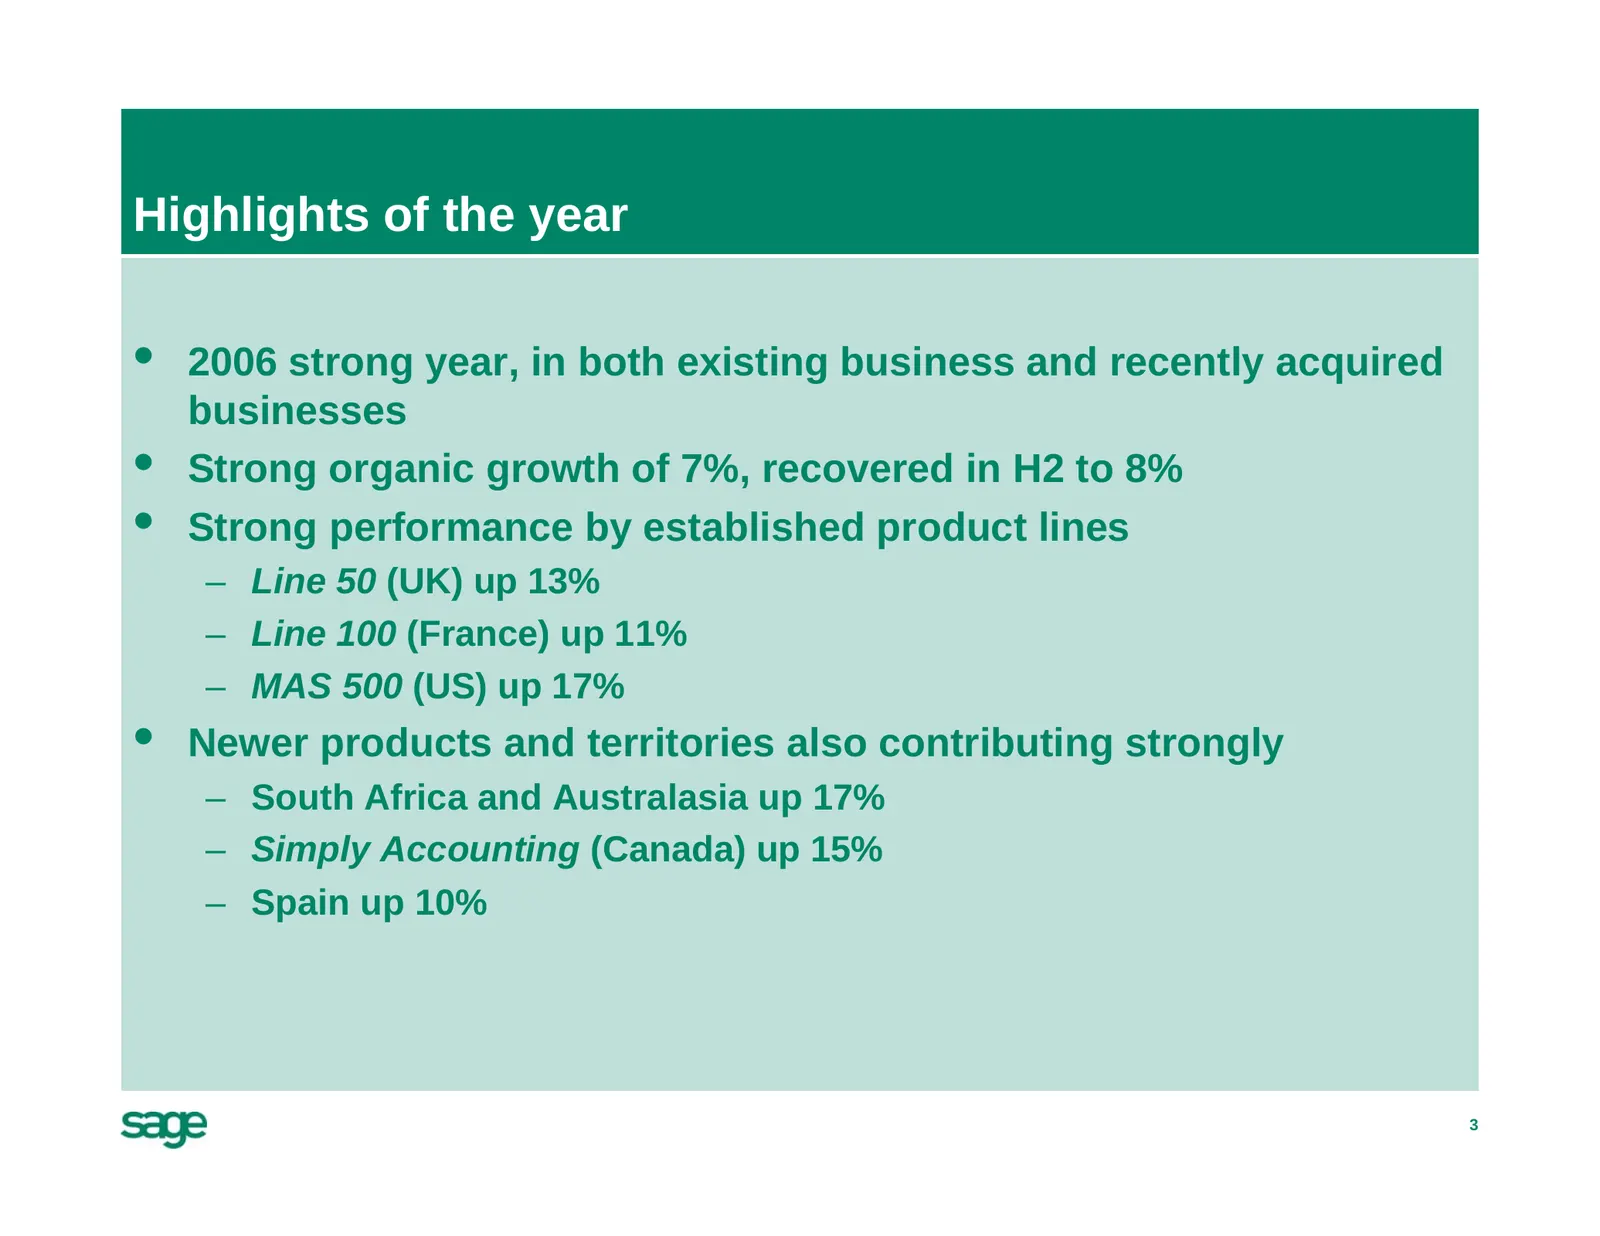
Highlights of the year • 2006 strong year, in both existing business and recently acquired businesses • Strong organic growth of 7%, recovered in H2 to 8% • Strong performance by established product lines – Line 50 (UK) up 13% – Line 100 (France) up 11% – MAS 500 (US) up 17% • Newer products and ter
Slide 4: Financial highlights
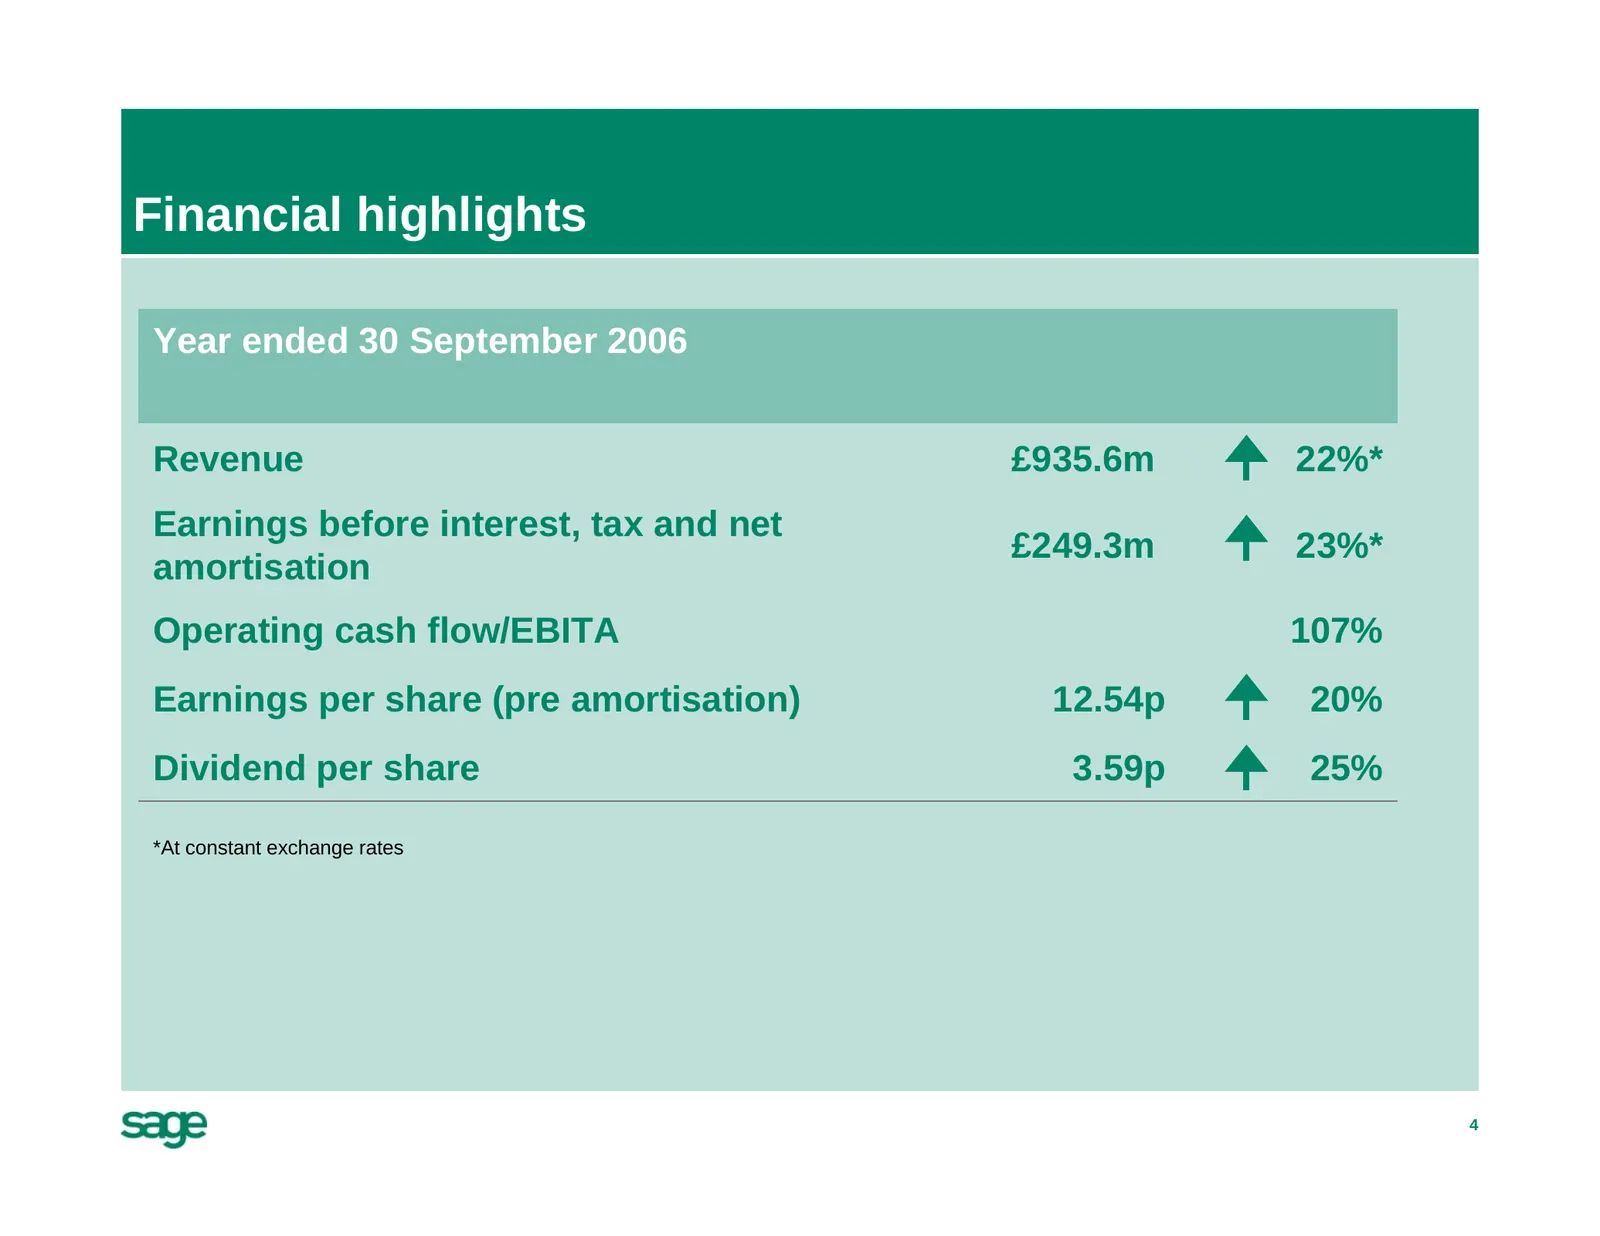
Financial highlights Year ended 30 September 2006 Revenue £935.6m 22%* Earnings before interest, tax and net £249.3m 23%* amortisation Operating cash flow/EBITA 107% Earnings per share (pre amortisation) 12.54p 20% Dividend per share 3.59p 25% *At constant exchange rates 4
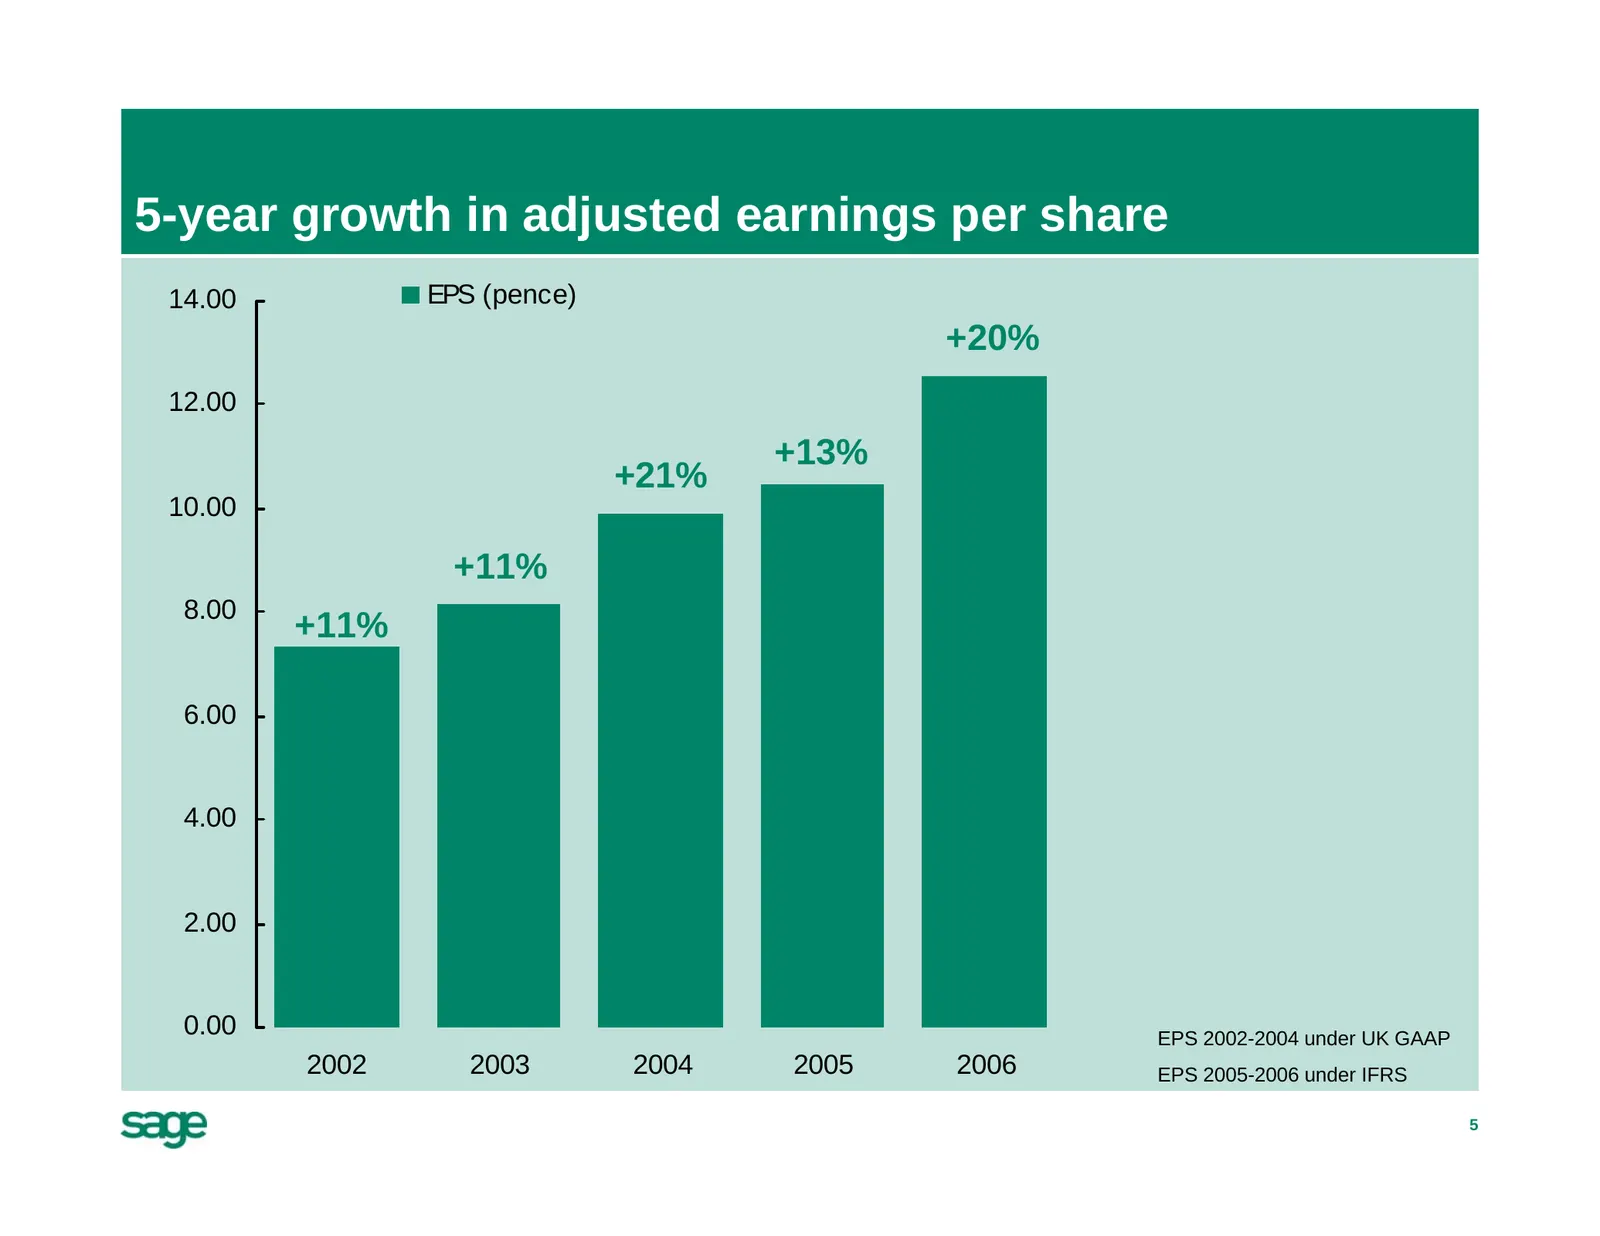
Slide 5: 5-year growth in adjusted earnings per share
5-year growth in adjusted earnings per share 14.00 EPS (pence) +20% 12.00 +13% +21% 10.00 +11% 8.00 +11% 6.00 4.00 2.00 0.00 EPS 2002-2004 under UK GAAP 2002 2003 2004 2005 2006 EPS 2005-2006 under IFRS 5
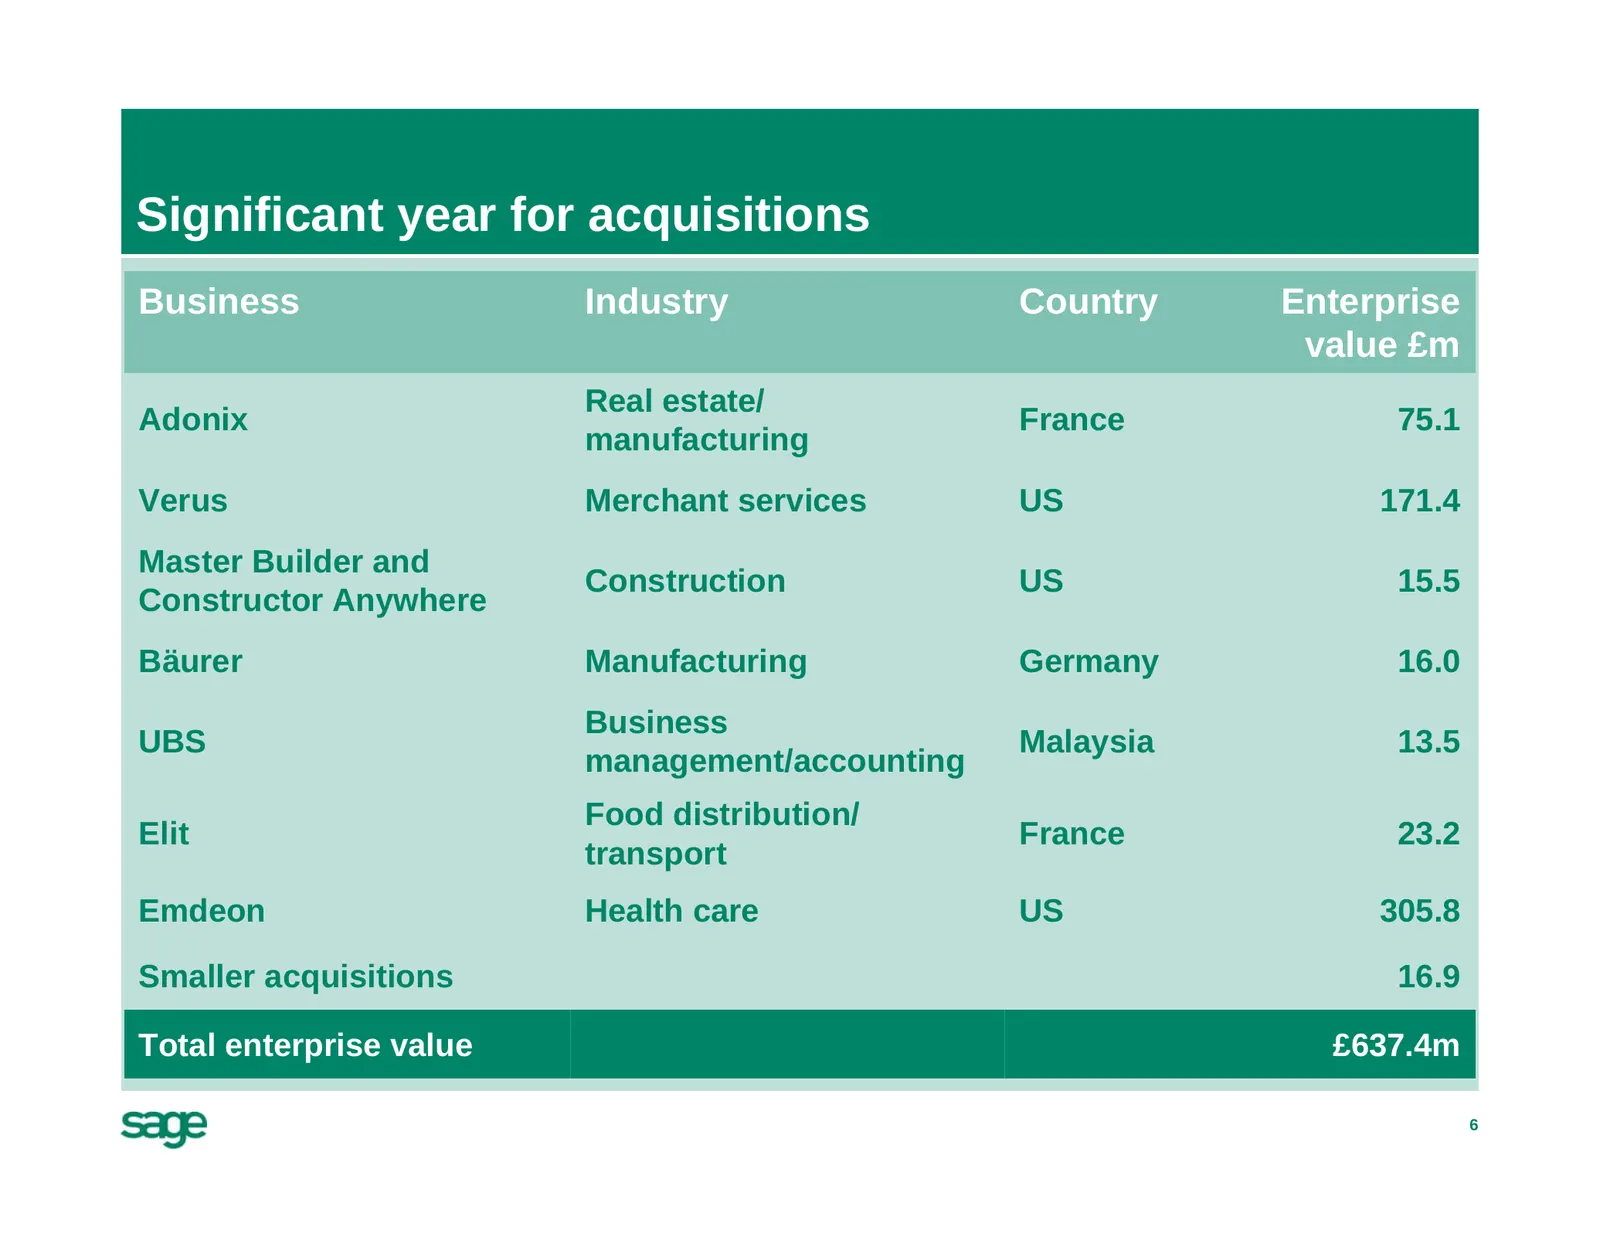
Slide 6: Significant year for acquisitions
Significant year for acquisitions Business Industry Country Enterprise value £m Real estate/ Adonix France 75.1 manufacturing Verus Merchant services US 171.4 Master Builder and Construction US 15.5 Constructor Anywhere Bäurer Manufacturing Germany 16.0 Business UBS Malaysia 13.5 management/accounti

Slide 7: Financial review
Financial review
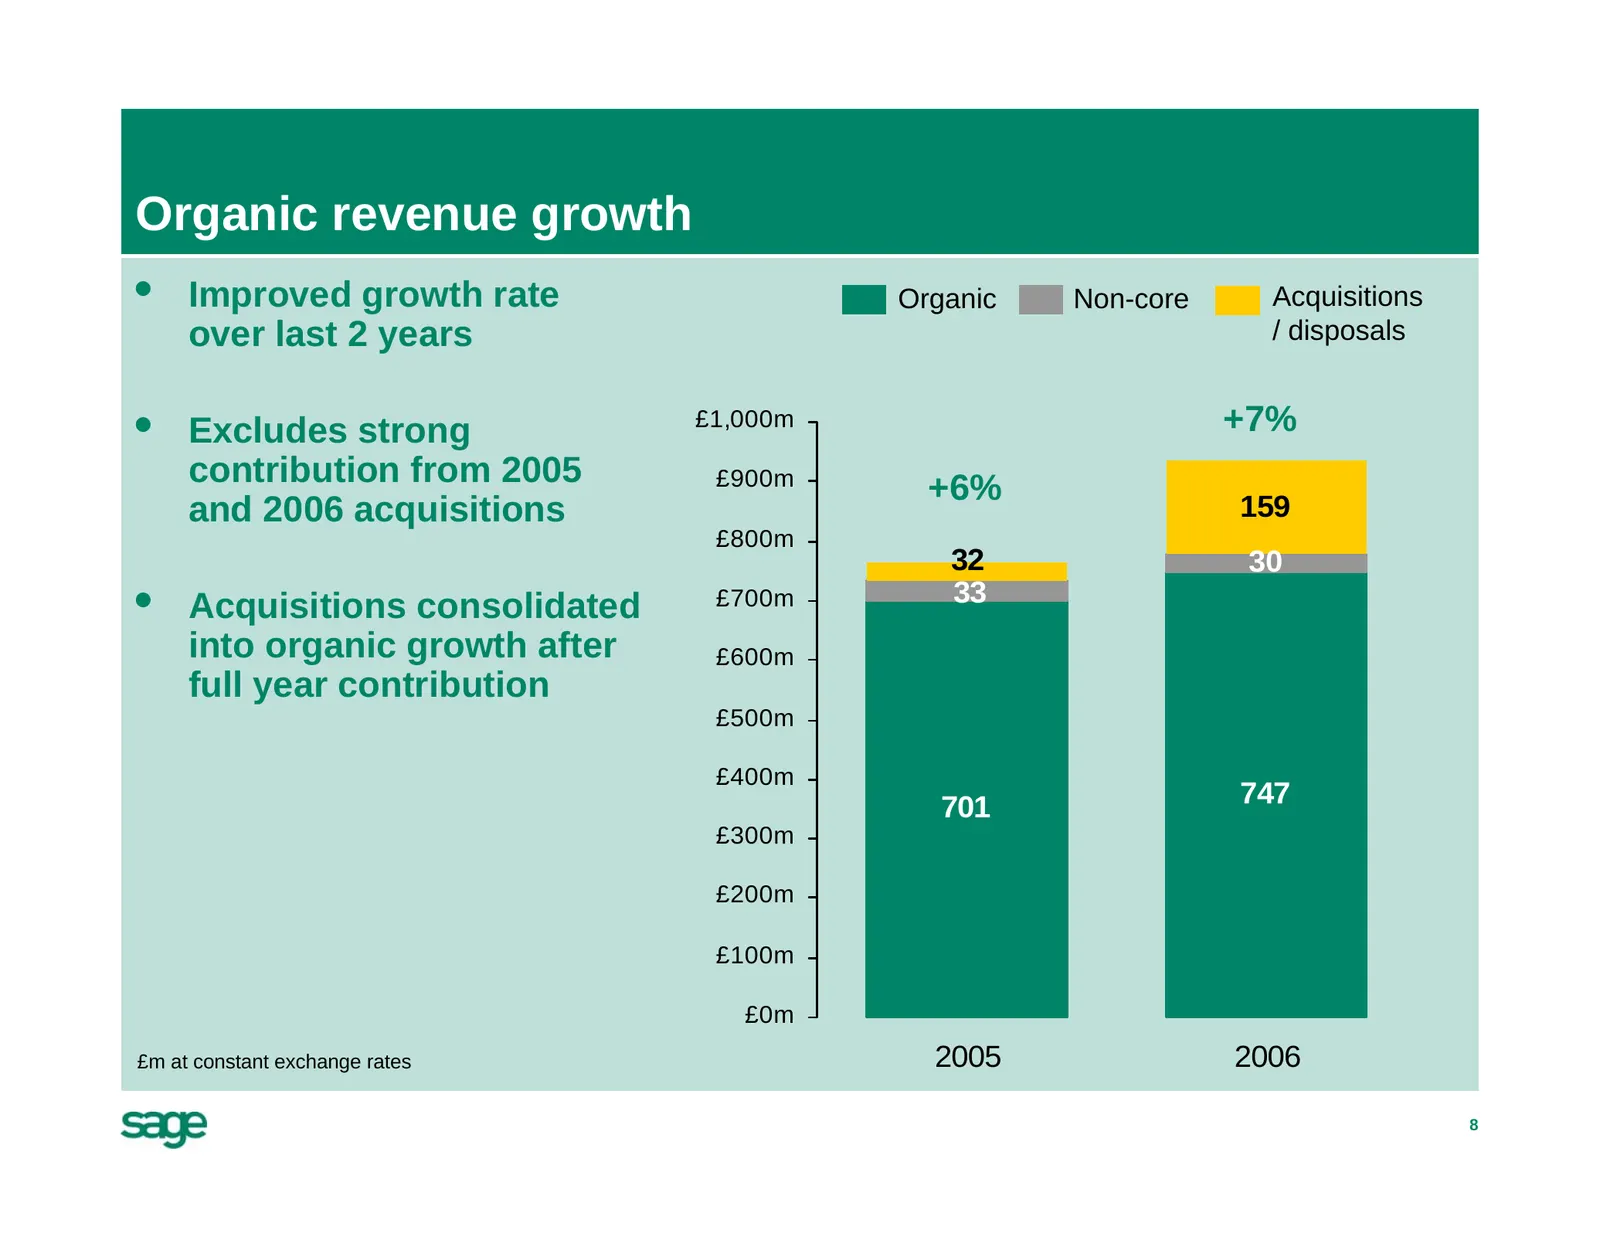
Slide 8: Organic revenue growth
Organic revenue growth • Improved growth rate Organic Non-core Acquisitions over last 2 years / disposals • Excludes strong £1,000m +7% contribution from 2005 £900m +6% and 2006 acquisitions 159 £800m 32 30 • Acquisitions consolidated £700m 33 into organic growth after £600m full year contribution £
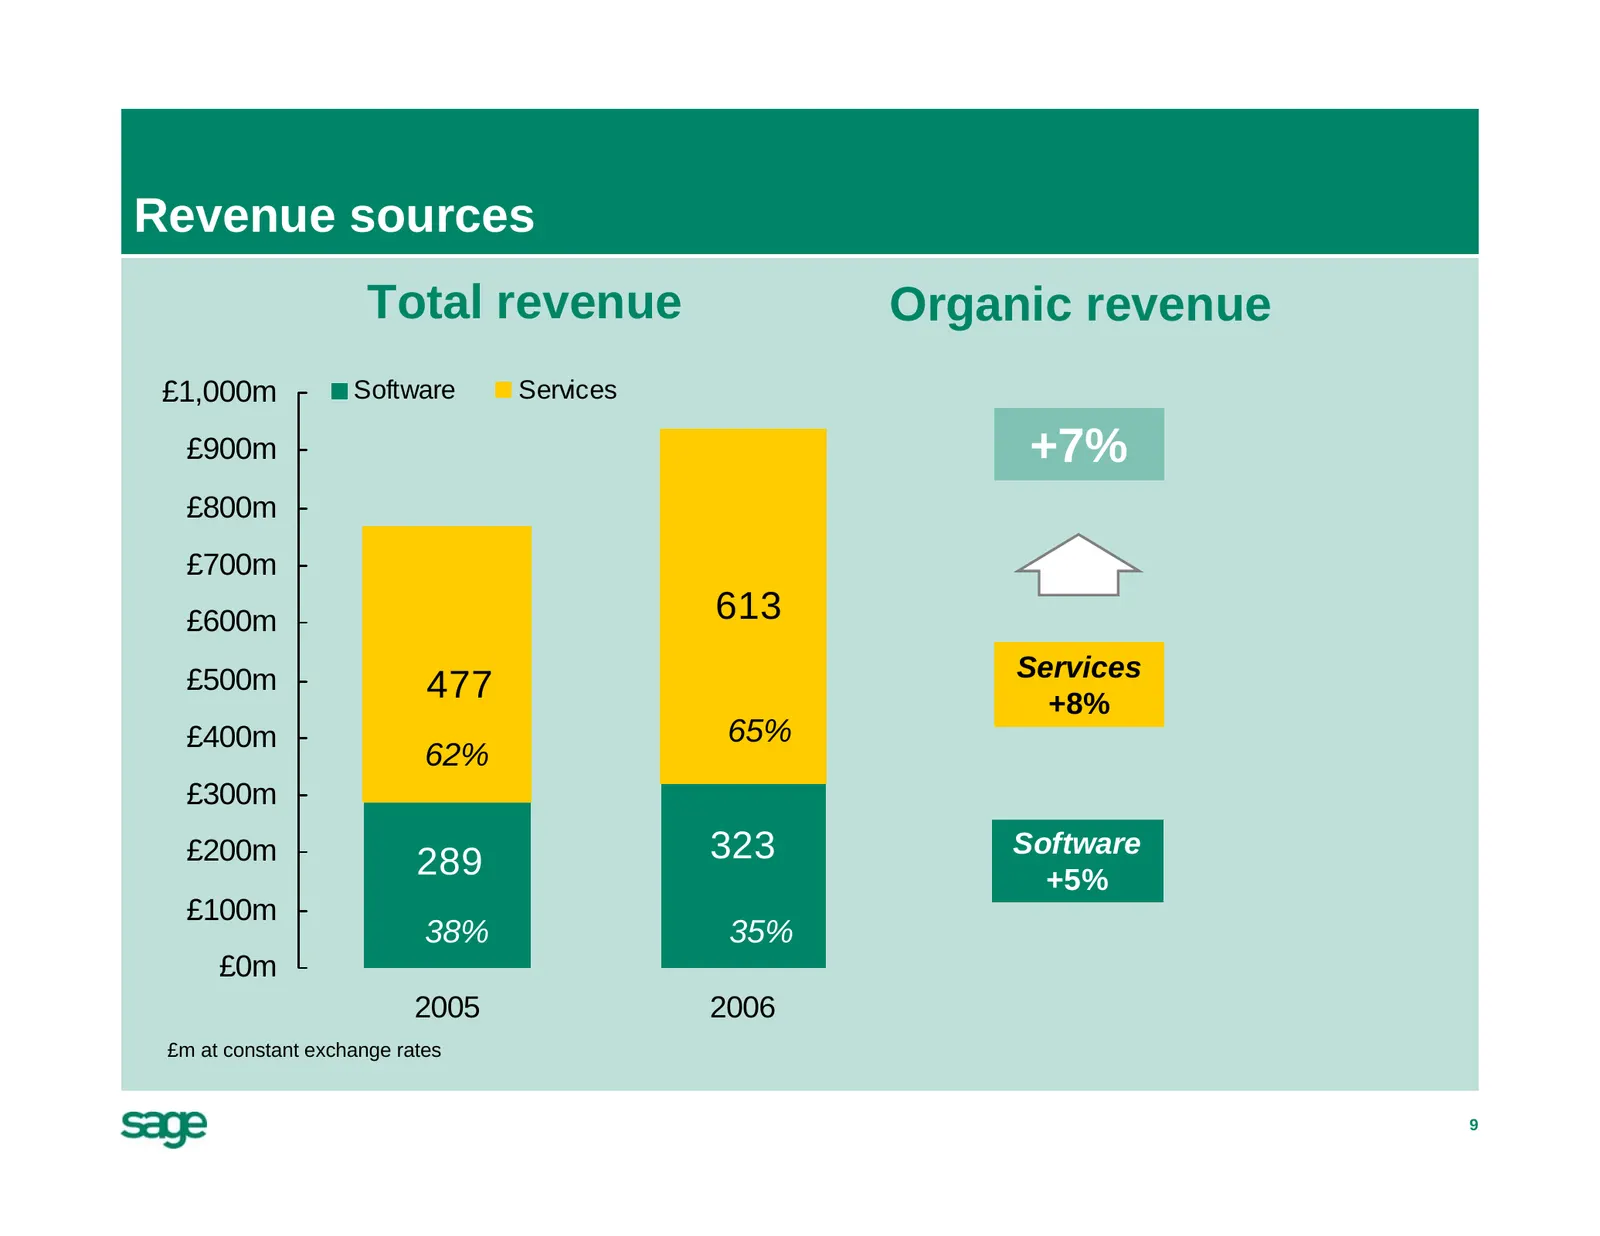
Slide 9: Revenue sources
Revenue sources Total revenue Organic revenue £1,000m Software Services £900m +7% £800m £700m £600m 613 £500m Services 477 +8% £400m 65% 62% £300m £200m 289 323 Software +5% £100m 38% 35% £0m 2005 2006 £m at constant exchange rates 9
Slide 10: Growth in combined software/support services revenue
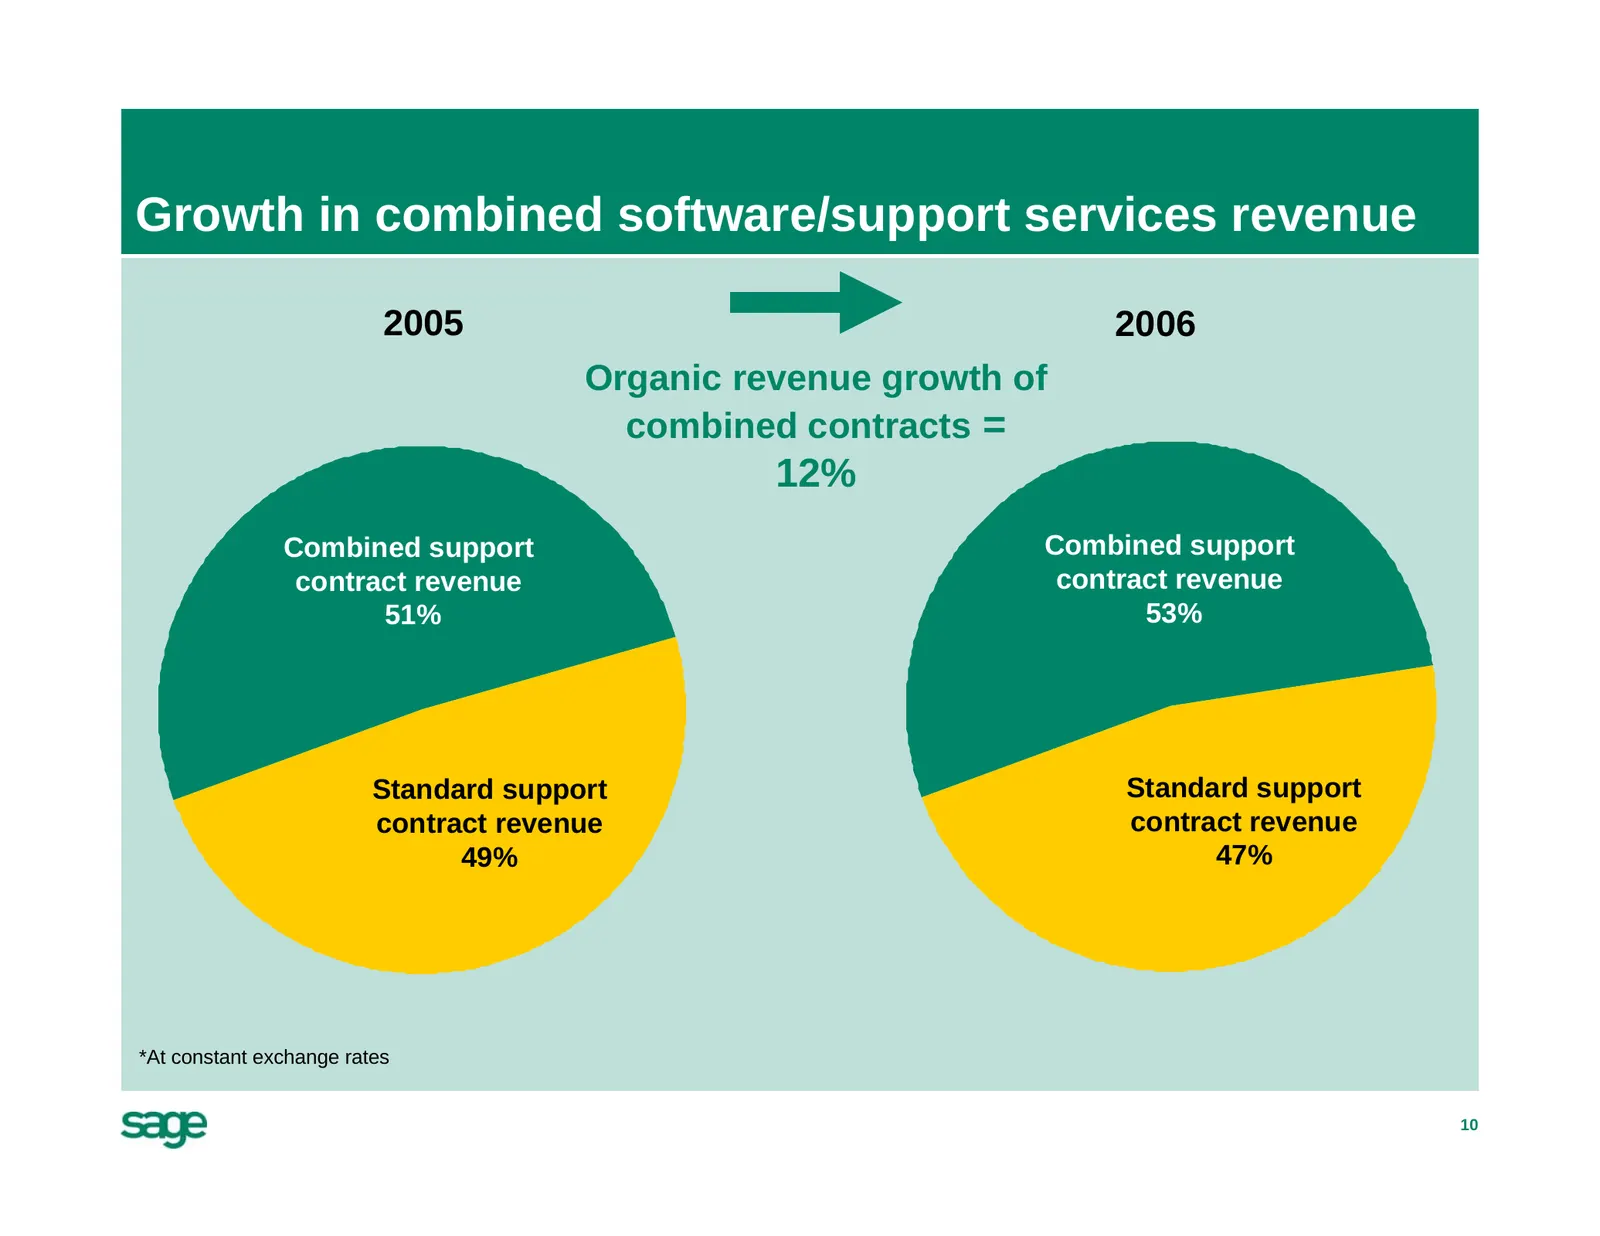
Growth in combined software/support services revenue 2005 2006 Organic revenue growth of combined contracts = 12% Combined support Combined support contract revenue contract revenue 51% 53% Standard support Standard support contract revenue contract revenue 49% 47% *At constant exchange rates 10
Slide 11: Earnings growth
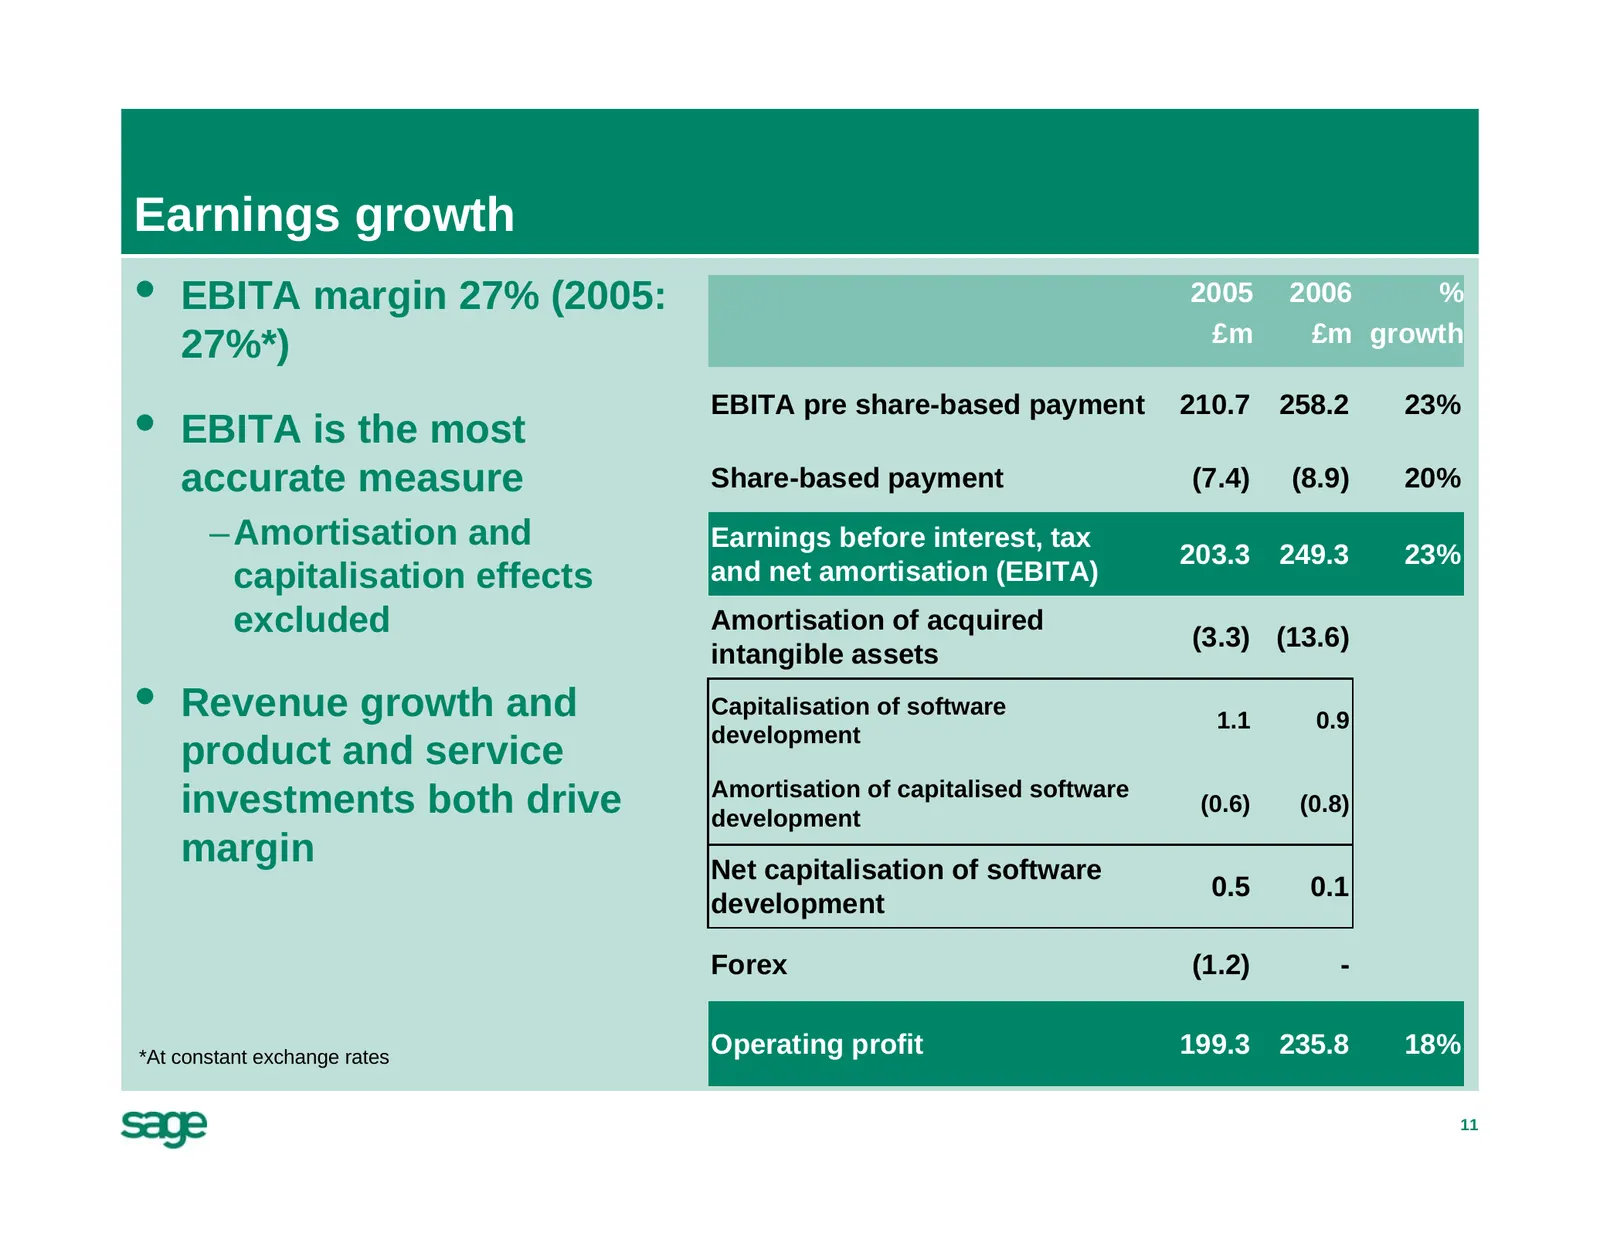
Earnings growth • EBITA margin 27% (2005: 2005 2006 % £m £m growth 27%*) EBITA pre share-based payment 210.7 258.2 23% • EBITA is the most accurate measure Share-based payment (7.4) (8.9) 20% – Amortisation and Earnings before interest, tax 203.3 249.3 23% capitalisation effects and net amortisation
Slide 12: Acquisitions: Adonix, Verus, Emdeon
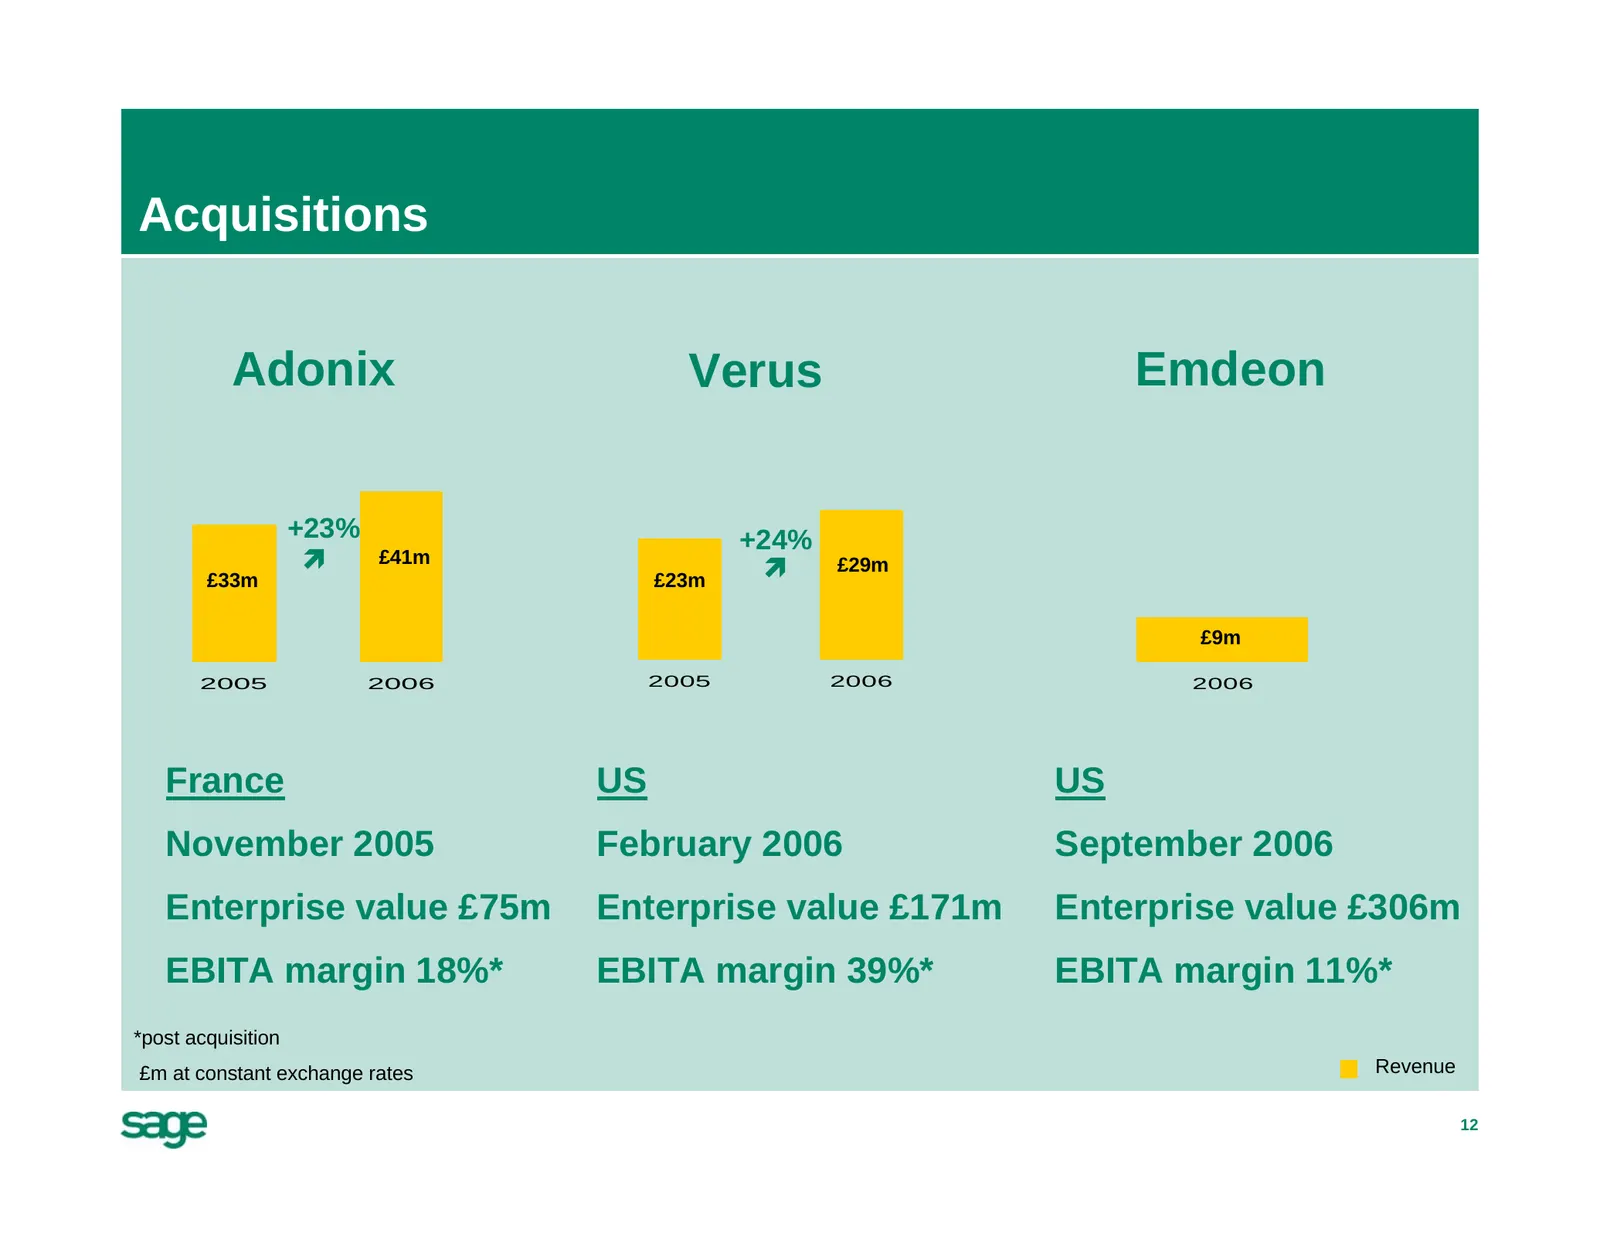
Acquisitions Adonix Verus Emdeon +23% +24% £41m Ï £29m Ï £33m £23m £9m 2005 2006 2005 2006 2006 France US US November 2005 February 2006 September 2006 Enterprise value £75m Enterprise value £171m Enterprise value £306m EBITA margin 18%* EBITA margin 39%* EBITA margin 11%* *post acquisition £m at co
Slide 13: Cash flow and net debt
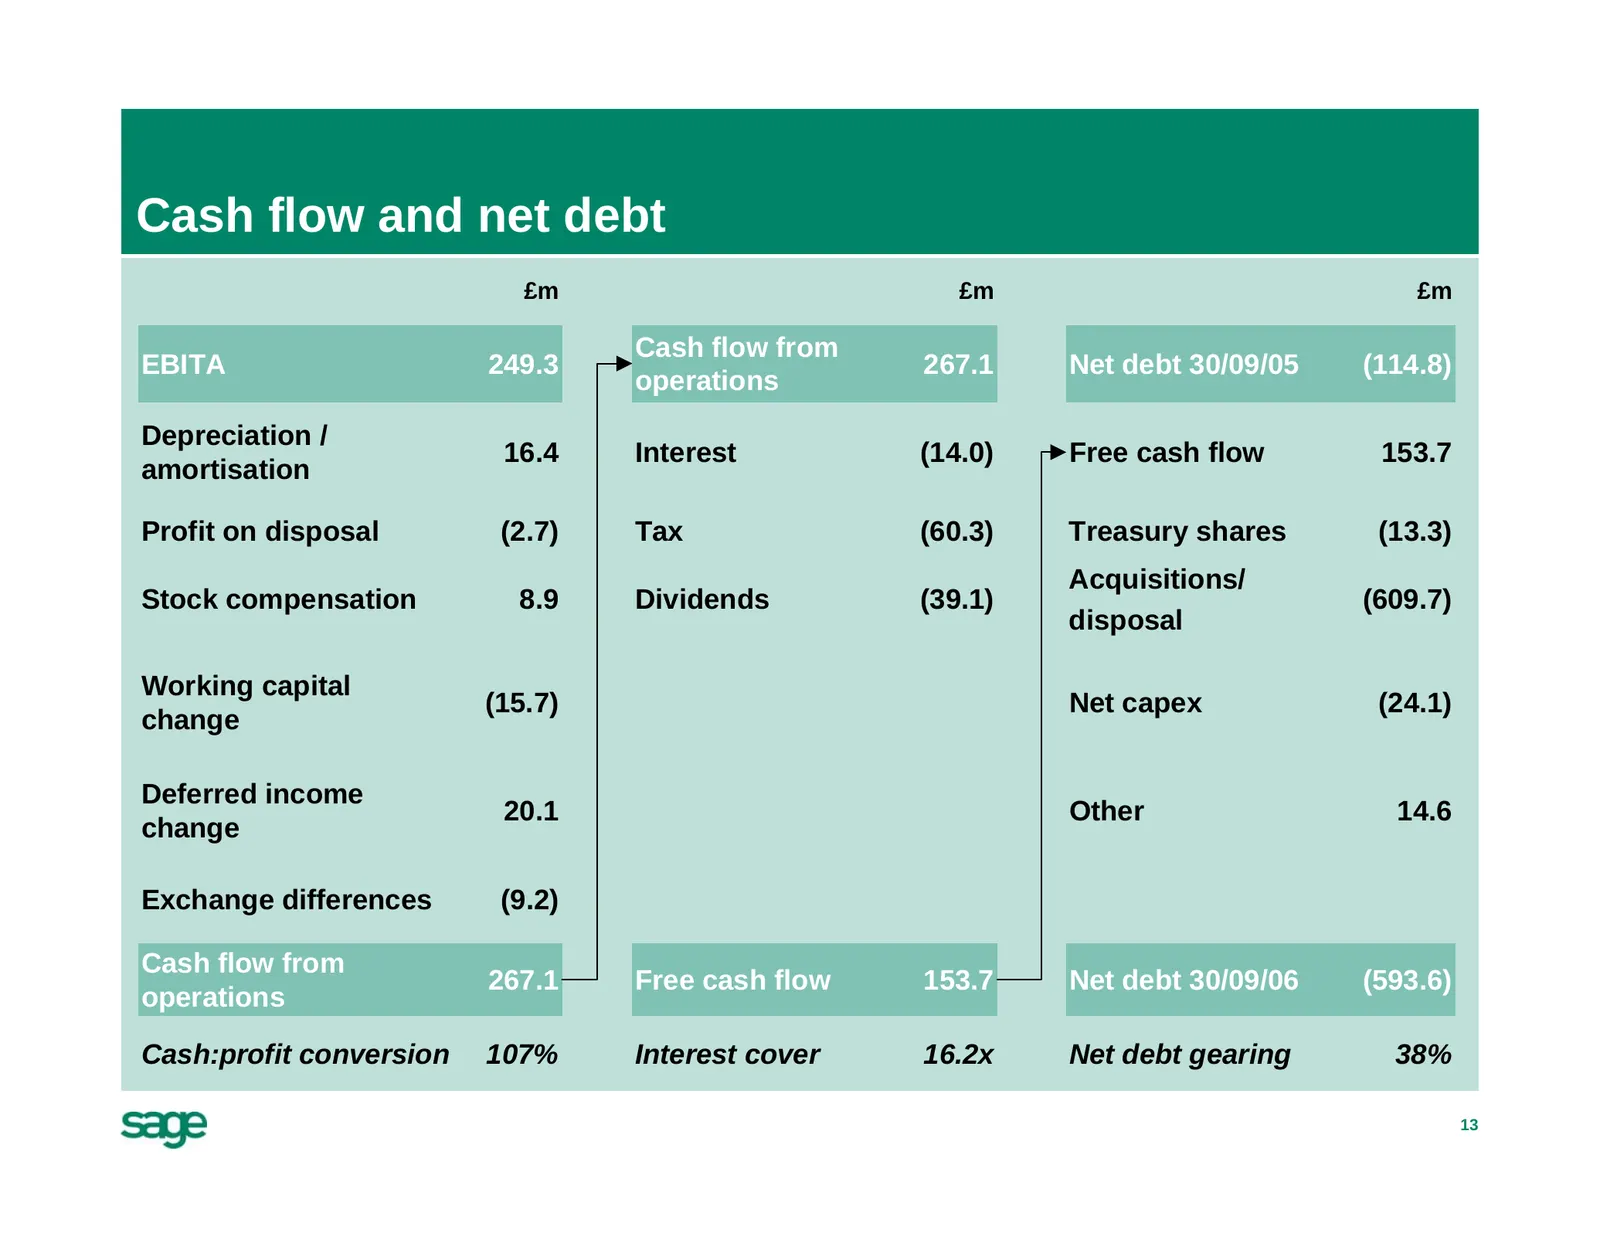
Cash flow and net debt £m £m £m Cash flow from EBITA 249.3 267.1 Net debt 30/09/05 (114.8) operations Depreciation / 16.4 Interest (14.0) Free cash flow 153.7 amortisation Profit on disposal (2.7) Tax (60.3) Treasury shares (13.3) Acquisitions/ Stock compensation 8.9 Dividends (39.1) (609.7) disposa
Slide 14: Regional review
Regional review
Slide 15: Global presence in countries
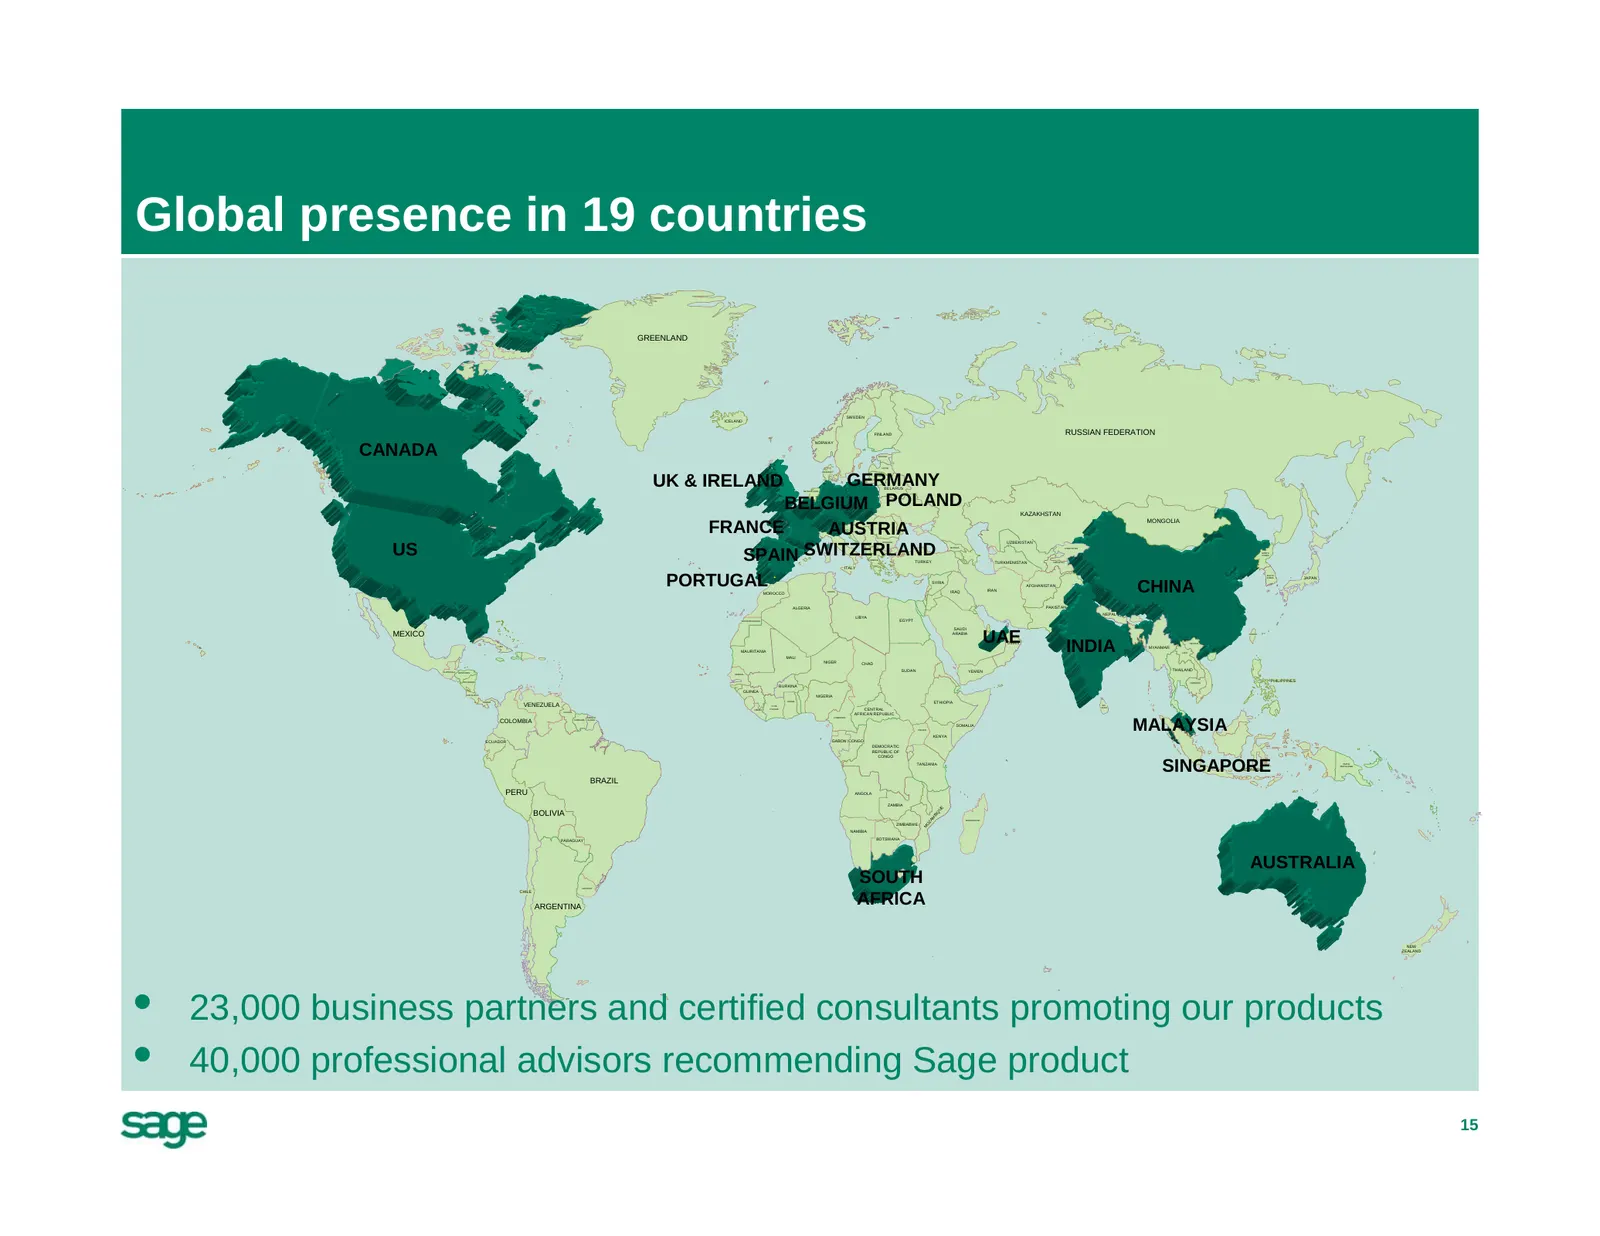
Global presence in 19 countries GREENLAND SWEDEN ICELAND FINLAND RUSSIAN FEDERATION NORWAY CANADA ESTONIA LATVIA DENMARK UK & IRELAND GERMANY LITHUANIA BELARUS NETHERLANDS BELGIUM POLAND KAZAKHSTAN MONGOLIA FRANCE AUSTRIA BULGARIA UZBEKISTAN US SPAIN SWITZERLAND GEORGIA KYRGYZSTAN NORTH KOREA GREECE
Slide 16: Organic revenue H1 vs H2
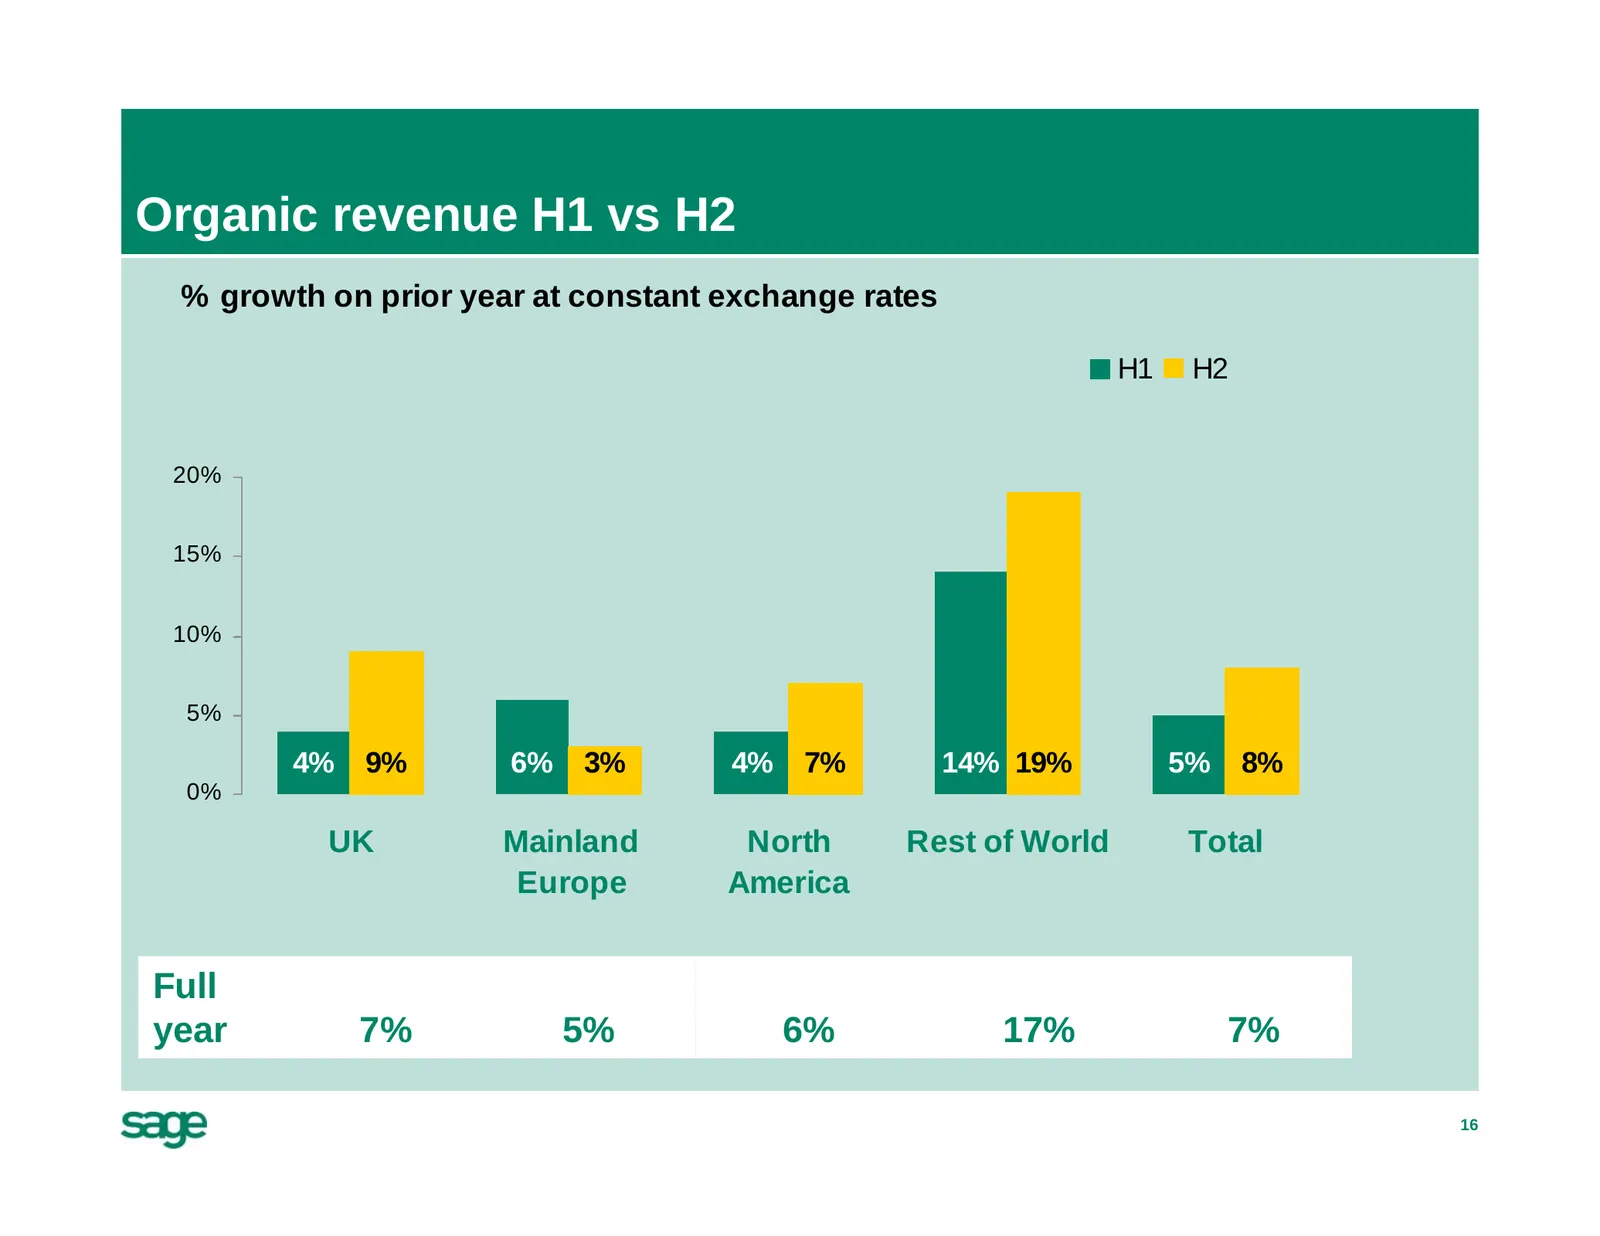
Organic revenue H1 vs H2 % growth on prior year at constant exchange rates H1 H2 20% 15% 10% 5% 4% 9% 6% 3% 4% 7% 14% 19% 5% 8% 0% UK Mainland North Rest of World Total Europe America Full year 7% 5% 6% 17% 7% 16
Slide 17: UK
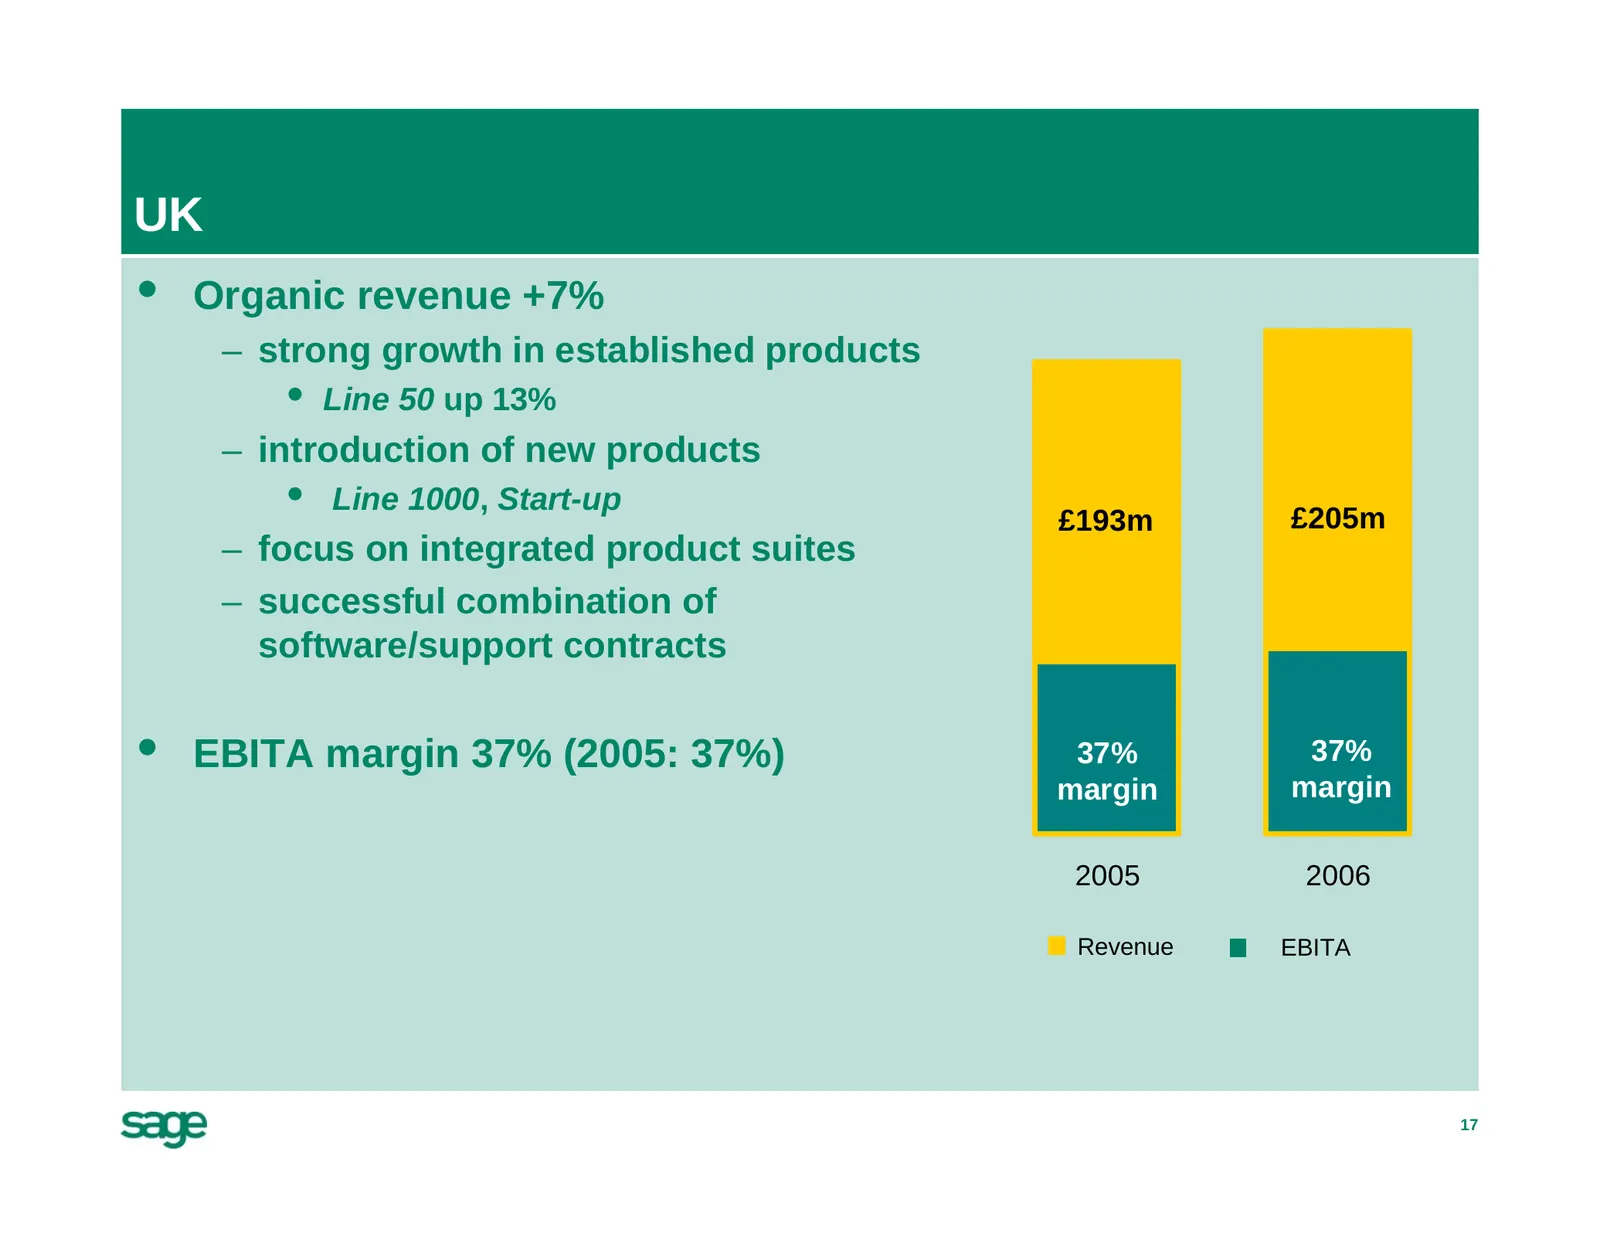
UK • Organic revenue +7% – strong growth in established products • Line 50 up 13% – introduction of new products • Line 1000, Start-up £193m £205m – focus on integrated product suites – successful combination of software/support contracts • EBITA margin 37% (2005: 37%) 37% 37% margin margin 2005 200
Slide 18: Mainland Europe
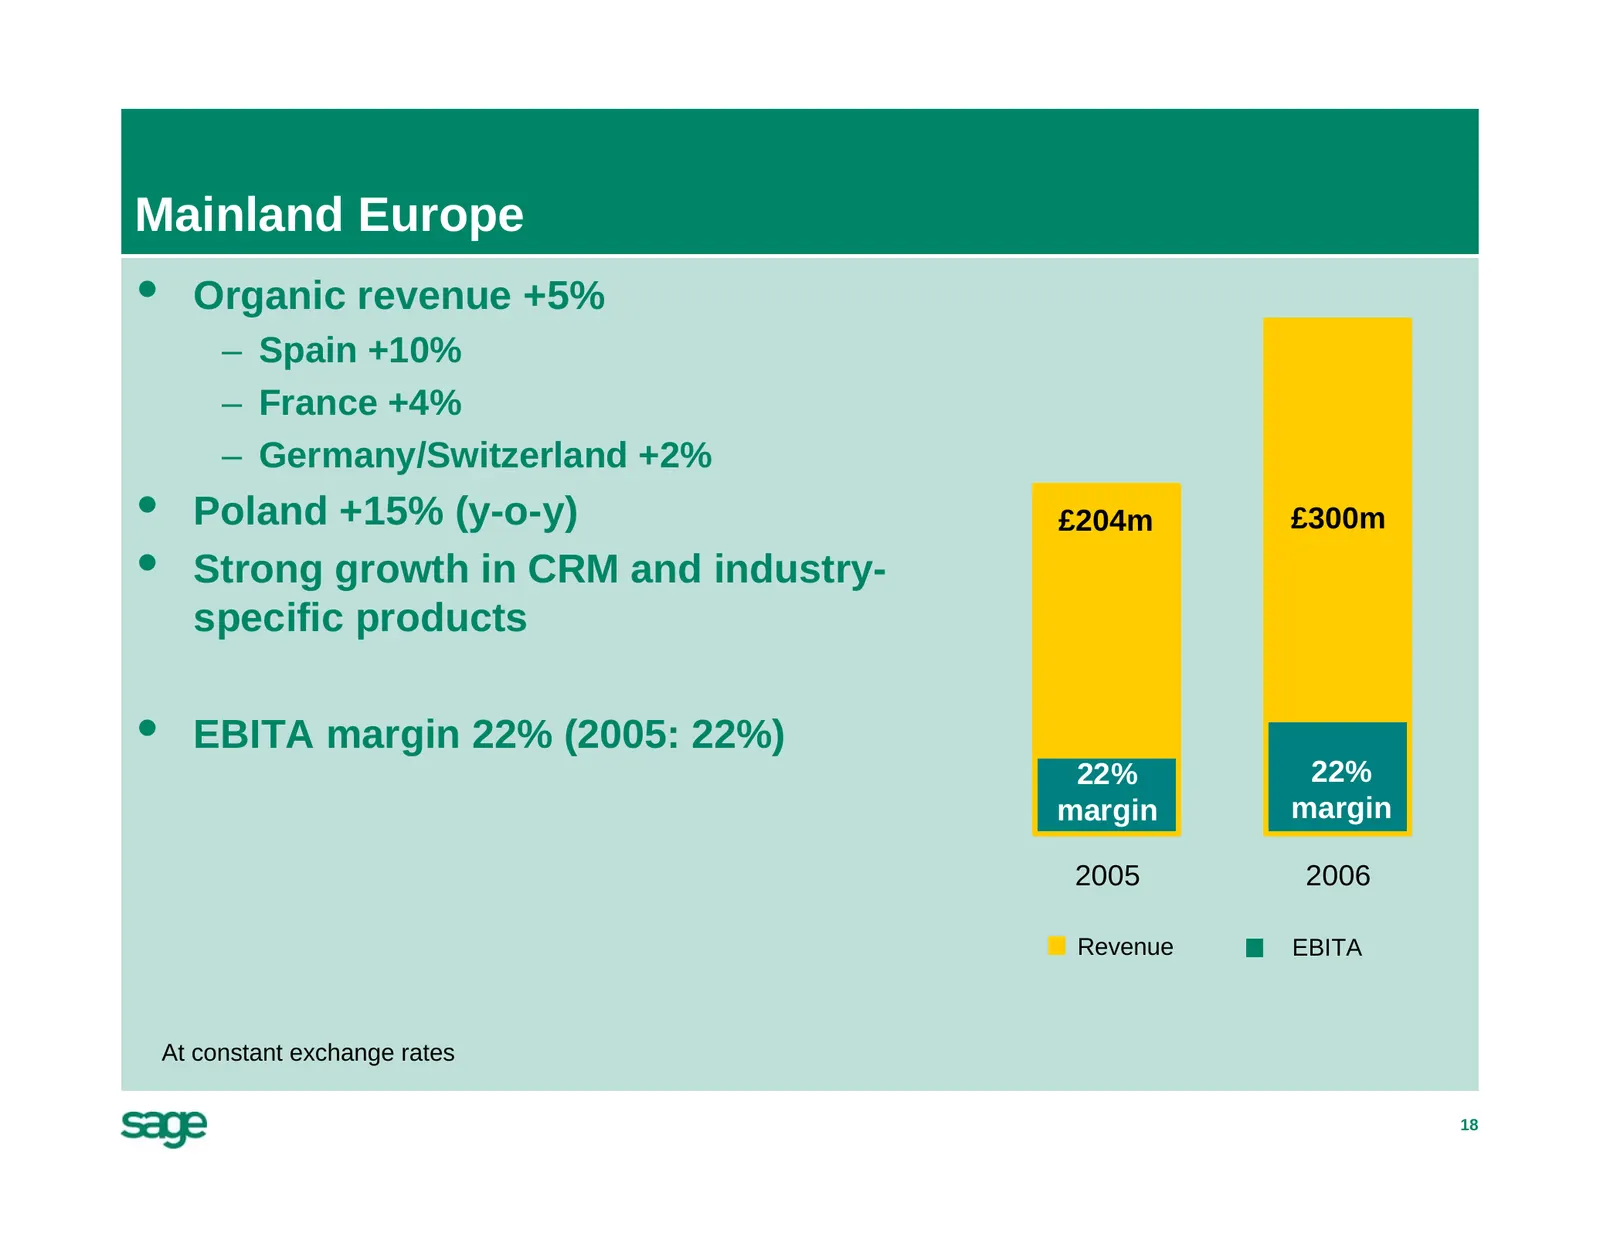
Mainland Europe • Organic revenue +5% – Spain +10% – France +4% – Germany/Switzerland +2% • Poland +15% (y-o-y) £204m £300m • Strong growth in CRM and industry- specific products • EBITA margin 22% (2005: 22%) 22% 22% margin margin 2005 2006 Revenue EBITA At constant exchange rates 18
Slide 19: North America
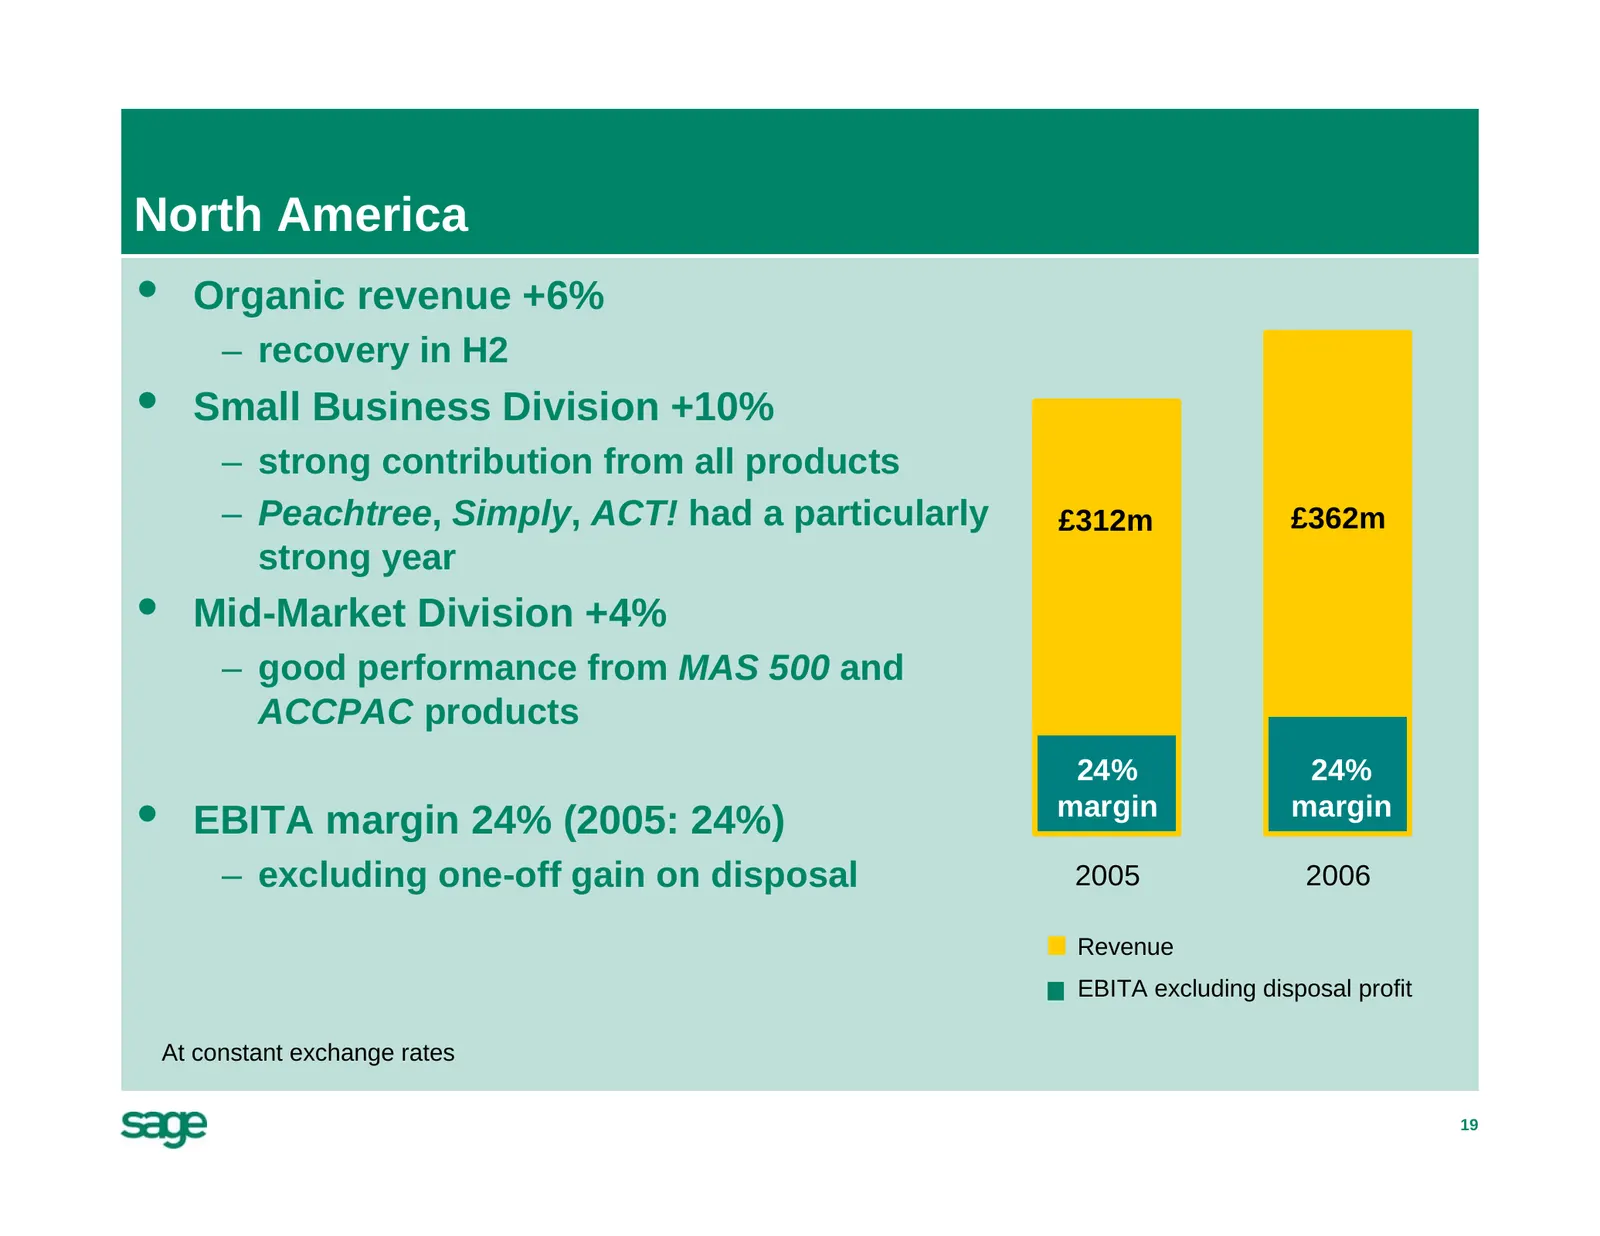
North America • Organic revenue +6% – recovery in H2 • Small Business Division +10% – strong contribution from all products – Peachtree, Simply, ACT! had a particularly £312m £362m strong year • Mid-Market Division +4% – good performance from MAS 500 and ACCPAC products 24% 24% • EBITA margin 24% (2
Slide 20: Rest of World
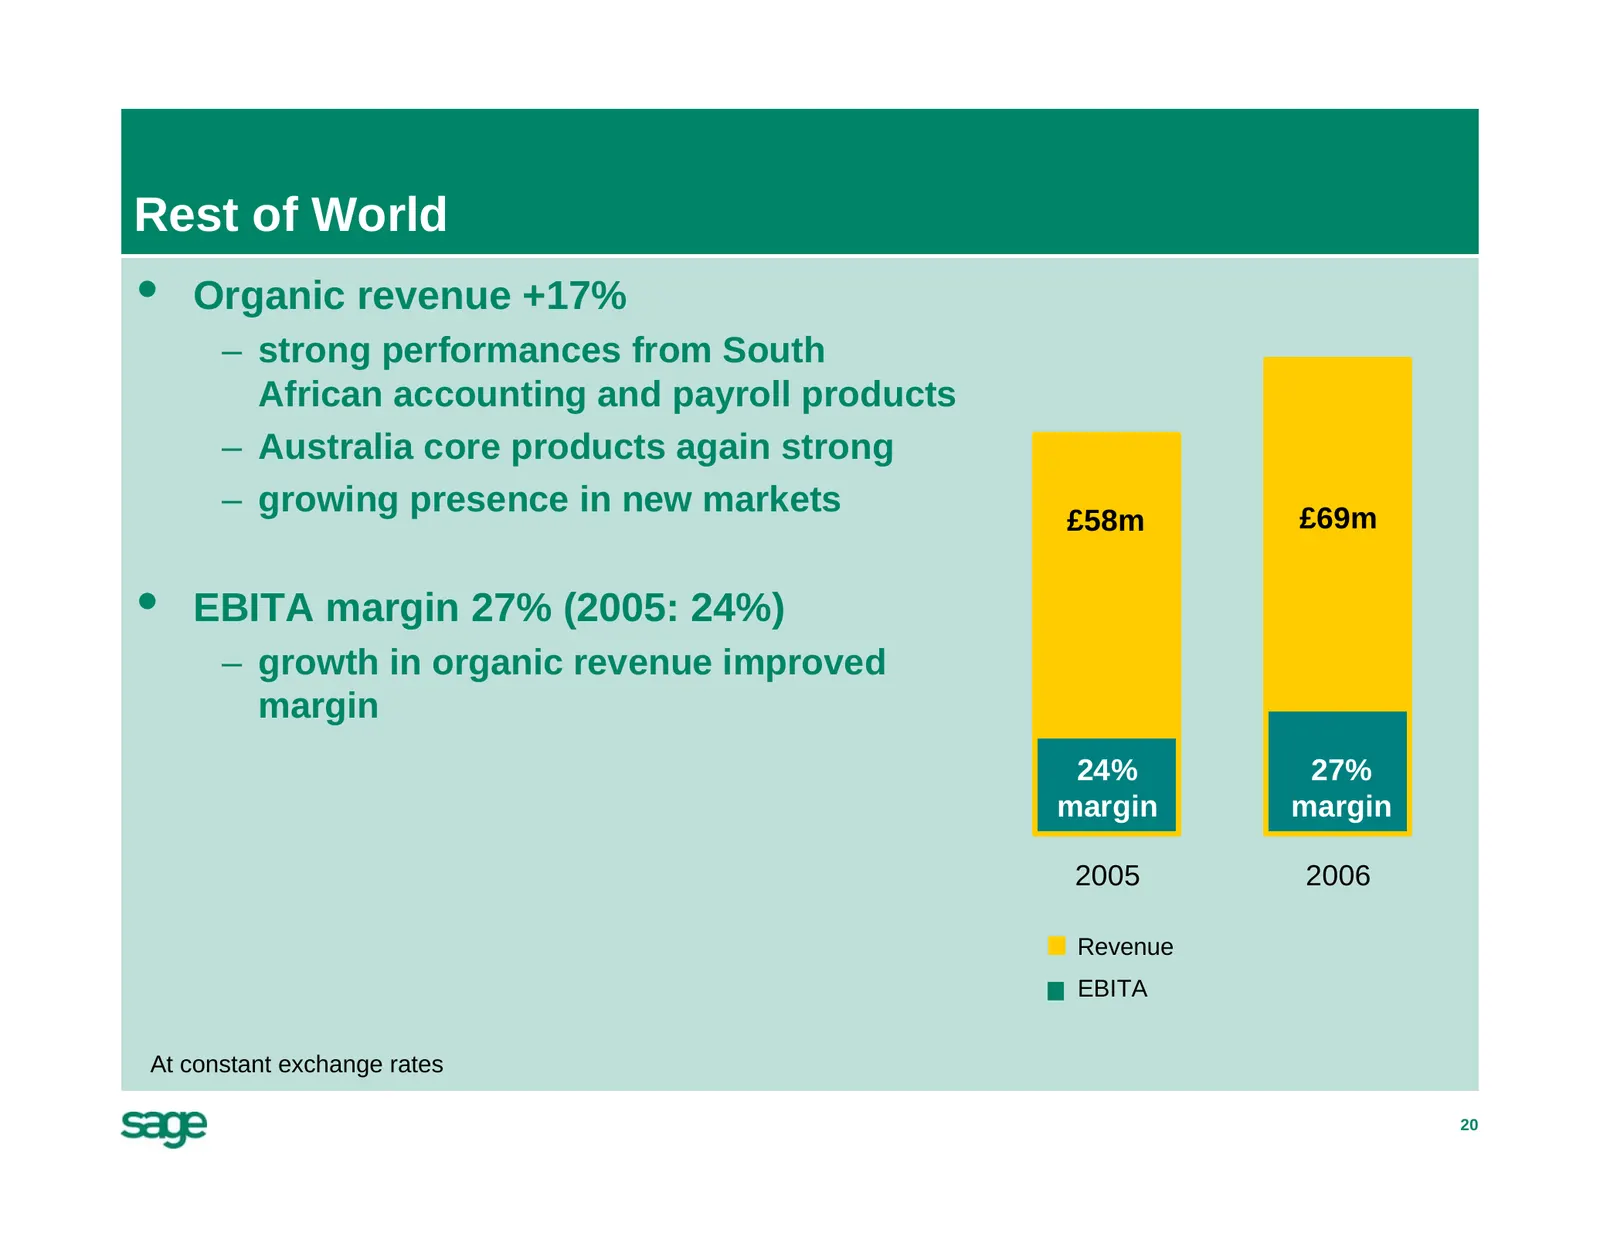
Rest of World • Organic revenue +17% – strong performances from South African accounting and payroll products – Australia core products again strong – growing presence in new markets £69m £58m • EBITA margin 27% (2005: 24%) – growth in organic revenue improved margin 24% 27% margin margin 2005 2006

Slide 21: Business review and outlook
Business review and outlook
Slide 22: What is helping us grow?
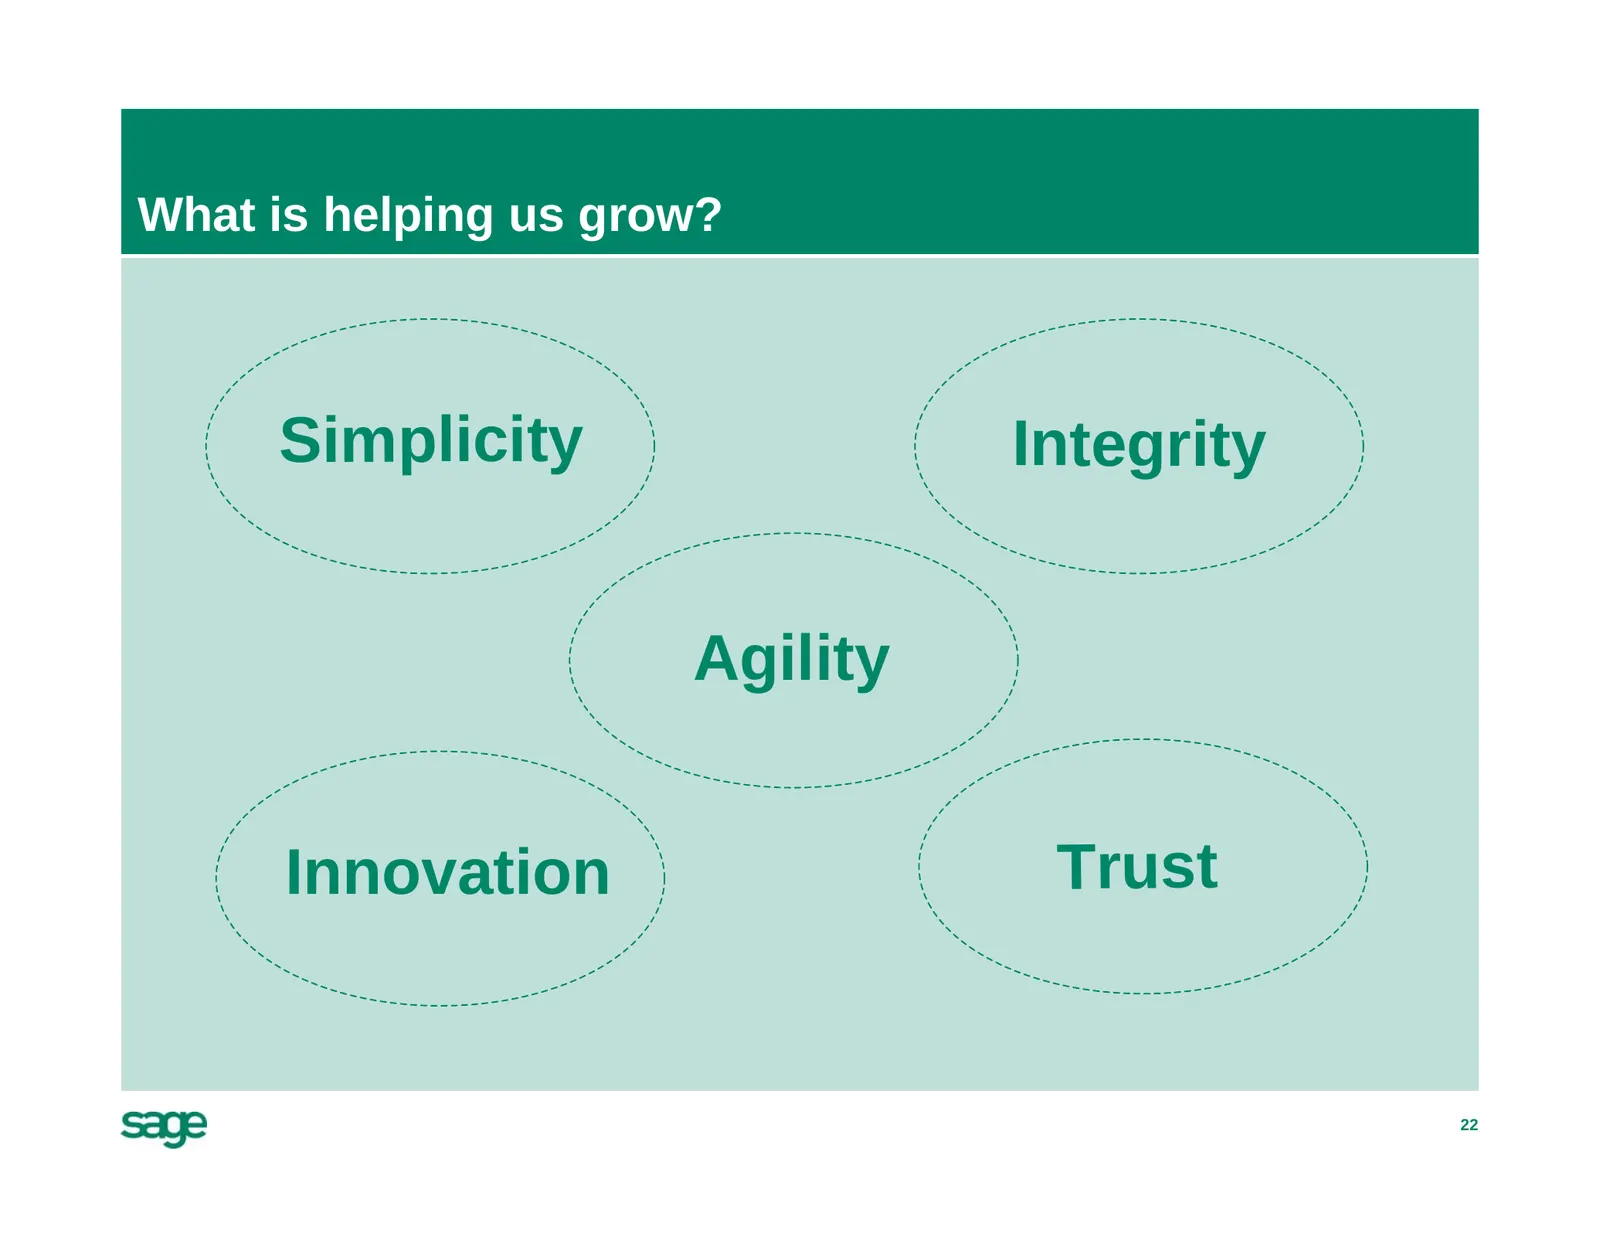
What is helping us grow? Simplicity Integrity Agility Innovation Trust 22
Slide 23: Growing customer base
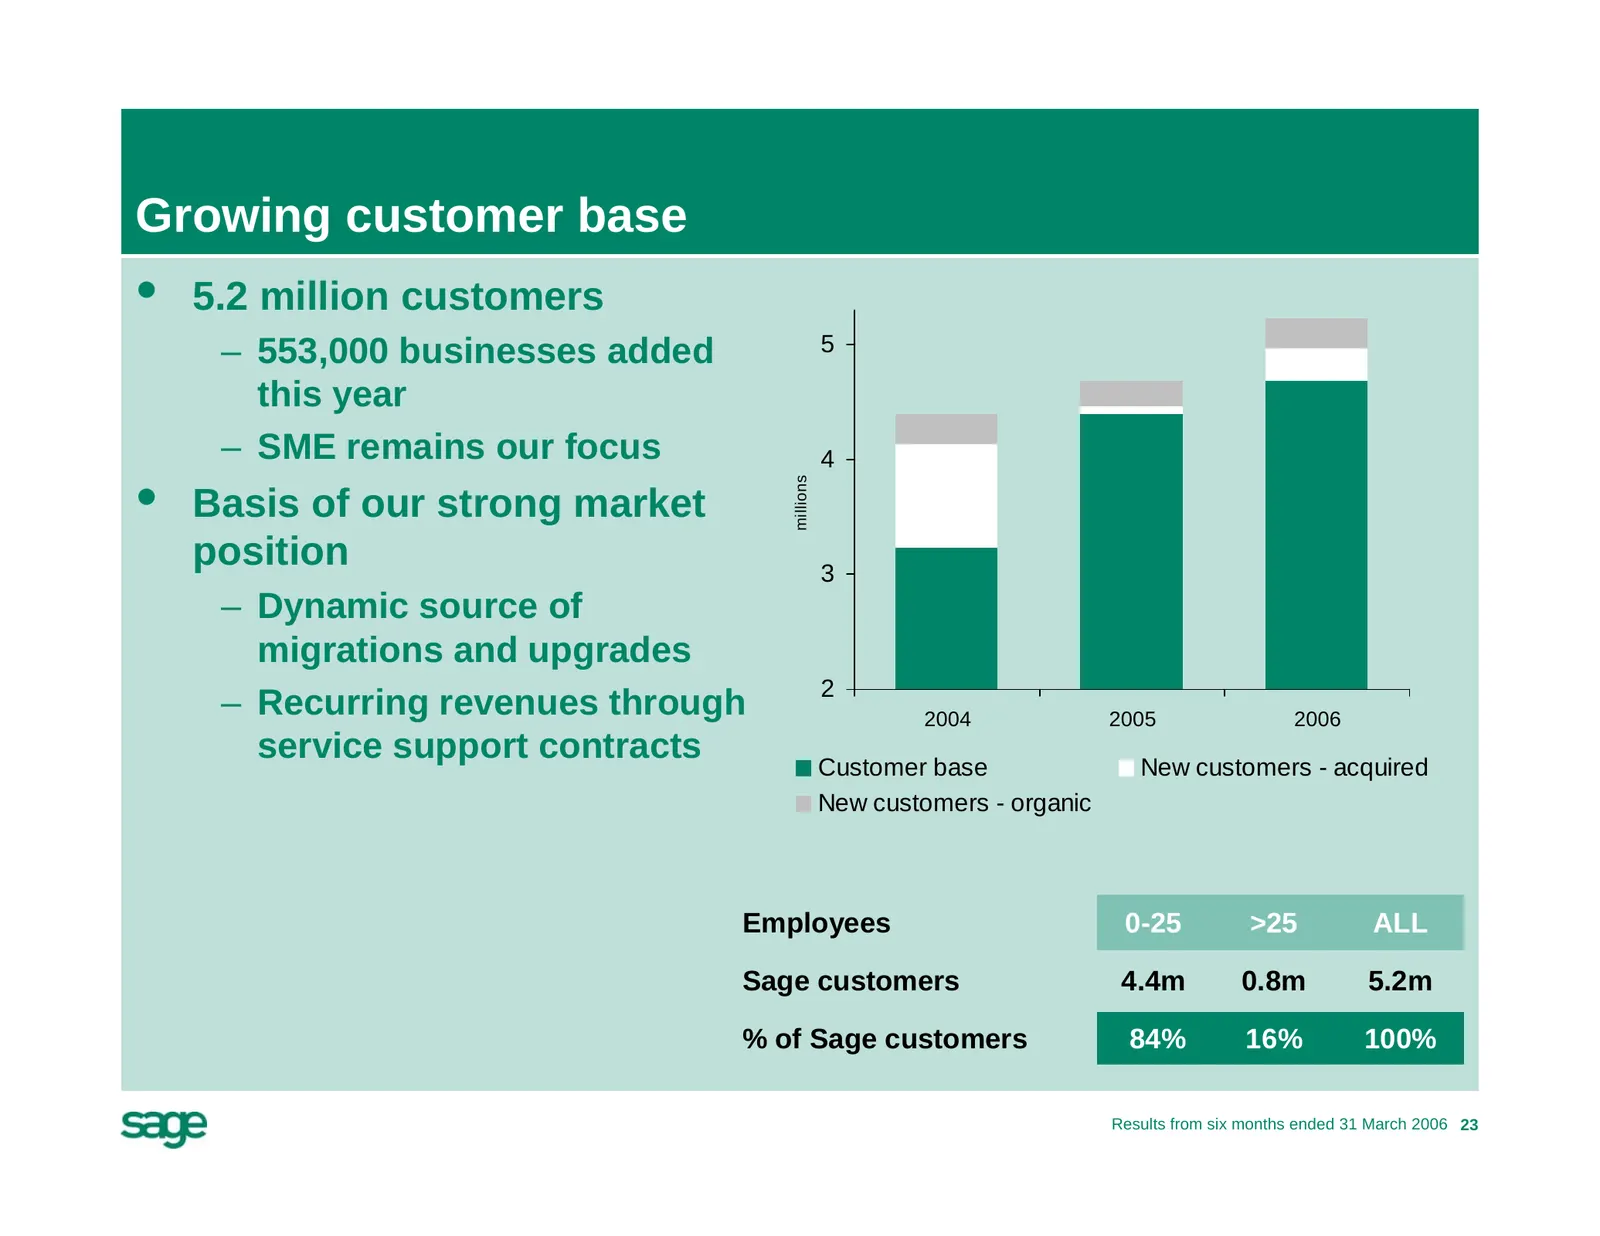
Growing customer base • 5.2 million customers – 553,000 businesses added 5 this year – SME remains our focus 4 • Basis of our strong market millions position 3 – Dynamic source of migrations and upgrades 2 – Recurring revenues through 2004 2005 2006 service support contracts Customer base New custom
Slide 24: Global CRM
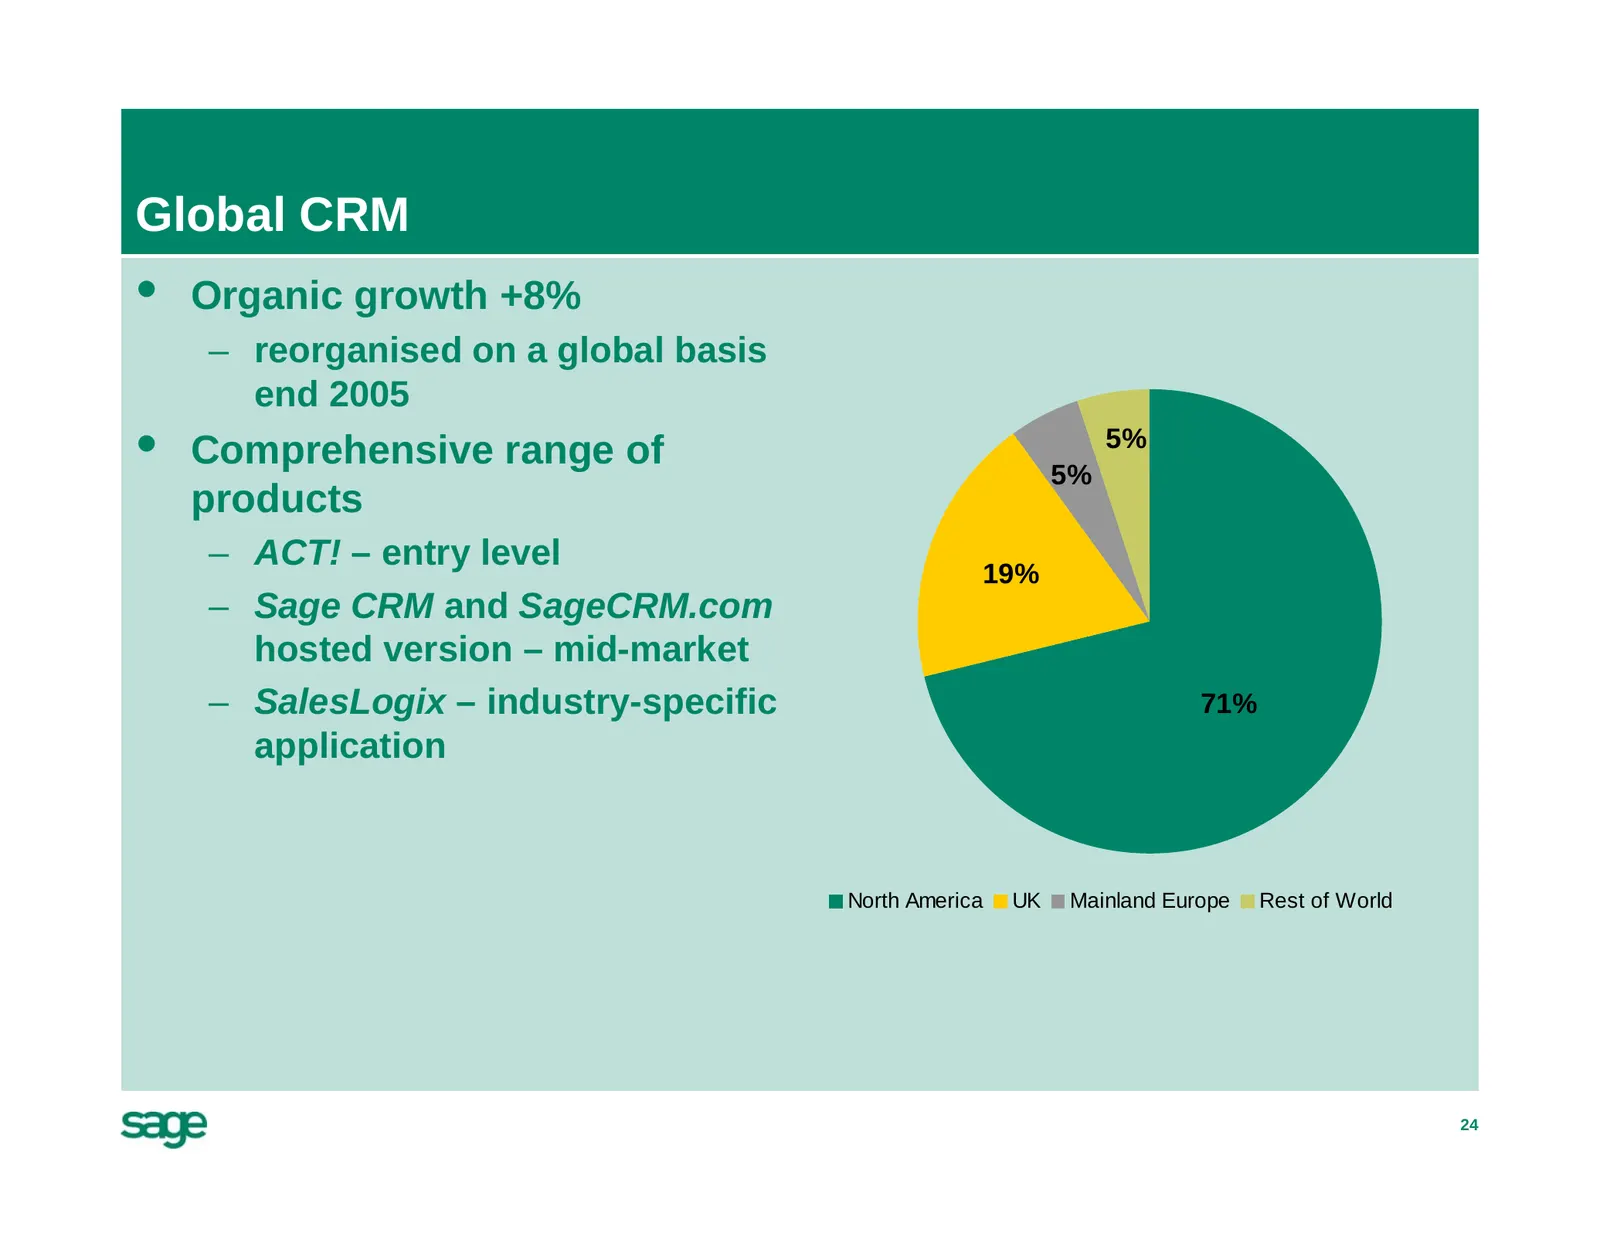
Global CRM • Organic growth +8% – reorganised on a global basis end 2005 • Comprehensive range of 5% 5% products – ACT! – entry level 19% – Sage CRM and SageCRM.com hosted version – mid-market – SalesLogix – industry-specific 71% application North America UK Mainland Europe Rest of World 24
Slide 25: Technology initiatives
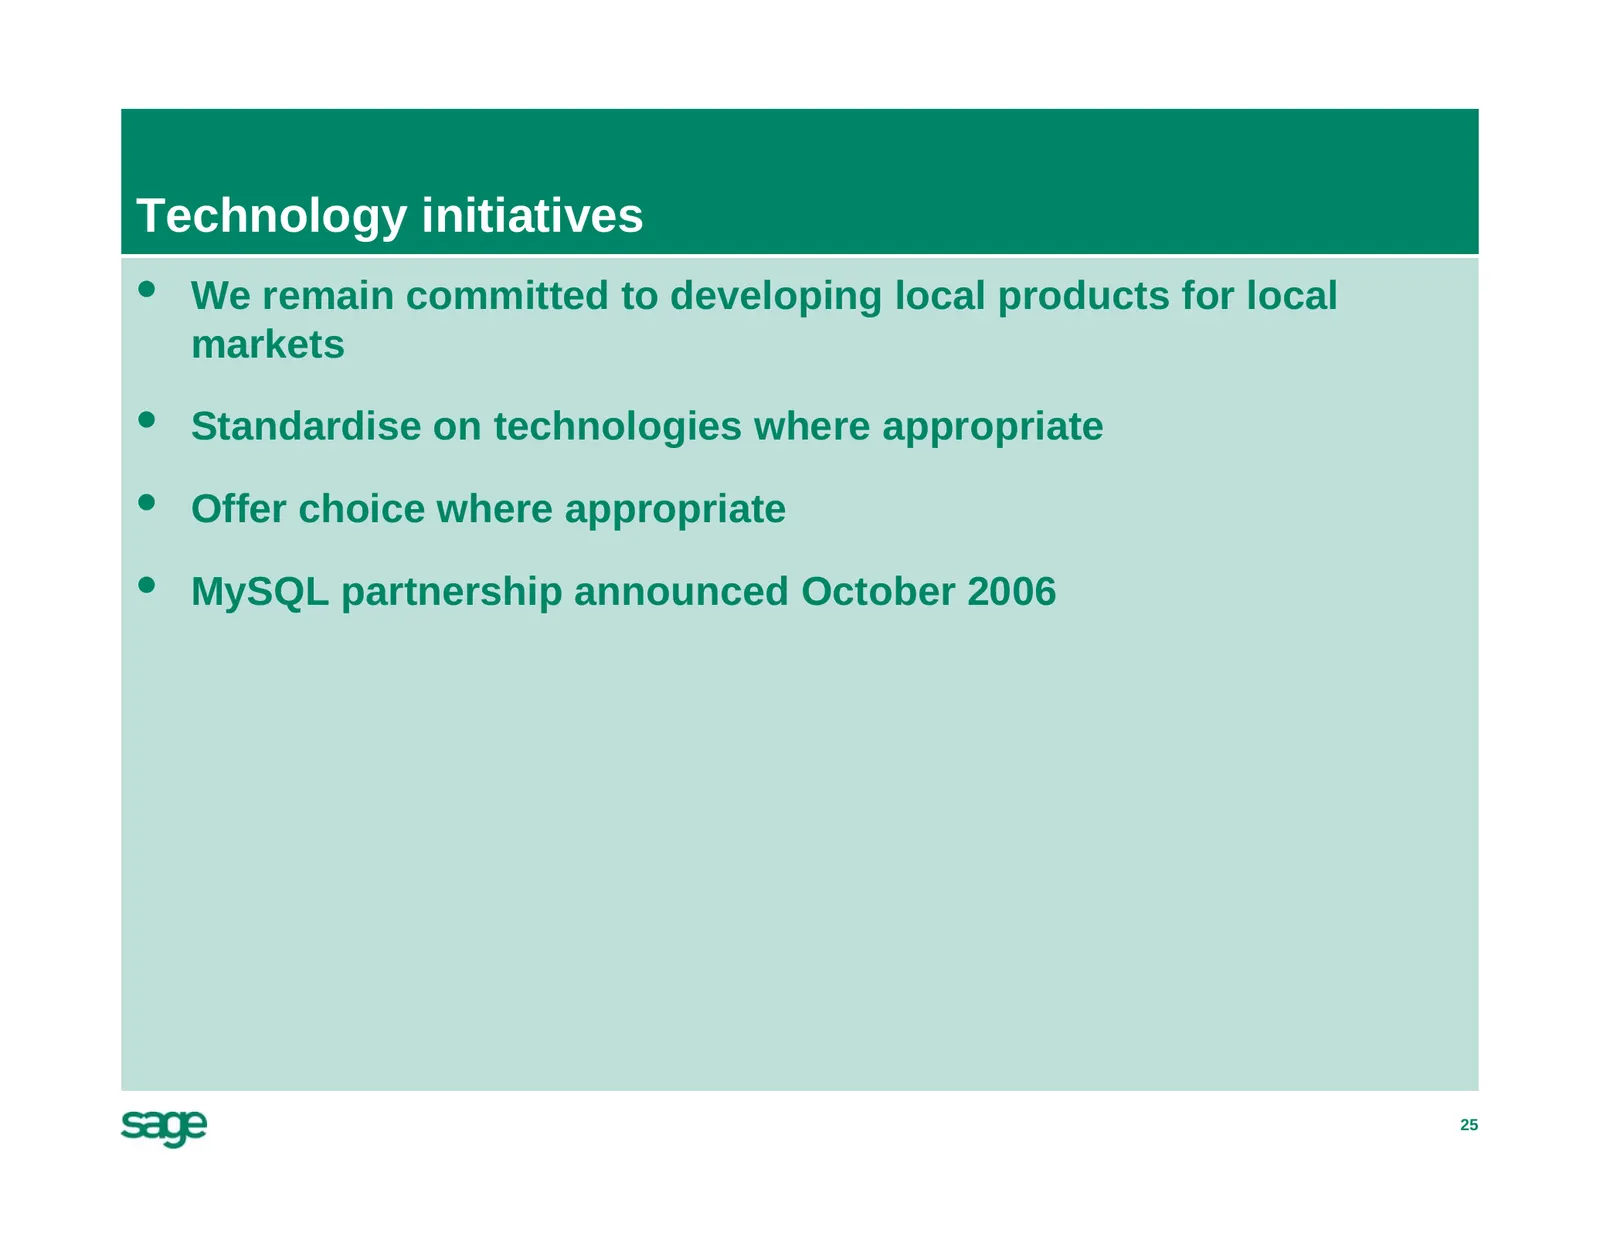
Technology initiatives • We remain committed to developing local products for local markets • Standardise on technologies where appropriate • Offer choice where appropriate • MySQL partnership announced October 2006 25
Slide 26: Acquisition strategy
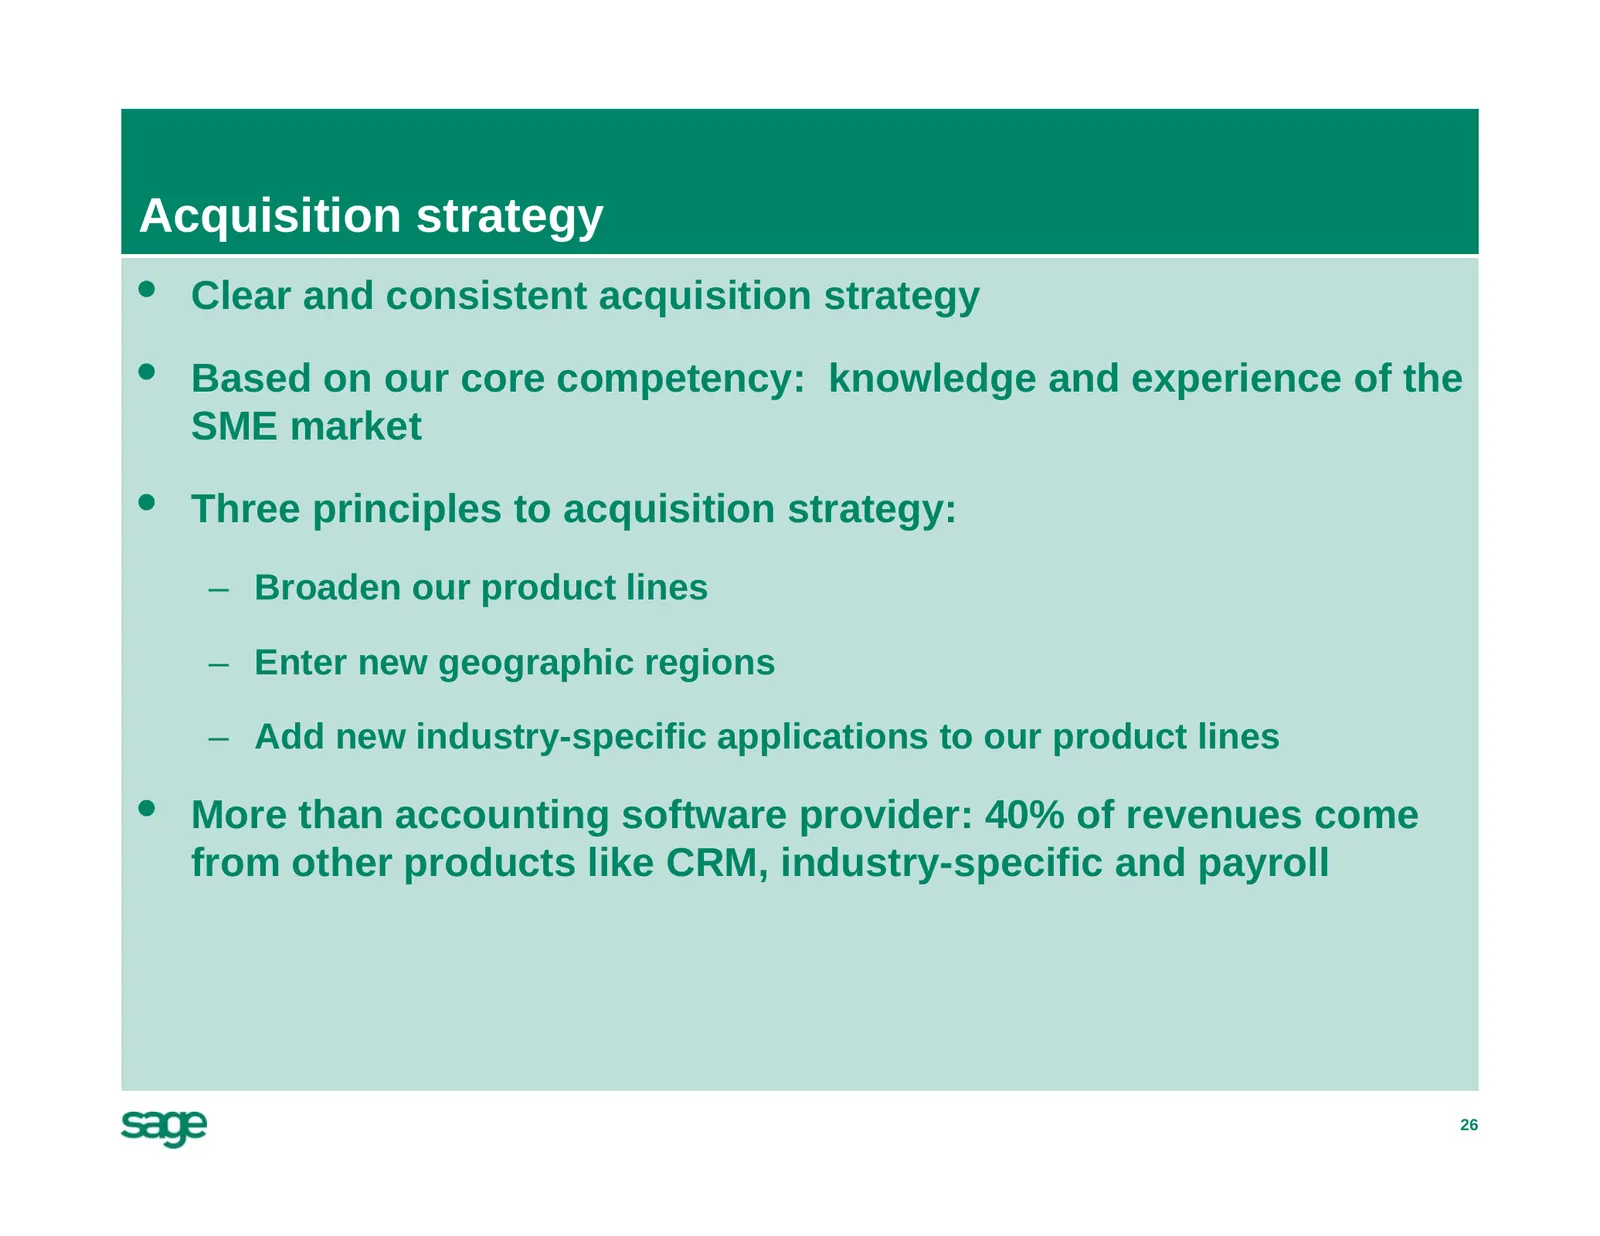
Acquisition strategy • Clear and consistent acquisition strategy • Based on our core competency: knowledge and experience of the SME market • Three principles to acquisition strategy: – Broaden our product lines – Enter new geographic regions – Add new industry-specific applications to our product l
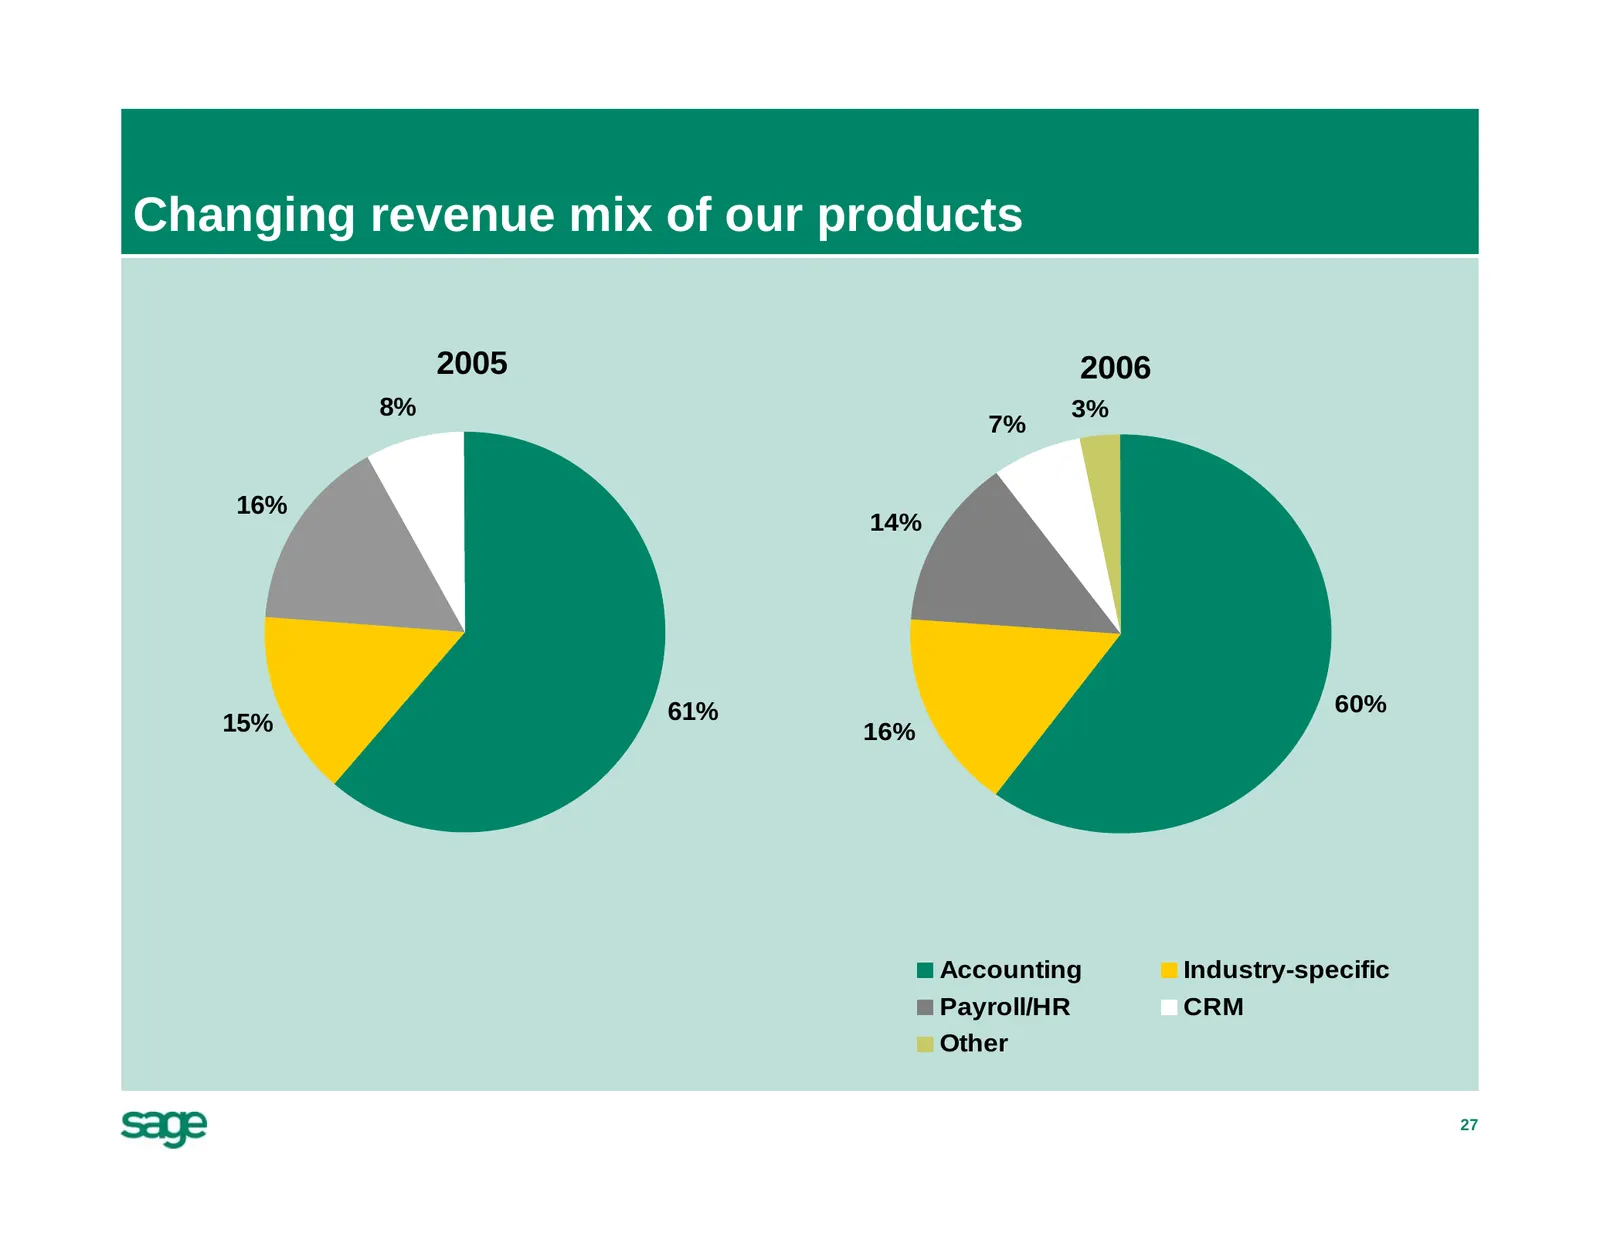
Slide 27: Changing revenue mix of our products
Changing revenue mix of our products 2005 2006 8% 3% 7% 16% 14% 61% 60% 15% 16% Accounting Industry-specific Payroll/HR CRM Other 27
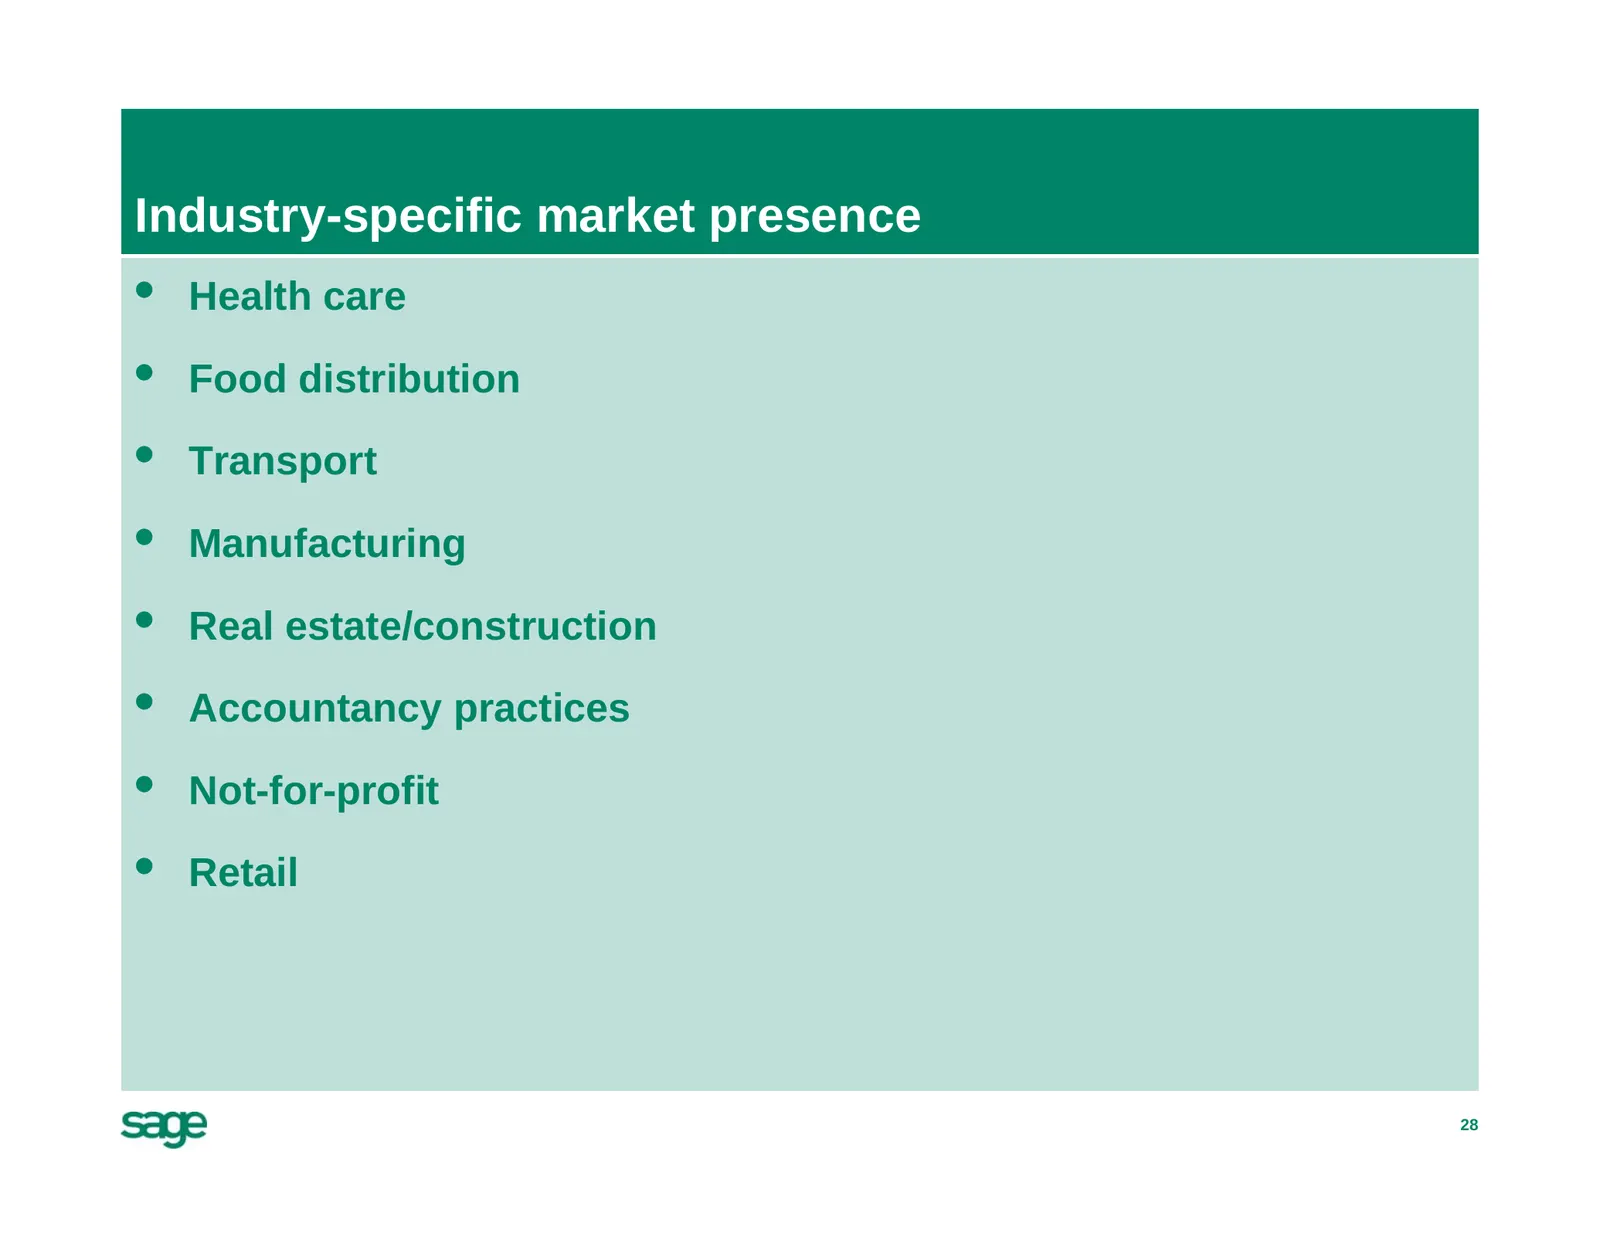
Slide 28: Industry-specific market presence
Industry-specific market presence • Health care • Food distribution • Transport • Manufacturing • Real estate/construction • Accountancy practices • Not-for-profit • Retail 28
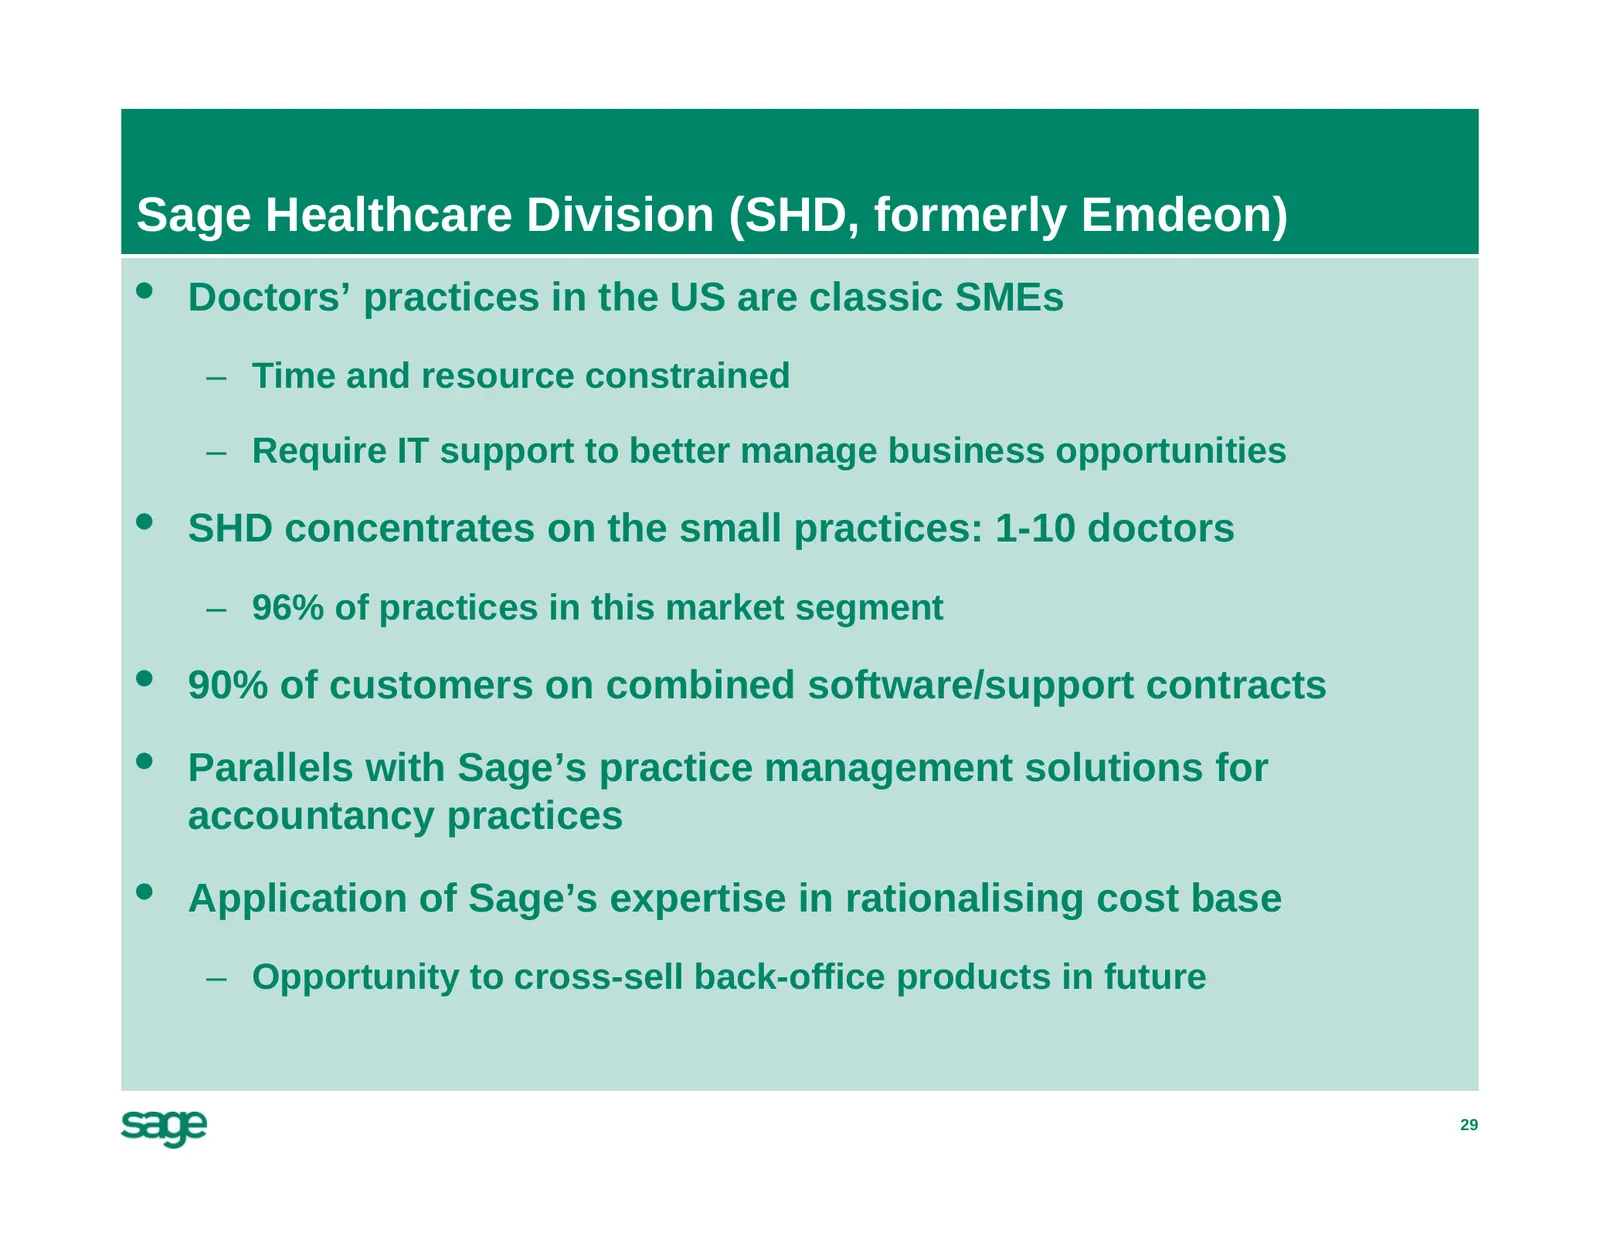
Slide 29: Sage Healthcare Division (SHD, formerly Emdeon)
Sage Healthcare Division (SHD, formerly Emdeon) • Doctors’ practices in the US are classic SMEs – Time and resource constrained – Require IT support to better manage business opportunities • SHD concentrates on the small practices: 1-10 doctors – 96% of practices in this market segment • 90% of cust
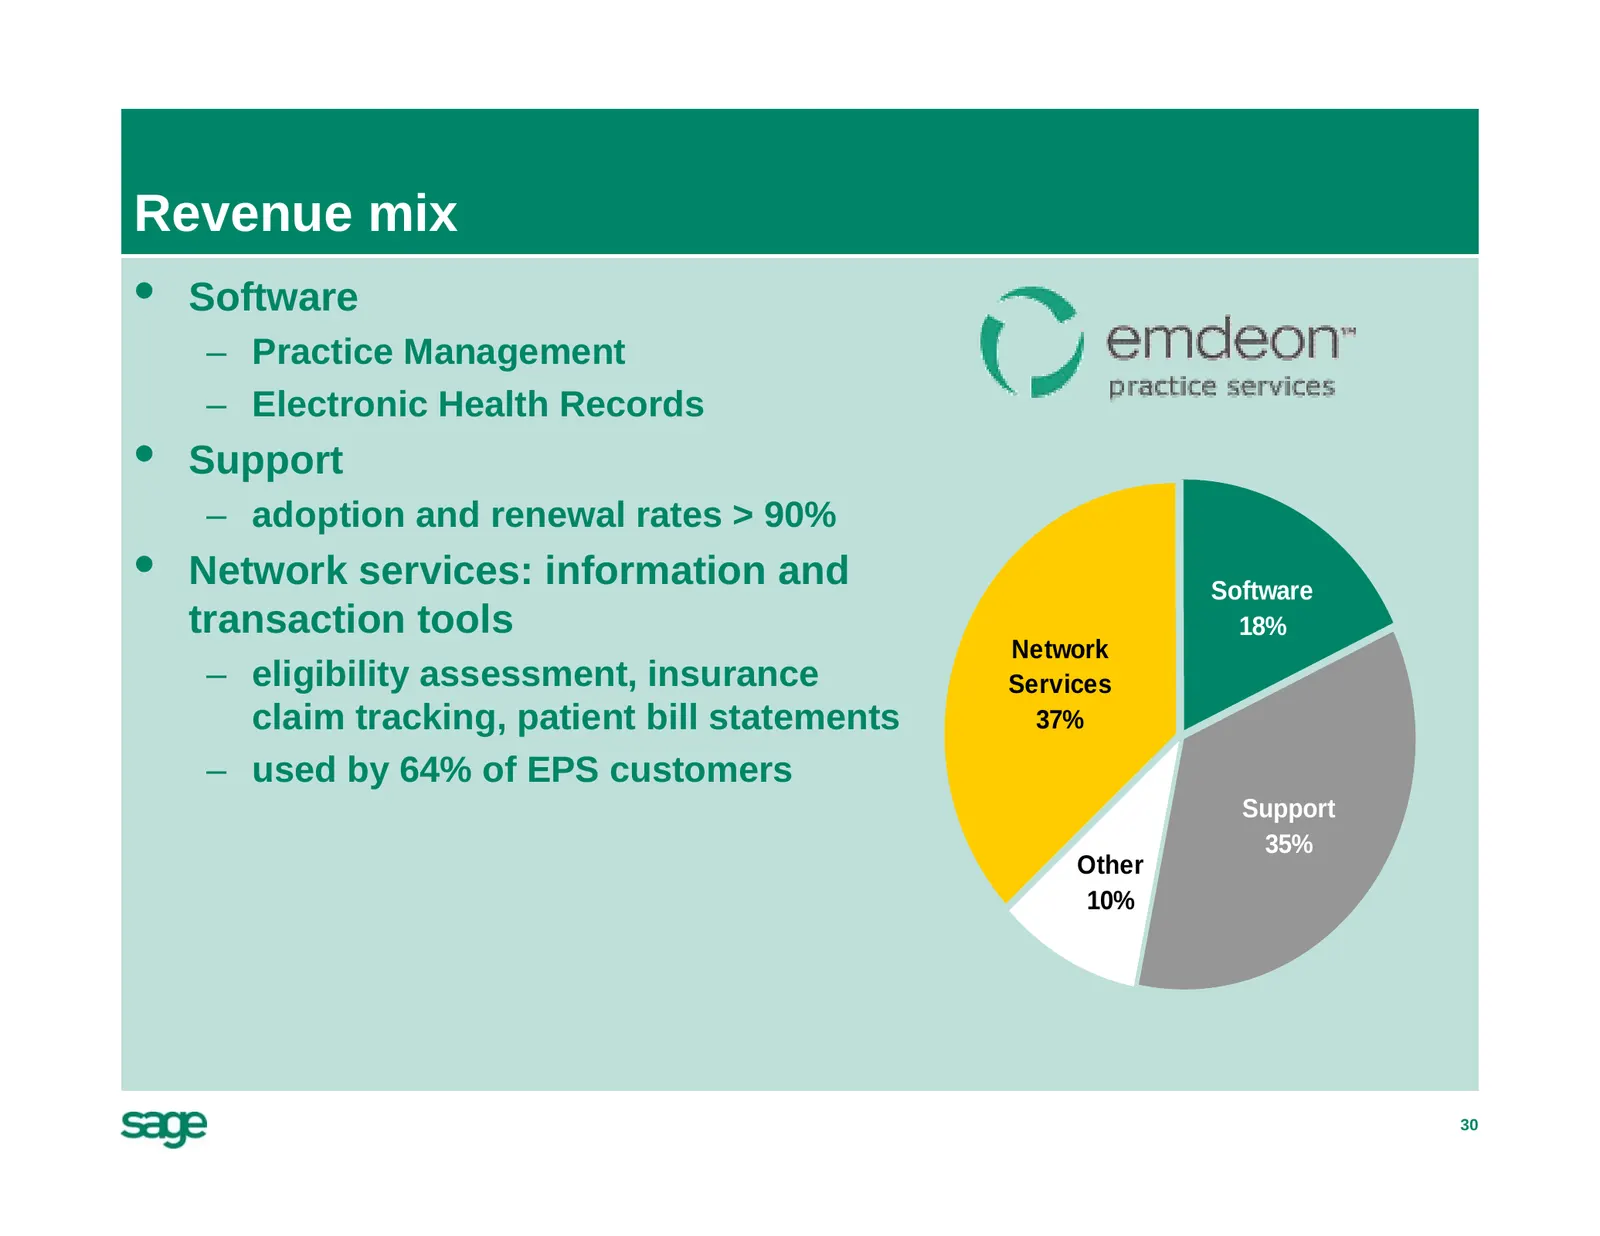
Slide 30: Revenue mix
Revenue mix • Software – Practice Management – Electronic Health Records • Support – adoption and renewal rates > 90% • Network services: information and Software transaction tools 18% Network – eligibility assessment, insurance Services claim tracking, patient bill statements 37% – used by 64% of E
Slide 31: Verus and Protx: Merchant Services
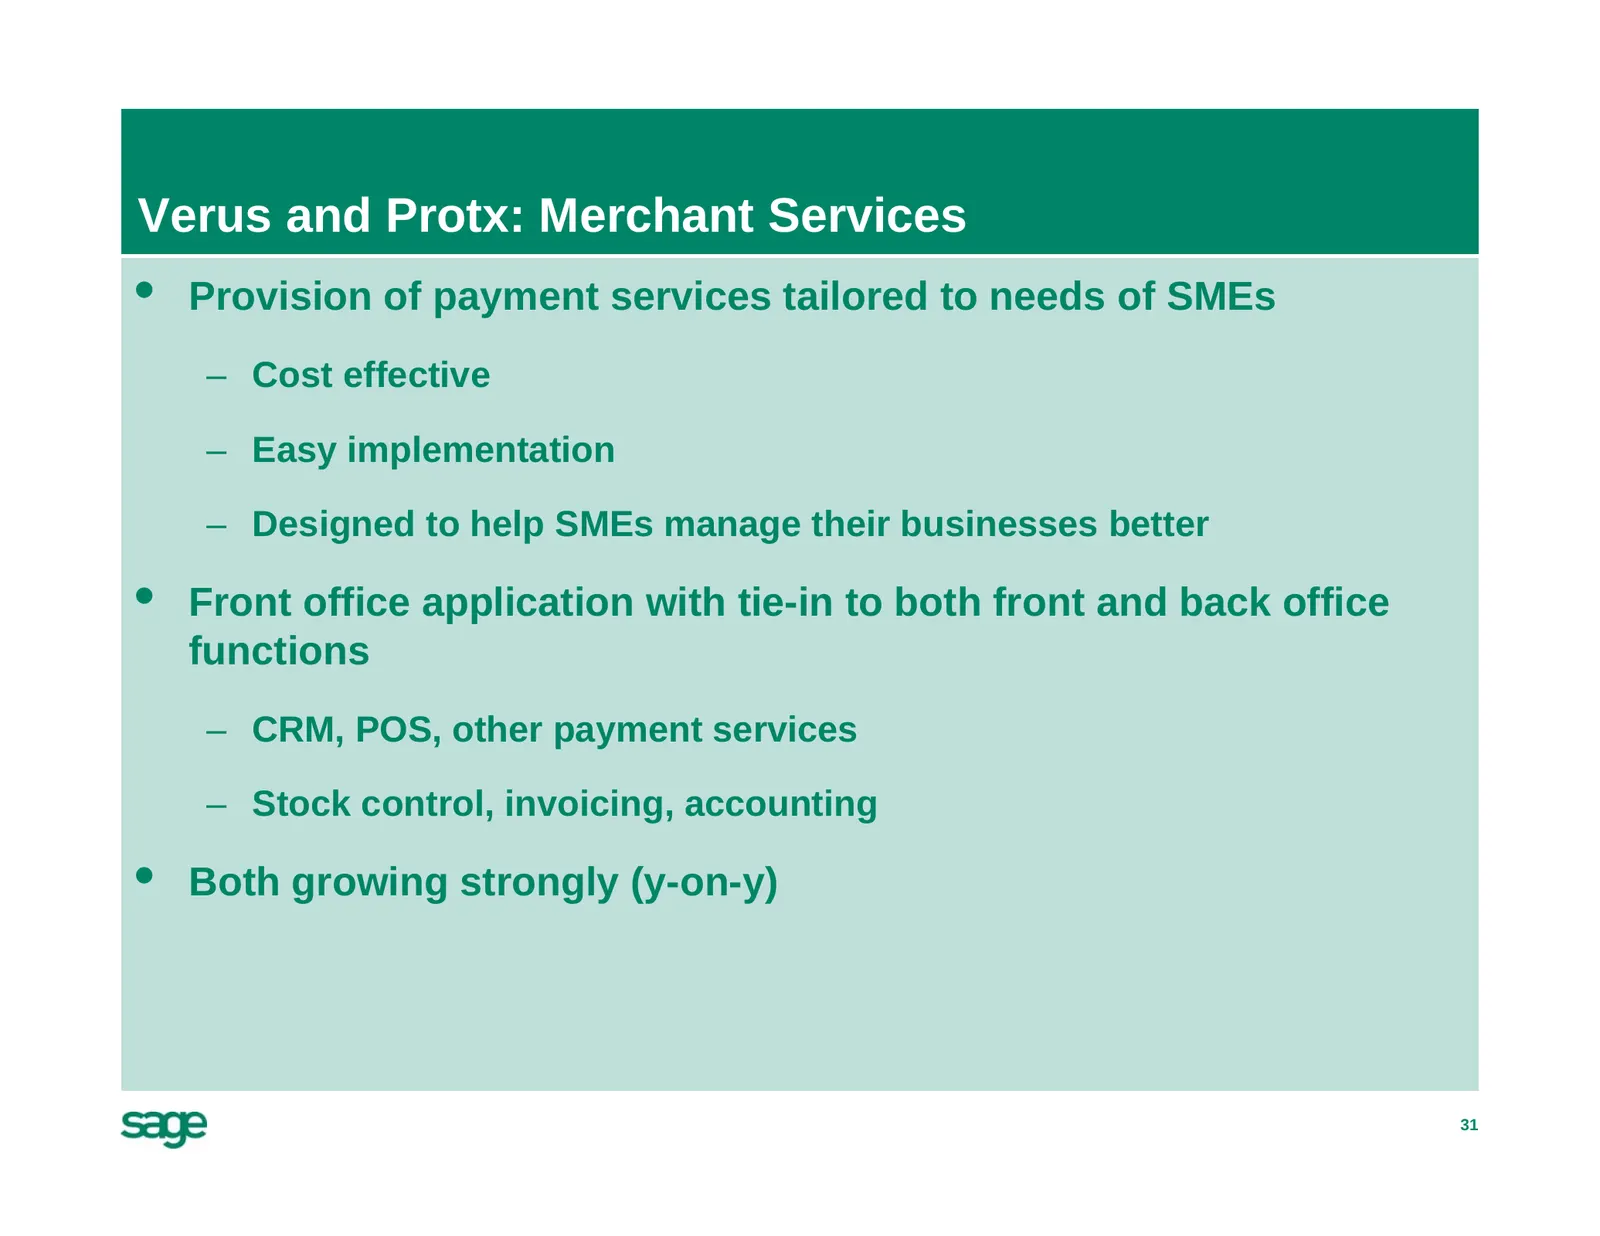
Verus and Protx: Merchant Services • Provision of payment services tailored to needs of SMEs – Cost effective – Easy implementation – Designed to help SMEs manage their businesses better • Front office application with tie-in to both front and back office functions – CRM, POS, other payment services
Slide 32: Objectives and outlook
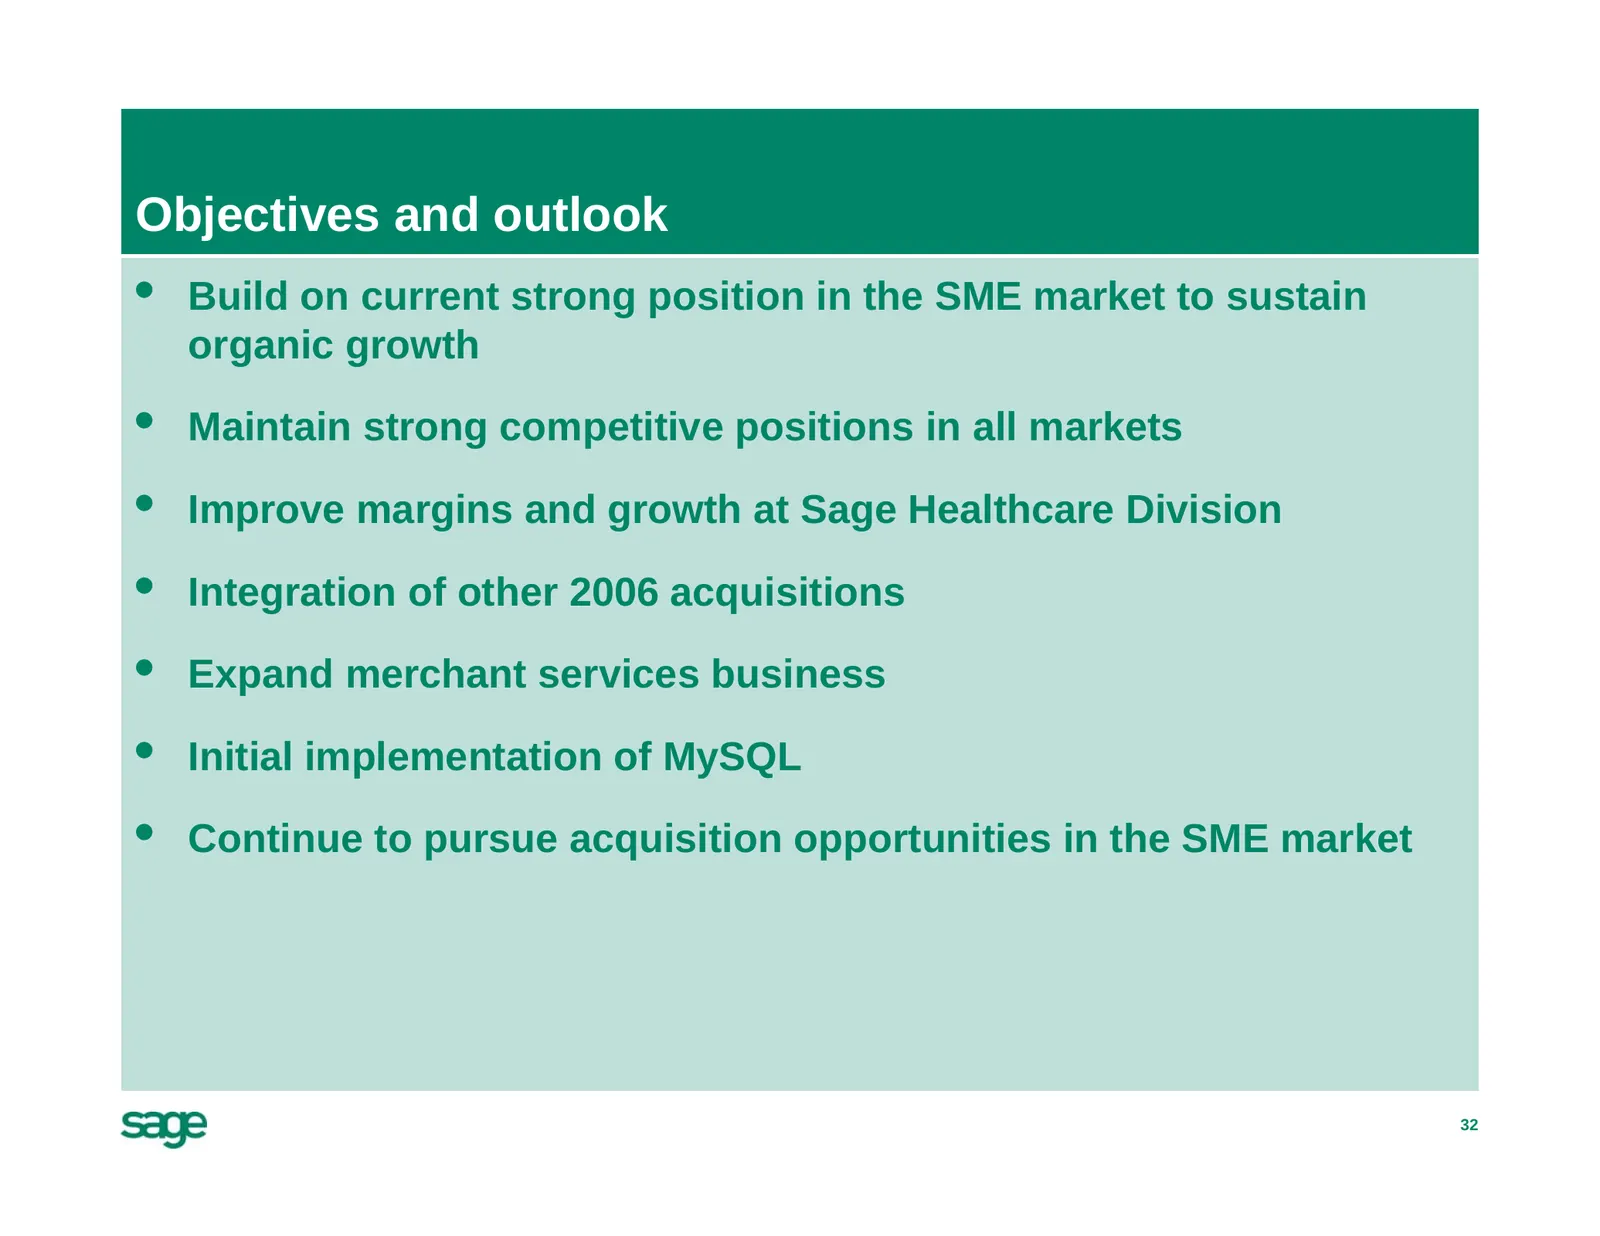
Objectives and outlook • Build on current strong position in the SME market to sustain organic growth • Maintain strong competitive positions in all markets • Improve margins and growth at Sage Healthcare Division • Integration of other 2006 acquisitions • Expand merchant services business • Initial
Slide 33: Supplementary information
Supplementary information
Slide 34: Organic revenue growth
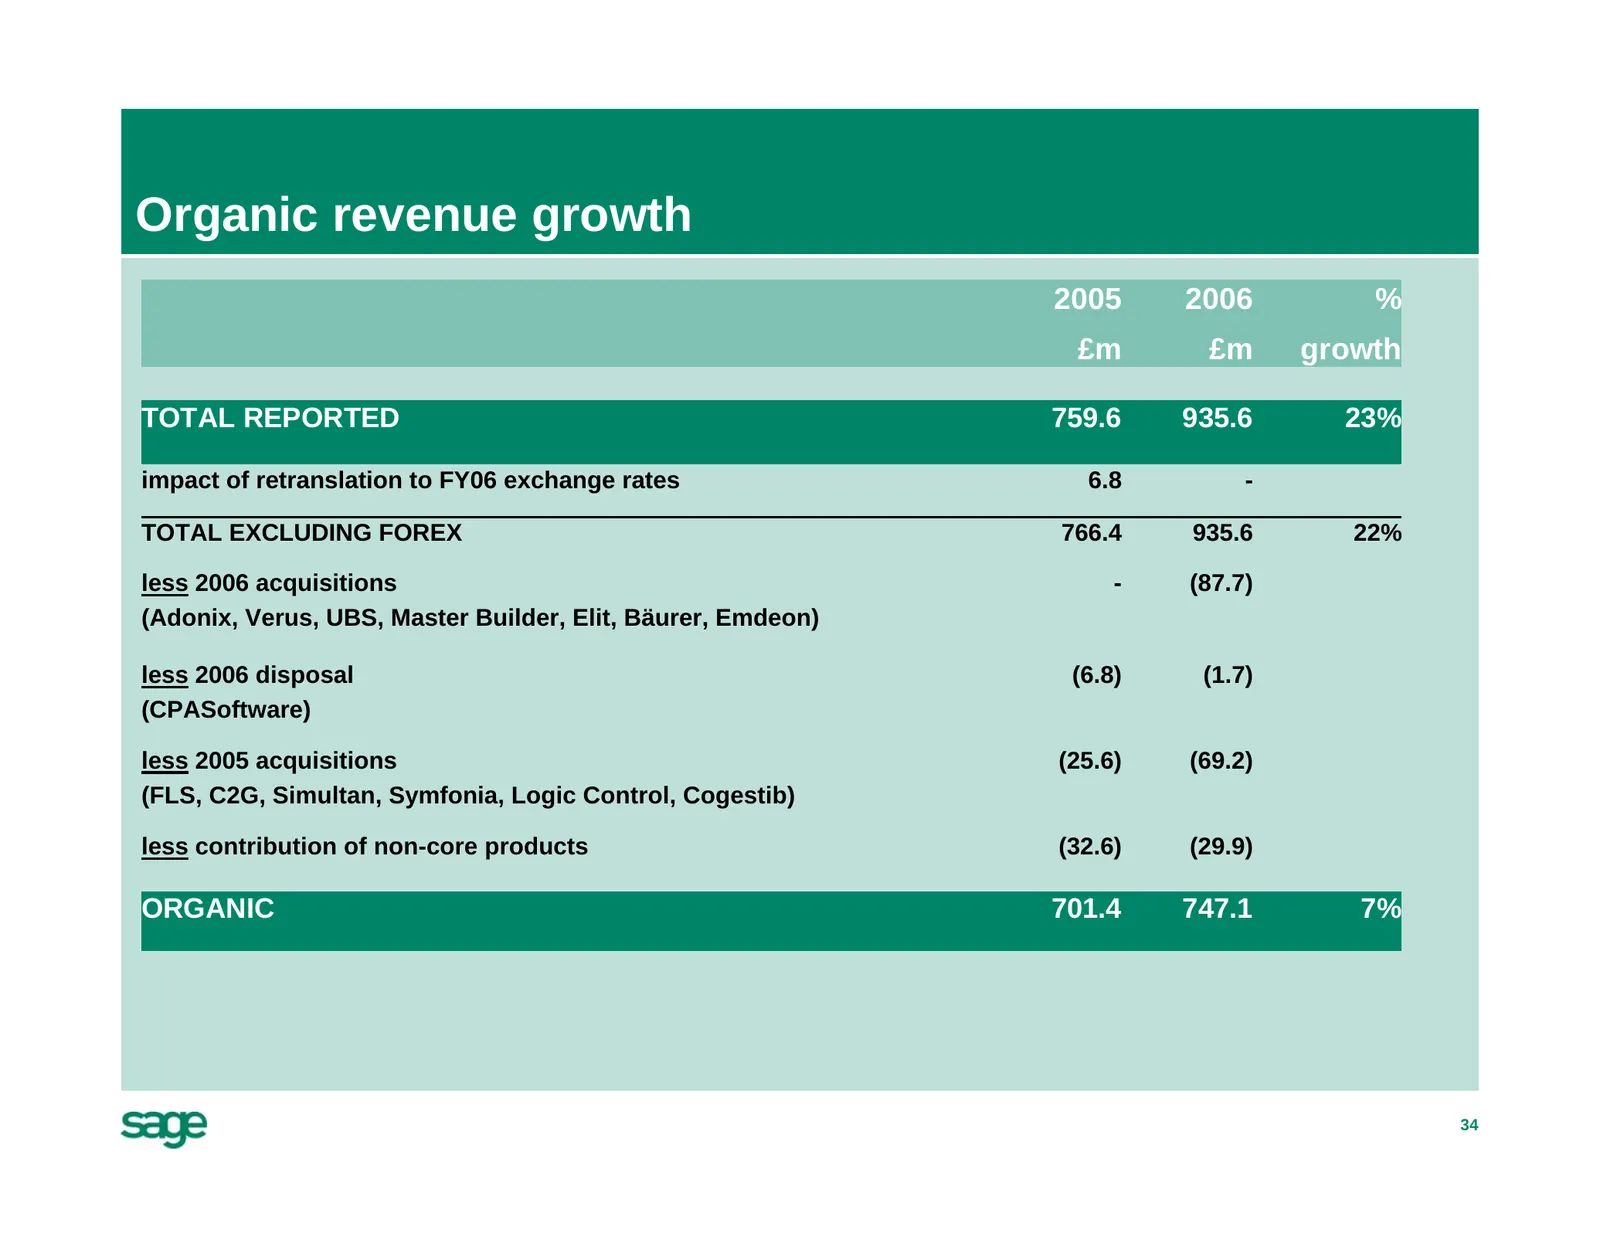
Organic revenue growth 2005 2006 % £m £m growth TOTAL REPORTED 759.6 935.6 23% impact of retranslation to FY06 exchange rates 6.8 - TOTAL EXCLUDING FOREX 766.4 935.6 22% less 2006 acquisitions - (87.7) (Adonix, Verus, UBS, Master Builder, Elit, Bäurer, Emdeon) less 2006 disposal (6.8) (1.7) (CPASoft
Slide 35: Operating profit by region
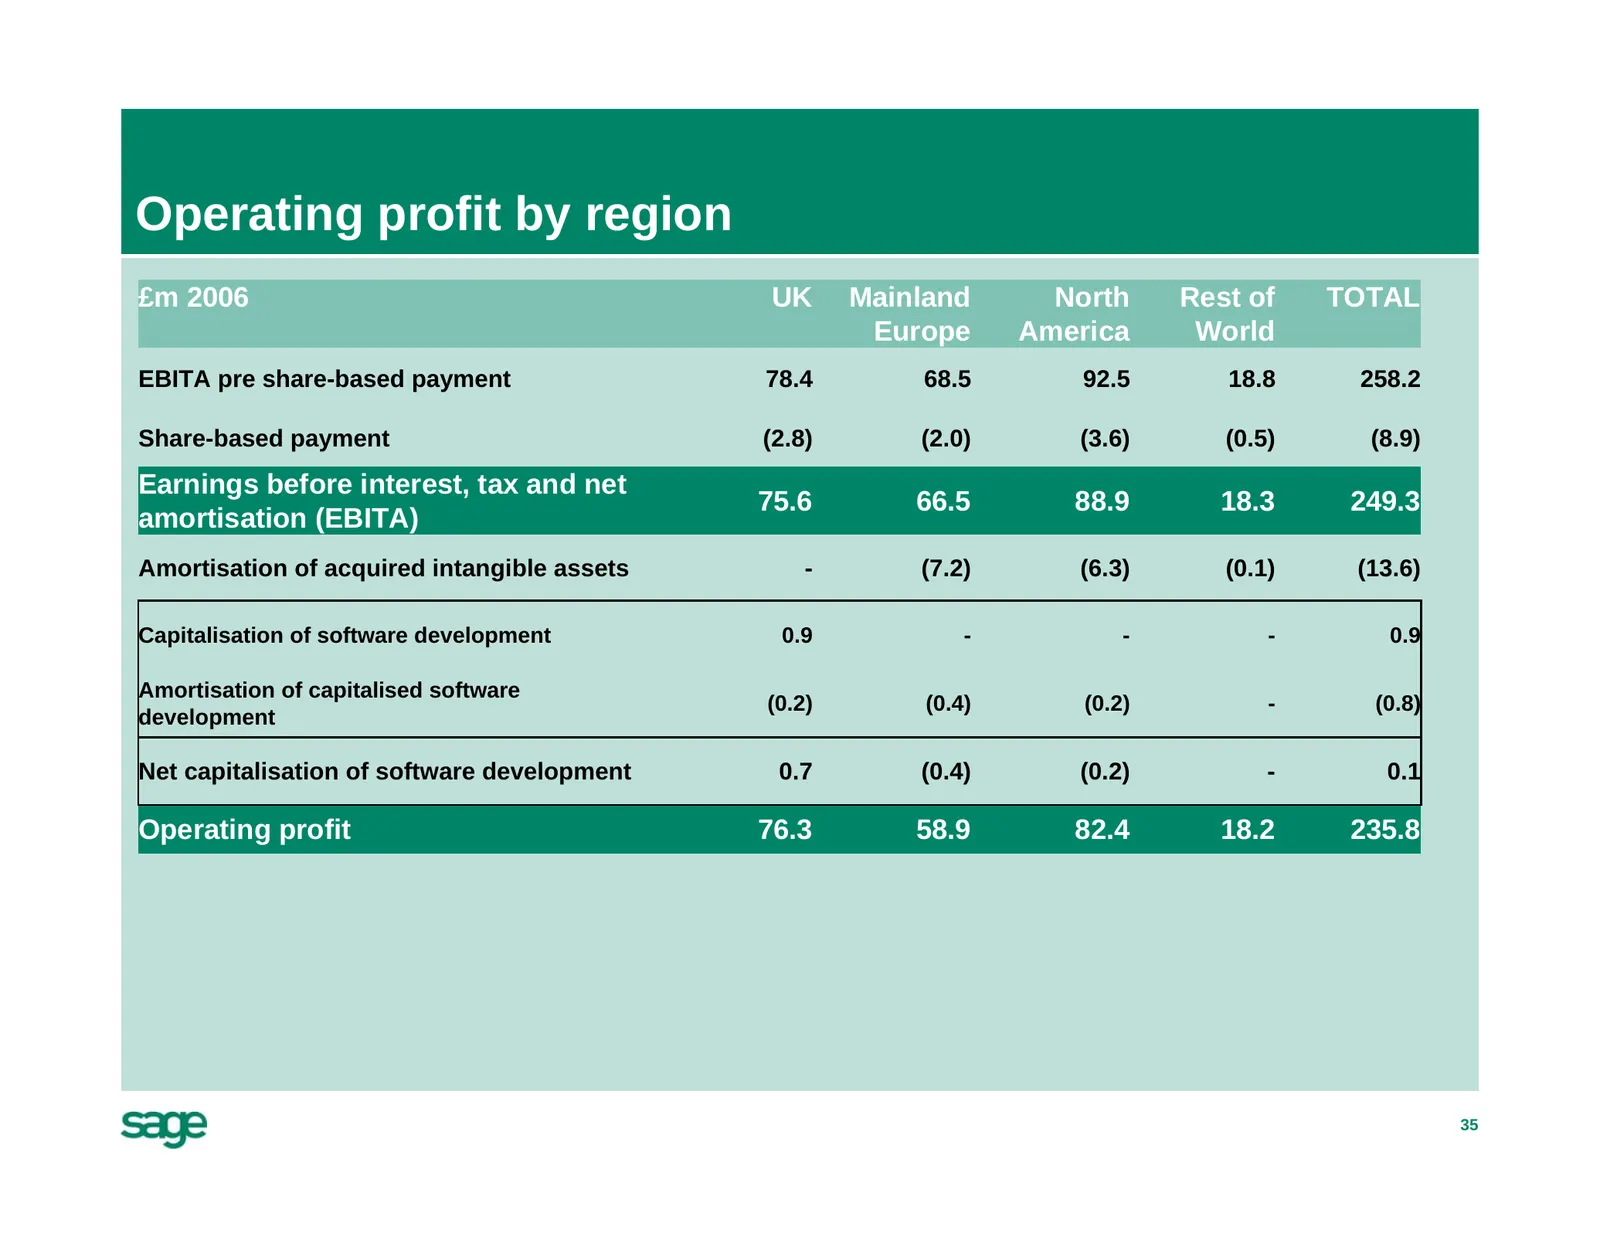
Operating profit by region £m 2006 UK Mainland North Rest of TOTAL Europe America World EBITA pre share-based payment 78.4 68.5 92.5 18.8 258.2 Share-based payment (2.8) (2.0) (3.6) (0.5) (8.9) Earnings before interest, tax and net 75.6 66.5 88.9 18.3 249.3 amortisation (EBITA) Amortisation of acqui
Slide 36: Revenue mix by region
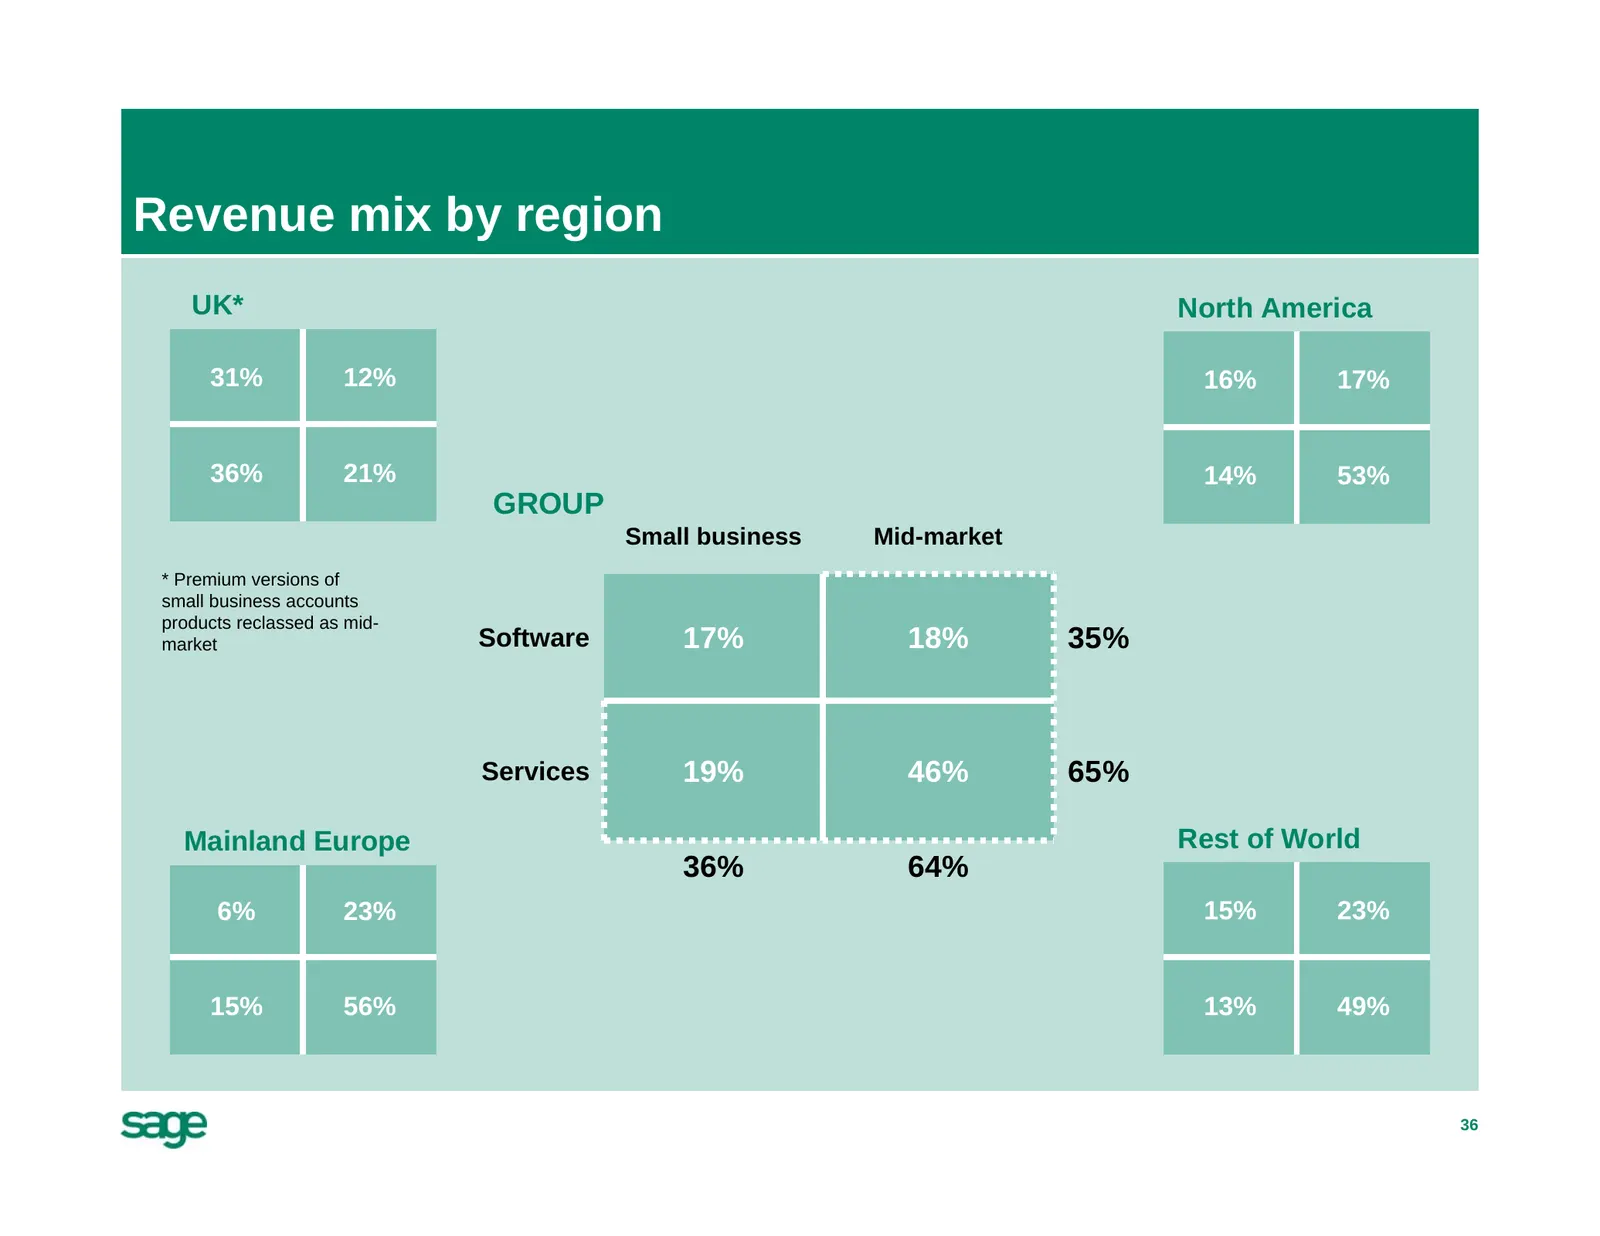
Revenue mix by region UK* North America 31% 12% 16% 17% 36% 21% 14% 53% GROUP Small business Mid-market * Premium versions of small business accounts products reclassed as mid- market Software 17% 18% 35% Services 19% 46% 65% Mainland Europe Rest of World 36% 64% 6% 23% 15% 23% 15% 56% 13% 49% 36
Slide 37: Support contracts
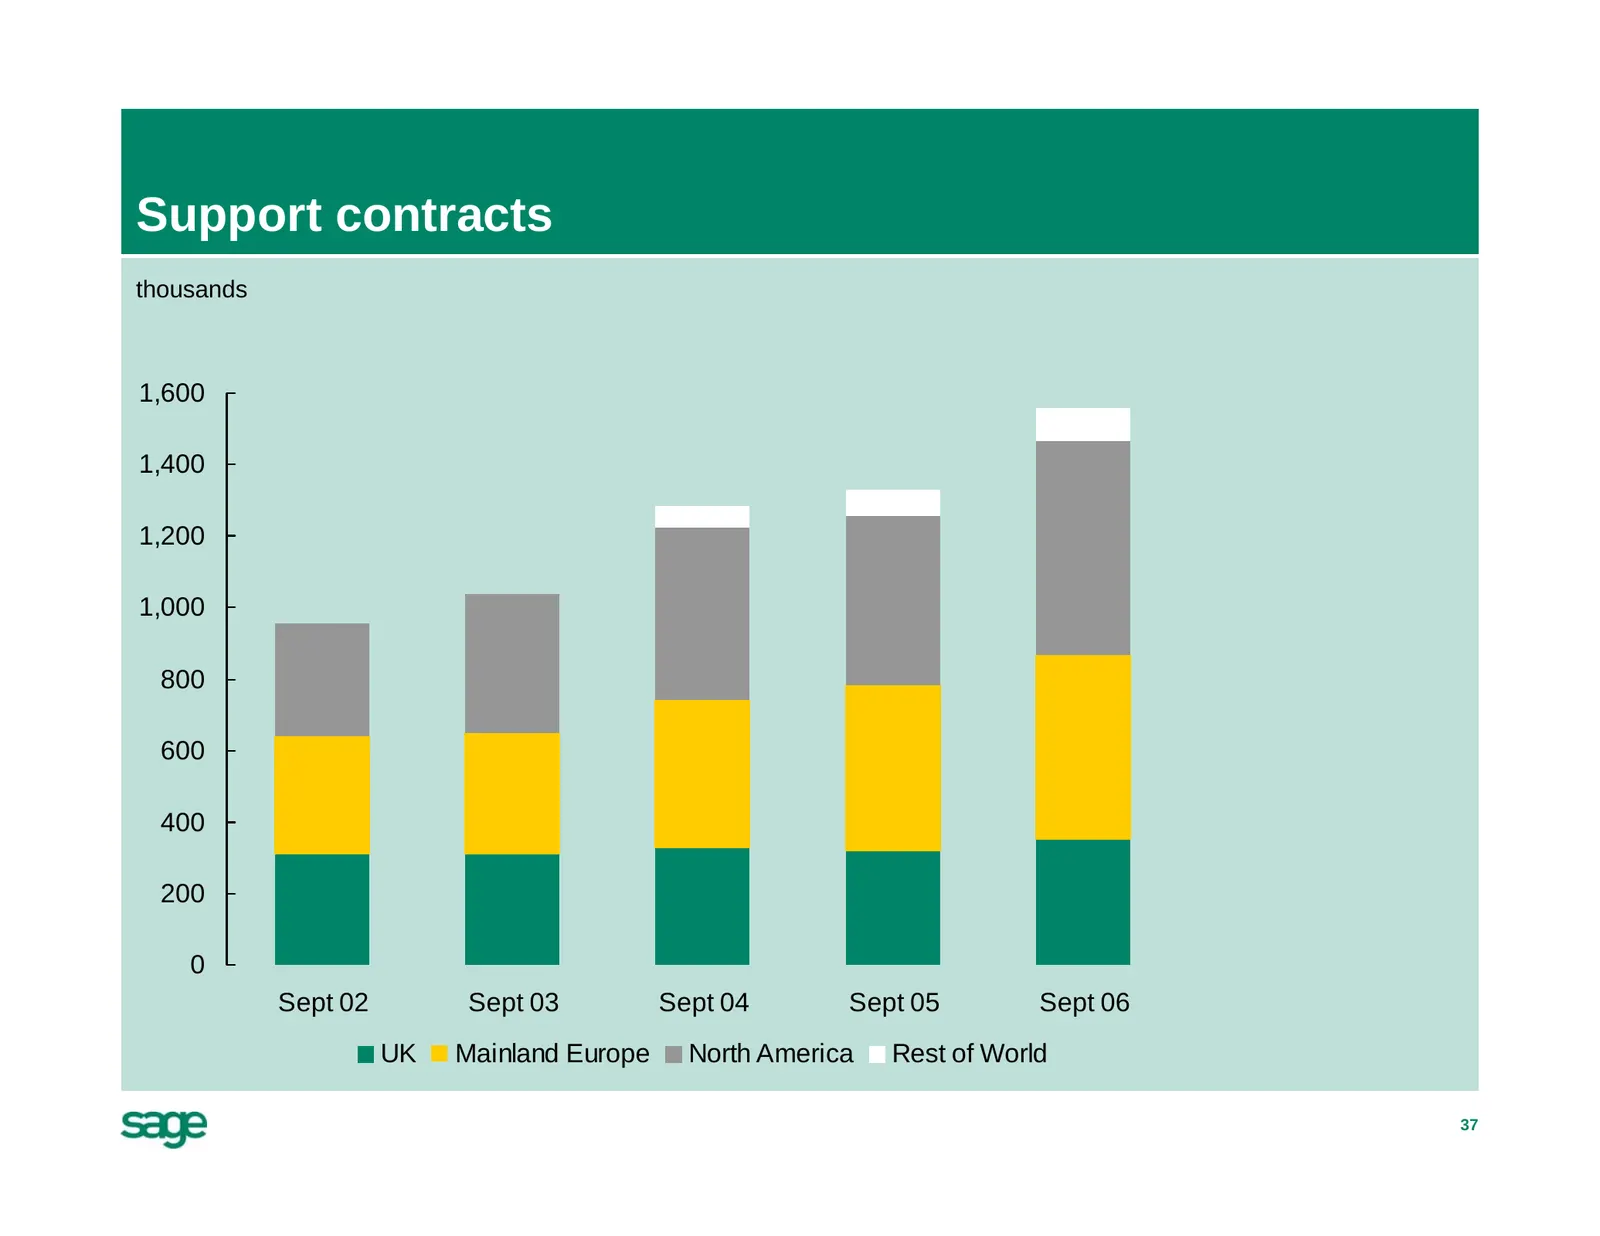
Support contracts thousands 1,600 1,400 1,200 1,000 800 600 400 200 0 Sept 02 Sept 03 Sept 04 Sept 05 Sept 06 UK Mainland Europe North America Rest of World 37
Slide 38: UK
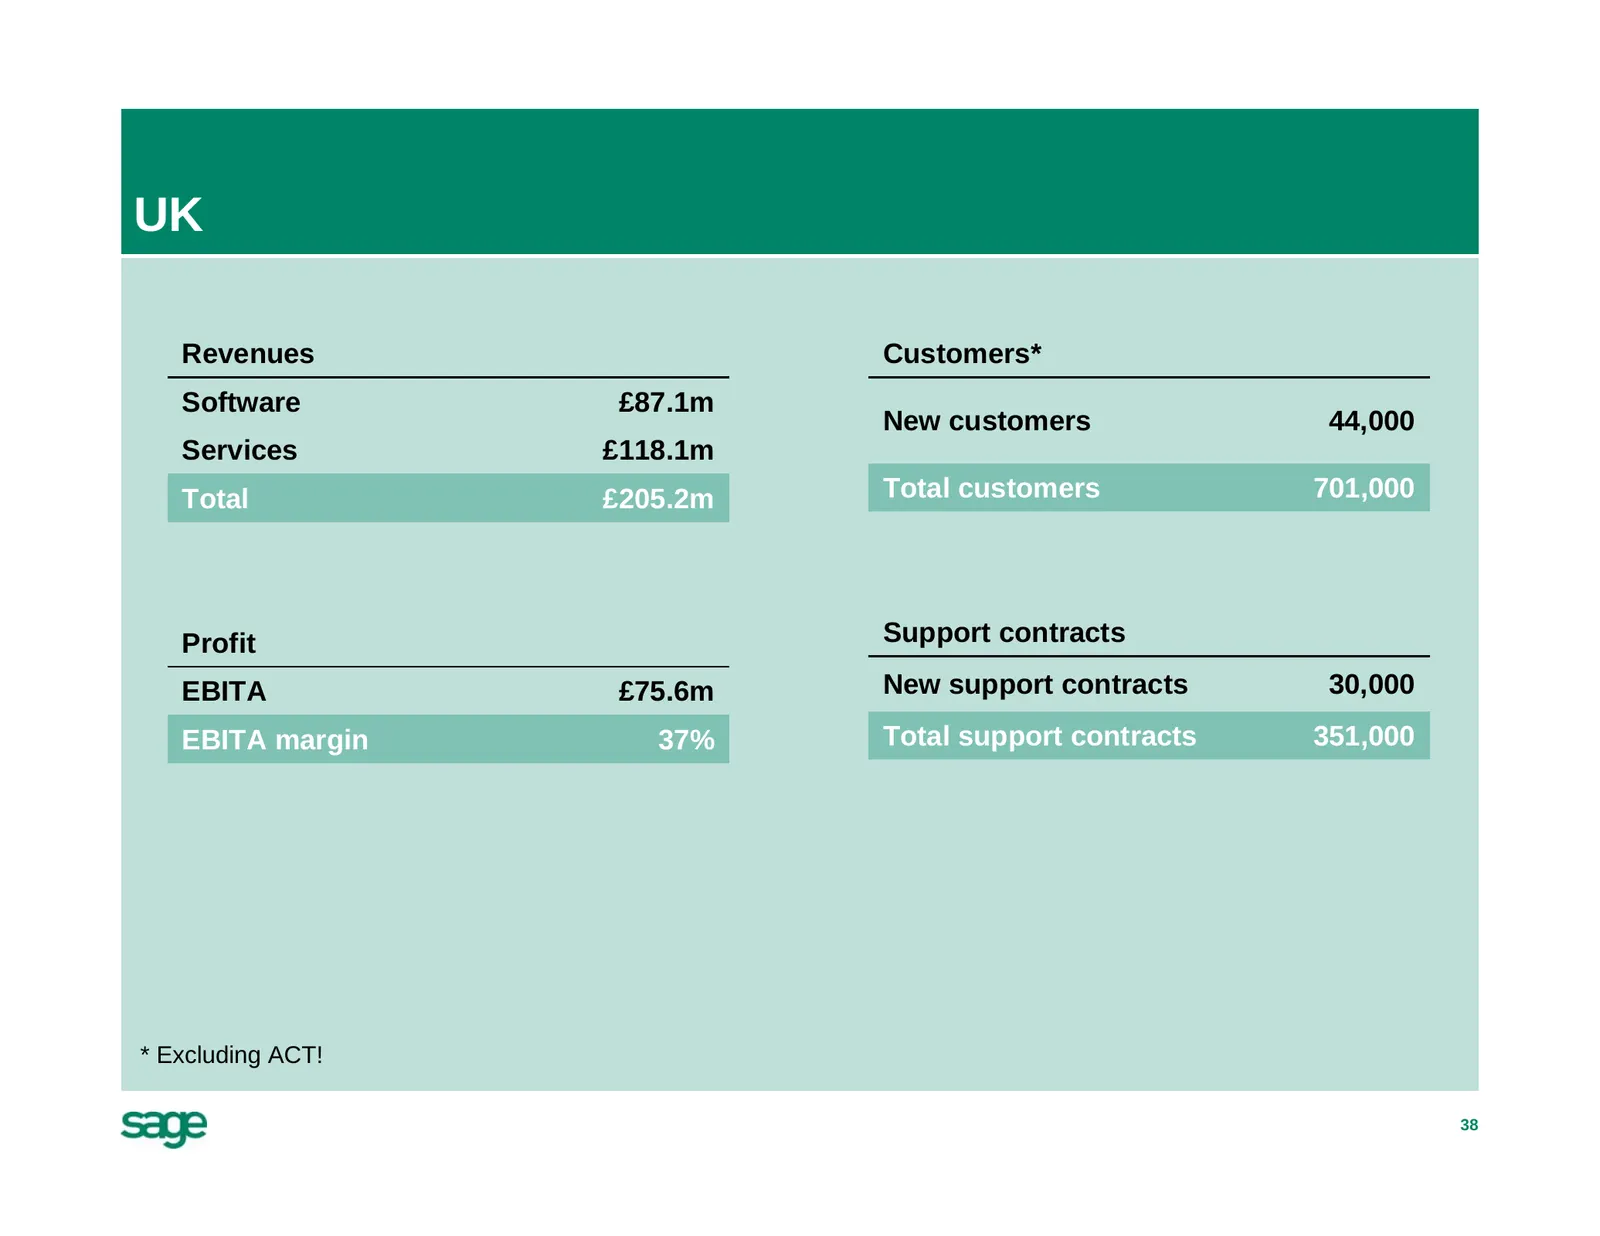
UK Revenues Customers* Software £87.1m New customers 44,000 Services £118.1m Total £205.2m Total customers 701,000 Profit Support contracts EBITA £75.6m New support contracts 30,000 EBITA margin 37% Total support contracts 351,000 * Excluding ACT! 38
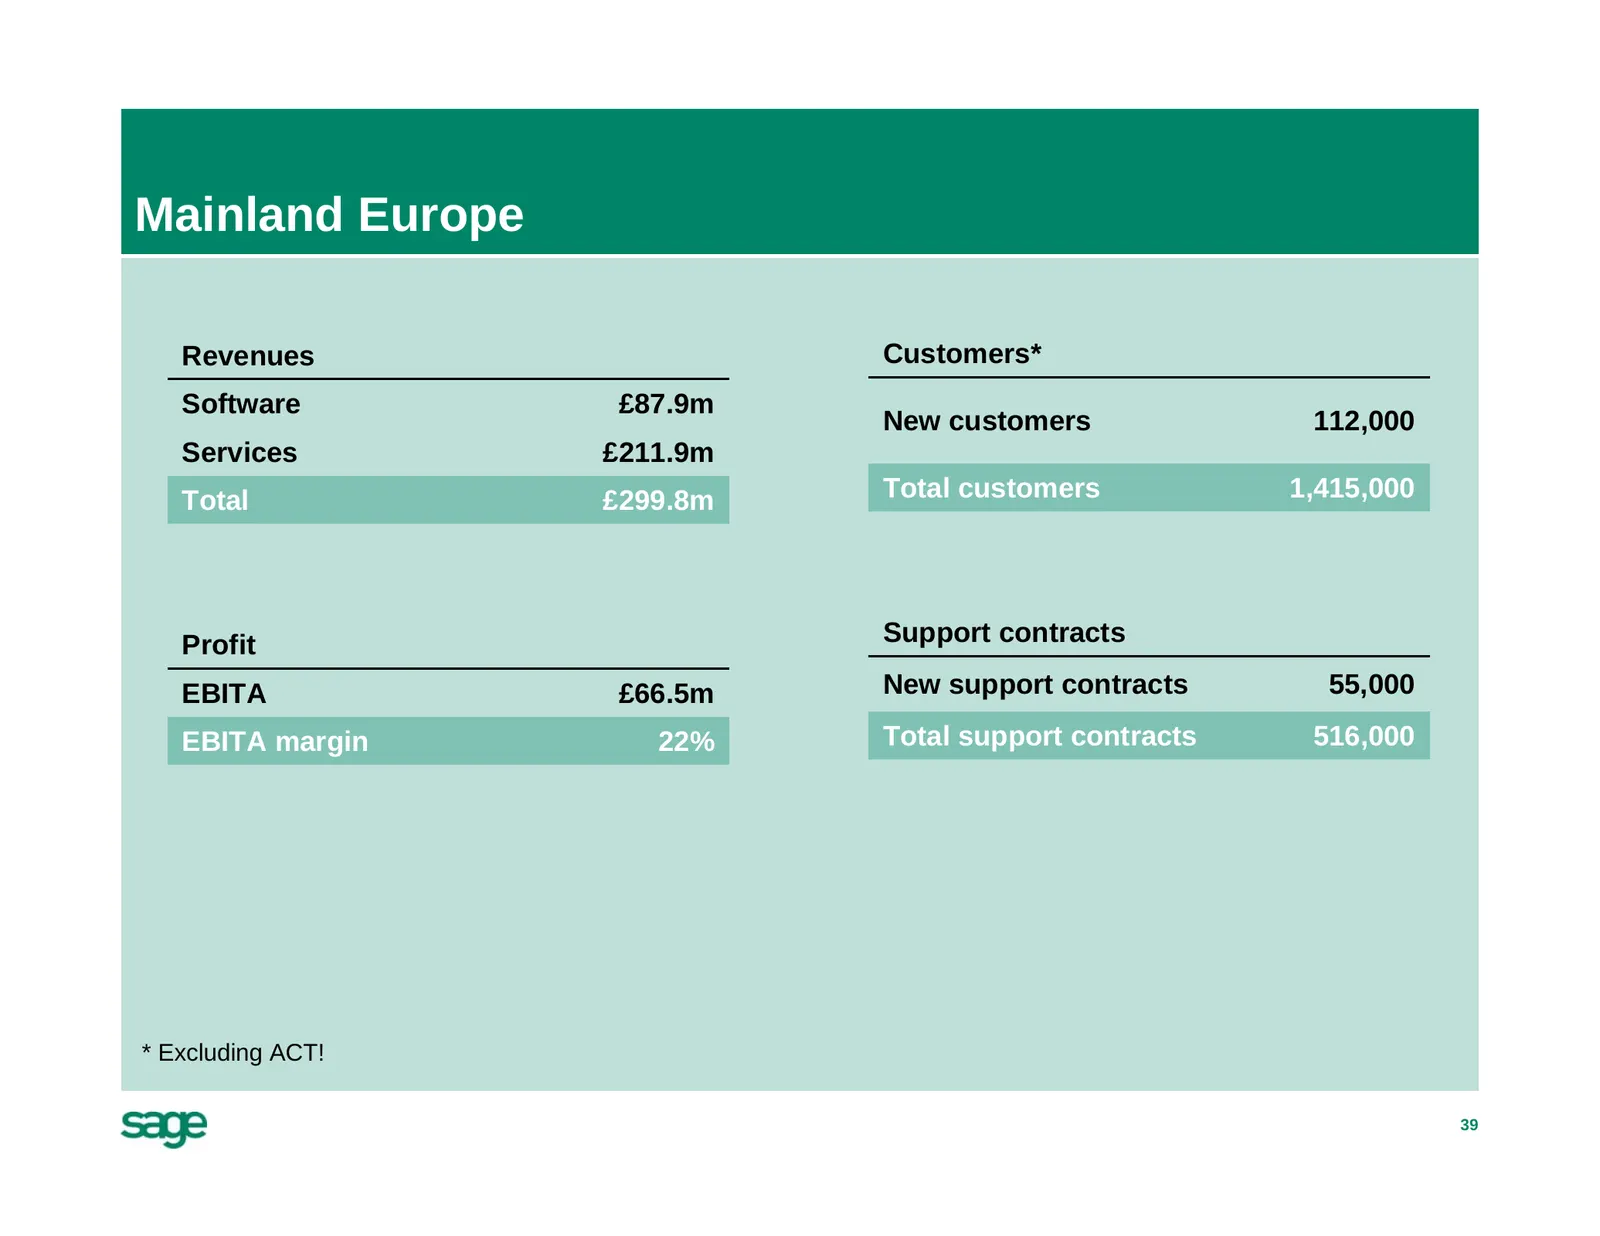
Slide 39: Mainland Europe
Mainland Europe Revenues Customers* Software £87.9m New customers 112,000 Services £211.9m Total £299.8m Total customers 1,415,000 Profit Support contracts EBITA £66.5m New support contracts 55,000 EBITA margin 22% Total support contracts 516,000 * Excluding ACT! 39
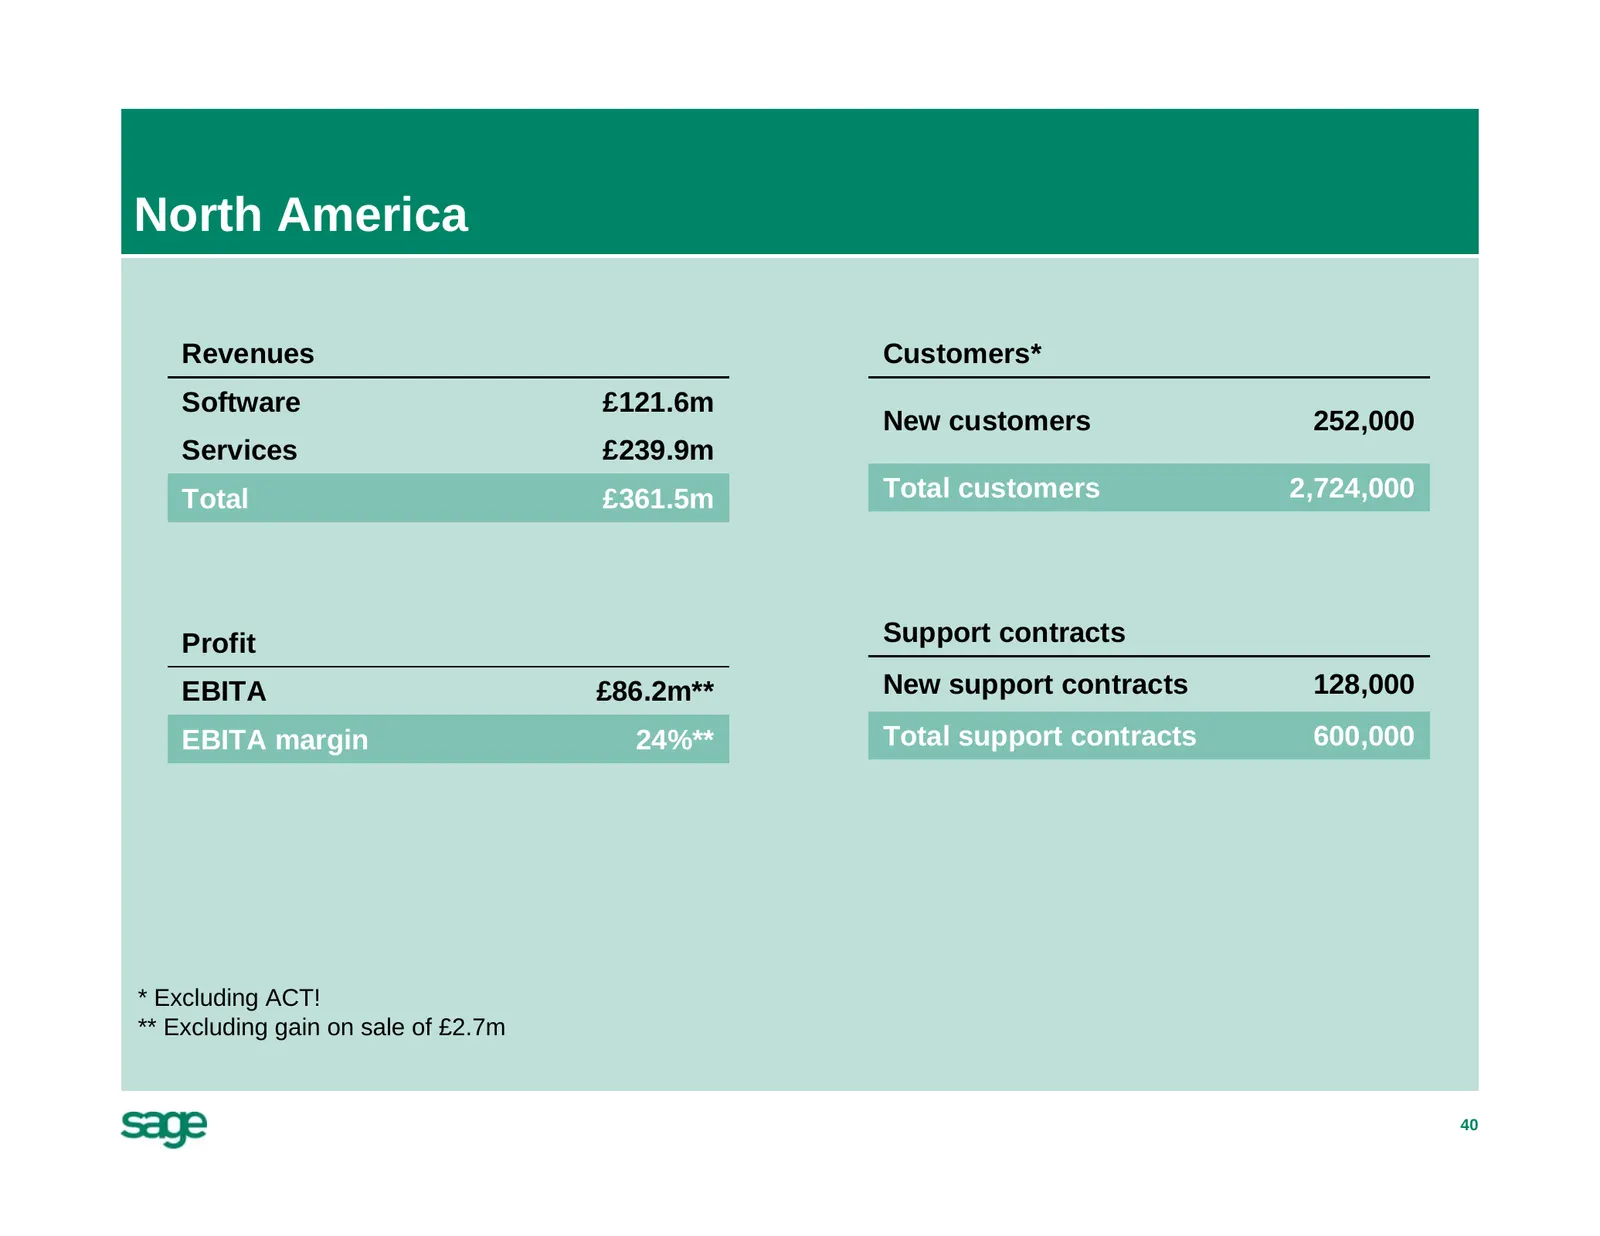
Slide 40: North America
North America Revenues Customers* Software £121.6m New customers 252,000 Services £239.9m Total £361.5m Total customers 2,724,000 Profit Support contracts EBITA £86.2m** New support contracts 128,000 EBITA margin 24%** Total support contracts 600,000 * Excluding ACT! ** Excluding gain on sale of £2.
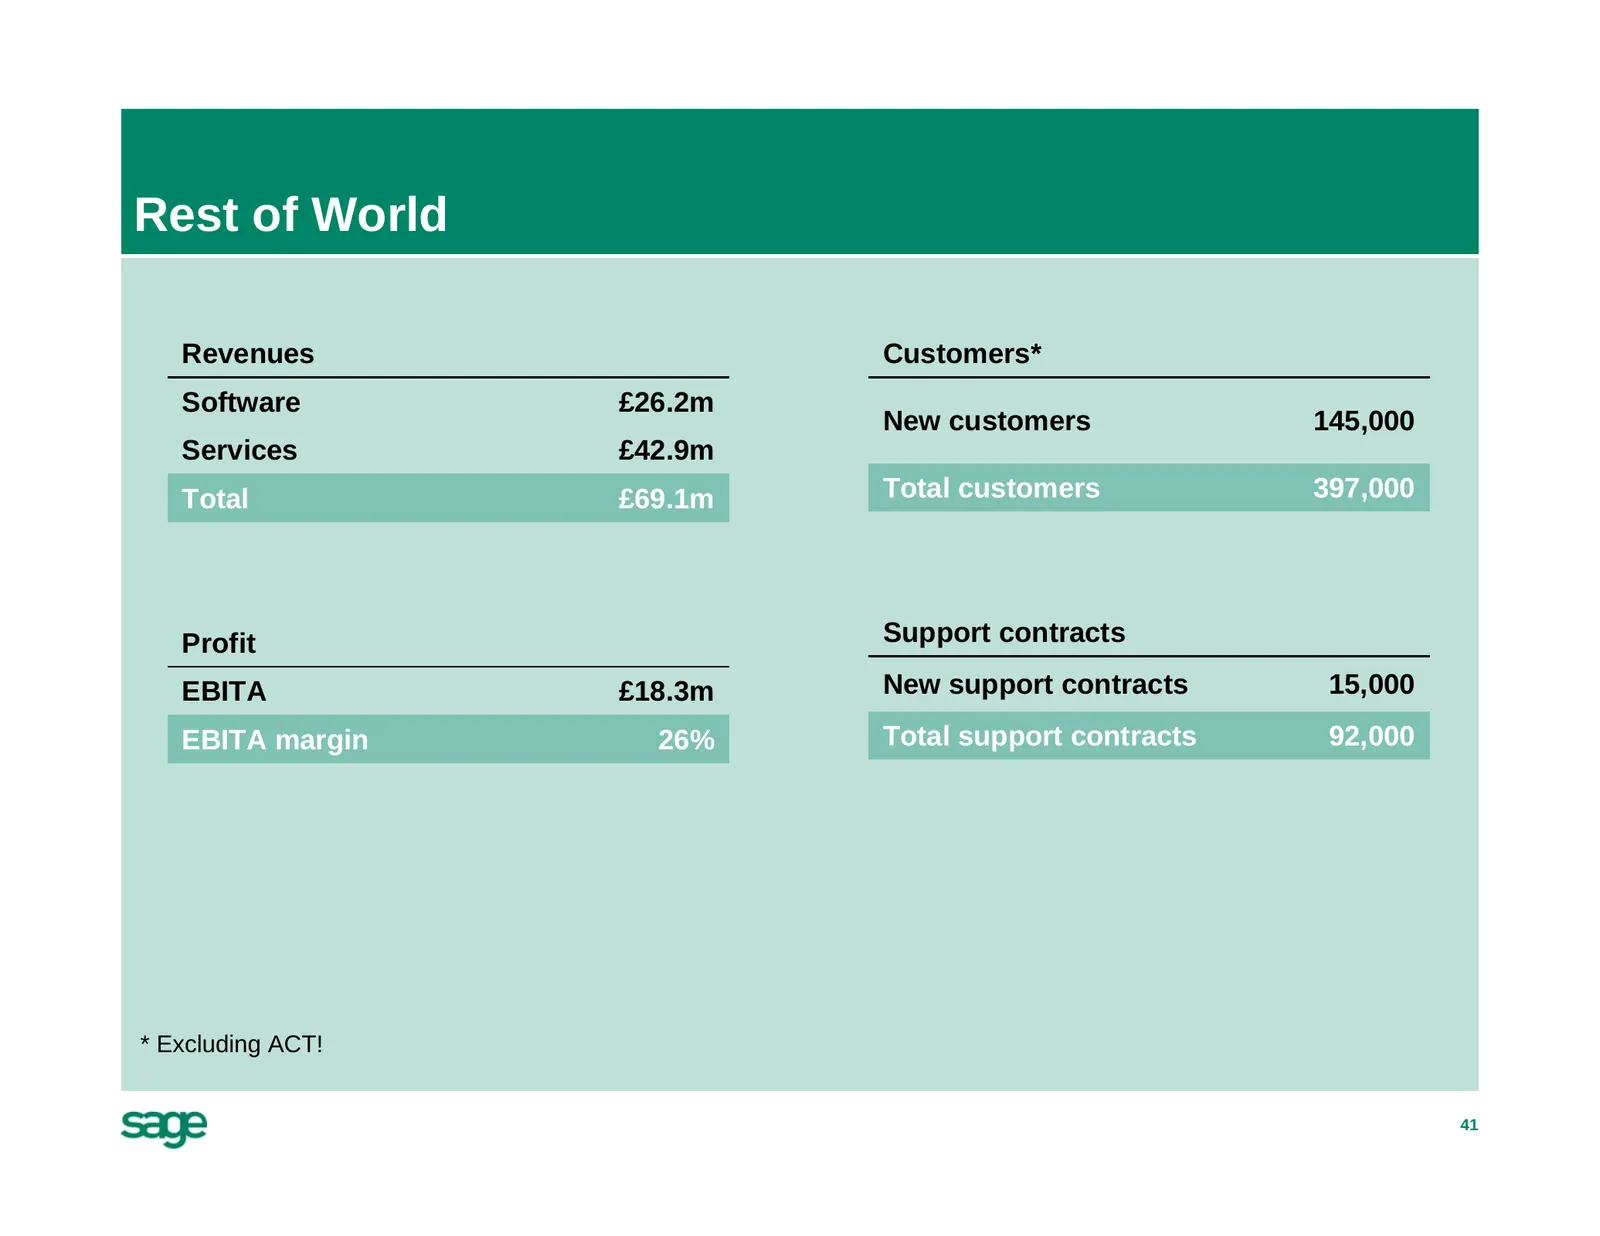
Slide 41: Rest of World
Rest of World Revenues Customers* Software £26.2m New customers 145,000 Services £42.9m Total £69.1m Total customers 397,000 Profit Support contracts EBITA £18.3m New support contracts 15,000 EBITA margin 26% Total support contracts 92,000 * Excluding ACT! 41
Source: Internet Archive copy of investors.sage.com
More decks from Sage Group plc
 H1 2026 Earnings Presentation44 slides · May 21, 2026
 FY2025 Earnings Presentation42 slides · Nov 19, 2025
 H1 2025 Earnings Presentation36 slides · May 15, 2025
 Investor Presentation (March 2025)47 slides · Mar 12, 2025
 FY2024 Earnings Presentation37 slides · Nov 20, 2024
 H1 2024 Earnings Presentation39 slides · May 16, 2024