Vertex Energy — Q4 2019 Earnings Presentation
22 slides from Vertex Energy's earnings presentation, Mar 4, 2020
Slide 1: 4Q19 Conference Call
March 4, 2020 4Q19 Conference Call
Slide 2: Disclaimer
Disclaimer This document may contain forward - looking statements including words such as “may,” “can,” “could,” “should,” “predict,” “aim,” “potential,” “continue,” “opportunity,” “intend,” “goal,” “estimate,” “expect,” “expectations,” “project,” “projections,” “plans,” “anticipates,” “believe,” “t
Slide 3: 4Q19 Results Summary
4Q19 RESULTS SUMMARY
Slide 4: Fourth Quarter 2019 Executive Summary
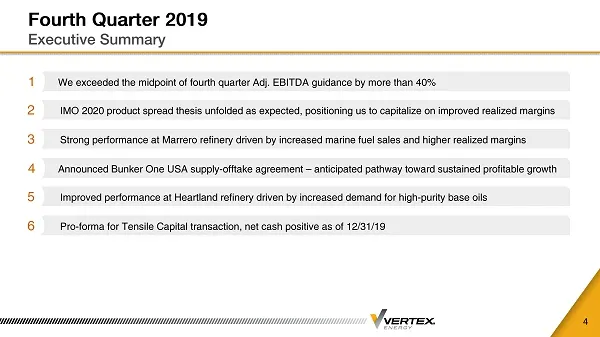
Fourth Quarter 2019 Executive Summary 4 1 4 6 5 We exceeded the midpoint of fourth quarter Adj. EBITDA guidance by more than 40% 1 IMO 2020 product spread thesis unfolded as expected, positioning us to capitalize on improved realized margins 2 Strong performance at Marrero refinery driven by increas
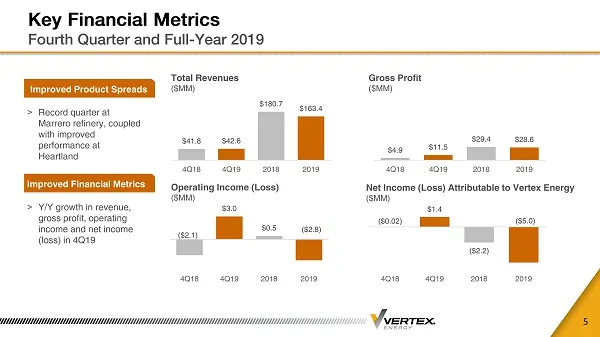
Slide 5: Key Financial Metrics Fourth Quarter and Full-Year 2019
Key Financial Metrics Fourth Quarter and Full - Year 2019 5 Total Revenues ($MM) Gross Profit ($MM) Operating Income (Loss) ($MM) Net Income (Loss) Attributable to Vertex Energy ($MM) > Record quarter at Marrero refinery, coupled with improved performance at Heartland Improved Product Spreads $41.8
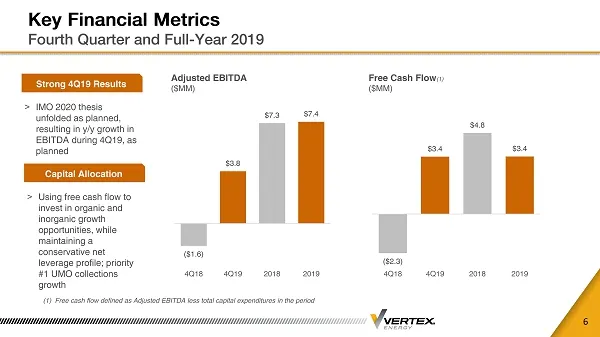
Slide 6: Key Financial Metrics: Adjusted EBITDA and Free Cash Flow
Key Financial Metrics Fourth Quarter and Full - Year 2019 6 Adjusted EBITDA ($MM) Free Cash Flow (1) ($MM) > Using free cash flow to invest in organic and inorganic growth opportunities, while maintaining a conservative net leverage profile; priority #1 UMO collections growth Capital Allocation (1)
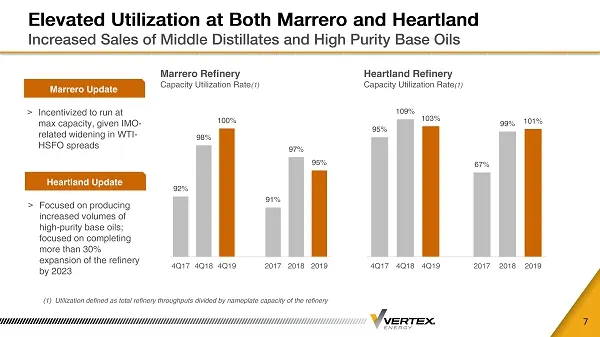
Slide 7: Elevated Utilization at Both Marrero and Heartland
Elevated Utilization at Both Marrero and Heartland Increased Sales of Middle Distillates and High Purity Base Oils 7 (1) Utilization defined as total refinery throughputs divided by nameplate capacity of the refinery Marrero Refinery Capacity Utilization Rate (1) > Incentivized to run at max capacit
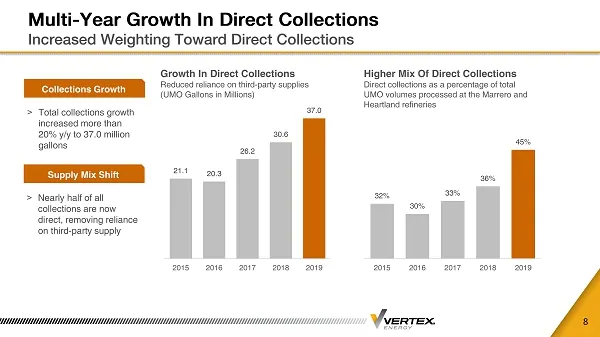
Slide 8: Multi-Year Growth In Direct Collections
Multi - Year Growth In Direct Collections Increased Weighting Toward Direct Collections 8 Growth In Direct Collections Reduced reliance on third - party supplies (UMO Gallons in Millions) 21.1 20.3 26.2 30.6 37.0 2015 2016 2017 2018 2019 > Total collections growth increased more than 20% y/y to 37.0
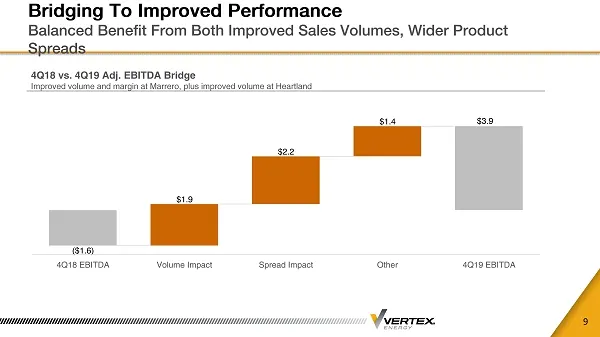
Slide 9: Bridging To Improved Performance
Bridging To Improved Performance Balanced Benefit From Both Improved Sales Volumes, Wider Product Spreads 9 4Q18 vs. 4Q19 Adj. EBITDA Bridge Improved volume and margin at Marrero, plus improved volume at Heartland $3.9
Slide 10: Management Outlook
MANAGEMENT OUTLOOK
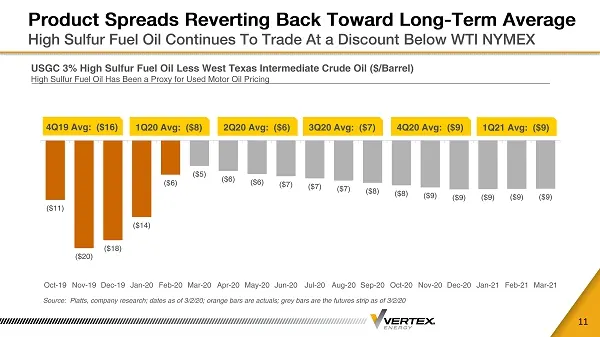
Slide 11: Product Spreads Reverting Back Toward Long-Term Average
Product Spreads Reverting Back Toward Long - Term Average High Sulfur Fuel Oil Continues To Trade At a Discount Below WTI NYMEX 11 USGC 3% High Sulfur Fuel Oil Less West Texas Intermediate Crude Oil ($/Barrel) High Sulfur Fuel Oil Has Been a Proxy for Used Motor Oil Pricing Source: Platts, company r
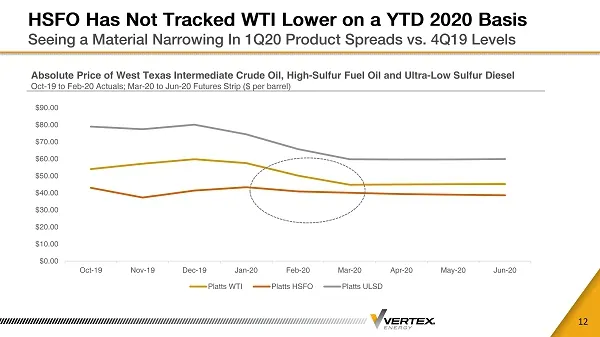
Slide 12: HSFO Has Not Tracked WTI Lower on a YTD 2020 Basis
HSFO Has Not Tracked WTI Lower on a YTD 2020 Basis Seeing a Material Narrowing In 1Q20 Product Spreads vs. 4Q19 Levels 12 Absolute Price of West Texas Intermediate Crude Oil, High - Sulfur Fuel Oil and Ultra - Low Sulfur Diesel Oct - 19 to Feb - 20 Actuals; Mar - 20 to Jun - 20 Futures Strip ($ per
Slide 13: Appendix
Werrex APPENDIX
Slide 14: Corporate Overview
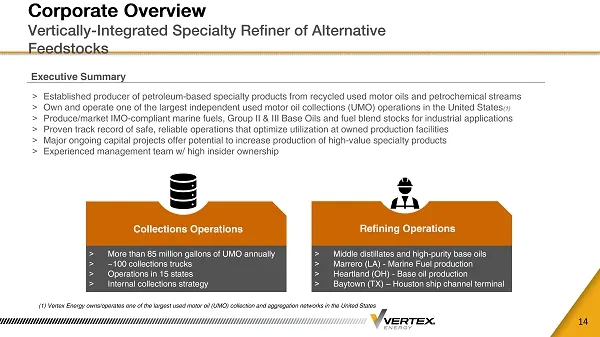
Corporate Overview Vertically - Integrated Specialty Refiner of Alternative Feedstocks 14 > More than 85 million gallons of UMO annually > ~100 collections trucks > Operations in 15 states > Internal collections strategy Collections Operations > Middle distillates and high - purity base oils > Marre
Slide 15: Used Motor Oil Recycling Value Chain
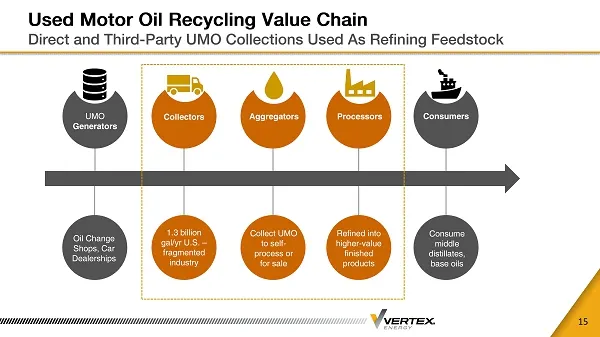
Used Motor Oil Recycling Value Chain Direct and Third - Party UMO Collections Used As Refining Feedstock 15 UMO Generators Collectors Aggregators Processors Consumers Oil Change Shops, Car Dealerships 1.3 billion gal/ yr U.S. – fragmented industry Collect UMO to self - process or for sale Refined in
Slide 16: We Own Advantaged Refining Assets In Strategic Markets
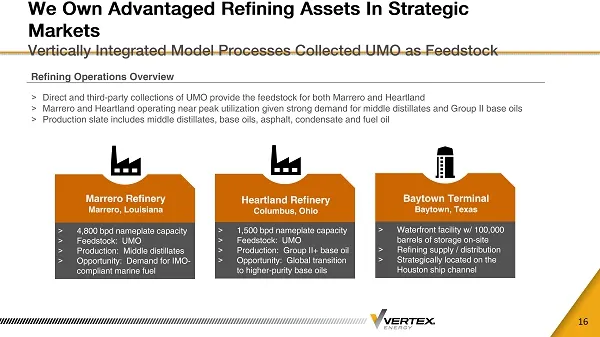
We Own Advantaged Refining Assets In Strategic Markets Vertically Integrated Model Processes Collected UMO as Feedstock 16 > 4,800 bpd nameplate capacity > Feedstock: UMO > Production: Middle distillates > Opportunity: Demand for IMO - compliant marine fuel Marrero Refinery Marrero, Louisiana > 1,50
Slide 17: We Are Focused On High-Grading Our Production Slate
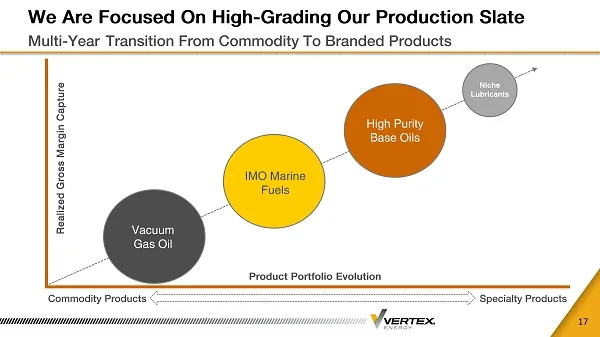
We Are Focused On High - Grading Our Production Slate Multi - Year Transition From Commodity To Branded Products 17 Realized Gross Margin Capture Product Portfolio Evolution Commodity Products Specialty Products Vacuum Gas Oil IMO Marine Fuels High Purity Base Oils Niche Lubricants
Slide 18: CAFE Standards Drive Demand For Higher Purity Base Oils
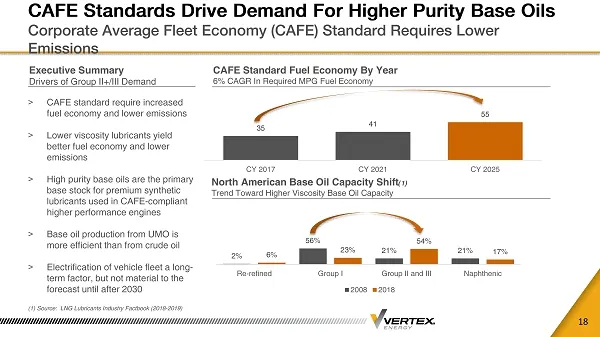
CAFE Standards Drive Demand For Higher Purity Base Oils Corporate Average Fleet Economy (CAFE) Standard Requires Lower Emissions 18 Executive Summary Drivers of Group II+/III Demand CAFE Standard Fuel Economy By Year 6% CAGR In Required MPG Fuel Economy > CAFE standard require increased fuel economy
Slide 19: Compelling Investment Thesis
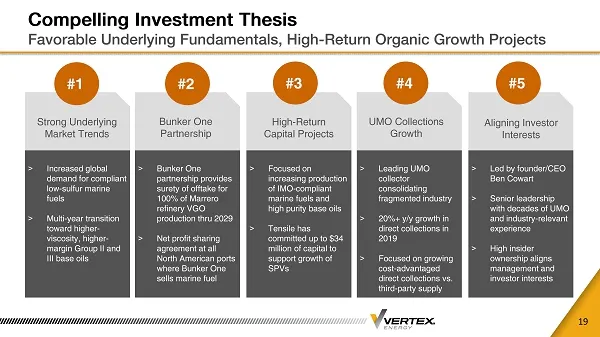
Compelling Investment Thesis Favorable Underlying Fundamentals, High - Return Organic Growth Projects 19 > Increased global demand for compliant low - sulfur marine fuels > Multi - year transition toward higher - viscosity, higher - margin Group II and III base oils Strong Underlying Market Trends >
Slide 20: Tensile Transaction Overview
TENSILE TRANSACTION OVERVIEW
Slide 21: Our Strategic Focus
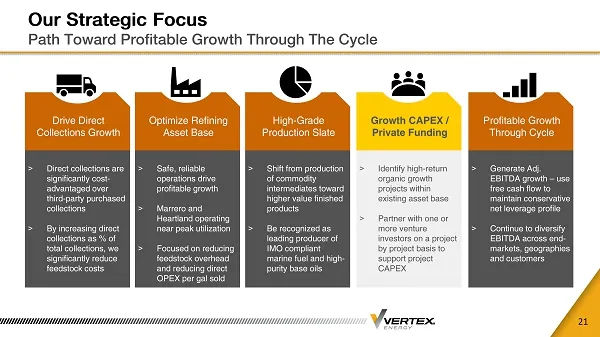
Our Strategic Focus Path Toward Profitable Growth Through The Cycle 21 > Direct collections are significantly cost - advantaged over third - party purchased collections > By increasing direct collections as % of total collections, we significantly reduce feedstock costs Drive Direct Collections Grow
Slide 22: Superior Project Economics Underpin Heartland Investment
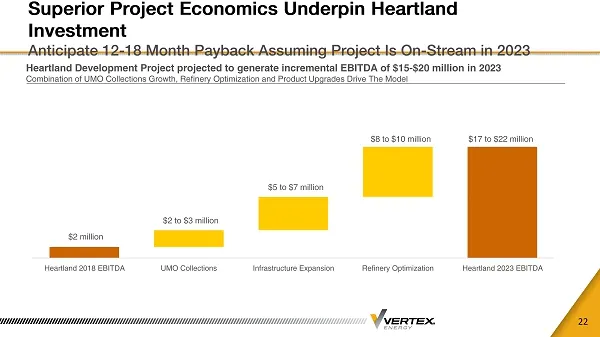
22 Superior Project Economics Underpin Heartland Investment Anticipate 12 - 18 Month Payback Assuming Project Is On - Stream in 2023 Heartland Development Project projected to generate incremental EBITDA of $15 - $20 million in 2023 Combination of UMO Collections Growth, Refinery Optimization and Pr
Source: SEC EDGAR · 8-K filed Mar 4, 2020
More decks from Vertex Energy Inc
 Q2 2024 Earnings Presentation21 slides · Aug 8, 2024
 Q1 2024 Earnings Presentation20 slides · May 9, 2024
 Q4 2023 Earnings Presentation29 slides · Feb 28, 2024
 Q3 2023 Earnings Presentation27 slides · Nov 7, 2023
 Q2 2023 Earnings Presentation26 slides · Aug 9, 2023
 Q1 2023 Earnings Presentation26 slides · May 9, 2023