Rexel SA · EURONEXT:RXL
Rexel SA — FY2014 Earnings Presentation
71 slides from Rexel SA's earnings presentation, Feb 12, 2015
Slide 1: Q4 & FY 2014 Results
Q4 & FY 2014 RESULTS February 12, 2015 Consolidated financial statements as of December 31, 2014 were authorized for issue by the Board of Directors held on February 11, 2015. They have been audited by statutory auditors.
Slide 2: Summary
Summary 1. Q4 & FY 2014 Results: In line with targets 2. 2015 business priorities: Focused on execution 3. Update on portfolio review: Targeted disposals to improve performance 4. Organizational update: Streamlined management structure 5. Focus on Europe and North America 6. 2015 outlook 2
Slide 3: Q4 & FY 2014 Results
1 » Q4&FY 2014 RESULTS RexeL fe a world of energy ENERG) IN MOTION
Slide 4: Q4 2014 highlights
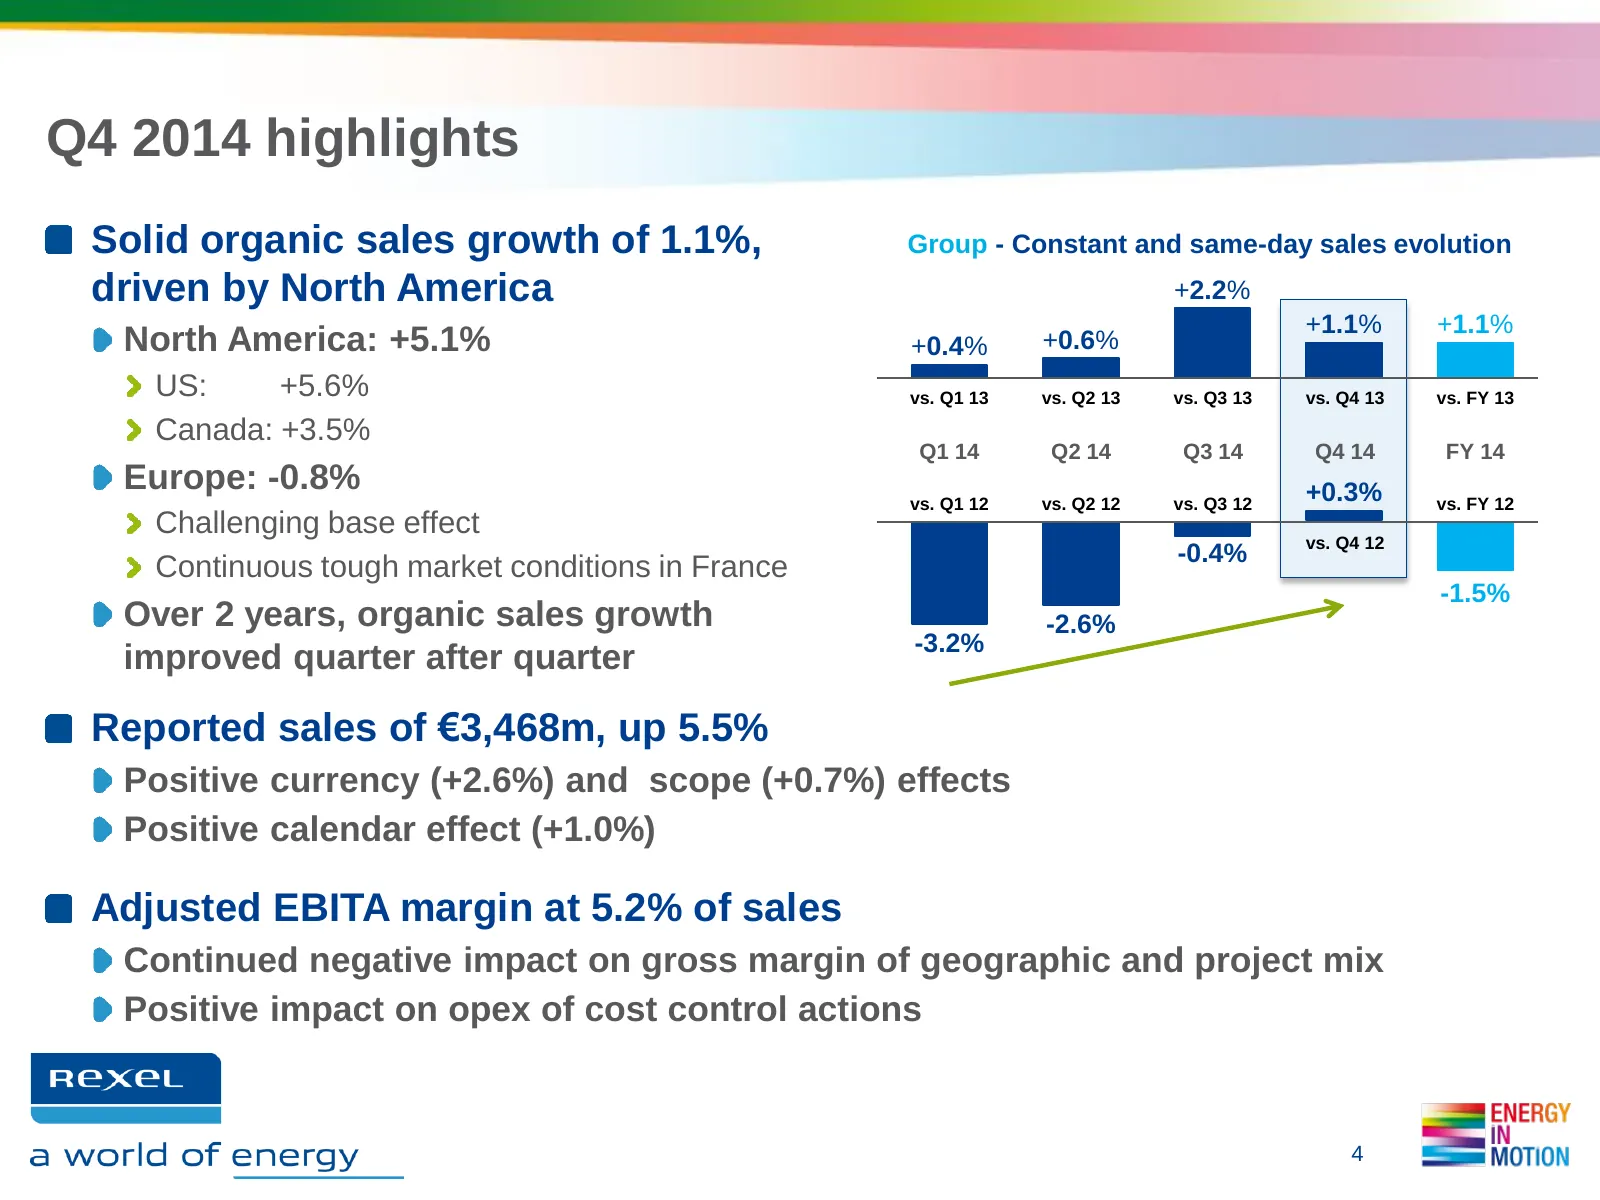
Q4 2014 highlights Solid organic sales growth of 1.1%, Group - Constant and same-day sales evolution driven by North America +2.2% +1.1% +1.1% North America: +5.1% +0.4% +0.6% US: +5.6% vs. Q1 13 vs. Q2 13 vs. Q3 13 vs. Q4 13 vs. FY 13 Canada: +3.5% Q1 14 Q2 14 Q3 14 Q4 14 FY 14 Europe: -0.8% +0.3%
Slide 5: FY2014 results in line with targets
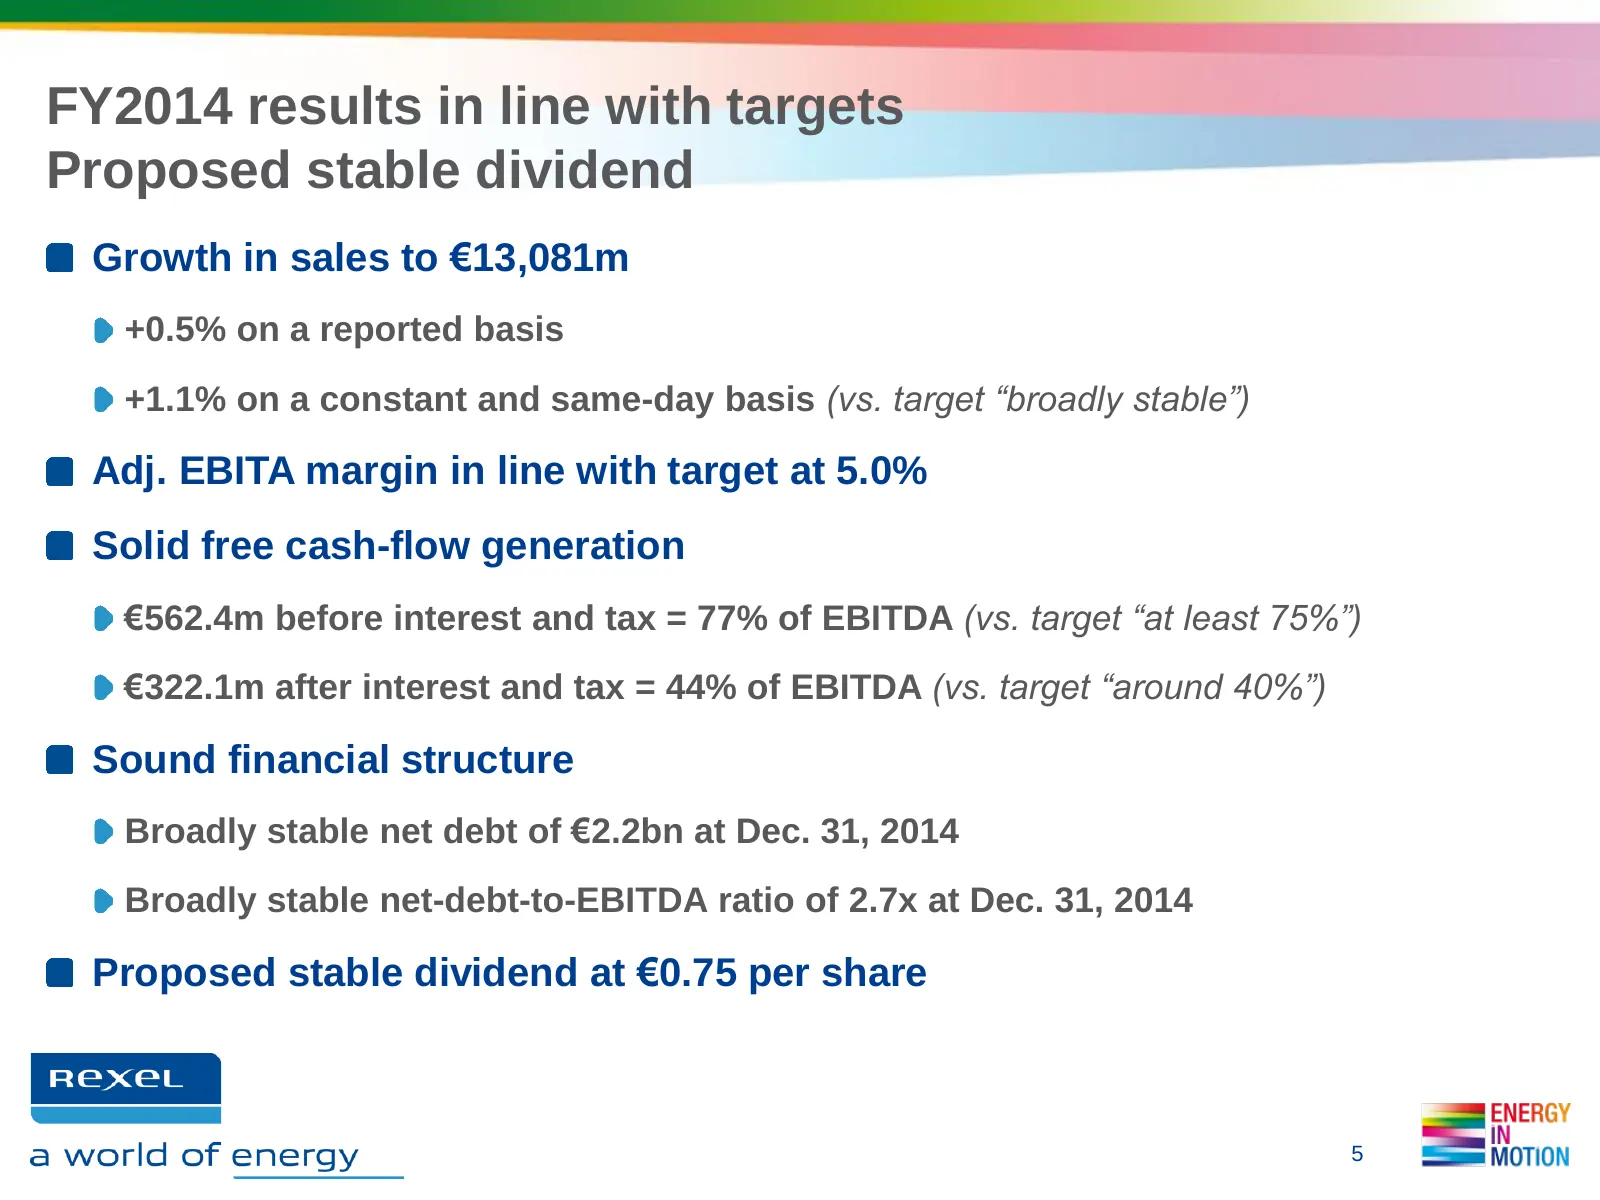
FY2014 results in line with targets Proposed stable dividend Growth in sales to €13,081m +0.5% on a reported basis +1.1% on a constant and same-day basis (vs. target “broadly stable”) Adj. EBITA margin in line with target at 5.0% Solid free cash-flow generation €562.4m before interest and tax = 77%
Slide 6: Europe: Q4 sales reflected challenging base effect and tough market conditions in France
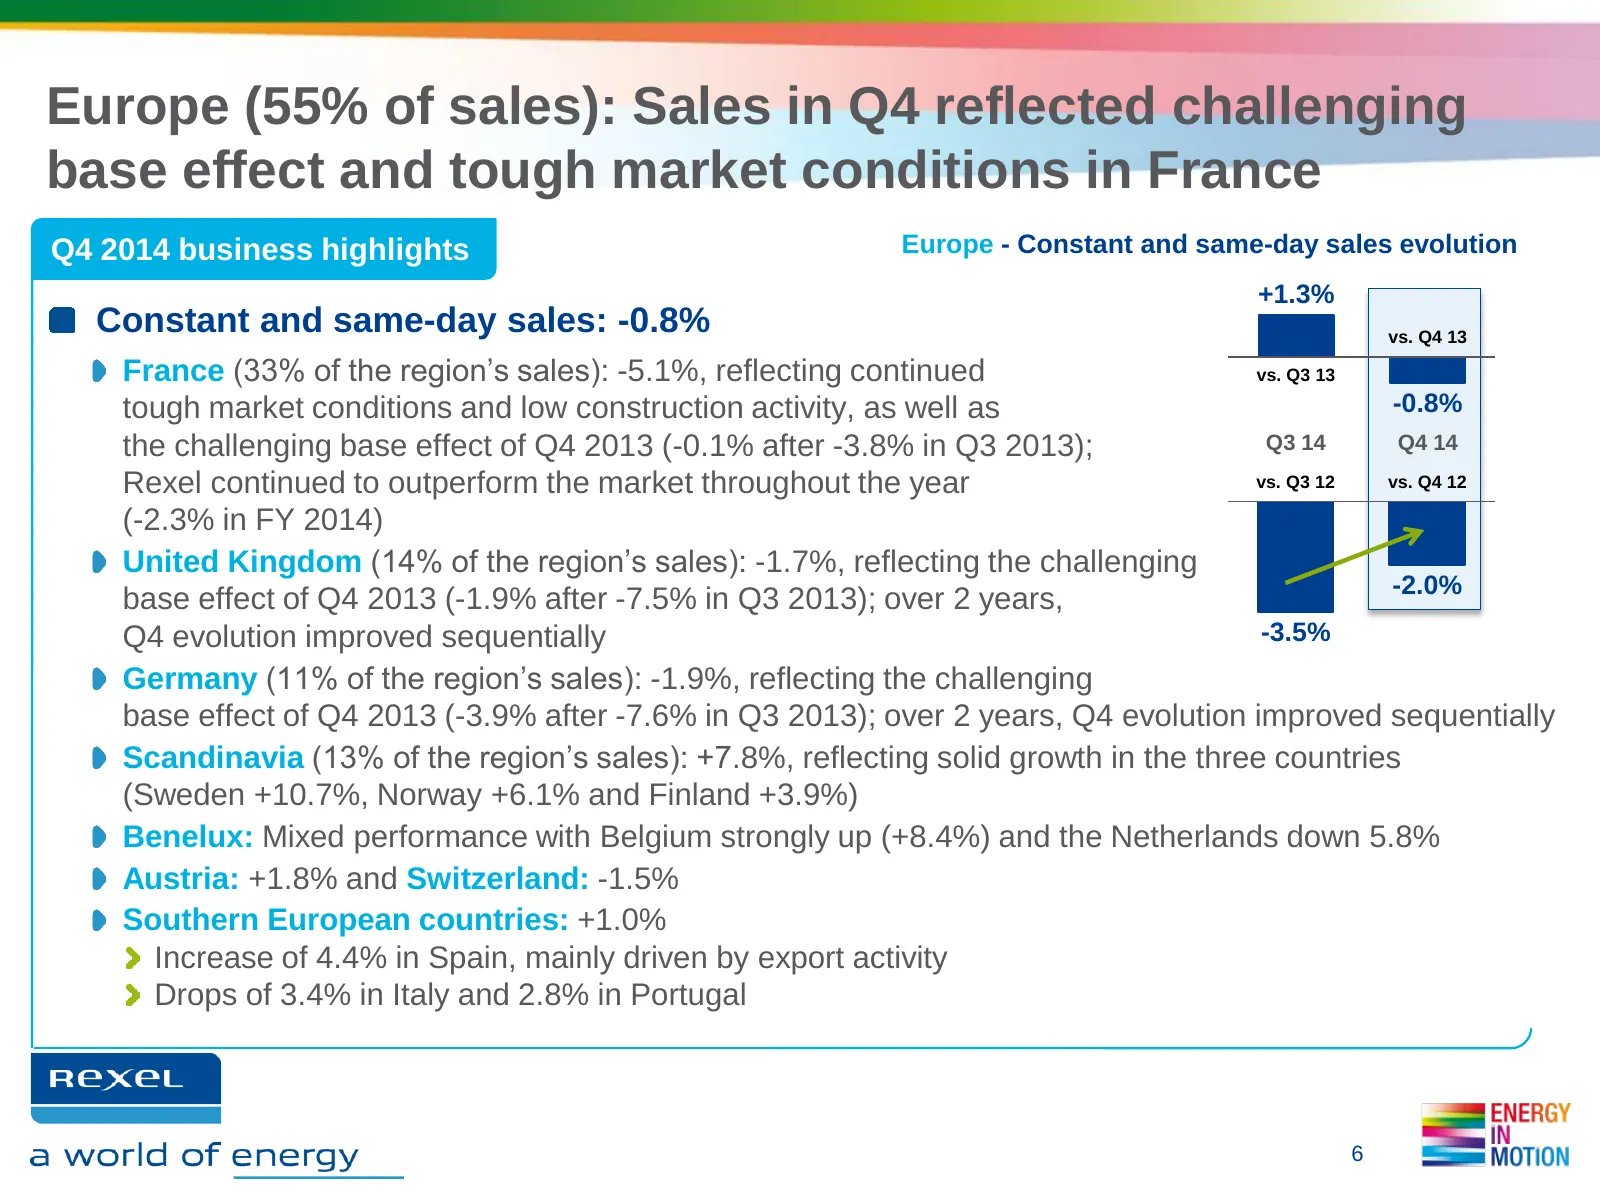
Europe (55% of sales): Sales in Q4 reflected challenging base effect and tough market conditions in France Q4 2014 business highlights Europe - Constant and same-day sales evolution +1.3% Constant and same-day sales: -0.8% vs. Q4 13 France (33% of the region’s sales): -5.1%, reflecting continued vs.
Slide 7: Europe: Sales growth and resilient profitability
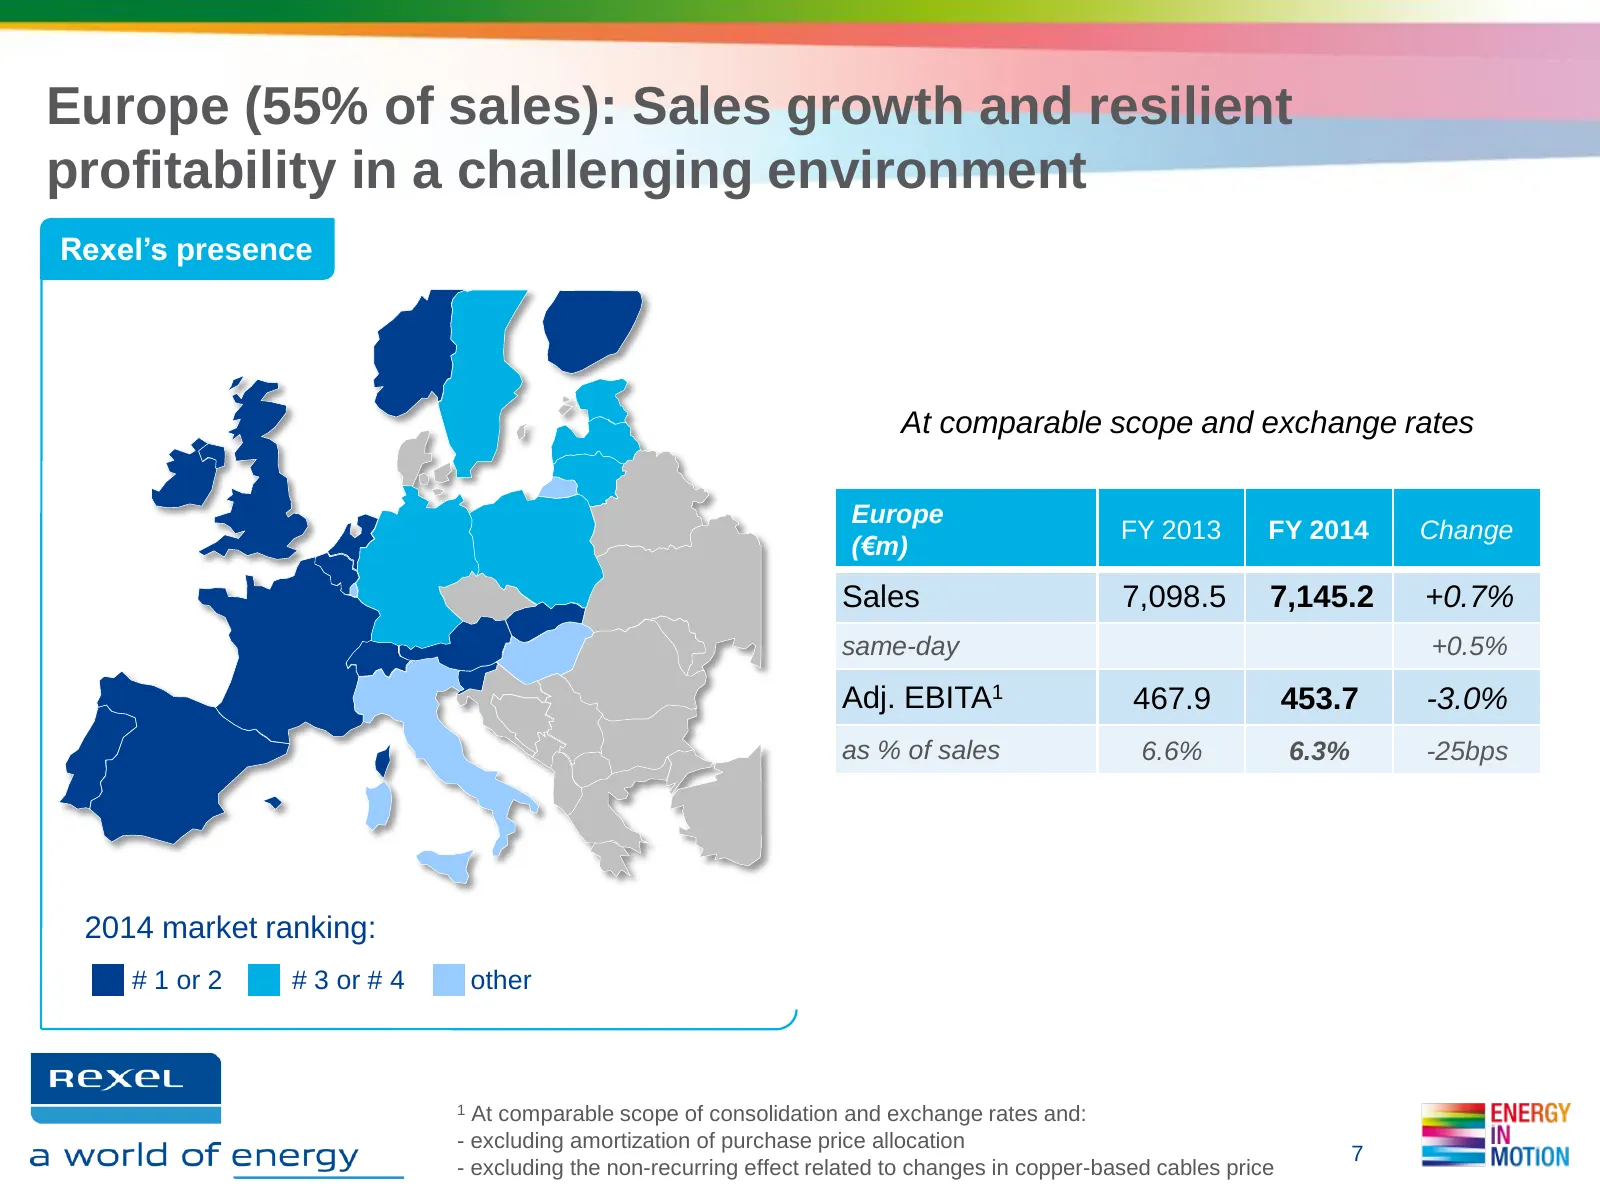
Europe (55% of sales): Sales growth and resilient profitability in a challenging environment Rexel’s presence At comparable scope and exchange rates Europe FY 2013 FY 2014 Change (€m) Sales 7,098.5 7,145.2 +0.7% same-day +0.5% Adj. EBITA1 467.9 453.7 -3.0% as % of sales 6.6% 6.3% -25bps 2014 market
Slide 8: North America: Q4 sales driven by US non-residential recovery
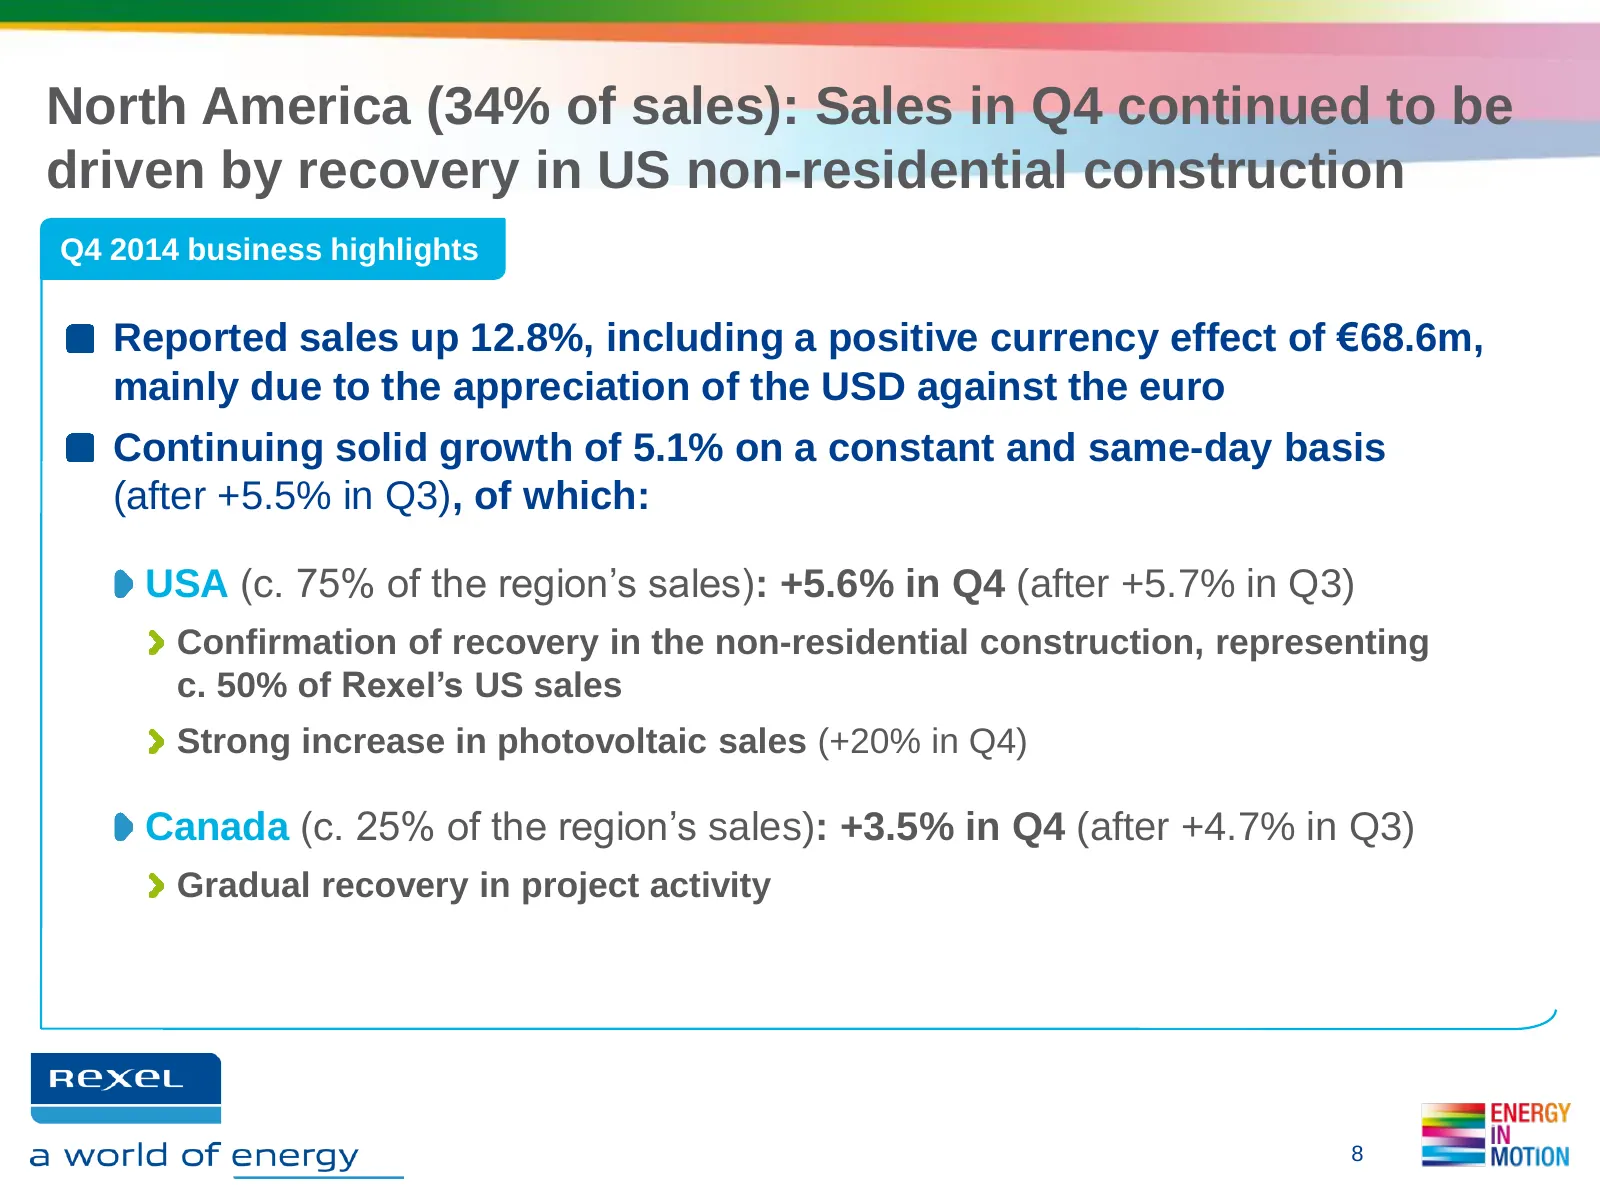
North America (34% of sales): Sales in Q4 continued to be driven by recovery in US non-residential construction Q4 2014 business highlights Reported sales up 12.8%, including a positive currency effect of €68.6m, mainly due to the appreciation of the USD against the euro Continuing solid growth of 5
Slide 9: North America: Sales growth in both countries
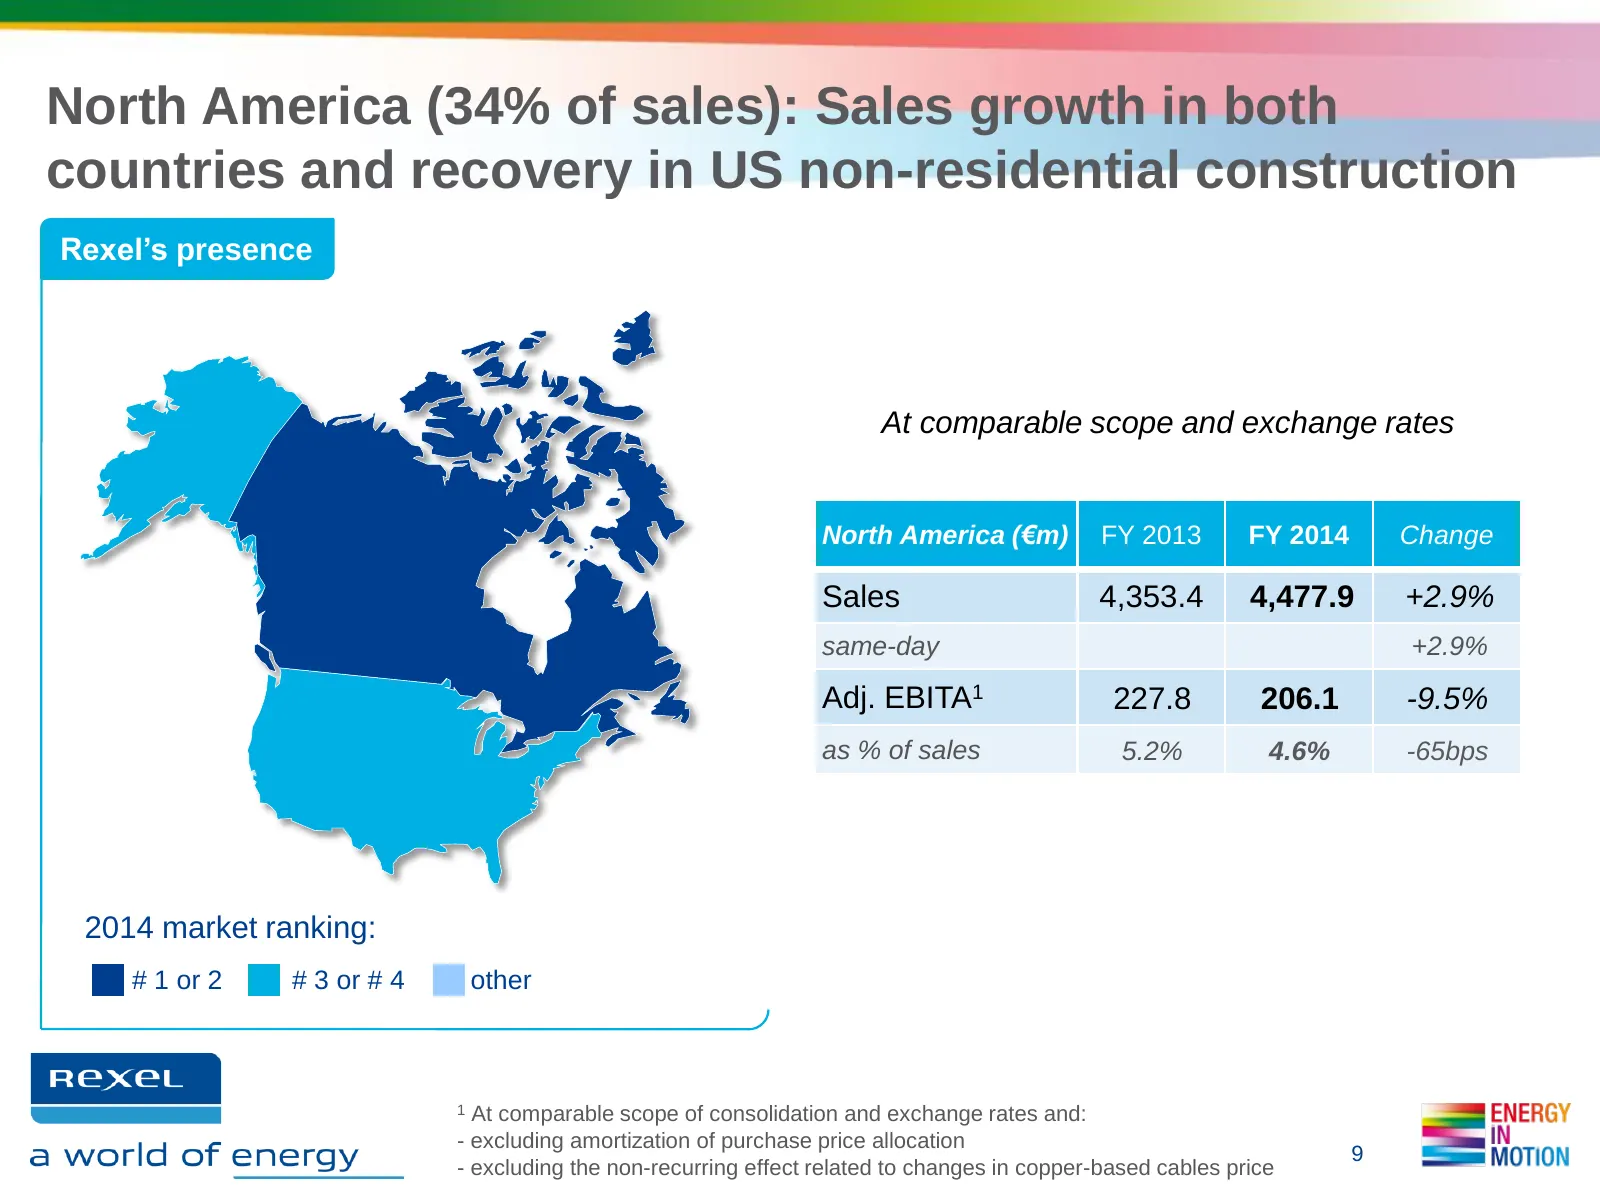
North America (34% of sales): Sales growth in both countries and recovery in US non-residential construction Rexel’s presence At comparable scope and exchange rates North America (€m) FY 2013 FY 2014 Change Sales 4,353.4 4,477.9 +2.9% same-day +2.9% Adj. EBITA1 227.8 206.1 -9.5% as % of sales 5.2% 4
Slide 10: Asia-Pacific: Q4 sales growth in Asia, Pacific negative
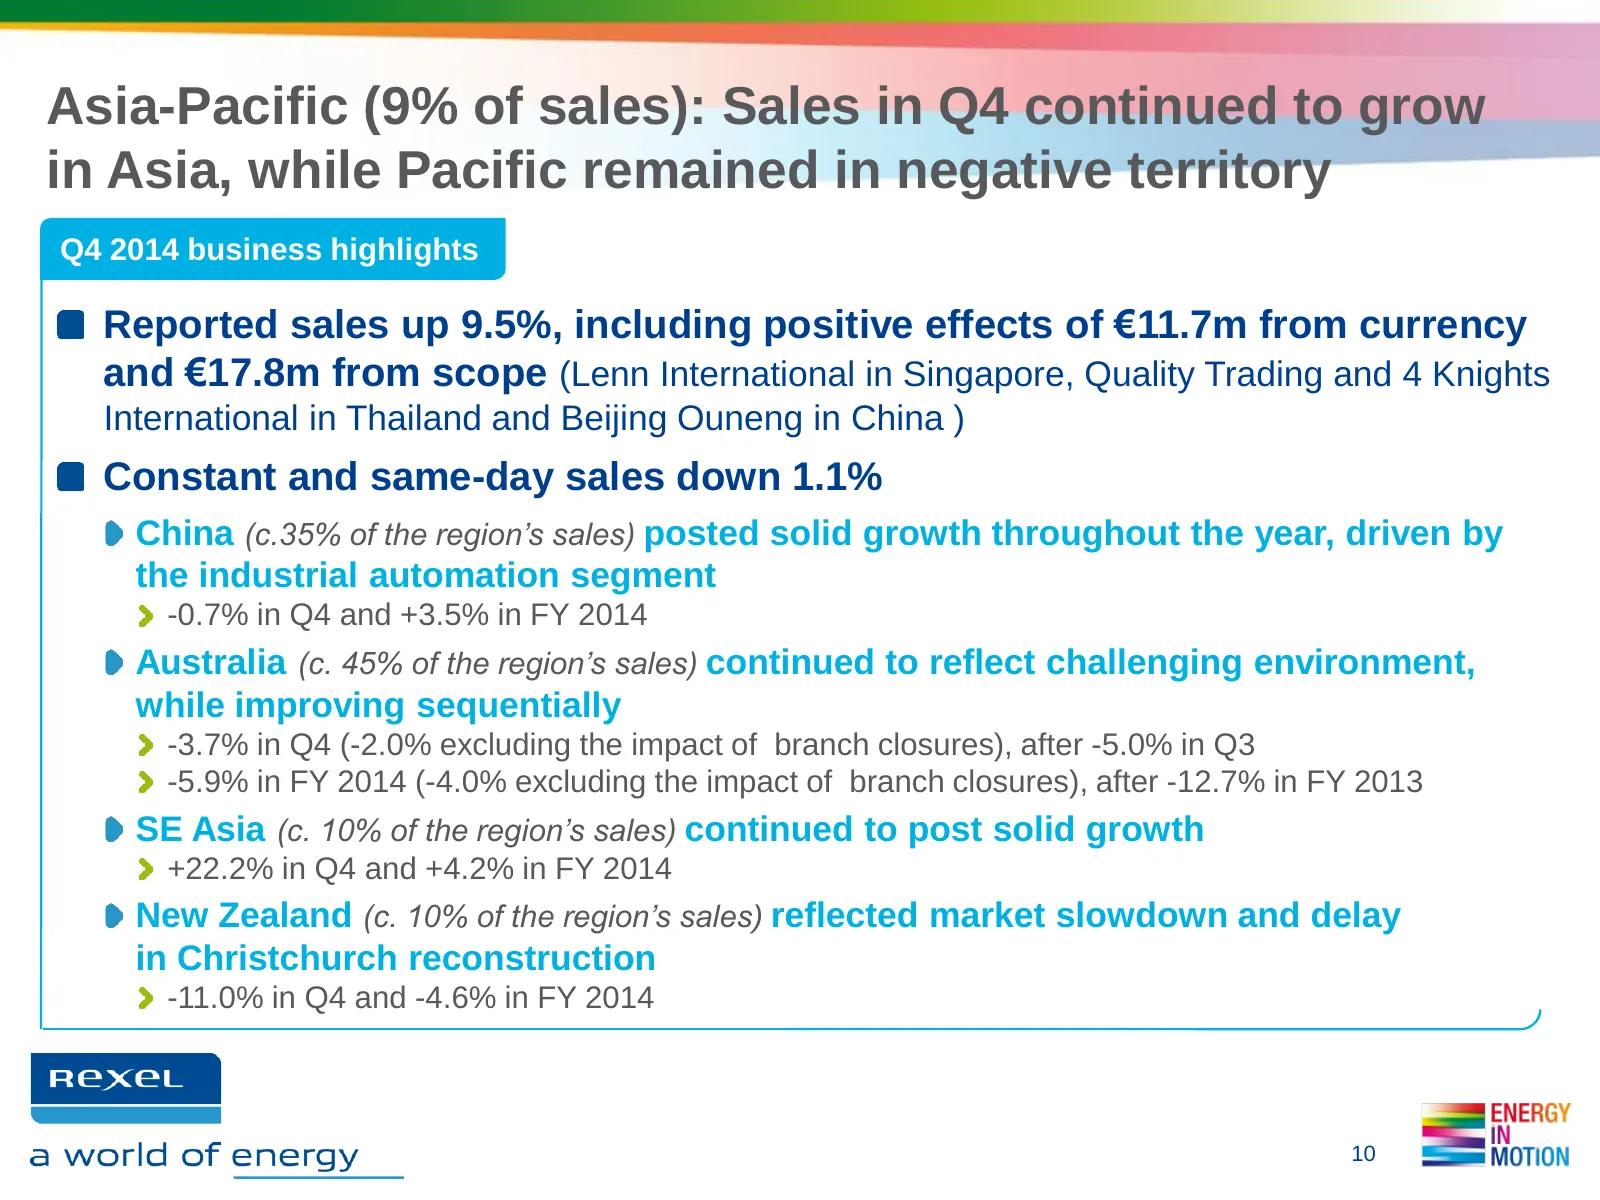
Asia-Pacific (9% of sales): Sales in Q4 continued to grow in Asia, while Pacific remained in negative territory Q4 2014 business highlights Reported sales up 9.5%, including positive effects of €11.7m from currency and €17.8m from scope (Lenn International in Singapore, Quality Trading and 4 Knights
Slide 11: Asia-Pacific: Solid Asia, persistent weakness in Pacific
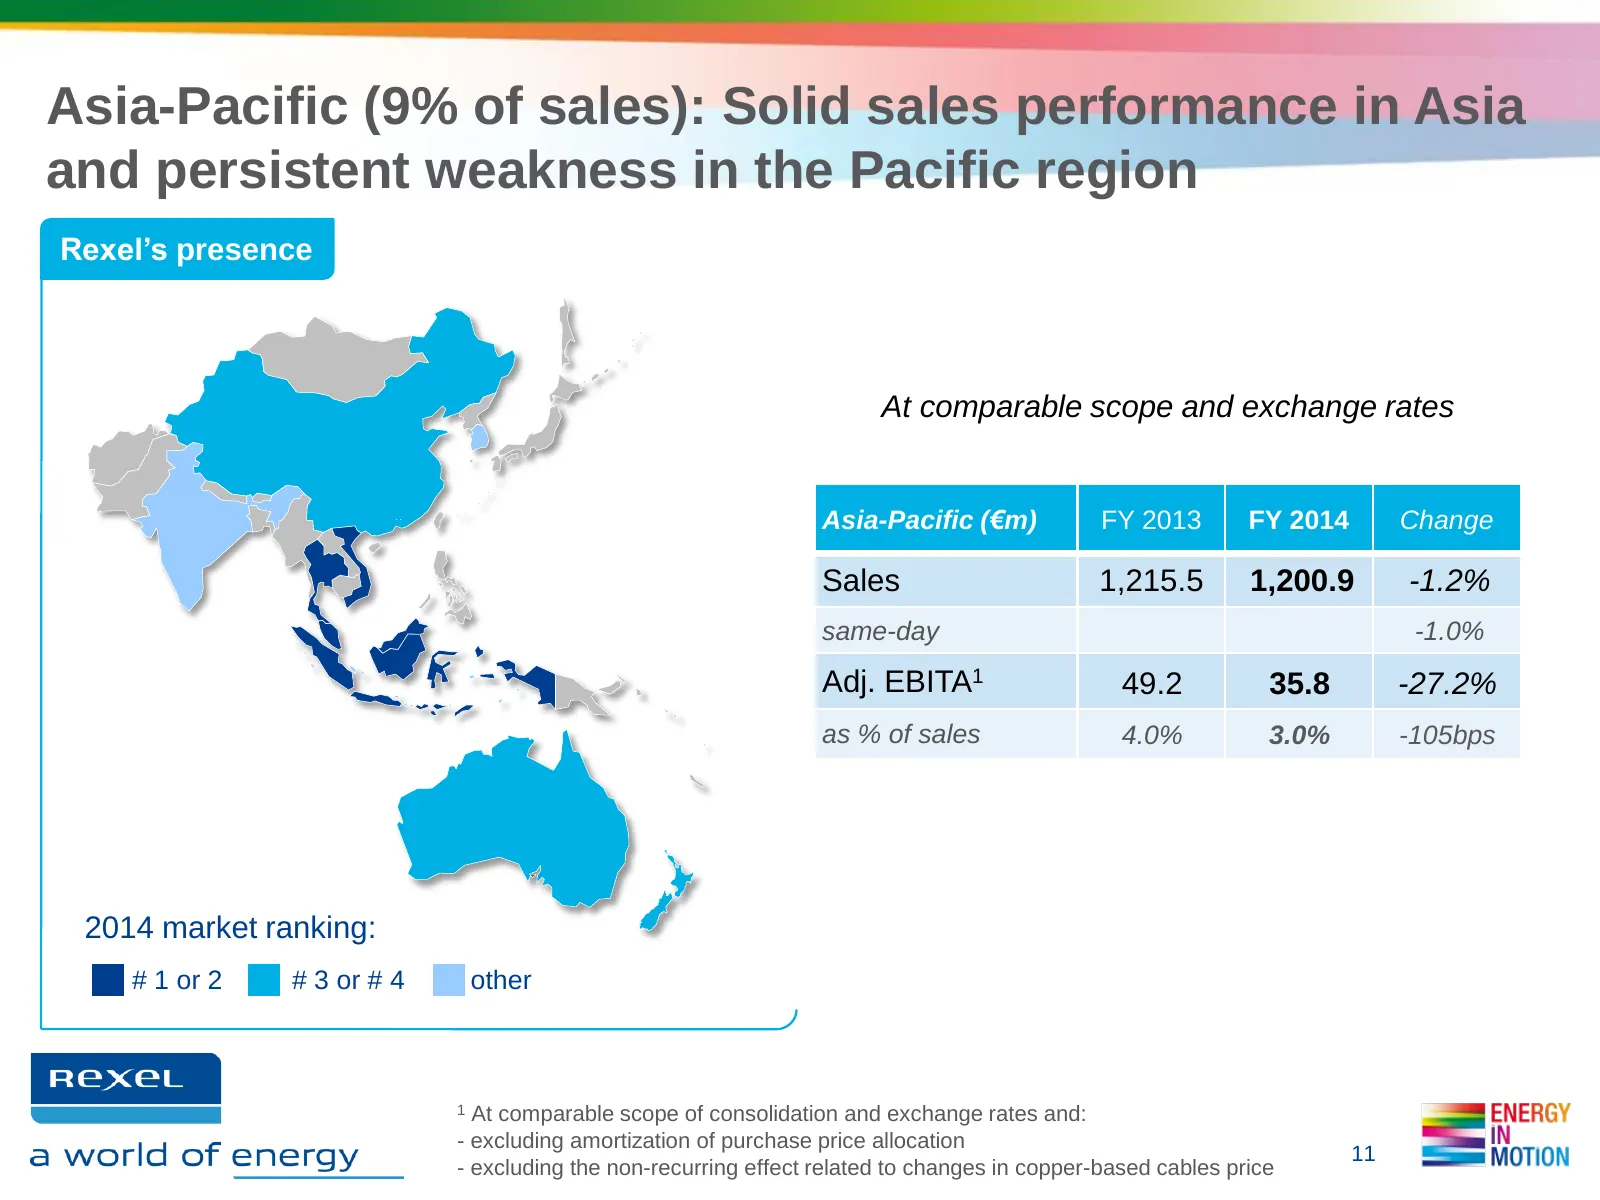
Asia-Pacific (9% of sales): Solid sales performance in Asia and persistent weakness in the Pacific region Rexel’s presence At comparable scope and exchange rates Asia-Pacific (€m) FY 2013 FY 2014 Change Sales 1,215.5 1,200.9 -1.2% same-day -1.0% Adj. EBITA1 49.2 35.8 -27.2% as % of sales 4.0% 3.0% -
Slide 12: Latin America: Q4 sales negative, impacted by mining in Chile
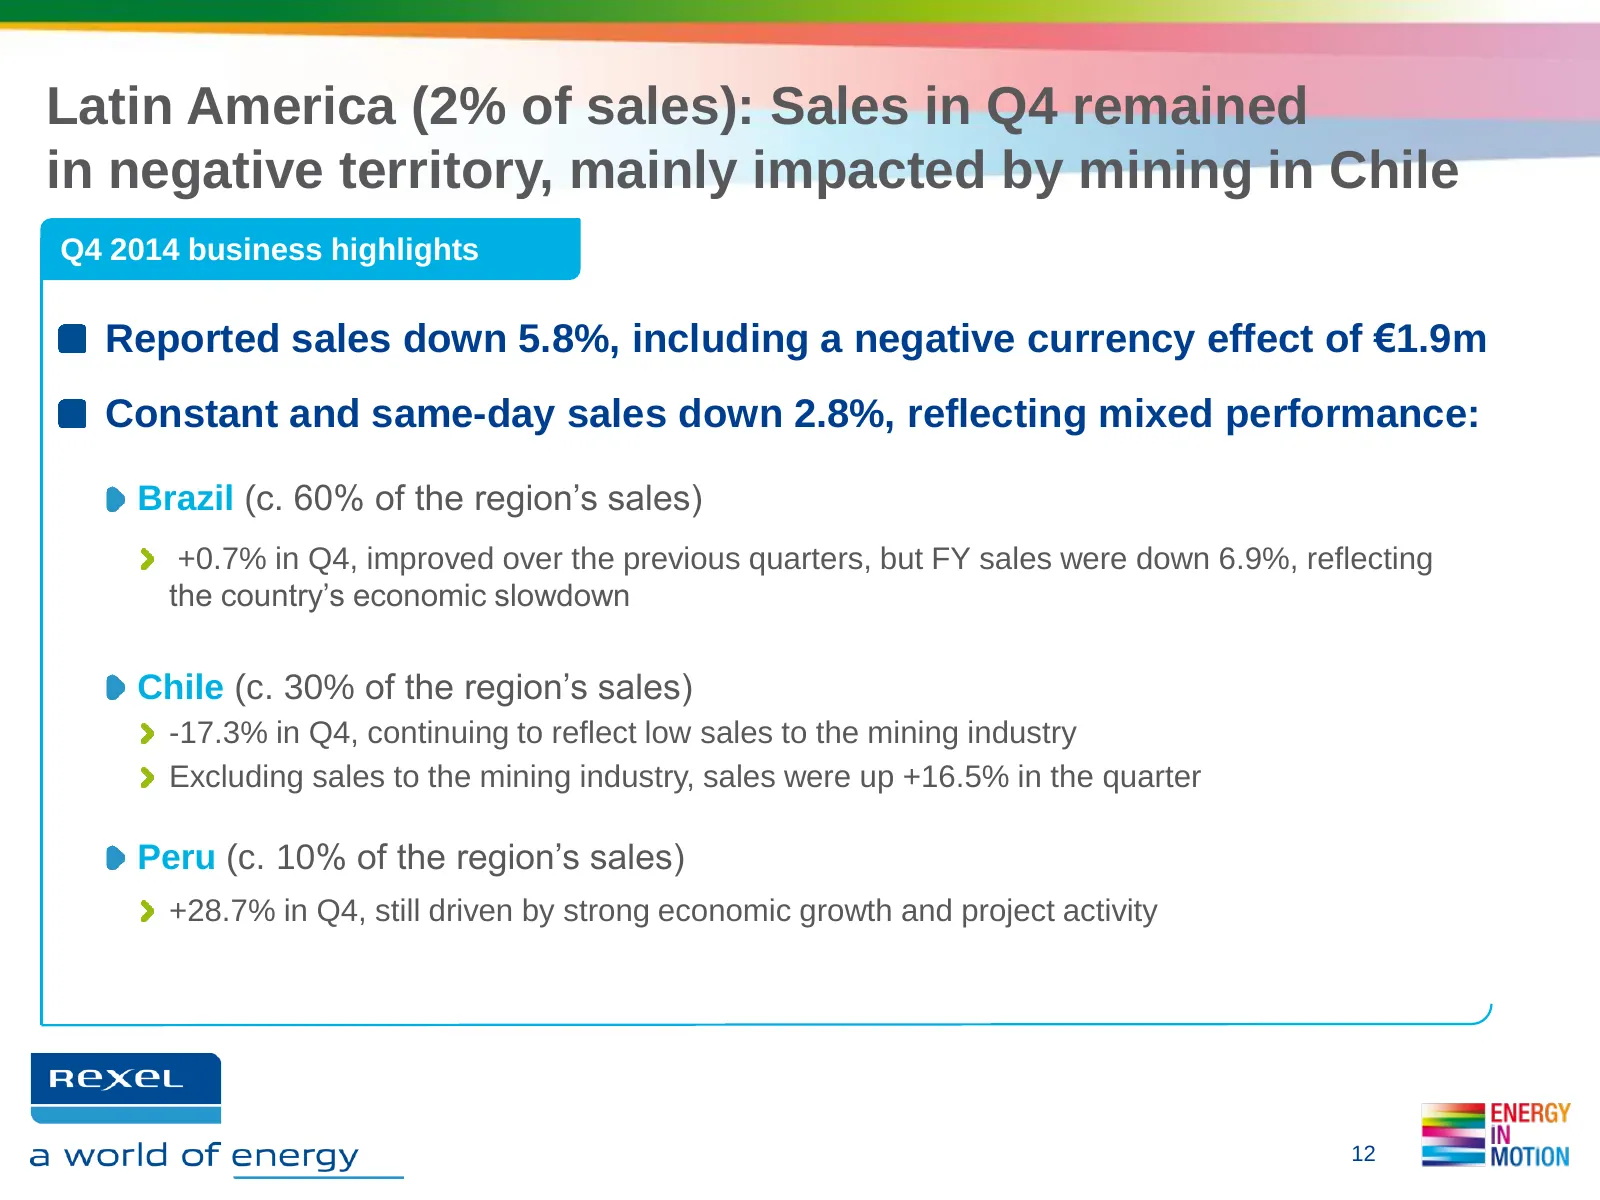
Latin America (2% of sales): Sales in Q4 remained in negative territory, mainly impacted by mining in Chile Q4 2014 business highlights Reported sales down 5.8%, including a negative currency effect of €1.9m Constant and same-day sales down 2.8%, reflecting mixed performance: Brazil (c. 60% of the r
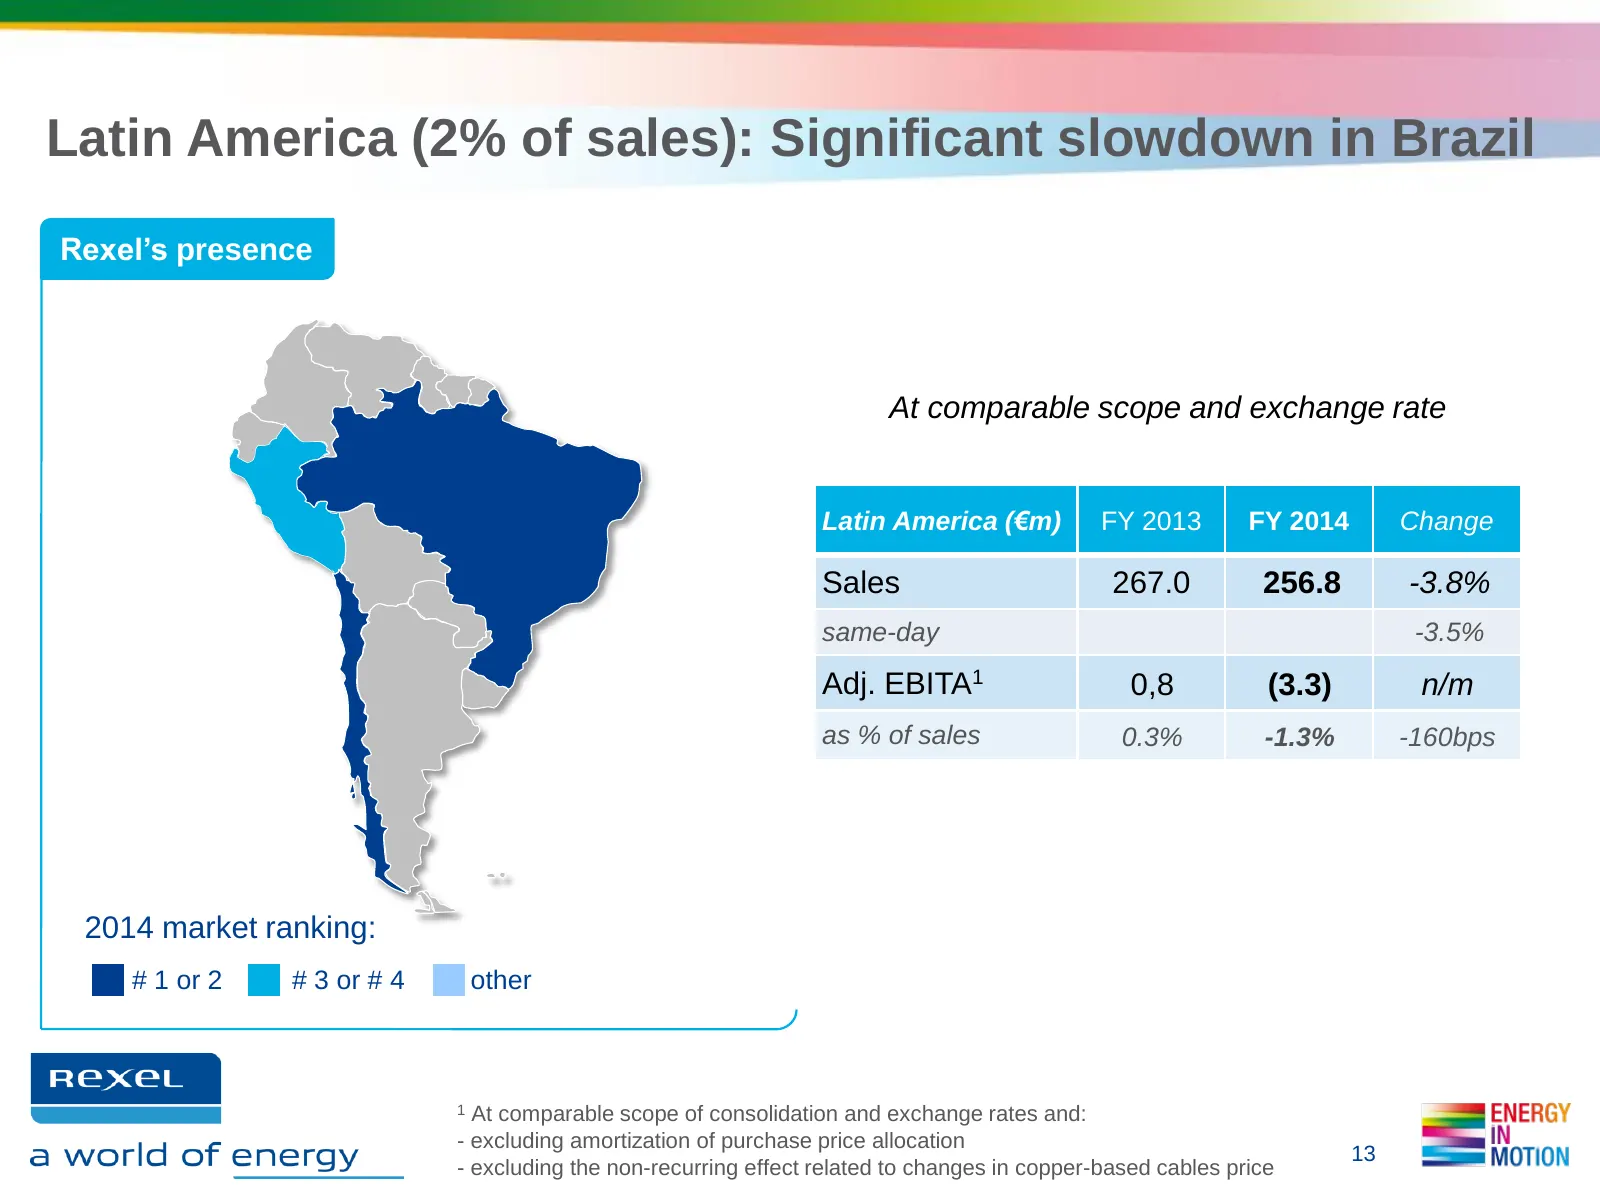
Slide 13: Latin America: Significant slowdown in Brazil
Latin America (2% of sales): Significant slowdown in Brazil Rexel’s presence At comparable scope and exchange rate Latin America (€m) FY 2013 FY 2014 Change Sales 267.0 256.8 -3.8% same-day -3.5% Adj. EBITA1 0,8 (3.3) n/m as % of sales 0.3% -1.3% -160bps 2014 market ranking: # 1 or 2 # 3 or # 4 othe
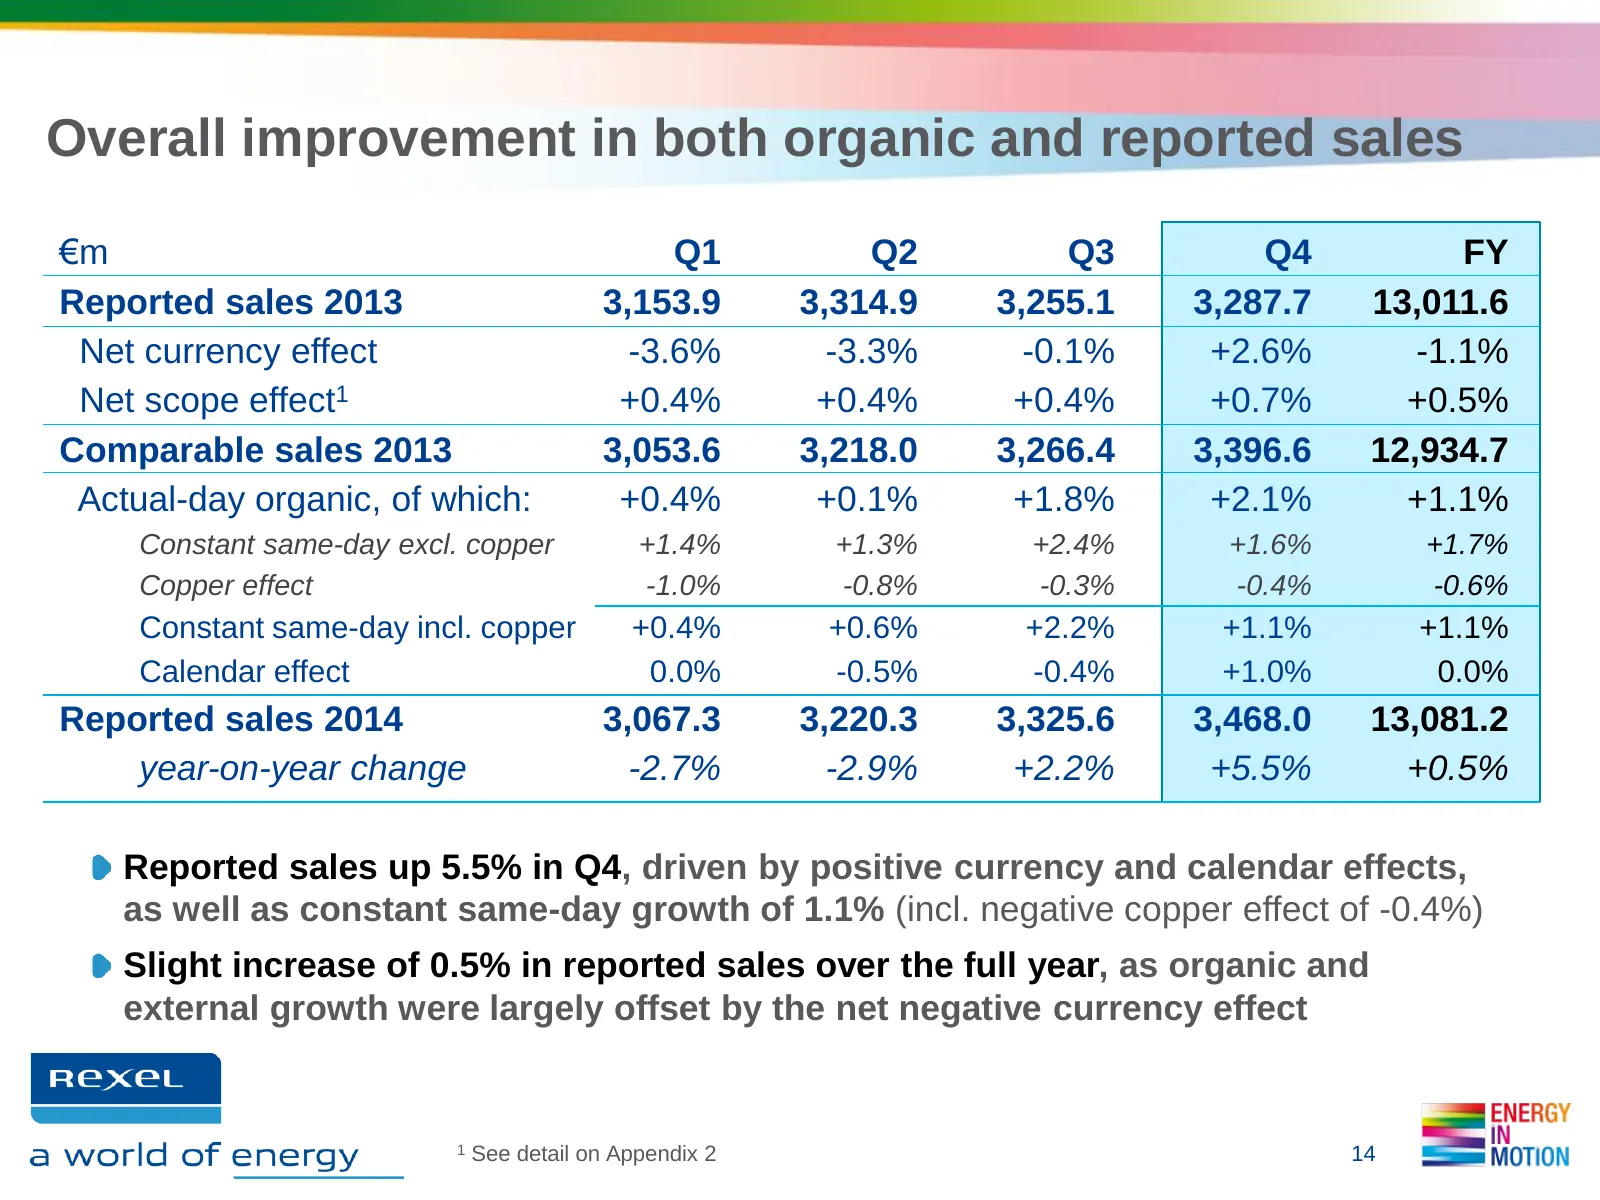
Slide 14: Overall improvement in organic and reported sales
Overall improvement in both organic and reported sales €m Q1 Q2 Q3 Q4 FY Reported sales 2013 3,153.9 3,314.9 3,255.1 3,287.7 13,011.6 Net currency effect -3.6% -3.3% -0.1% +2.6% -1.1% Net scope effect1 +0.4% +0.4% +0.4% +0.7% +0.5% Comparable sales 2013 3,053.6 3,218.0 3,266.4 3,396.6 12,934.7 Actua
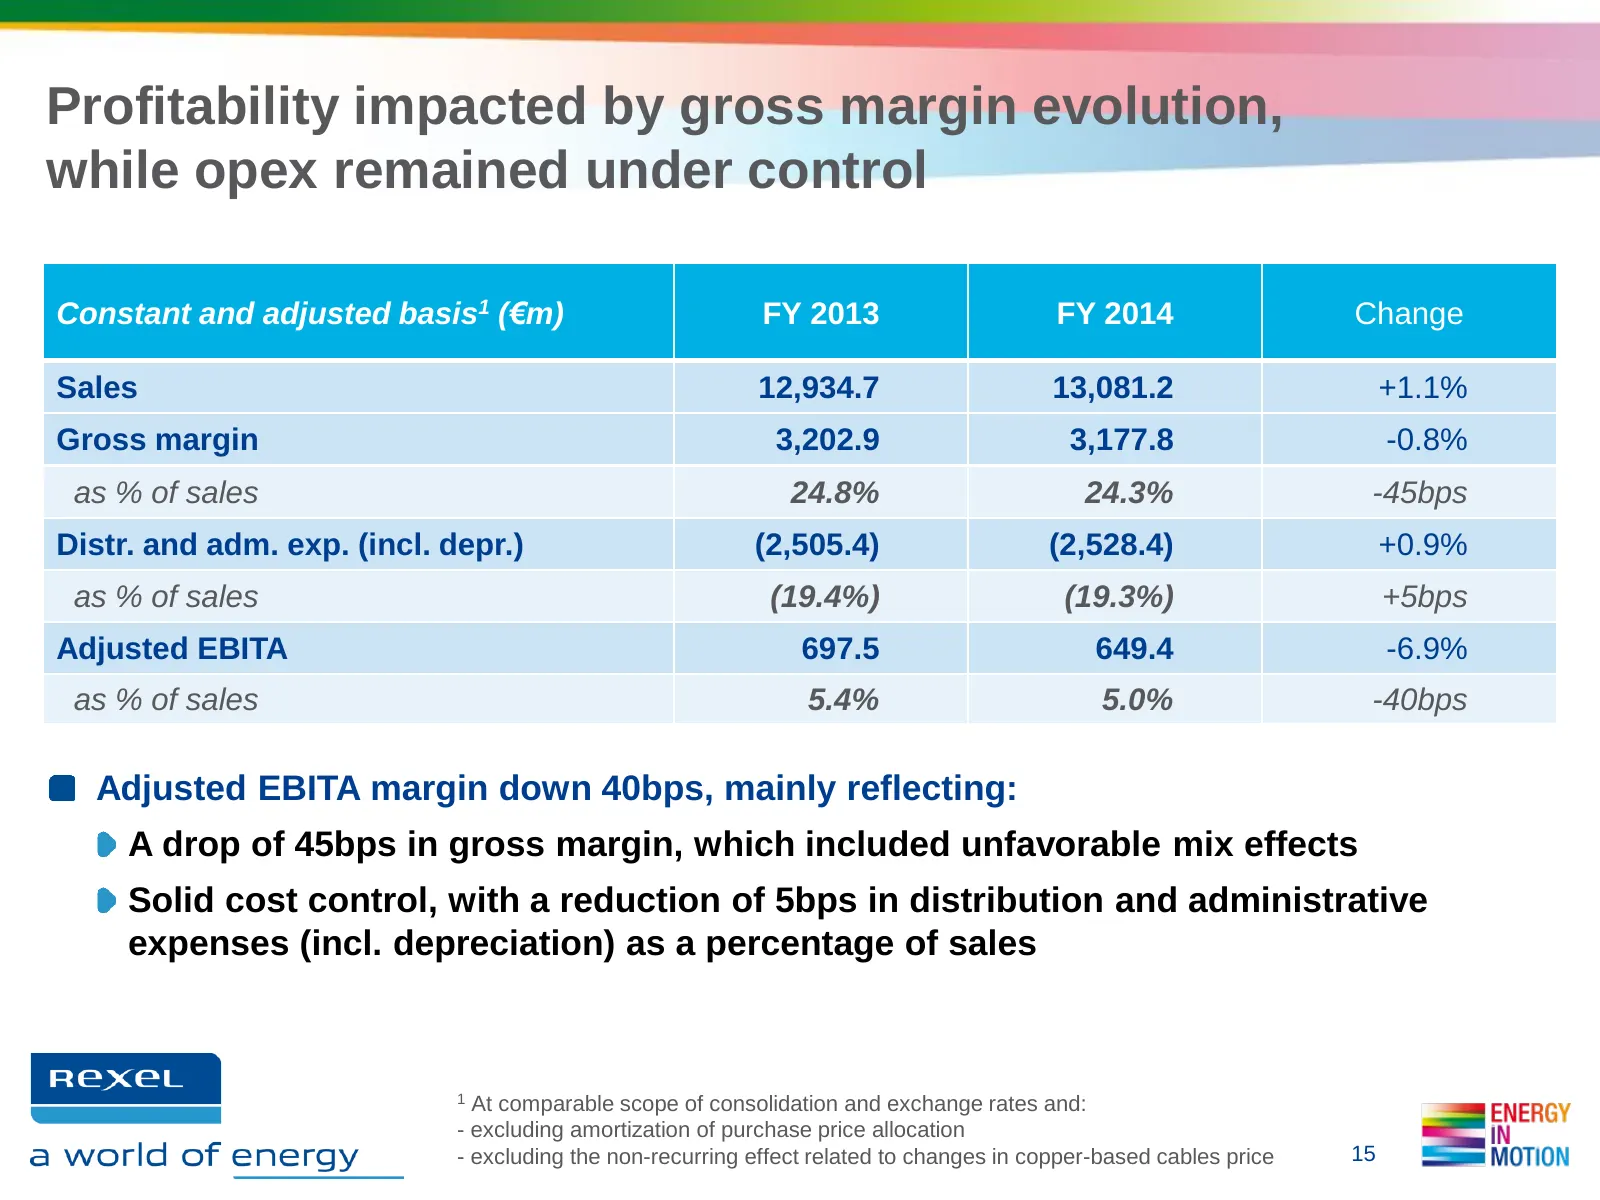
Slide 15: Profitability impacted by gross margin, opex under control
Profitability impacted by gross margin evolution, while opex remained under control Constant and adjusted basis1 (€m) FY 2013 FY 2014 Change Sales 12,934.7 13,081.2 +1.1% Gross margin 3,202.9 3,177.8 -0.8% as % of sales 24.8% 24.3% -45bps Distr. and adm. exp. (incl. depr.) (2,505.4) (2,528.4) +0.9%
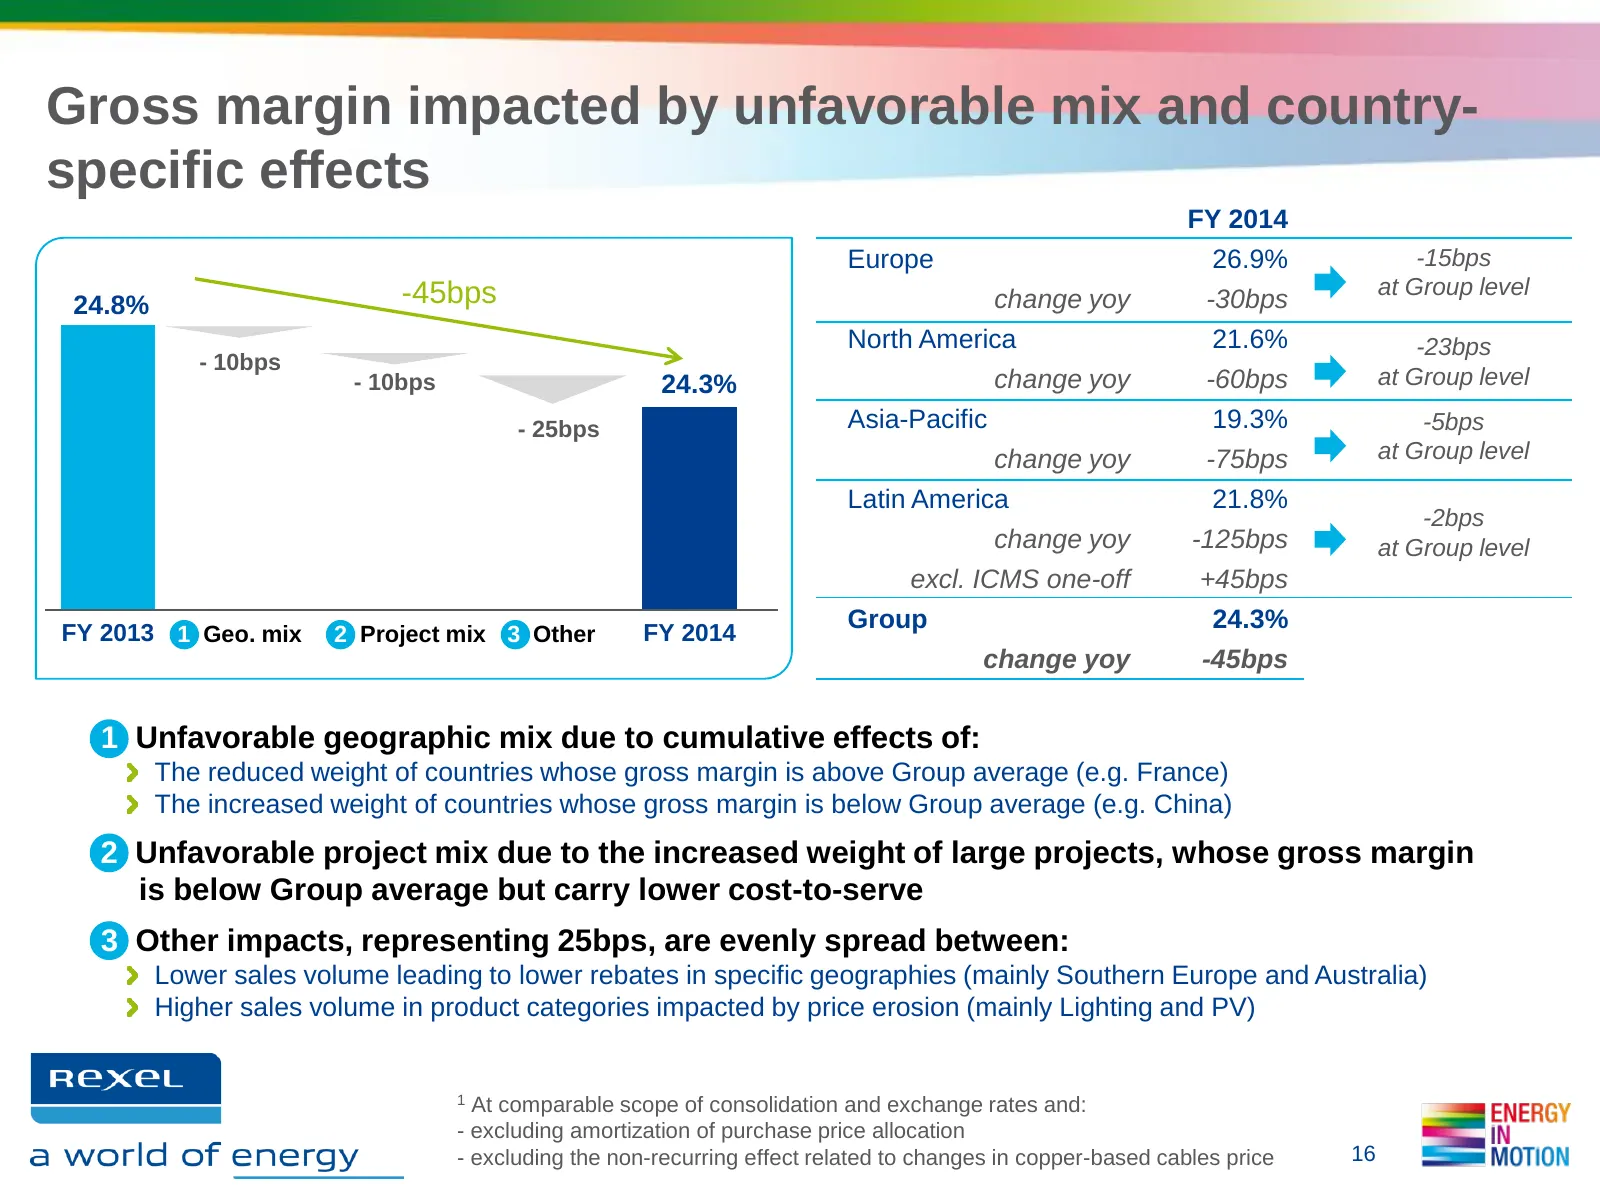
Slide 16: Gross margin impacted by unfavorable mix and country-specific effects
Gross margin impacted by unfavorable mix and country- specific effects FY 2014 Europe 26.9% -15bps -45bps at Group level 24.8% change yoy -30bps North America 21.6% -23bps - 10bps - 10bps 24.3% change yoy -60bps at Group level - 25bps Asia-Pacific 19.3% -5bps change yoy -75bps at Group level Latin A
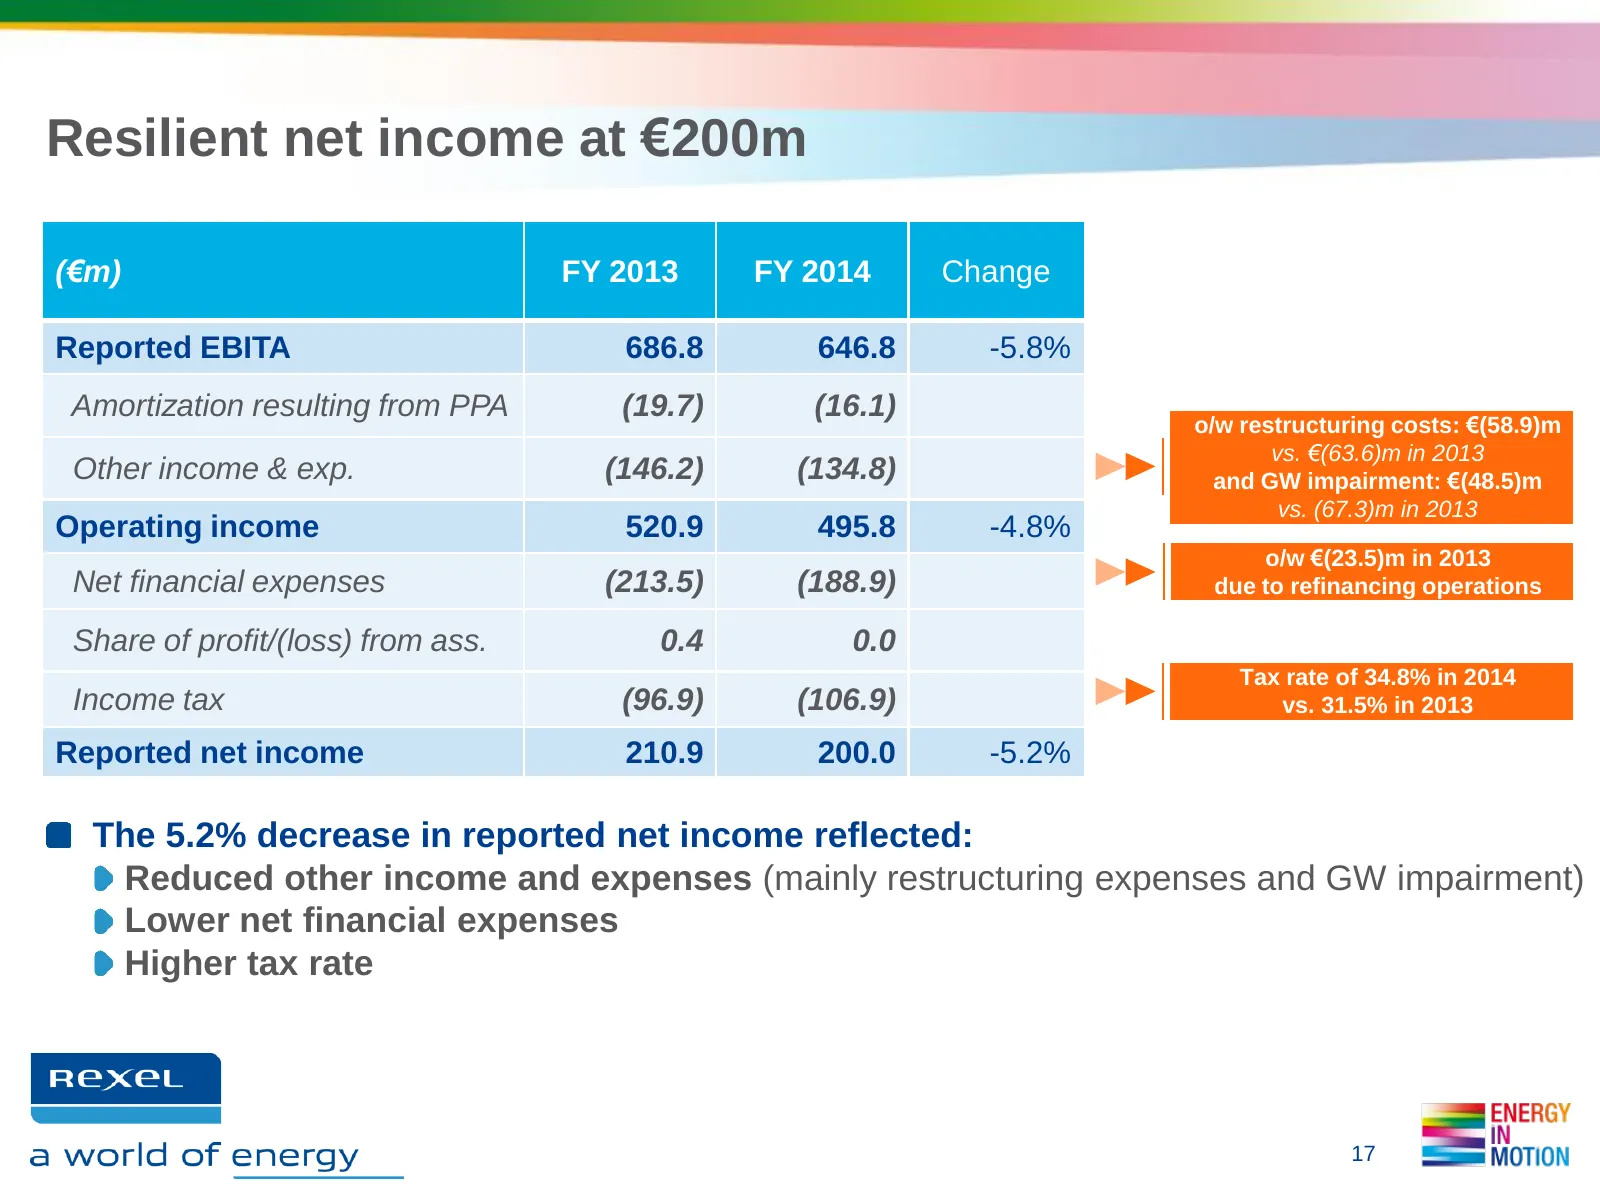
Slide 17: Resilient net income at €200m
Resilient net income at €200m (€m) FY 2013 FY 2014 Change Reported EBITA 686.8 646.8 -5.8% Amortization resulting from PPA (19.7) (16.1) o/w restructuring costs: €(58.9)m vs. €(63.6)m in 2013 Other income & exp. (146.2) (134.8) and GW impairment: €(48.5)m vs. (67.3)m in 2013 Operating income 520.9 4
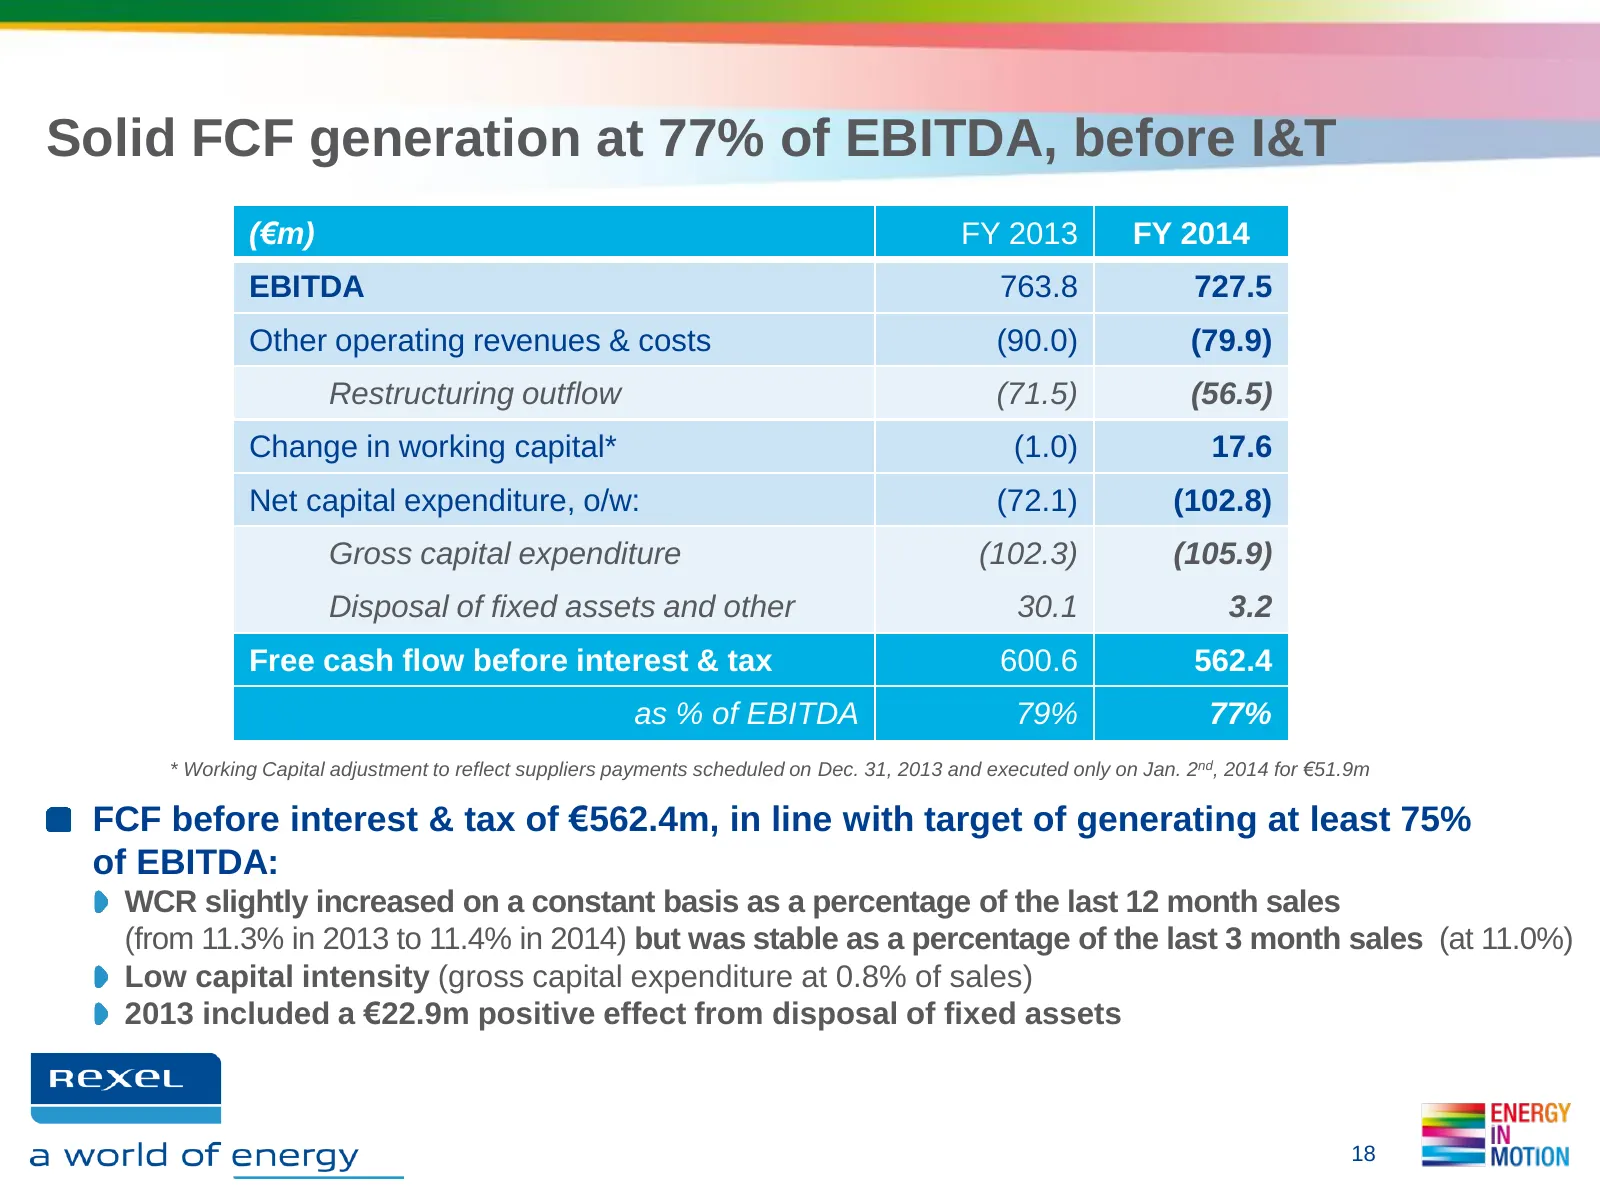
Slide 18: Solid FCF generation at 77% of EBITDA, before I&T
Solid FCF generation at 77% of EBITDA, before I&T (€m) FY 2013 FY 2014 EBITDA 763.8 727.5 Other operating revenues & costs (90.0) (79.9) Restructuring outflow (71.5) (56.5) Change in working capital* (1.0) 17.6 Net capital expenditure, o/w: (72.1) (102.8) Gross capital expenditure (102.3) (105.9) Di
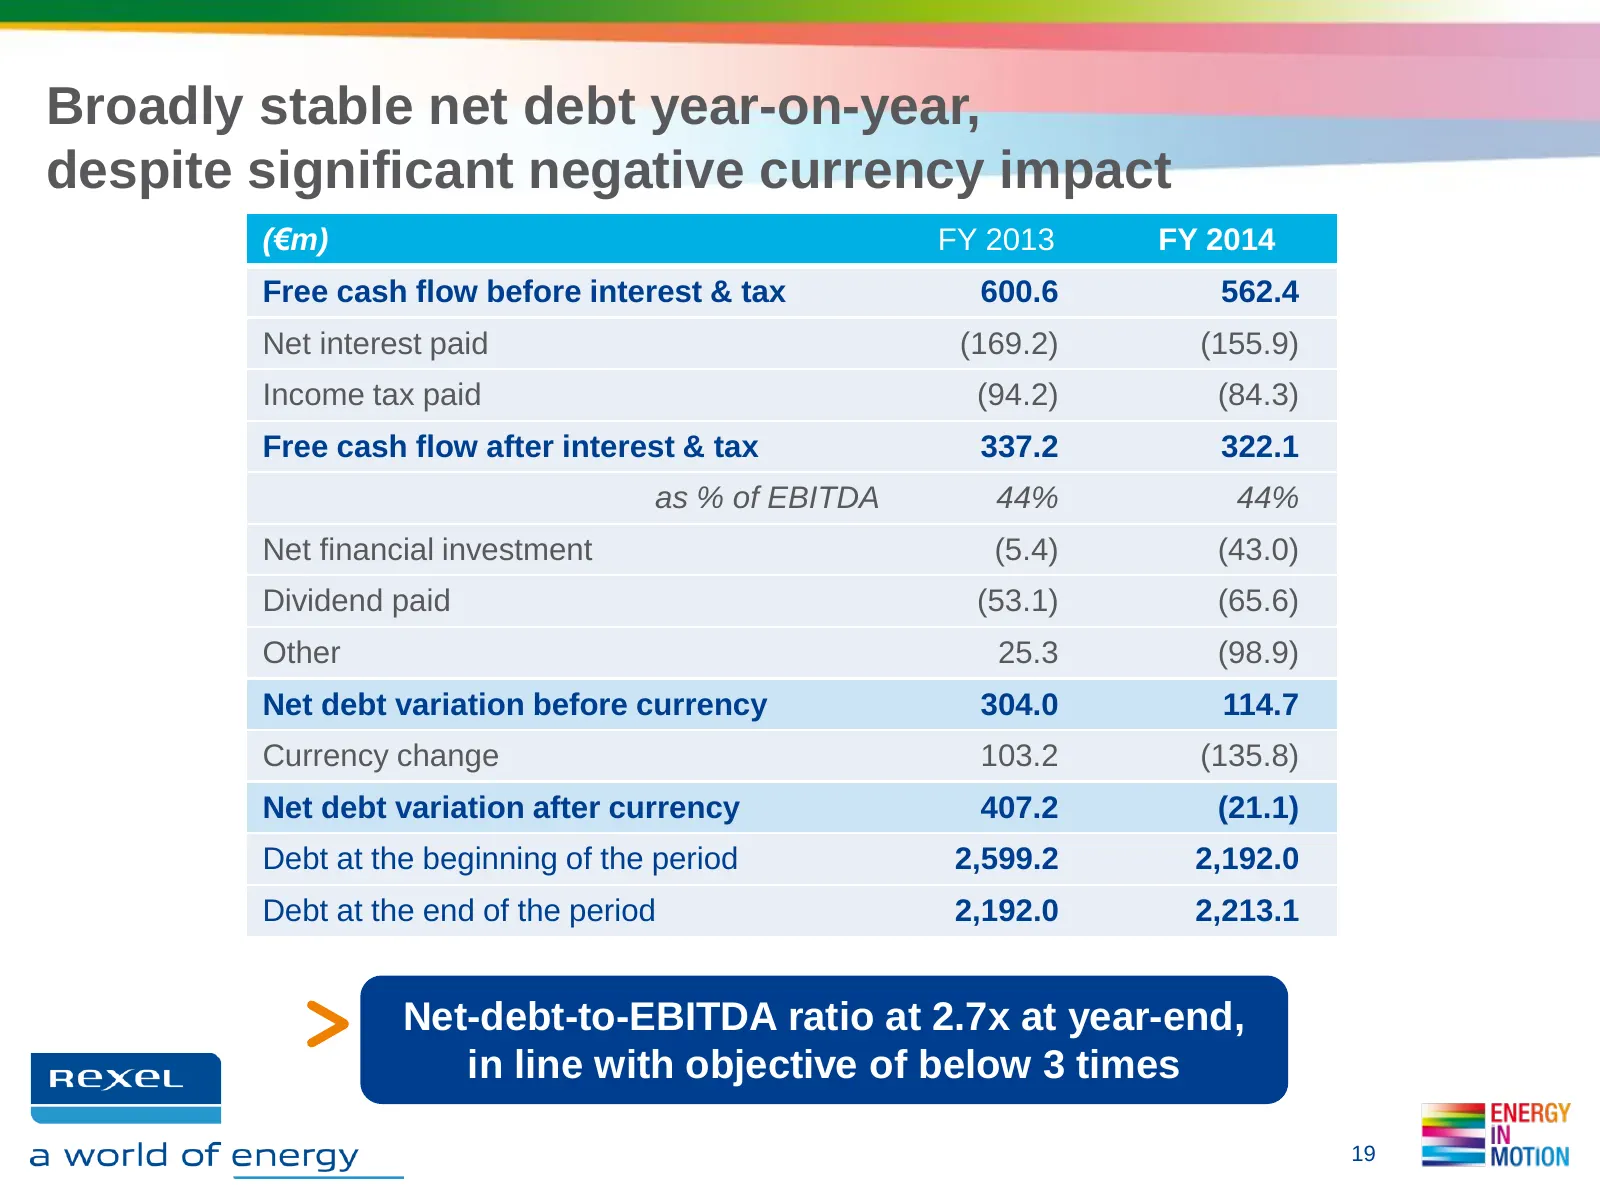
Slide 19: Broadly stable net debt despite negative currency impact
Broadly stable net debt year-on-year, despite significant negative currency impact (€m) FY 2013 FY 2014 Free cash flow before interest & tax 600.6 562.4 Net interest paid (169.2) (155.9) Income tax paid (94.2) (84.3) Free cash flow after interest & tax 337.2 322.1 as % of EBITDA 44% 44% Net financia
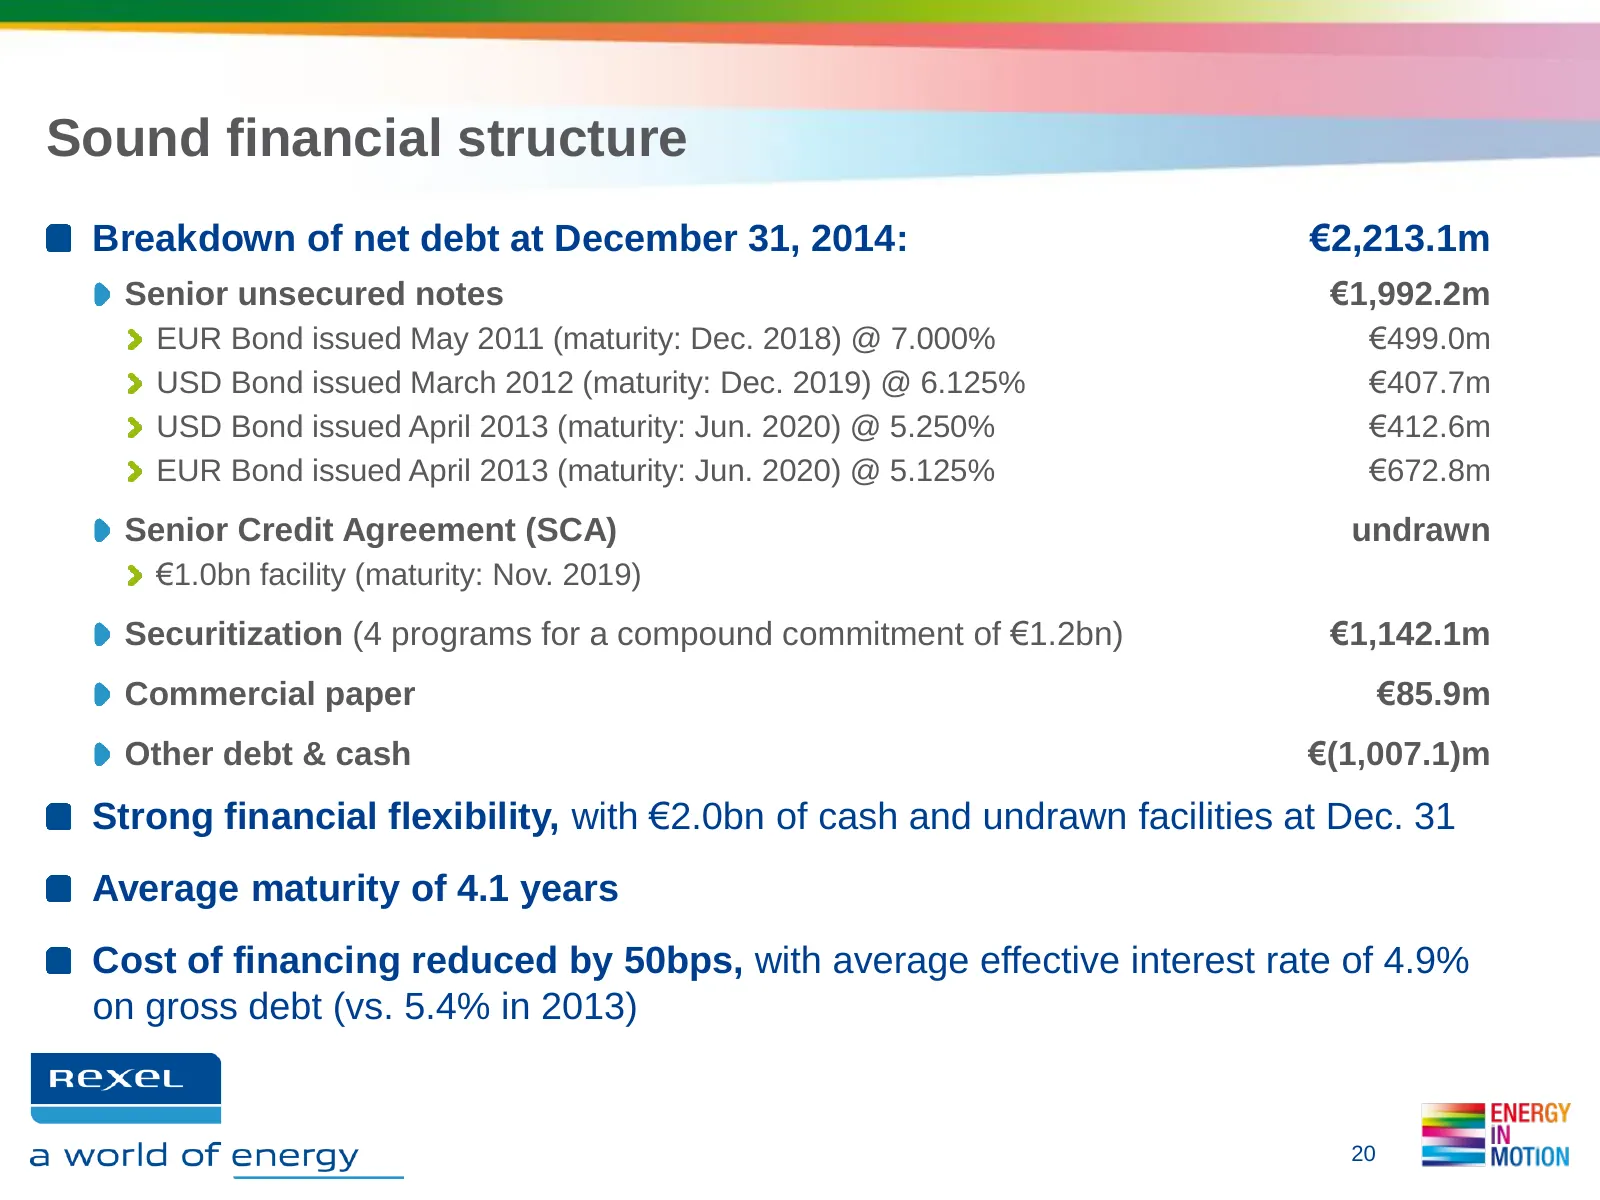
Slide 20: Sound financial structure
Sound financial structure Breakdown of net debt at December 31, 2014: €2,213.1m Senior unsecured notes €1,992.2m EUR Bond issued May 2011 (maturity: Dec. 2018) @ 7.000% €499.0m USD Bond issued March 2012 (maturity: Dec. 2019) @ 6.125% €407.7m USD Bond issued April 2013 (maturity: Jun. 2020) @ 5.250%
Slide 21: Active balance-sheet management
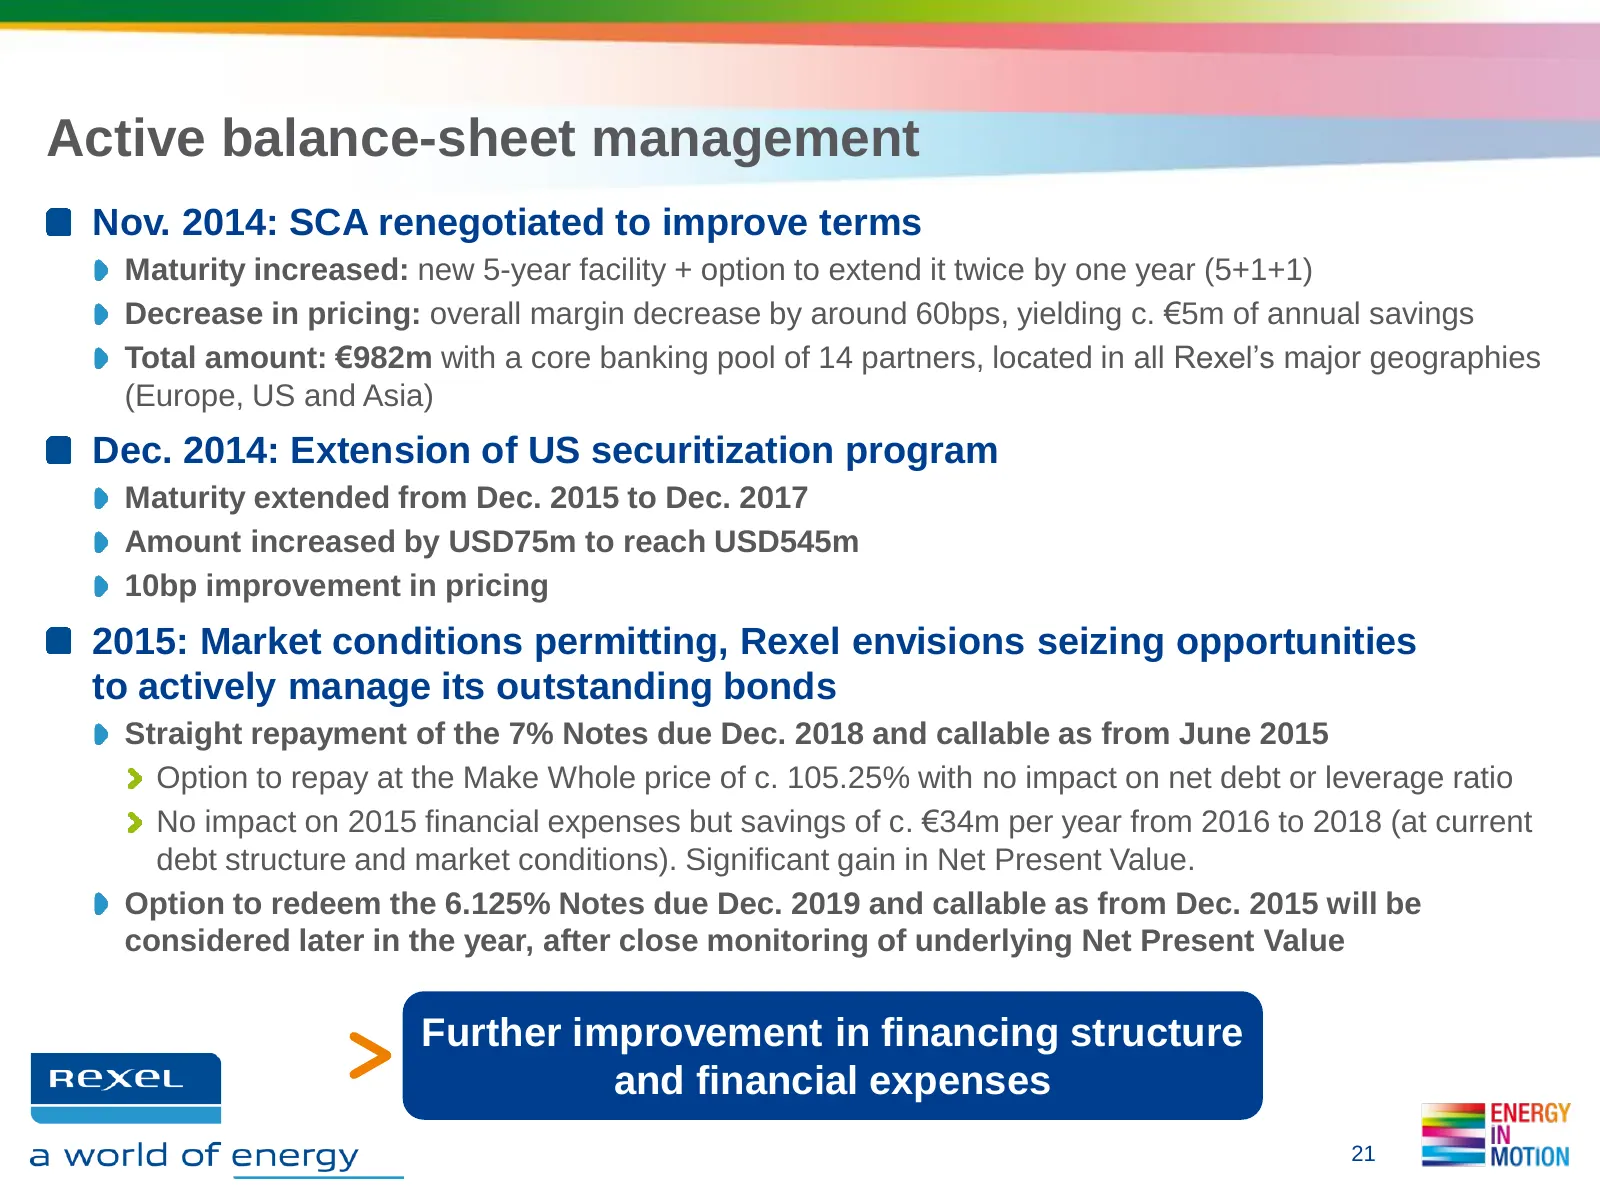
Active balance-sheet management Nov. 2014: SCA renegotiated to improve terms Maturity increased: new 5-year facility + option to extend it twice by one year (5+1+1) Decrease in pricing: overall margin decrease by around 60bps, yielding c. €5m of annual savings Total amount: €982m with a core banking
Slide 22: Stable proposed dividend of €0.75 per share
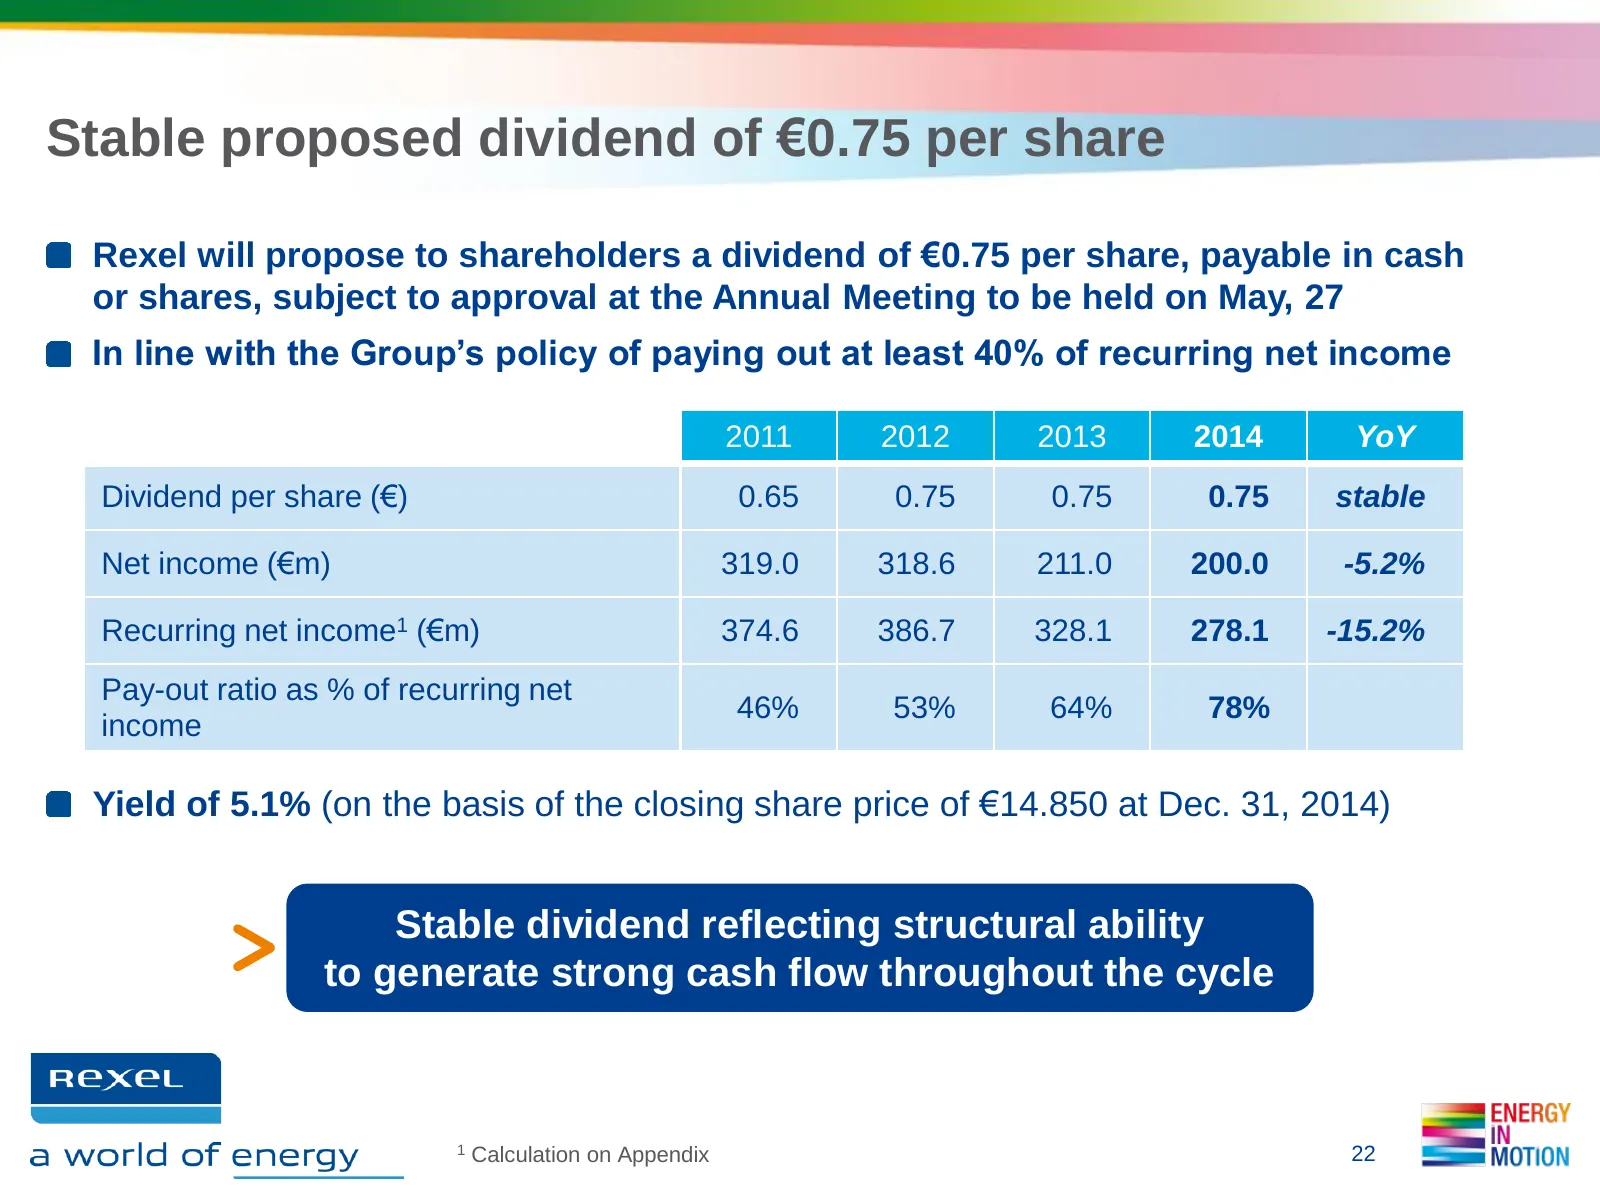
Stable proposed dividend of €0.75 per share Rexel will propose to shareholders a dividend of €0.75 per share, payable in cash or shares, subject to approval at the Annual Meeting to be held on May, 27 In line with the Group’s policy of paying out at least 40% of recurring net income 2011 2012 2013 2
Slide 23: 2015 Business Priorities
2 » 2015 BUSINESS PRIORITIES RexeL fe a world of energy enero == MOTION
Slide 24: Drive profitable organic growth through high-growth initiatives
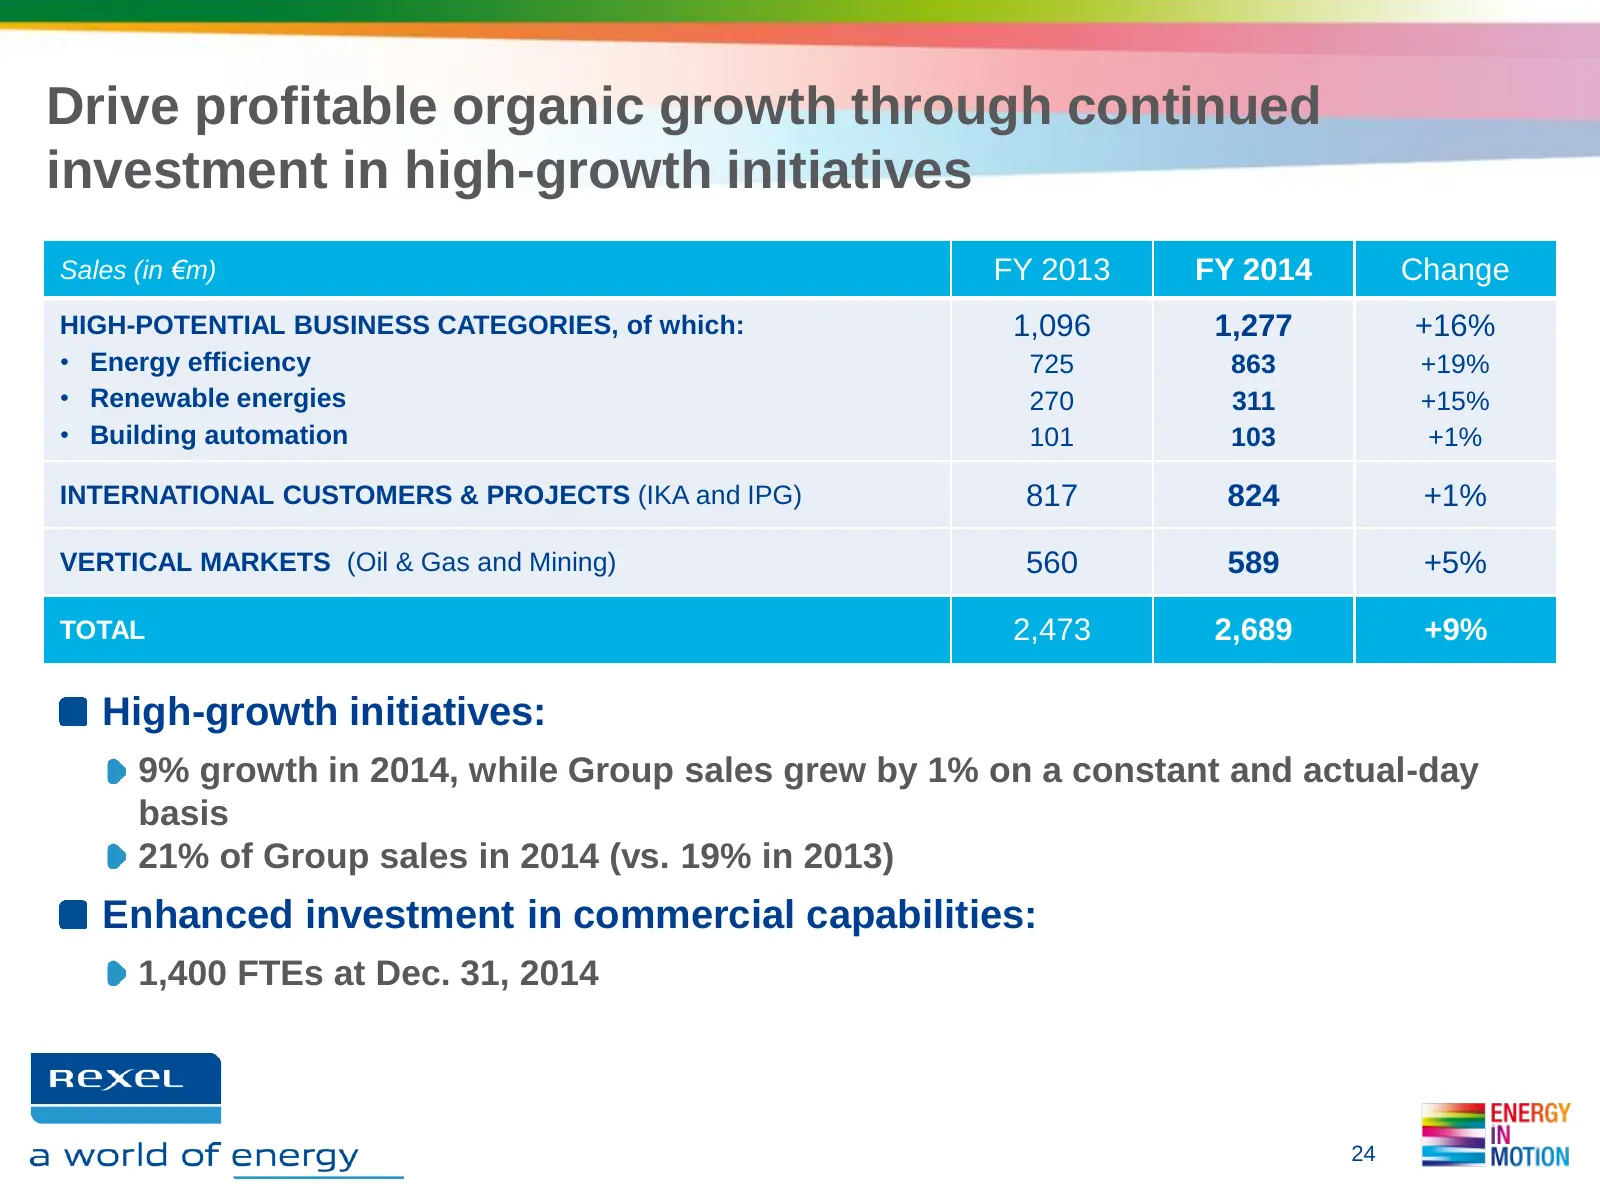
Drive profitable organic growth through continued investment in high-growth initiatives Sales (in €m) FY 2013 FY 2014 Change HIGH-POTENTIAL BUSINESS CATEGORIES, of which: 1,096 1,277 +16% • Energy efficiency 725 863 +19% • Renewable energies 270 311 +15% • Building automation 101 103 +1% INTERNATION
Slide 25: Focus on gross margin optimization and cost-to-serve
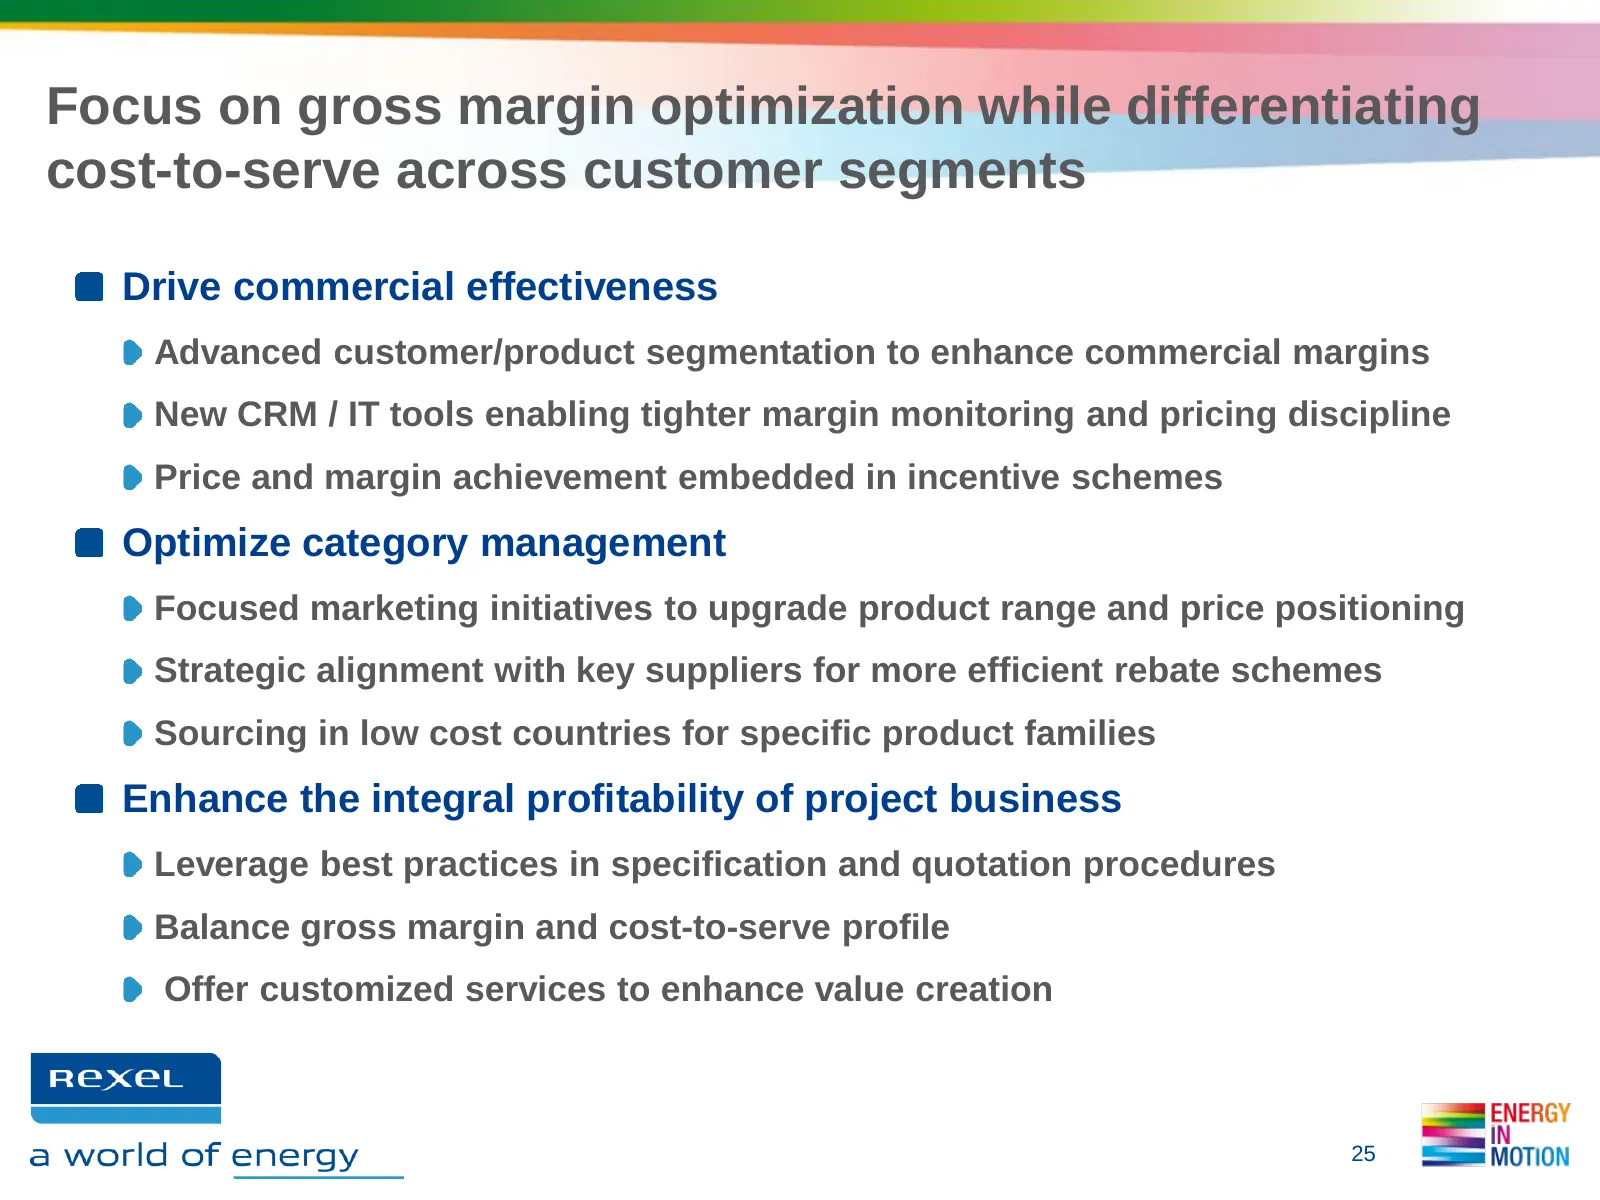
Focus on gross margin optimization while differentiating cost-to-serve across customer segments Drive commercial effectiveness Advanced customer/product segmentation to enhance commercial margins New CRM / IT tools enabling tighter margin monitoring and pricing discipline Price and margin achievemen
Slide 26: Drive operational excellence through logistics network optimization
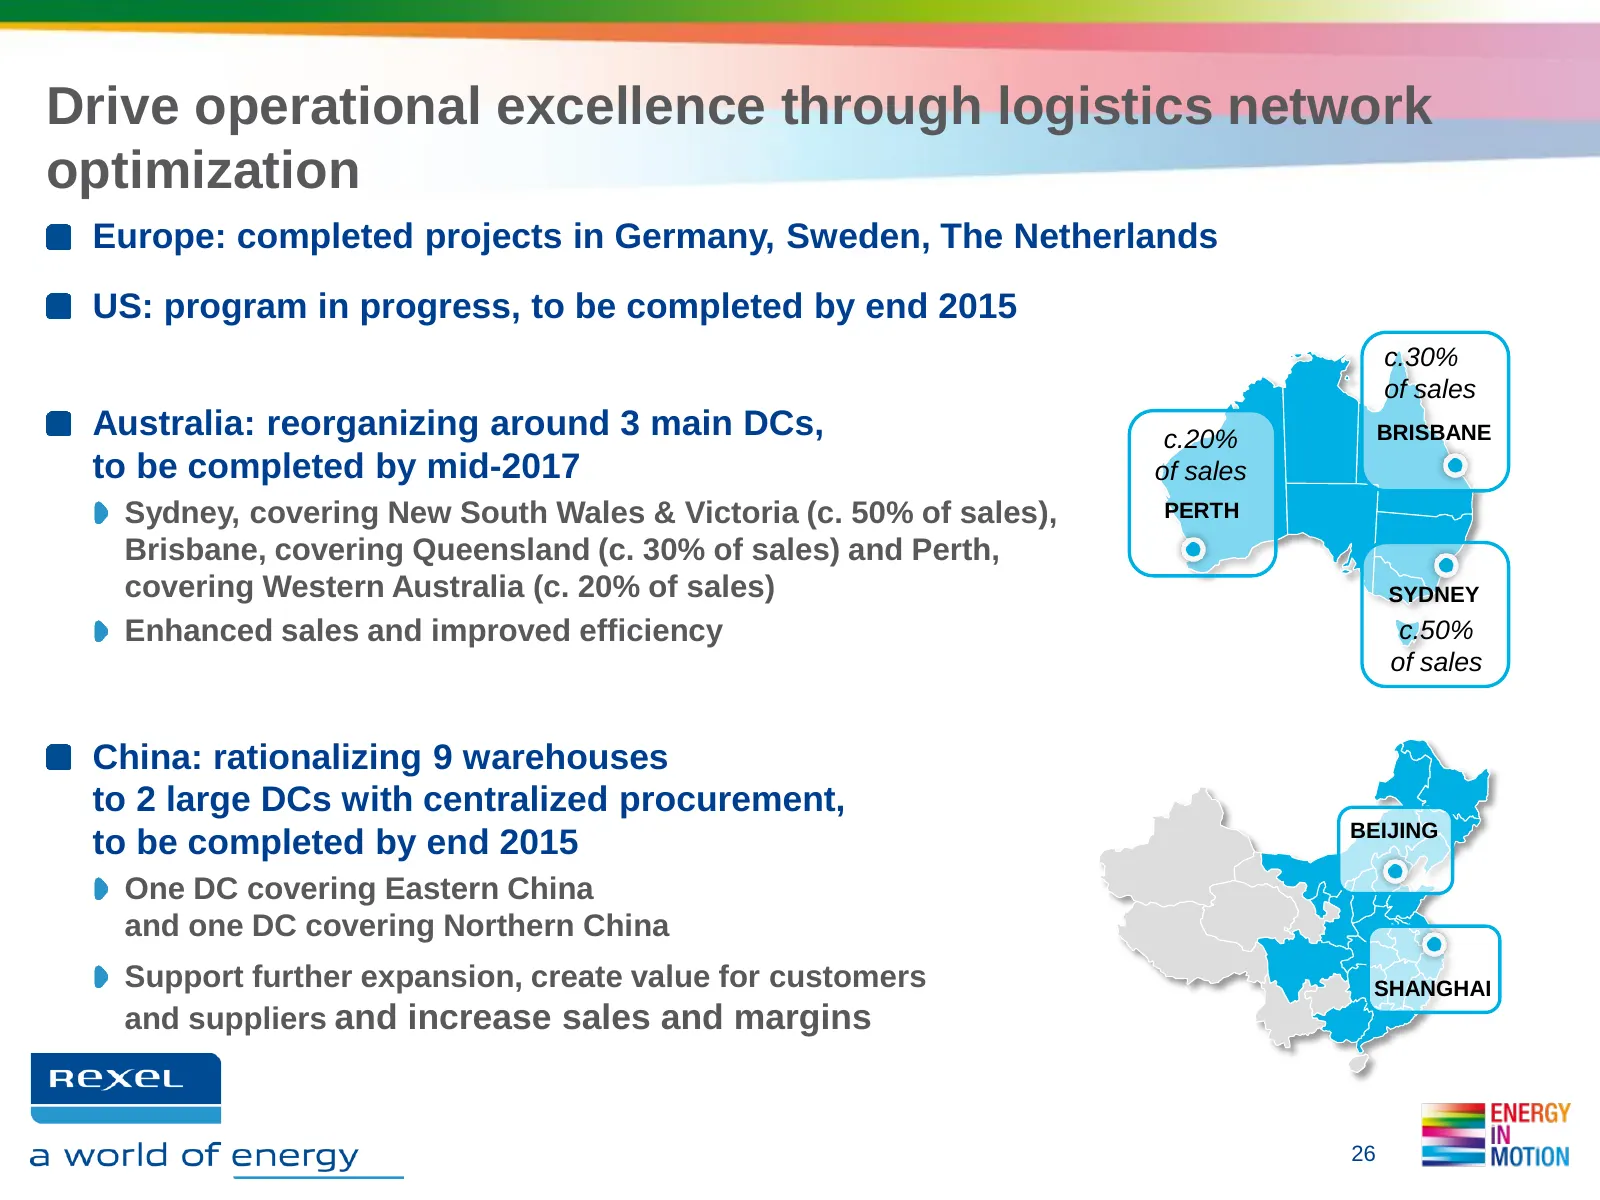
Drive operational excellence through logistics network optimization Europe: completed projects in Germany, Sweden, The Netherlands US: program in progress, to be completed by end 2015 c.30% of sales Australia: reorganizing around 3 main DCs, c.20% BRISBANE to be completed by mid-2017 of sales Sydney
Slide 27: Establish a strong IT backbone and digital platform
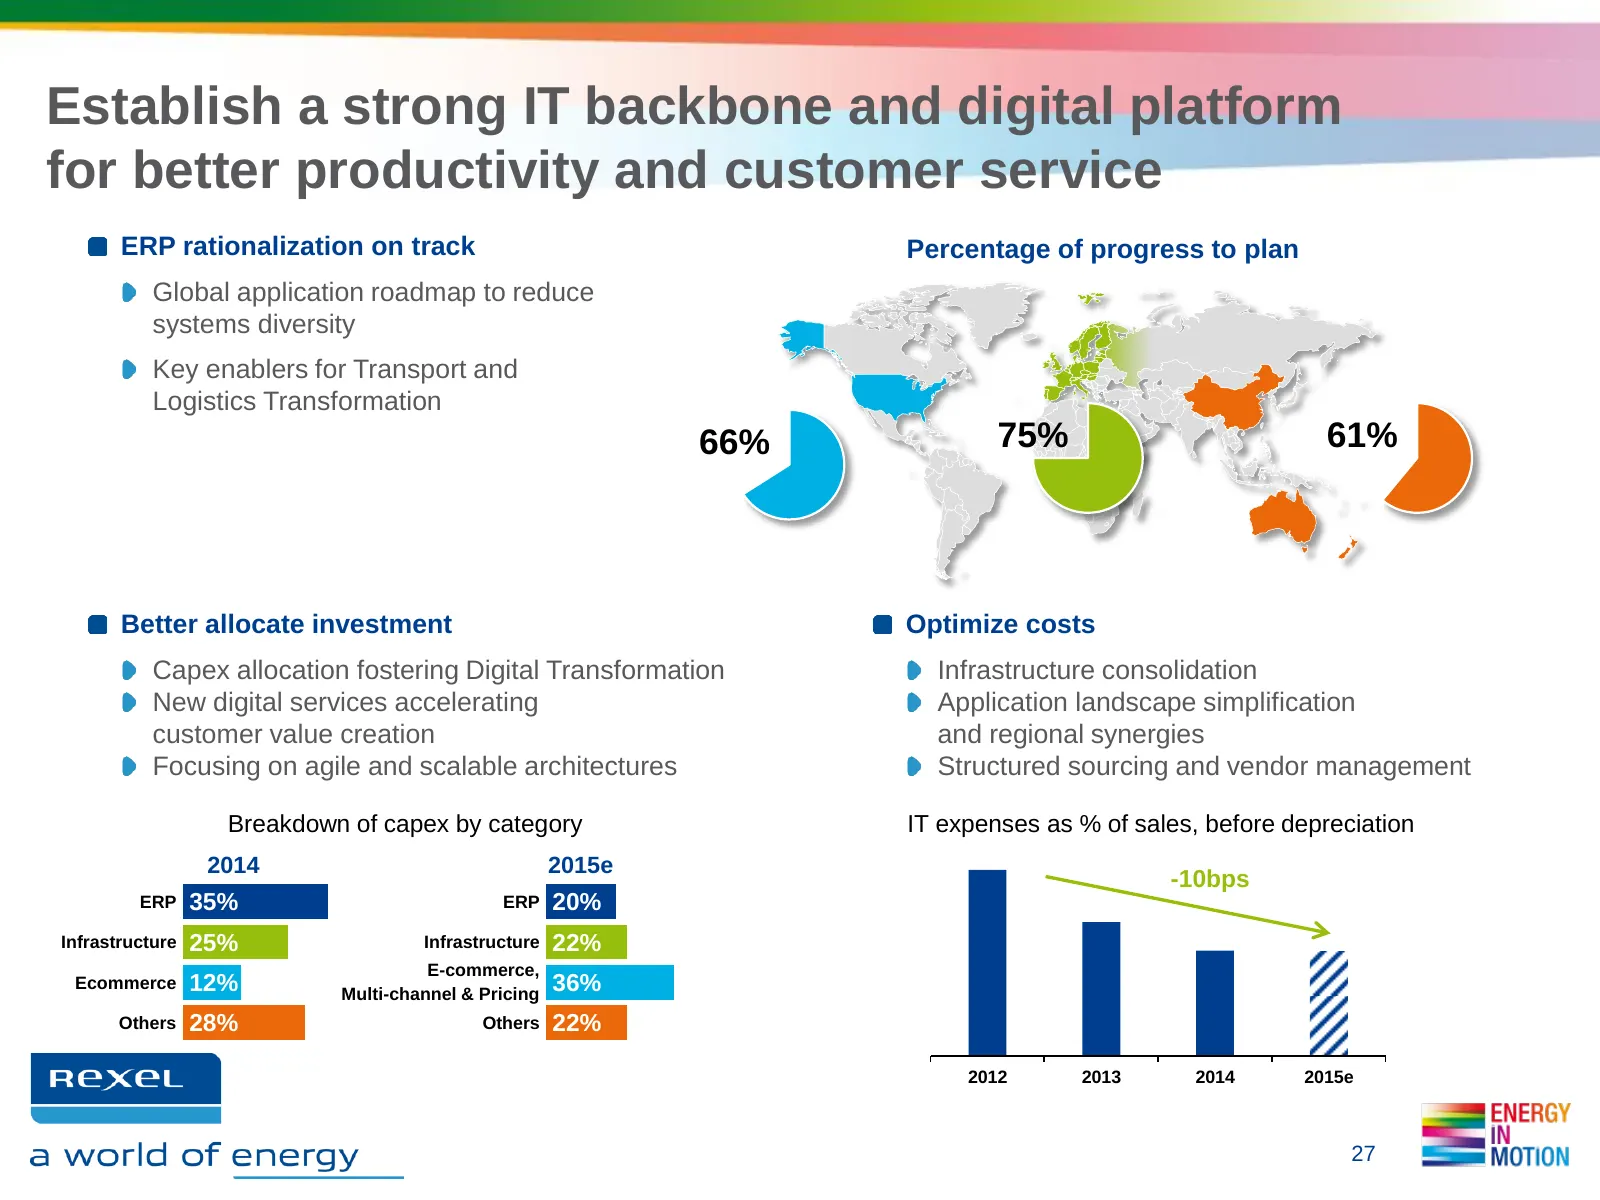
Establish a strong IT backbone and digital platform for better productivity and customer service ERP rationalization on track Percentage of progress to plan Global application roadmap to reduce systems diversity Key enablers for Transport and Logistics Transformation 66% 75% 61% Better allocate inve
Slide 28: Accelerate growth through targeted acquisitions
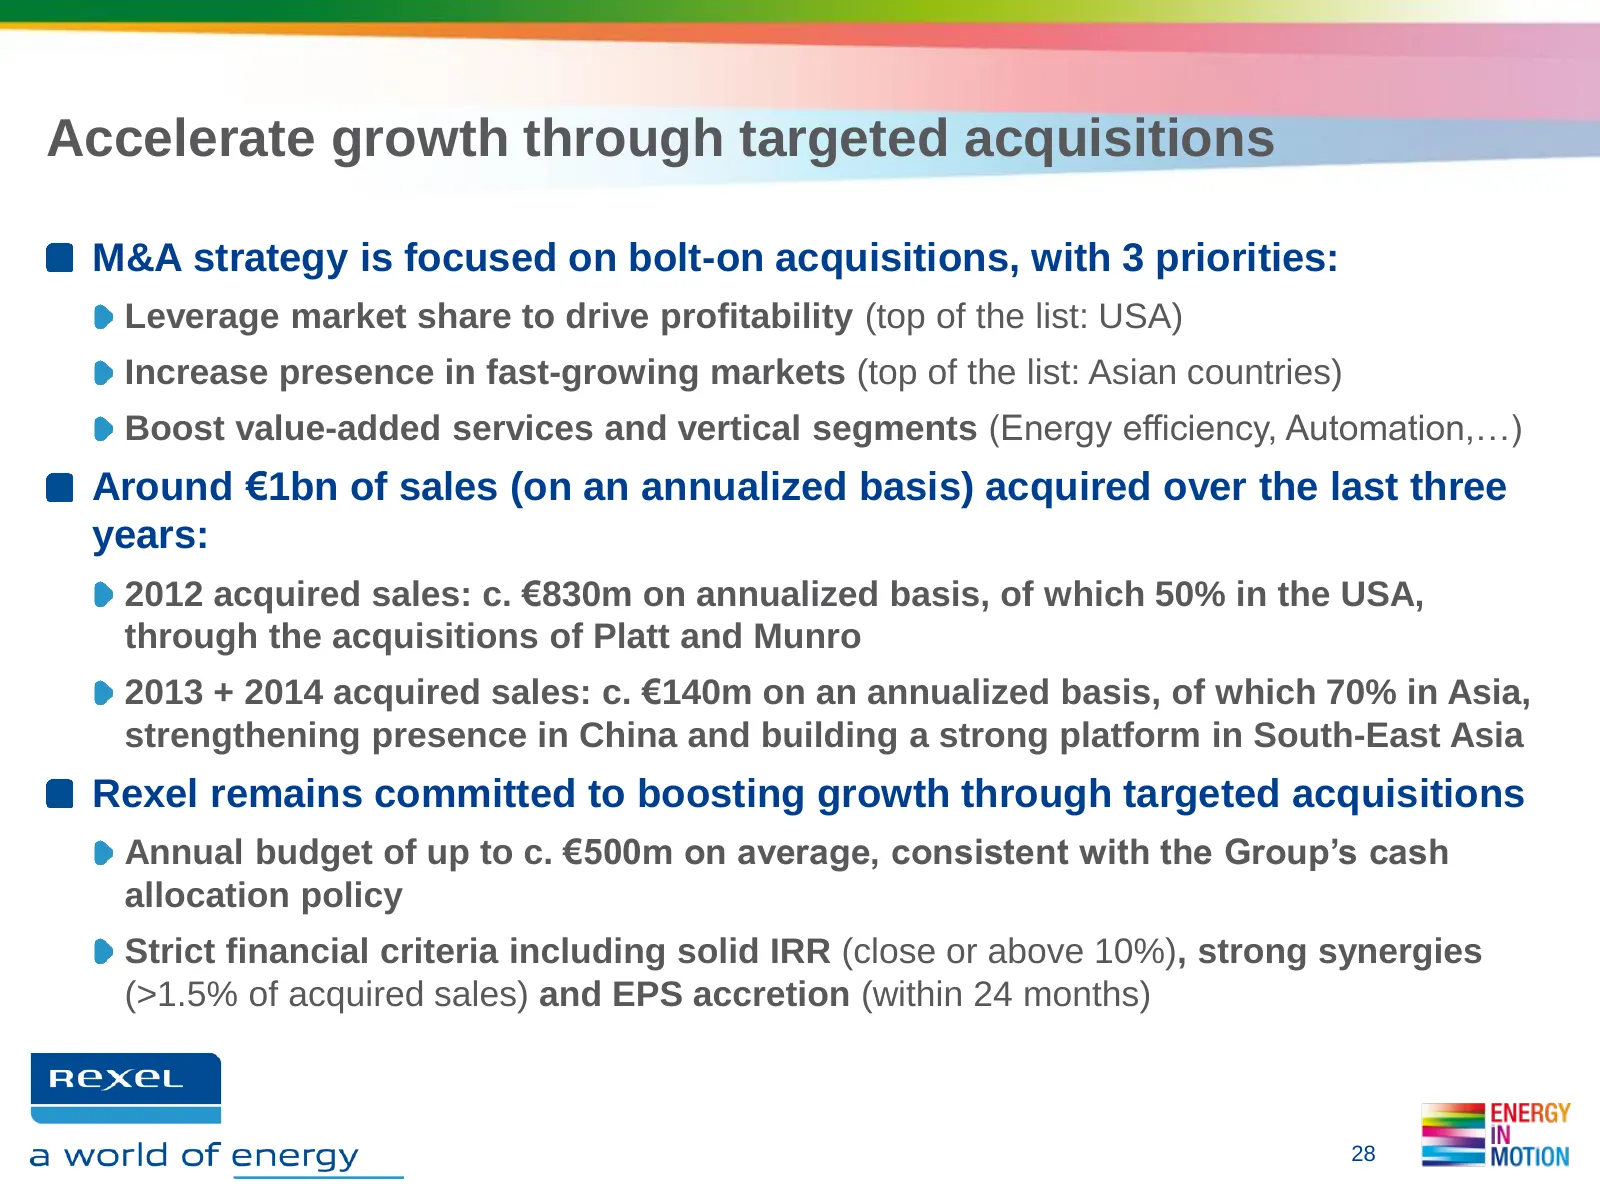
Accelerate growth through targeted acquisitions M&A strategy is focused on bolt-on acquisitions, with 3 priorities: Leverage market share to drive profitability (top of the list: USA) Increase presence in fast-growing markets (top of the list: Asian countries) Boost value-added services and vertical
Slide 29: In summary: 2015 business priorities
In summary: 2015 business priorities Drive profitable growth through continued investment in high-growth initiatives Focus on gross margin optimization while differentiating cost-to-serve across customer segments Drive operational excellence through logistics network optimization Establish a strong

Slide 30: Update on Portfolio Review
3. UPDATE ON PORTFOLIO REVIEW
Slide 31: Framework of portfolio review
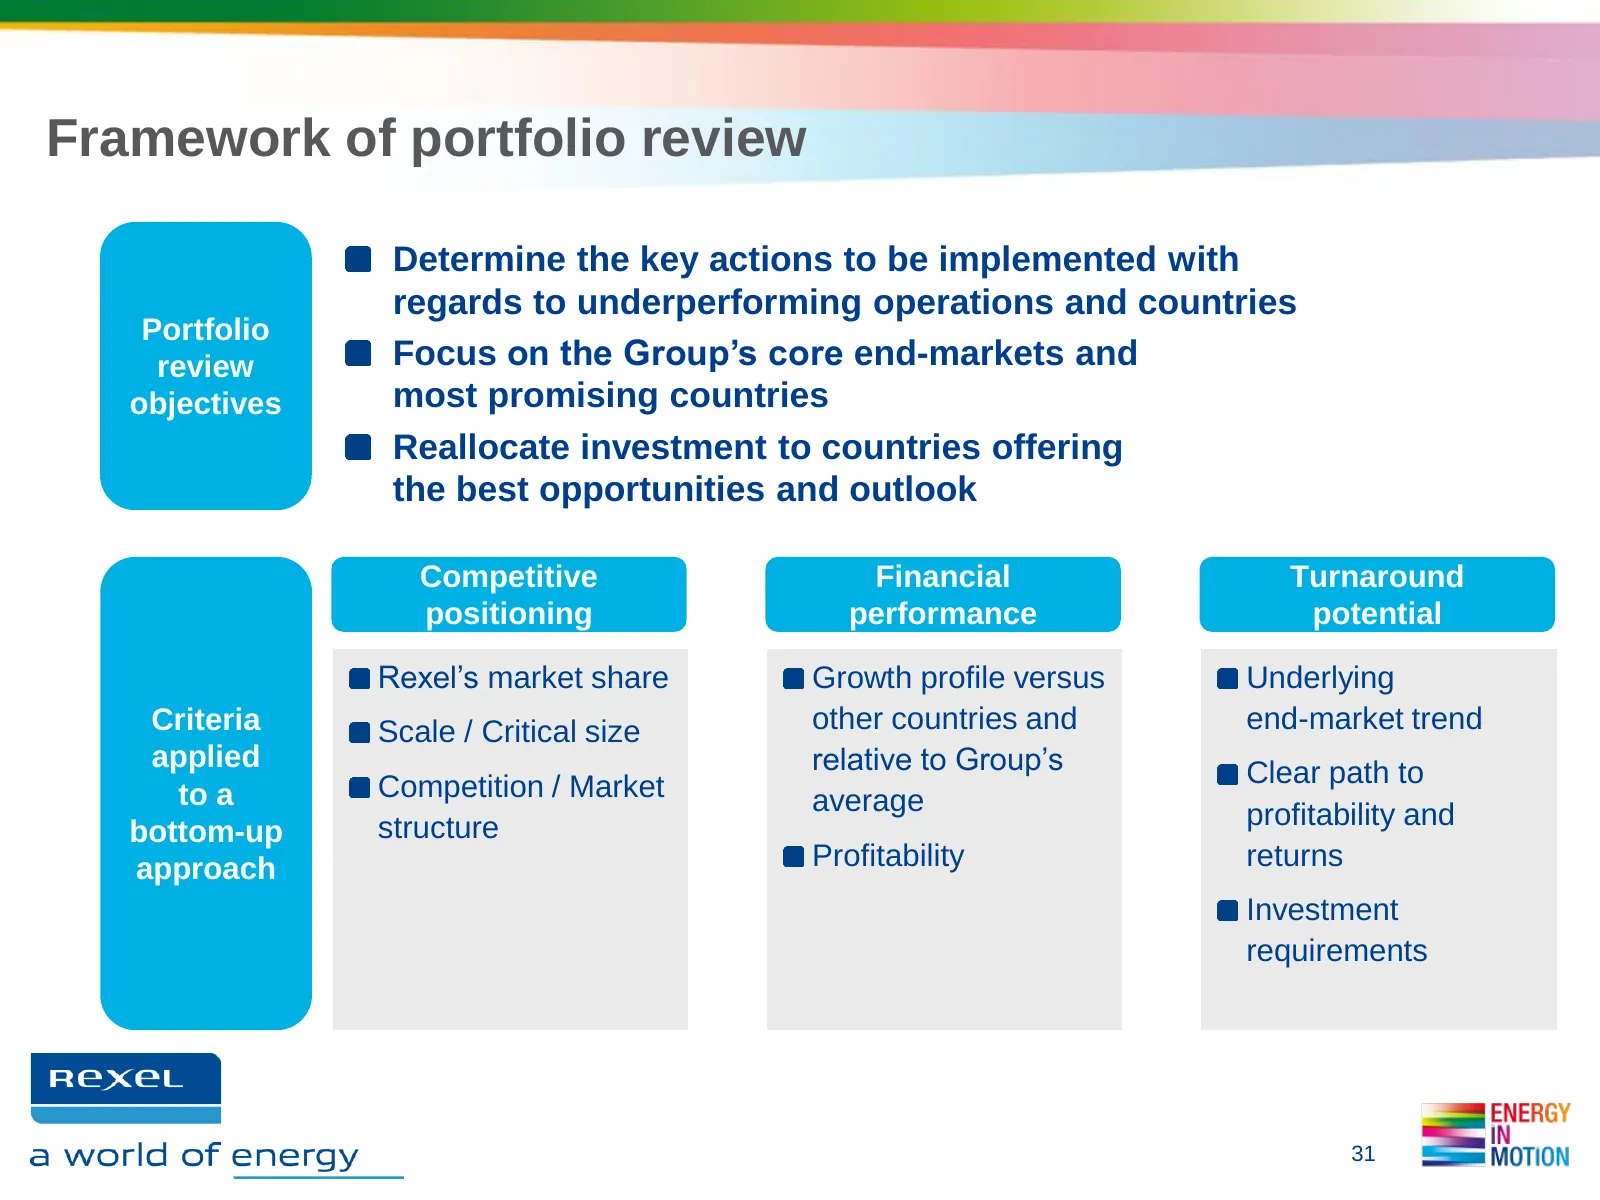
Framework of portfolio review Determine the key actions to be implemented with regards to underperforming operations and countries Portfolio review Focus on the Group’s core end-markets and objectives most promising countries Reallocate investment to countries offering the best opportunities and out
Slide 32: Process underway: divestment process
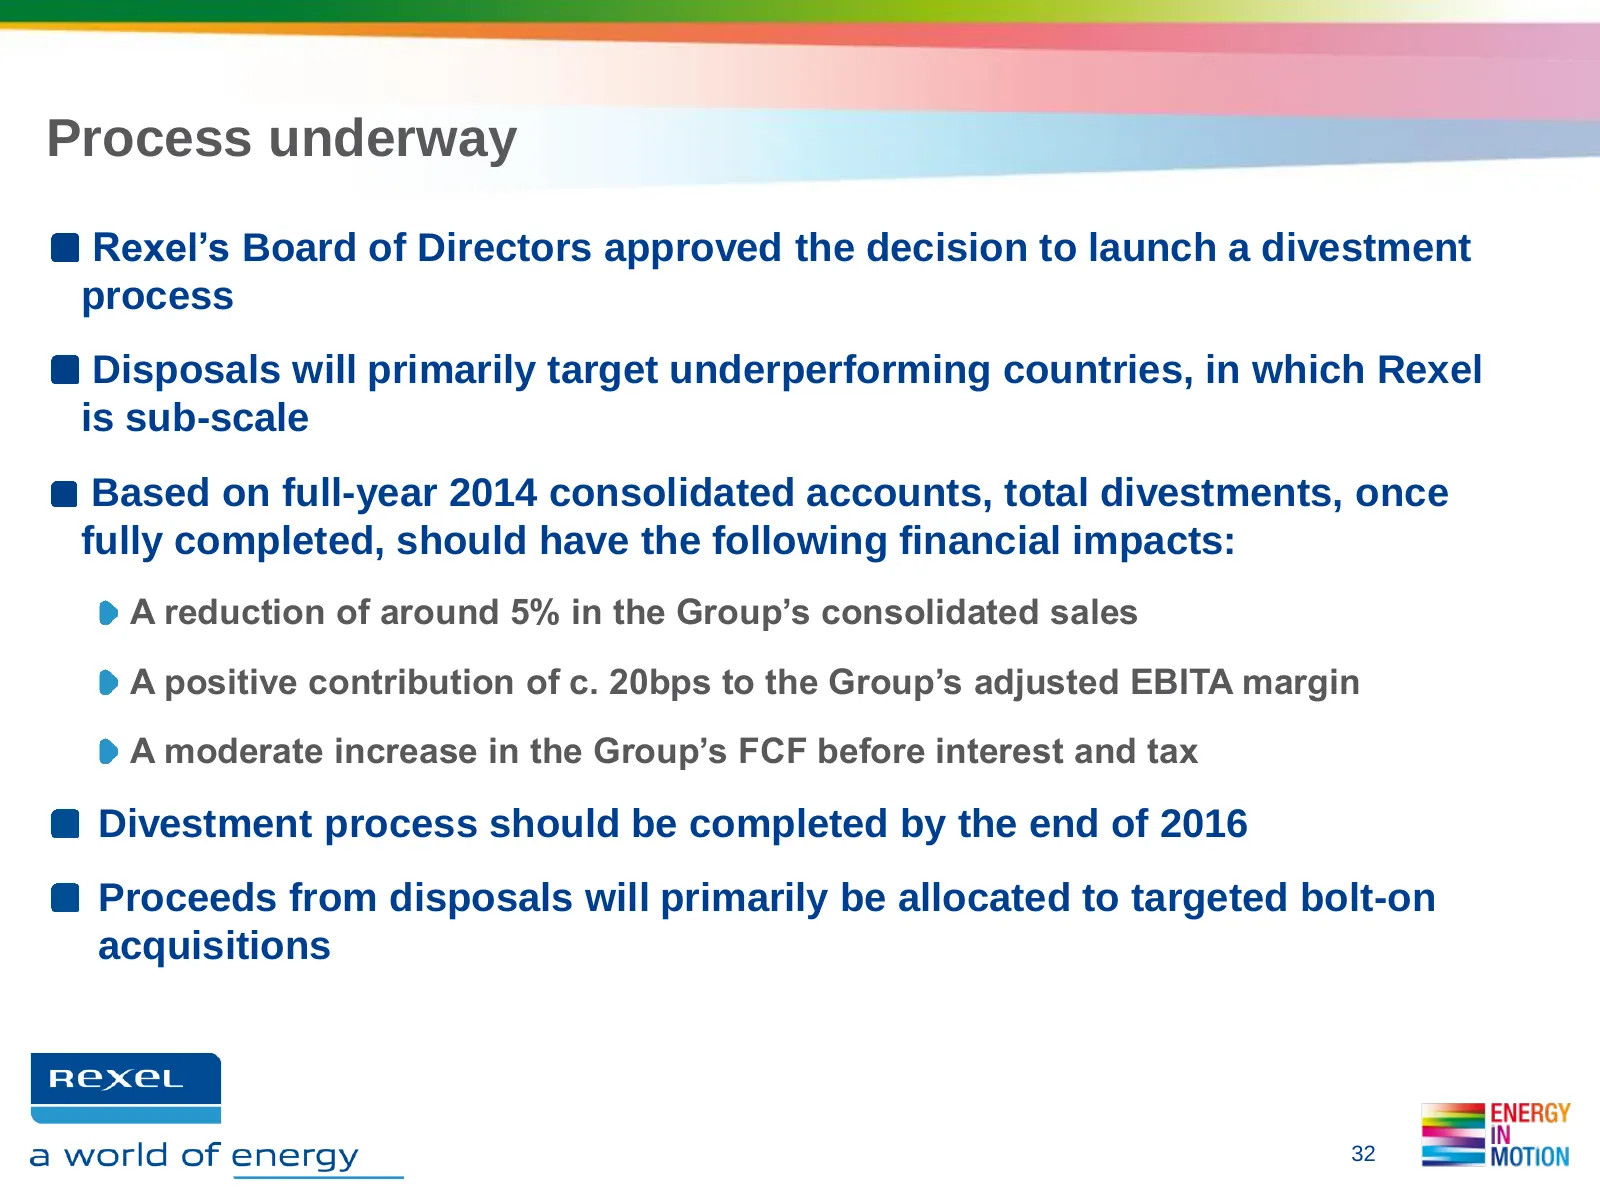
Process underway Rexel’s Board of Directors approved the decision to launch a divestment process Disposals will primarily target underperforming countries, in which Rexel is sub-scale Based on full-year 2014 consolidated accounts, total divestments, once fully completed, should have the following fi
Slide 33: New Organization
4 » NEW ORGANIZATION RexeL fe a world of energy ENERG) IN MOTION
Slide 34: A streamlined Executive Committee
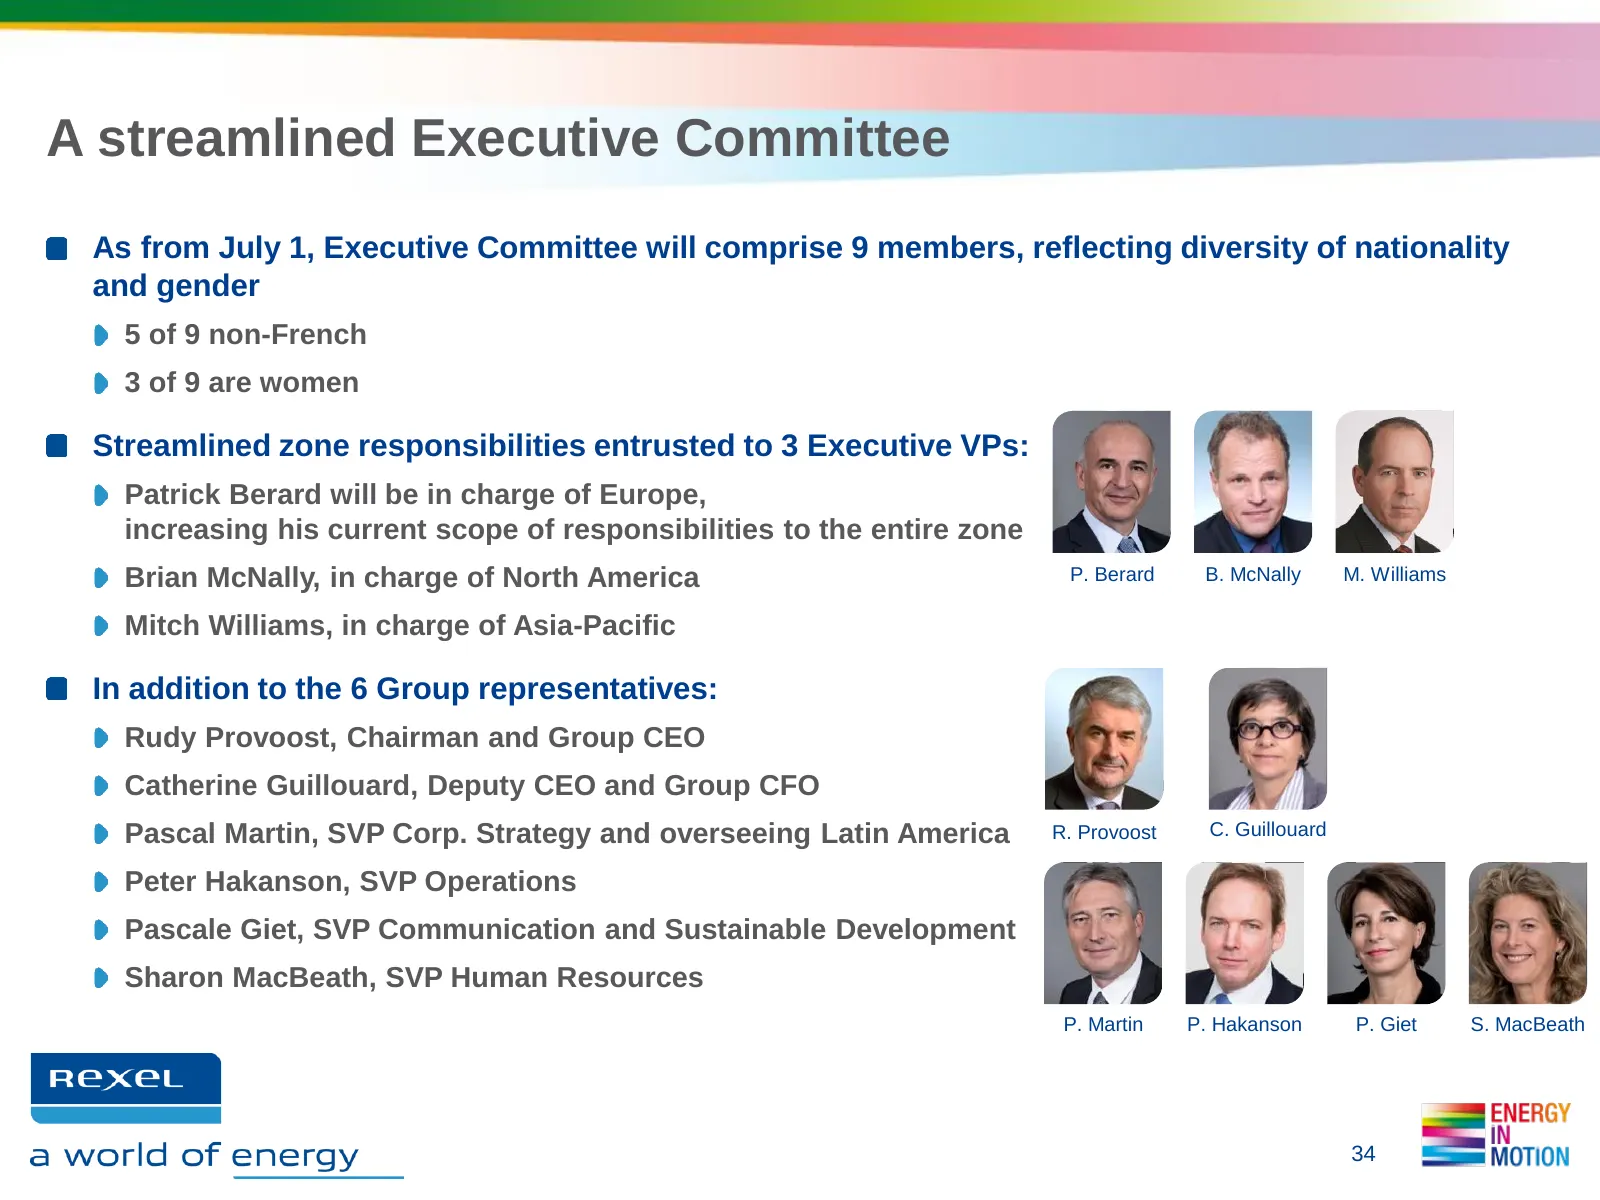
A streamlined Executive Committee As from July 1, Executive Committee will comprise 9 members, reflecting diversity of nationality and gender 5 of 9 non-French 3 of 9 are women Streamlined zone responsibilities entrusted to 3 Executive VPs: Patrick Berard will be in charge of Europe, increasing his
Slide 35: Simplified management structure reinforcing regional accountability
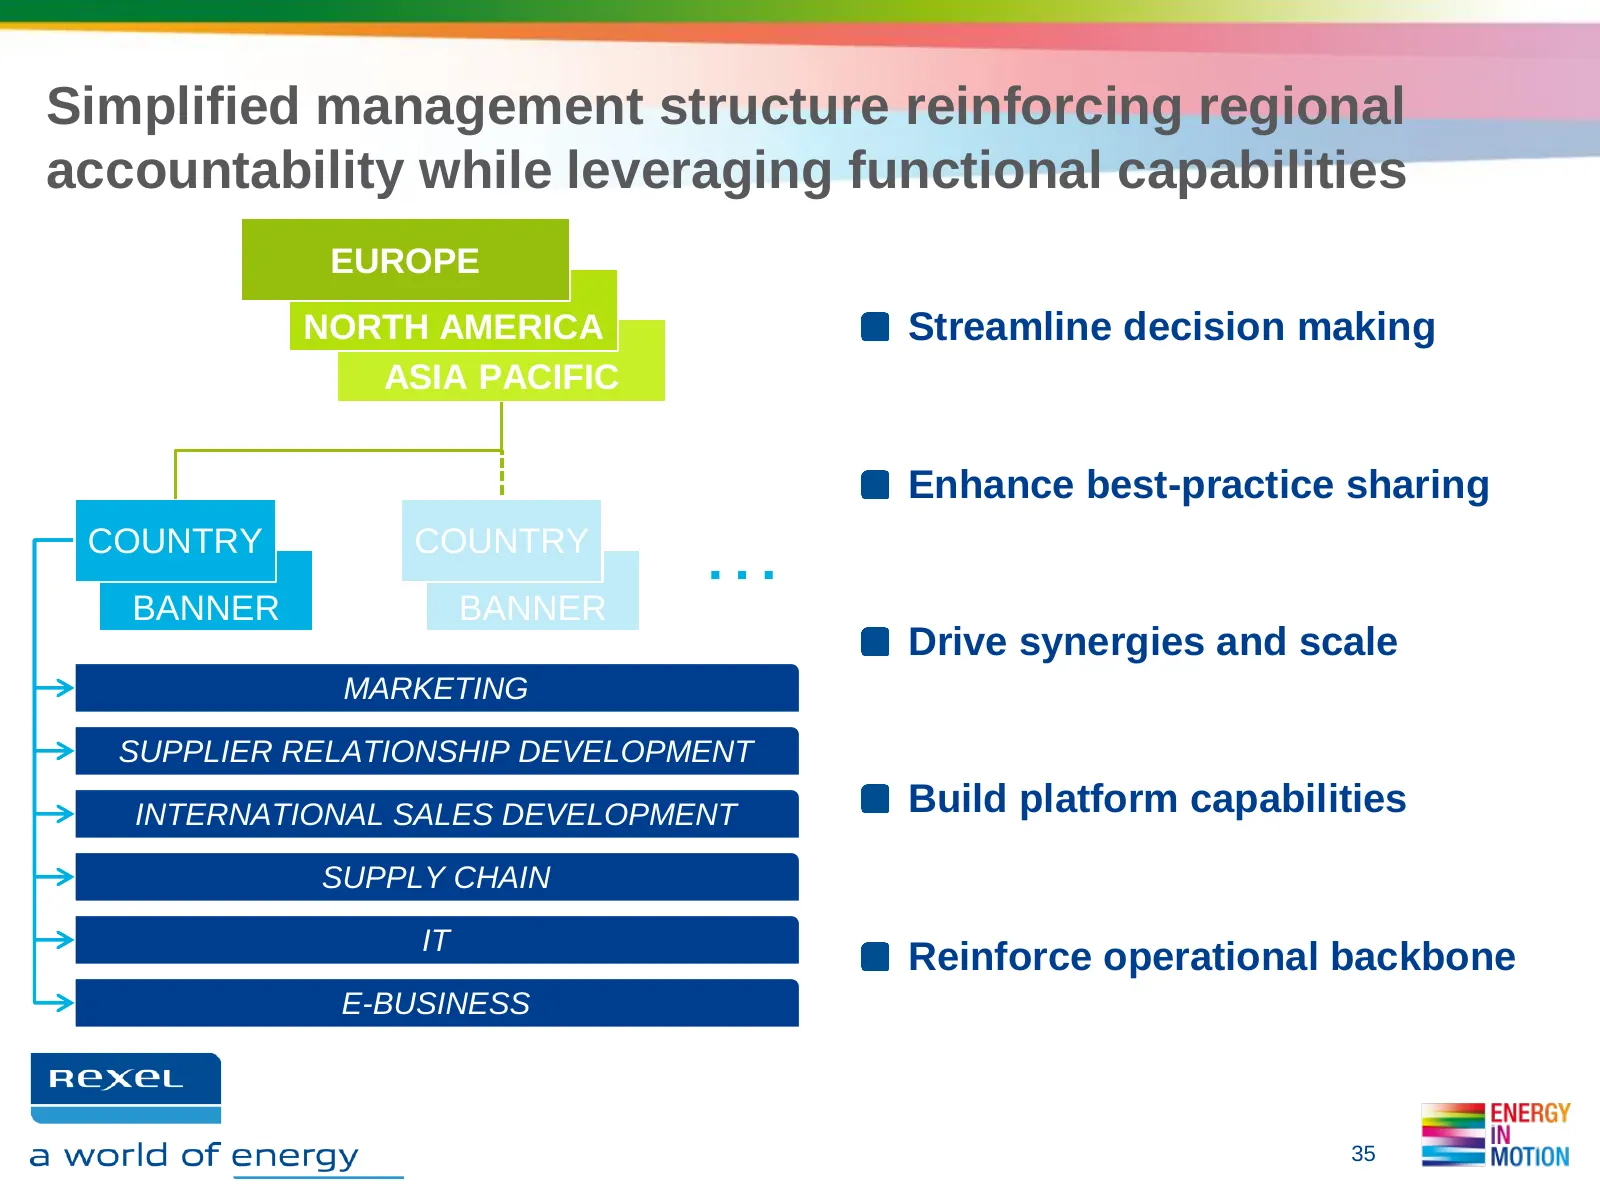
Simplified management structure reinforcing regional accountability while leveraging functional capabilities EUROPE NORTH AMERICA Streamline decision making ASIA PACIFIC Enhance best-practice sharing COUNTRY COUNTRY … BANNER BANNER Drive synergies and scale MARKETING SUPPLIER RELATIONSHIP DEVELOPMEN
Slide 36: Focus on Europe and North America
5. FOCUS ON EUROPE AND NORTH AMERICA
Slide 37: Focus on Europe
FOCUS ON EUROPE PATRICK BERARD
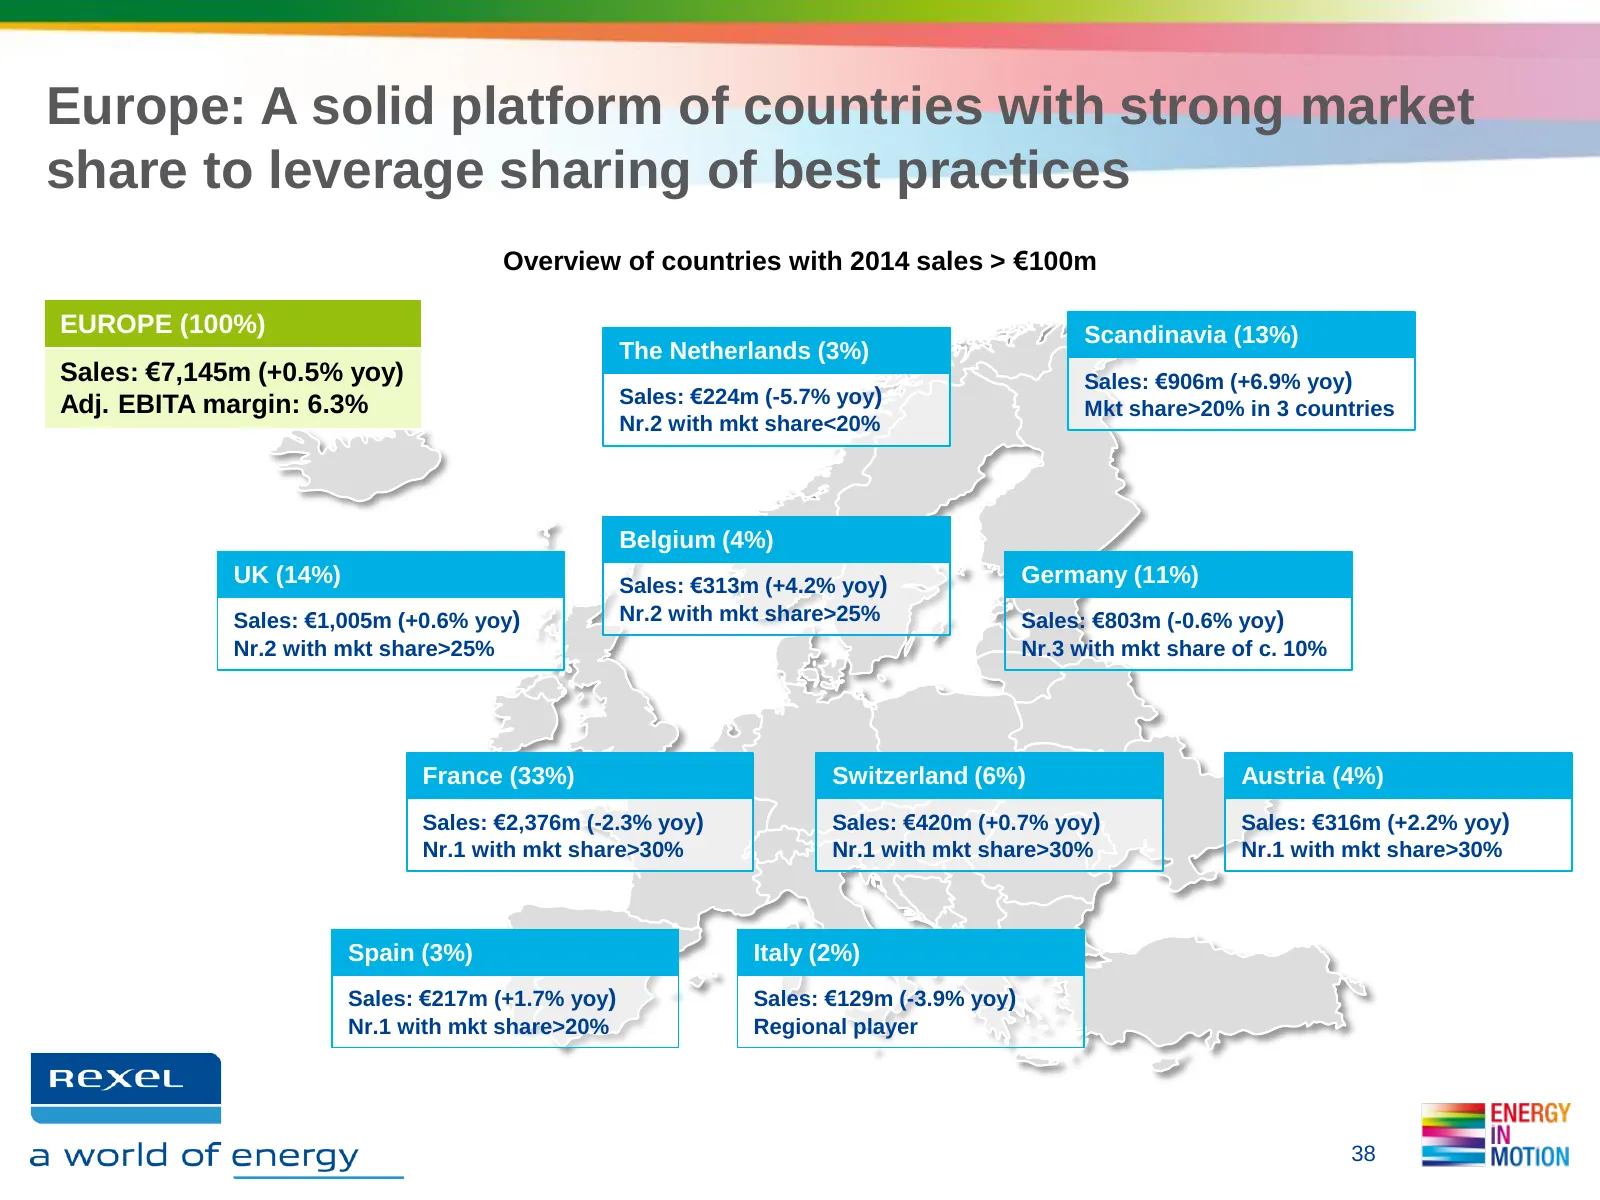
Slide 38: Europe: A solid platform of countries with strong market share
Europe: A solid platform of countries with strong market share to leverage sharing of best practices Overview of countries with 2014 sales > €100m EUROPE (100%) Scandinavia (13%) The Netherlands (3%) Sales: €7,145m (+0.5% yoy) Sales: €906m (+6.9% yoy) Adj. EBITA margin: 6.3% Sales: €224m (-5.7% yoy)
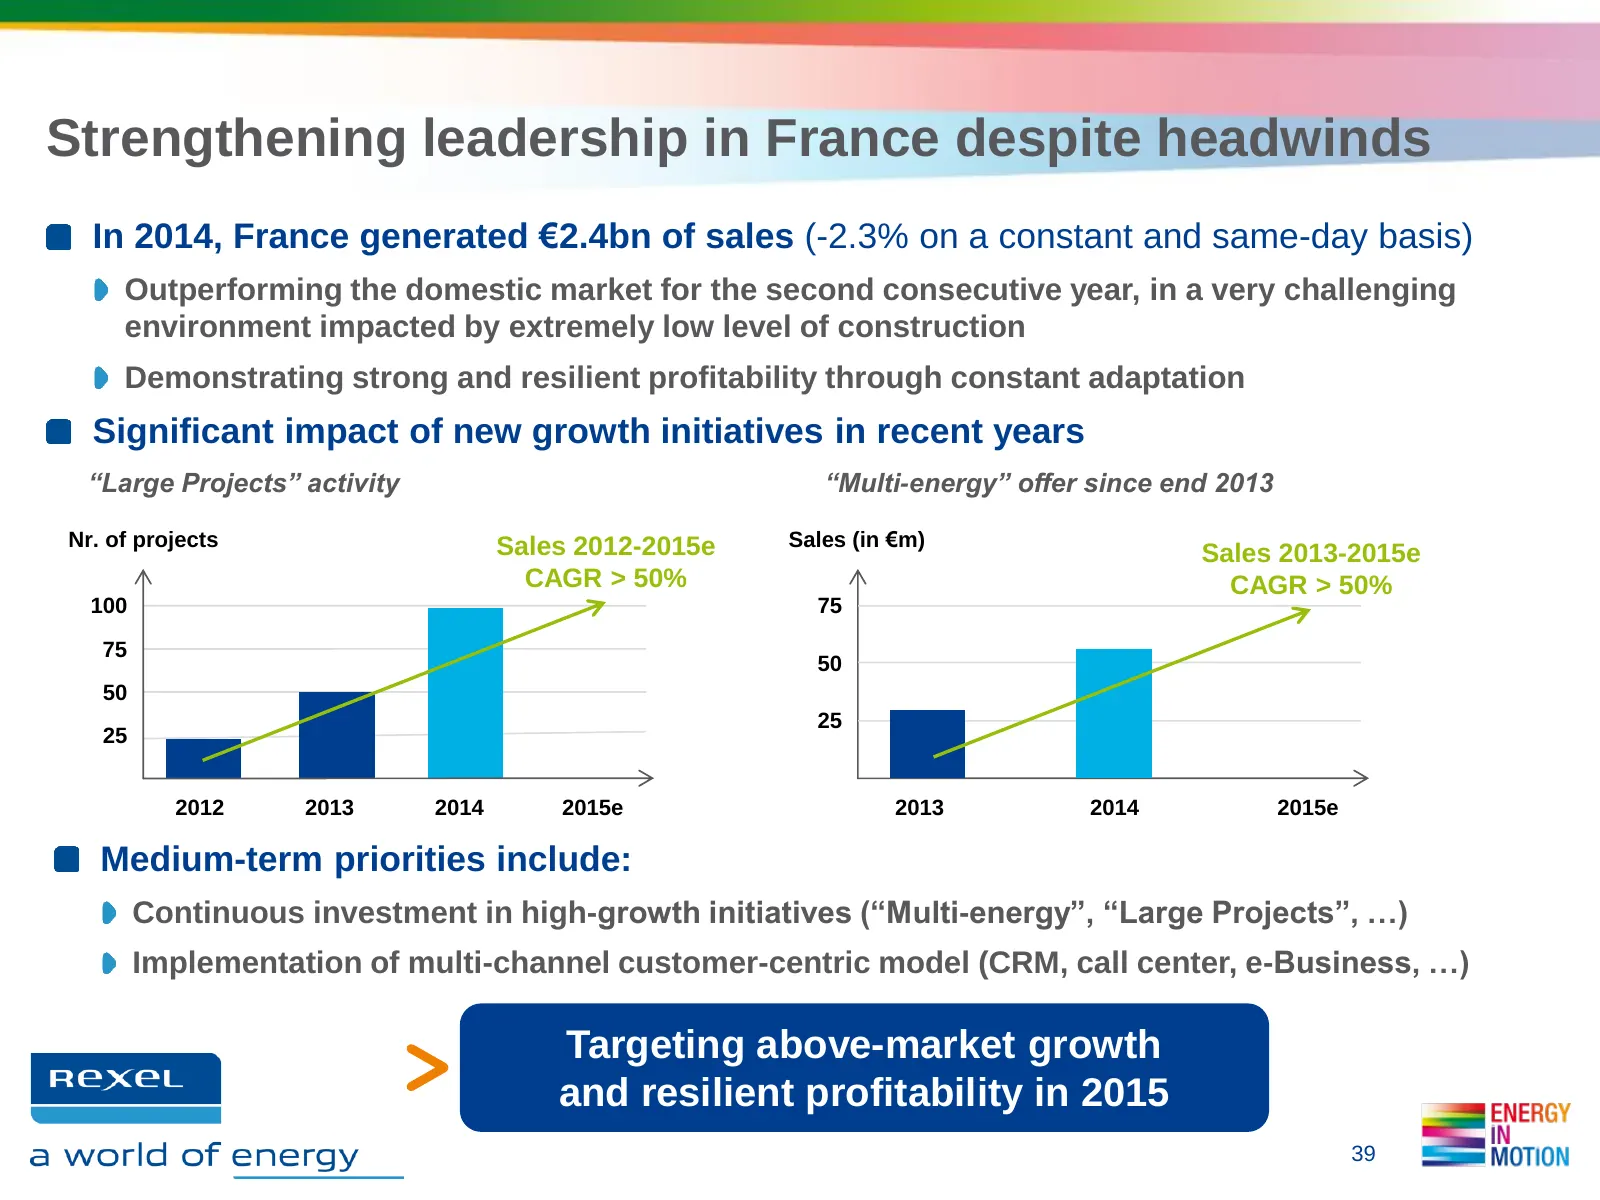
Slide 39: Strengthening leadership in France despite headwinds
Strengthening leadership in France despite headwinds In 2014, France generated €2.4bn of sales (-2.3% on a constant and same-day basis) Outperforming the domestic market for the second consecutive year, in a very challenging environment impacted by extremely low level of construction Demonstrating s
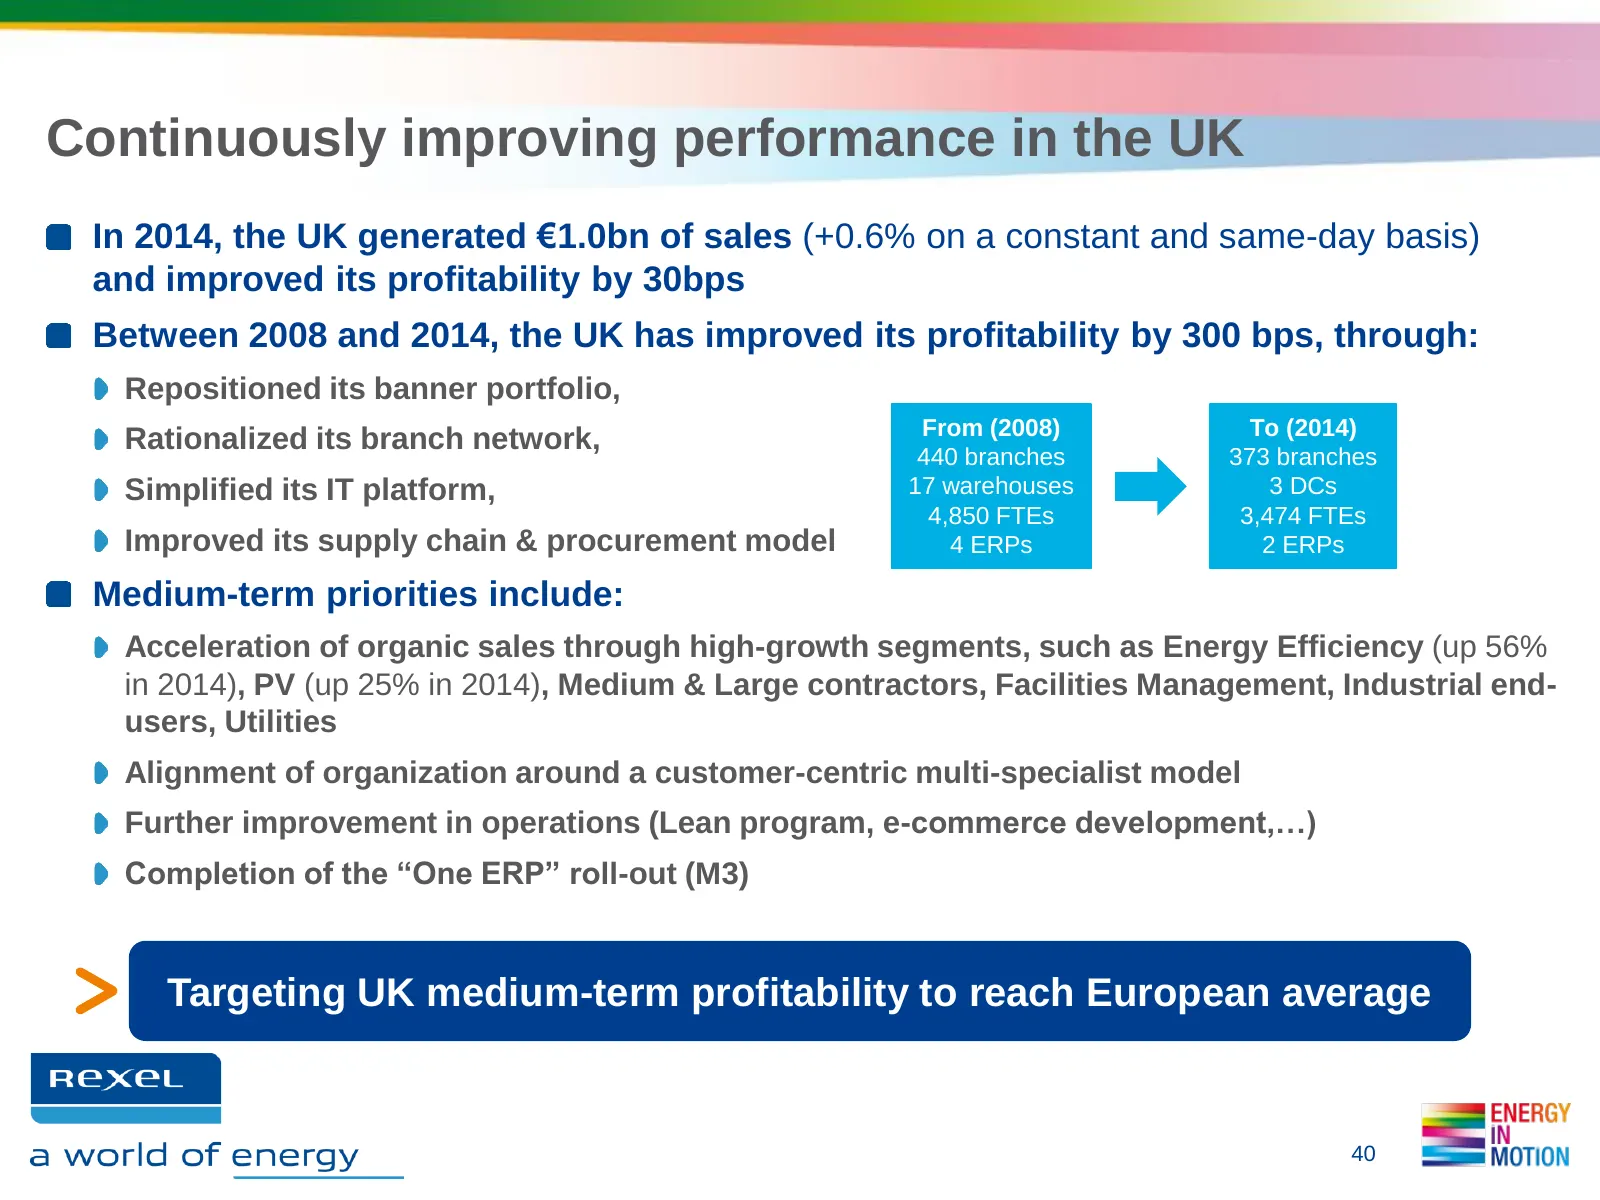
Slide 40: Continuously improving performance in the UK
Continuously improving performance in the UK In 2014, the UK generated €1.0bn of sales (+0.6% on a constant and same-day basis) and improved its profitability by 30bps Between 2008 and 2014, the UK has improved its profitability by 300 bps, through: Repositioned its banner portfolio, From (2008) To
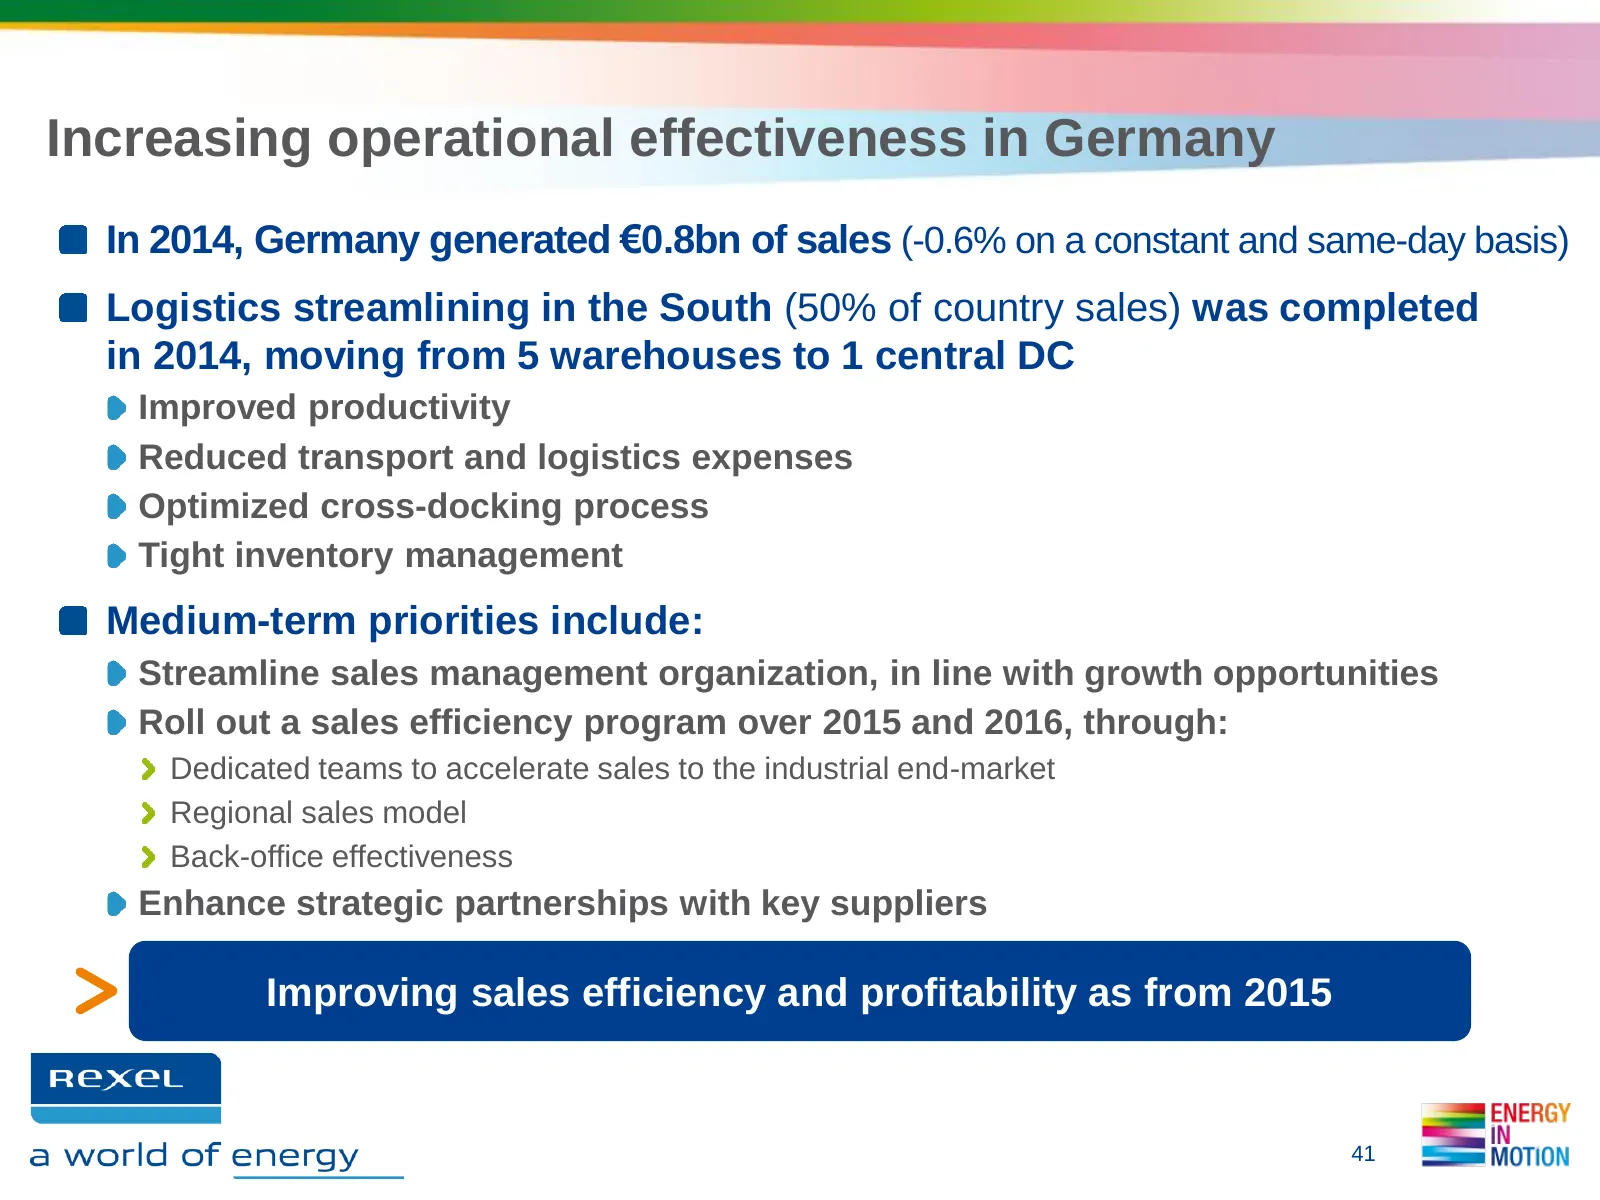
Slide 41: Increasing operational effectiveness in Germany
Increasing operational effectiveness in Germany In 2014, Germany generated €0.8bn of sales (-0.6% on a constant and same-day basis) Logistics streamlining in the South (50% of country sales) was completed in 2014, moving from 5 warehouses to 1 central DC Improved productivity Reduced transport and l
Slide 42: Focus on North America
FOCUS ON NORTH AMERICA BRIAN McNALLY
Slide 43: North America: A strategic market for Rexel
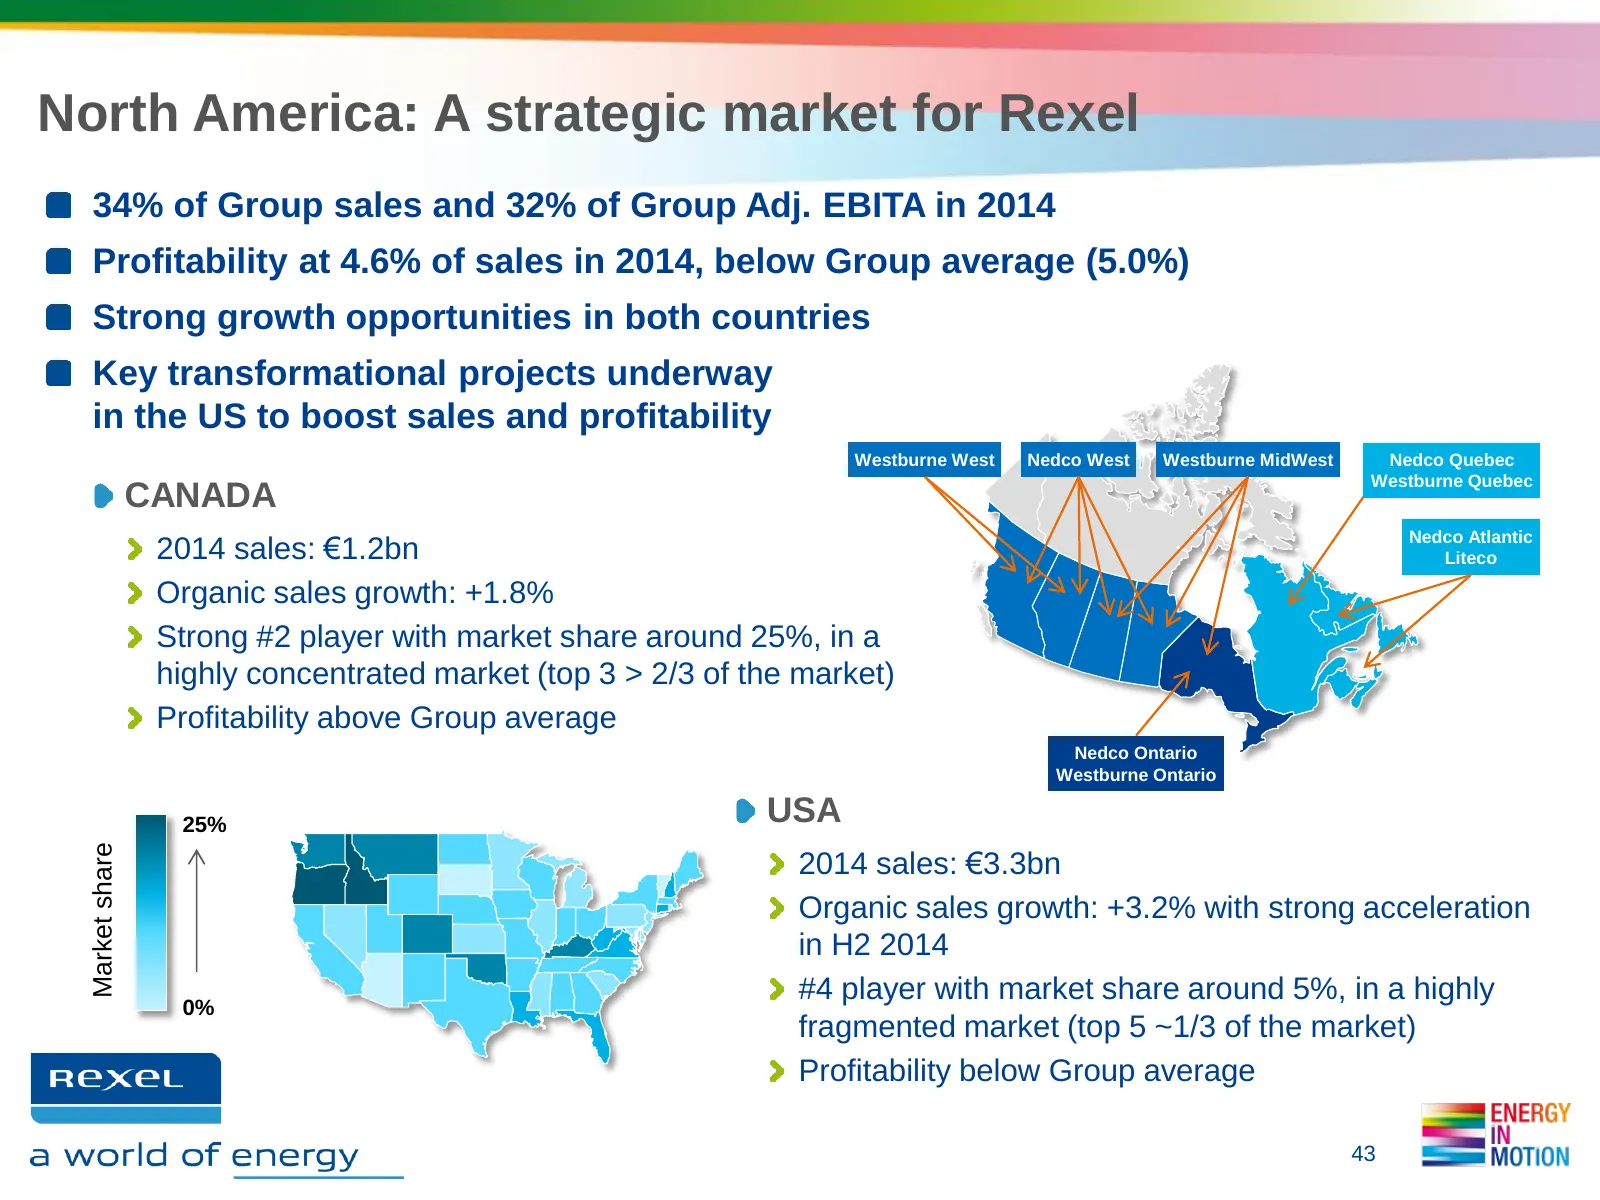
North America: A strategic market for Rexel 34% of Group sales and 32% of Group Adj. EBITA in 2014 Profitability at 4.6% of sales in 2014, below Group average (5.0%) Strong growth opportunities in both countries Key transformational projects underway in the US to boost sales and profitability Westbu
Slide 44: USA: New Go-To-Market model
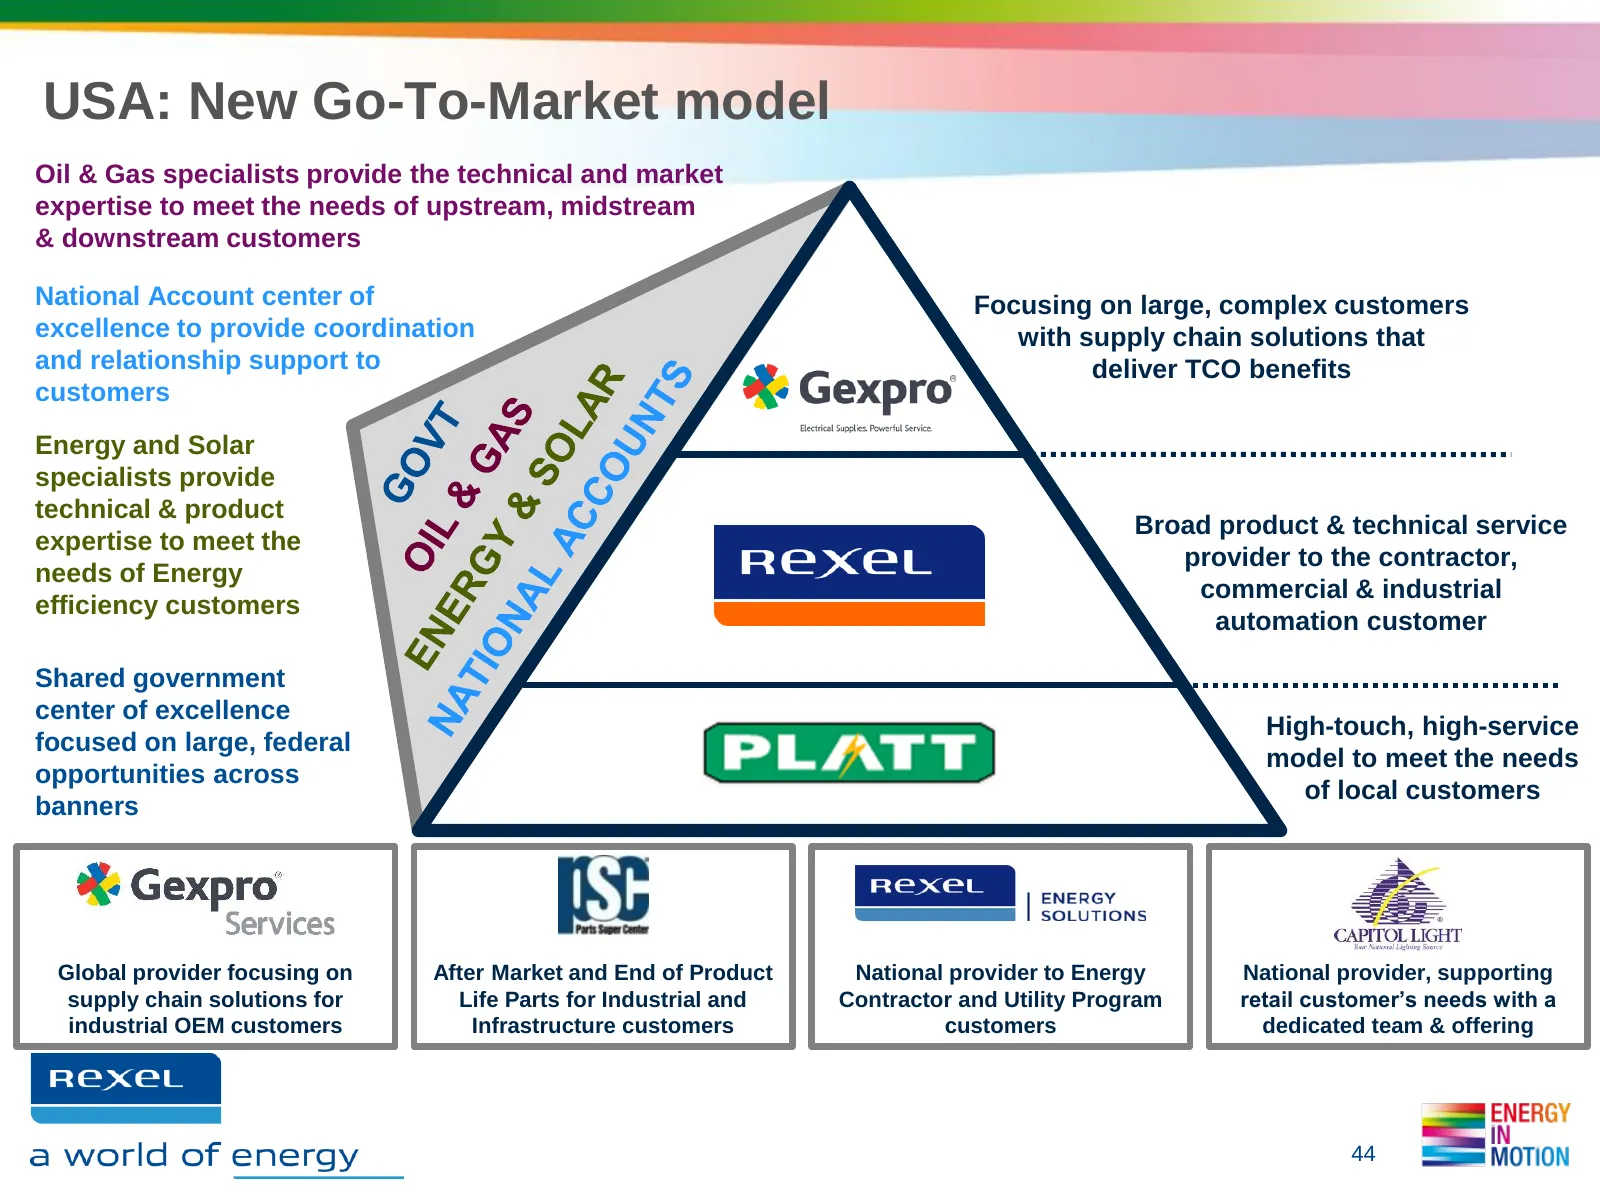
USA: New Go-To-Market model Oil & Gas specialists provide the technical and market expertise to meet the needs of upstream, midstream & downstream customers National Account center of Focusing on large, complex customers excellence to provide coordination with supply chain solutions that and relatio
Slide 45: USA: growth priorities
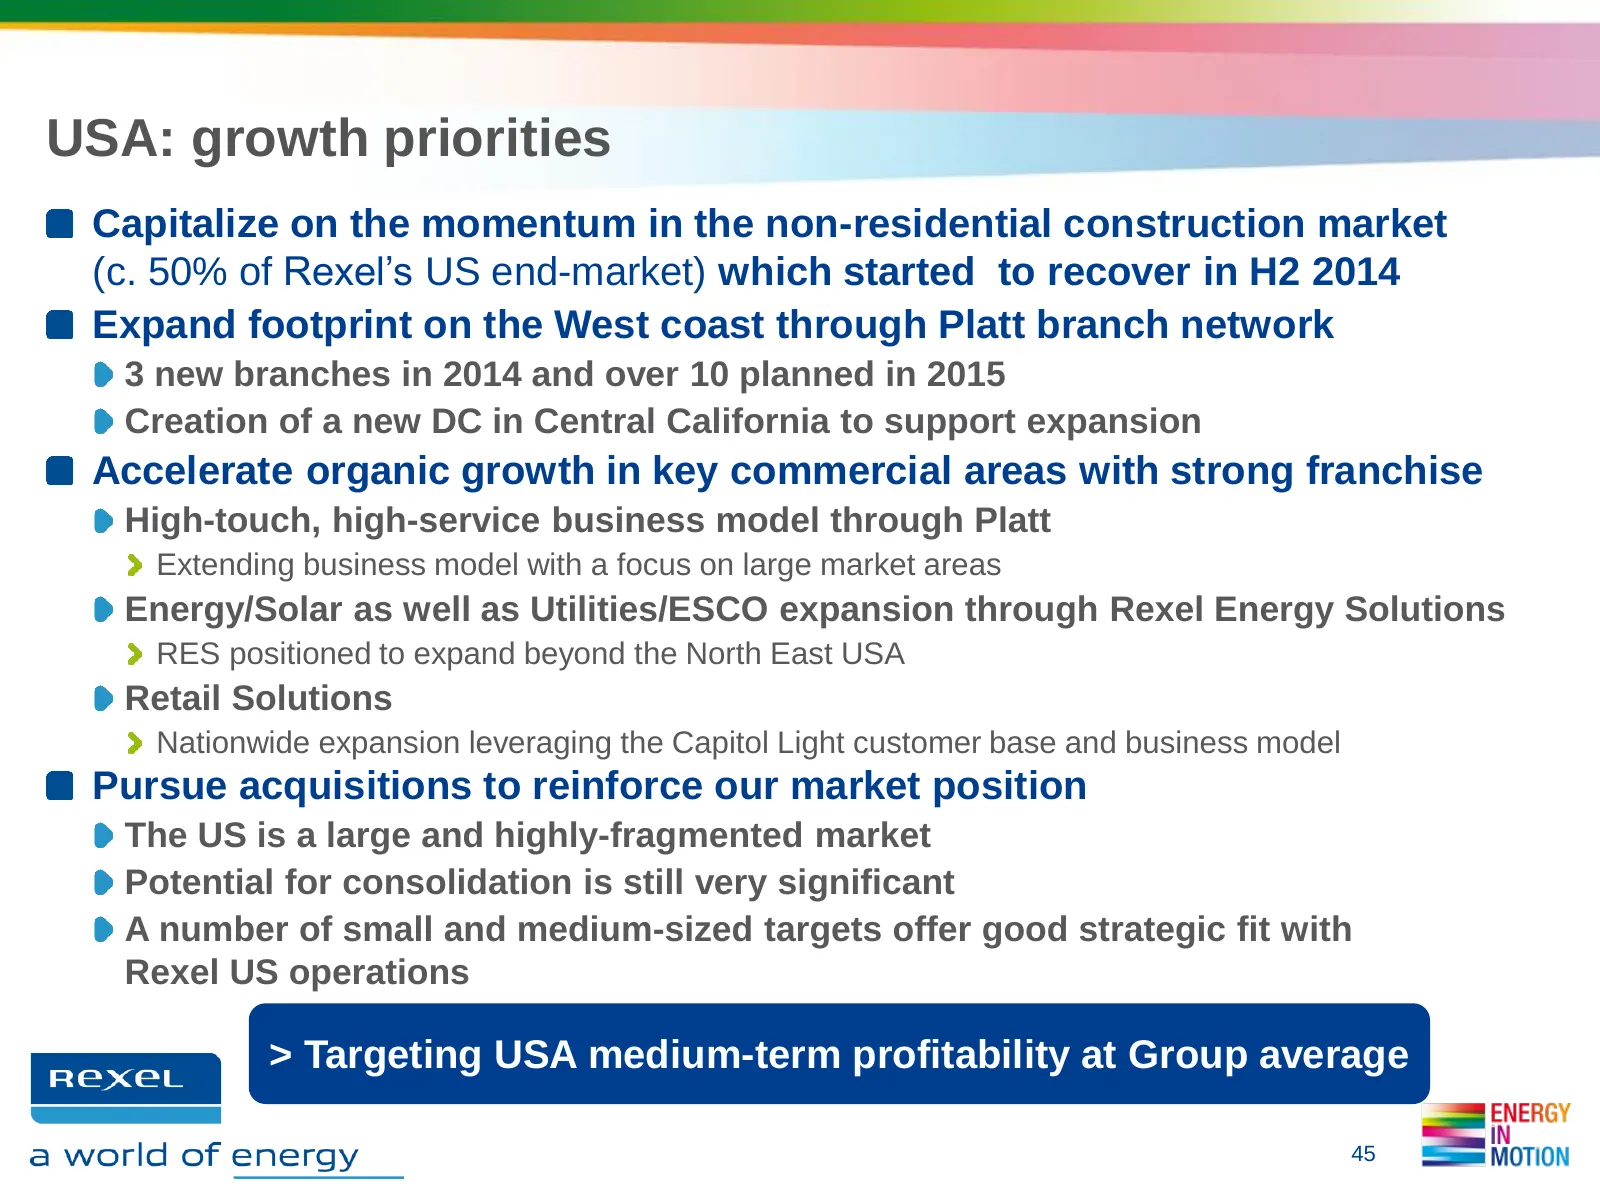
USA: growth priorities Capitalize on the momentum in the non-residential construction market (c. 50% of Rexel’s US end-market) which started to recover in H2 2014 Expand footprint on the West coast through Platt branch network 3 new branches in 2014 and over 10 planned in 2015 Creation of a new DC i
Slide 46: USA: Update on the Single ERP project
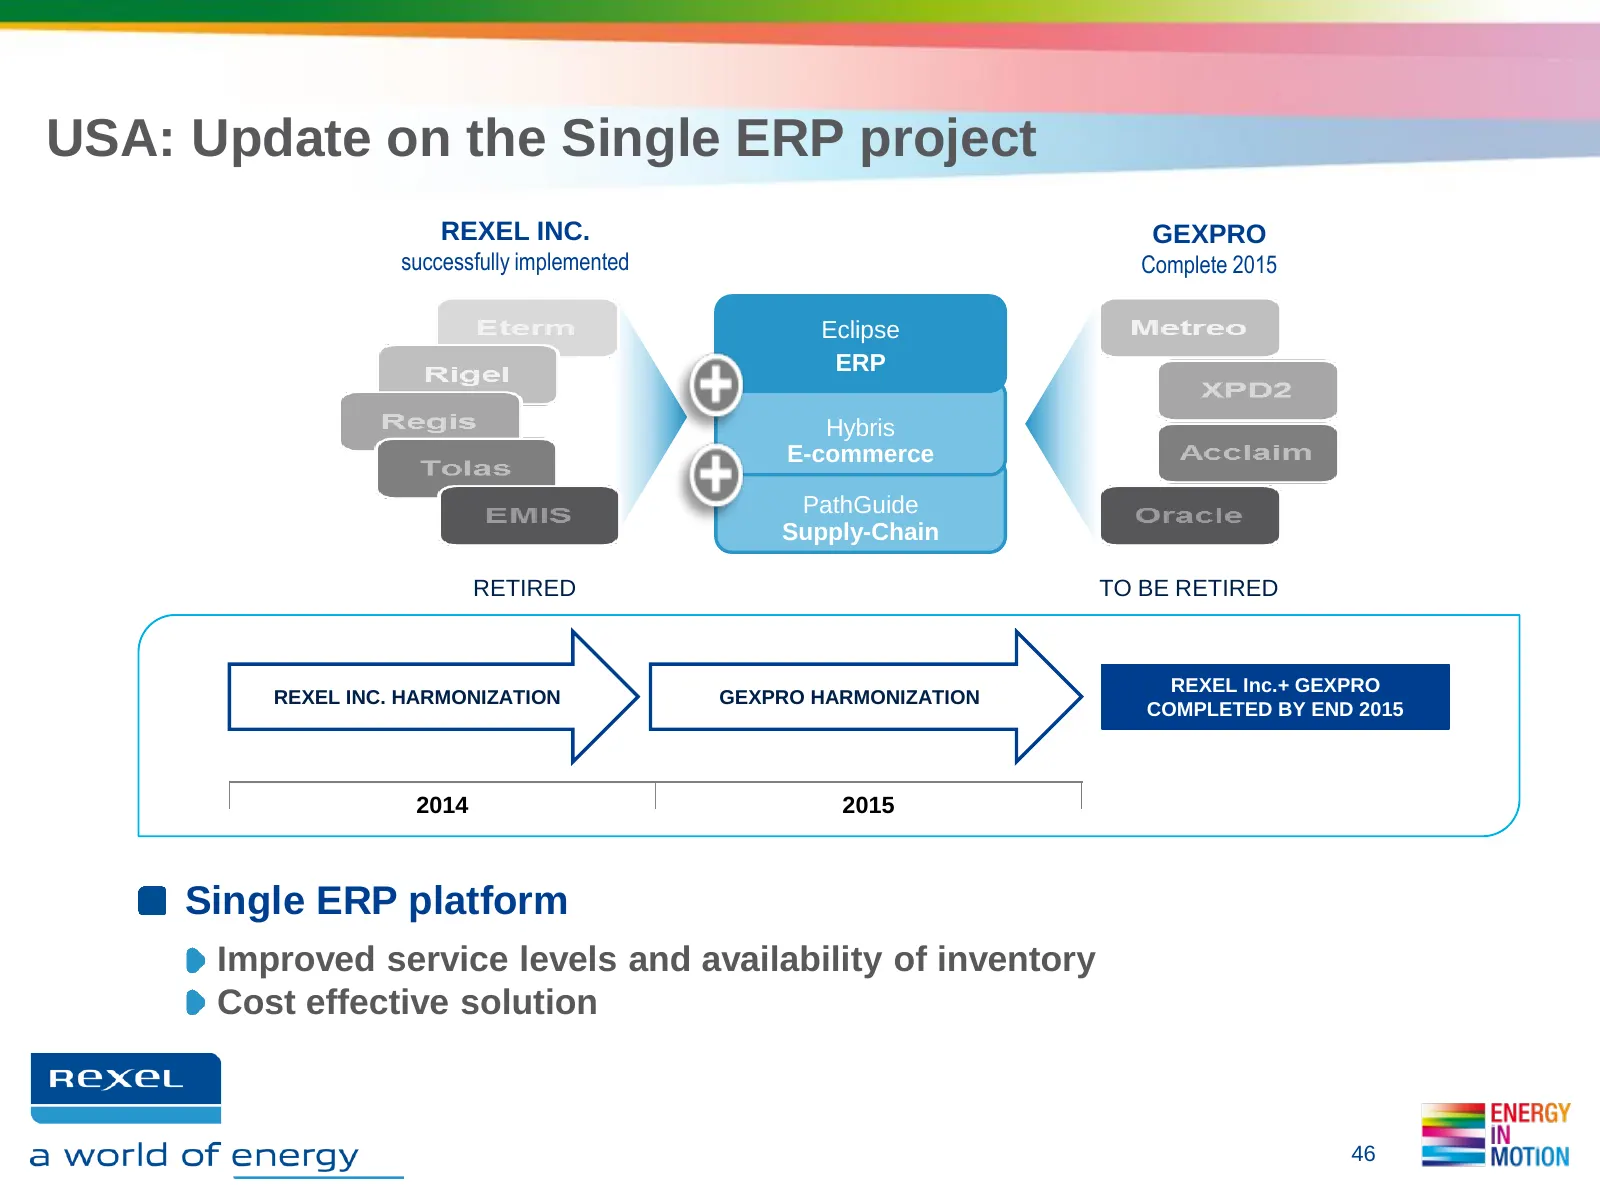
USA: Update on the Single ERP project REXEL INC. GEXPRO successfully implemented Complete 2015 Eclipse ERP Hybris E-commerce PathGuide Supply-Chain RETIRED TO BE RETIRED REXEL Inc.+ GEXPRO REXEL INC. HARMONIZATION GEXPRO HARMONIZATION COMPLETED BY END 2015 2014 2015 Single ERP platform Improved serv
Slide 47: USA: Update on the logistics network optimization project
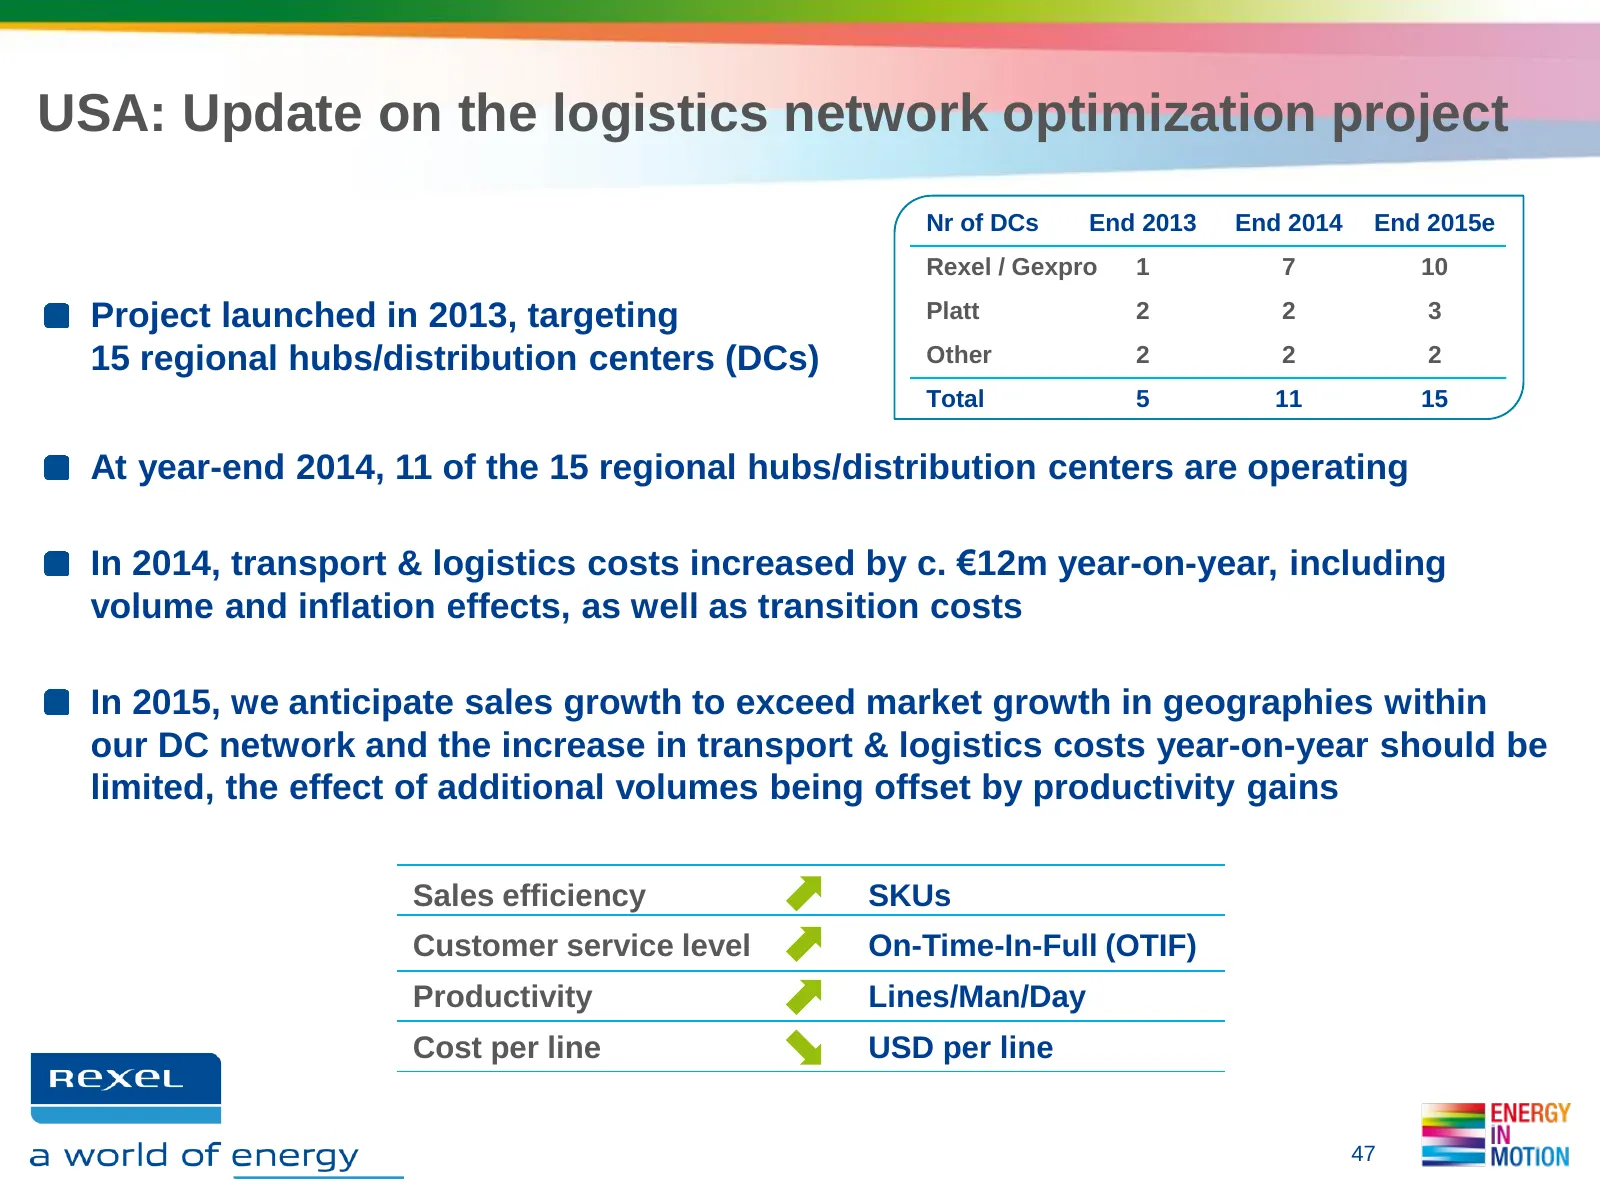
USA: Update on the logistics network optimization project Nr of DCs End 2013 End 2014 End 2015e Rexel / Gexpro 1 7 10 Project launched in 2013, targeting Platt 2 2 3 15 regional hubs/distribution centers (DCs) Other 2 2 2 Total 5 11 15 At year-end 2014, 11 of the 15 regional hubs/distribution center
Slide 48: Canada: opportunities to grow sales and margins
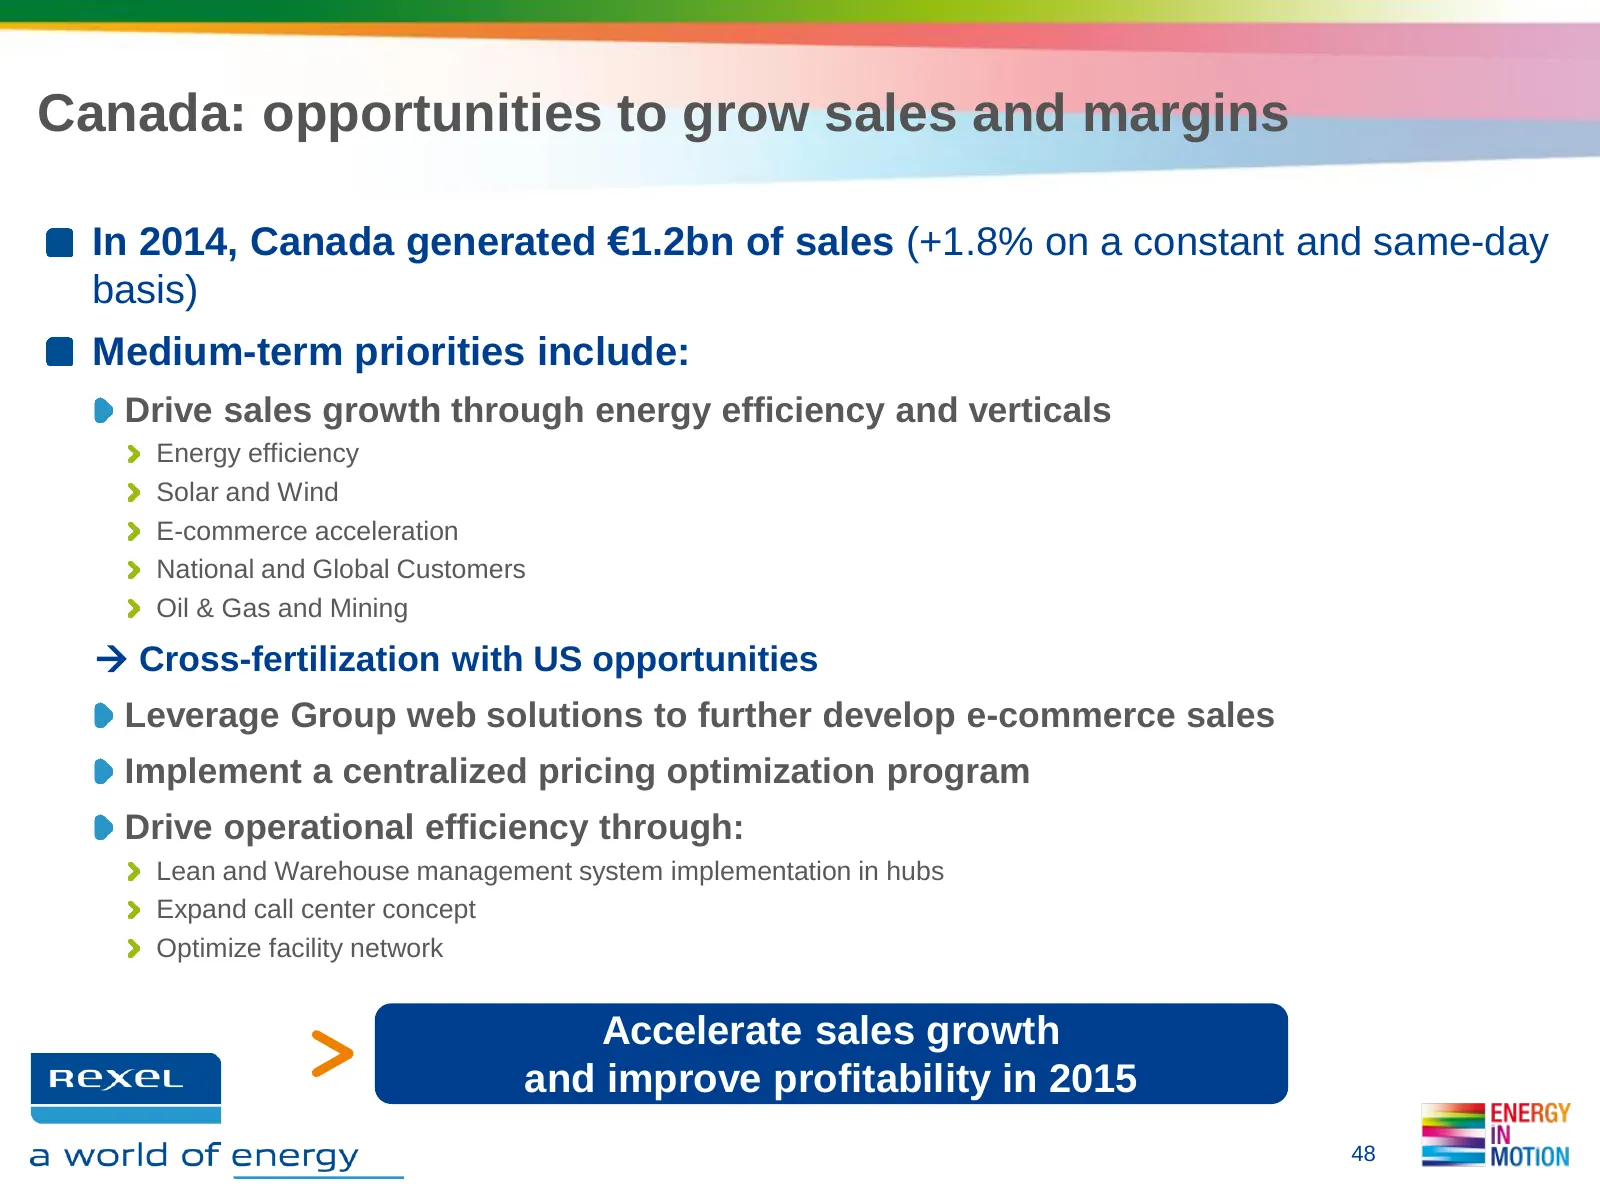
Canada: opportunities to grow sales and margins In 2014, Canada generated €1.2bn of sales (+1.8% on a constant and same-day basis) Medium-term priorities include: Drive sales growth through energy efficiency and verticals Energy efficiency Solar and Wind E-commerce acceleration National and Global C

Slide 49: 2015 Outlook
6 » 2015 OUTLOOK RexeL fe a world of energy
Slide 50: 2015 outlook
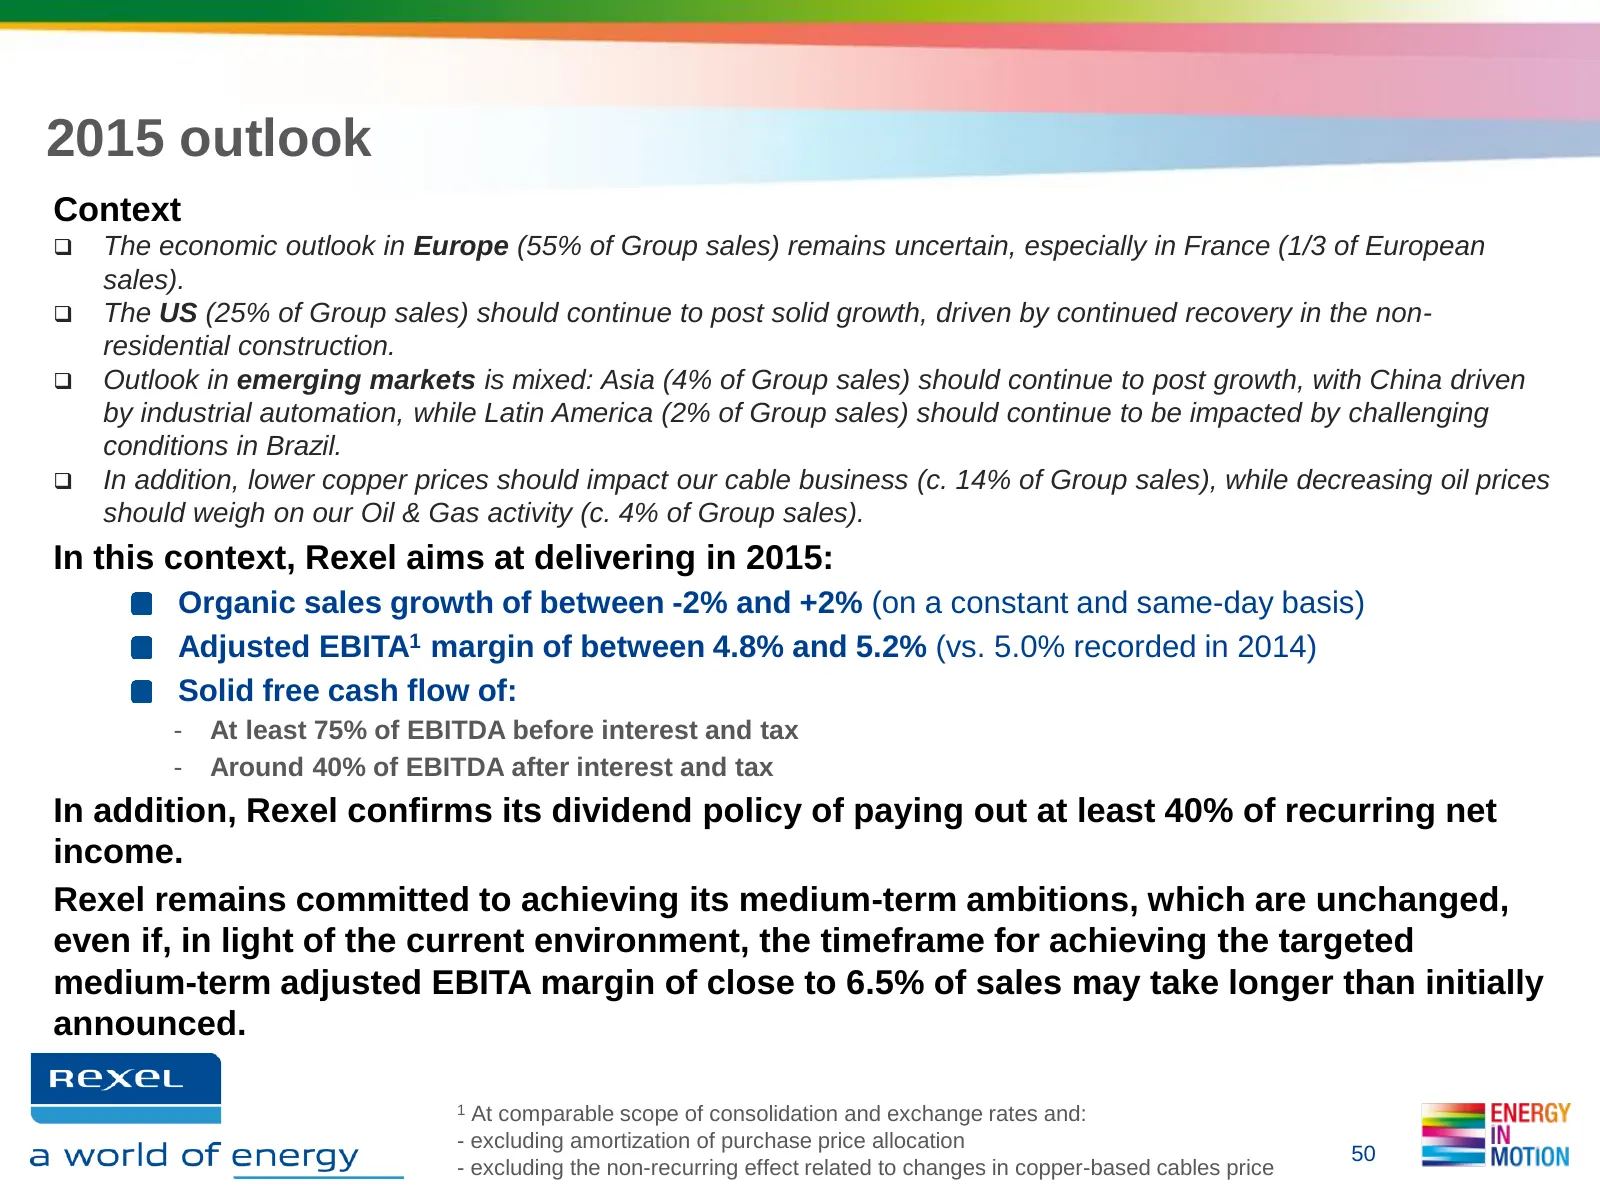
2015 outlook Context The economic outlook in Europe (55% of Group sales) remains uncertain, especially in France (1/3 of European sales). The US (25% of Group sales) should continue to post solid growth, driven by continued recovery in the non- residential construction. Outlook in emerging mar
Slide 51: Appendices
APPENDICES RexeL fe a world of energy
Slide 52: Appendix 1: Segment reporting - Group
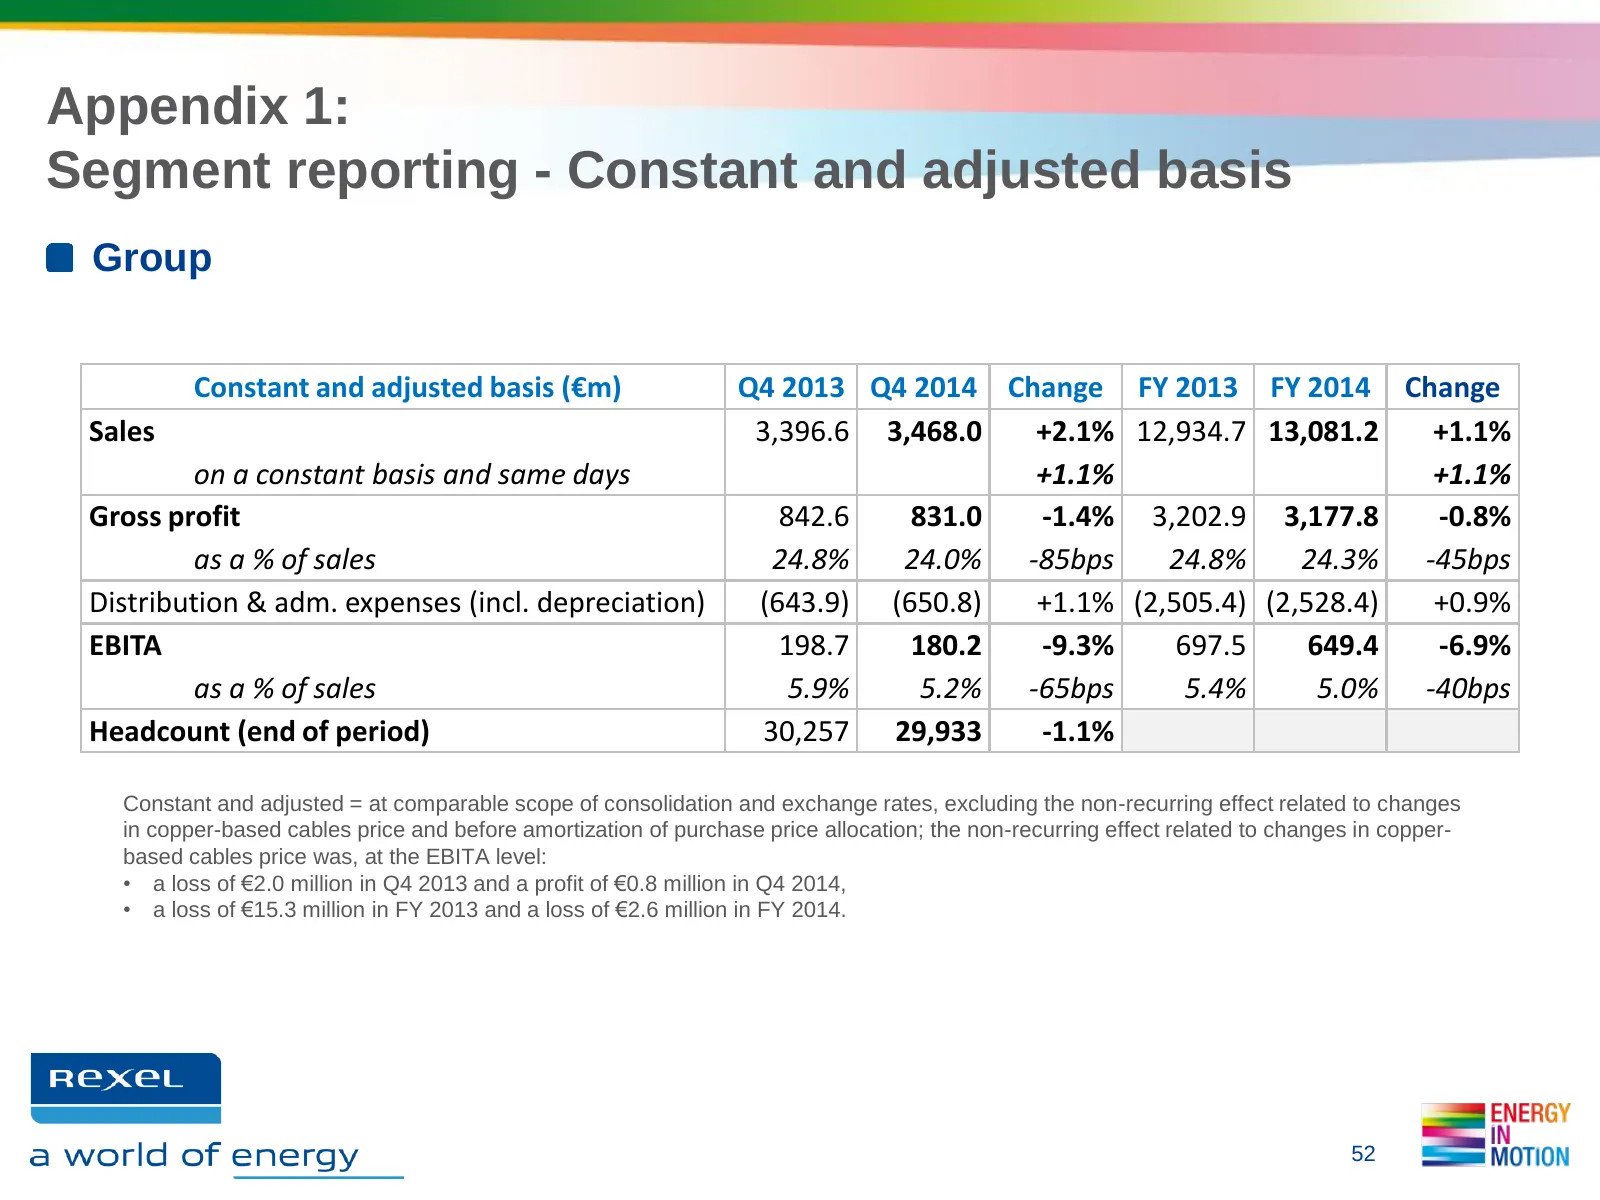
Appendix 1: Segment reporting - Constant and adjusted basis Group Constant and adjusted basis (€m) Q4 2013 Q4 2014 Change FY 2013 FY 2014 Change Sales 3,396.6 3,468.0 +2.1% 12,934.7 13,081.2 +1.1% on a constant basis and same days +1.1% +1.1% Gross profit 842.6 831.0 -1.4% 3,202.9 3,177.8 -0.8% as a
Slide 53: Appendix 1: Segment reporting - Europe
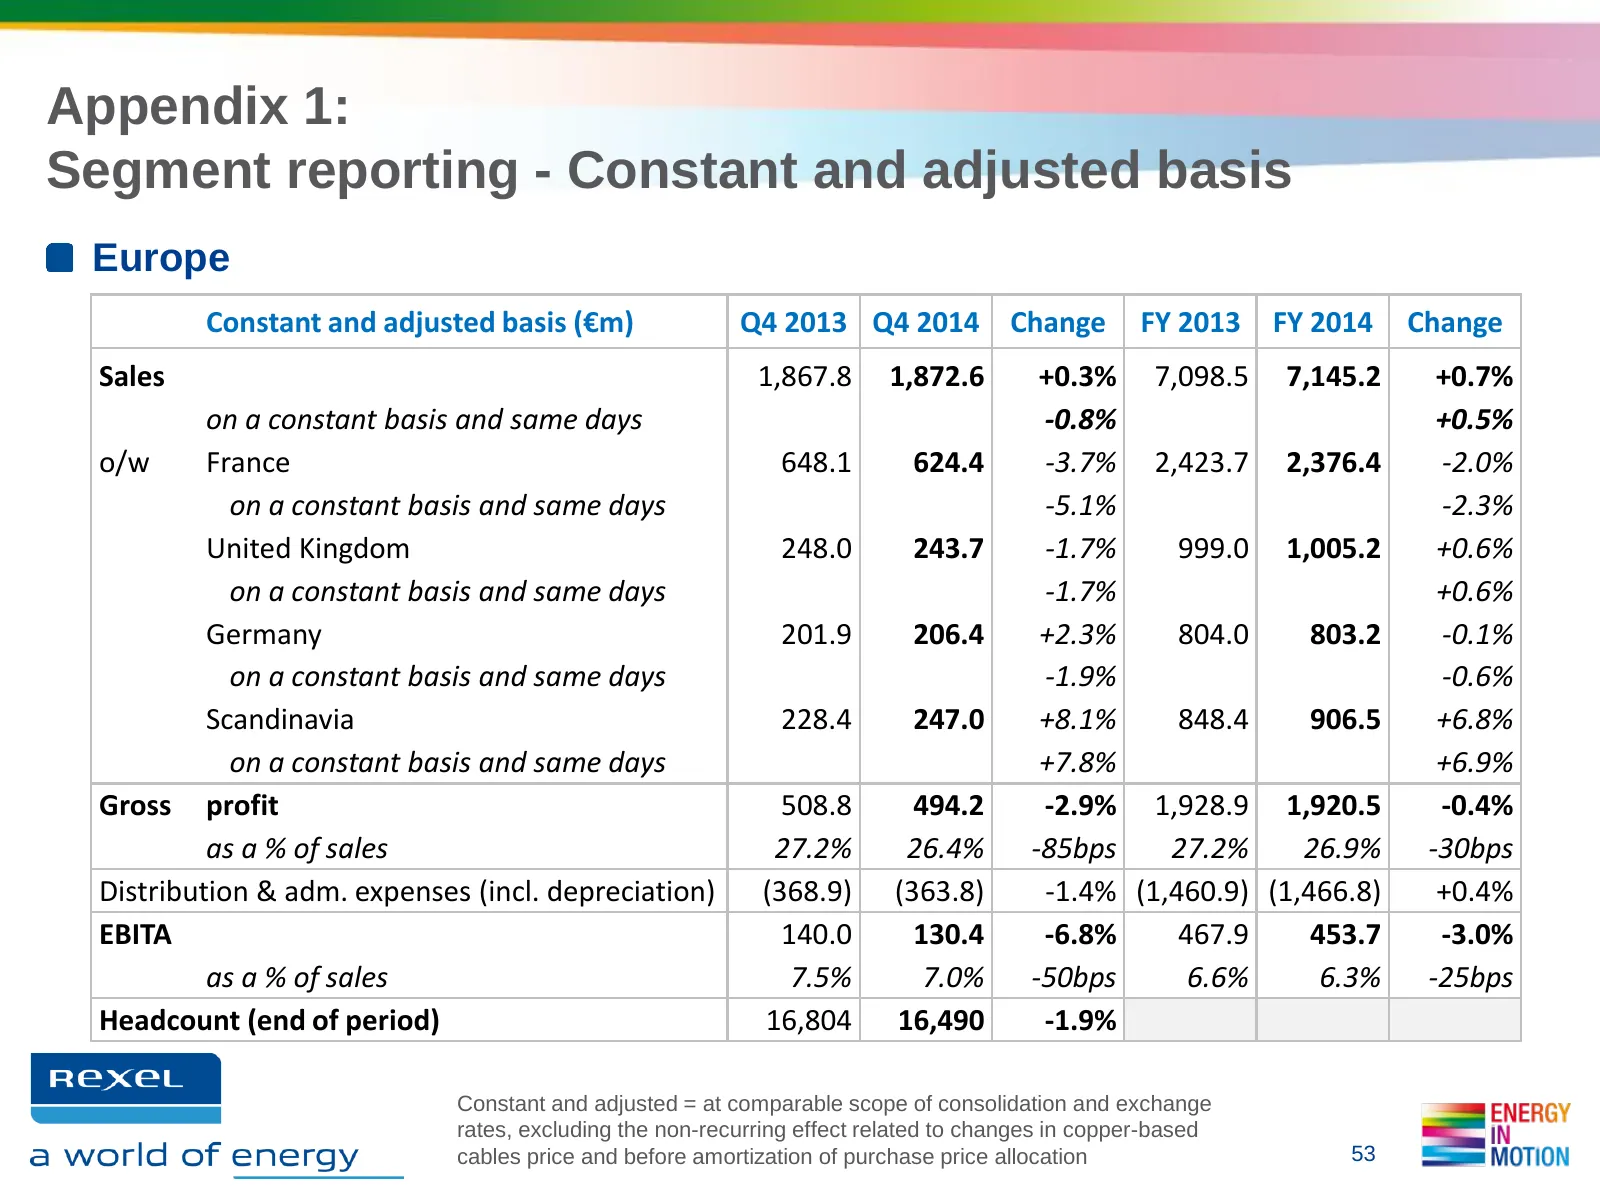
Appendix 1: Segment reporting - Constant and adjusted basis Europe Constant and adjusted basis (€m) Q4 2013 Q4 2014 Change FY 2013 FY 2014 Change Sales 1,867.8 1,872.6 +0.3% 7,098.5 7,145.2 +0.7% on a constant basis and same days -0.8% +0.5% o/w France 648.1 624.4 -3.7% 2,423.7 2,376.4 -2.0% on a co
Slide 54: Appendix 1: Segment reporting - North America
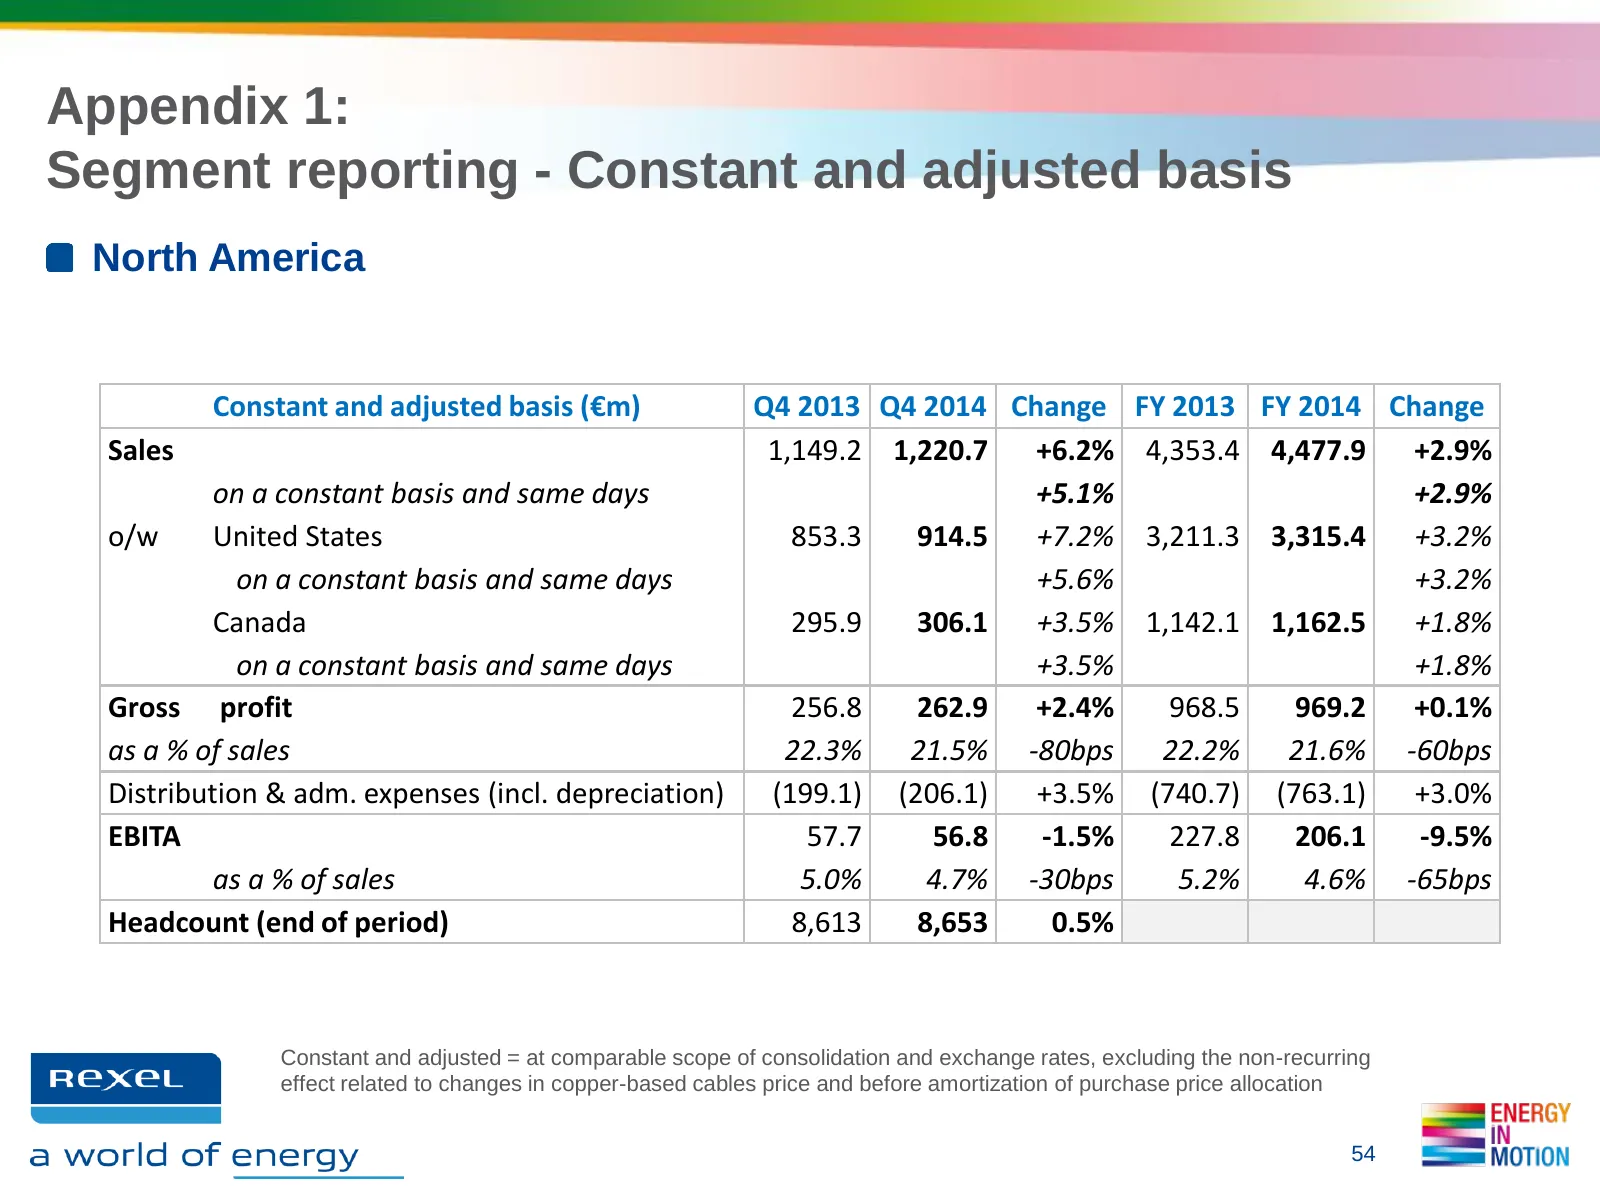
Appendix 1: Segment reporting - Constant and adjusted basis North America Constant and adjusted basis (€m) Q4 2013 Q4 2014 Change FY 2013 FY 2014 Change Sales 1,149.2 1,220.7 +6.2% 4,353.4 4,477.9 +2.9% on a constant basis and same days +5.1% +2.9% o/w United States 853.3 914.5 +7.2% 3,211.3 3,315.4
Slide 55: Appendix 1: Segment reporting - Asia-Pacific
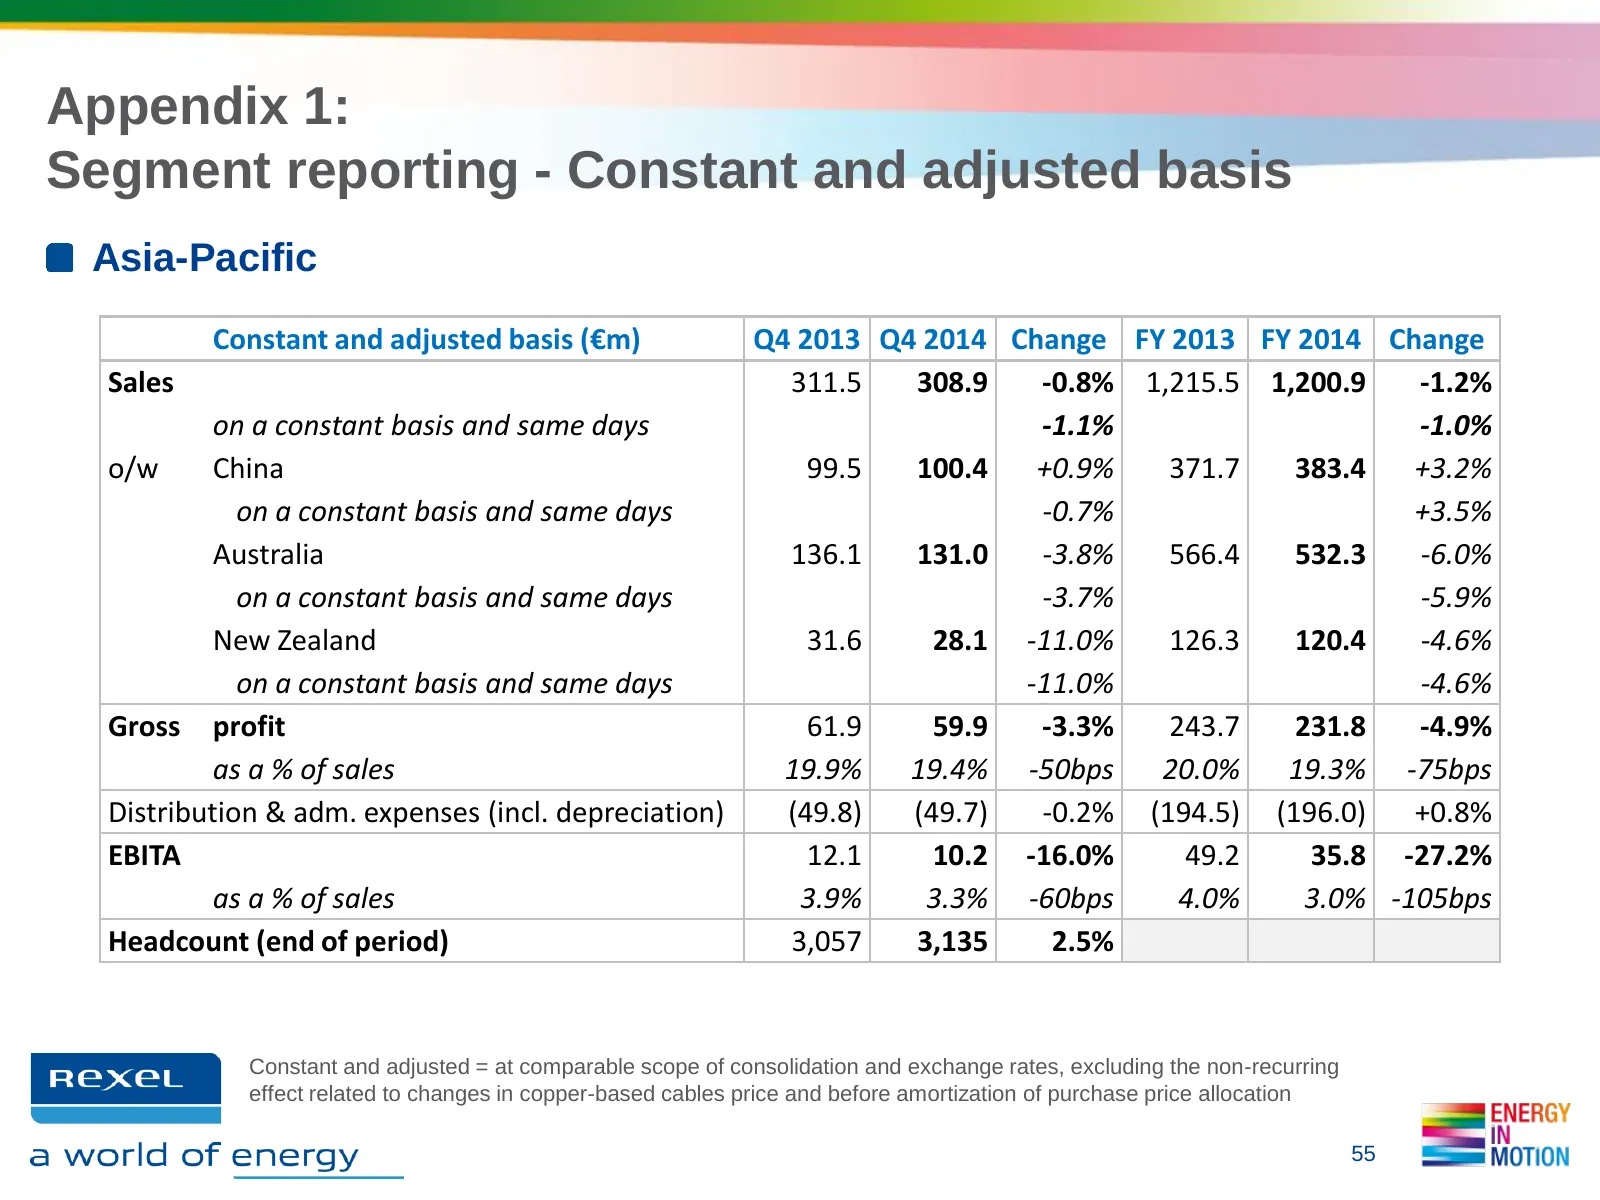
Appendix 1: Segment reporting - Constant and adjusted basis Asia-Pacific Constant and adjusted basis (€m) Q4 2013 Q4 2014 Change FY 2013 FY 2014 Change Sales 311.5 308.9 -0.8% 1,215.5 1,200.9 -1.2% on a constant basis and same days -1.1% -1.0% o/w China 99.5 100.4 +0.9% 371.7 383.4 +3.2% on a consta
Slide 56: Appendix 1: Segment reporting - Latin America
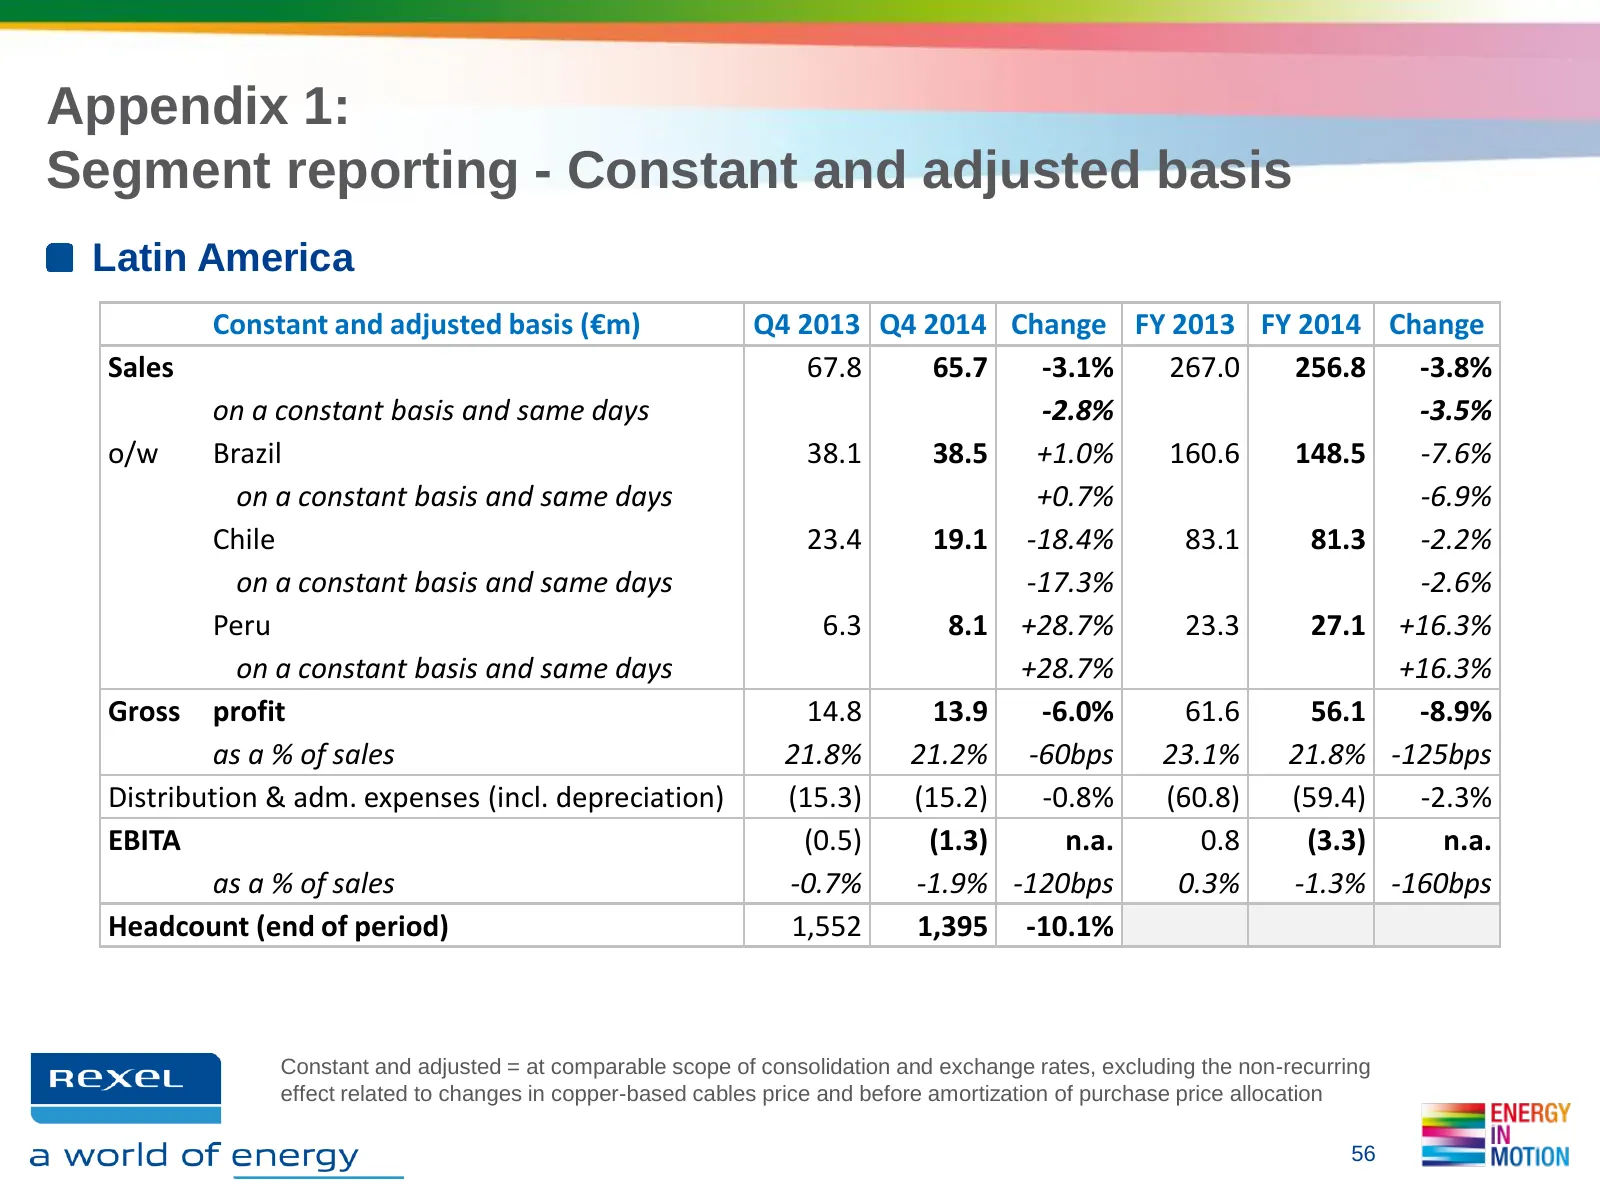
Appendix 1: Segment reporting - Constant and adjusted basis Latin America Constant and adjusted basis (€m) Q4 2013 Q4 2014 Change FY 2013 FY 2014 Change Sales 67.8 65.7 -3.1% 267.0 256.8 -3.8% on a constant basis and same days -2.8% -3.5% o/w Brazil 38.1 38.5 +1.0% 160.6 148.5 -7.6% on a constant ba
Slide 57: Appendix 2: Consolidated Income Statement
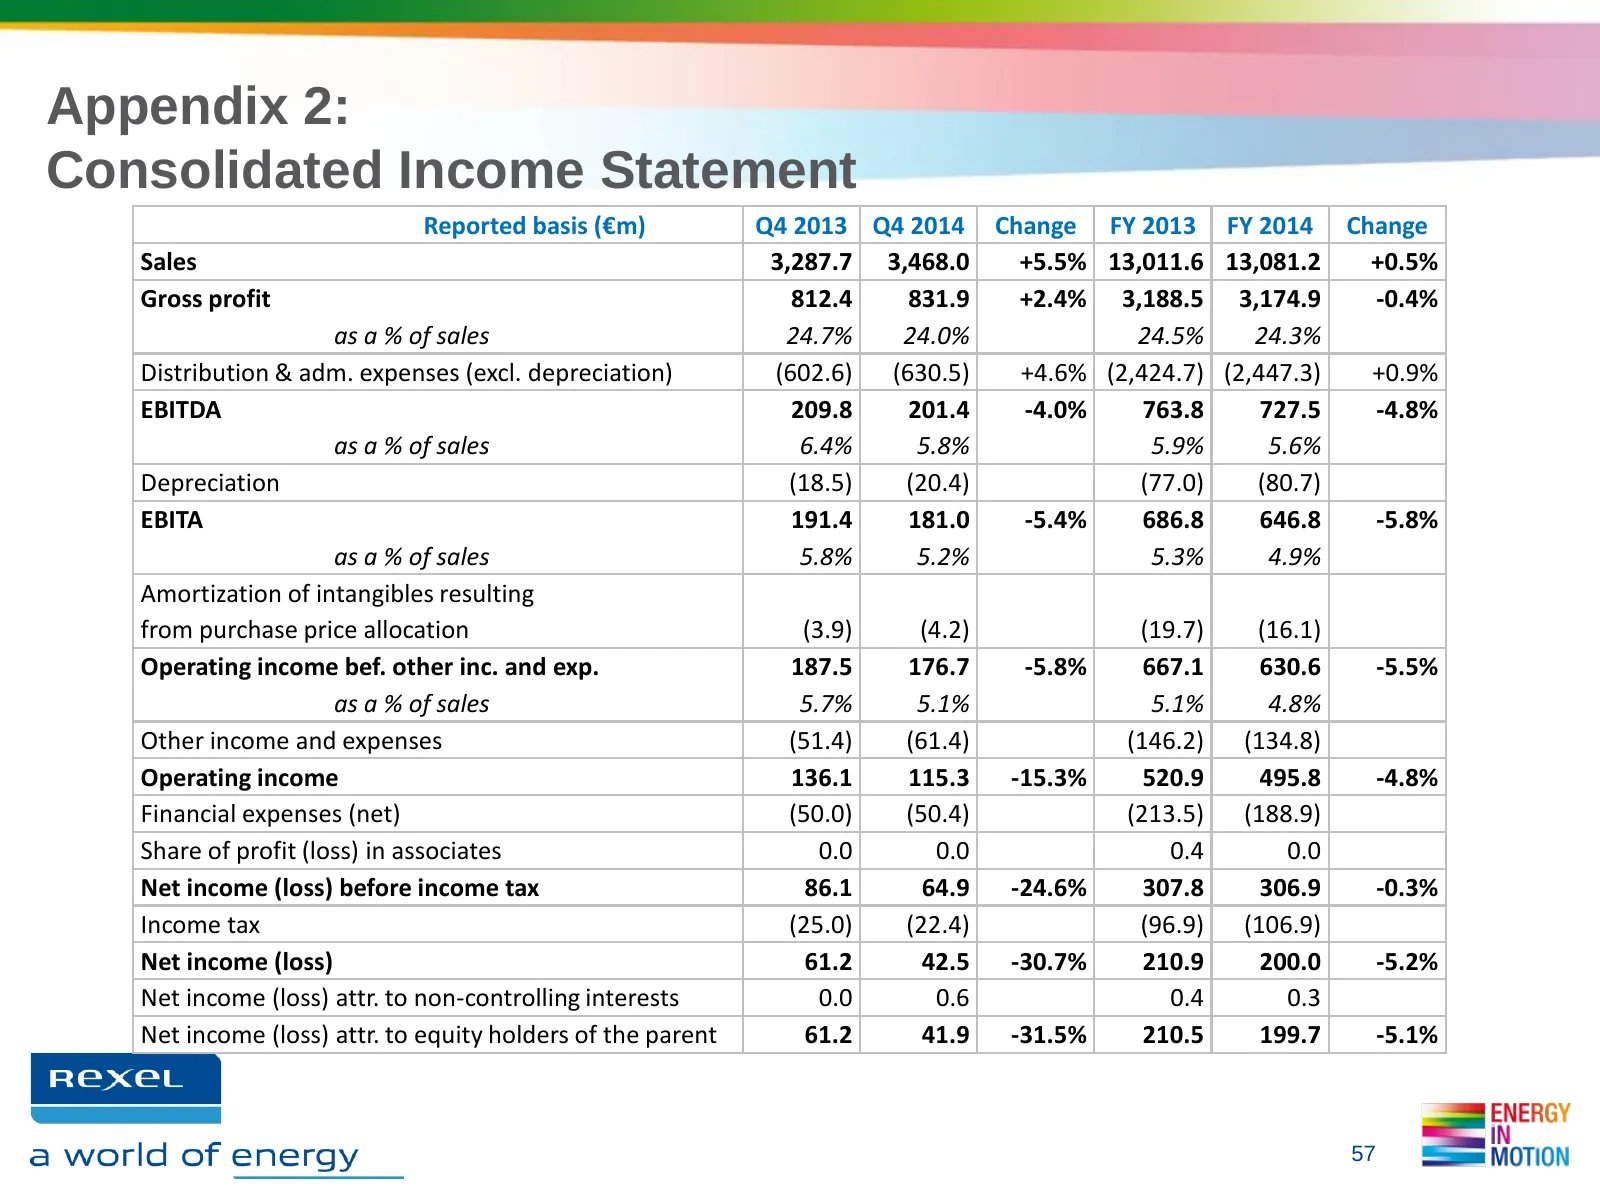
Appendix 2: Consolidated Income Statement Reported basis (€m) Q4 2013 Q4 2014 Change FY 2013 FY 2014 Change Sales 3,287.7 3,468.0 +5.5% 13,011.6 13,081.2 +0.5% Gross profit 812.4 831.9 +2.4% 3,188.5 3,174.9 -0.4% as a % of sales 24.7% 24.0% 24.5% 24.3% Distribution & adm. expenses (excl. depreciatio
Slide 58: Appendix 2: Bridge to adjusted EBITA
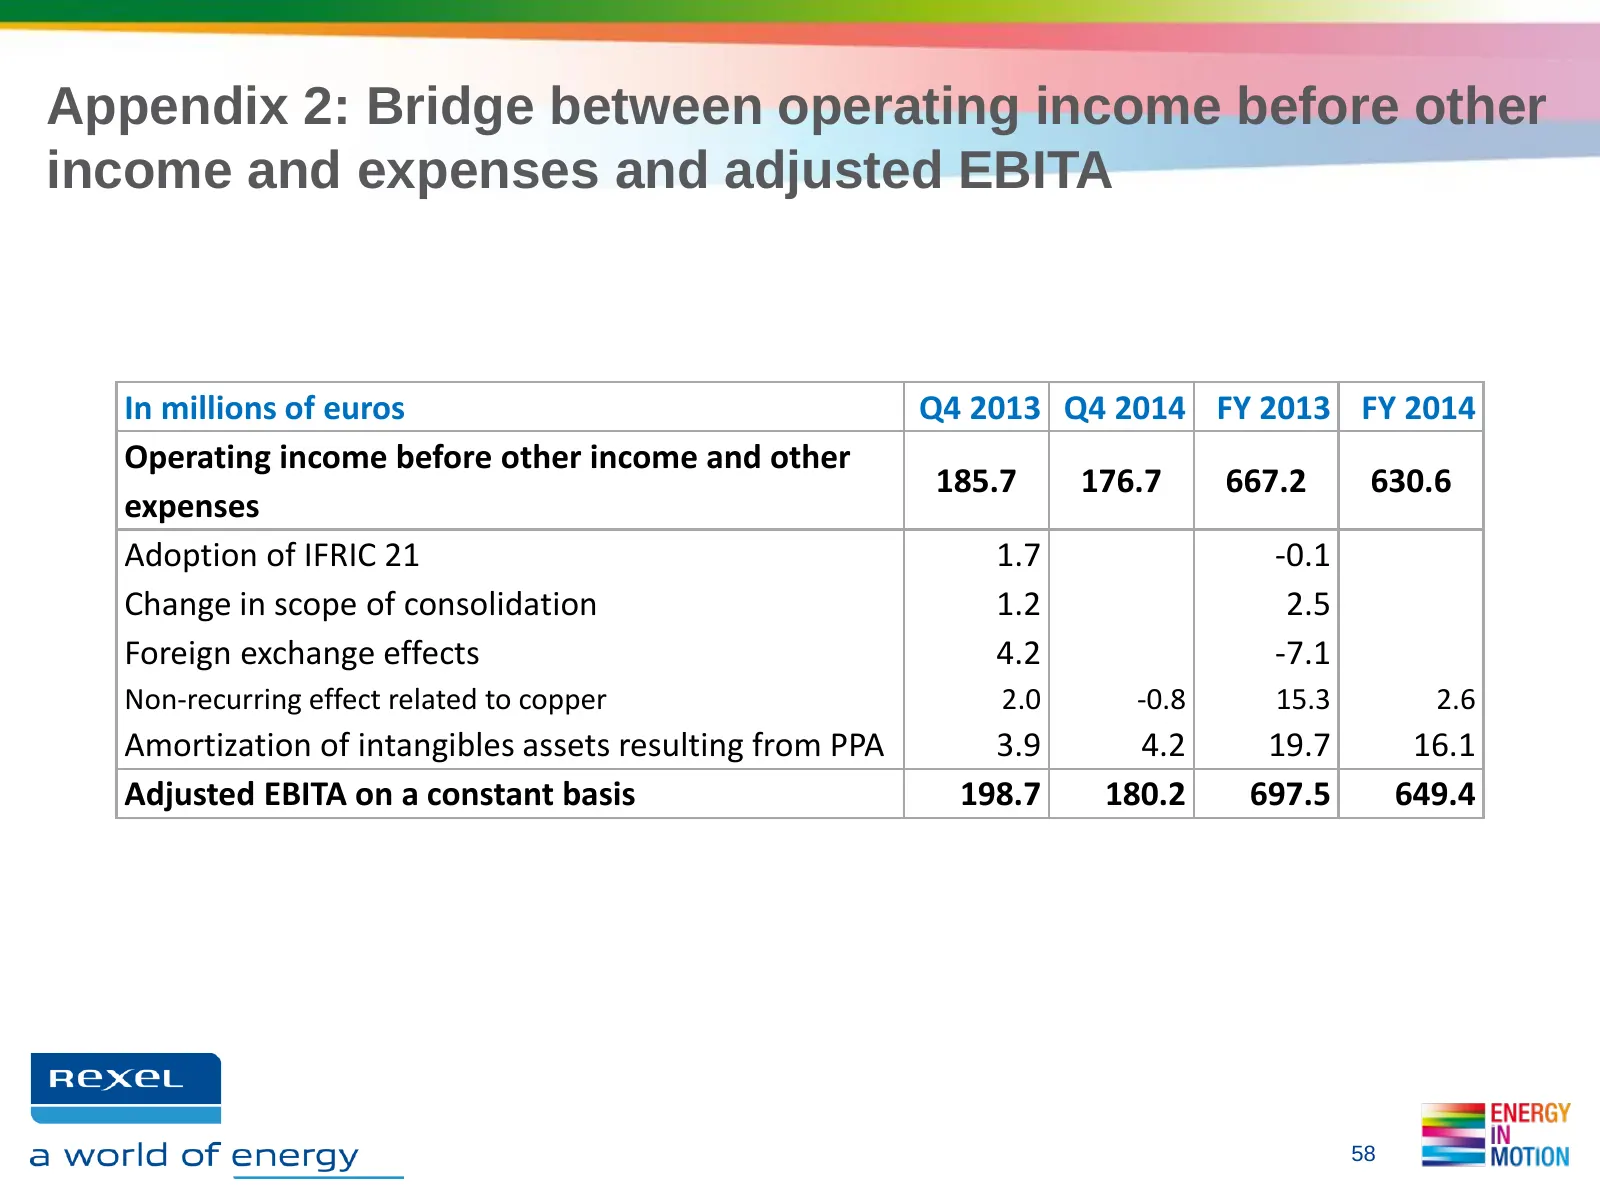
Appendix 2: Bridge between operating income before other income and expenses and adjusted EBITA In millions of euros Q4 2013 Q4 2014 FY 2013 FY 2014 Operating income before other income and other 185.7 176.7 667.2 630.6 expenses Adoption of IFRIC 21 1.7 -0.1 Change in scope of consolidation 1.2 2.5
Slide 59: Appendix 2: Recurring net income
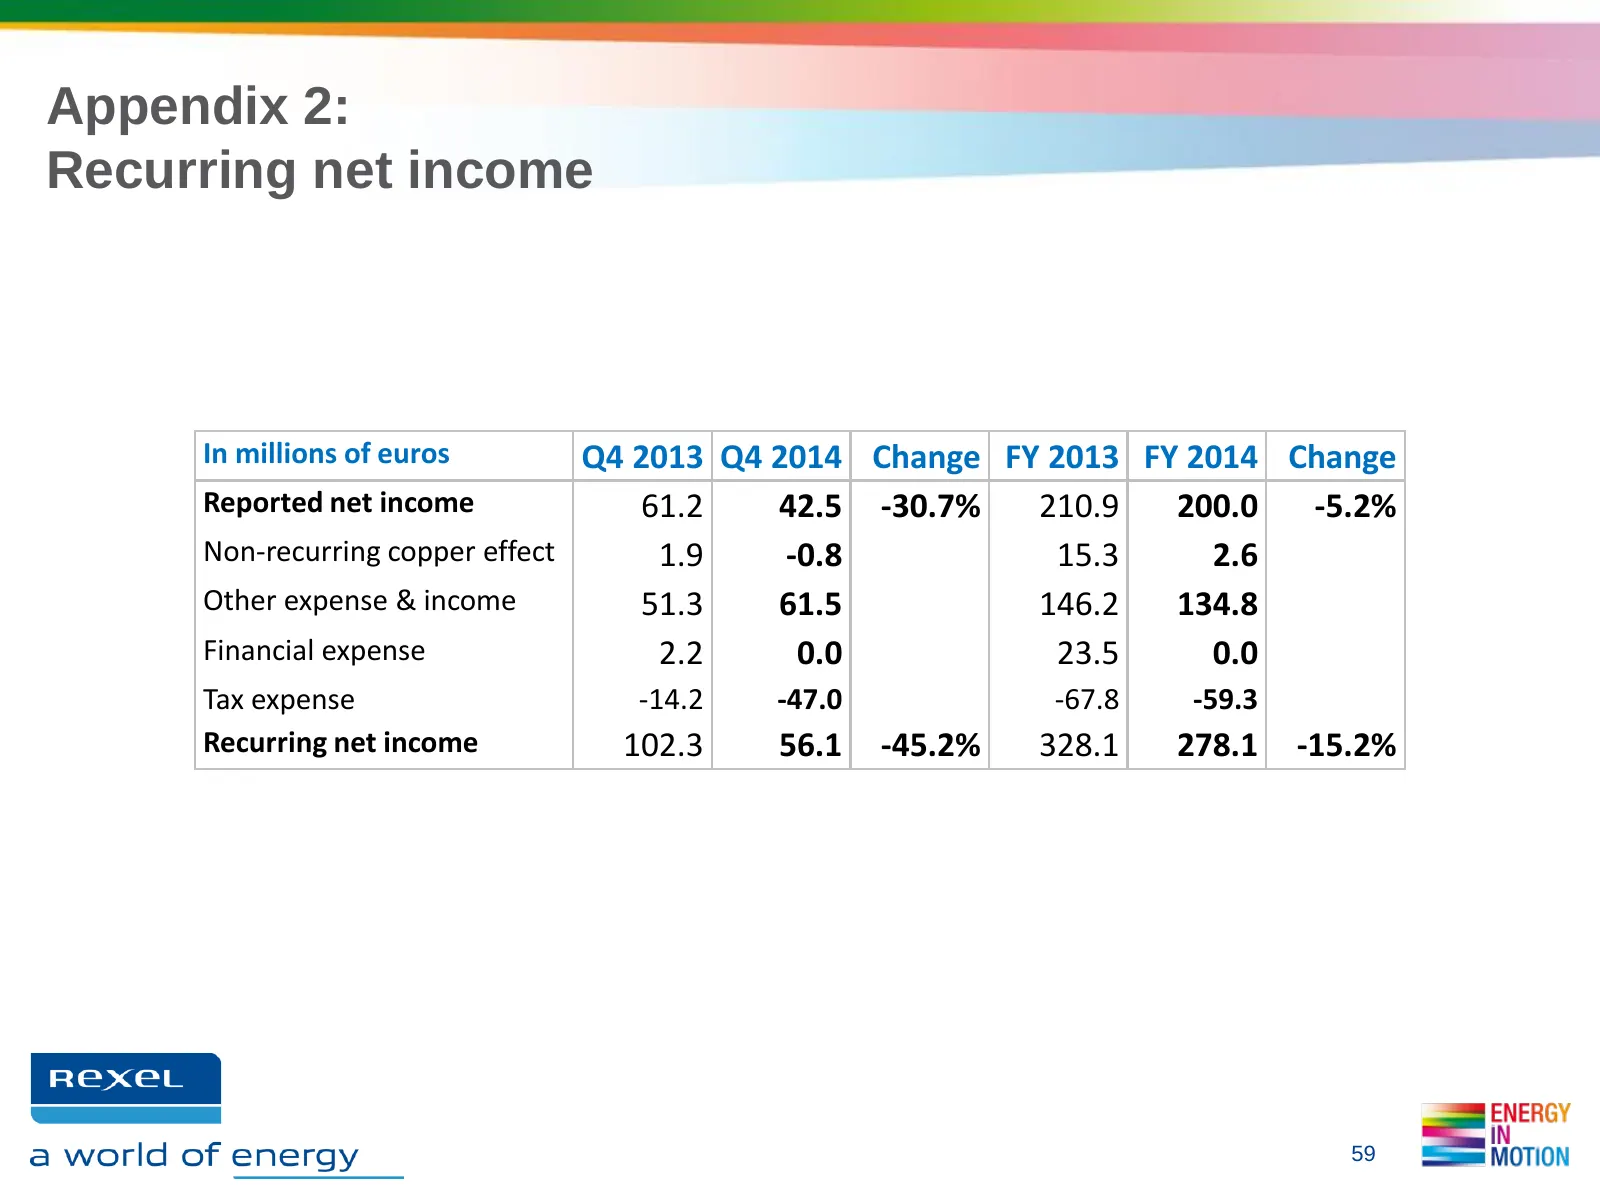
Appendix 2: Recurring net income In millions of euros Q4 2013 Q4 2014 Change FY 2013 FY 2014 Change Reported net income 61.2 42.5 -30.7% 210.9 200.0 -5.2% Non-recurring copper effect 1.9 -0.8 15.3 2.6 Other expense & income 51.3 61.5 146.2 134.8 Financial expense 2.2 0.0 23.5 0.0 Tax expense -14.2 -
Slide 60: Appendix 2: Sales and profitability by segment - Reported basis
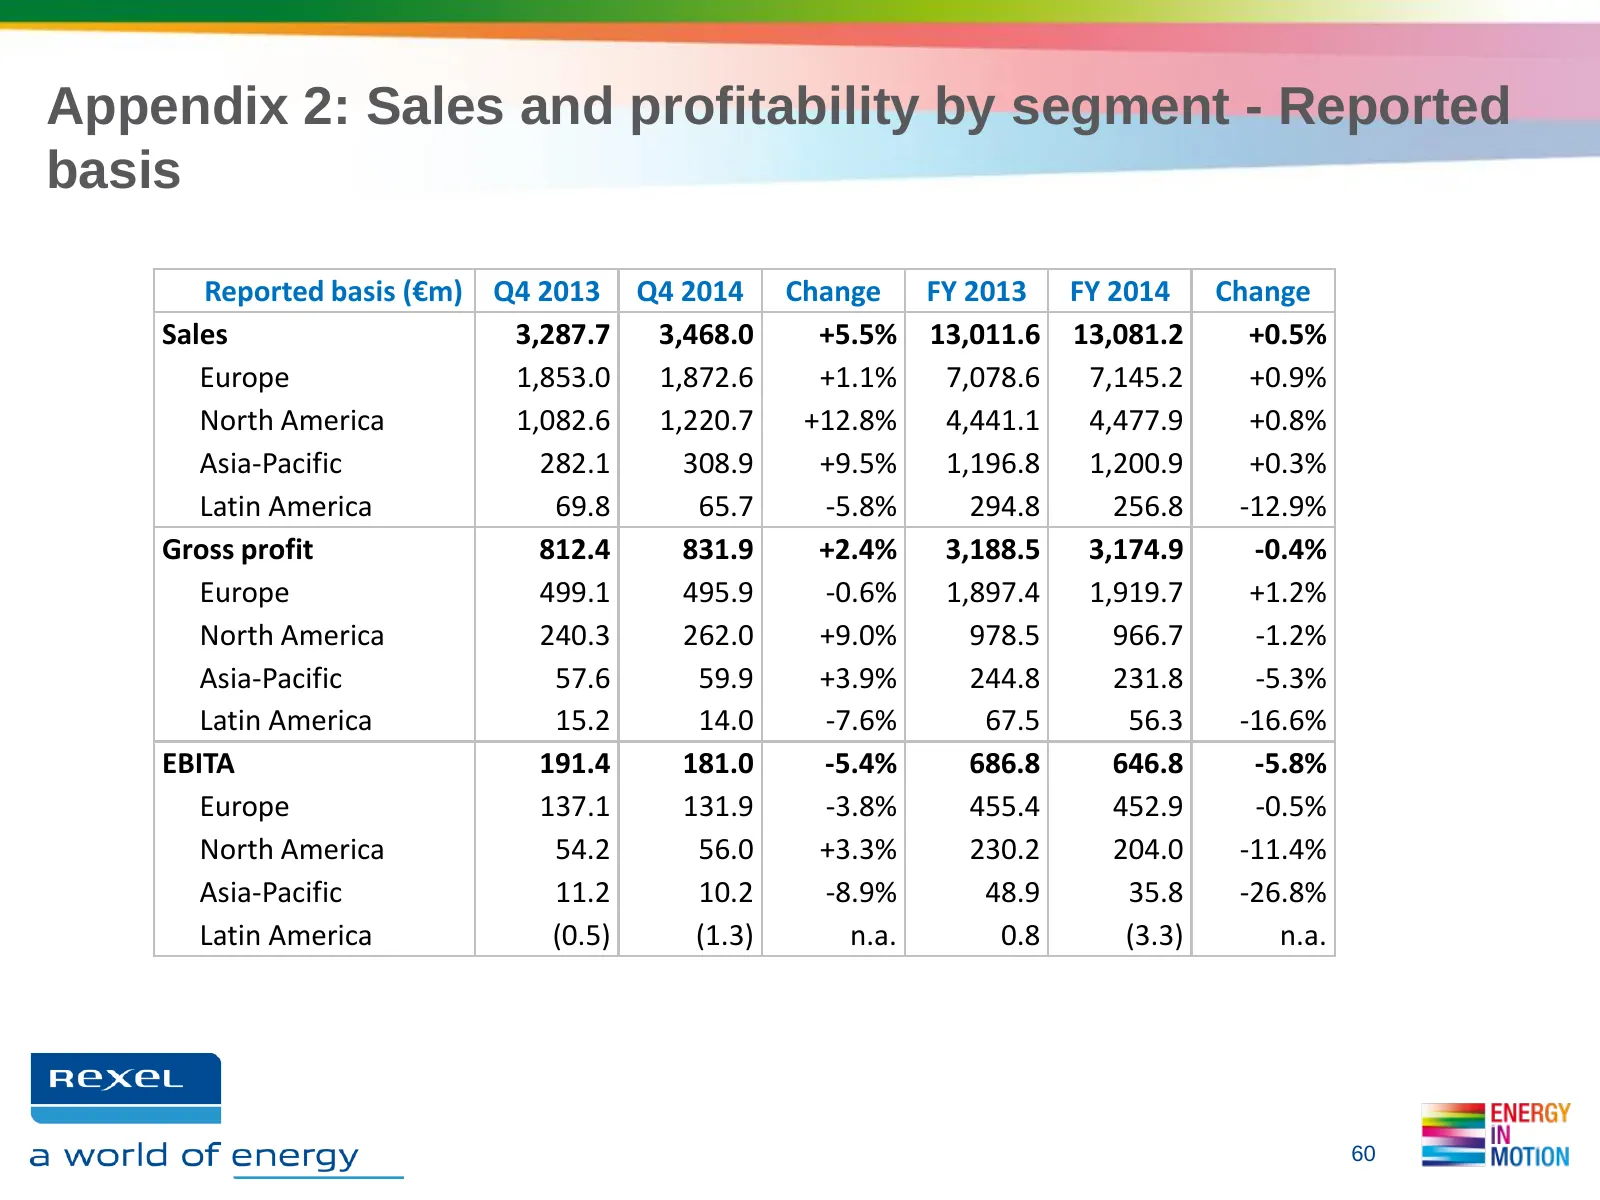
Appendix 2: Sales and profitability by segment - Reported basis Reported basis (€m) Q4 2013 Q4 2014 Change FY 2013 FY 2014 Change Sales 3,287.7 3,468.0 +5.5% 13,011.6 13,081.2 +0.5% Europe 1,853.0 1,872.6 +1.1% 7,078.6 7,145.2 +0.9% North America 1,082.6 1,220.7 +12.8% 4,441.1 4,477.9 +0.8% Asia-Pac
Slide 61: Appendix 2: Consolidated Balance Sheet
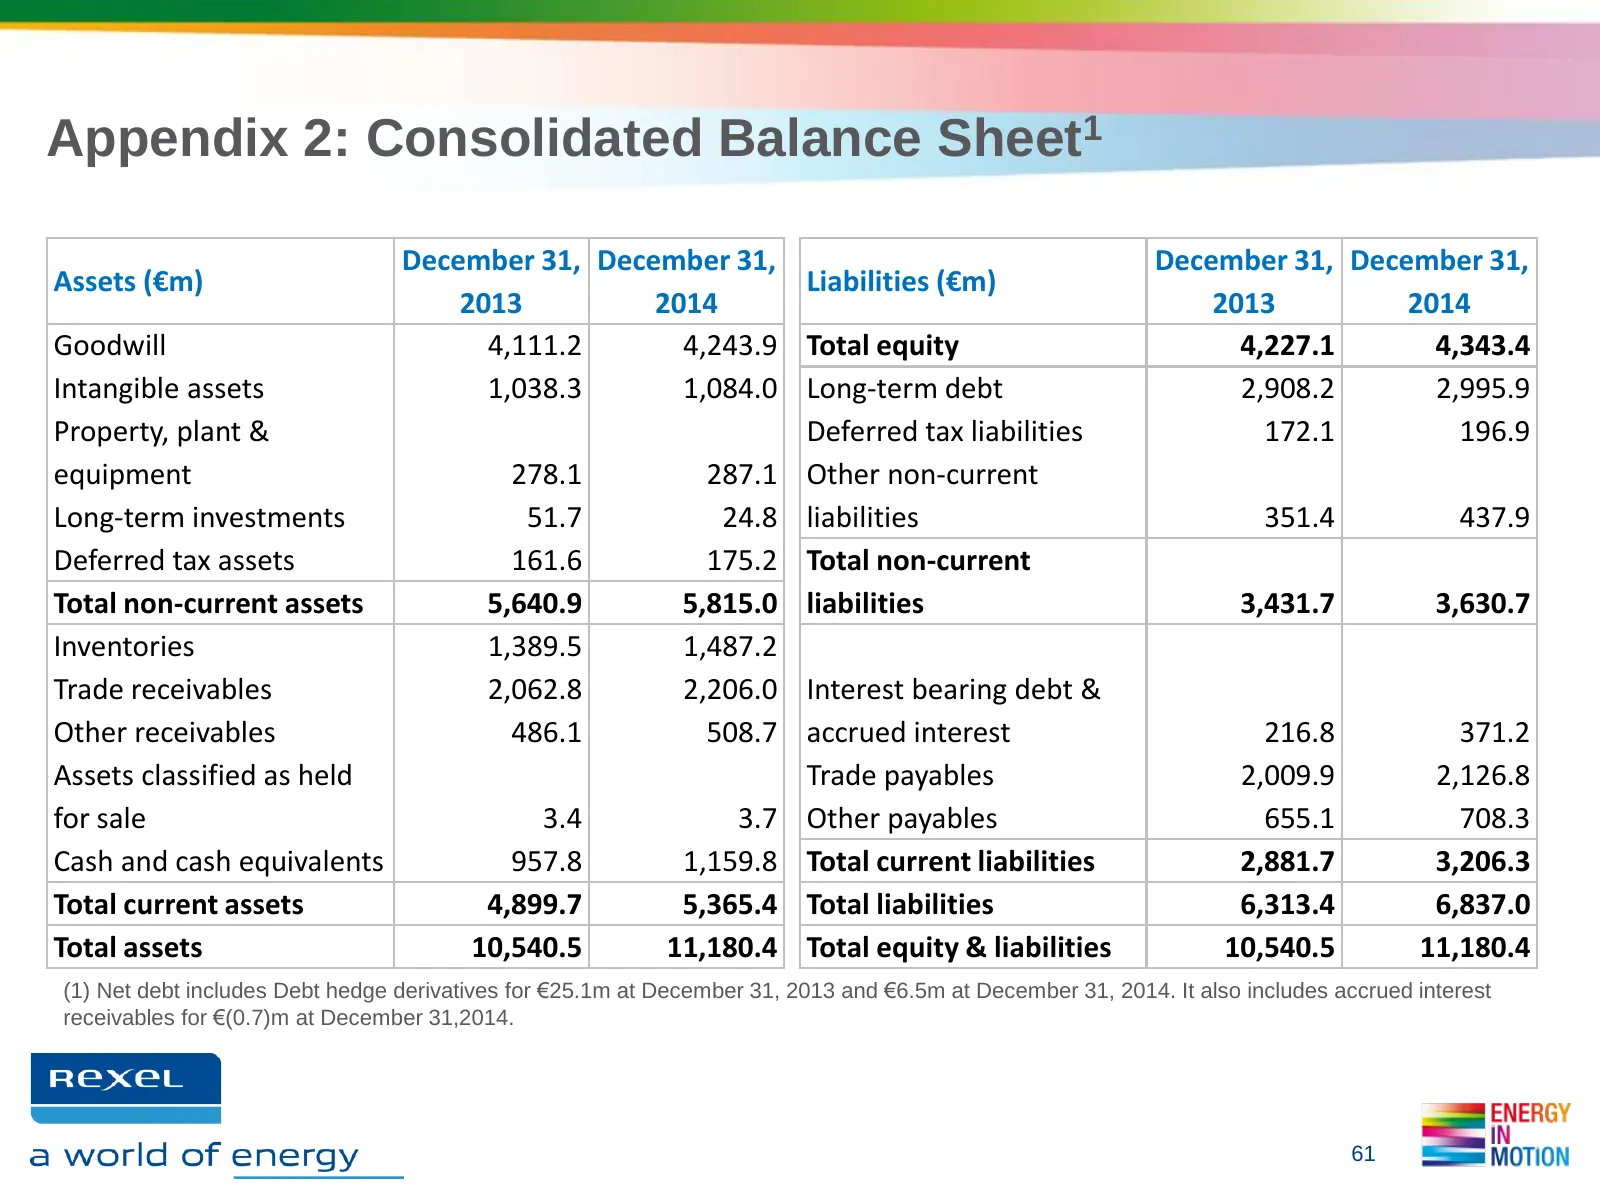
Appendix 2: Consolidated Balance Sheet1 December 31, December 31, December 31, December 31, Assets (€m) Liabilities (€m) 2013 2014 2013 2014 Goodwill 4,111.2 4,243.9 Total equity 4,227.1 4,343.4 Intangible assets 1,038.3 1,084.0 Long-term debt 2,908.2 2,995.9 Property, plant & Deferred tax liabiliti
Slide 62: Appendix 2: Change in Net Debt
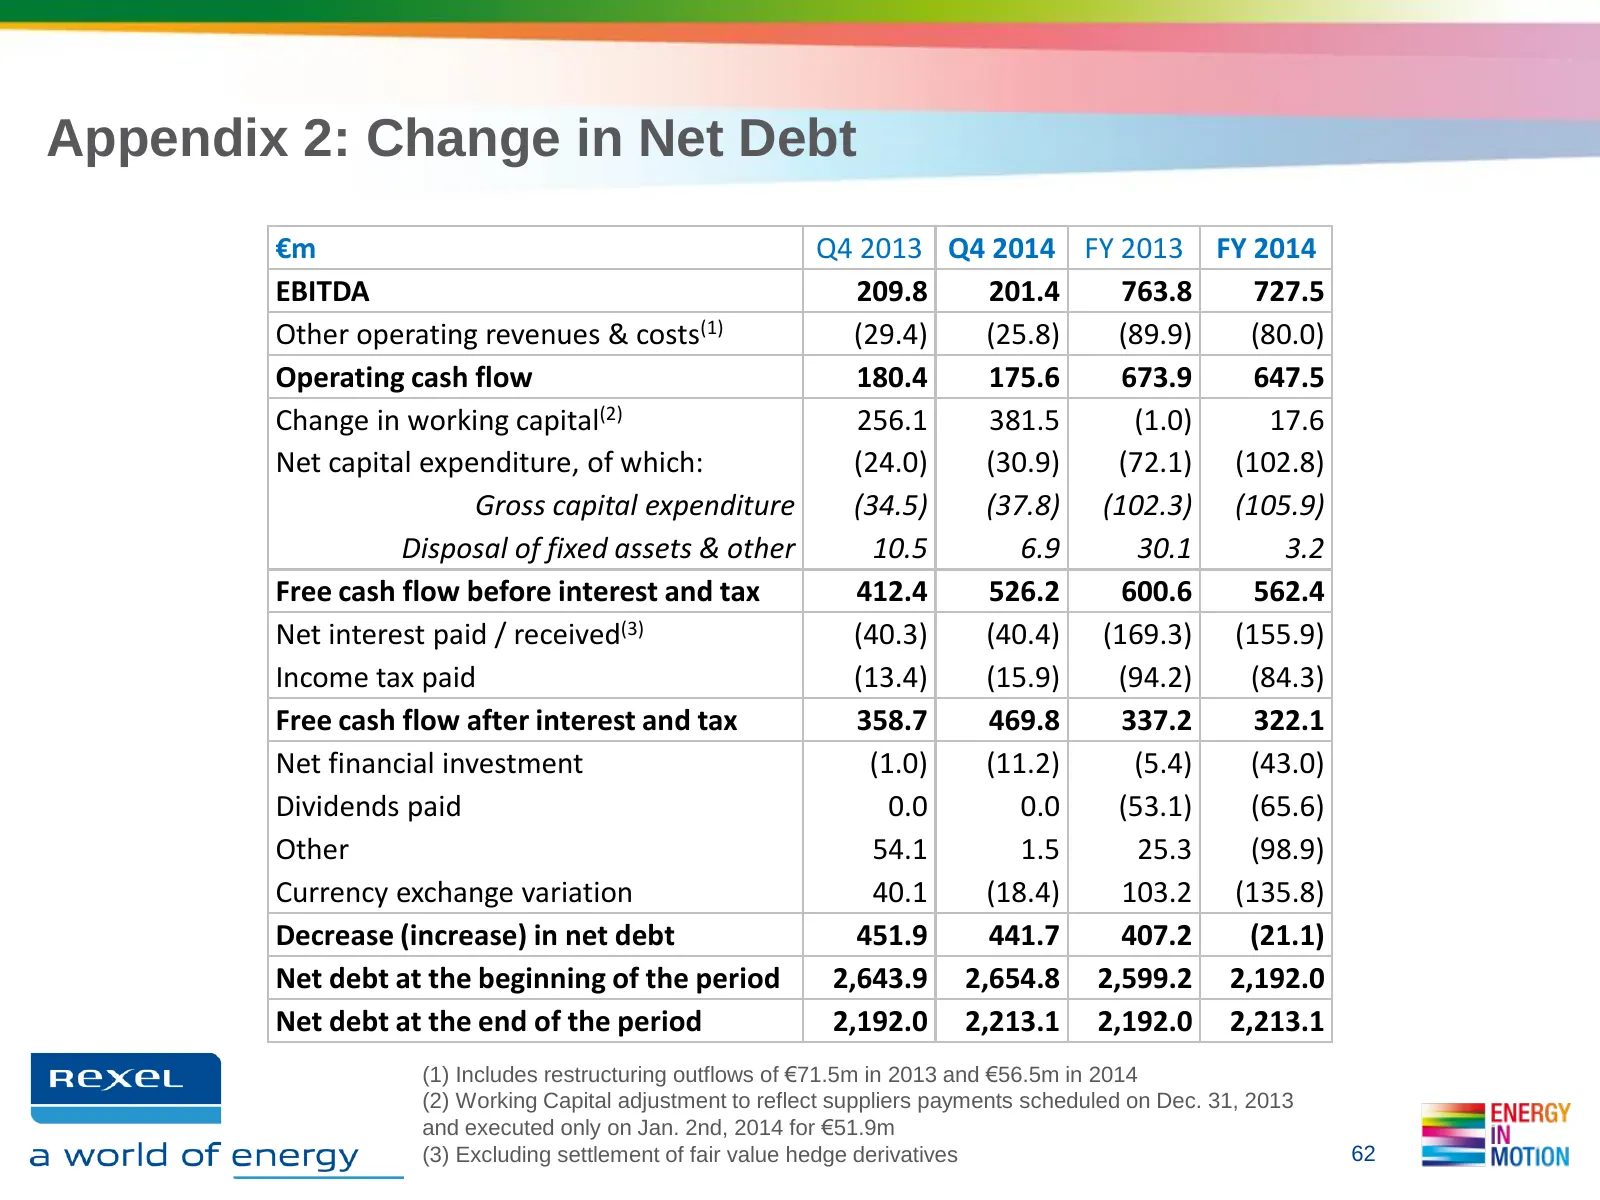
Appendix 2: Change in Net Debt €m Q4 2013 Q4 2014 FY 2013 FY 2014 EBITDA 209.8 201.4 763.8 727.5 Other operating revenues & costs(1) (29.4) (25.8) (89.9) (80.0) Operating cash flow 180.4 175.6 673.9 647.5 Change in working capital(2) 256.1 381.5 (1.0) 17.6 Net capital expenditure, of which: (24.0) (
Slide 63: Appendix 3: Working Capital
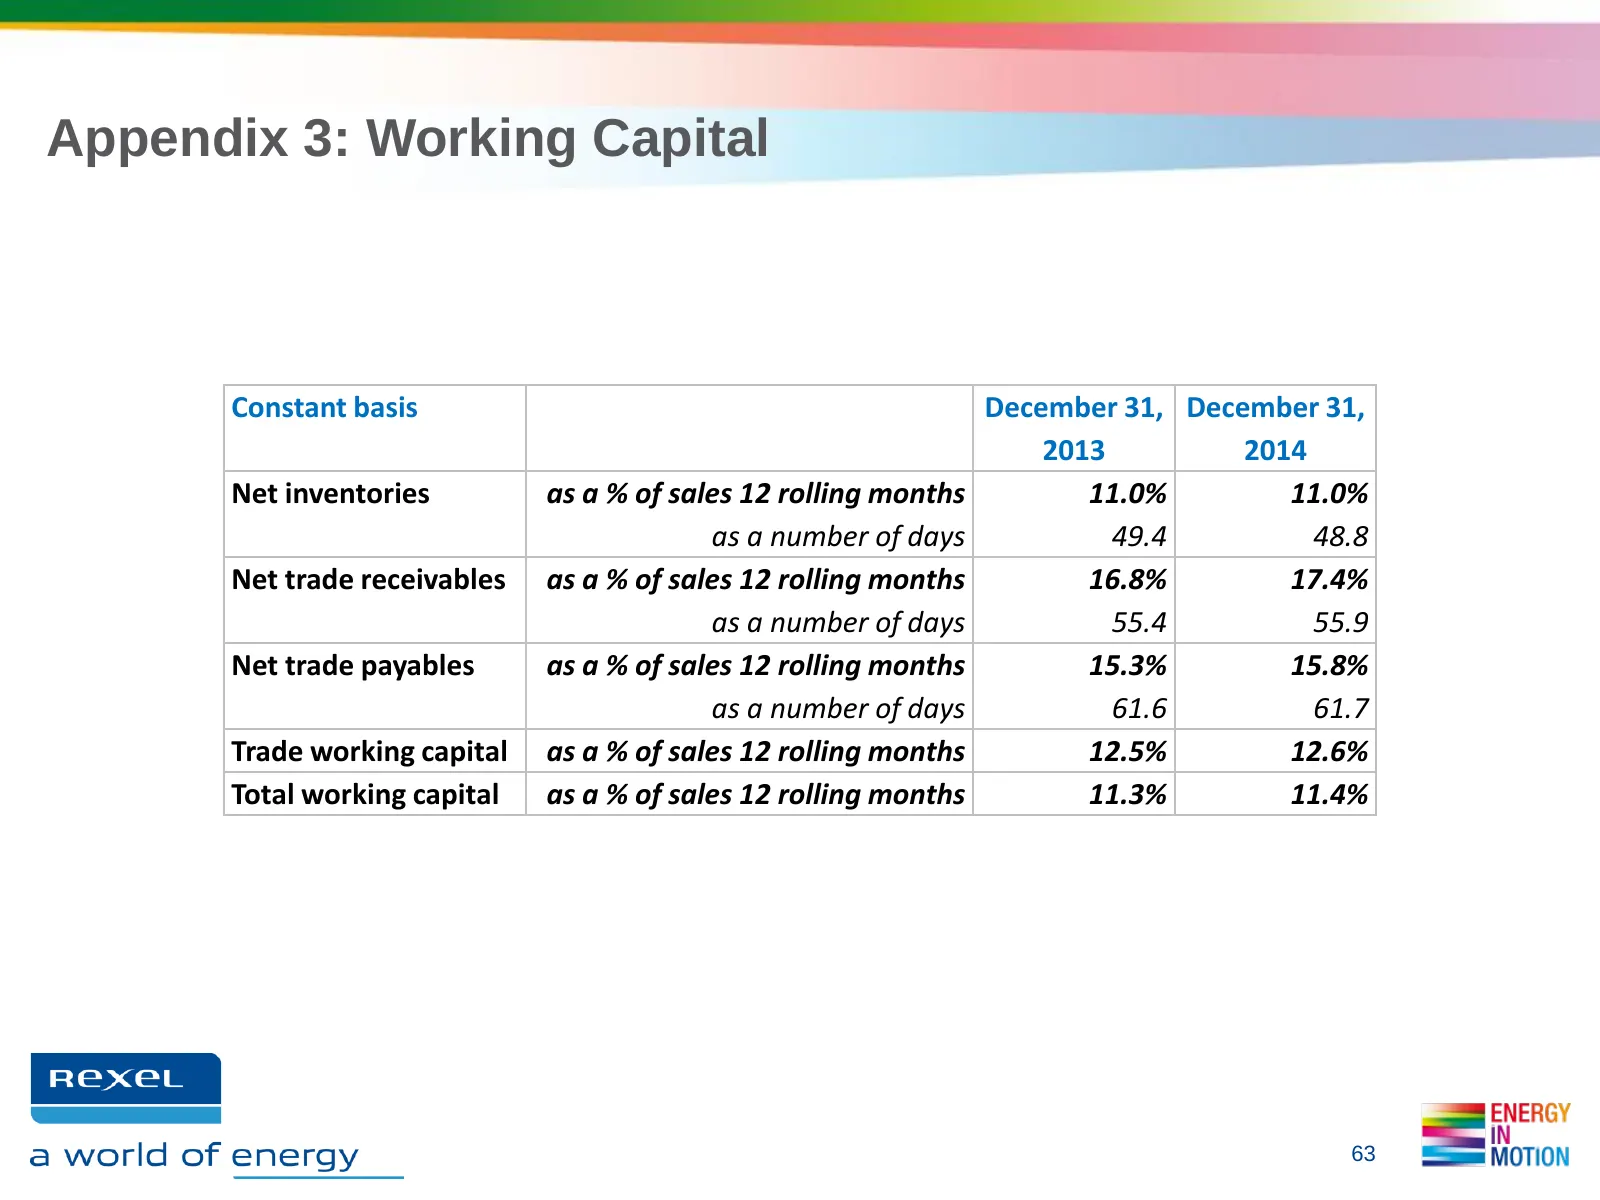
Appendix 3: Working Capital Constant basis December 31, December 31, 2013 2014 Net inventories as a % of sales 12 rolling months 11.0% 11.0% as a number of days 49.4 48.8 Net trade receivables as a % of sales 12 rolling months 16.8% 17.4% as a number of days 55.4 55.9 Net trade payables as a % of sa
Slide 64: Appendix 4: Headcount & Branch Evolution
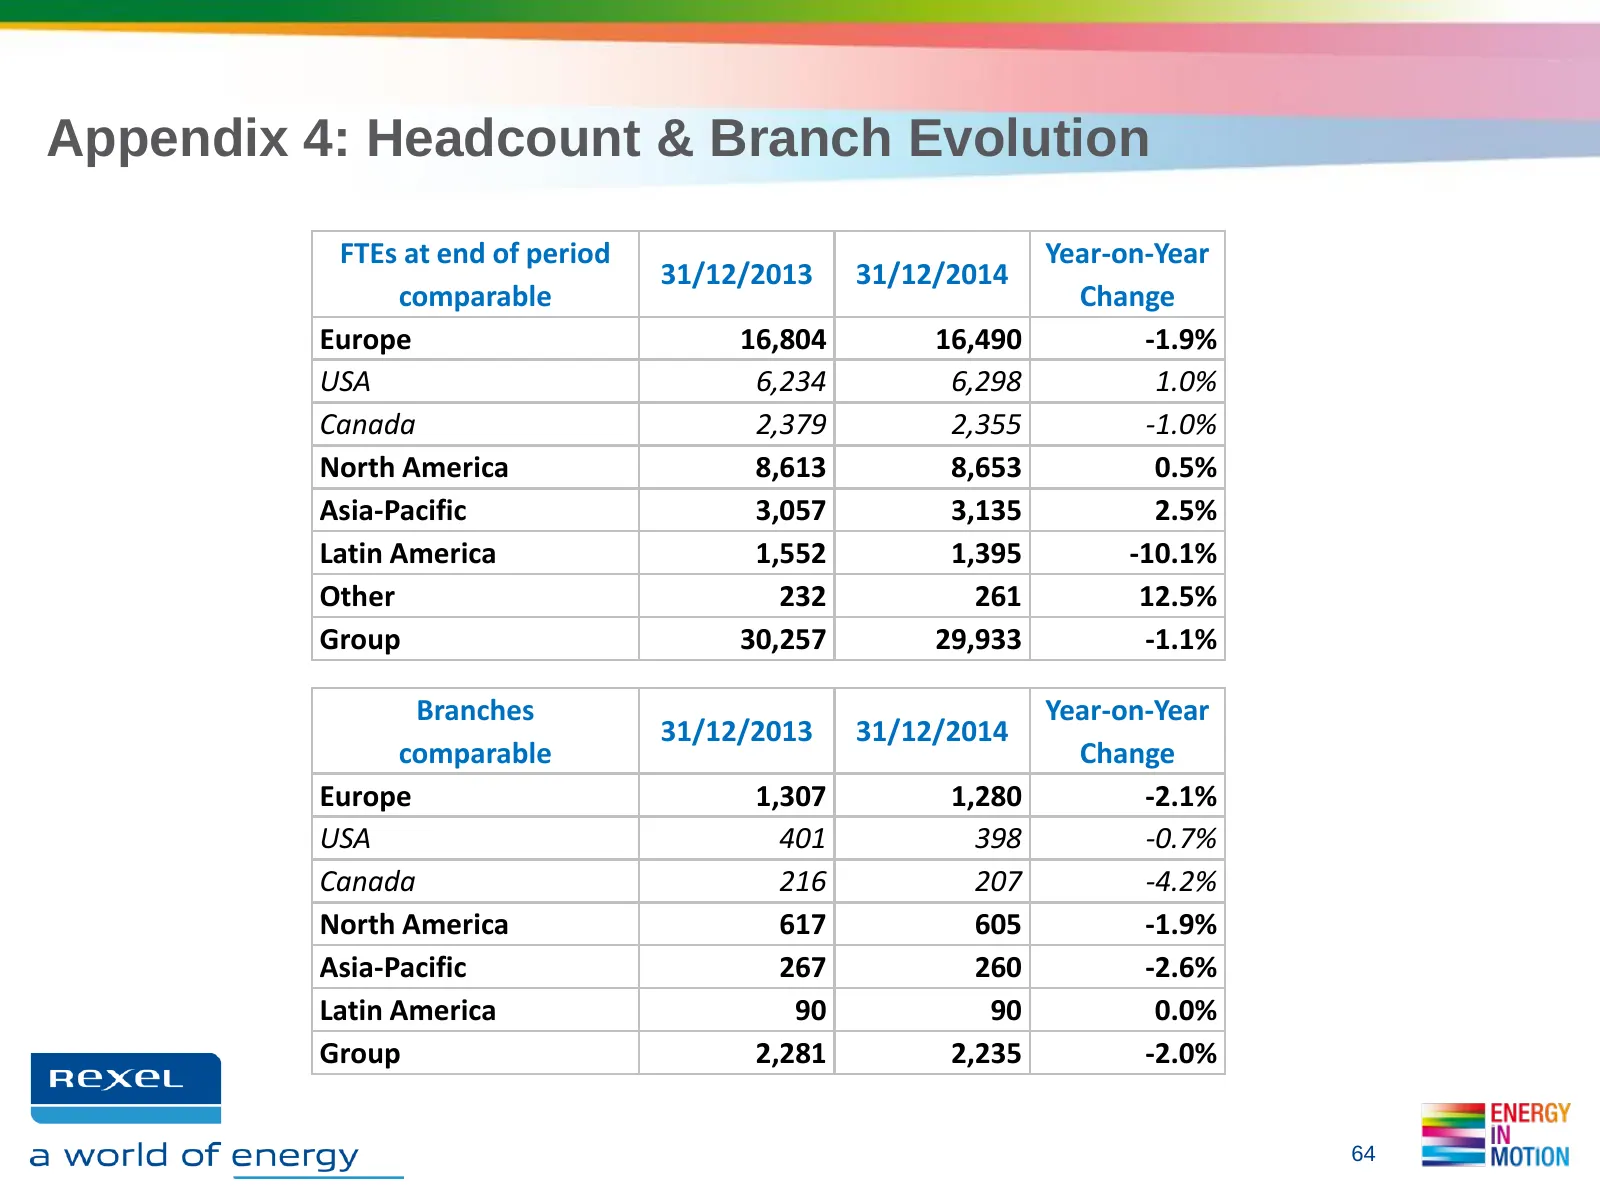
Appendix 4: Headcount & Branch Evolution FTEs at end of period Year-on-Year 31/12/2013 31/12/2014 comparable Change Europe 16,804 16,490 -1.9% USA 6,234 6,298 1.0% Canada 2,379 2,355 -1.0% North America 8,613 8,653 0.5% Asia-Pacific 3,057 3,135 2.5% Latin America 1,552 1,395 -10.1% Other 232 261 12.
Slide 65: Appendix 5: Calendar, scope and change effects on sales
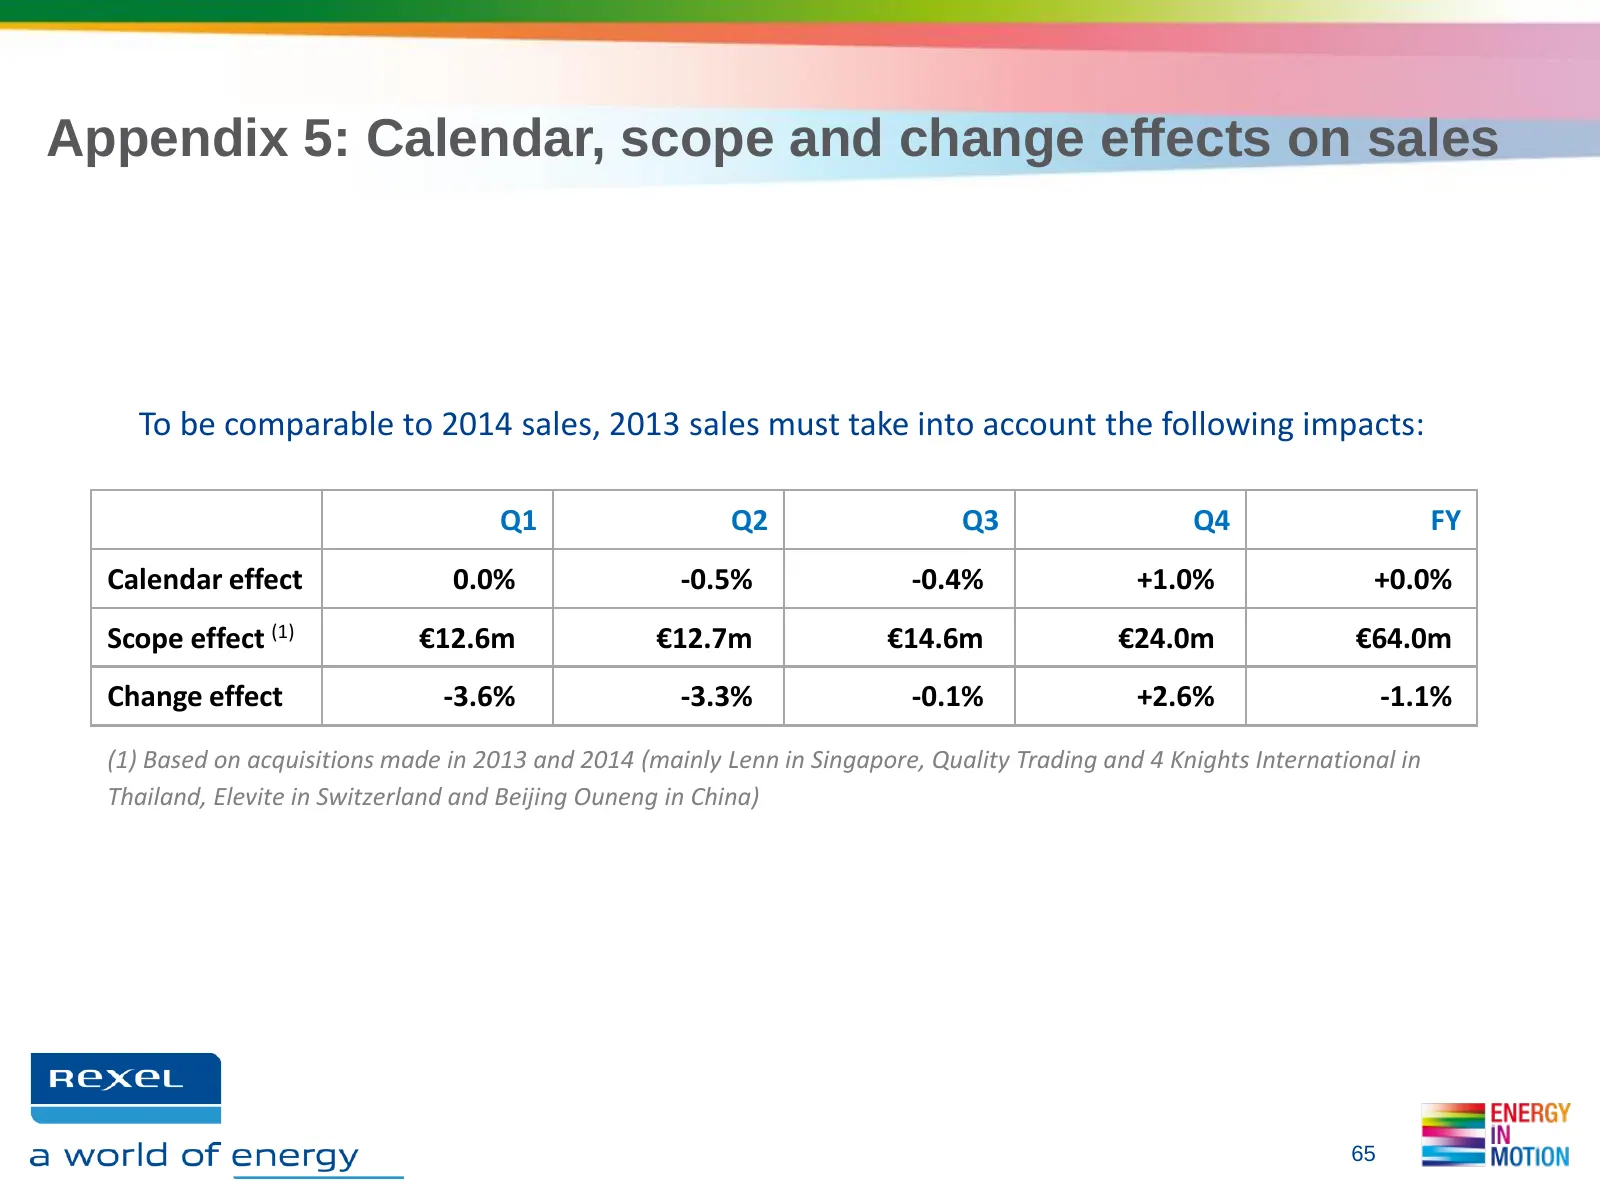
Appendix 5: Calendar, scope and change effects on sales To be comparable to 2014 sales, 2013 sales must take into account the following impacts: Q1 Q2 Q3 Q4 FY Calendar effect 0.0% -0.5% -0.4% +1.0% +0.0% Scope effect (1) €12.6m €12.7m €14.6m €24.0m €64.0m Change effect -3.6% -3.3% -0.1% +2.6% -1.1%
Slide 66: Appendix 5: Calendar, scope and change effects on sales
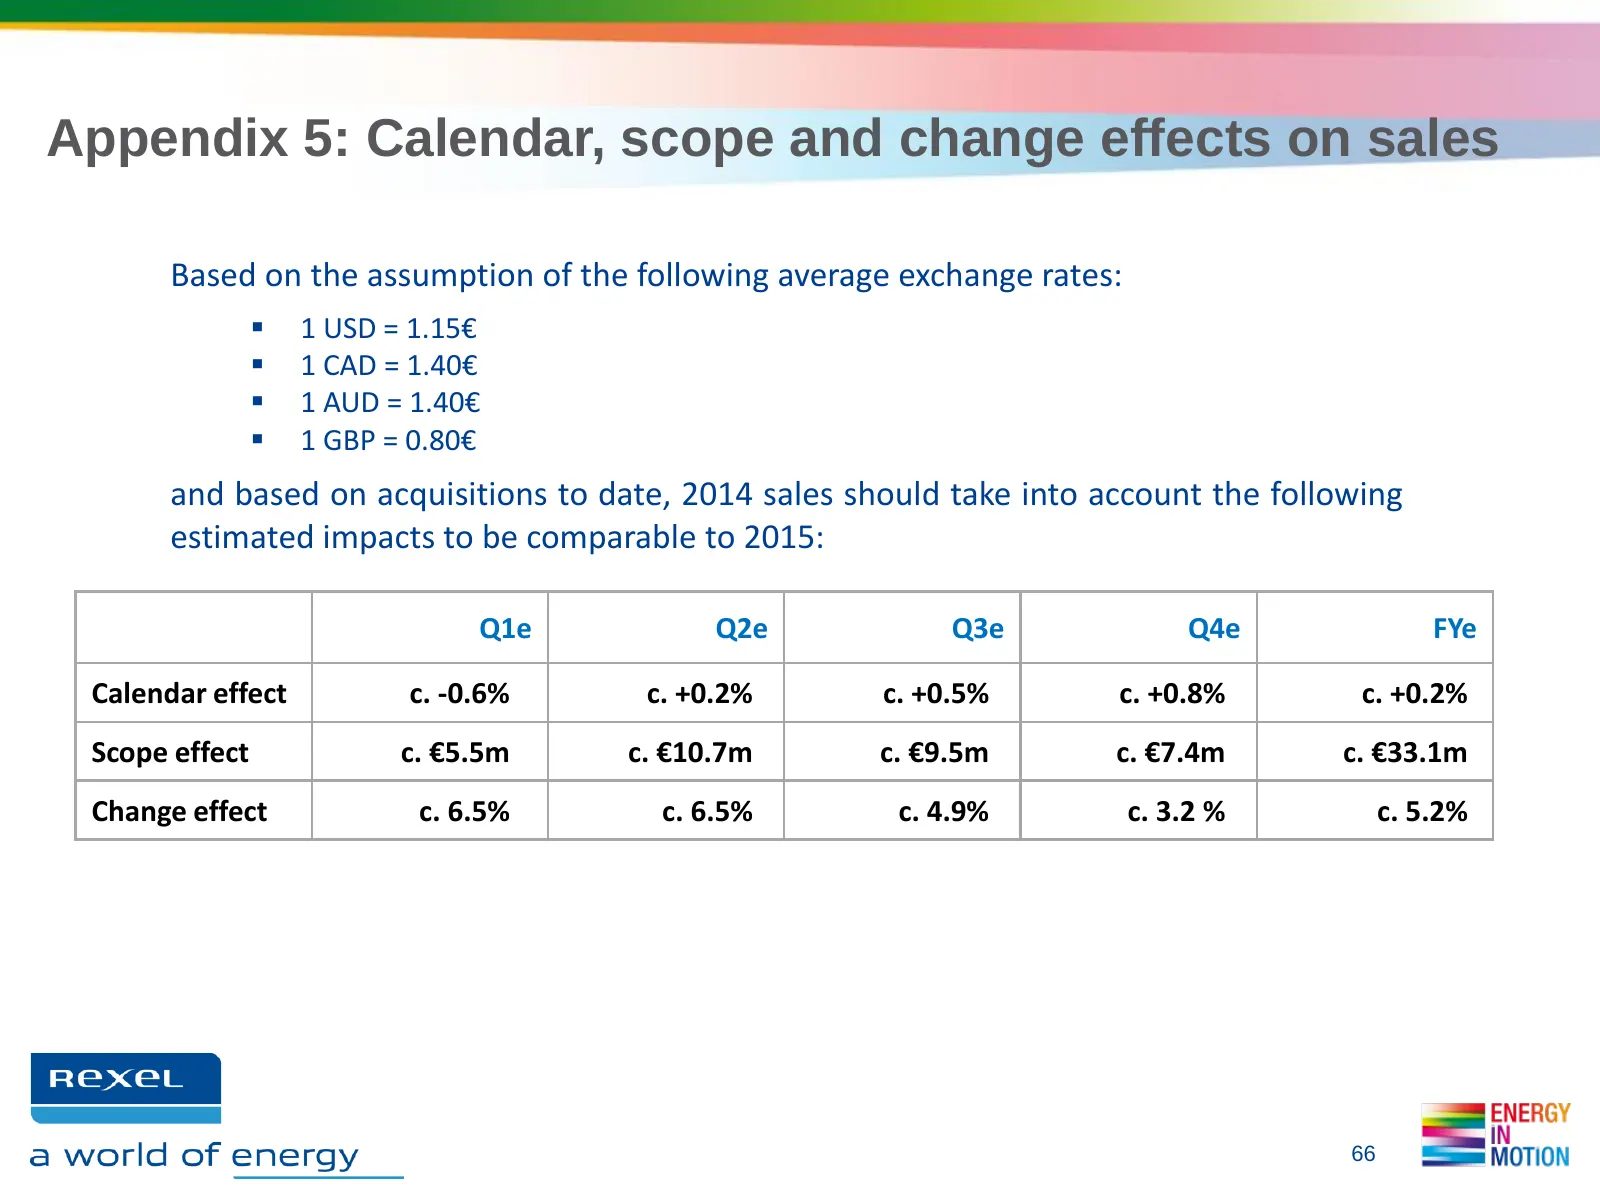
Appendix 5: Calendar, scope and change effects on sales Based on the assumption of the following average exchange rates: 1 USD = 1.15€ 1 CAD = 1.40€ 1 AUD = 1.40€ 1 GBP = 0.80€ and based on acquisitions to date, 2014 sales should take into account the following estimated impacts to be compar
Slide 67: Appendix 6: Historical copper price evolution
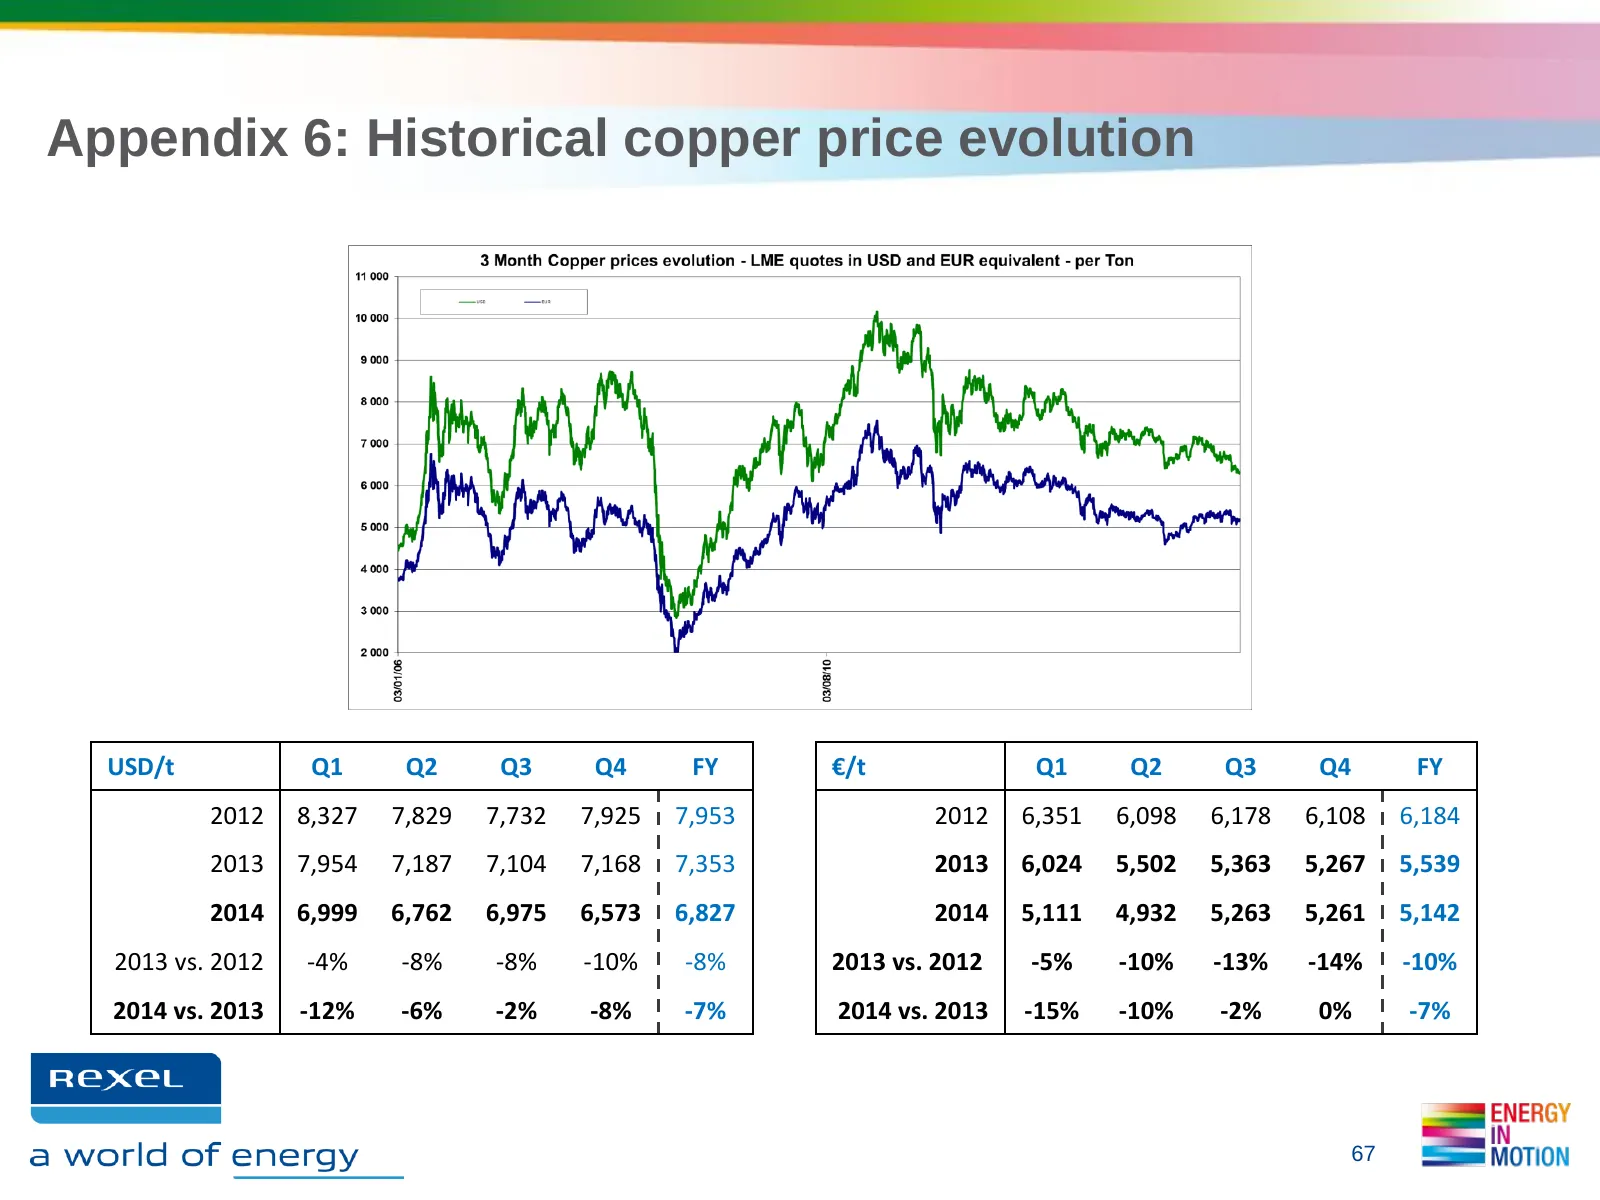
Appendix 6: Historical copper price evolution USD/t Q1 Q2 Q3 Q4 FY €/t Q1 Q2 Q3 Q4 FY 2012 8,327 7,829 7,732 7,925 7,953 2012 6,351 6,098 6,178 6,108 6,184 2013 7,954 7,187 7,104 7,168 7,353 2013 6,024 5,502 5,363 5,267 5,539 2014 6,999 6,762 6,975 6,573 6,827 2014 5,111 4,932 5,263 5,261 5,142 2013
Slide 68: Appendix 7: Estimated impact of lower copper prices on 2015
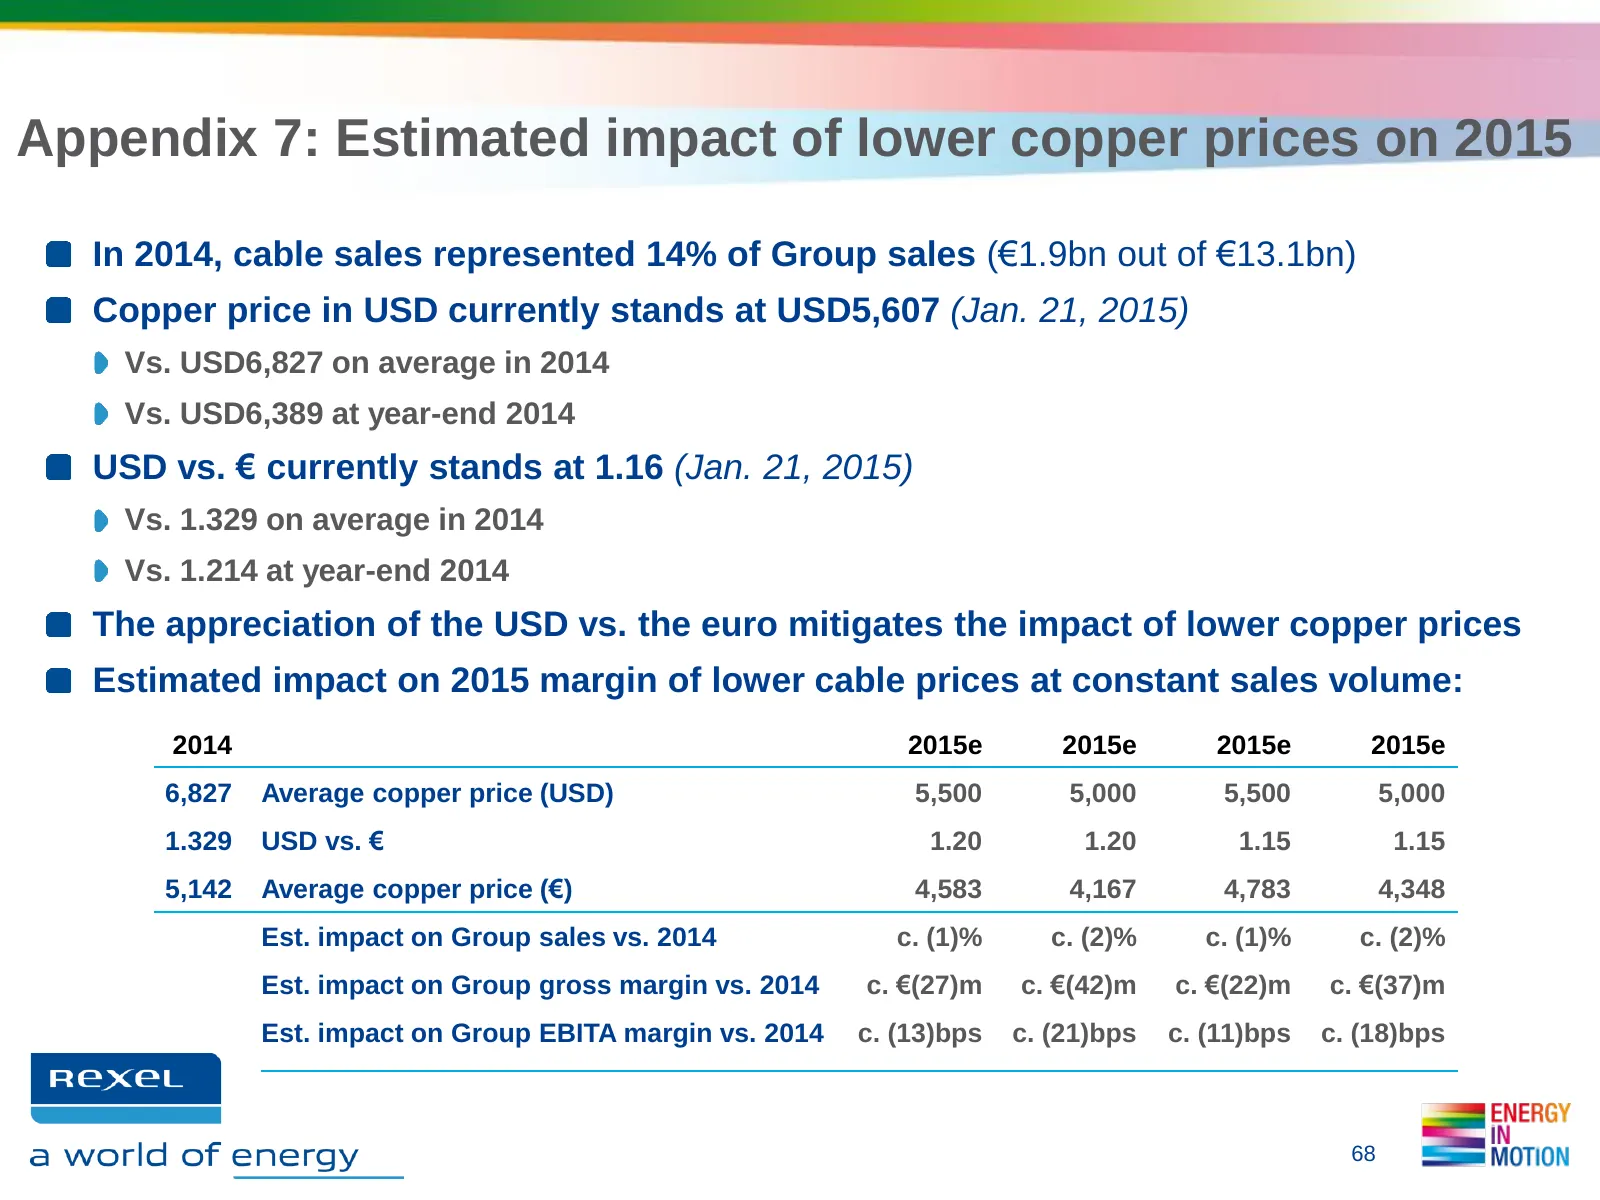
Appendix 7: Estimated impact of lower copper prices on 2015 In 2014, cable sales represented 14% of Group sales (€1.9bn out of €13.1bn) Copper price in USD currently stands at USD5,607 (Jan. 21, 2015) Vs. USD6,827 on average in 2014 Vs. USD6,389 at year-end 2014 USD vs. € currently stands at 1.16 (J
Slide 69: Appendix 8: Potential risk on Oil & Gas business in 2015
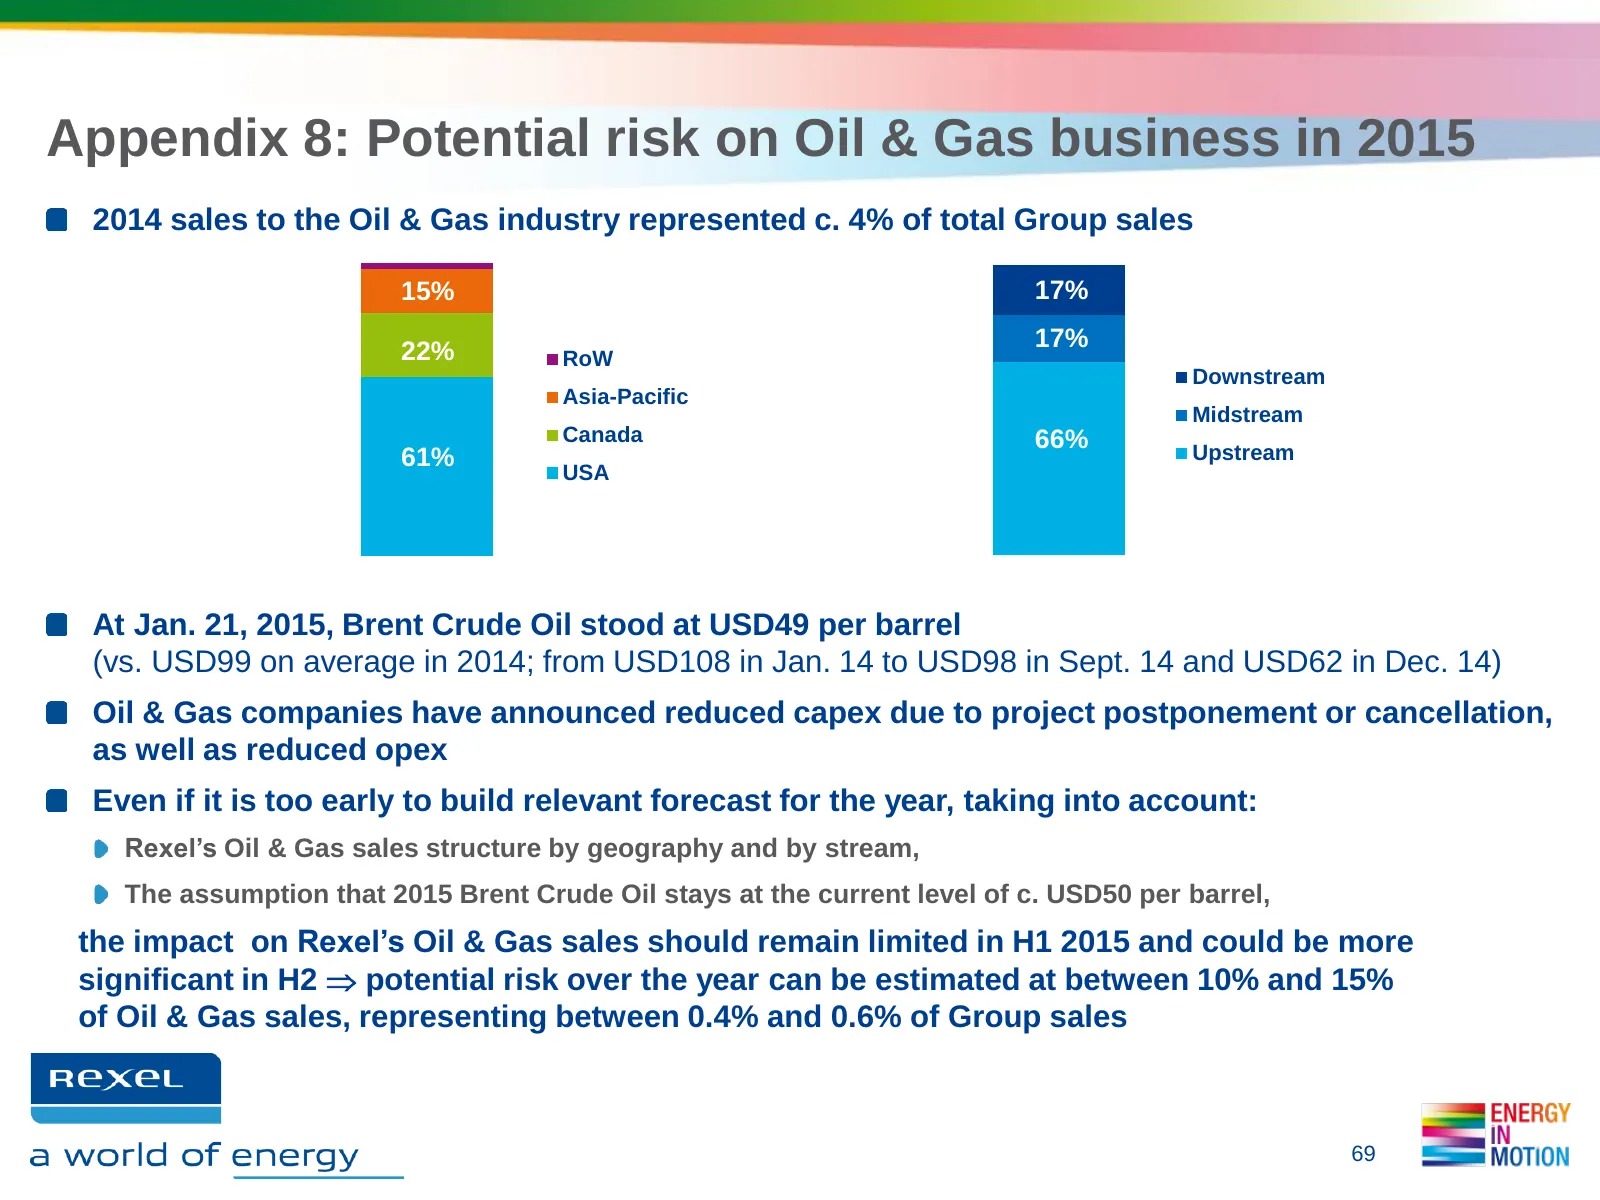
Appendix 8: Potential risk on Oil & Gas business in 2015 2014 sales to the Oil & Gas industry represented c. 4% of total Group sales 15% 17% 22% 17% RoW Downstream Asia-Pacific Midstream Canada 66% 61% Upstream USA At Jan. 21, 2015, Brent Crude Oil stood at USD49 per barrel (vs. USD99 on average in
Slide 70: Financial Calendar and contacts
Financial Calendar and contacts Financial Calendar Contacts • April 30, 2015 • Investors & Analysts Q1 results Marc MAILLET Tel: +33 1 42 85 76 12 • May 27, 2015 Email: marc.maillet@rexel.com AGM Florence MEILHAC • July 29, 2015 Tel: +33 1 42 85 57 61 Q2 and H1 results Email: florence.meilhac@rexel.
Slide 71: Disclaimer
Disclaimer The Group is exposed to fluctuations in copper prices in connection with its distribution of cable products. Cables accounted for approximately 14% of the Group's sales, and copper accounts for approximately 60% of the composition of cables. This exposure is indirect since cable prices al
Source: Internet Archive copy of rexel.com
More decks from Rexel SA
 Q3 2026 Earnings Presentation13 slides · Oct 22, 2026
 Q2 2026 Earnings Presentation24 slides · Jul 27, 2026
 FY 2025 Earnings Presentation31 slides · Feb 11, 2026
 Q3 2025 Earnings Presentation15 slides · Oct 15, 2025
 Q2 2025 Earnings Presentation20 slides · Jul 28, 2025
 Q1 2025 Earnings Presentation16 slides · Apr 29, 2025