CAR Group Limited · ASX:CAR
CAR — carsales.com — H1 FY2021 Earnings Presentation
40 slides from CAR's earnings presentation, Feb 17, 2021

Slide 1: Half Year Results Presentation
For personal use only HALF YEAR RESULTS PRESENTATION HALF YEAR ENDED 31 DECEMBER 2020
Slide 2: Disclaimer and Non-IFRS Information
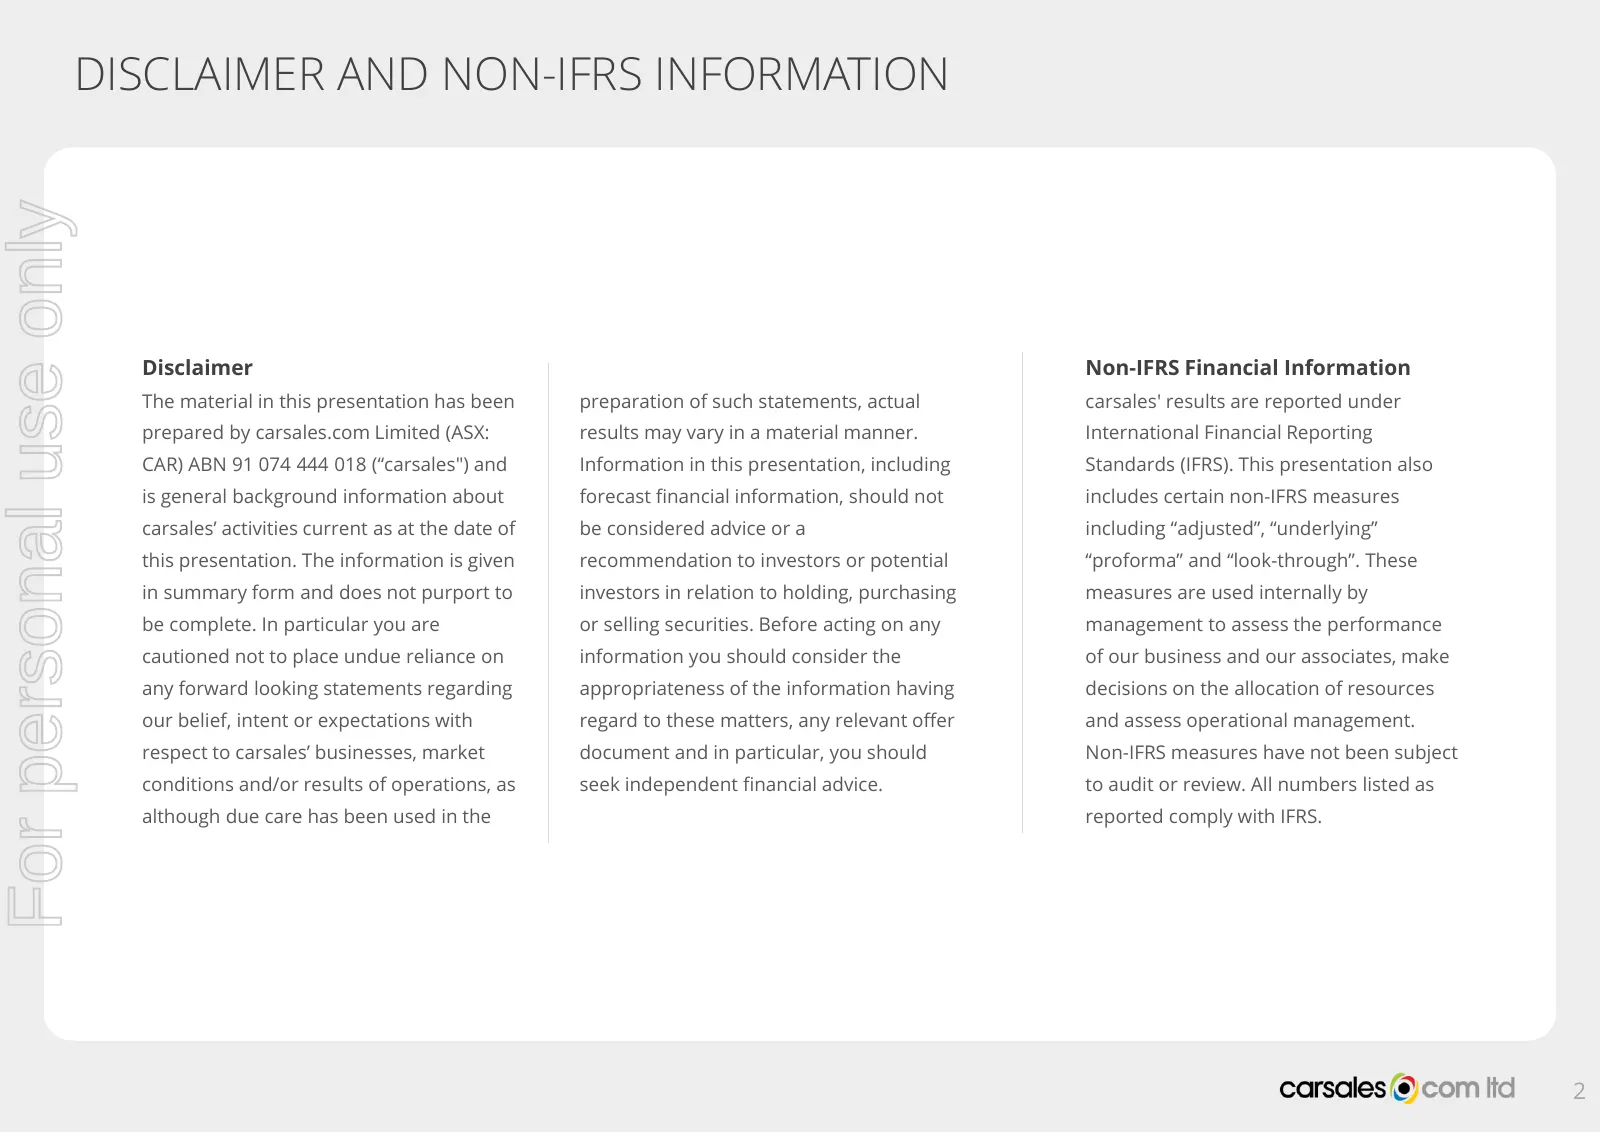
DISCLAIMER AND NON-IFRS INFORMATION For personal use only Disclaimer Non-IFRS Financial Information The material in this presentation has been preparation of such statements, actual carsales' results are reported under prepared by carsales.com Limited (ASX: results may vary in a material manner. Int
Slide 3: Contents
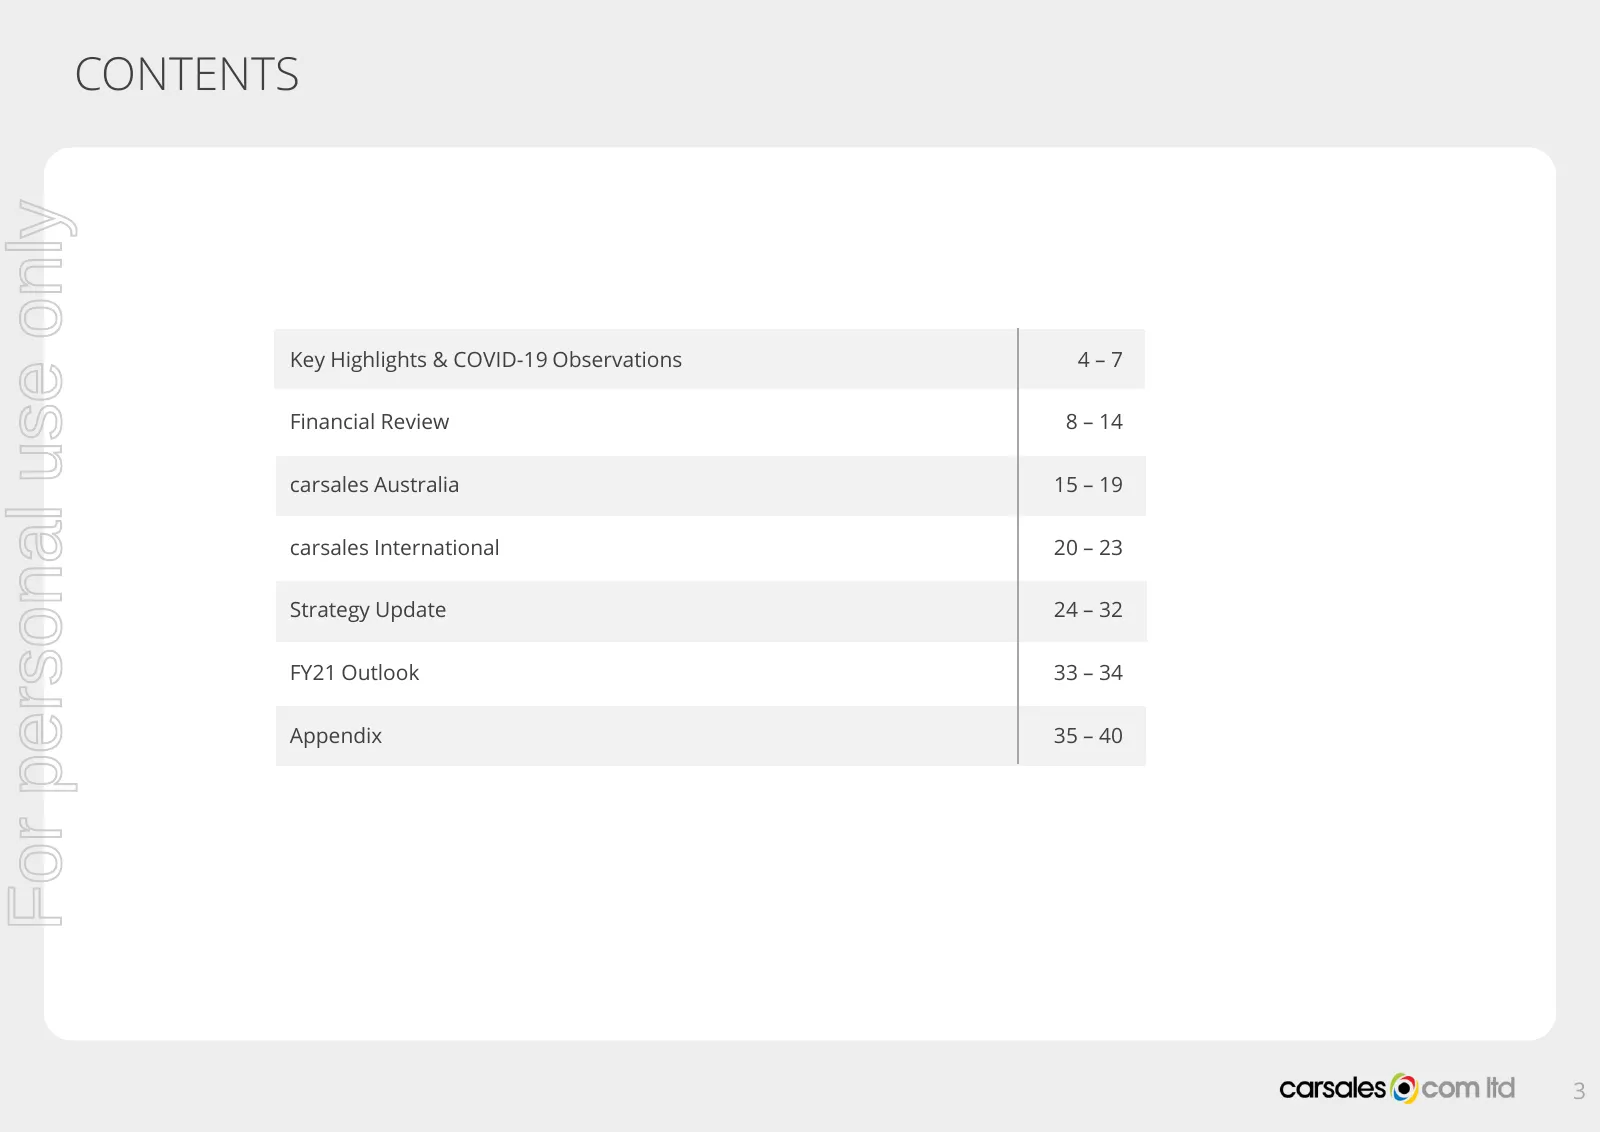
CONTENTS For personal use only Key Highlights & COVID-19 Observations 4–7 Financial Review 8 – 14 carsales Australia 15 – 19 carsales International 20 – 23 Strategy Update 24 – 32 FY21 Outlook 33 – 34 Appendix 35 – 40 3
Slide 4: H1 FY21 Highlights
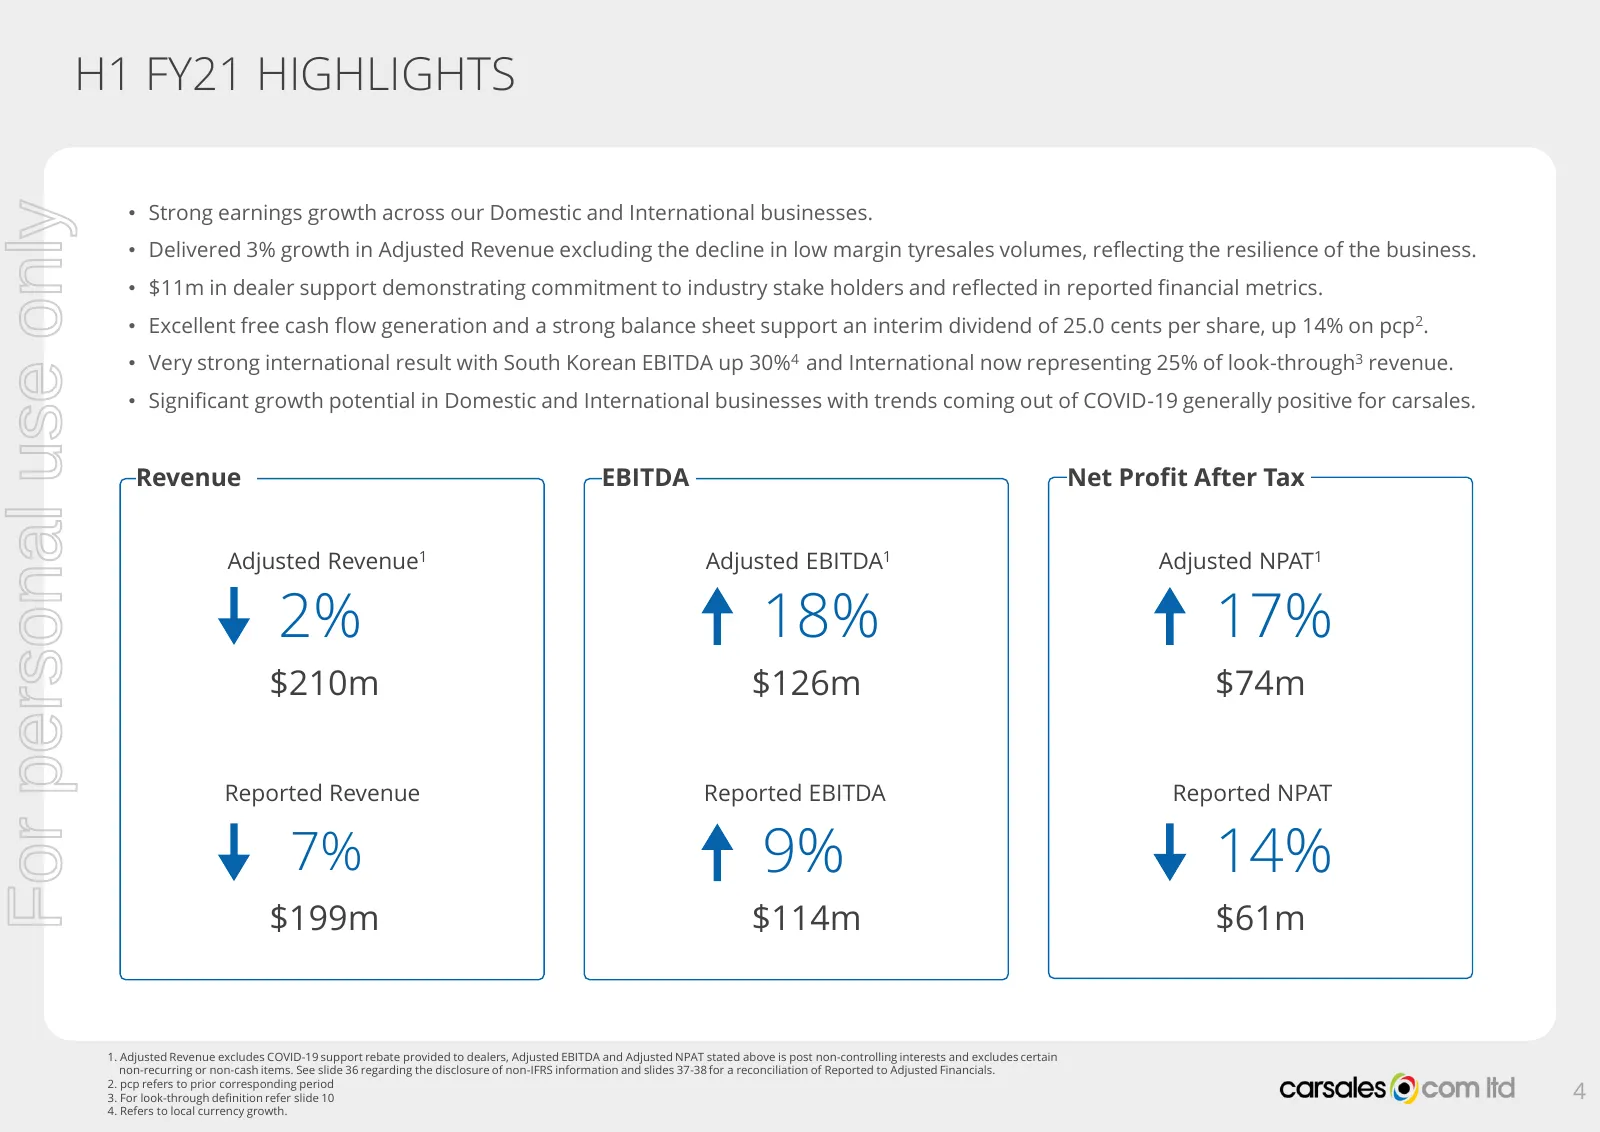
H1 FY21 HIGHLIGHTS • Strong earnings growth across our Domestic and International businesses. For personal use only • Delivered 3% growth in Adjusted Revenue excluding the decline in low margin tyresales volumes, reflecting the resilience of the business. • $11m in dealer support demonstrating commi
Slide 5: Market-Leading Operational Metrics
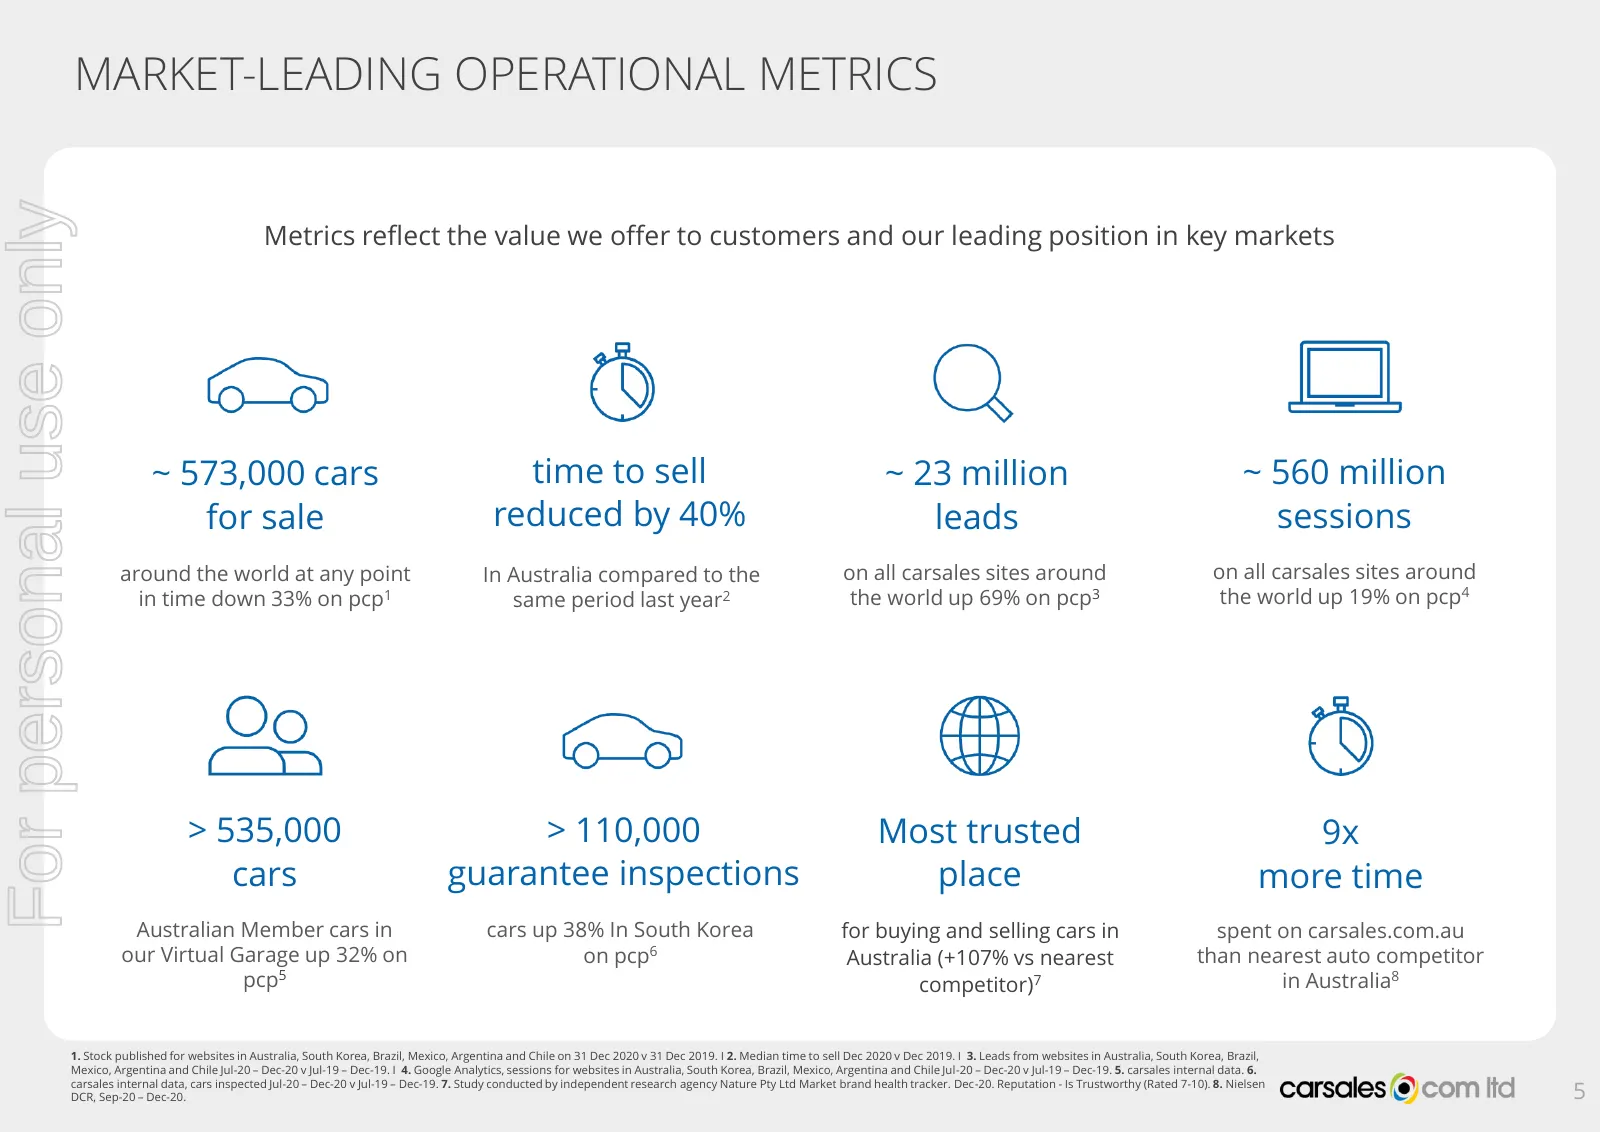
MARKET-LEADING OPERATIONAL METRICS For personal use only Metrics reflect the value we offer to customers and our leading position in key markets ~ 573,000 cars time to sell ~ 23 million ~ 560 million for sale reduced by 40% leads sessions around the world at any point In Australia compared to the on
Slide 6: Extending Our Australian Market Leadership
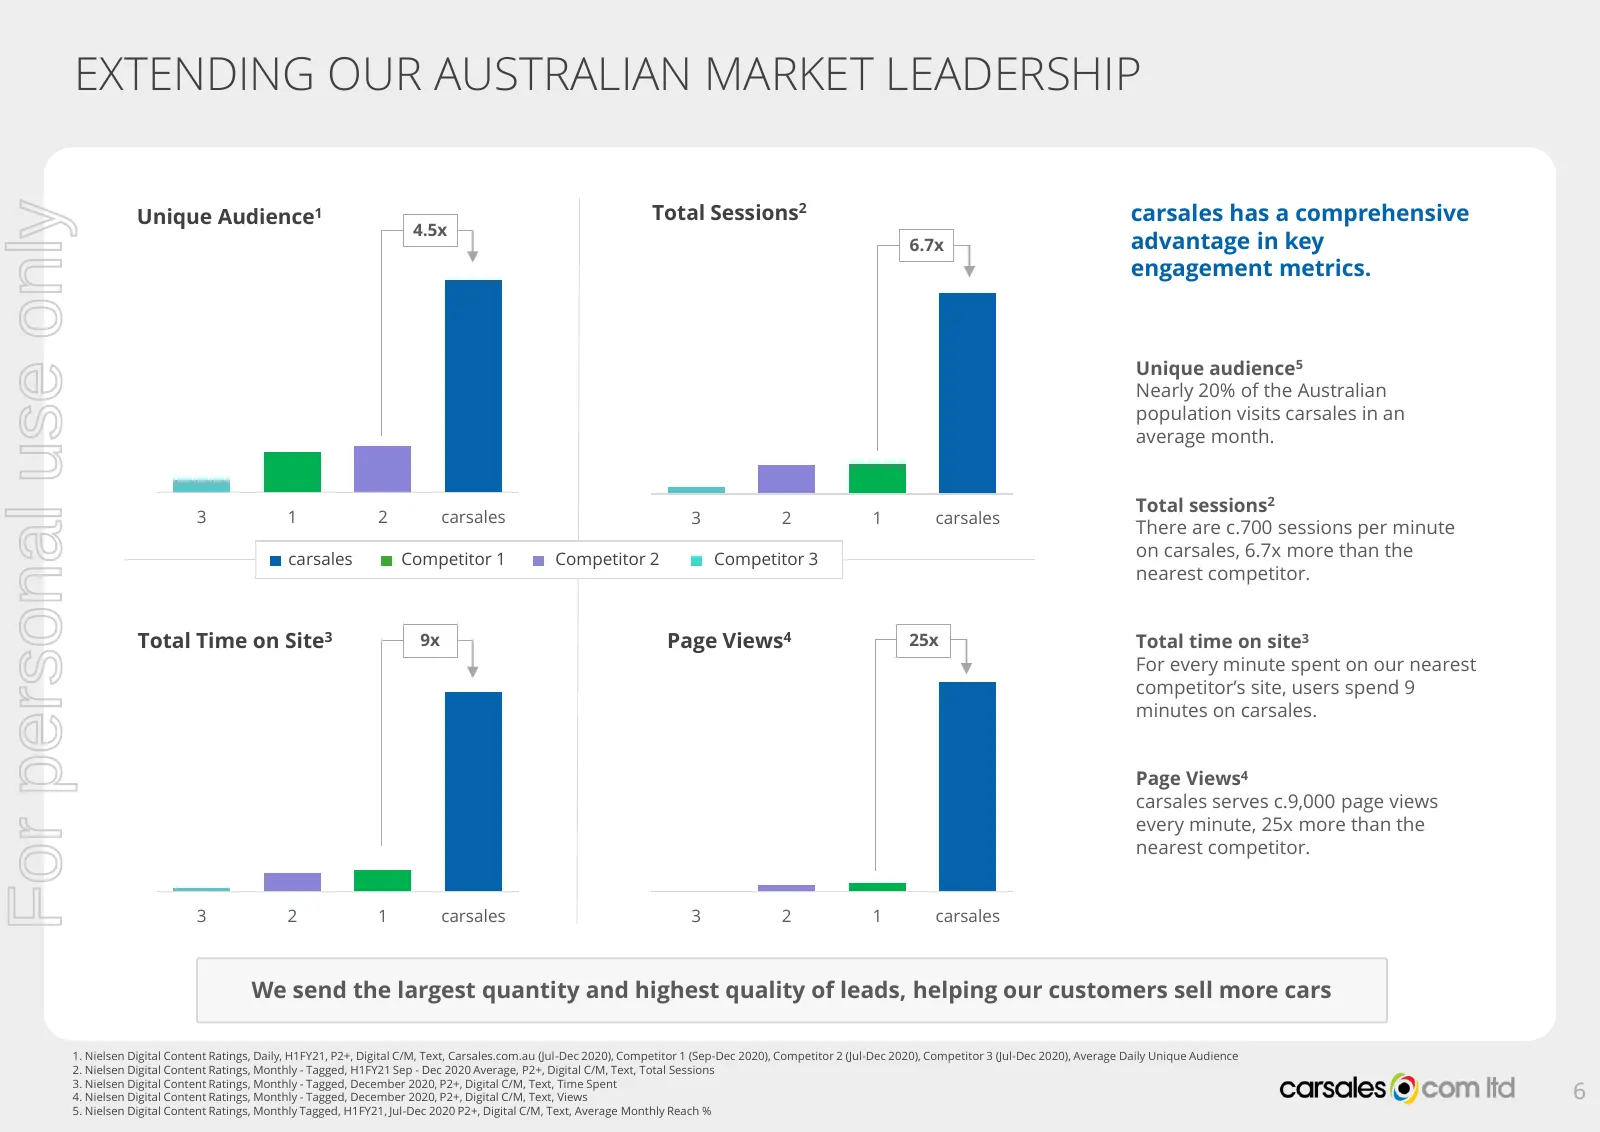
EXTENDING OUR AUSTRALIAN MARKET LEADERSHIP Total Sessions2 carsales has a comprehensive For personal use only Unique Audience1 4.5x 6.7x advantage in key engagement metrics. Unique audience5 Nearly 20% of the Australian population visits carsales in an average month. Total sessions2 3 1 2 carsales 3
Slide 7: Recent COVID-19 Related Observations
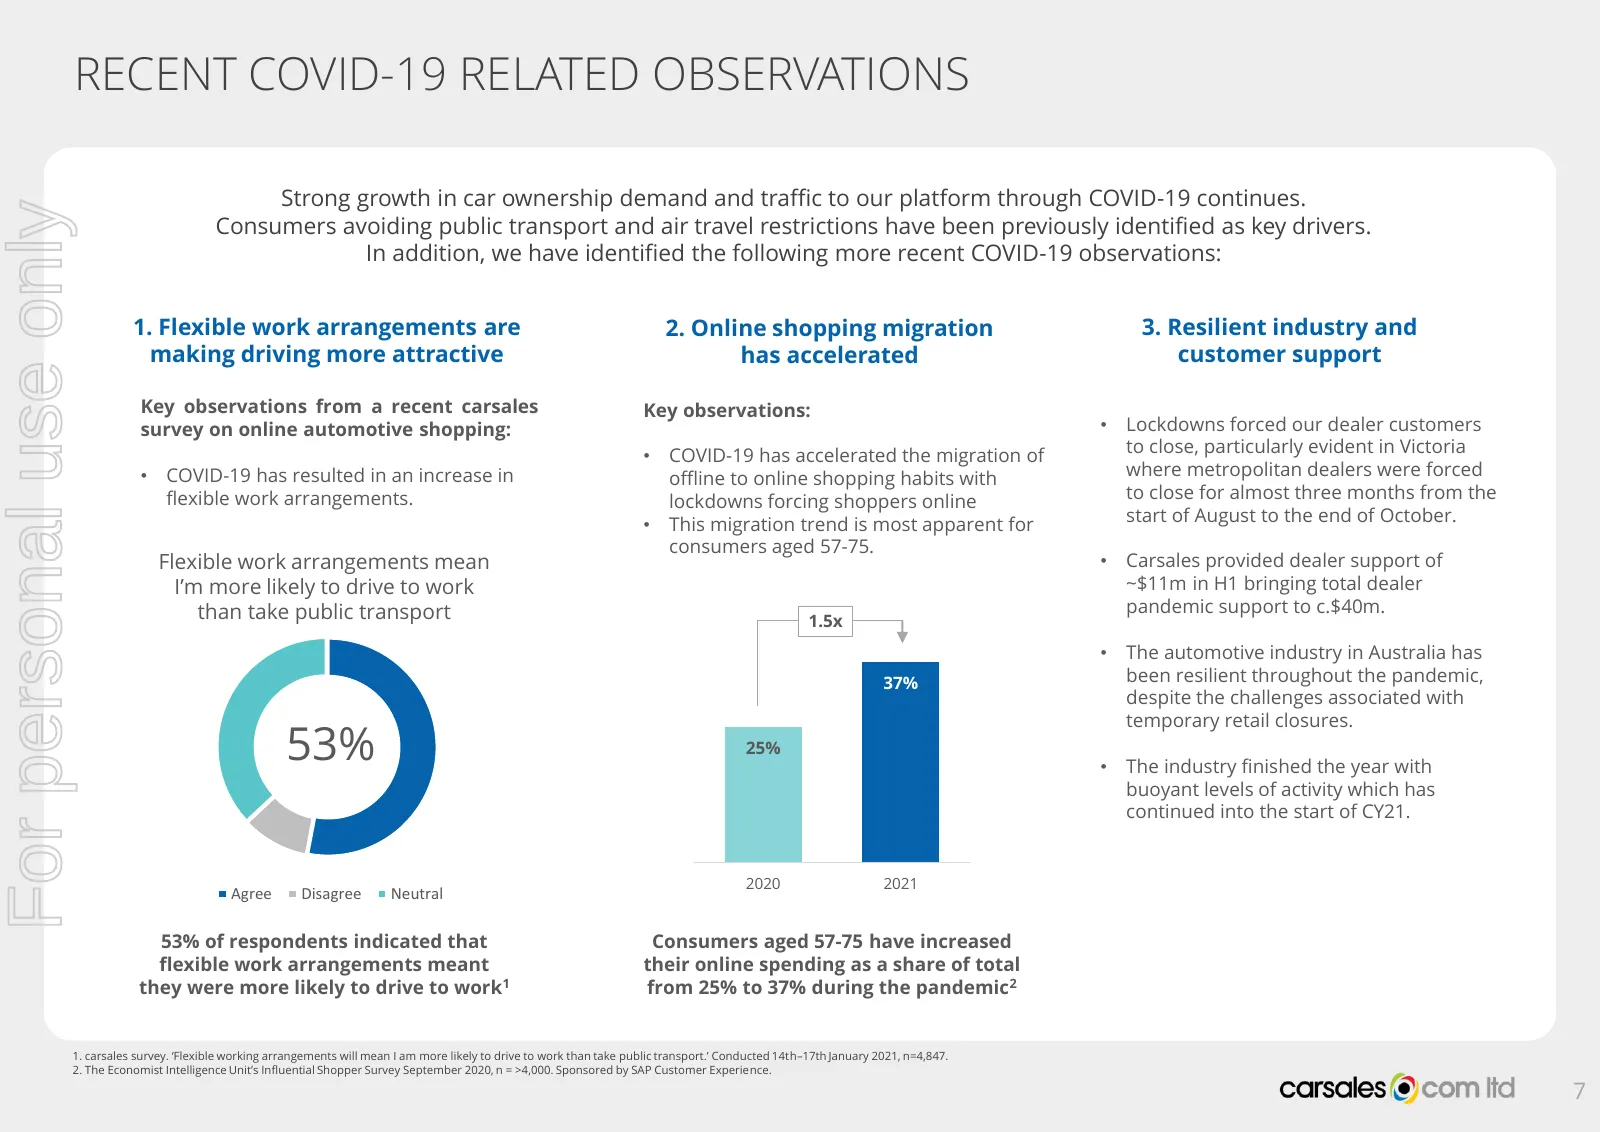
RECENT COVID-19 RELATED OBSERVATIONS Strong growth in car ownership demand and traffic to our platform through COVID-19 continues. For personal use only Consumers avoiding public transport and air travel restrictions have been previously identified as key drivers. In addition, we have identified the

Slide 8: Group Financial Review
For personal use only GROUP FINANCIAL REVIEW 8
Slide 9: Strong Track Record of Sustained Growth
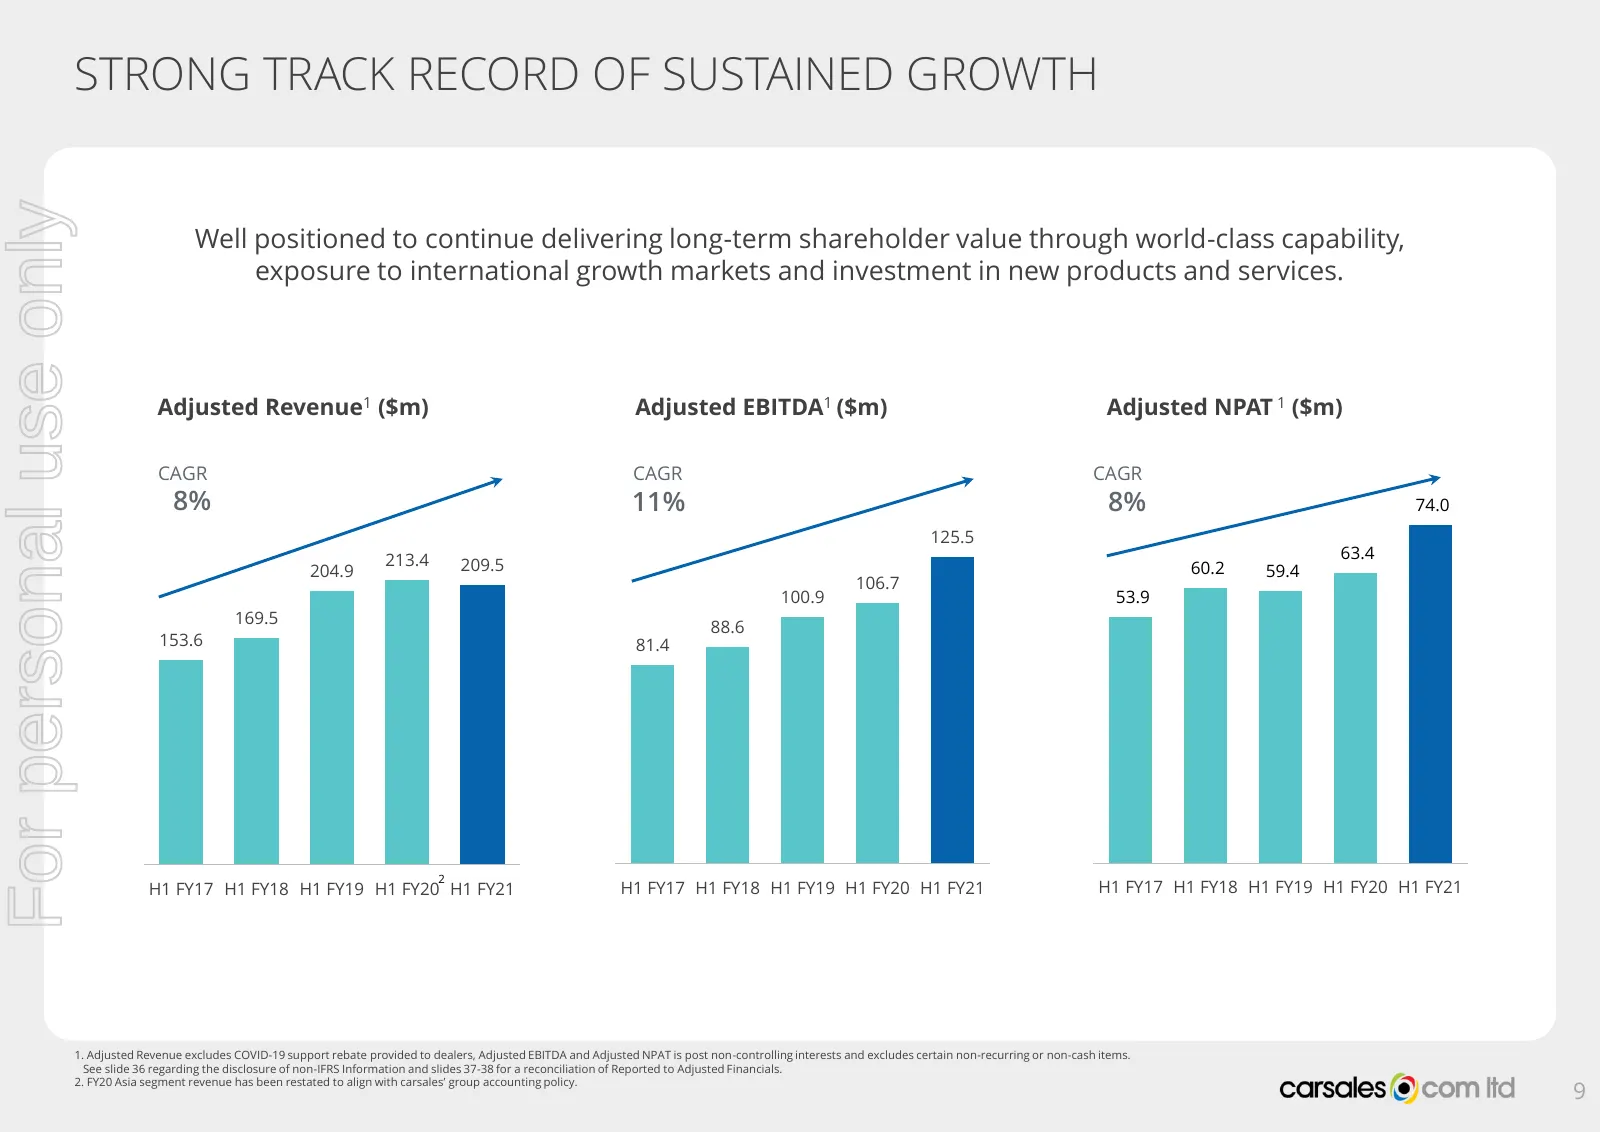
STRONG TRACK RECORD OF SUSTAINED GROWTH For personal use only Well positioned to continue delivering long-term shareholder value through world-class capability, exposure to international growth markets and investment in new products and services. Adjusted Revenue1 ($m) Adjusted EBITDA1 ($m) Adjusted
Slide 10: Look-Through Financials
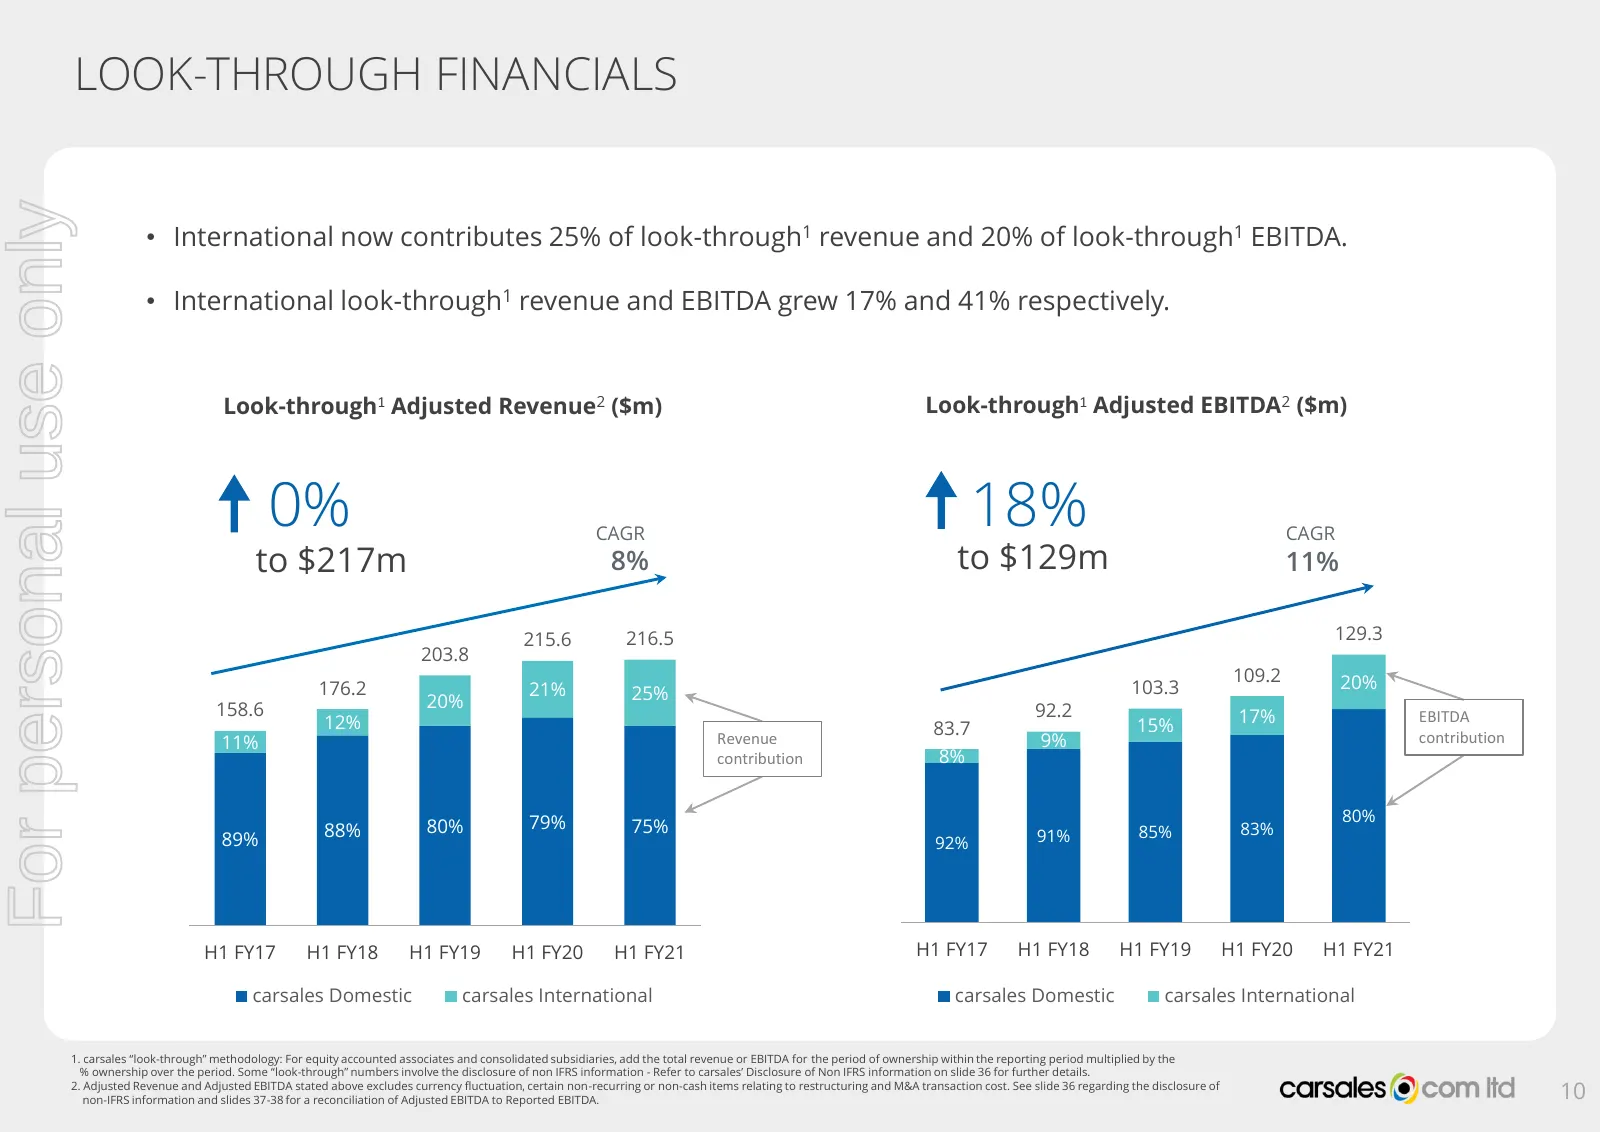
LOOK-THROUGH FINANCIALS For personal use only • International now contributes 25% of look-through1 revenue and 20% of look-through1 EBITDA. • International look-through1 revenue and EBITDA grew 17% and 41% respectively. Look-through1 Adjusted Revenue2 ($m) Look-through1 Adjusted EBITDA2 ($m) 0% CAGR
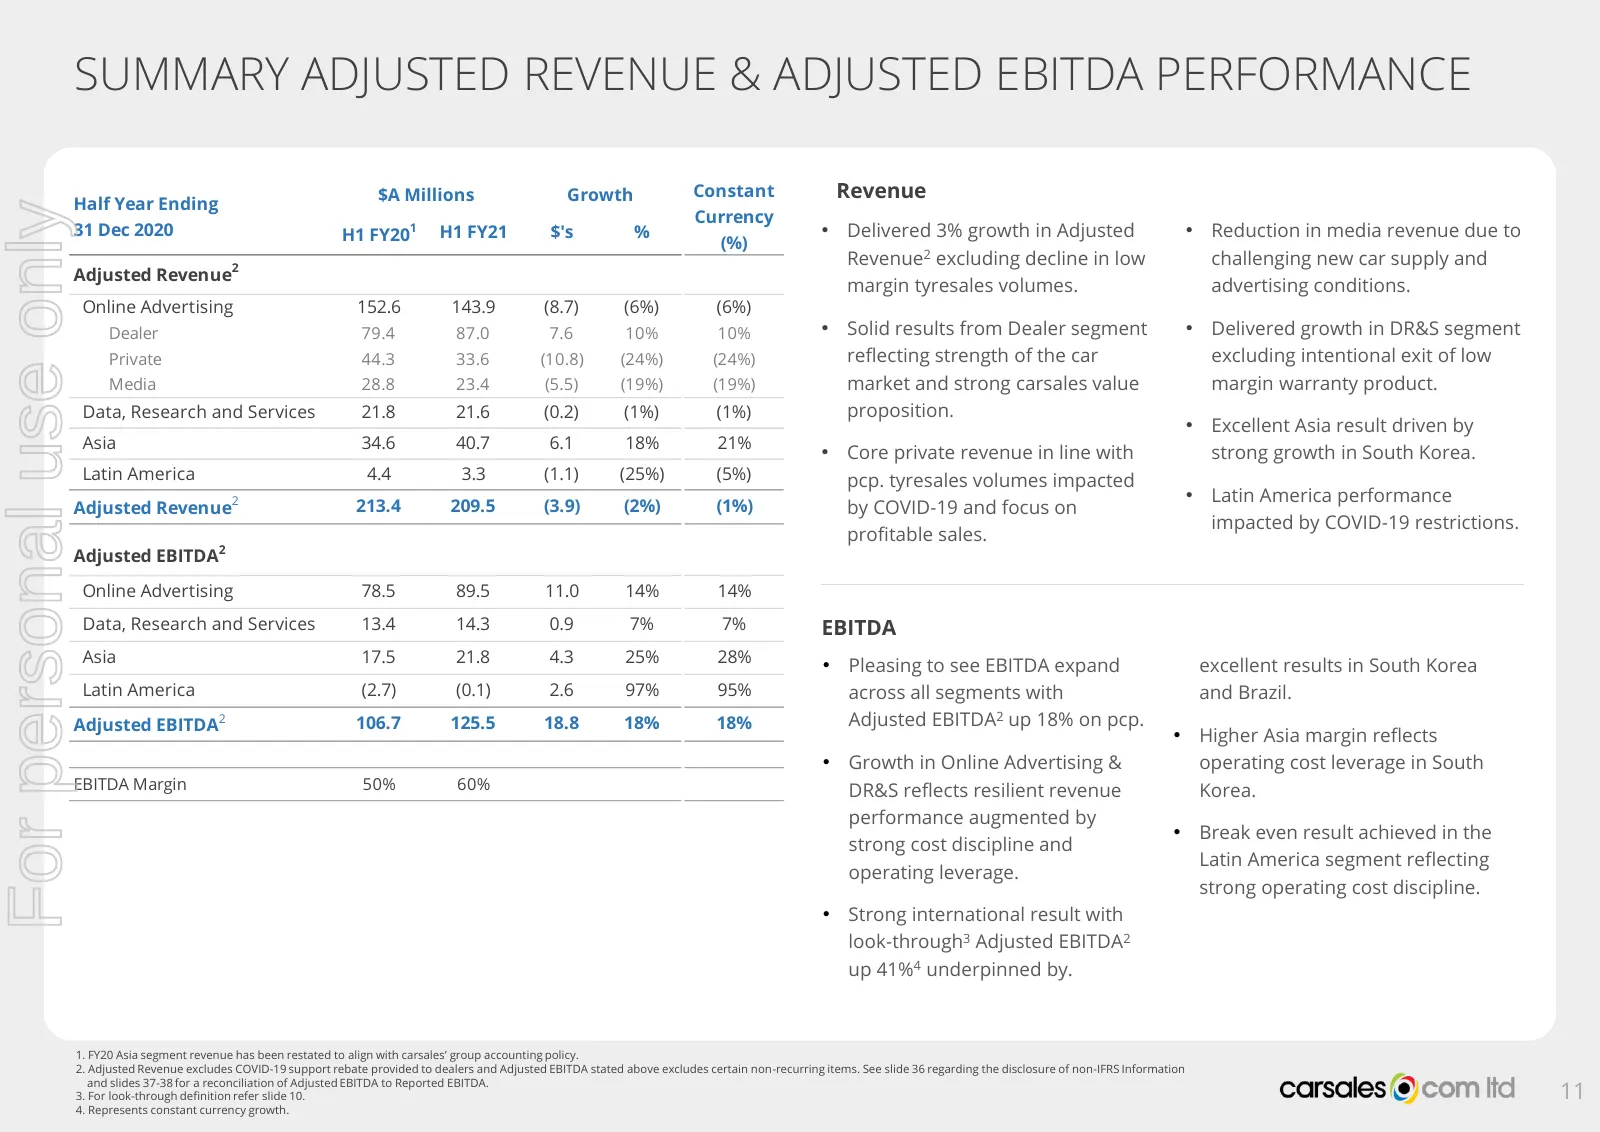
Slide 11: Summary Adjusted Revenue & Adjusted EBITDA Performance
SUMMARY ADJUSTED REVENUE & ADJUSTED EBITDA PERFORMANCE $A Millions Growth Constant Revenue Half Year Ending For personal use only Currency 31 Dec 2020 H1 FY201 H1 FY21 $'s % • Delivered 3% growth in Adjusted • Reduction in media revenue due to (%) 2 Revenue2 excluding decline in low challenging new
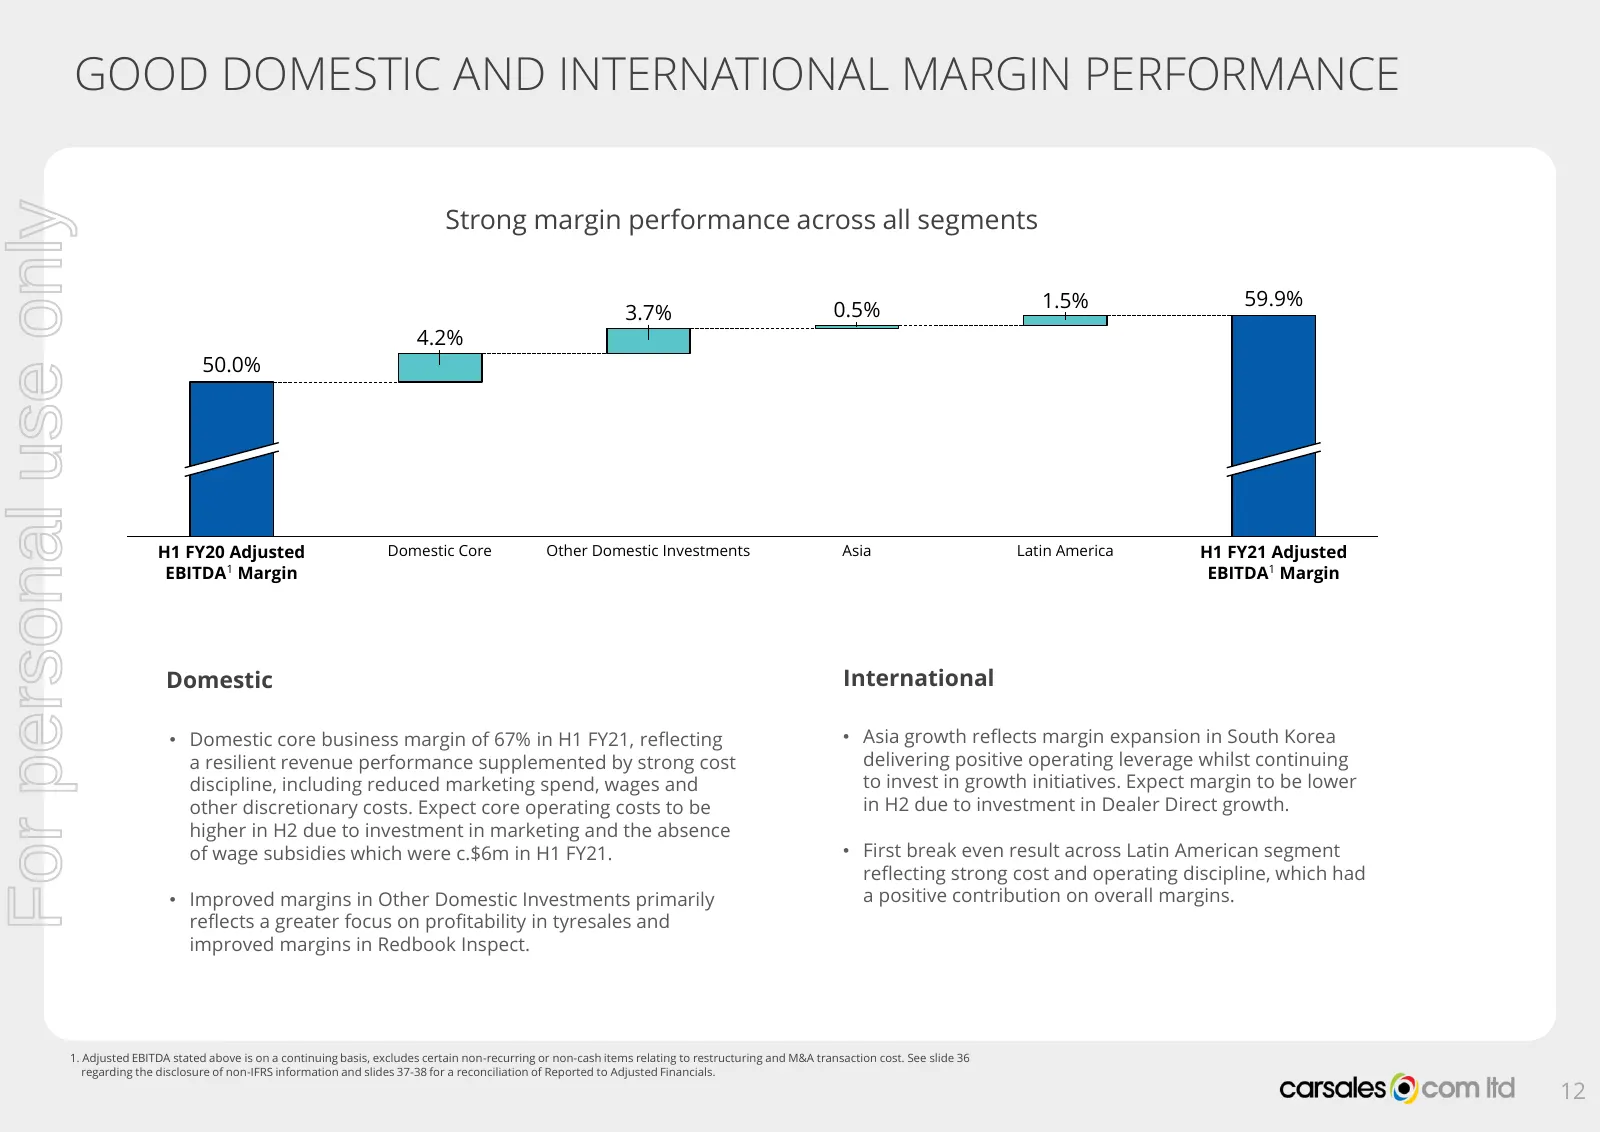
Slide 12: Good Domestic and International Margin Performance
GOOD DOMESTIC AND INTERNATIONAL MARGIN PERFORMANCE For personal use only Strong margin performance across all segments 1.5% 59.9% 3.7% 0.5% 4.2% 50.0% H1 FY20 Adjusted Domestic Core Other Domestic Investments Asia Latin America H1 FY21 Adjusted EBITDA1 Margin EBITDA1 Margin Domestic International •
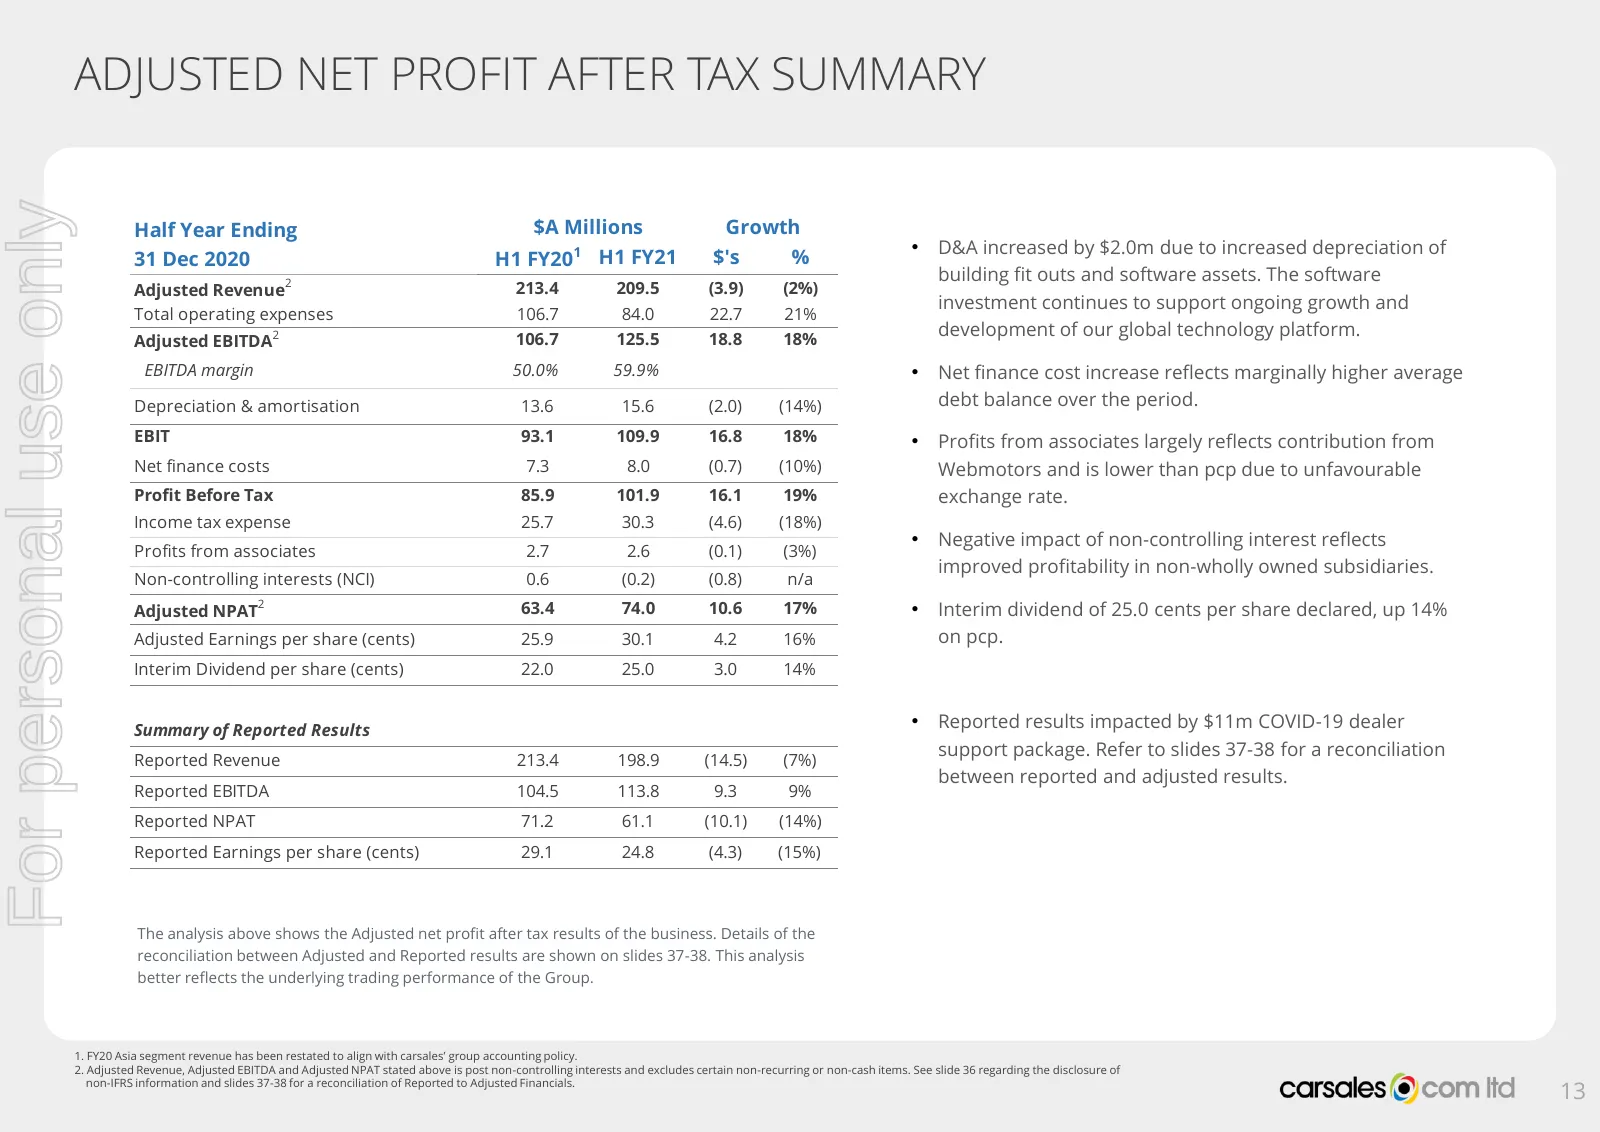
Slide 13: Adjusted Net Profit After Tax Summary
ADJUSTED NET PROFIT AFTER TAX SUMMARY For personal use only Half Year Ending $A Millions Growth 1 H1 FY21 $'s % • D&A increased by $2.0m due to increased depreciation of 31 Dec 2020 H1 FY20 2 building fit outs and software assets. The software Adjusted Revenue 213.4 209.5 (3.9) (2%) investment conti
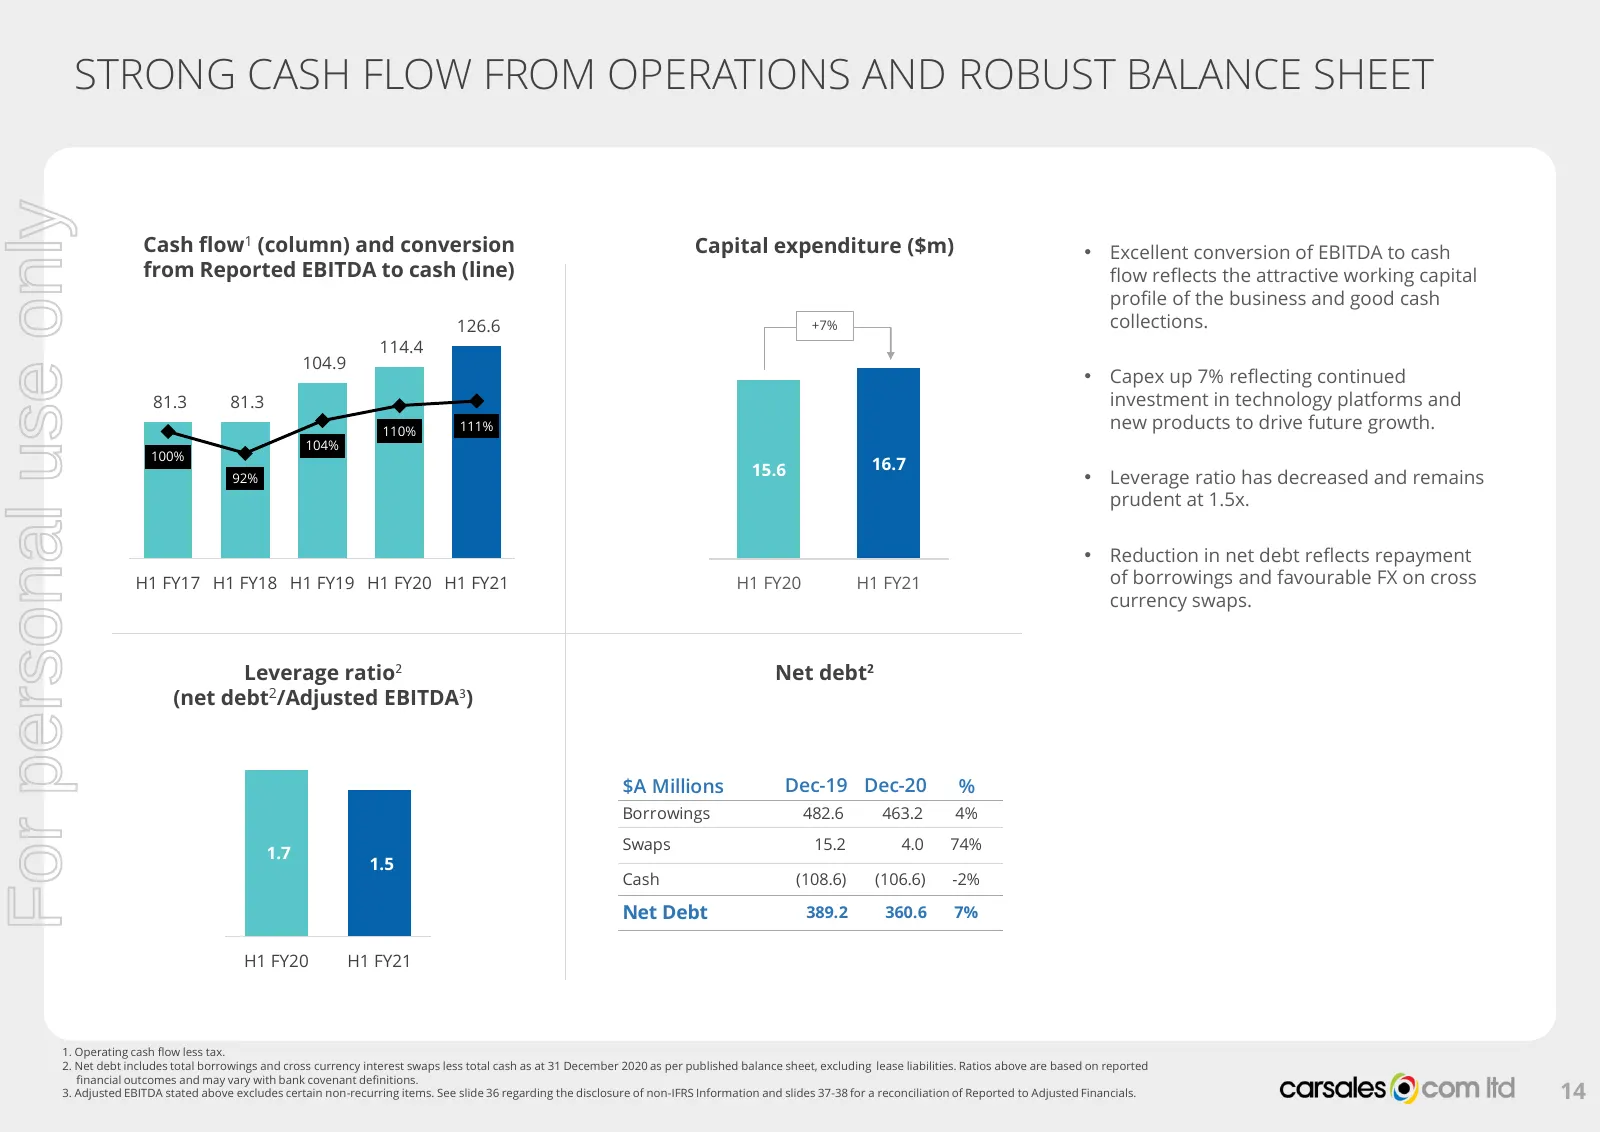
Slide 14: Strong Cash Flow from Operations and Robust Balance Sheet
STRONG CASH FLOW FROM OPERATIONS AND ROBUST BALANCE SHEET For personal use only Cash flow1 (column) and conversion Capital expenditure ($m) • Excellent conversion of EBITDA to cash from Reported EBITDA to cash (line) flow reflects the attractive working capital profile of the business and good cash

Slide 15: carsales Australia
For personal use only CARSALES AUSTRALIA 15
Slide 16: Dealer
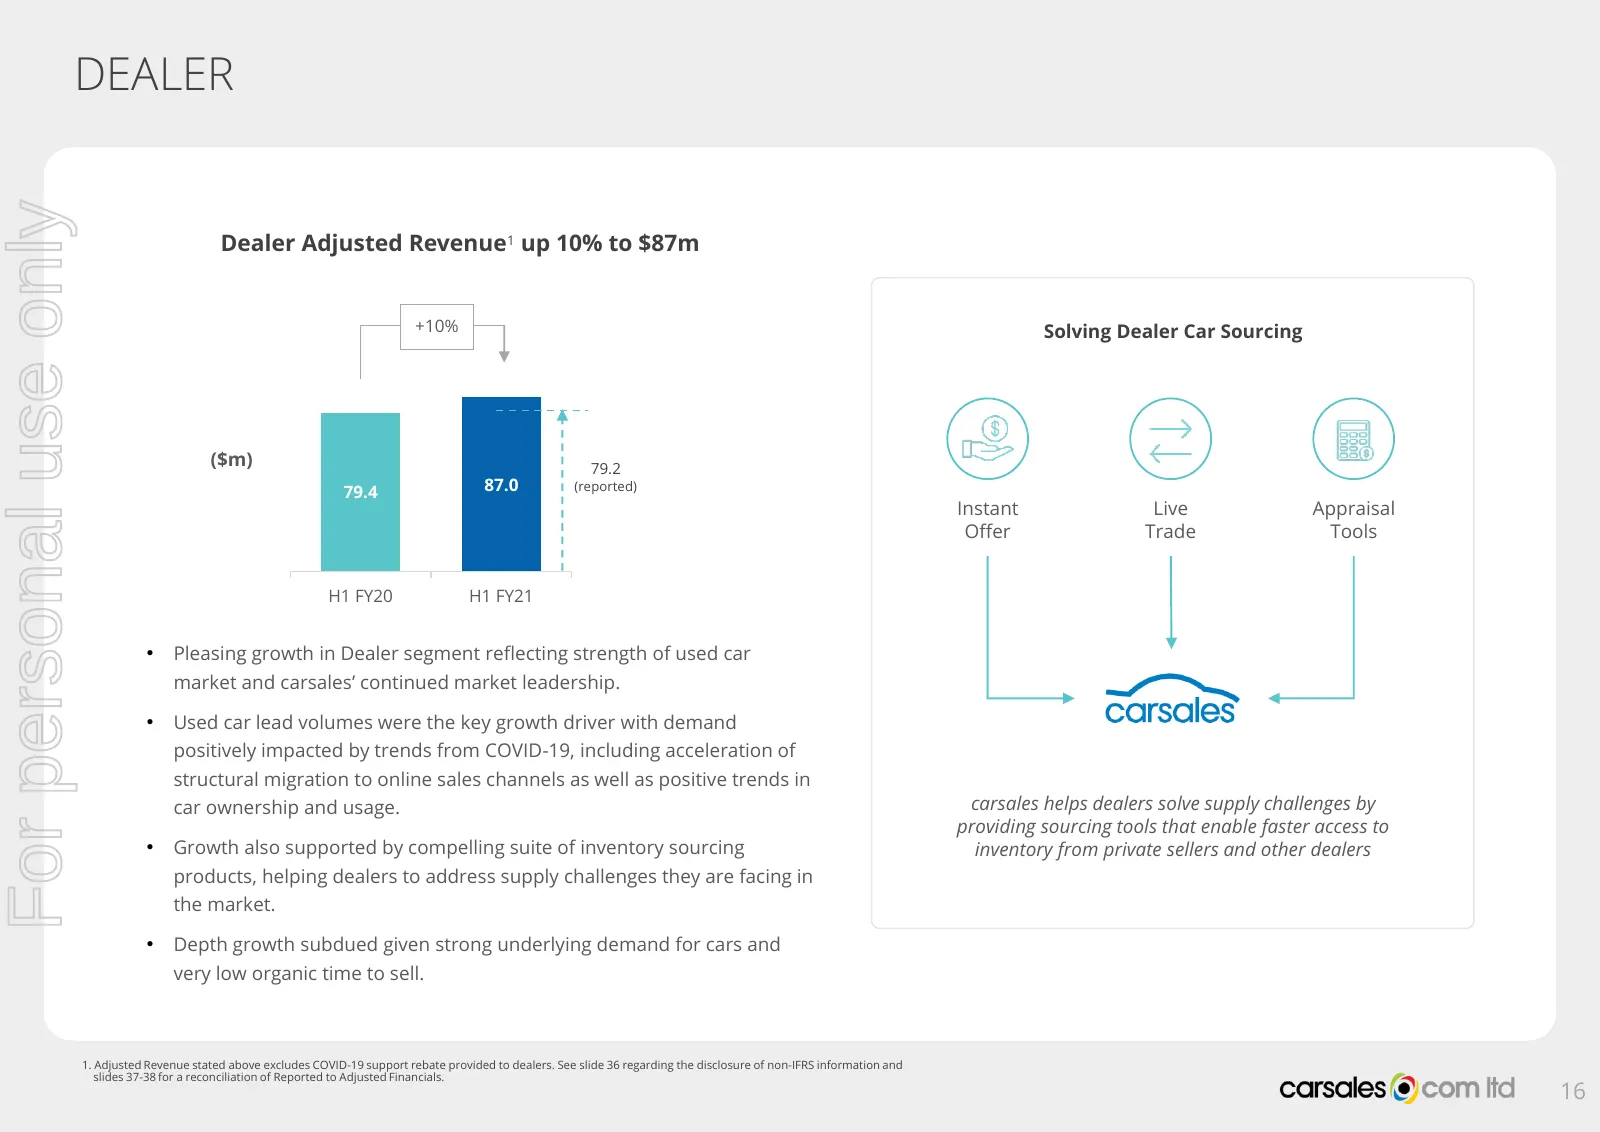
DEALER For personal use only Dealer Adjusted Revenue1 up 10% to $87m +10% Solving Dealer Car Sourcing ($m) 79.2 79.4 87.0 (reported) Instant Live Appraisal Offer Trade Tools H1 FY20 H1 FY21 • Pleasing growth in Dealer segment reflecting strength of used car market and carsales’ continued market lead
Slide 17: Private
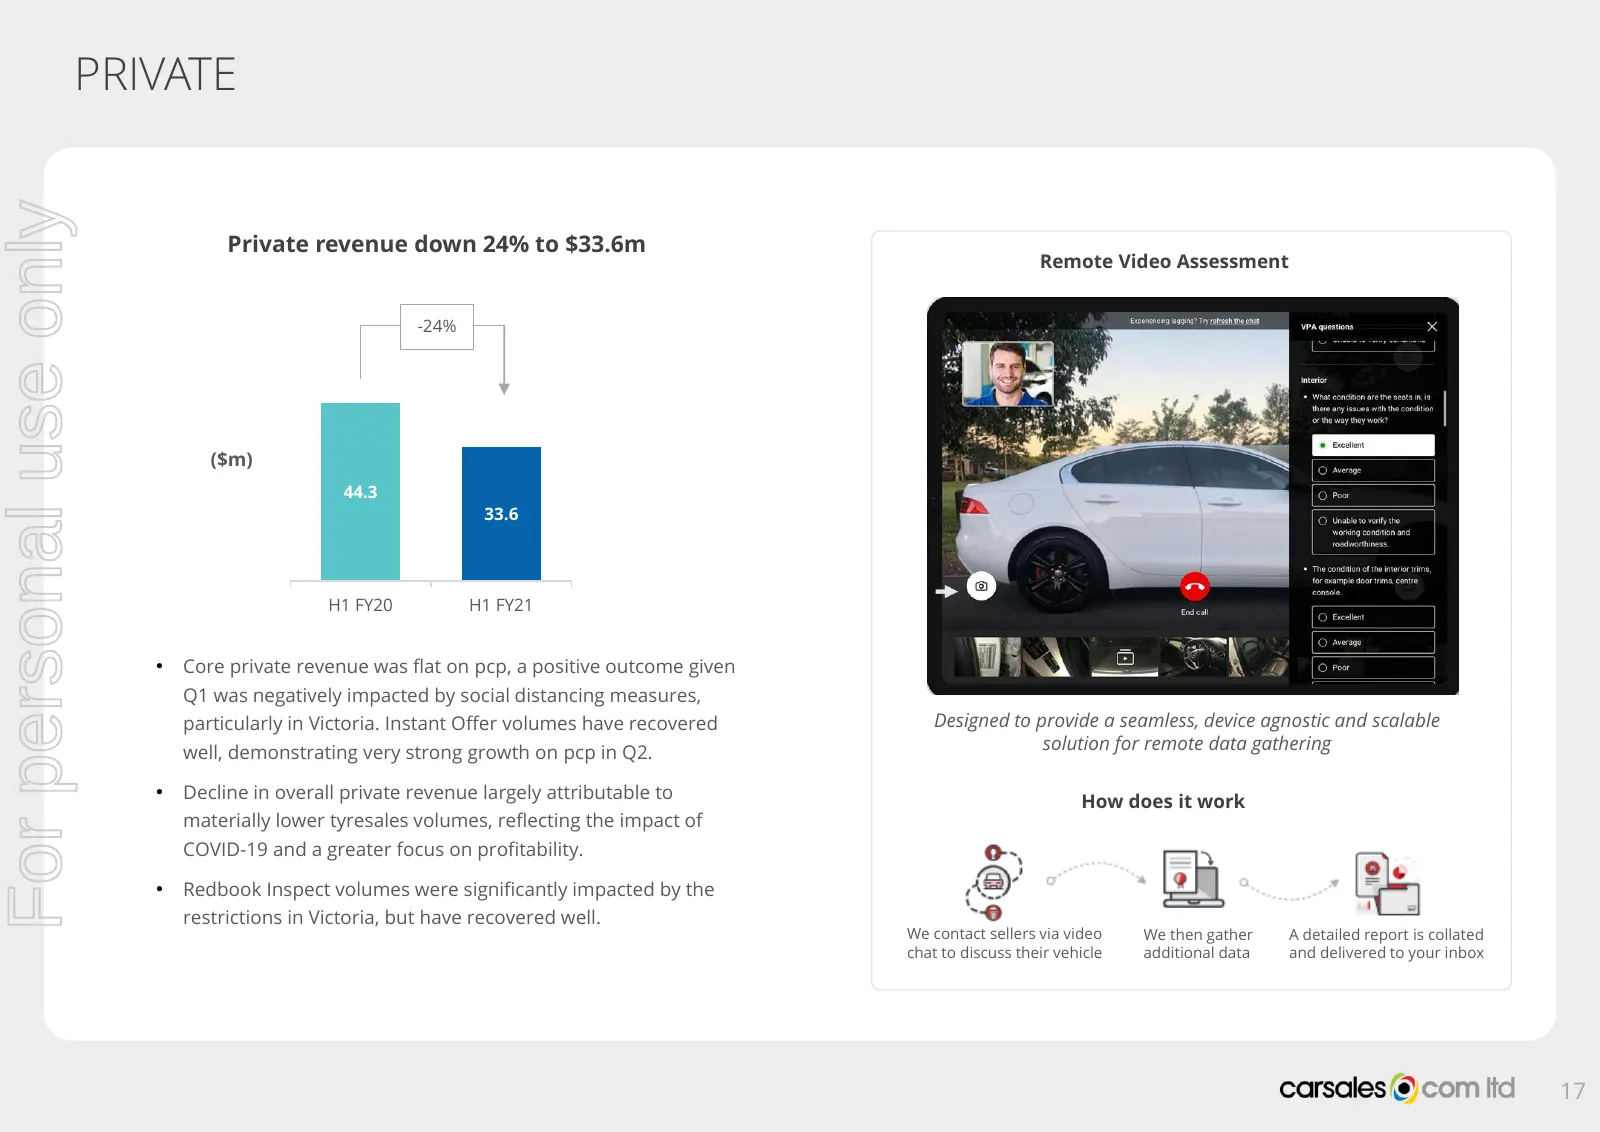
PRIVATE For personal use only Private revenue down 24% to $33.6m Remote Video Assessment -24% ($m) 44.3 33.6 H1 FY20 H1 FY21 • Core private revenue was flat on pcp, a positive outcome given Q1 was negatively impacted by social distancing measures, particularly in Victoria. Instant Offer volumes have
Slide 18: Media
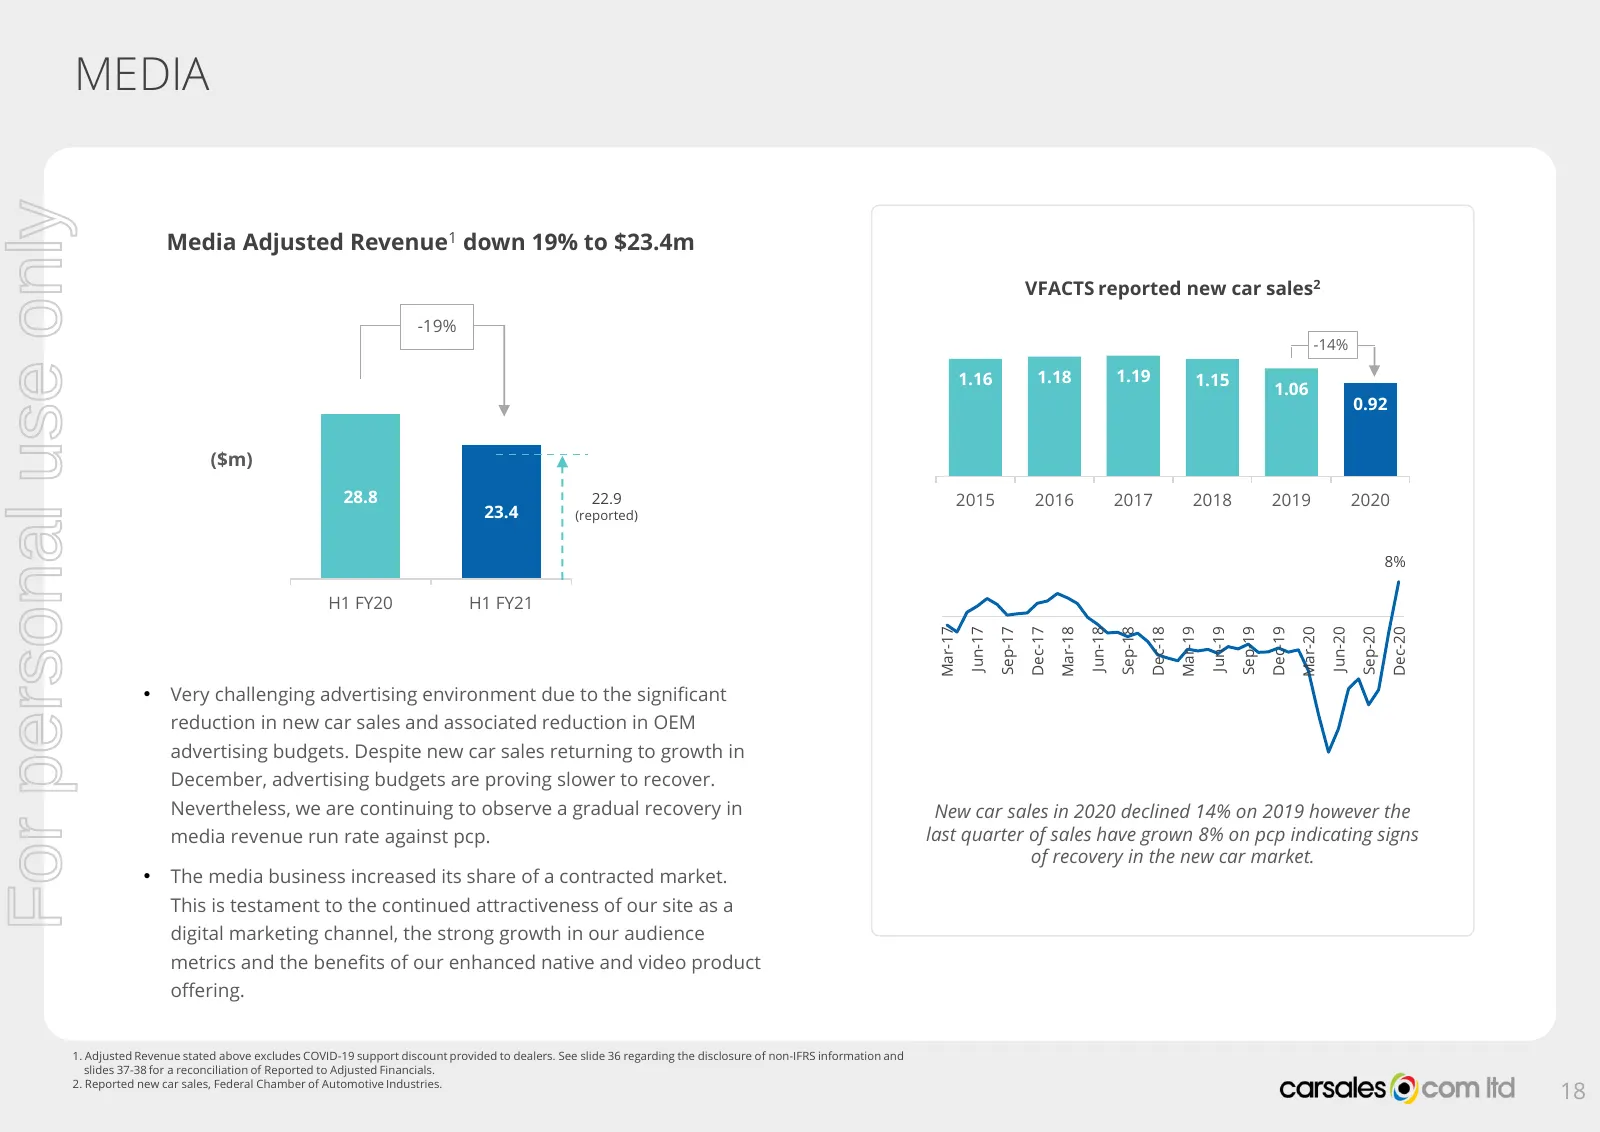
MEDIA For personal use only Media Adjusted Revenue1 down 19% to $23.4m VFACTS reported new car sales2 -19% -14% 1.16 1.18 1.19 1.15 1.06 0.92 ($m) 28.8 22.9 2015 2016 2017 2018 2019 2020 23.4 (reported) 8% H1 FY20 H1 FY21 Mar-17 Jun-17 Jun-18 Dec-17 Mar-18 Dec-18 Mar-19 Jun-19 Dec-19 Mar-20 Jun-20 D
Slide 19: Data Research & Services
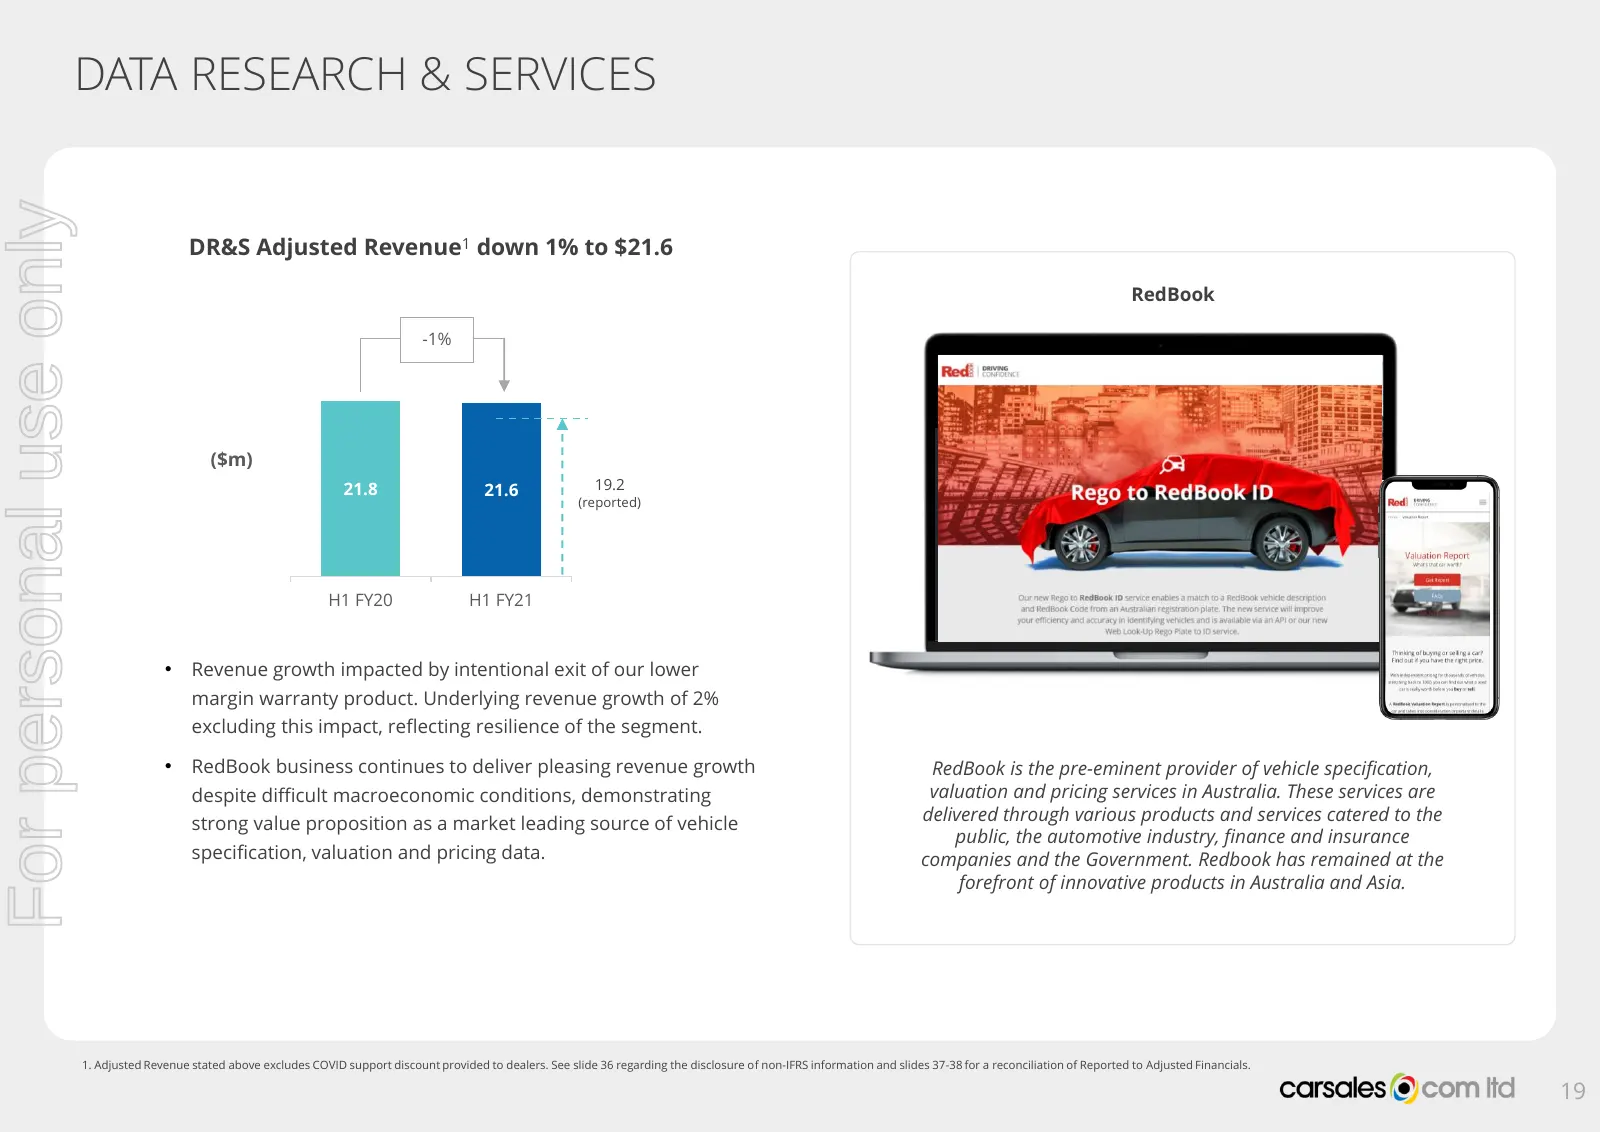
DATA RESEARCH & SERVICES For personal use only DR&S Adjusted Revenue1 down 1% to $21.6 RedBook -1% ($m) 21.8 21.6 19.2 (reported) H1 FY20 H1 FY21 • Revenue growth impacted by intentional exit of our lower margin warranty product. Underlying revenue growth of 2% excluding this impact, reflecting resi

Slide 20: carsales International
For personal use only CARSALES INTERNATIONAL
Slide 21: Asia – Encar (South Korea)
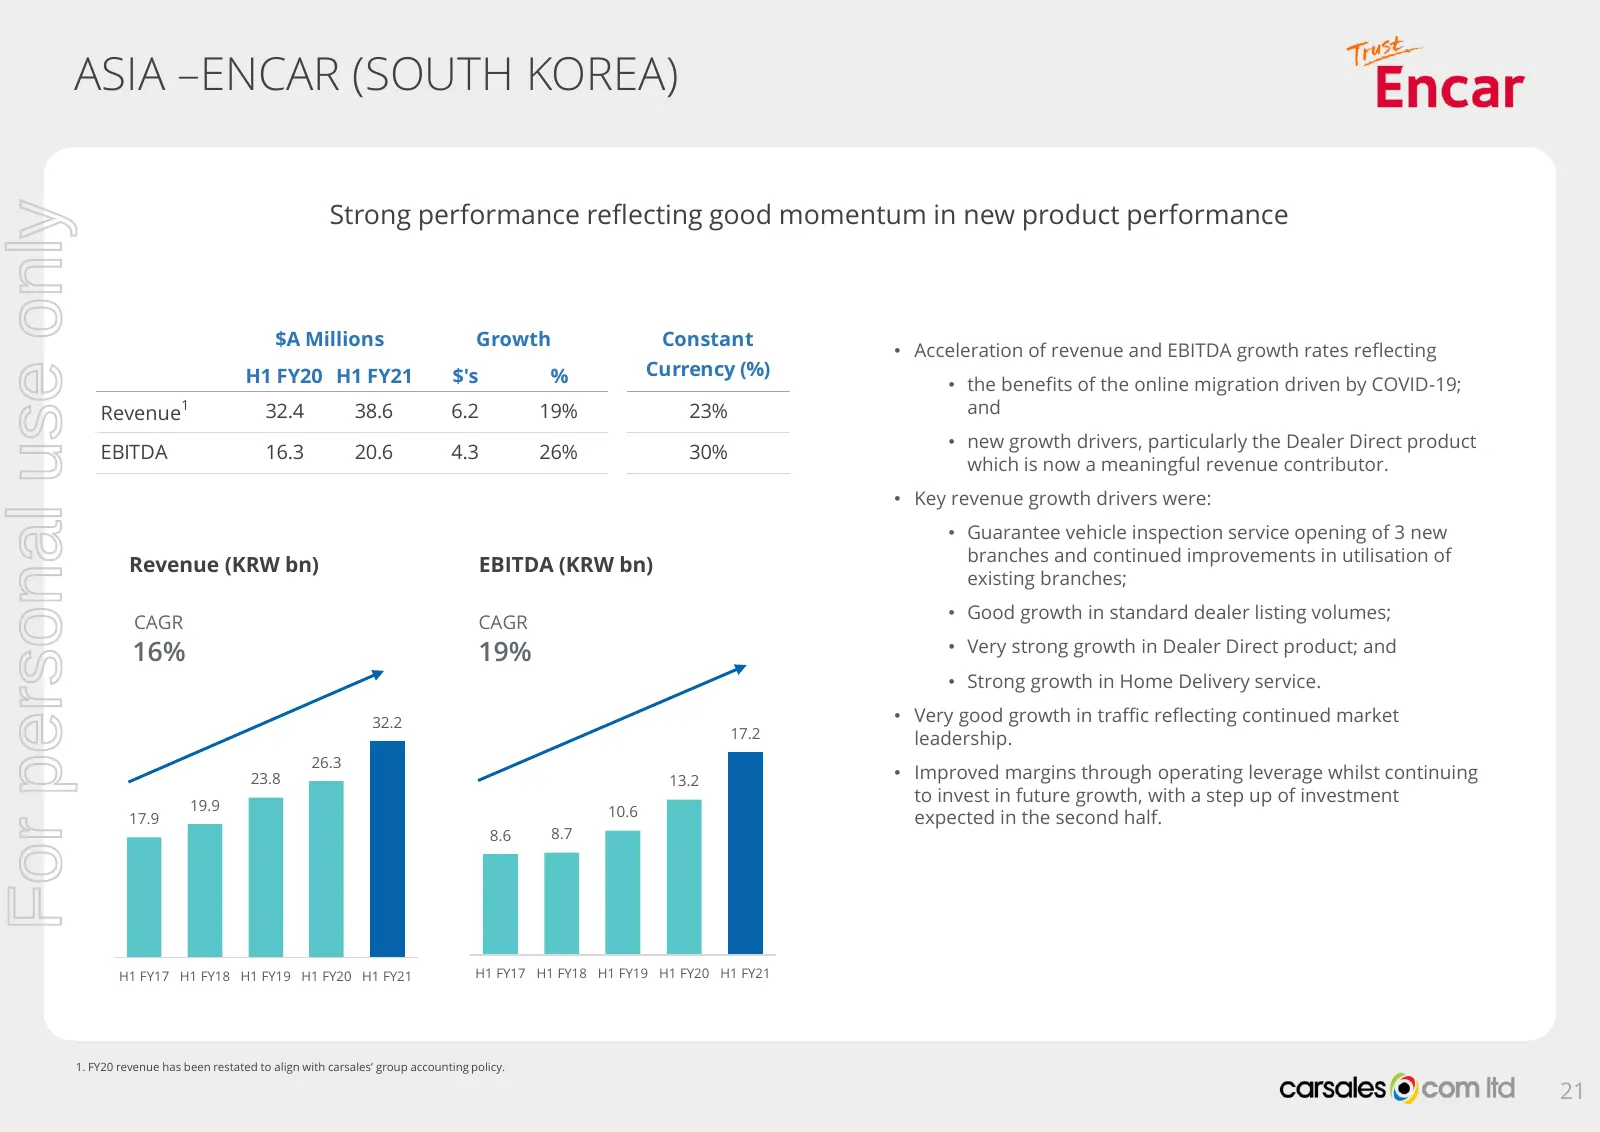
ASIA –ENCAR (SOUTH KOREA) Strong performance reflecting good momentum in new product performance For personal use only $A Millions Growth Constant • Acceleration of revenue and EBITDA growth rates reflecting H1 FY20 H1 FY21 $'s % Currency (%) • the benefits of the online migration driven by COVID-19
Slide 22: Latin America – Webmotors (Brazil)
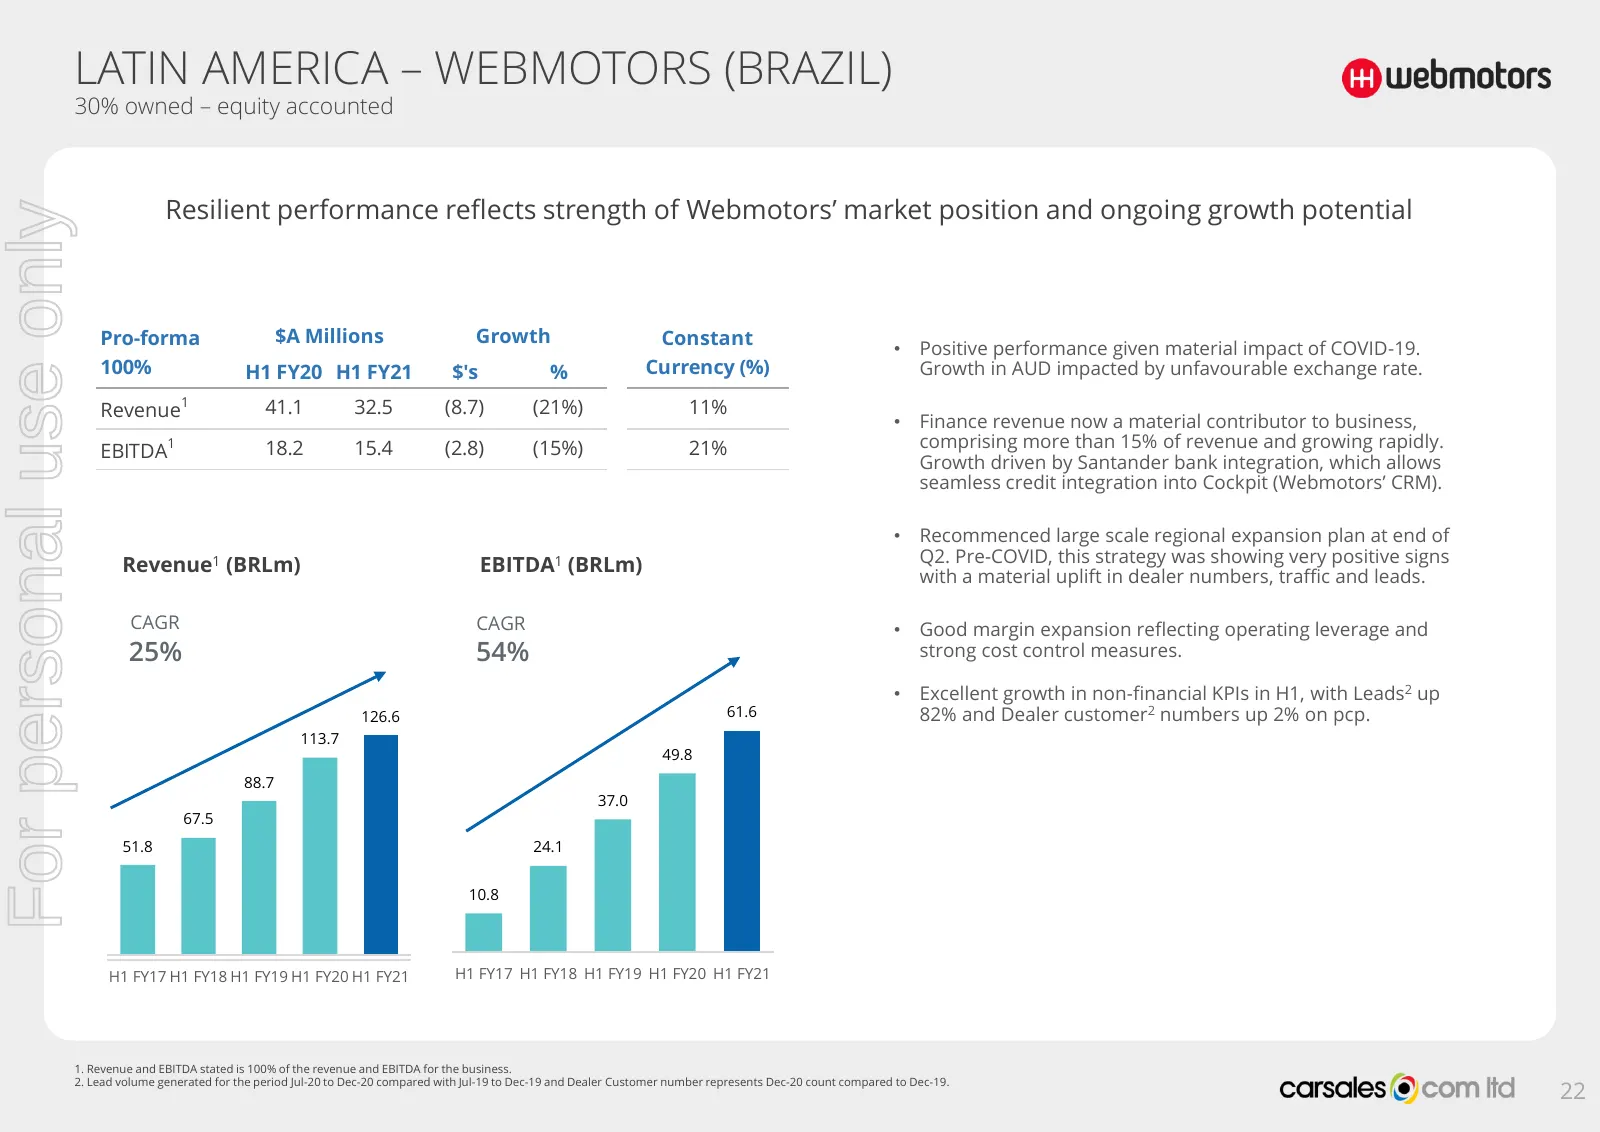
LATIN AMERICA – WEBMOTORS (BRAZIL) 30% owned – equity accounted Resilient performance reflects strength of Webmotors’ market position and ongoing growth potential For personal use only Pro-forma $A Millions Growth Constant • Positive performance given material impact of COVID-19. 100% H1 FY20 H1 FY2
Slide 23: Latin America
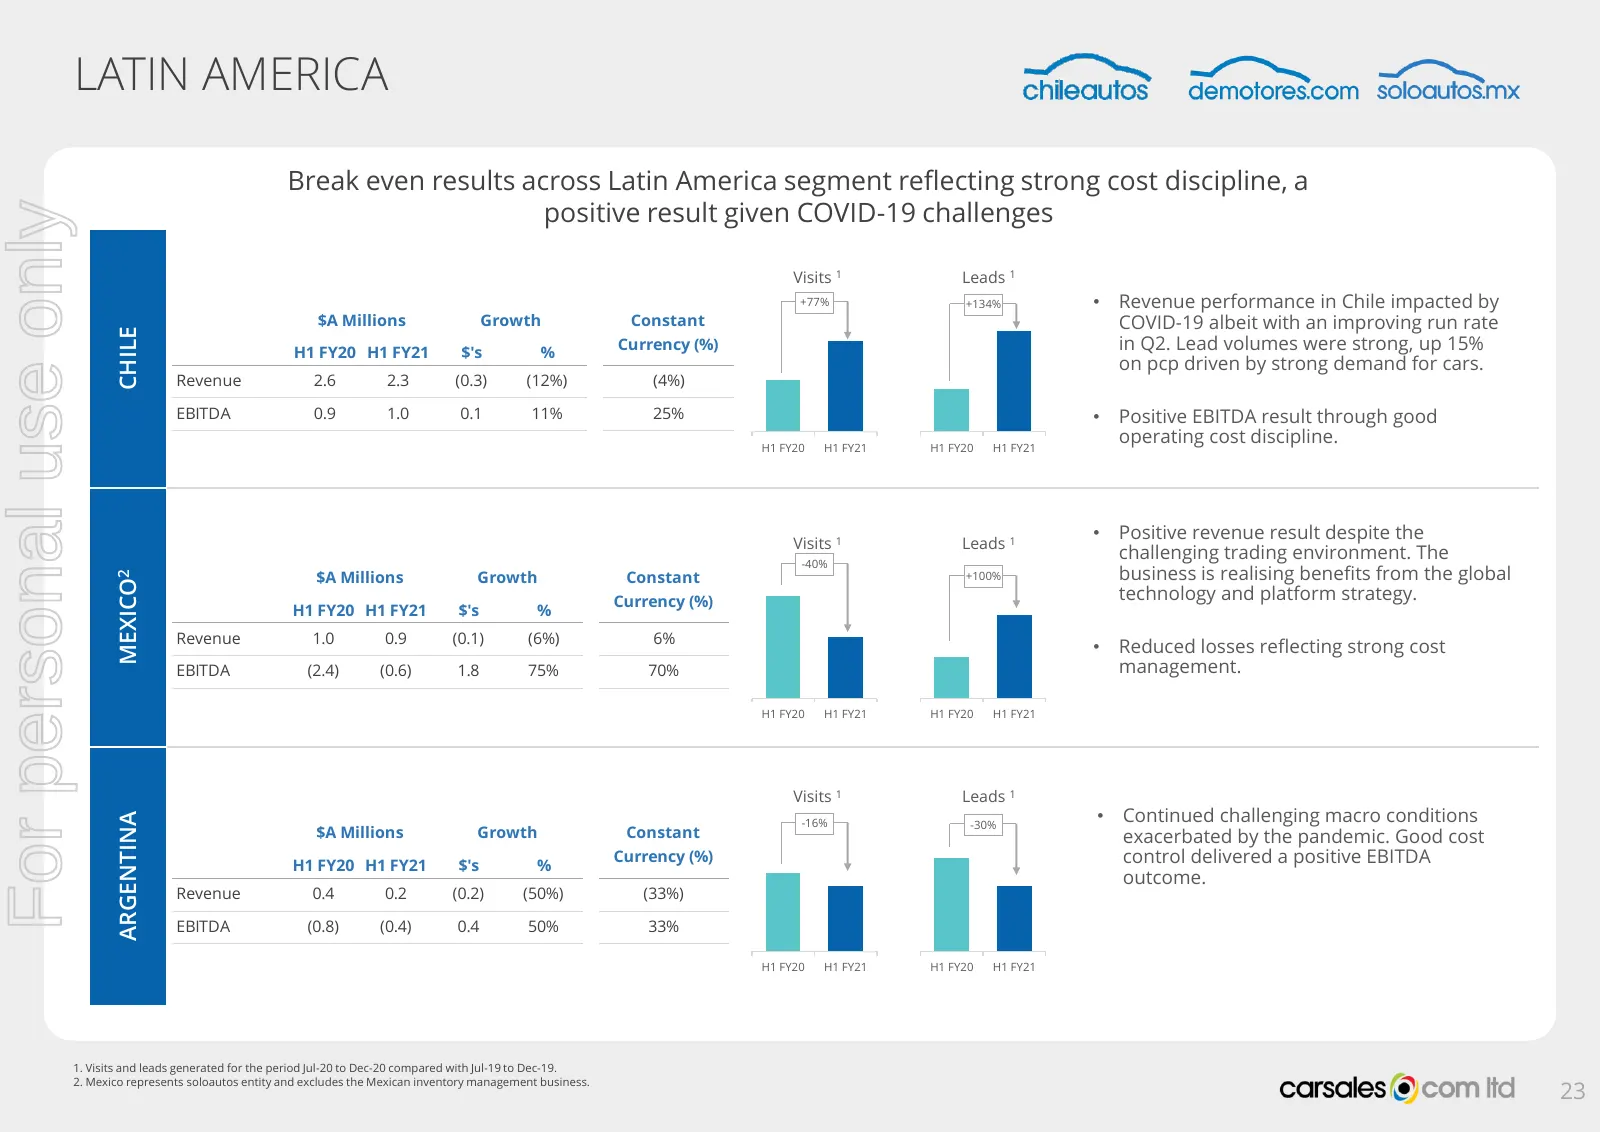
LATIN AMERICA Break even results across Latin America segment reflecting strong cost discipline, a positive result given COVID-19 challenges For personal use only Visits 1 Leads 1 +77% +134% • Revenue performance in Chile impacted by $A Millions Growth Constant COVID-19 albeit with an improving run

Slide 24: Strategy Update
For personal use only UPDATE STRATEGY
Slide 25: carsales Strategy
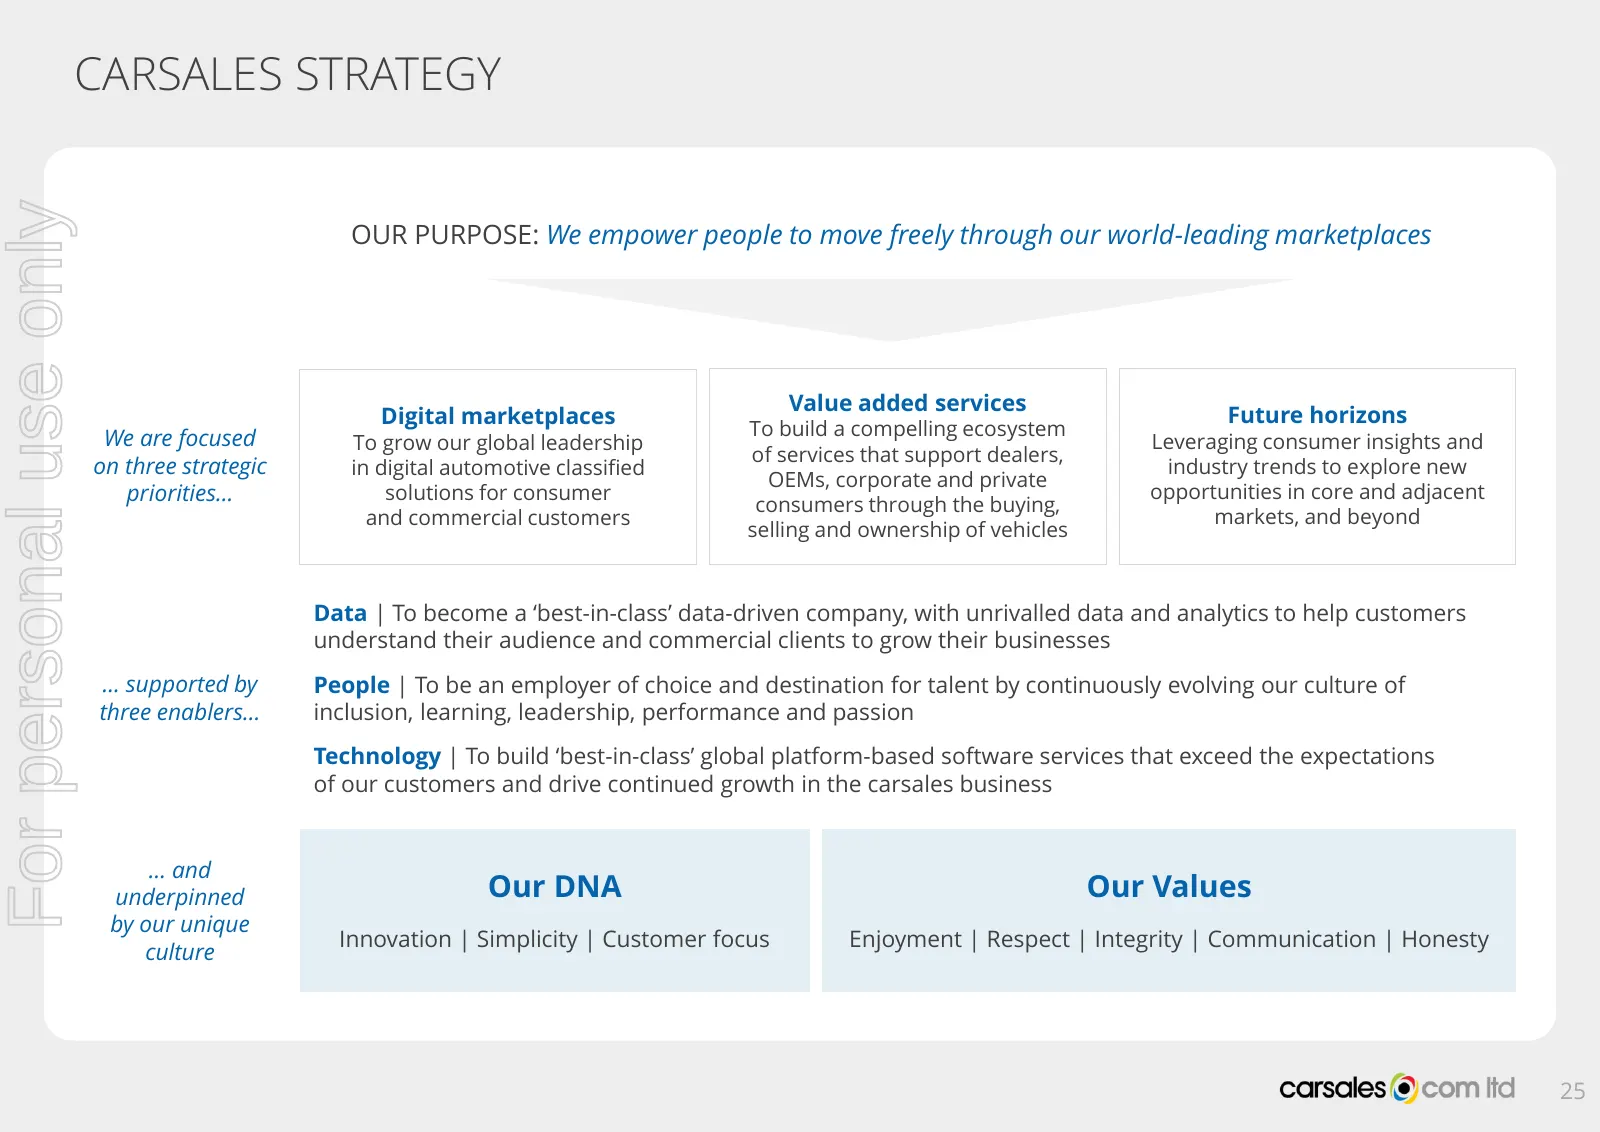
CARSALES STRATEGY For personal use only OUR PURPOSE: We empower people to move freely through our world-leading marketplaces Value added services Digital marketplaces Future horizons We are focused To build a compelling ecosystem To grow our global leadership Leveraging consumer insights and of serv
Slide 26: Australia FY21 Key Focus Areas
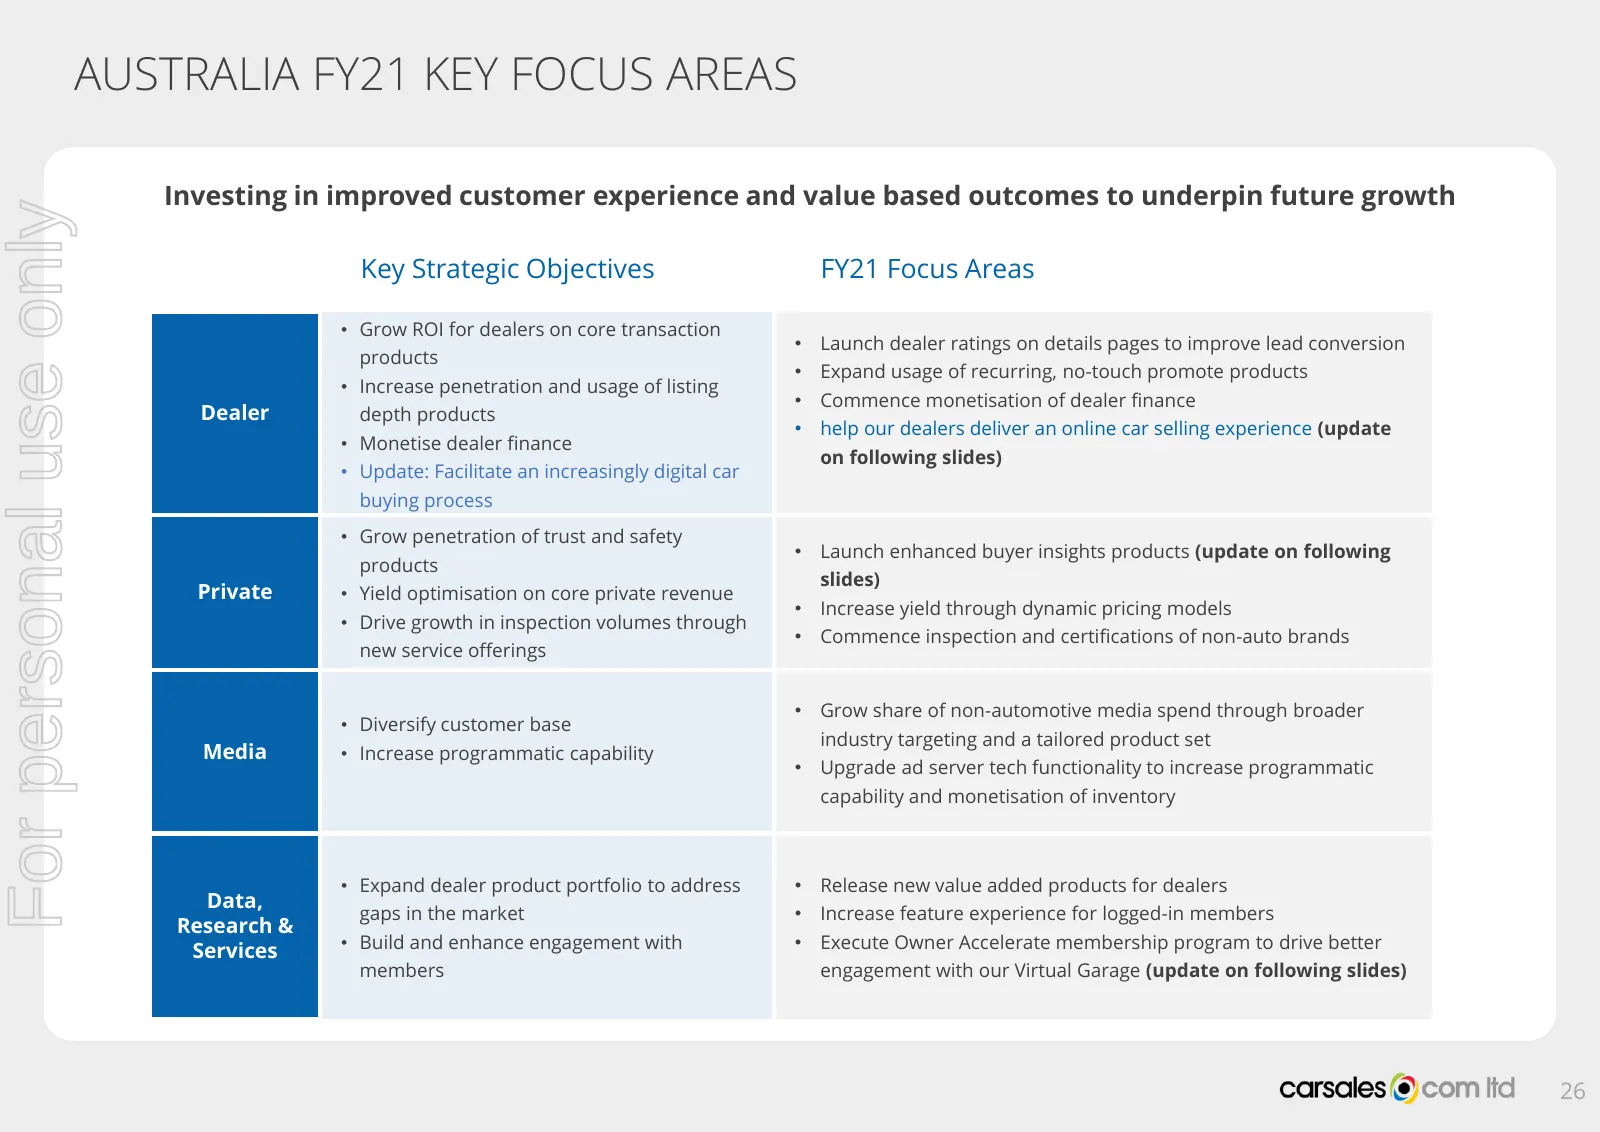
AUSTRALIA FY21 KEY FOCUS AREAS Investing in improved customer experience and value based outcomes to underpin future growth For personal use only Key Strategic Objectives FY21 Focus Areas • Grow ROI for dealers on core transaction • Launch dealer ratings on details pages to improve lead conversion p
Slide 27: Digital Car Buying
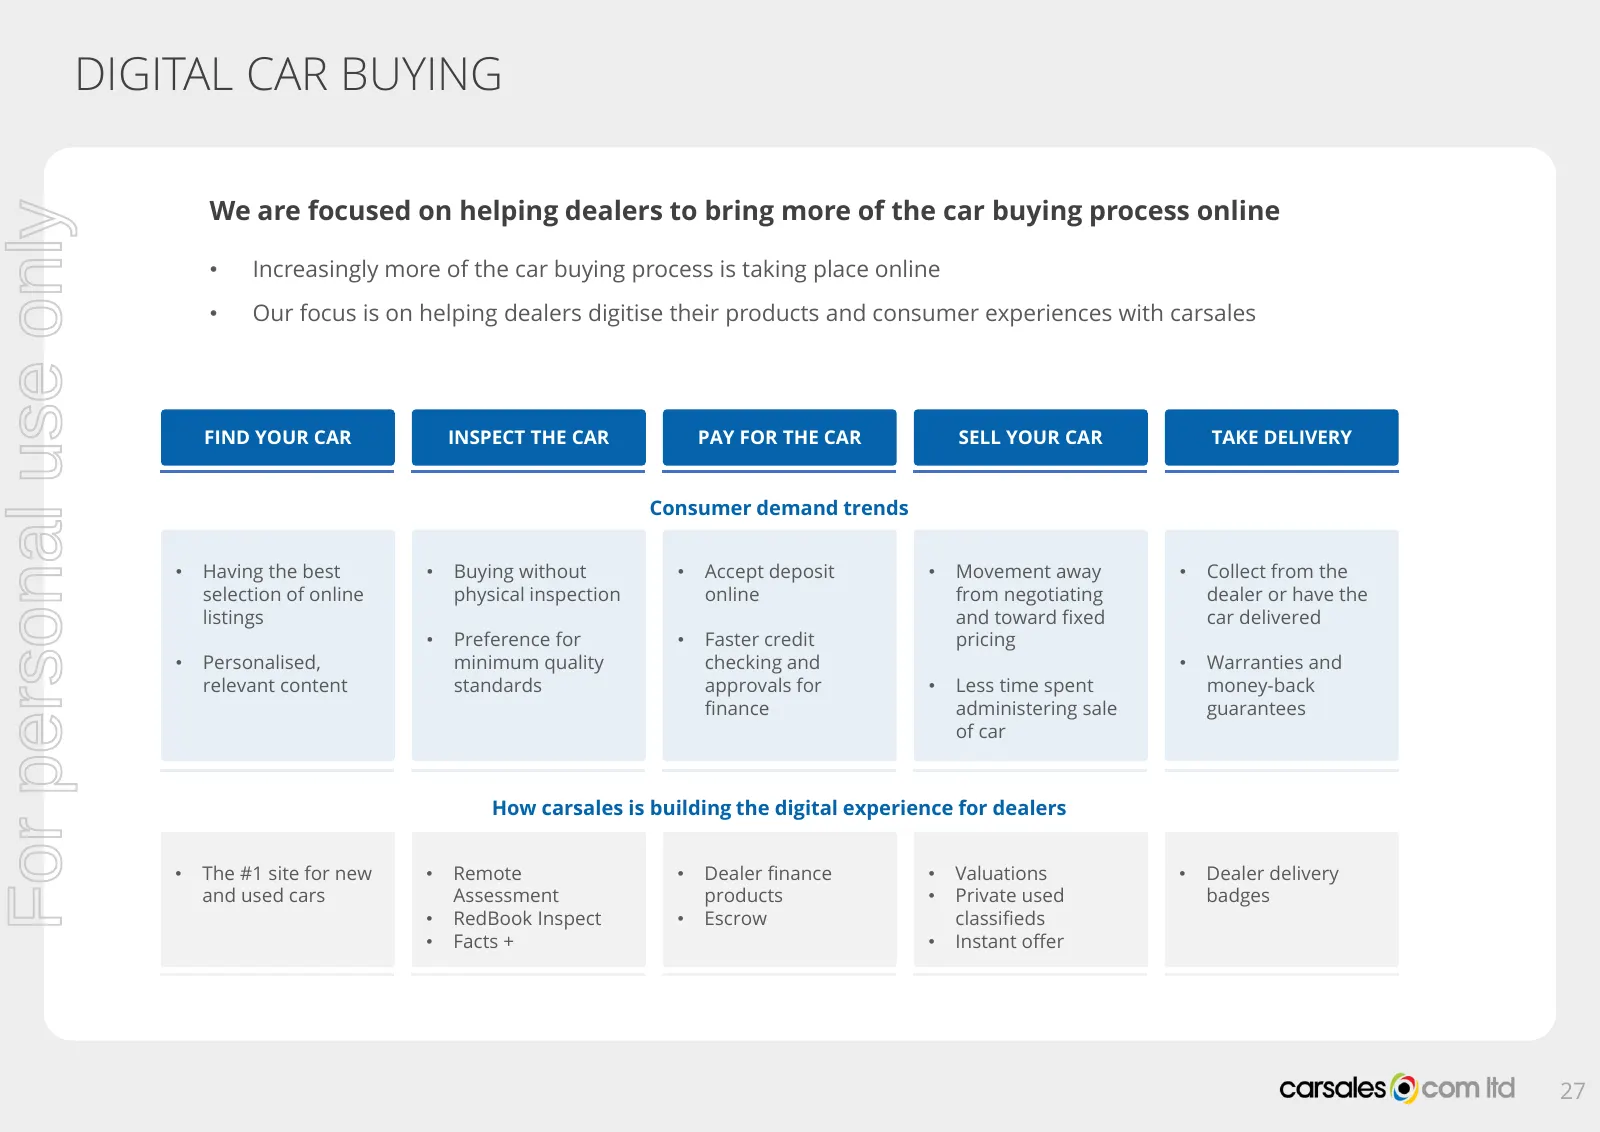
DIGITAL CAR BUYING We are focused on helping dealers to bring more of the car buying process online For personal use only • Increasingly more of the car buying process is taking place online • Our focus is on helping dealers digitise their products and consumer experiences with carsales FIND YOUR CA
Slide 28: Providing Car Buyers with Better Insights and Confidence
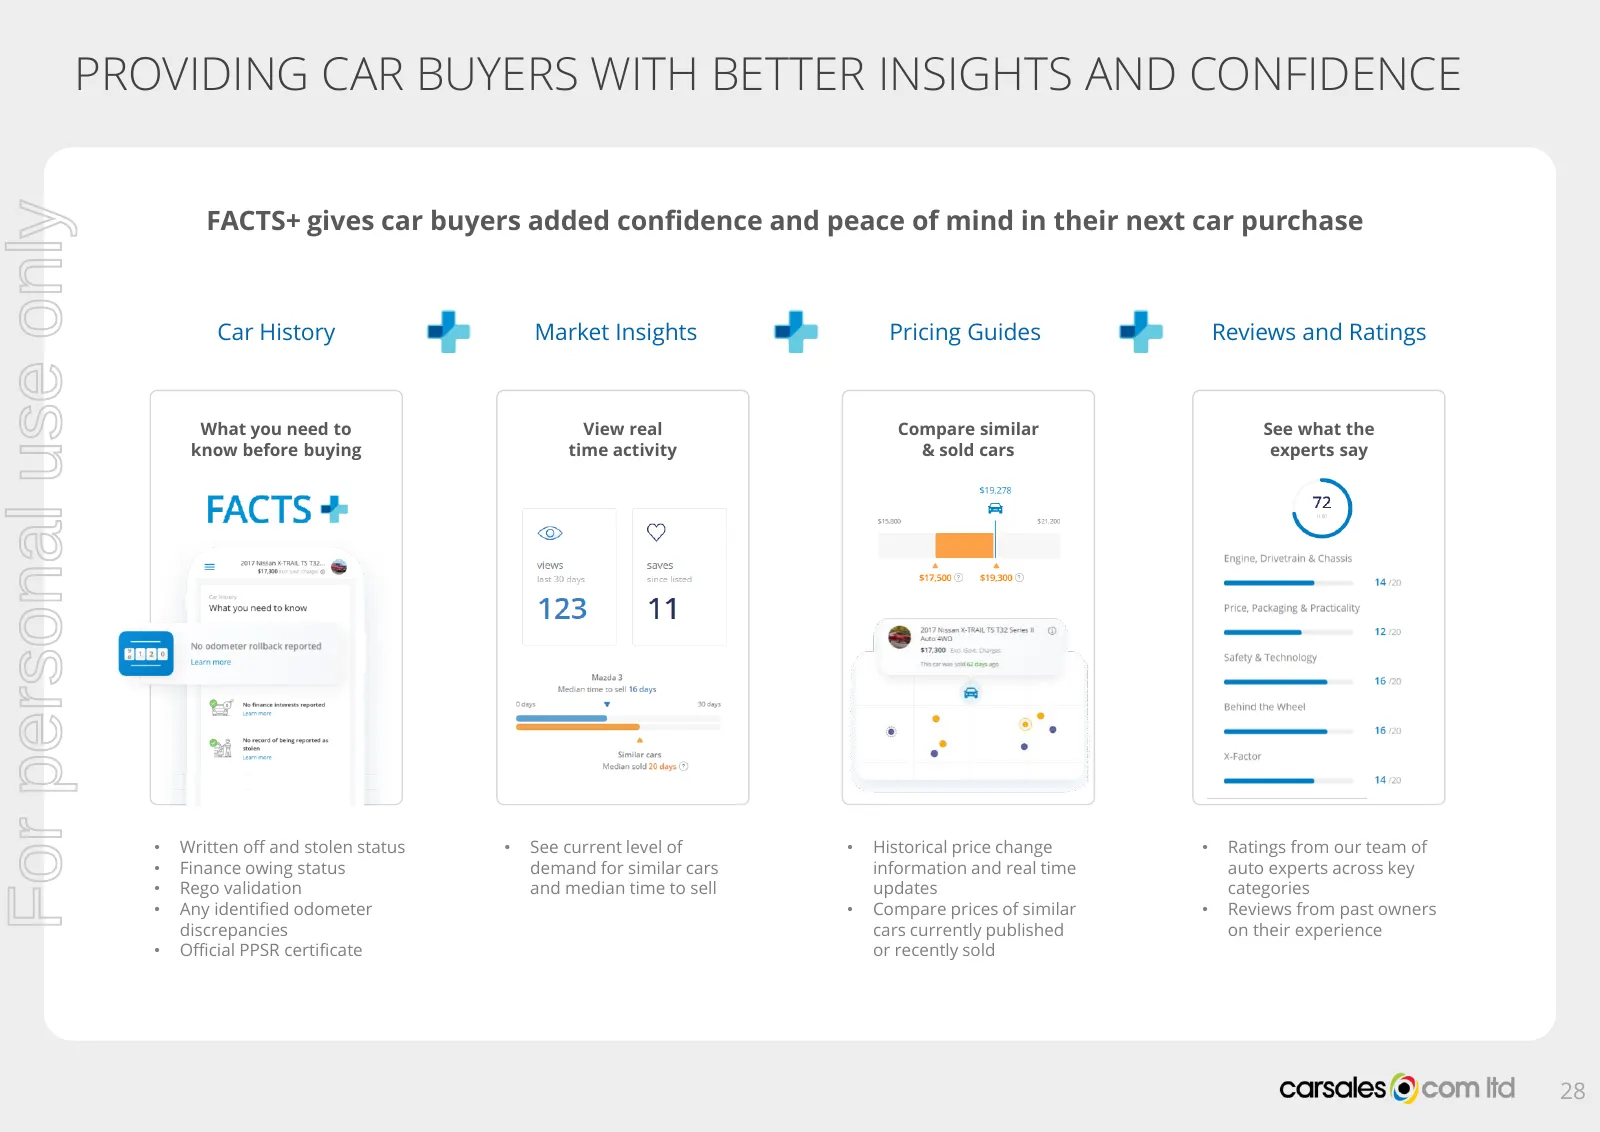
PROVIDING CAR BUYERS WITH BETTER INSIGHTS AND CONFIDENCE For personal use only FACTS+ gives car buyers added confidence and peace of mind in their next car purchase Car History Market Insights Pricing Guides Reviews and Ratings What you need to View real Compare similar See what the know before buyi
Slide 29: Placie Now in Beta
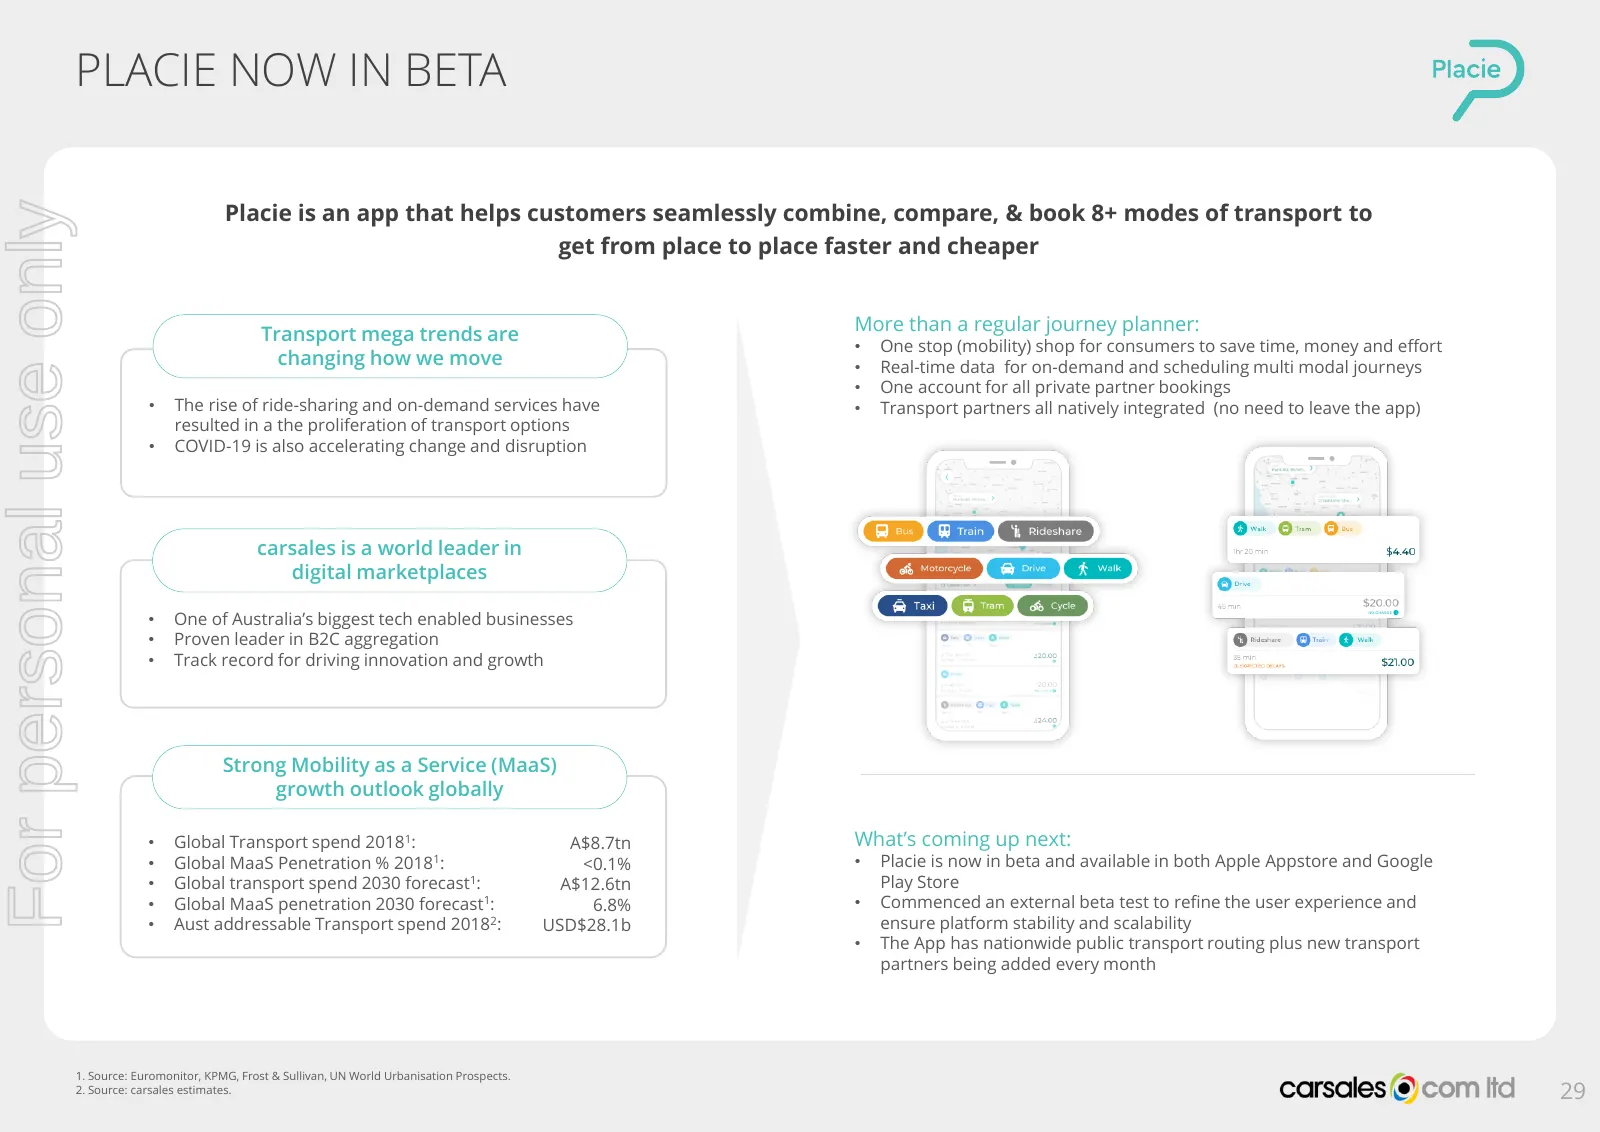
PLACIE NOW IN BETA Placie is an app that helps customers seamlessly combine, compare, & book 8+ modes of transport to For personal use only get from place to place faster and cheaper Transport mega trends are More than a regular journey planner: • One stop (mobility) shop for consumers to save time,
Slide 30: International FY21 Key Focus Areas
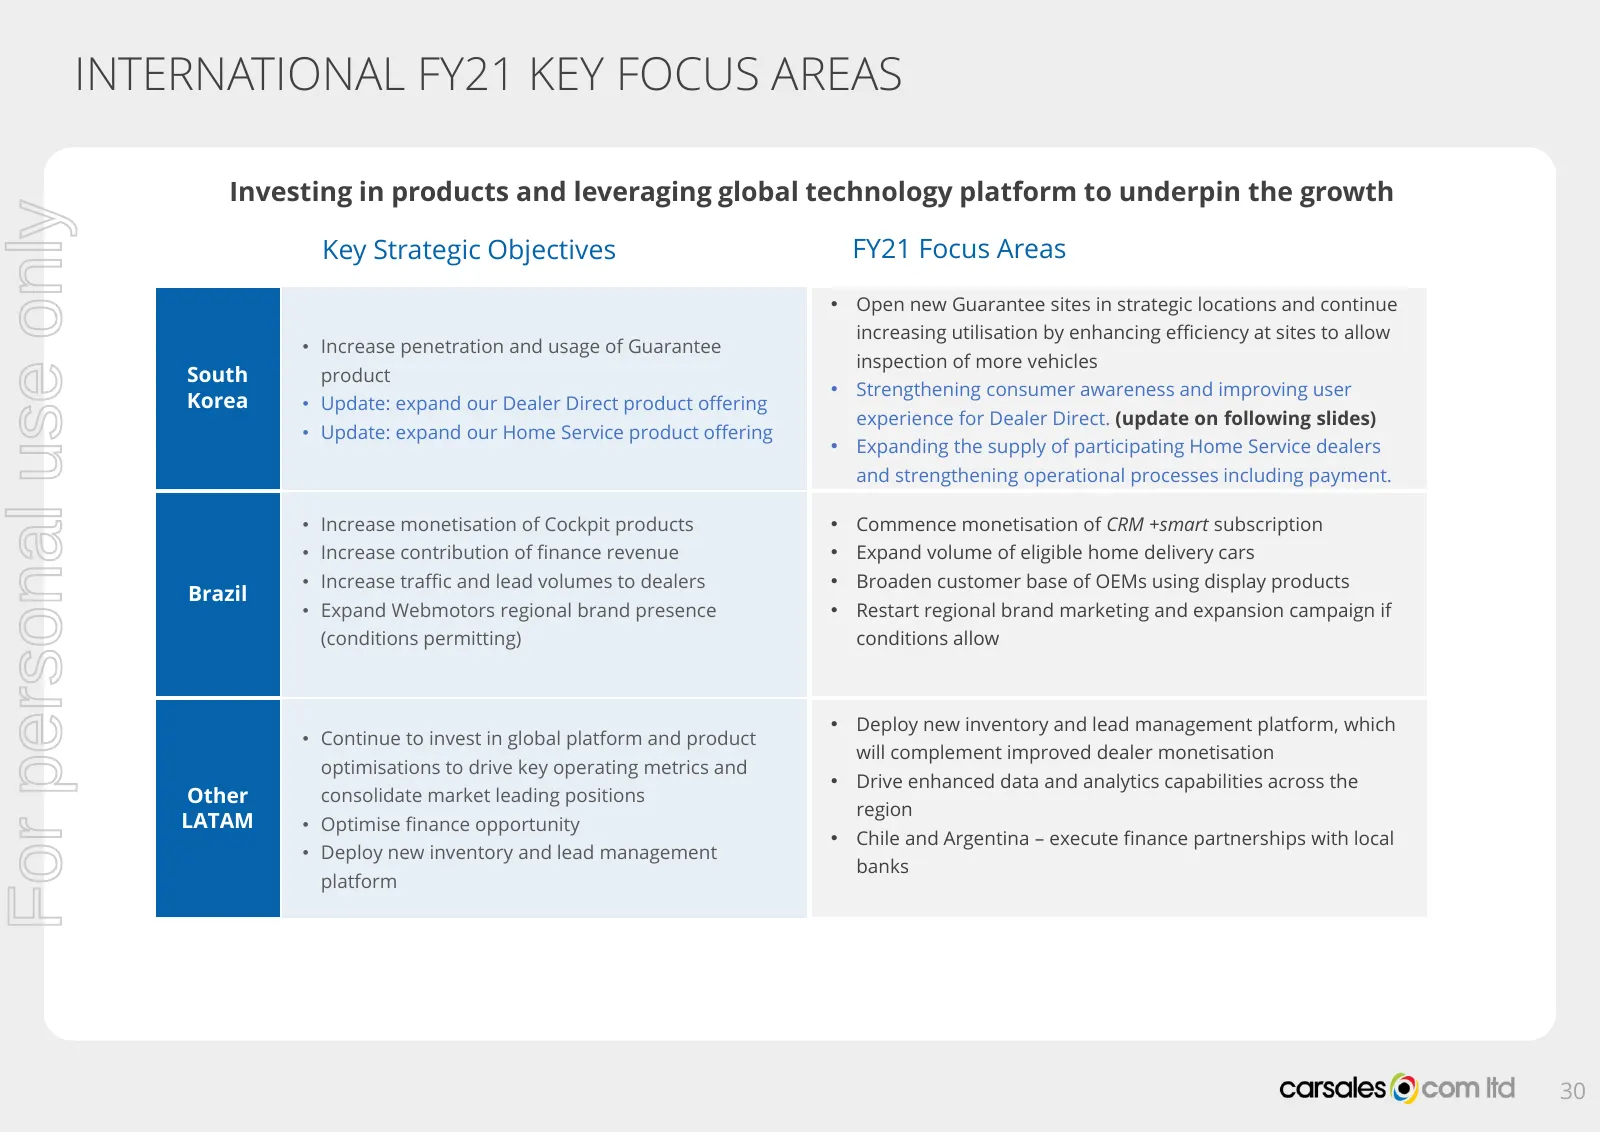
INTERNATIONAL FY21 KEY FOCUS AREAS Investing in products and leveraging global technology platform to underpin the growth For personal use only Key Strategic Objectives FY21 Focus Areas • Open new Guarantee sites in strategic locations and continue increasing utilisation by enhancing efficiency at s
Slide 31: South Korea Key Focus Areas
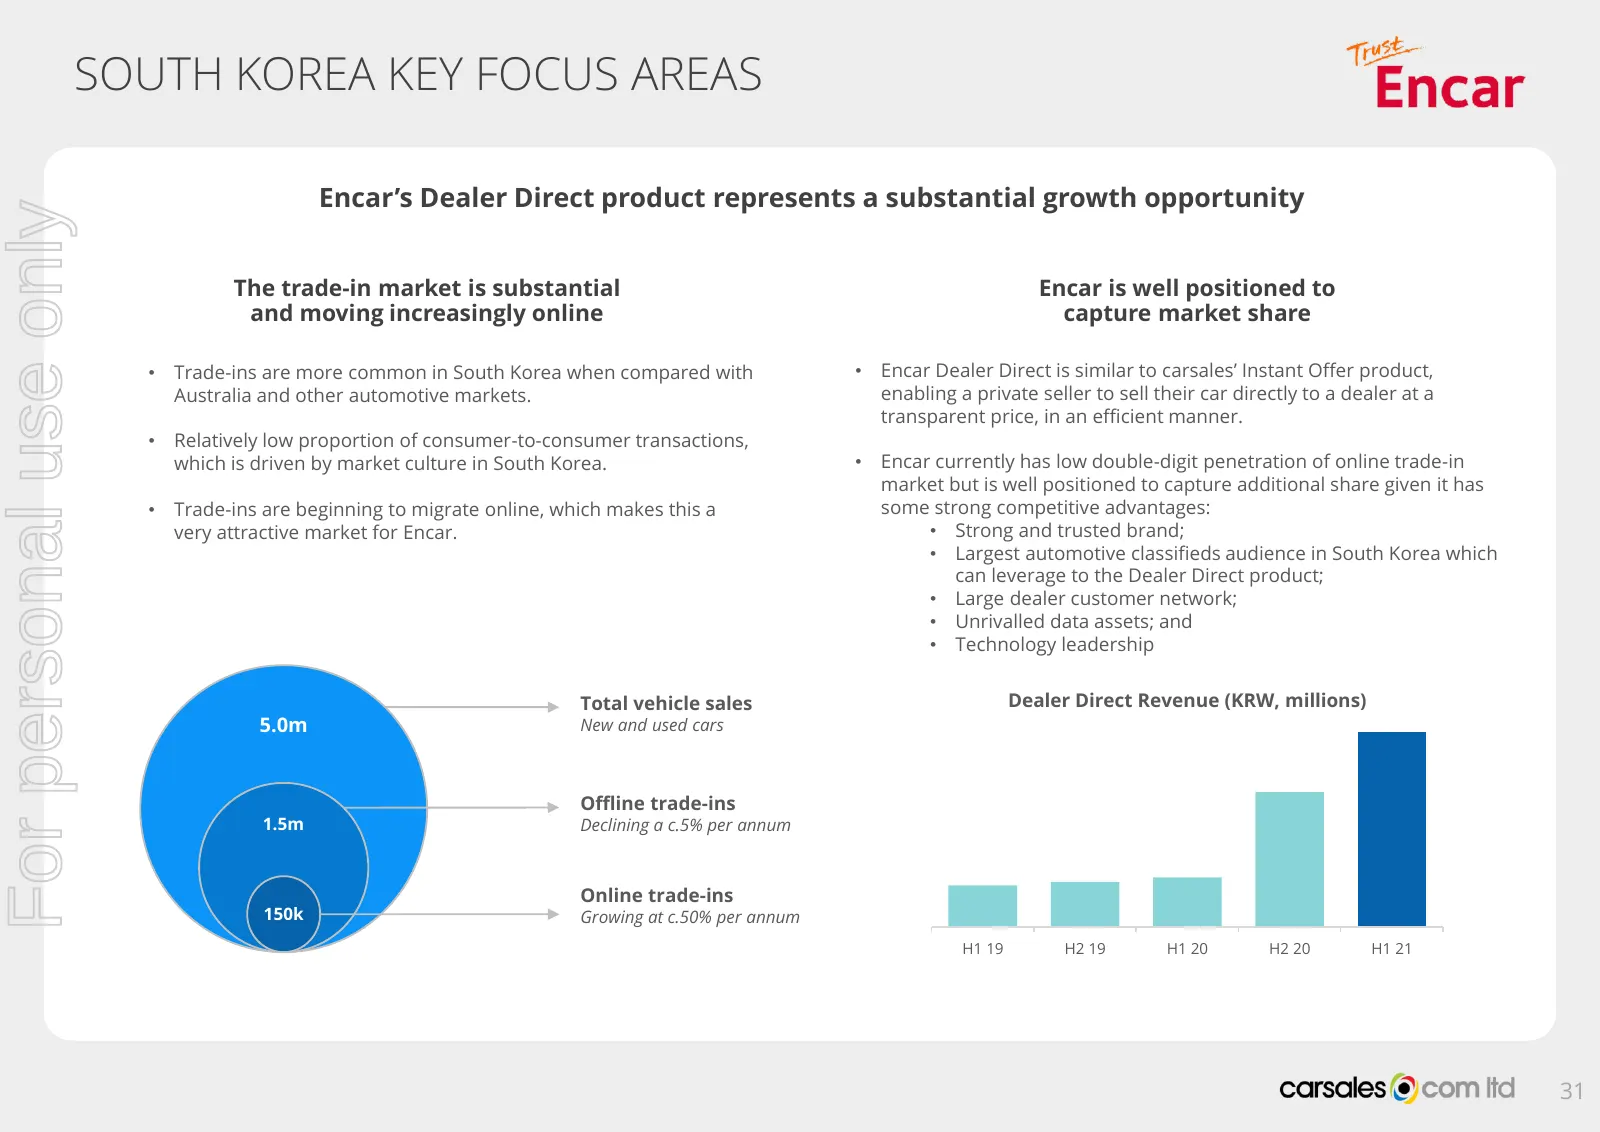
SOUTH KOREA KEY FOCUS AREAS Encar’s Dealer Direct product represents a substantial growth opportunity For personal use only The trade-in market is substantial Encar is well positioned to and moving increasingly online capture market share • Trade-ins are more common in South Korea when compared with
Slide 32: South Korea Key Focus Areas
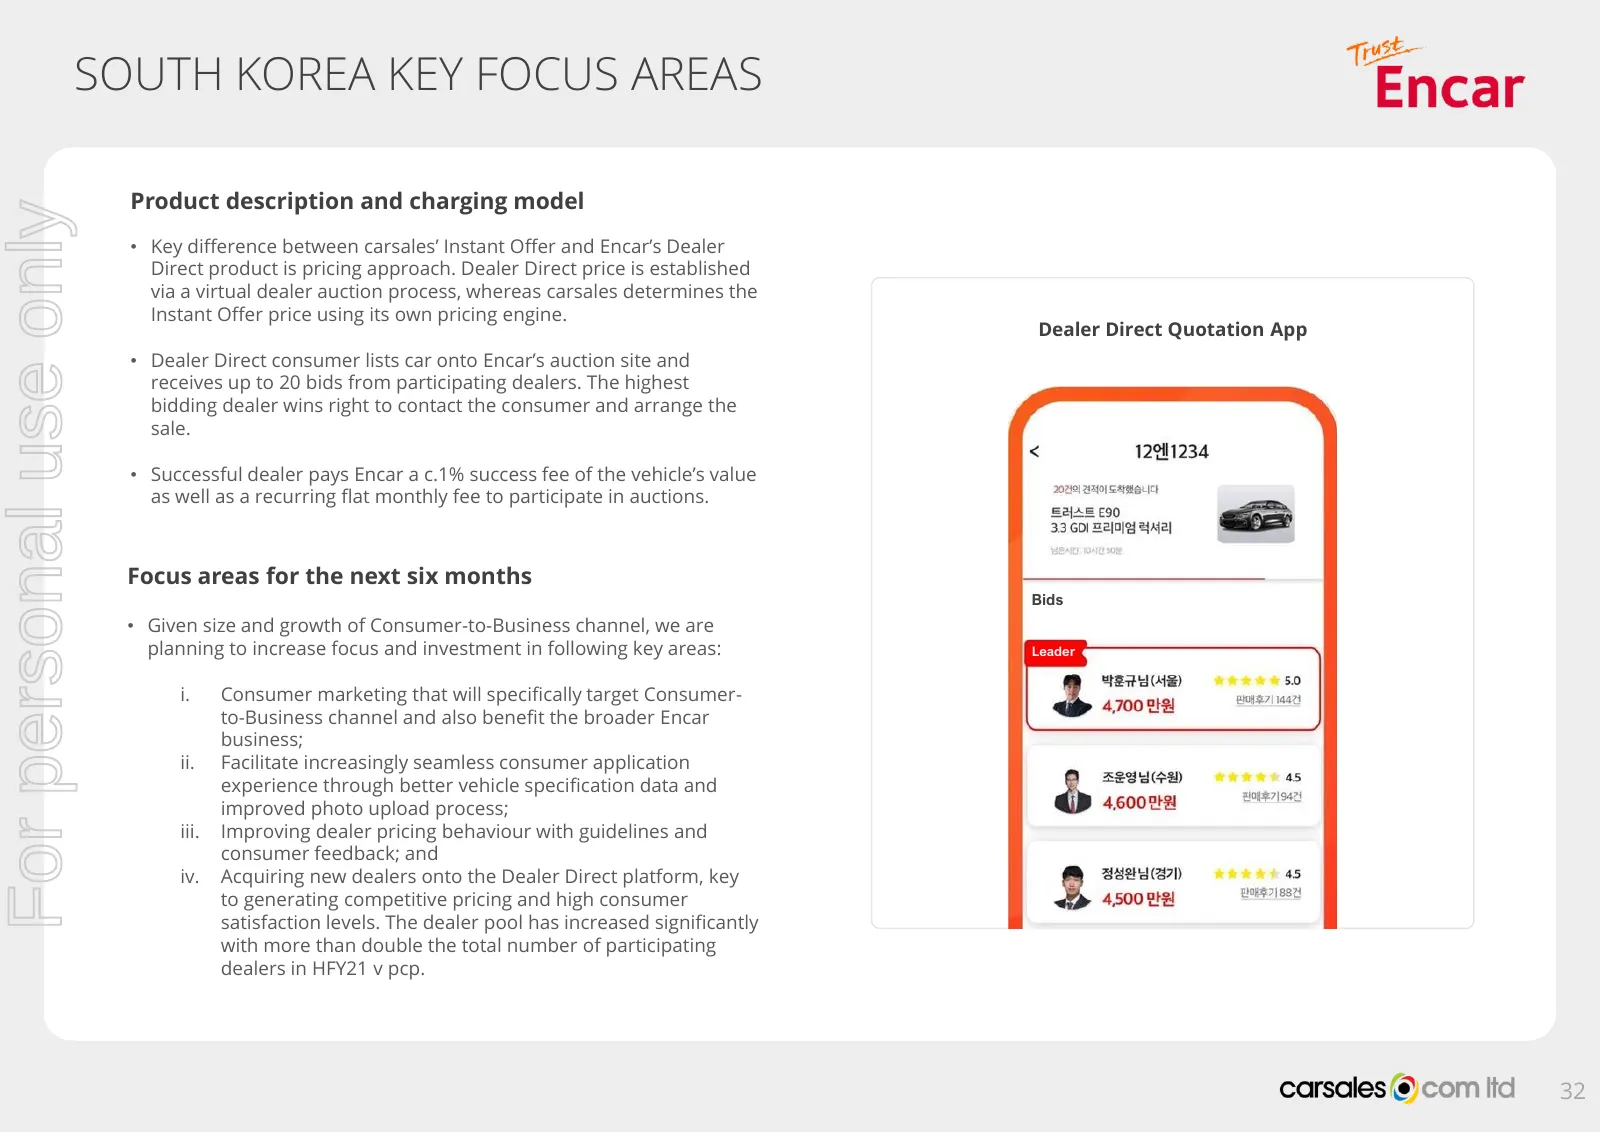
SOUTH KOREA KEY FOCUS AREAS Product description and charging model For personal use only • Key difference between carsales’ Instant Offer and Encar’s Dealer Direct product is pricing approach. Dealer Direct price is established via a virtual dealer auction process, whereas carsales determines the In

Slide 33: FY21 Outlook
For personal use only FY21 OUTLOOK
Slide 34: FY21 Outlook
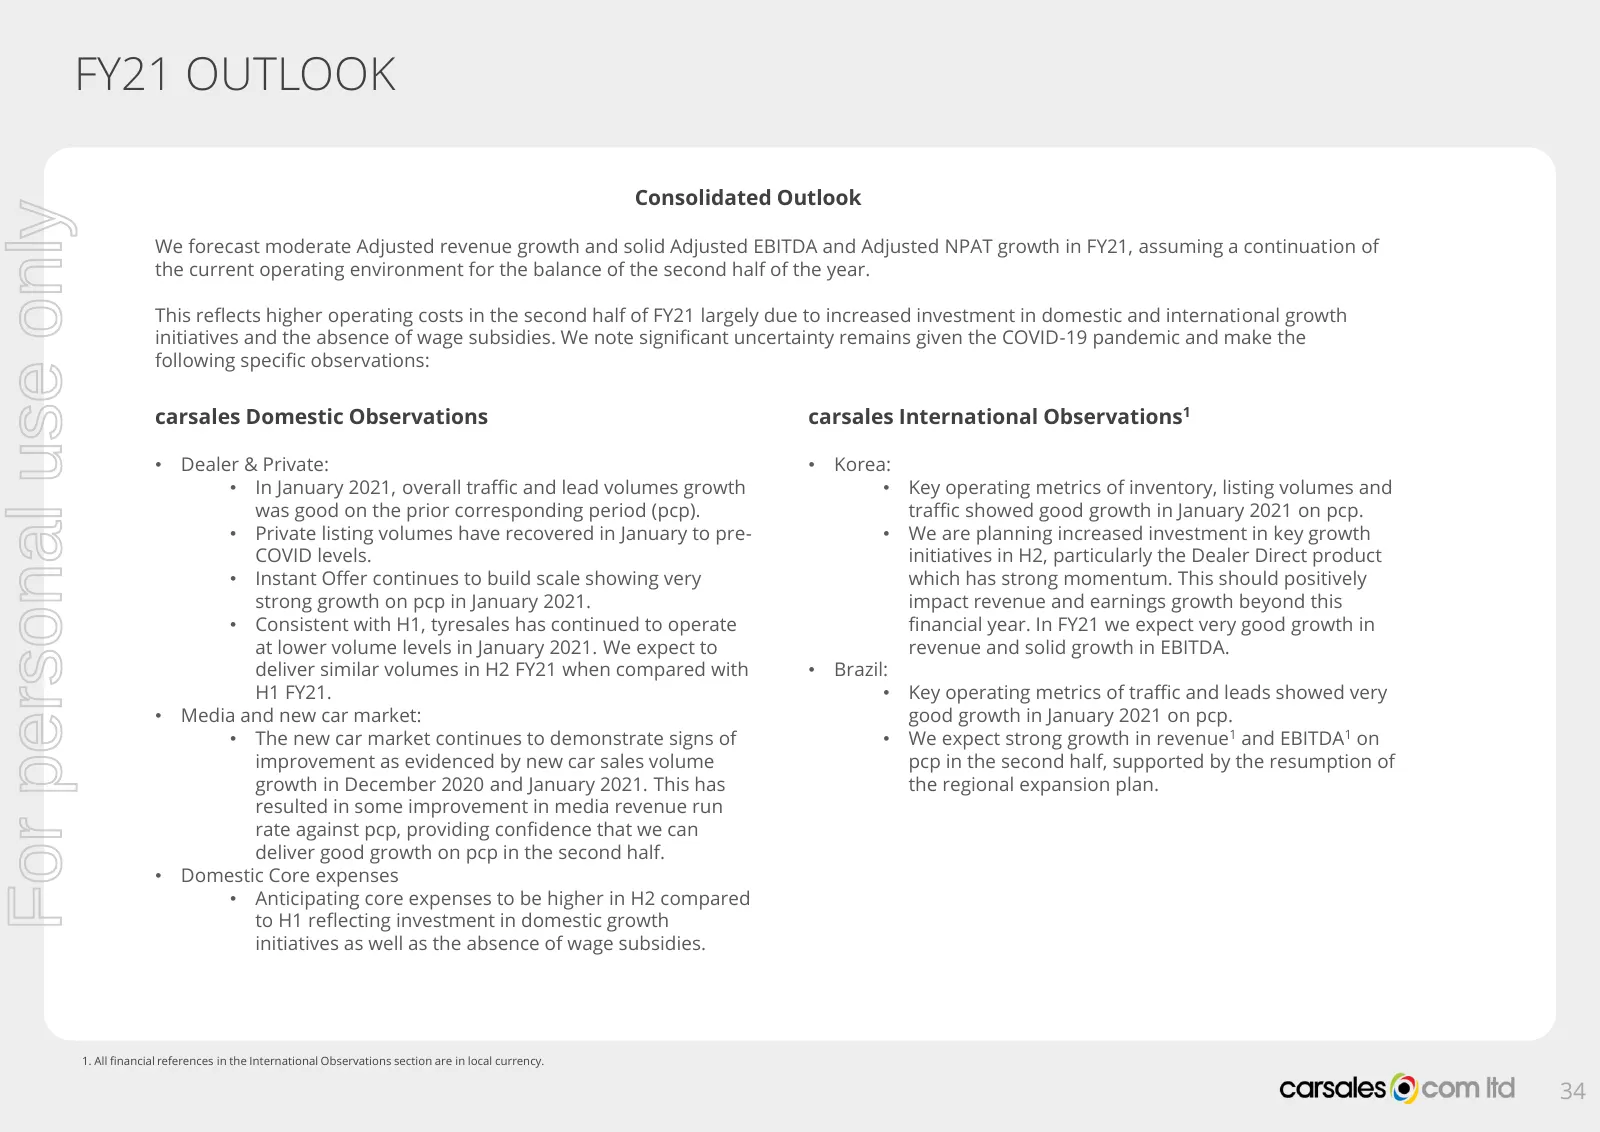
FY21 OUTLOOK Consolidated Outlook For personal use only We forecast moderate Adjusted revenue growth and solid Adjusted EBITDA and Adjusted NPAT growth in FY21, assuming a continuation of the current operating environment for the balance of the second half of the year. This reflects higher operating

Slide 35: Appendix
For personal use only APPENDIX
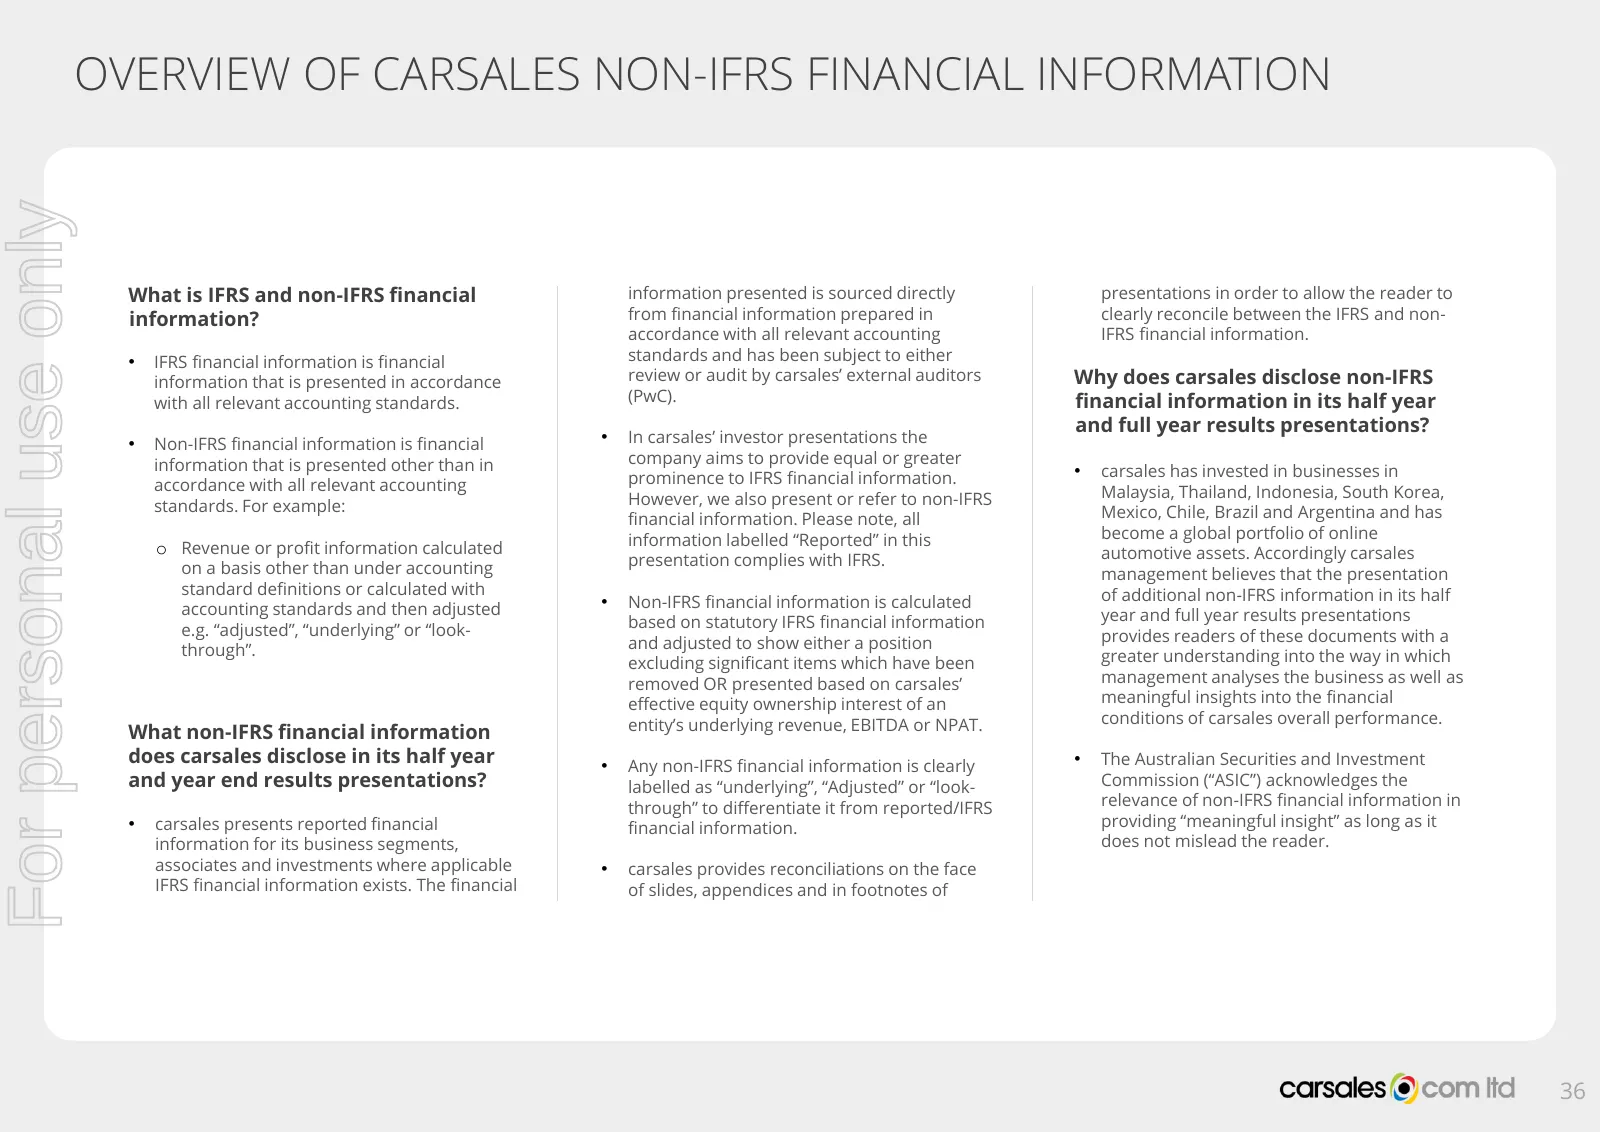
Slide 36: Overview of carsales Non-IFRS Financial Information
OVERVIEW OF CARSALES NON-IFRS FINANCIAL INFORMATION For personal use only What is IFRS and non-IFRS financial information presented is sourced directly presentations in order to allow the reader to information? from financial information prepared in clearly reconcile between the IFRS and non- accord
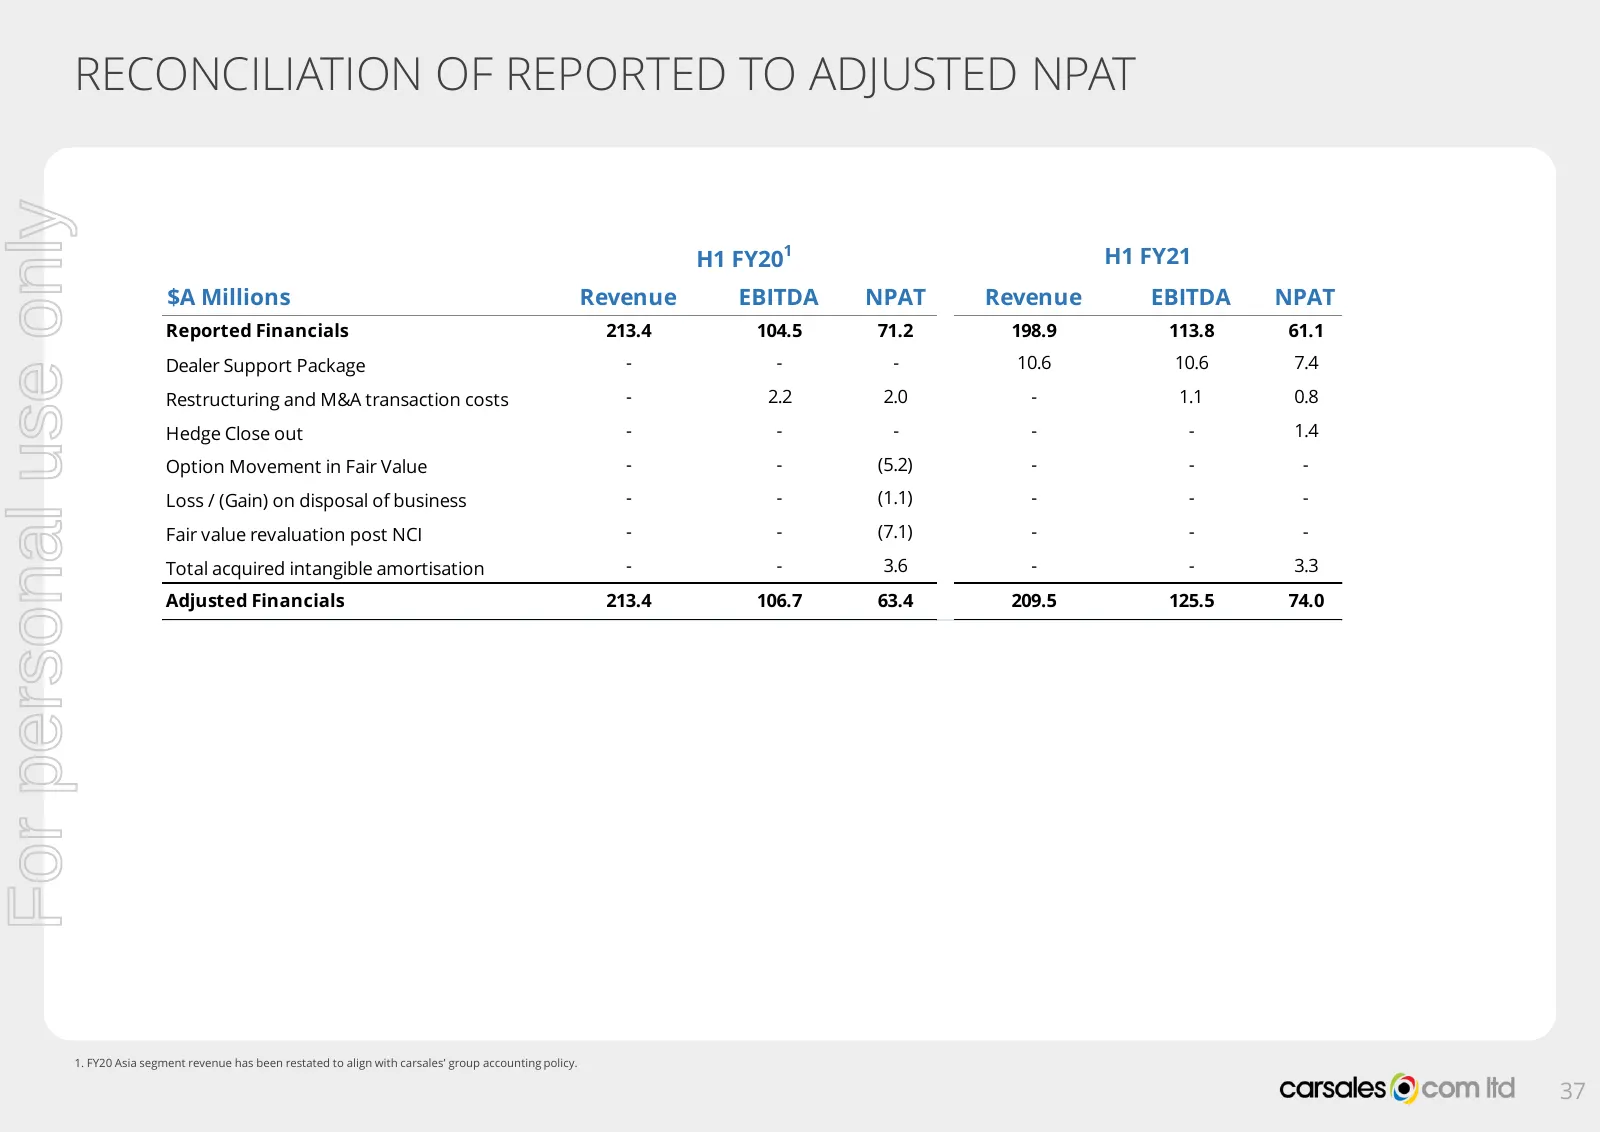
Slide 37: Reconciliation of Reported to Adjusted NPAT
RECONCILIATION OF REPORTED TO ADJUSTED NPAT For personal use only H1 FY201 H1 FY21 $A Millions Revenue EBITDA NPAT Revenue EBITDA NPAT Reported Financials 213.4 104.5 71.2 198.9 113.8 61.1 Dealer Support Package - - - 10.6 10.6 7.4 Restructuring and M&A transaction costs - 2.2 2.0 - 1.1 0.8 Hedge Cl
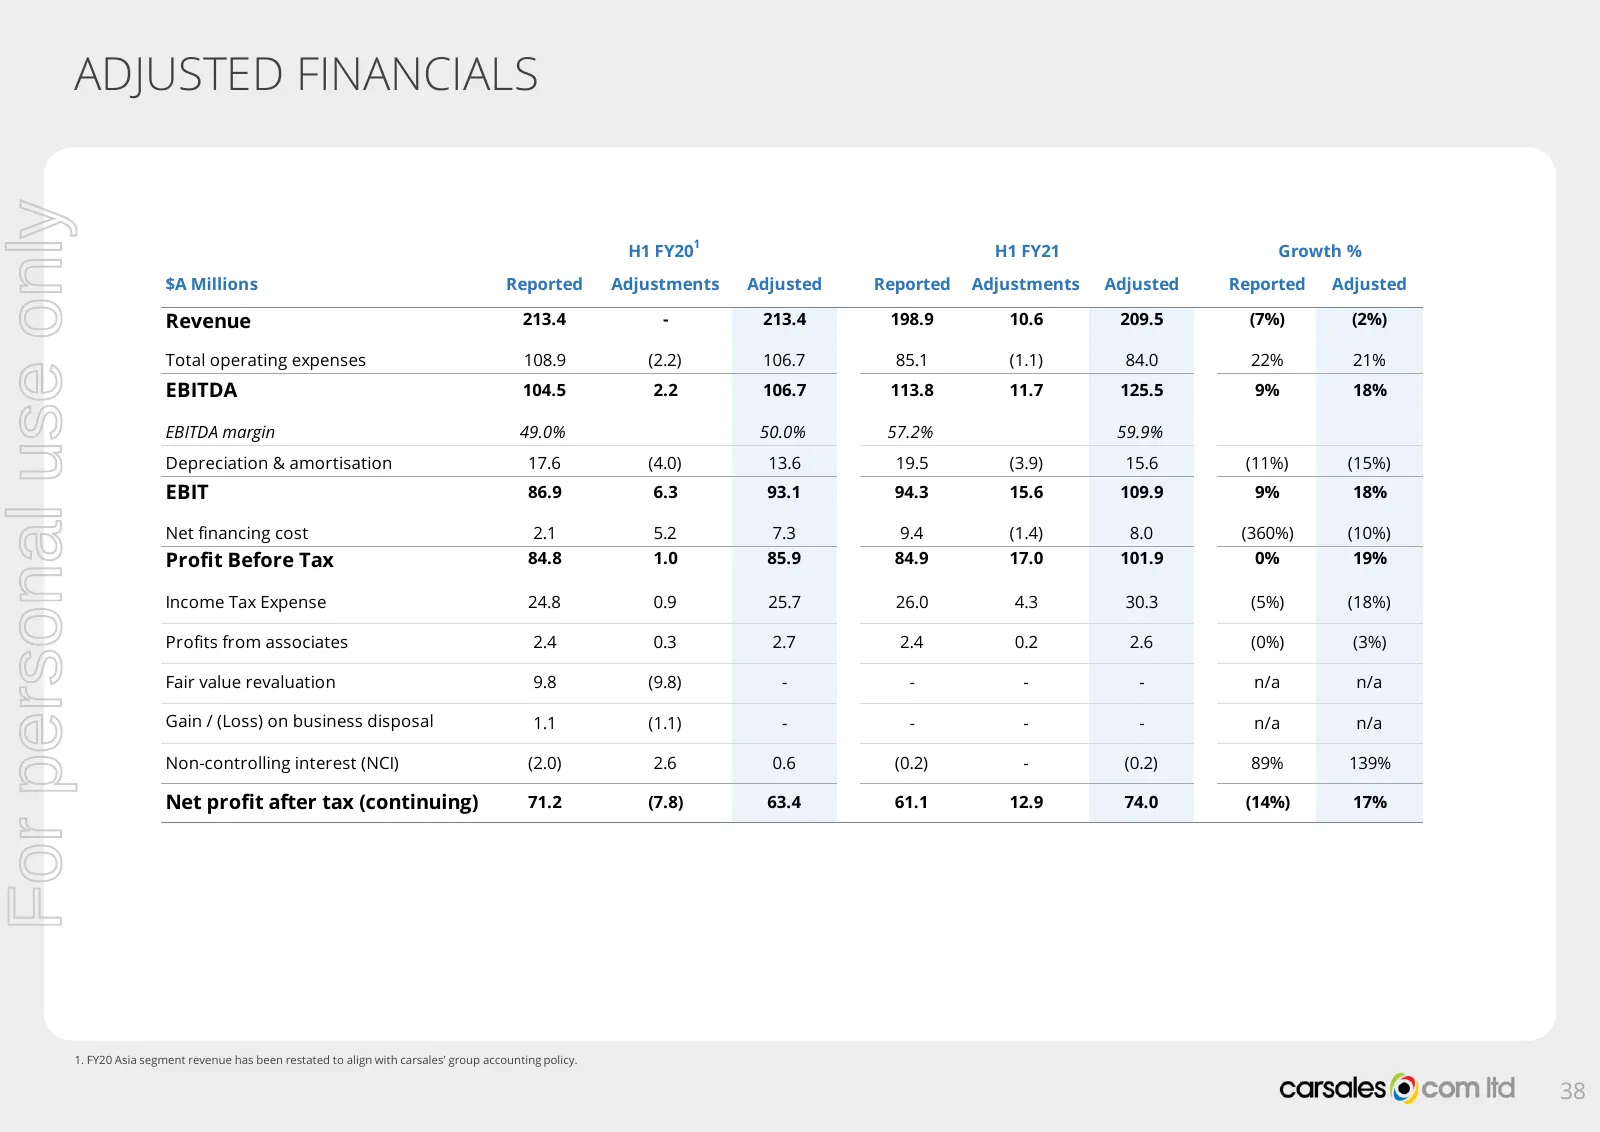
Slide 38: Adjusted Financials
ADJUSTED FINANCIALS For personal use only H1 FY201 H1 FY21 Growth % $A Millions Reported Adjustments Adjusted Reported Adjustments Adjusted Reported Adjusted Revenue 213.4 - 213.4 198.9 10.6 209.5 (7%) (2%) Total operating expenses 108.9 (2.2) 106.7 85.1 (1.1) 84.0 22% 21% EBITDA 104.5 2.2 106.7 113
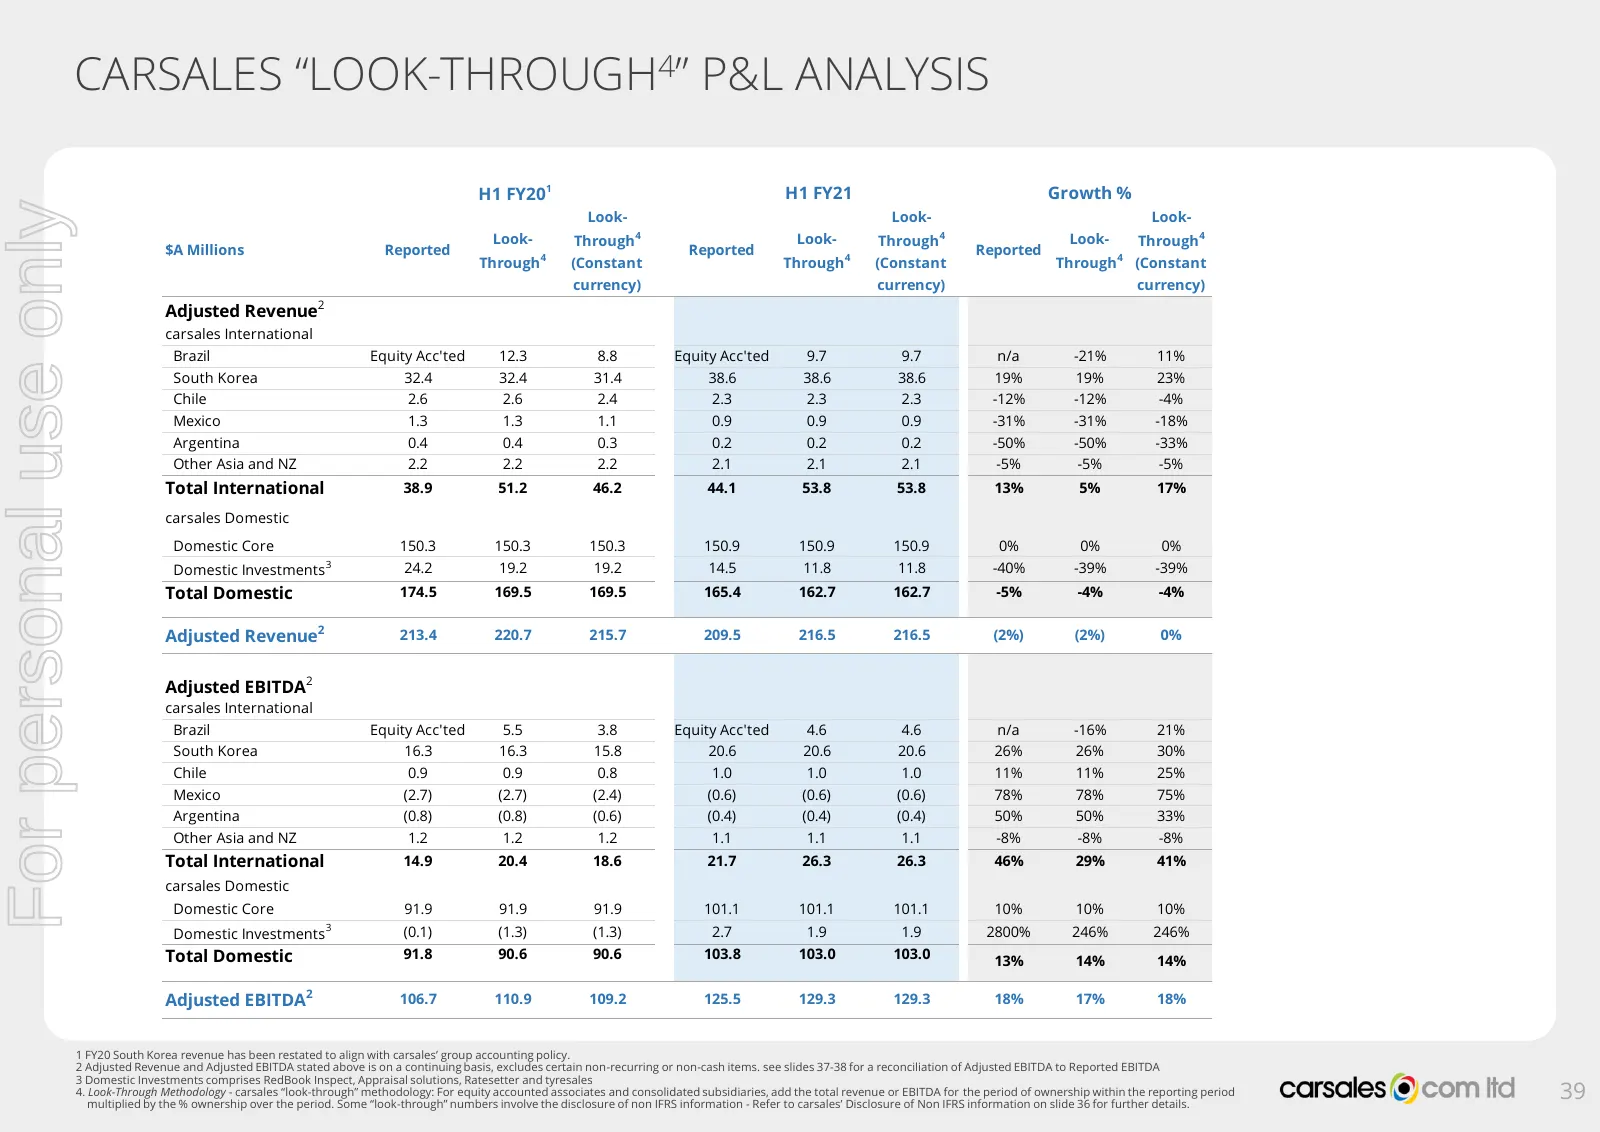
Slide 39: carsales Look-Through P&L Analysis
CARSALES “LOOK-THROUGH4” P&L ANALYSIS H1 FY201 H1 FY21 Growth % For personal use only Look- Look- Look- Look- Through 4 Look- Through 4 Look- Through 4 $A Millions Reported Reported Reported Through 4 (Constant Through 4 (Constant Through 4 (Constant currency) currency) currency) Adjusted Revenue2 c

Slide 40: For personal use only
For personal use only 40
Source: ASX announcement, Feb 17, 2021
More decks from CAR Group Limited
 Shareholder Meeting (October 2026)6 slides · Oct 30, 2026
 Shareholder Meeting (October 2026)23 slides · Oct 30, 2026
 FY2026 Earnings Presentation46 slides · Aug 10, 2026
 H1 FY26 Earnings Presentation44 slides · Feb 9, 2026
 Shareholder Meeting (October 2025)25 slides · Oct 31, 2025
 Q3 2025 Earnings Presentation11 slides · Sep 15, 2025