Rowan Companies — Pritchard Capital Partners presentation, January 2007
21 slides from Rowan Companies's conference presentation, Jan 9, 2007
Slide 1: Rowan Companies, Inc.
Pritchard Capital Partners Rowan Companies, Inc. D.F. McNease Chairman & CEO January 2007

Slide 2: Forward Looking Statements
This report contains forward looking statements within the meaning of the Private Securities Litigation Reform Act of 1995, including, without limitation, statements as to the expectations, beliefs and future expected financial performance of the Company that are based on current expectations and ar

Slide 3: Rowan Companies, Inc. Revenues
Drilling 73% Manufacturing Drilling 70% Manufacturing 2005 2006 Estimate Rowan Companies, Inc. Revenues 27% 30%

Slide 4: Operations and Backlog
( $ in millions) External revenues $313.0 $191.1 Margin* (% of revenues) $72.1 (23%) $42.9 (22%) Operating income** (% of revenues) $28.7 (9%) 0.9 (1%) External backlog $578.1 $321.7 Internal volume to Rowan $164.1 $80.5 * Equals external revenues less direct cost of sales ** Equals margin less SG&A
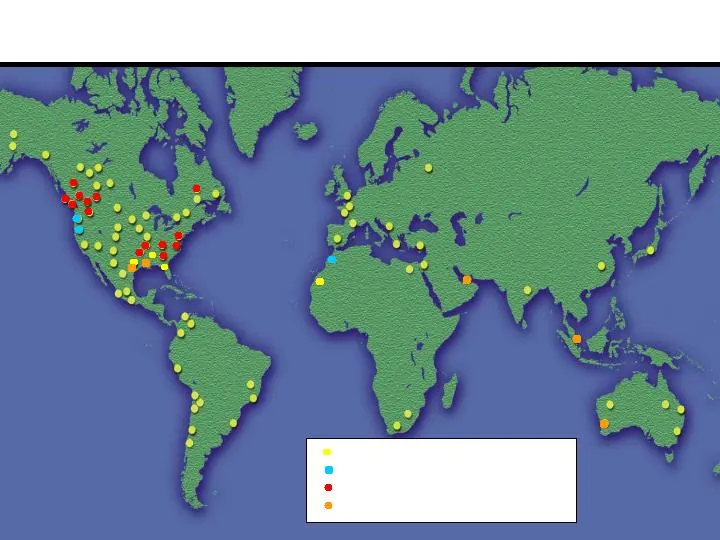
Slide 5: LeTourneau Technologies, Inc. – Worldwide Operations
Forestry & Mining Forestry Distribution Mining Distribution Drilling Products Distribution LeTourneau Technologies, Inc. – Worldwide Operations
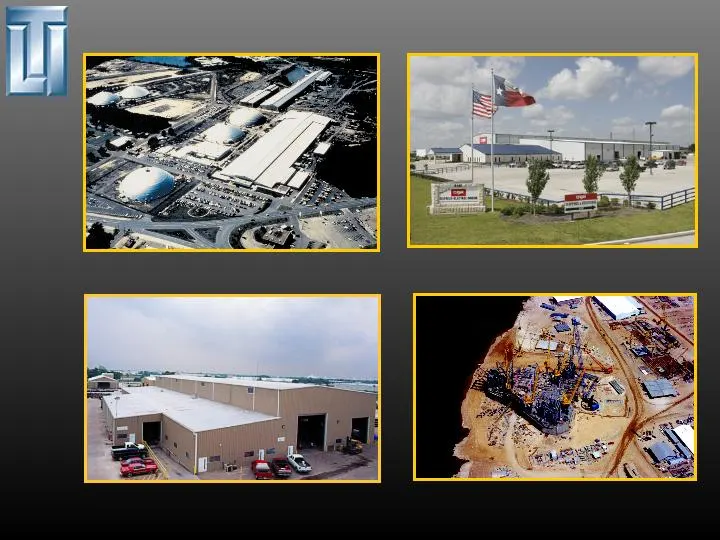
Slide 6: LeTourneau Technologies, Inc. Facilities
LeTourneau, Inc. - Longview OEM - Houston LeTourneau, Inc. - Vicksburg LEWCO - Houston LeTourneau Technologies, Inc. Facilities
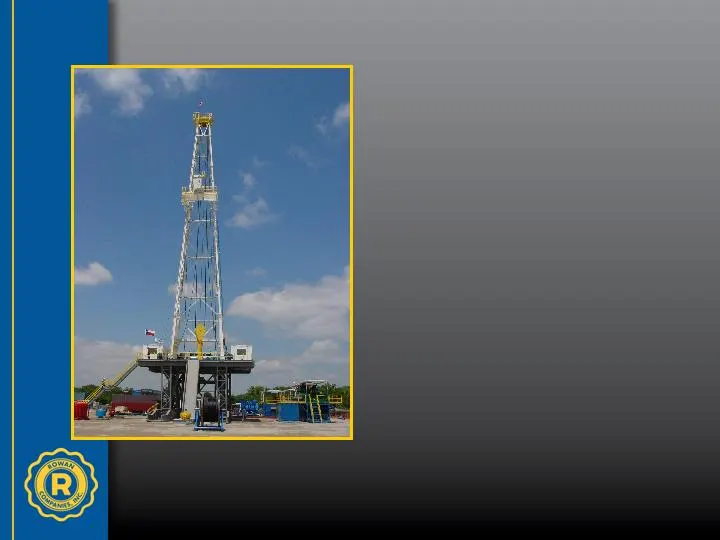
Slide 7: Rowan's Land Fleet
Rig 54 25 Land rigs currently operating in Texas, Louisiana & Oklahoma 22 out of the 24 rigs are on term contracts Current average day rate: $ 23,125 newbuilds are under construction of the 4 rigs are contracted for terms of two to three years with day rates at approximately $27,500 Rowan’s Land Fle
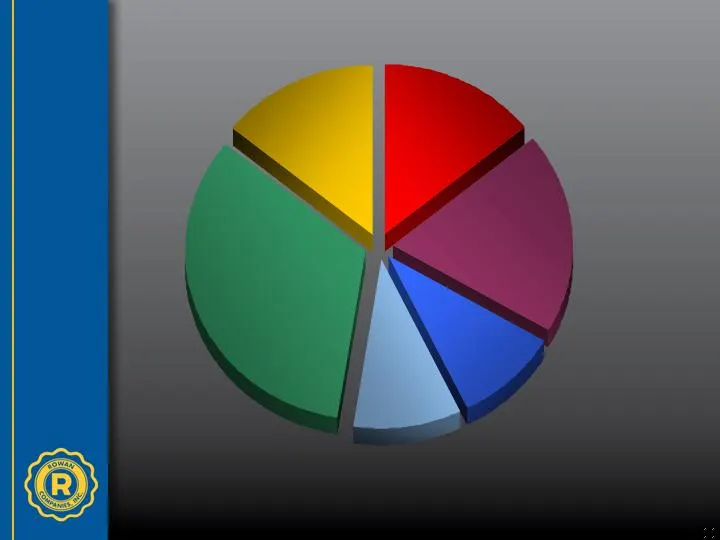
Slide 8: Rowan's Offshore Fleet – 21 Total Jack-ups
250’- 300’ Slot 2 Rigs 10% Super Gorilla Class 4 Rigs 19% The Hank Boswell, Rowan’s 3 rd TARZAN Class jack-up, was christened into service on September 23, 2006. Three additional rigs are under construction / on order. Rowan’s Offshore Fleet – 21 Total Jack-ups Gorilla Class Rigs 14% 300-350' 116-C
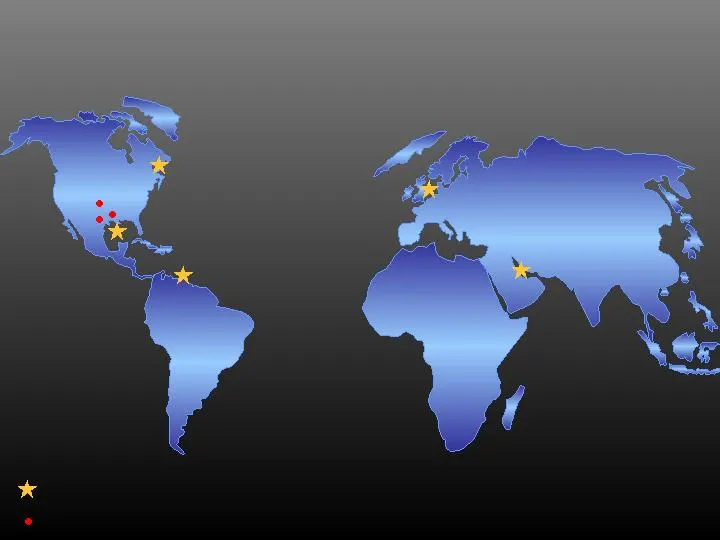
Slide 9: Rowan's Worldwide Drilling Operations
U.S. Gulf of Mexico 9 Jack-ups Trinidad 1 Jack-up Eastern Canada Operations Office North Sea 3 Jack-ups Middle East 8 Jack-ups 25 Land Rigs Rowan’s Worldwide Drilling Operations Jack-up Rigs Land Rigs
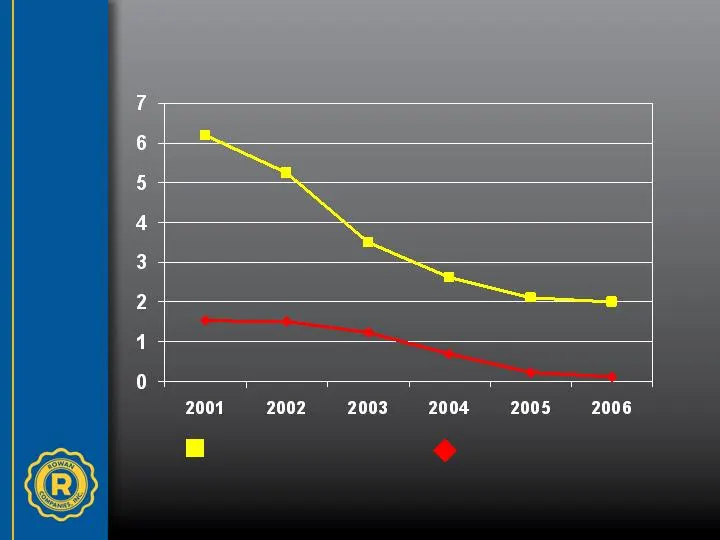
Slide 10: Rowan's Safety Statistics: Offshore and Land Drilling
TRIR Rate LTI Rate Rowan accident rate based on 200,000 man-hours Rowan’s Safety Statistics: Offshore and Land Drilling
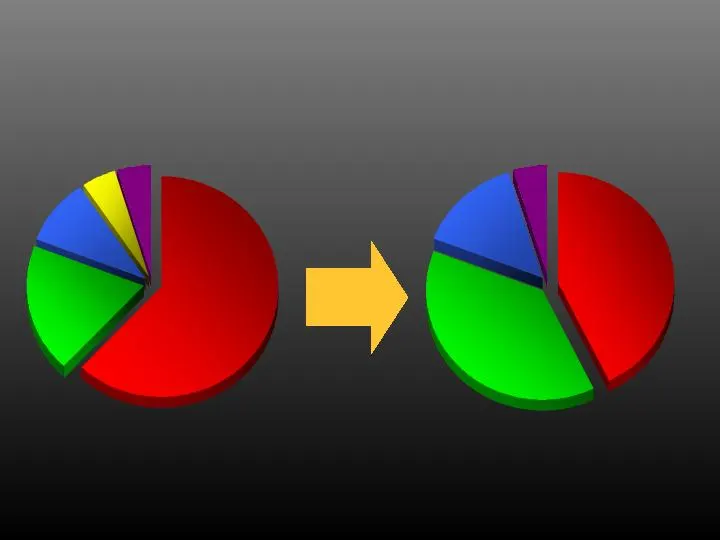
Slide 11: Rowan's Worldwide Offshore Fleet (Number of rigs per area)
Eastern Canada 1 Rig 5% North Sea 2 Rigs 9% Current average day rate worldwide: $154,000 North Sea 3 Rigs 14% Trinidad 1 Rig 5% 4th Quarter 2006 1 st Quarter 2007 Trinidad 1 Rig 5% Rowan’s Worldwide Offshore Fleet Middle East Rigs 19% U.S. Gulf of Mexico Rigs 43% Middle East Rigs 38% U.S. Gulf of Me
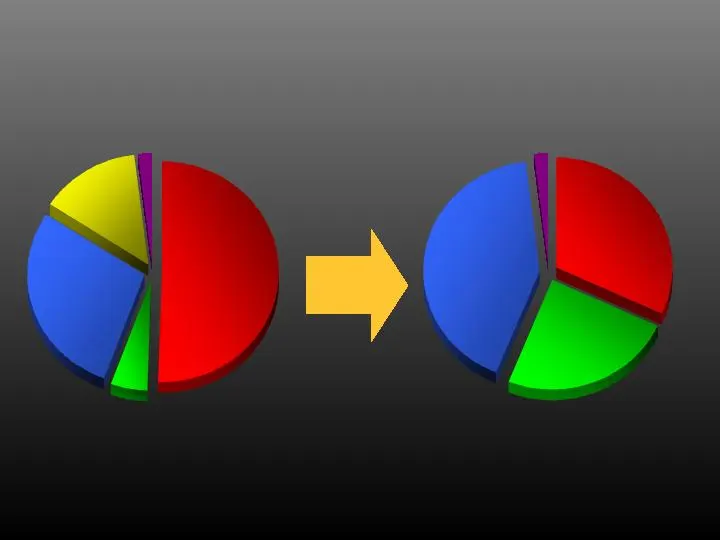
Slide 12: Rowan's Worldwide Offshore Fleet (Net Book Value per area)
Middle East 5% North Sea 29% North Sea 42% Trinidad 2% 1 st Quarter 2007 Trinidad 2% 4th Quarter 2006 Eastern Canada 13% U.S. Gulf of Mexico 32% Middle East 24% U.S. Gulf of Mexico 51% Rowan’s Worldwide Offshore Fleet (Net Book Value per area)

Slide 13: Rowan Companies, Inc. - ROI Analysis
4 year income – after taxes (35%) $203million 4 year cash flow – after taxes $241 million Rowan Companies, Inc. - ROI Analysis Estimated ROI – after taxes 20% Saudi Aramco Contract: 2 TARZAN Rigs - 4 year period
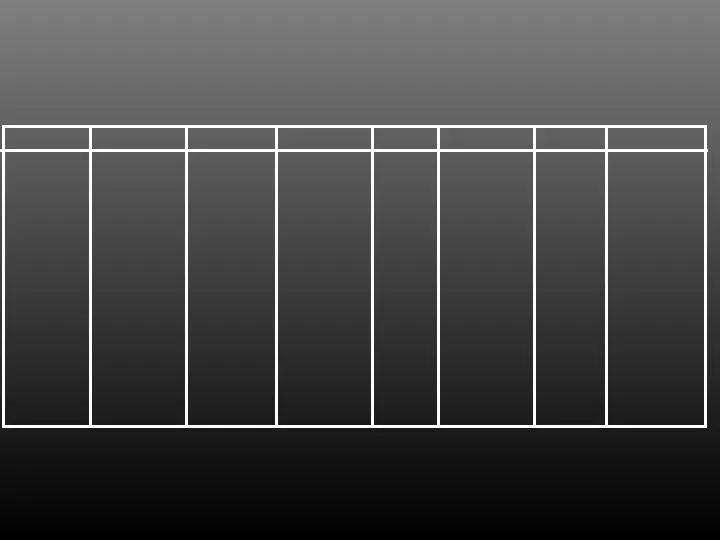
Slide 14: Worldwide Jack-ups: Contracted Time and Average Dayrates
Contractor Total Jack-ups % Time Cont. Avg. Dayrate % Time Avg. Dayrate % Time Avg. Dayrate A 43 76% $150,537 55% $165,929 22% $168,719 B 41 66% $138,578 38% $131,050 25% $133,398 C 24 88% $112,515 49% $134,314 29% $140,786 D 41 82% $115,111 35% $124,795 15% $131,535 E 27 52% $93,677 19% $97,340 11%
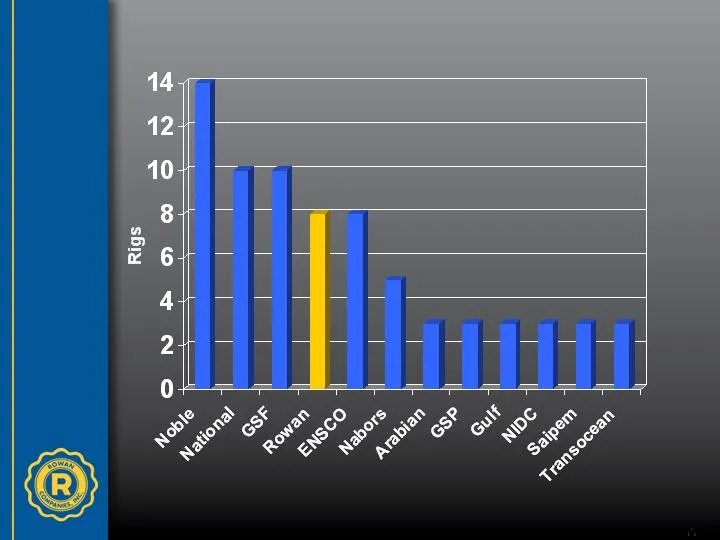
Slide 15: Middle East Jack-up Market Share – Main Contractors
Includes data supplied by ODS-Petrodata, Inc; Copyright 2006 Middle East Jack-up Market Share – Main Contractors

Slide 16: Year End Jack-up Demand Comparison
Source: RigZone Date % Time Contracted Average Dayrate for next year for next year Dec. 2005 (for ’06) 51% $ 78,796 Dec. 2004 (for ’05) 41% $ 52,844 Year End Jack-up Demand Comparison Dec. 2006 (for ’07) 69% $125,358

Slide 17: Rowan's CAPEX vs. Cash Flow
Capital Expenditures: Drilling ($530) Manufacturing ($55) *Cash Flow is Rowan's actual increase in cash, excluding additions to PP&E Rowan’s CAPEX vs. Cash Flow For the 21 months ended 9/30/2006 (In millions) Cash Flow $583 Total CAPEX ($585) CAPEX exceeds Cash Flow by ($2)
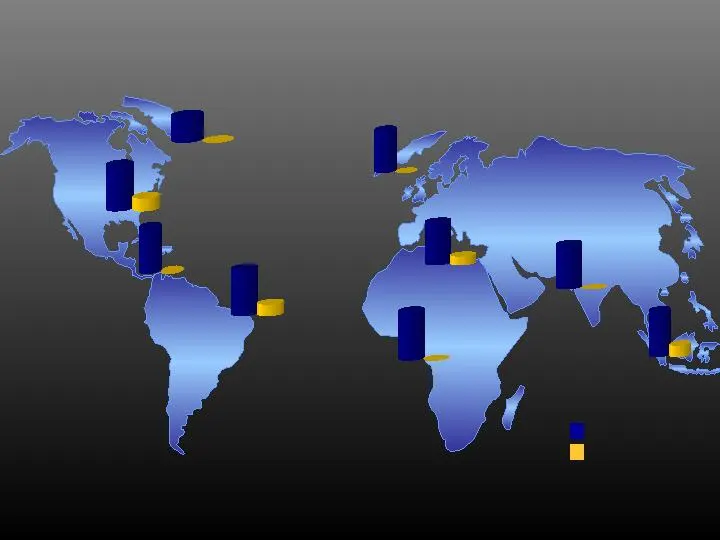
Slide 18: Current Worldwide Jack-up Supply / Demand
E. Canada: 100% C & S America: 83% US GOM: 82% Mexico: 96% West Africa: 100% North Sea: 1 0 Middle East: 97% SE Asia: 97% Contracted Not Contracted 75 2 0 27 3 33 25 0 84 3 32 1 16 15 1 Worldwide Utilization: 93% Includes data supplied by ODS-Petrodata, Inc; Copyright 2006 Indian Ocean: 100% 31 0 00

Slide 19: Worldwide: Jack-up Supply Deficits
Southeast Asia 4 - 6 rigs India 3 - 4 rigs West Africa 3 - 4 rigs Mexico 3 - 4 rigs Middle East 5 - 6 rigs North Sea 2 - 3 rigs Trinidad 1 rig Mediterranean 2 rigs Worldwide: Jack-up Supply Deficits Total Rig Deficit23 - 30 Jack-ups
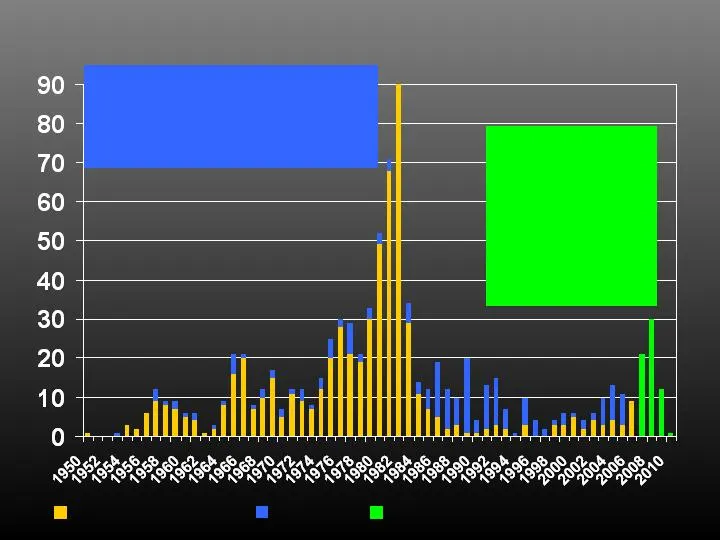
Slide 20: Worldwide Jack-up Newbuilds and Attrition 1950-2010
Additions to the Fleet Attrition Average Age of Retired Rigs: 20 yrs. 87% of the fleet is 20 years & older Average Number of Retired Rigs per year: 6 Rigs Scheduled Construction / On Order Includes data supplied by ODS-Petrodata, Inc; Copyright 2006 Worldwide Jack-up Newbuilds and Attrition 1950-201
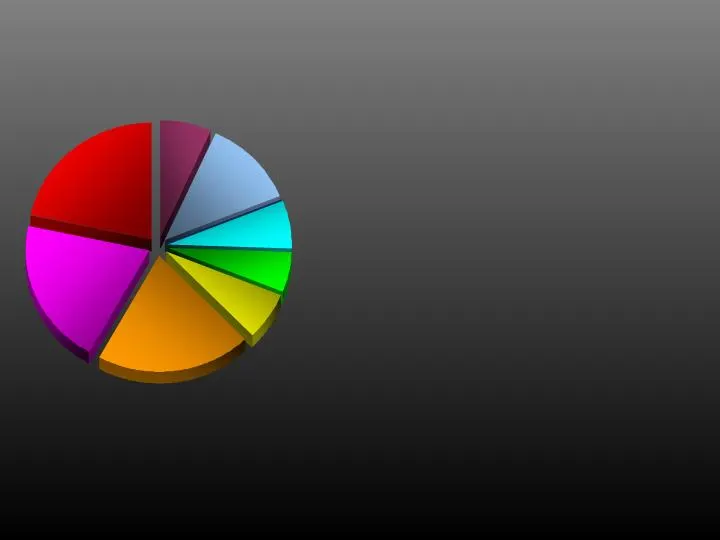
Slide 21: Gulf of Mexico Jack-ups Projected Rig Make-up December 2007
• Mediterranean – 1-2 rigs (250’IC / 300’IC) • Mexico – 2-3 rigs (250’IC/300’IC) • West Africa – 2 rigs (350’IC) • North Sea – 2 rigs (350’+IC) • Middle East – 4-5 rigs (300’IC/350’IC) • India – 1-2 rigs (300’IC) • Trinidad – 1 rig (350’IC) • • There are still 9 cold stacked jack-up rigs further • C
Source: SEC EDGAR · 8-K filed Jan 9, 2007
More decks from Rowan Companies plc
 Merger or Acquisition (October 2018)27 slides · Oct 9, 2018
 Merger or Acquisition (November 2016)12 slides · Nov 21, 2016
 Investor Presentation (March 2016)36 slides · Mar 29, 2016
 Investor Presentation (March 2015)43 slides · Mar 23, 2015
 Barclays CEO Energy - Power Conference 201443 slides · Sep 2, 2014
 Investor Presentation (May 2014)39 slides · May 19, 2014