Dover Corporation · NYSE:DOV
Dover — Morgan Stanley Laguna Conference 2022
12 slides from Dover's conference presentation, Sep 15, 2022
Slide 1: Dover Corporation – Morgan Stanley Laguna Conference
September 15, 2022 Dover Corporation Morgan Stanley Laguna Conference Rich Tobin, President & CEO
Slide 2: Forward-Looking Statements and Non-GAAP Measures
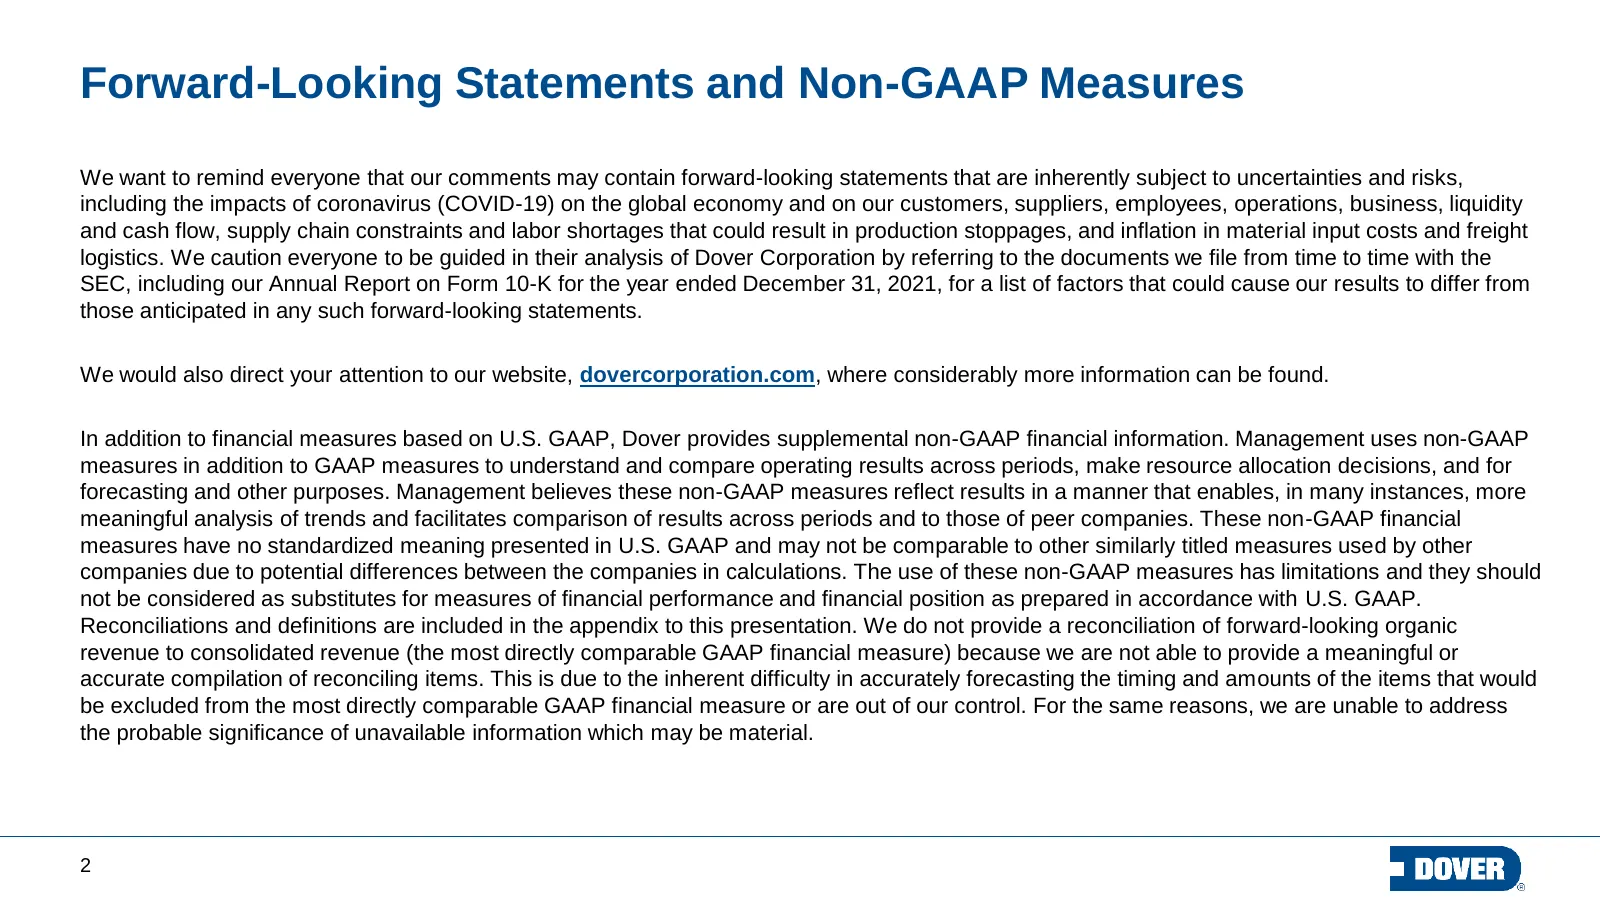
Forward-Looking Statements and Non-GAAP Measures We want to remind everyone that our comments may contain forward-looking statements that are inherently subject to uncertainties and risks, including the impacts of coronavirus (COVID-19) on the global economy and on our customers, suppliers, employee
Slide 3: Dover Strategy Delivers Through-Cycle Value Creation
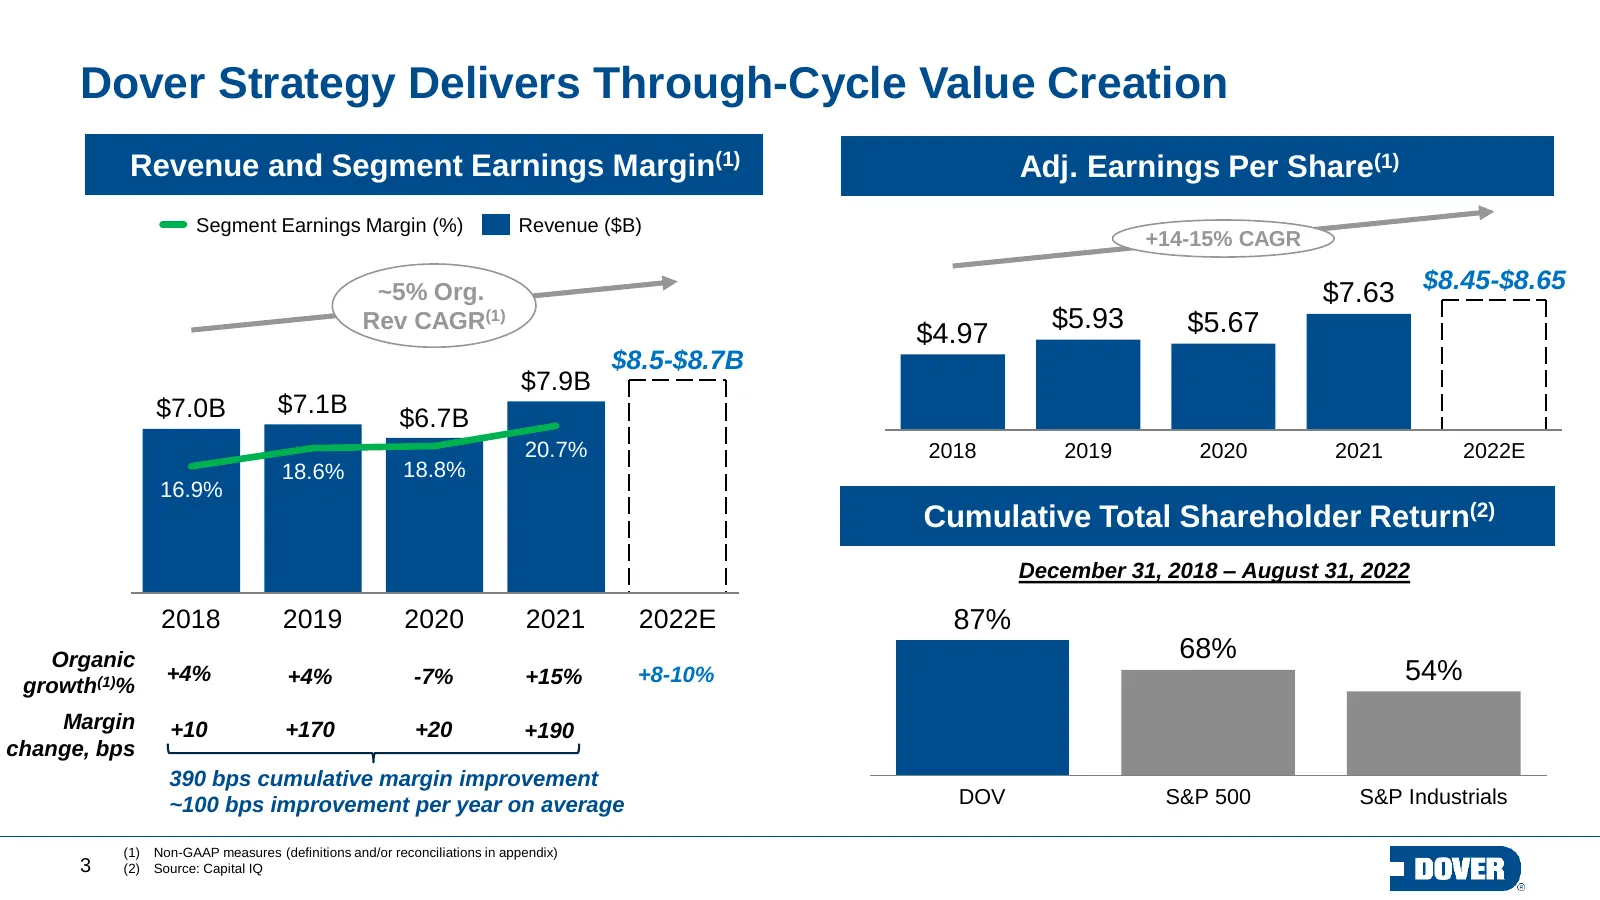
Dover Strategy Delivers Through-Cycle Value Creation Revenue and Segment Earnings Margin(1) Adj. Earnings Per Share(1) Segment Earnings Margin (%) Revenue ($B) +14-15% CAGR ~5% Org. $7.63 $8.45-$8.65 Rev CAGR(1) $5.93 $5.67 $4.97 $8.5-$8.7B $7.9B $7.0B $7.1B $6.7B 20.7% 2018 2019 2020 2021 2022E 18.
Slide 4: Sustained Investment Behind Resilient, High Growth Portfolio
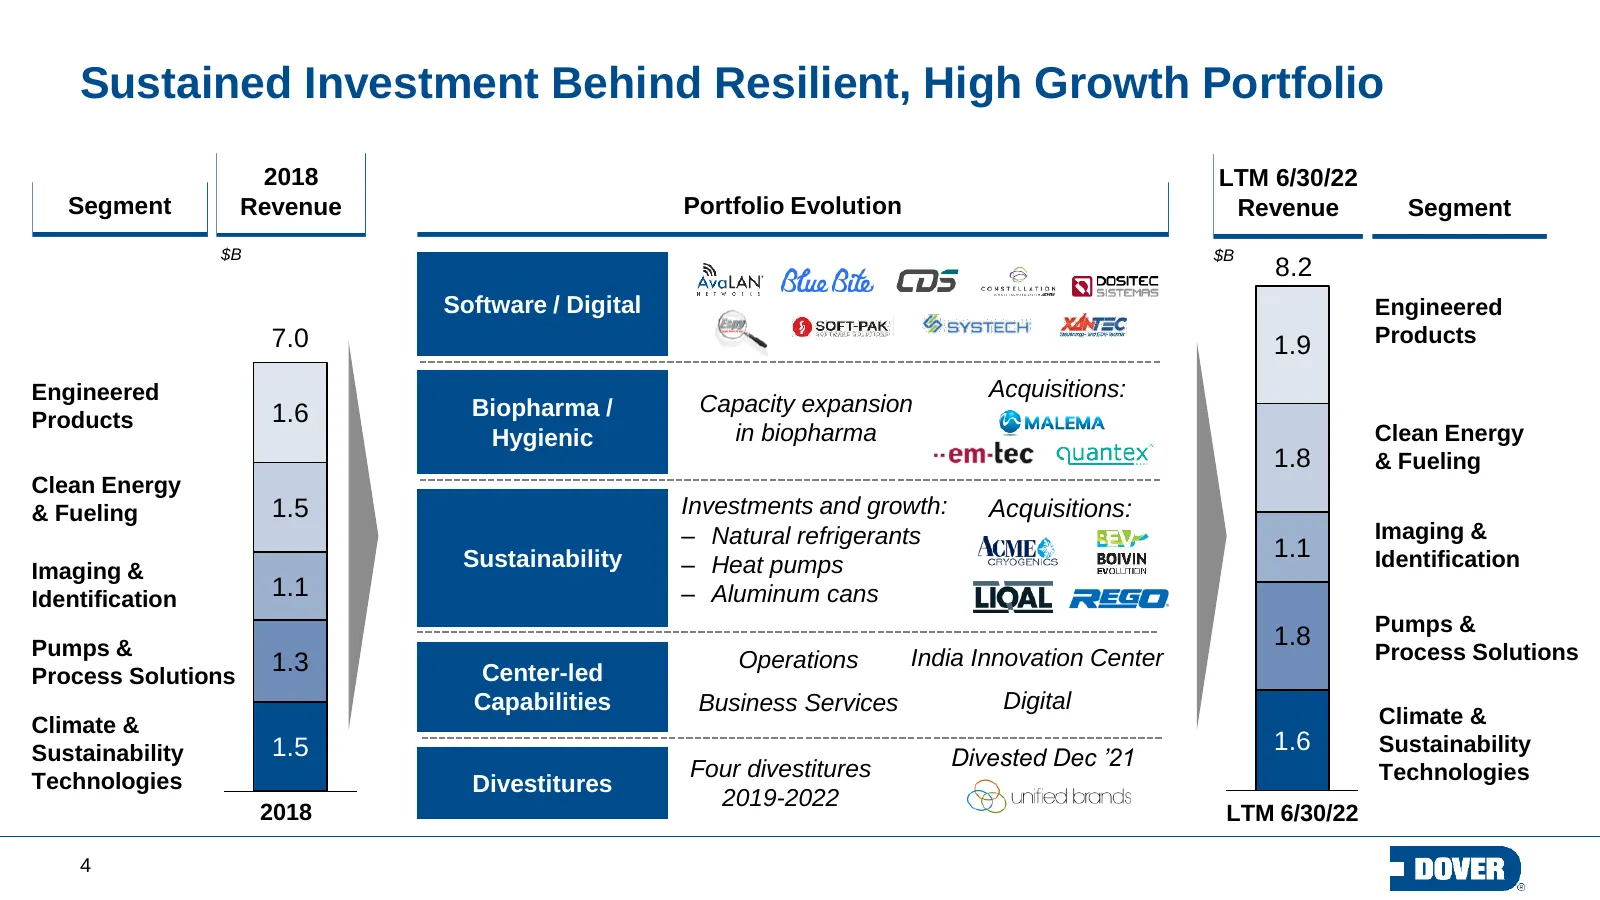
Sustained Investment Behind Resilient, High Growth Portfolio 2018 LTM 6/30/22 Segment Revenue Portfolio Evolution Revenue Segment $B $B 8.2 Software / Digital Engineered 7.0 1.9 Products Engineered Acquisitions: 1.6 Biopharma / Capacity expansion Products Hygienic in biopharma Clean Energy 1.8 & Fue
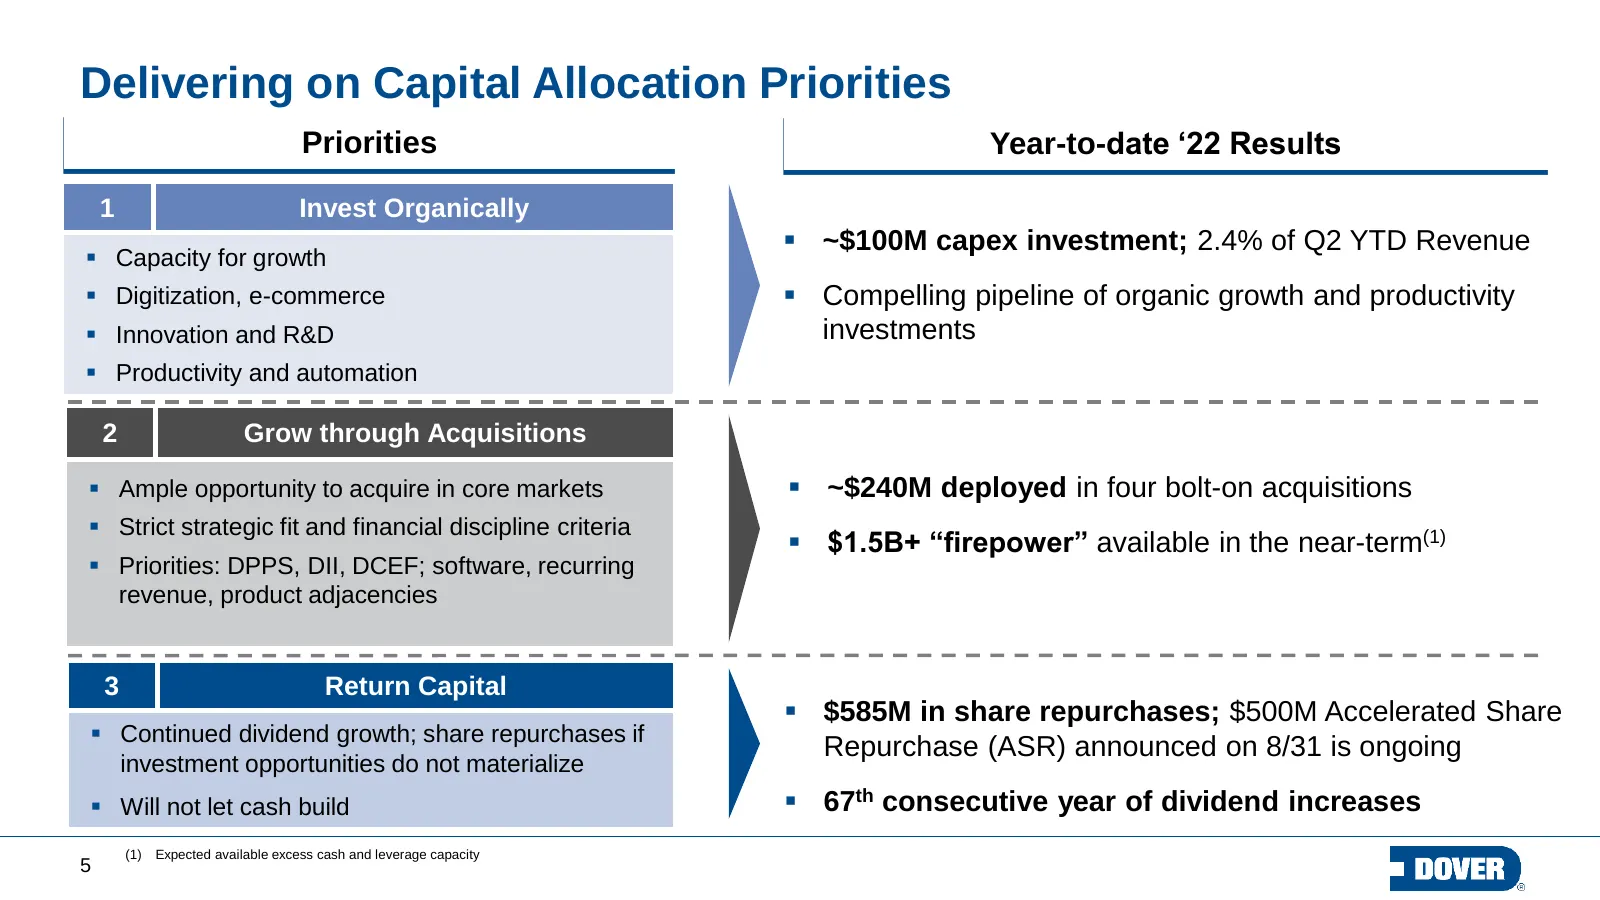
Slide 5: Delivering on Capital Allocation Priorities
Delivering on Capital Allocation Priorities Priorities Year-to-date ‘22 Results 1 Invest Organically ~$100M capex investment; 2.4% of Q2 YTD Revenue Capacity for growth Digitization, e-commerce Compelling pipeline of organic growth and productivity Innovation and R&D investments Producti
Slide 6: Appendix
Appendix 6
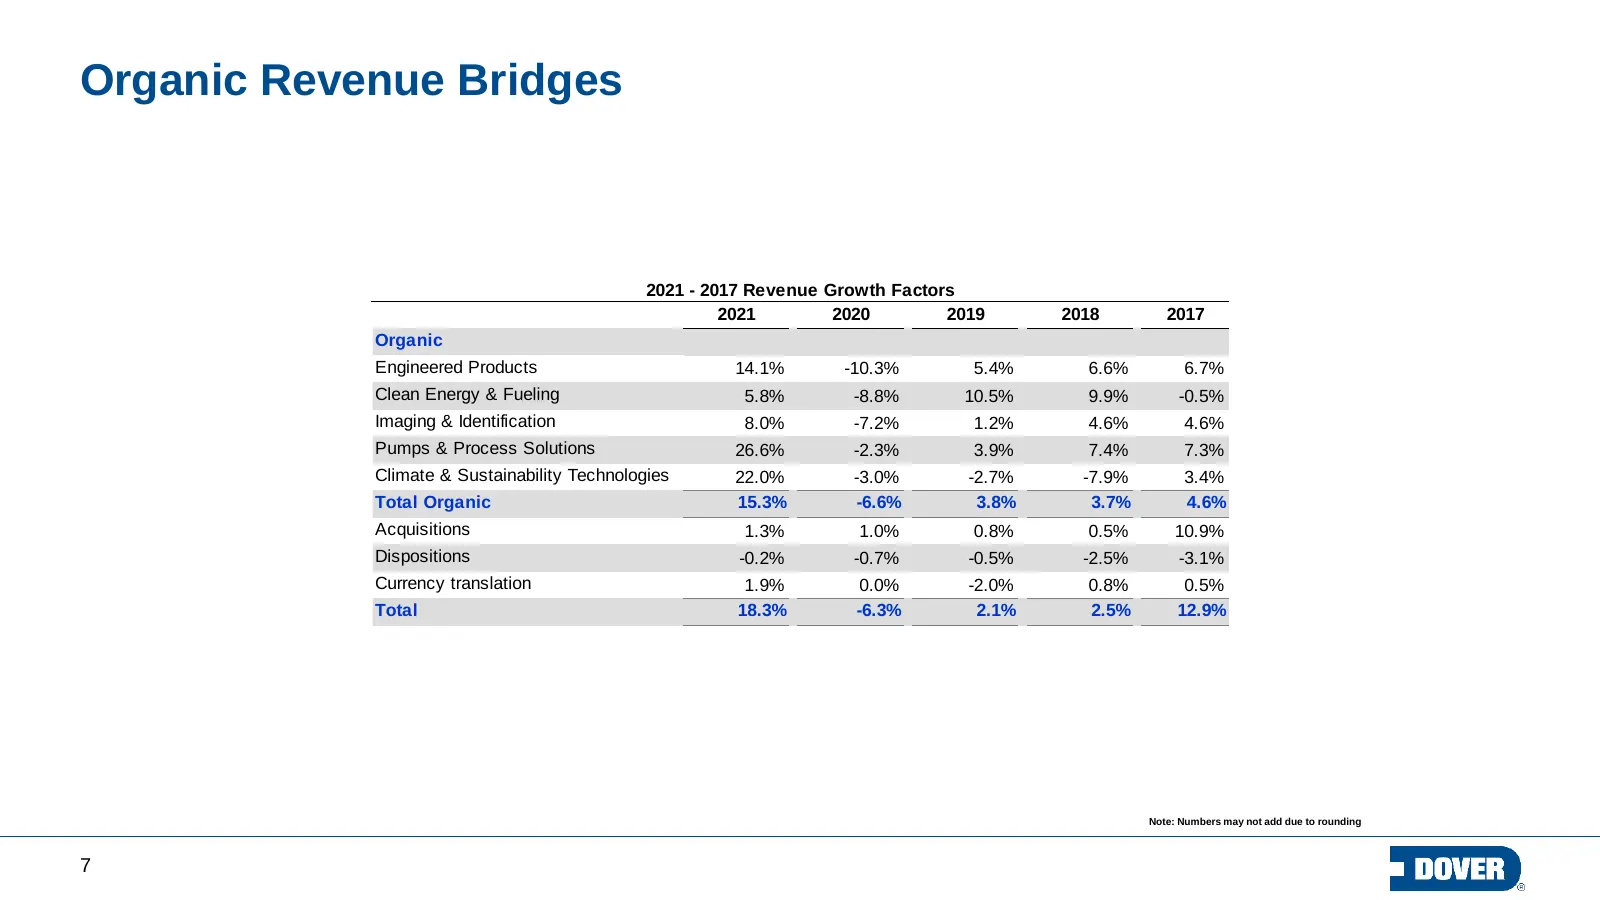
Slide 7: Organic Revenue Bridges
Organic Revenue Bridges 2021 - 2017 Revenue Growth Factors 2021 2020 2019 2018 2017 Organic Engineered Products 14.1% -10.3% 5.4% 6.6% 6.7% Clean Energy & Fueling 5.8% -8.8% 10.5% 9.9% -0.5% Imaging & Identification 8.0% -7.2% 1.2% 4.6% 4.6% Pumps & Process Solutions 26.6% -2.3% 3.9% 7.4% 7.3% Clima
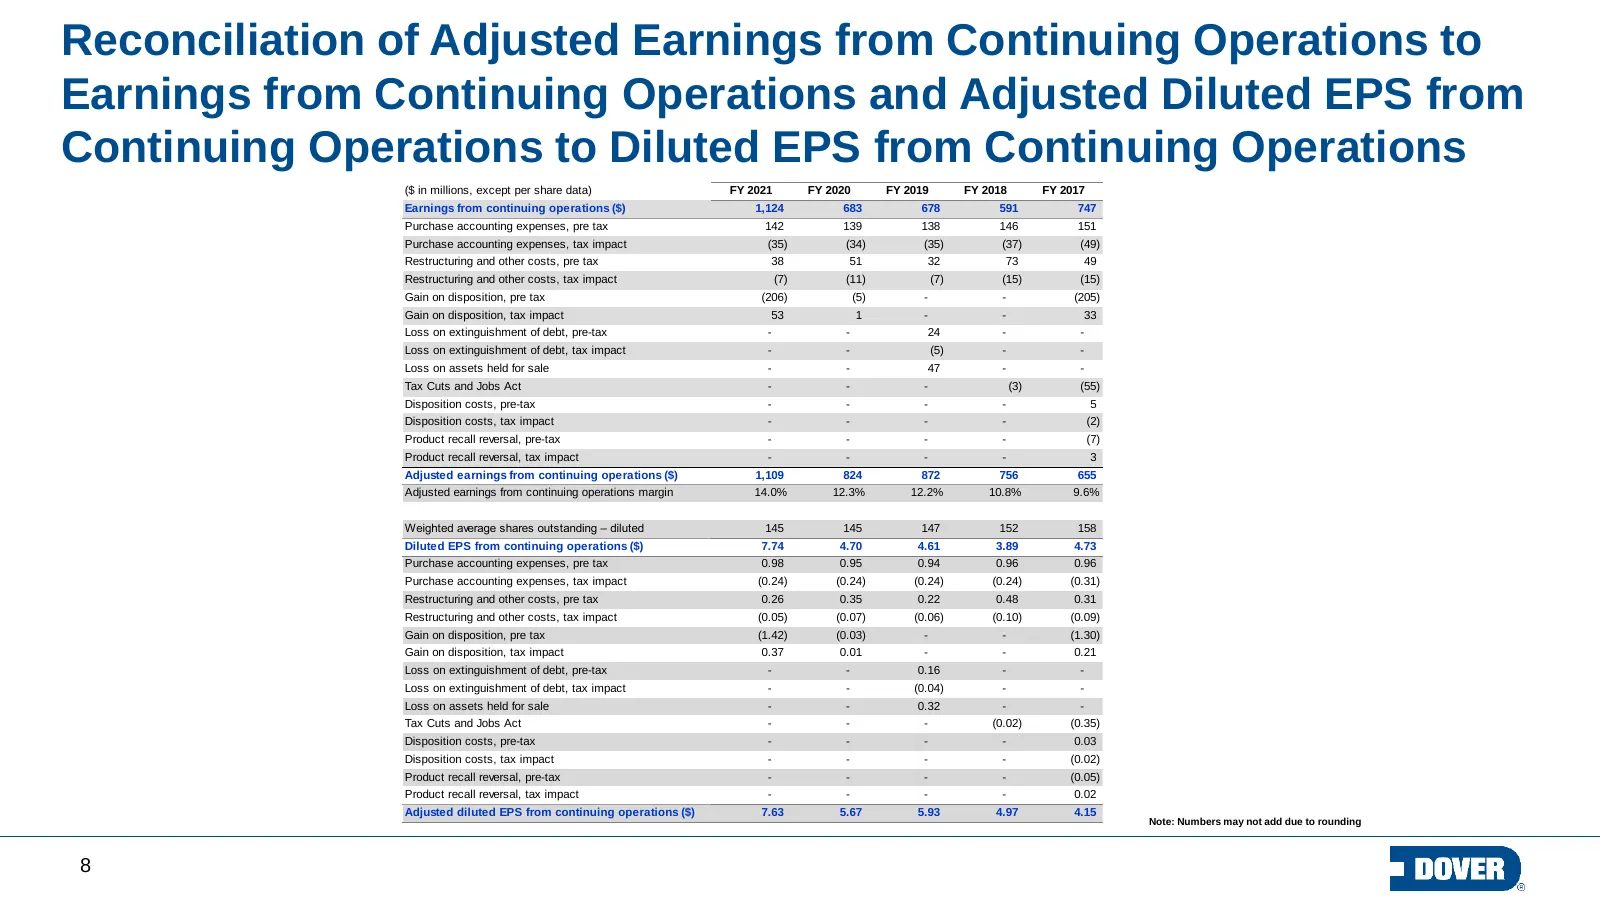
Slide 8: Reconciliation of Adjusted Earnings from Continuing Operations to Earnings from Continuing Operations
Reconciliation of Adjusted Earnings from Continuing Operations to Earnings from Continuing Operations and Adjusted Diluted EPS from Continuing Operations to Diluted EPS from Continuing Operations ($ in millions, except per share data) FY 2021 FY 2020 FY 2019 FY 2018 FY 2017 Earnings from continuing
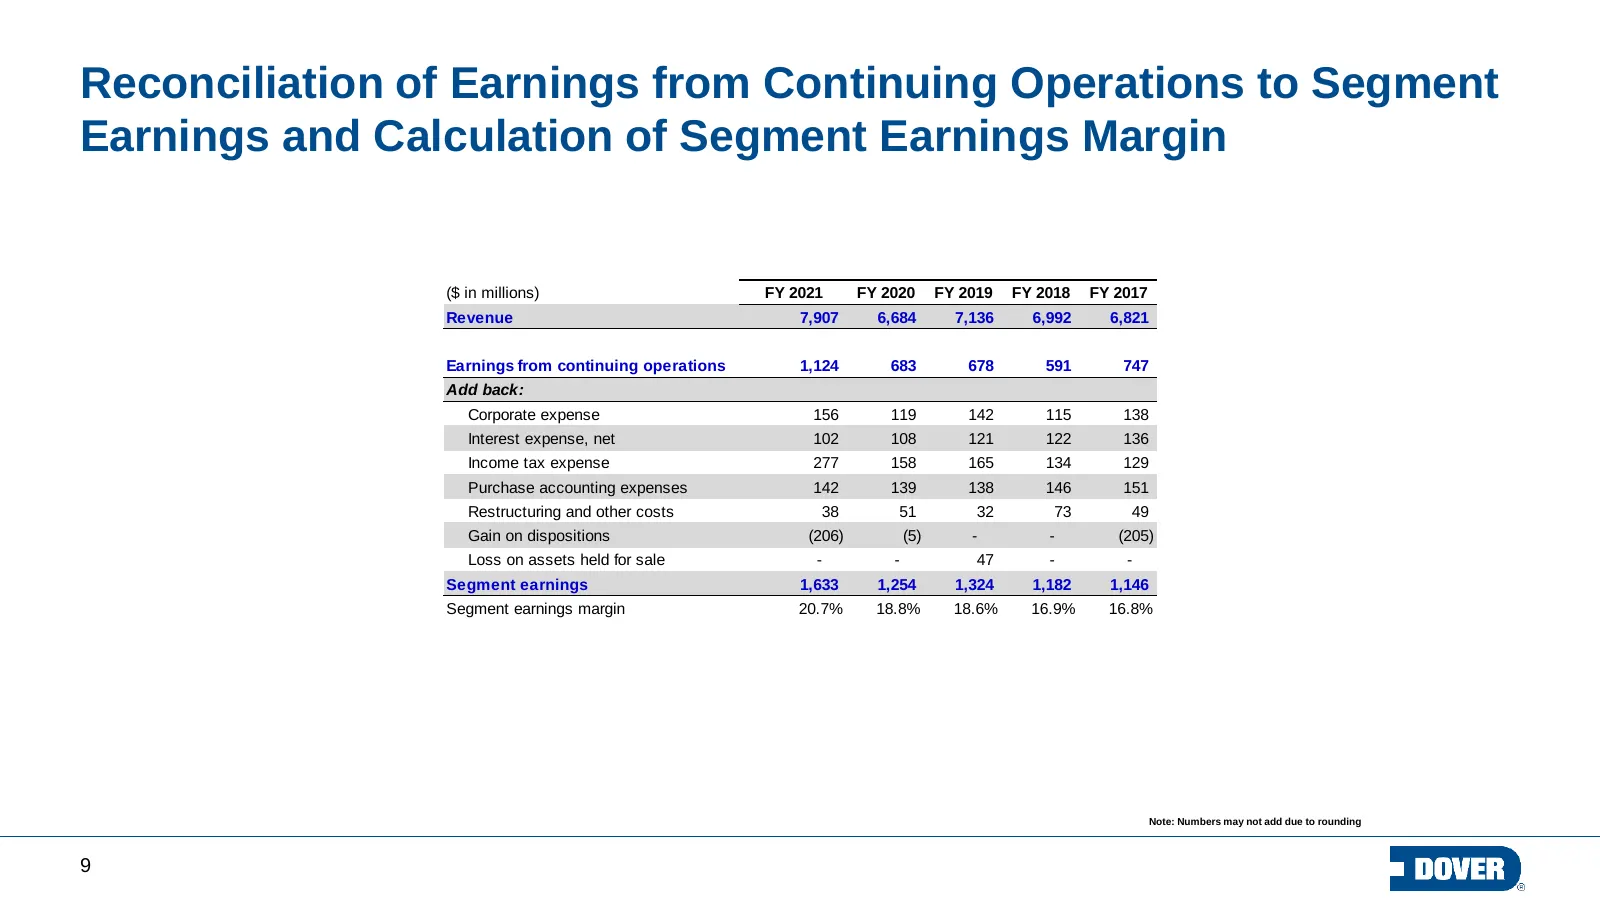
Slide 9: Reconciliation of Earnings from Continuing Operations to Segment Earnings
Reconciliation of Earnings from Continuing Operations to Segment Earnings and Calculation of Segment Earnings Margin ($ in millions) FY 2021 FY 2020 FY 2019 FY 2018 FY 2017 Revenue 7,907 6,684 7,136 6,992 6,821 Earnings from continuing operations 1,124 683 678 591 747 Add back: Corporate expense 156
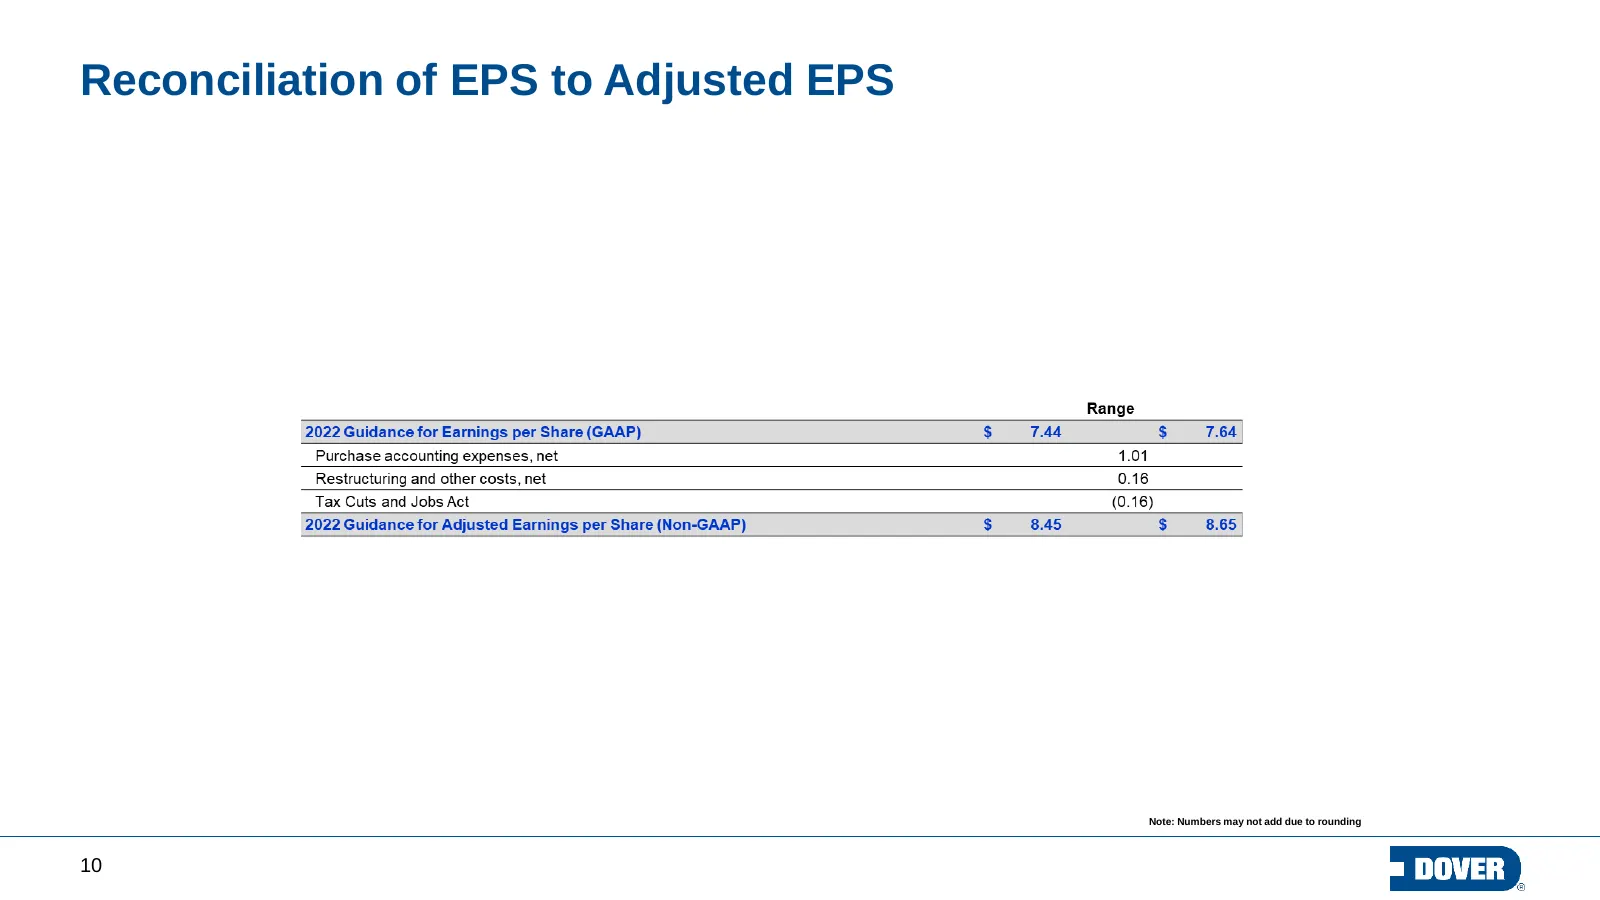
Slide 10: Reconciliation of EPS to Adjusted EPS
Reconciliation of EPS to Adjusted EPS Note: Numbers may not add due to rounding 10
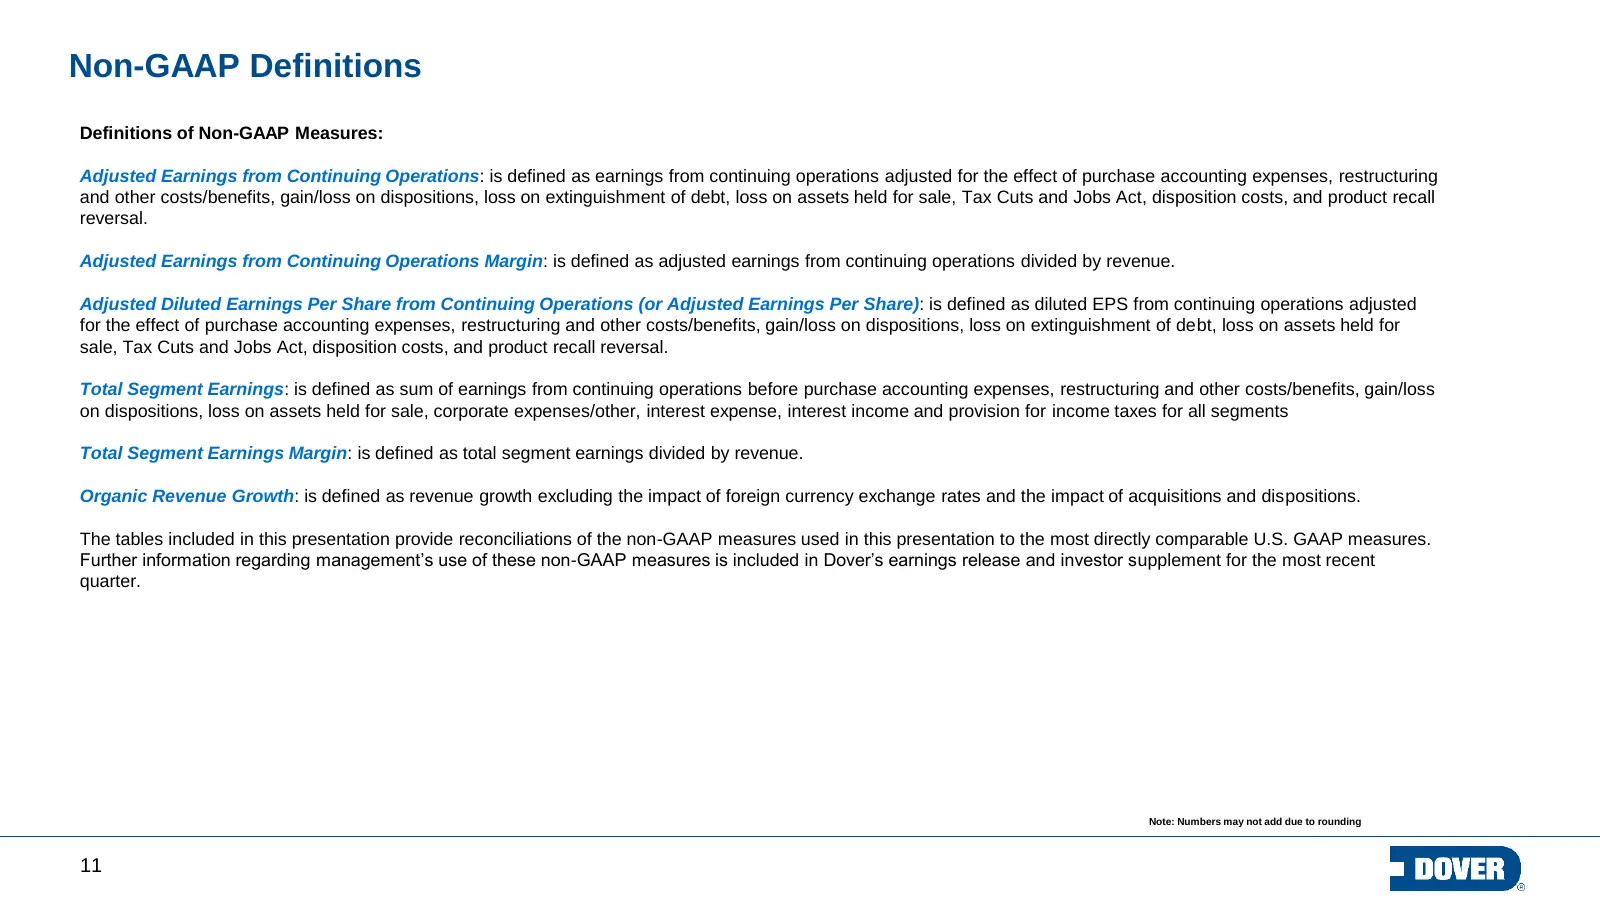
Slide 11: Non-GAAP Definitions
Non-GAAP Definitions Definitions of Non-GAAP Measures: Adjusted Earnings from Continuing Operations: is defined as earnings from continuing operations adjusted for the effect of purchase accounting expenses, restructuring and other costs/benefits, gain/loss on dispositions, loss on extinguishment of

Slide 12
Source: company website
More decks from Dover Corporation
 Q3 2026 Earnings Presentation22 slides · Oct 22, 2026
 Q2 2026 Earnings Presentation20 slides · Jul 23, 2026
 Q1 2026 Earnings Presentation22 slides · Apr 23, 2026
 Q2 2025 Earnings Presentation24 slides · Jul 24, 2025
 Q1 2025 Earnings Presentation22 slides · Apr 24, 2025
 Q4 2024 Earnings Presentation21 slides · Jan 30, 2025