Applied Optoelectronics, Inc. · NASDAQ:AAOI
Applied Optoelectronics — Q3 2025 Earnings Presentation
6 slides from Applied Optoelectronics's earnings presentation
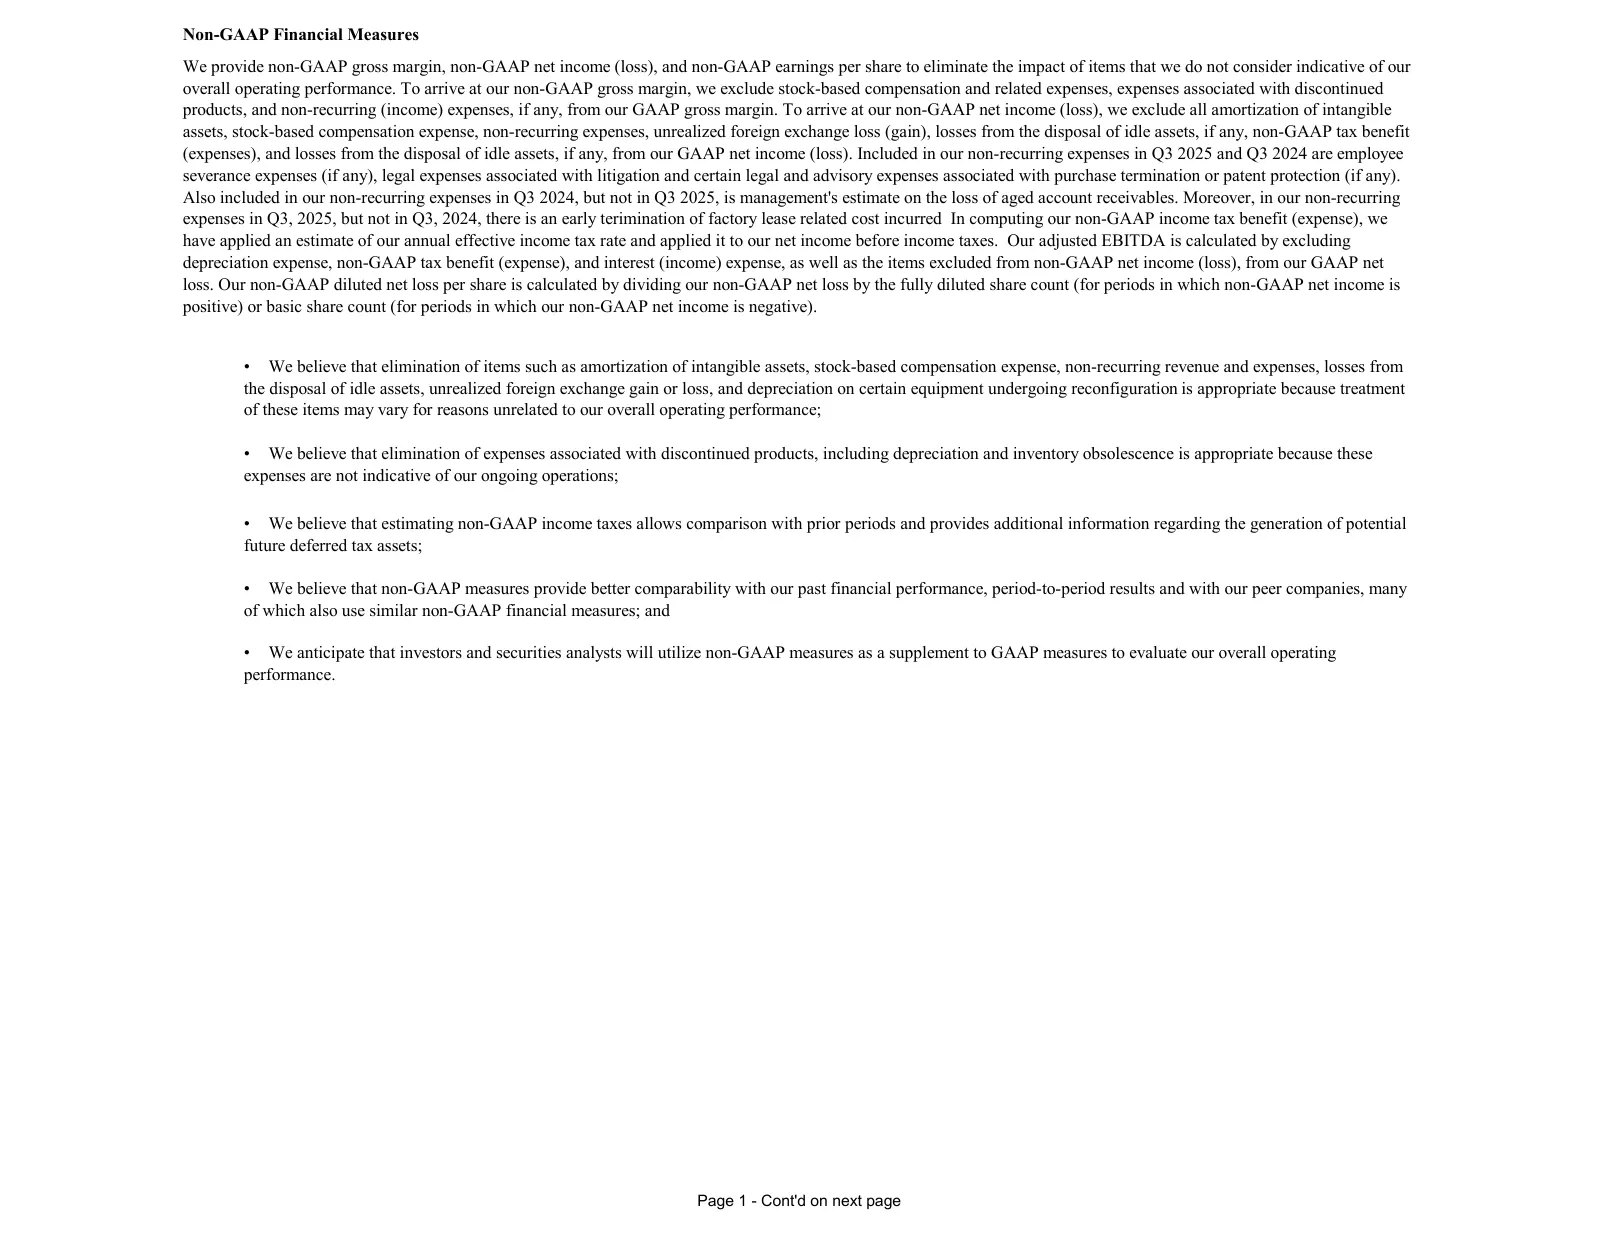
Slide 1: Non-GAAP Financial Measures
Non-GAAP Financial Measures We provide non-GAAP gross margin, non-GAAP net income (loss), and non-GAAP earnings per share to eliminate the impact of items that we do not consider indicative of our overall operating performance. To arrive at our non-GAAP gross margin, we exclude stock-based compensat
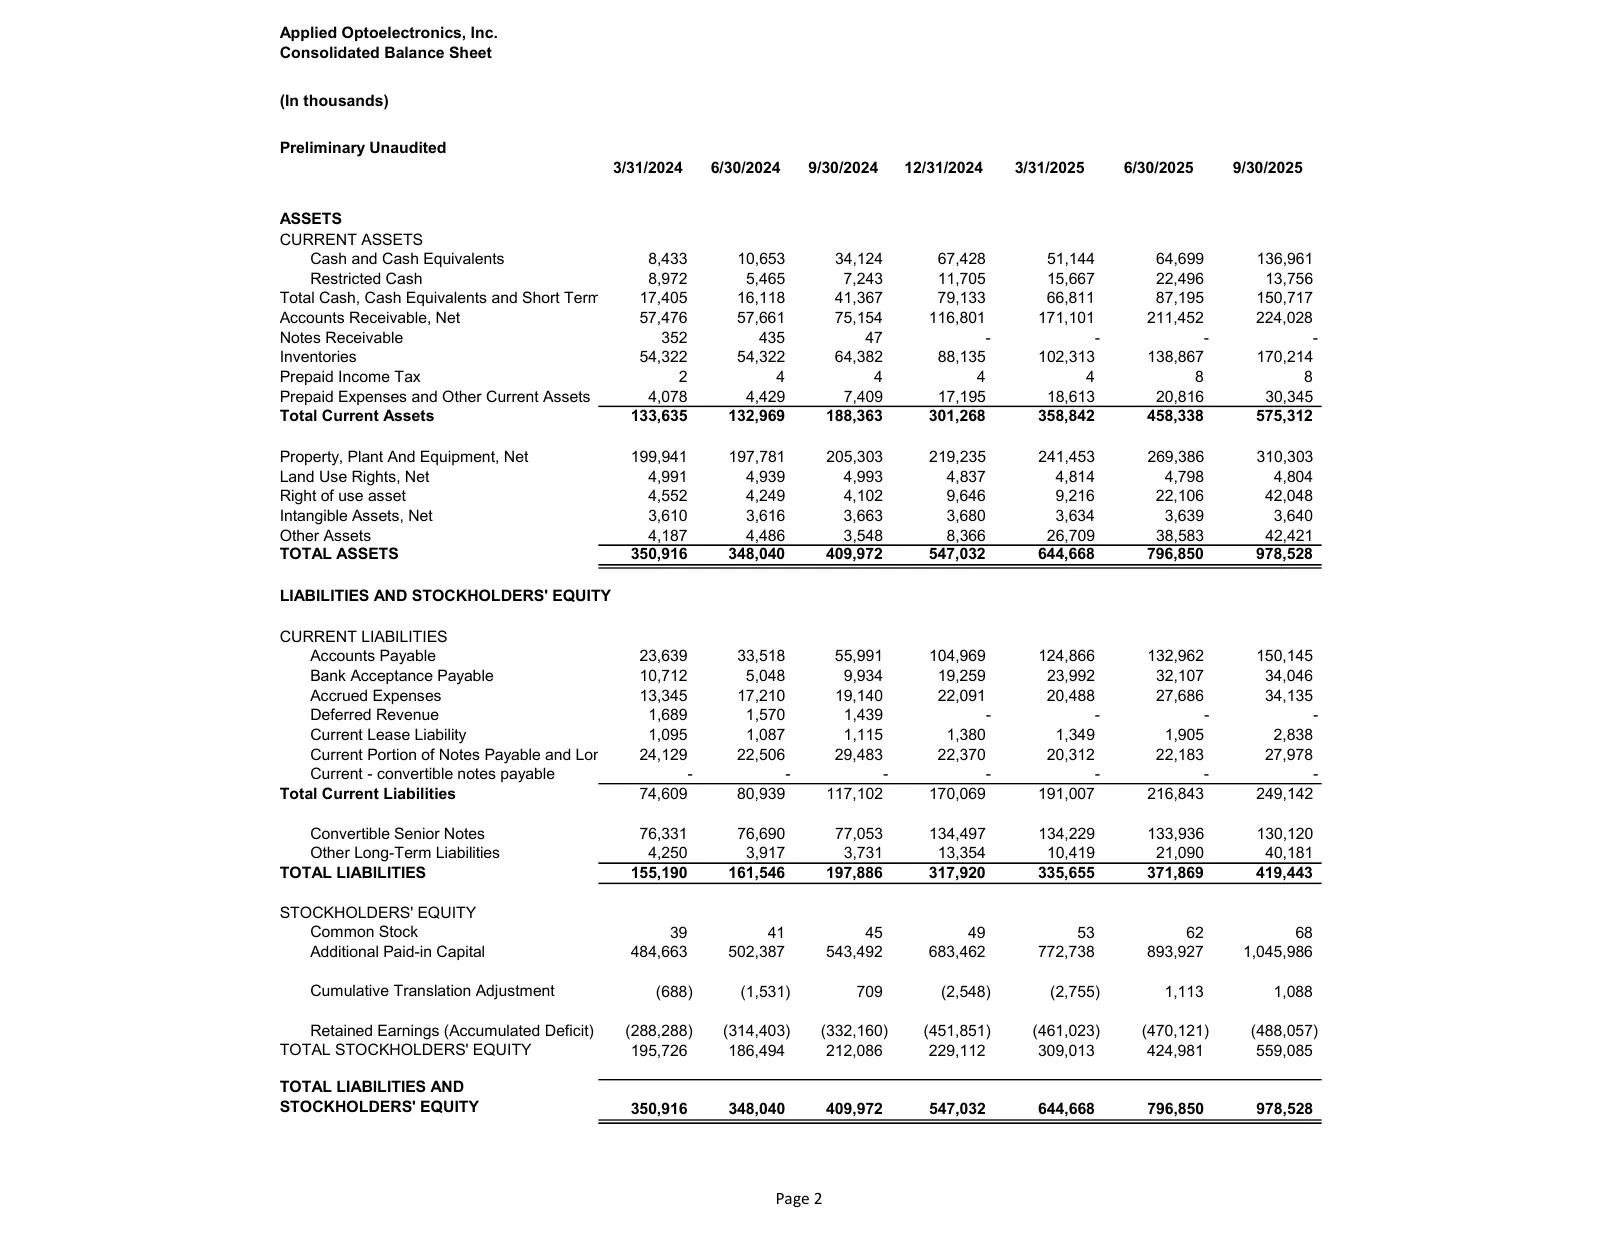
Slide 2: Consolidated Balance Sheet
Applied Optoelectronics, Inc. Consolidated Balance Sheet (In thousands) Preliminary Unaudited 3/31/2024 6/30/2024 9/30/2024 12/31/2024 3/31/2025 6/30/2025 9/30/2025 ASSETS CURRENT ASSETS Cash and Cash Equivalents 8,433 10,653 34,124 67,428 51,144 64,699 136,961 Restricted Cash 8,972 5,465 7,243 11,7
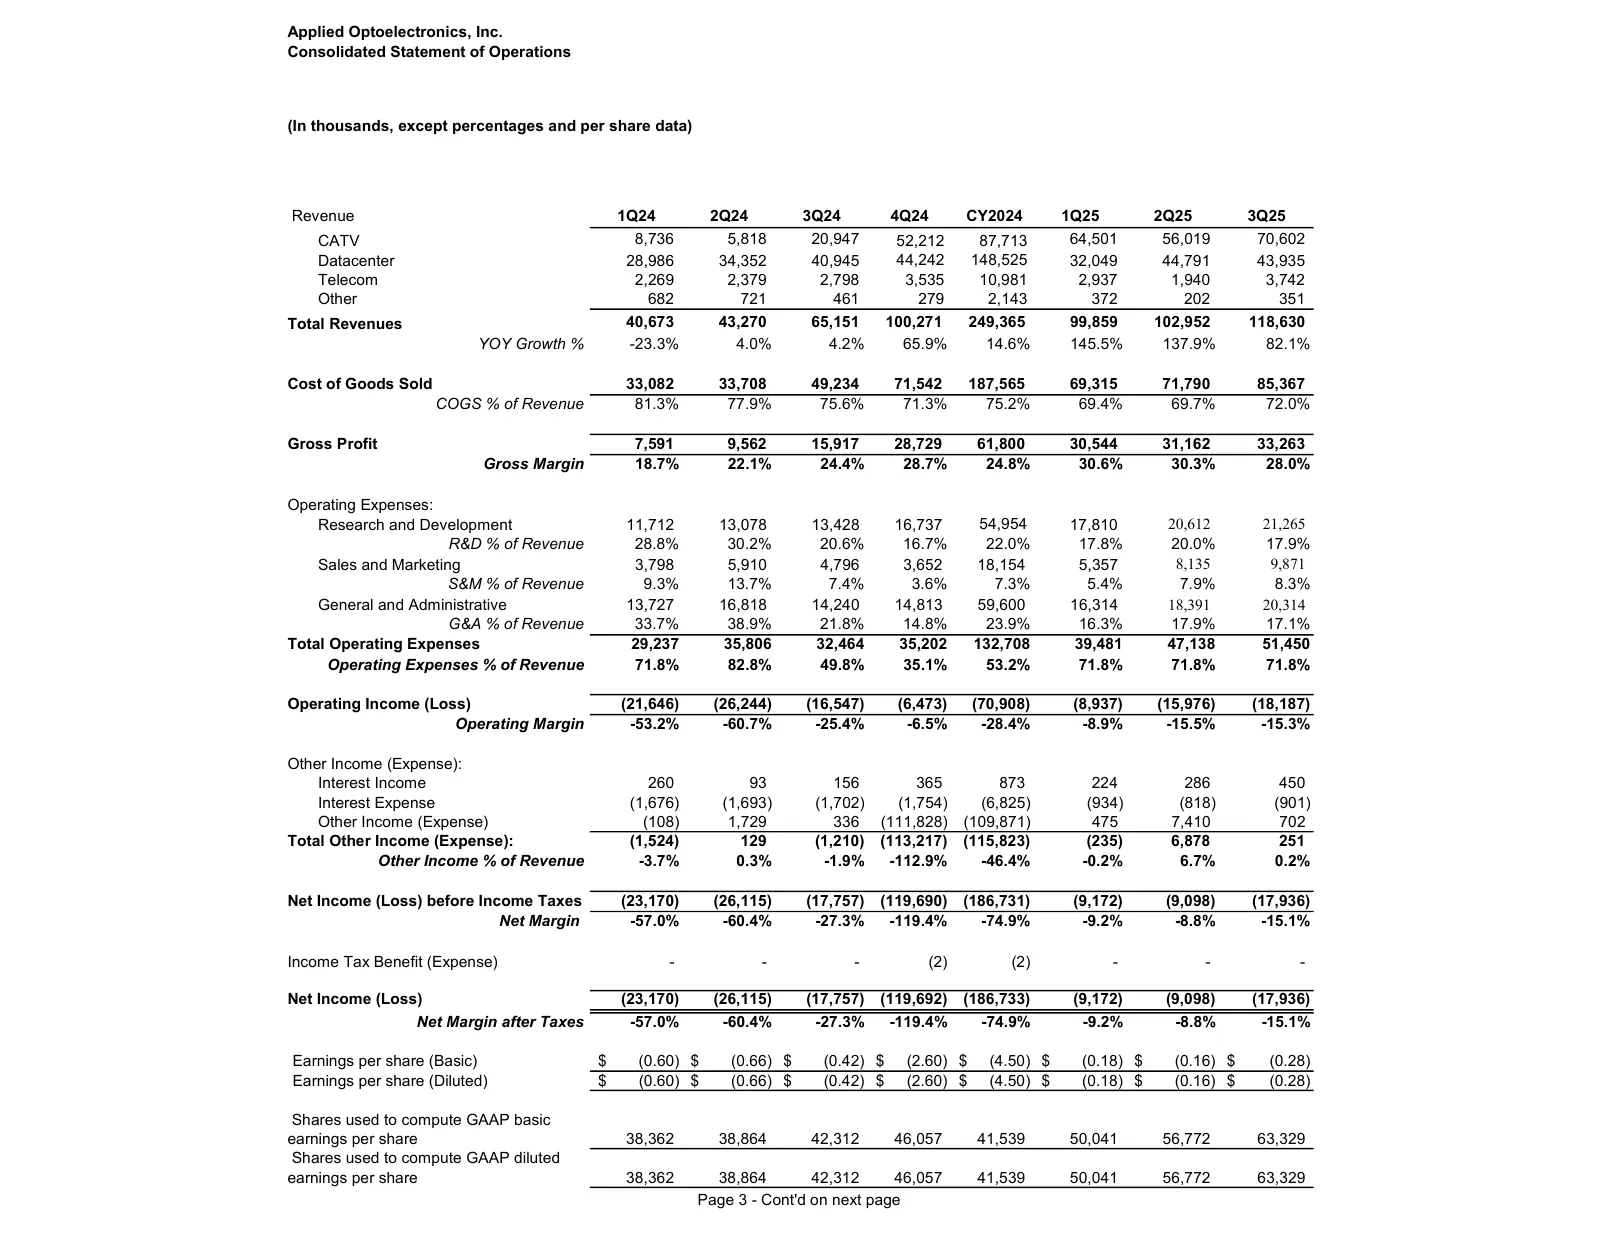
Slide 3: Consolidated Statement of Operations
Applied Optoelectronics, Inc. Consolidated Statement of Operations (In thousands, except percentages and per share data) Revenue 1Q24 2Q24 3Q24 4Q24 CY2024 1Q25 2Q25 3Q25 CATV 8,736 5,818 20,947 52,212 87,713 64,501 56,019 70,602 Datacenter 28,986 34,352 40,945 44,242 148,525 32,049 44,791 43,935 Te
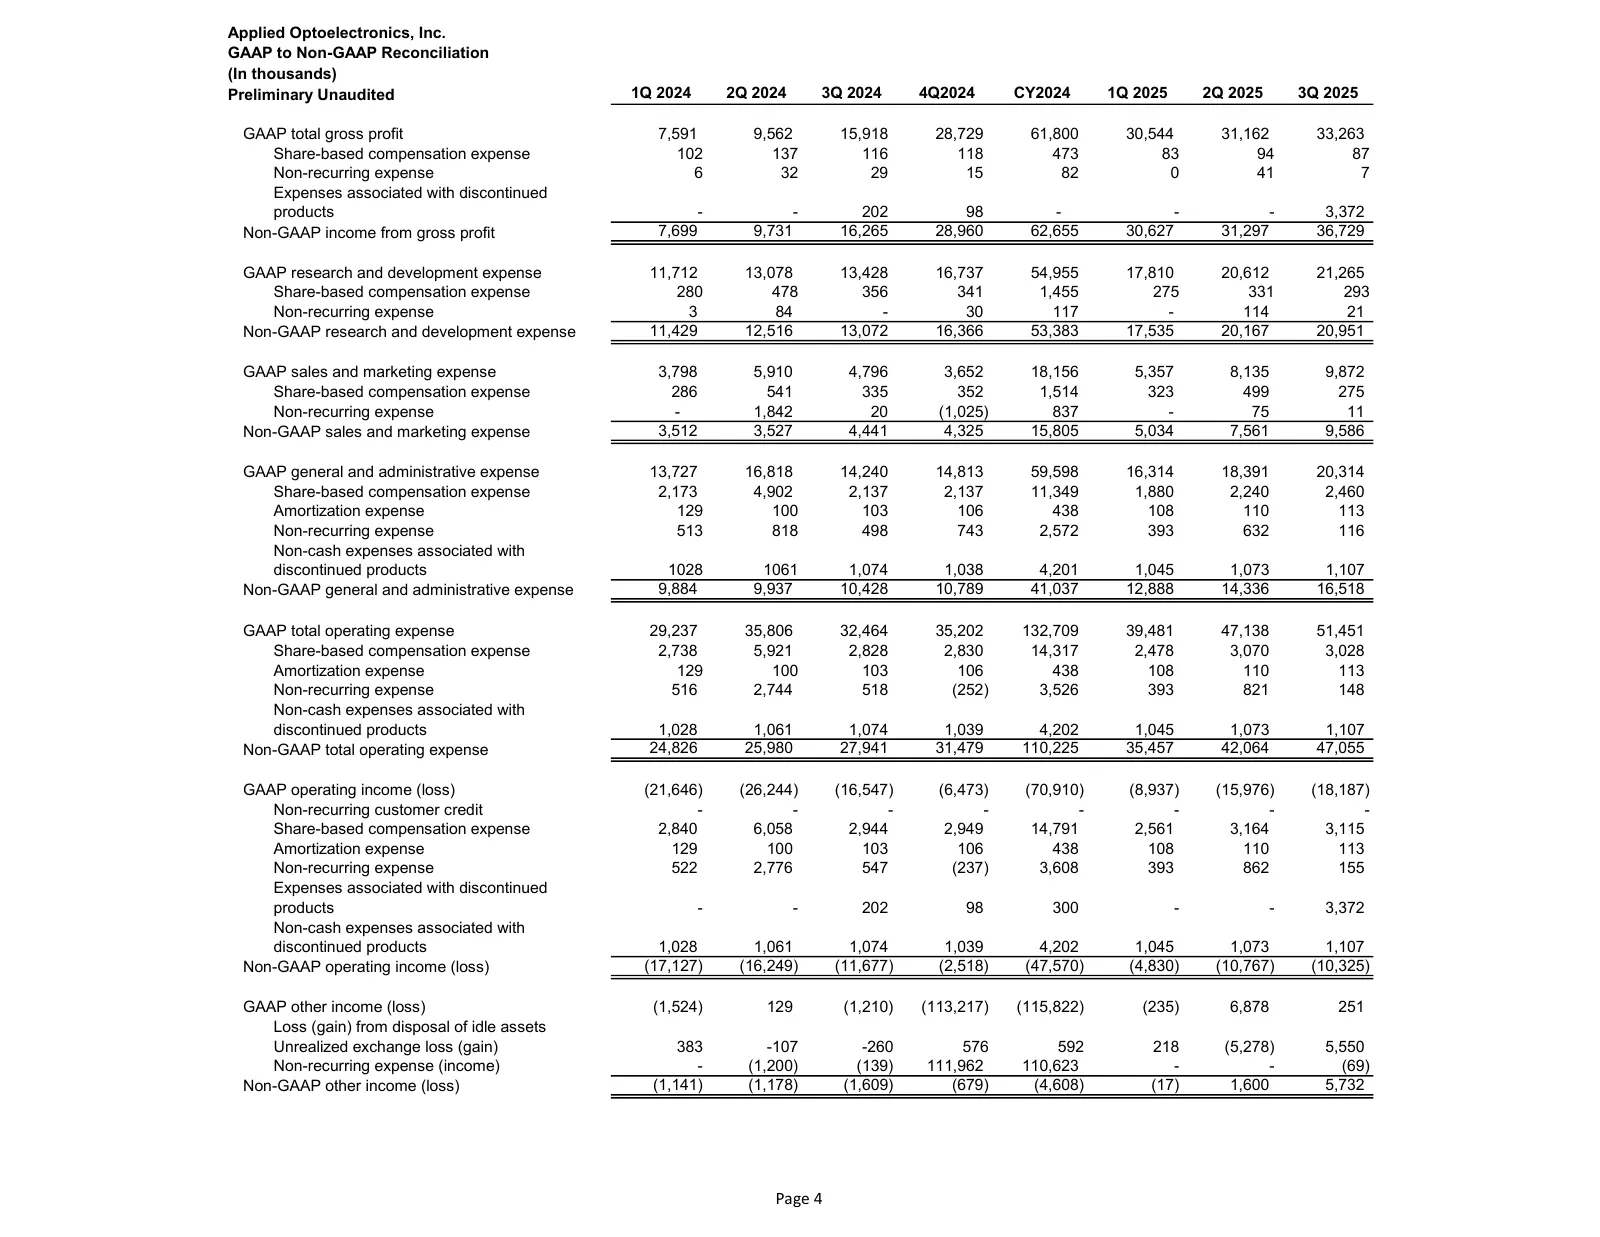
Slide 4: GAAP to Non-GAAP Reconciliation
Applied Optoelectronics, Inc. GAAP to Non-GAAP Reconciliation (In thousands) Preliminary Unaudited 1Q 2024 2Q 2024 3Q 2024 4Q2024 CY2024 1Q 2025 2Q 2025 3Q 2025 GAAP total gross profit 7,591 9,562 15,918 28,729 61,800 30,544 31,162 33,263 Share-based compensation expense 102 137 116 118 473 83 94 87
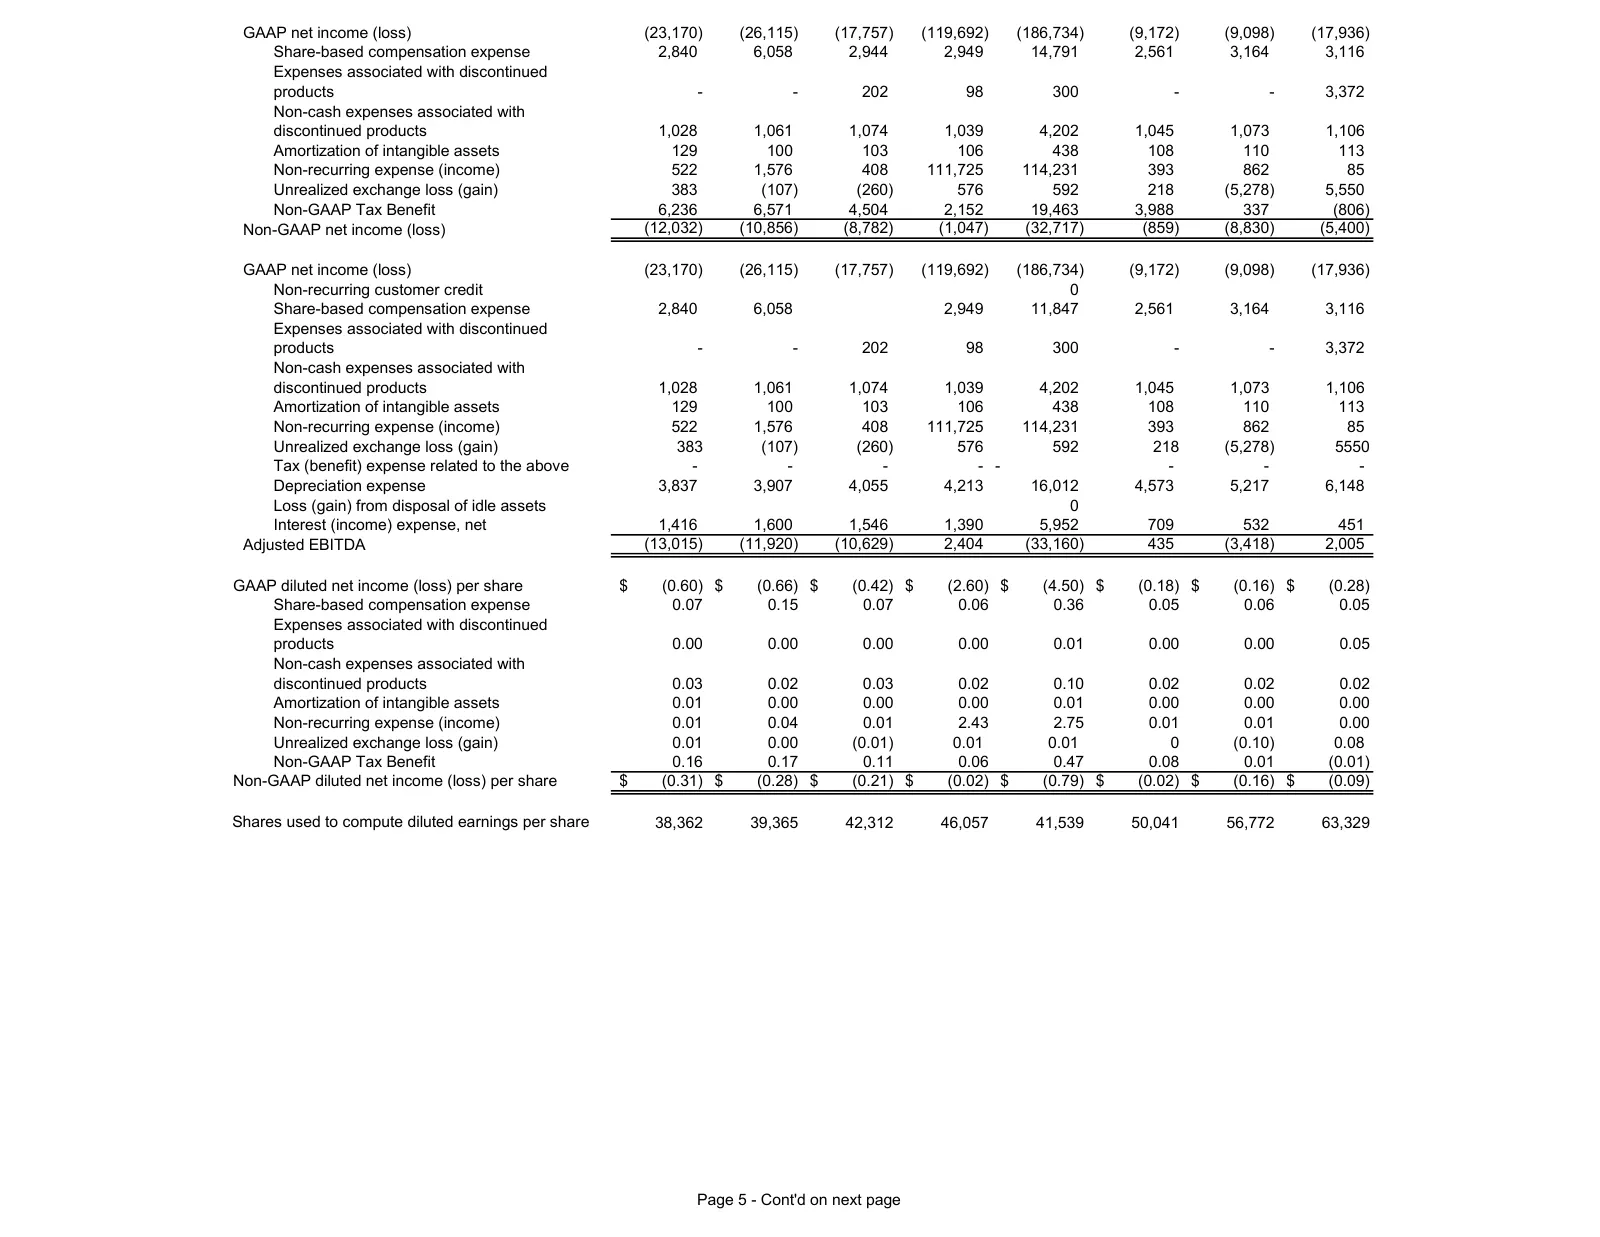
Slide 5: GAAP net income (loss) to Non-GAAP net income (loss)
GAAP net income (loss) (23,170) (26,115) (17,757) (119,692) (186,734) (9,172) (9,098) (17,936) Share-based compensation expense 2,840 6,058 2,944 2,949 14,791 2,561 3,164 3,116 Expenses associated with discontinued products - - 202 98 300 - - 3,372 Non-cash expenses associated with discontinued prod
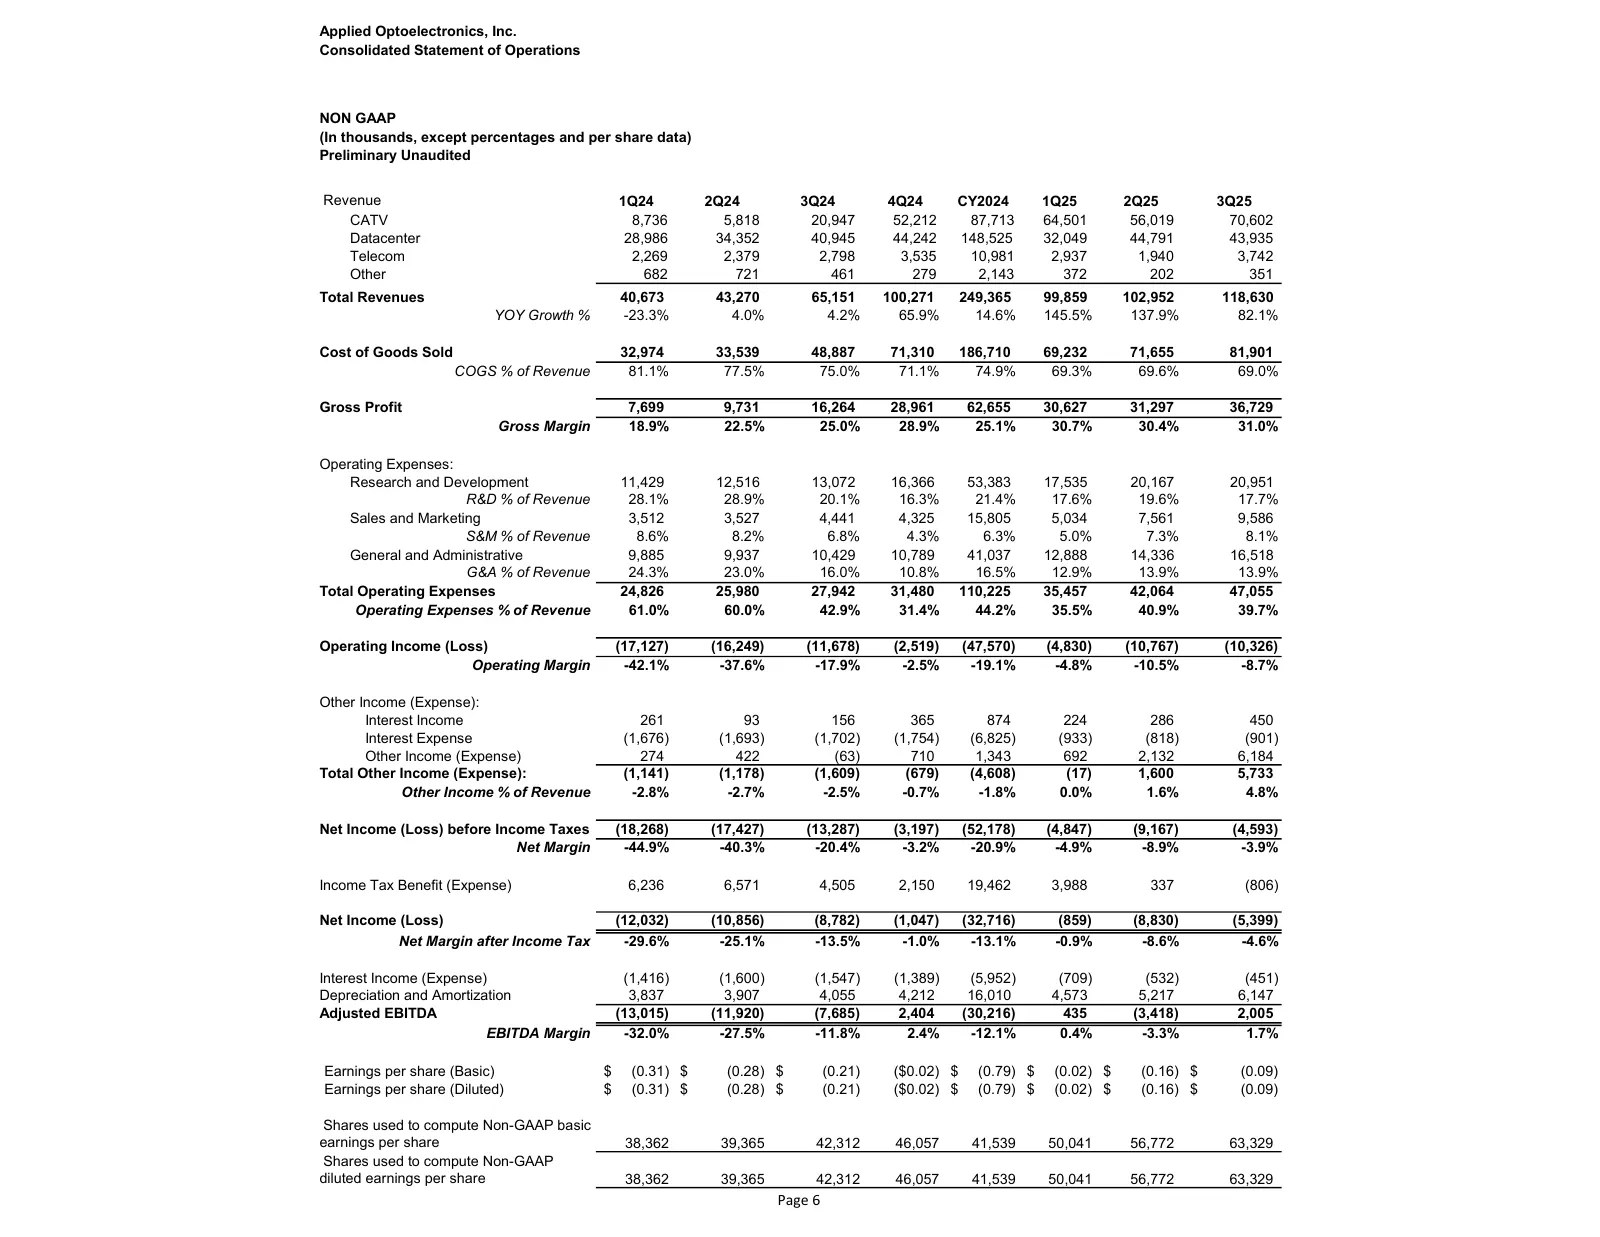
Slide 6: Non-GAAP Statement of Operations
Applied Optoelectronics, Inc. Consolidated Statement of Operations NON GAAP (In thousands, except percentages and per share data) Preliminary Unaudited Revenue 1Q24 2Q24 3Q24 4Q24 CY2024 1Q25 2Q25 3Q25 CATV 8,736 5,818 20,947 52,212 87,713 64,501 56,019 70,602 Datacenter 28,986 34,352 40,945 44,242
Source: company website
More decks from Applied Optoelectronics, Inc.
 Q2 2026 Earnings Presentation32 slides · August 2026
 Investor Presentation (February 2026)33 slides · February 2026
 Q1 2025 Earnings Presentation6 slides · 2025
 Q2 2024 Earnings Presentation30 slides · Aug 6, 2024
 Q2 2024 Earnings Presentation6 slides · August 2024
 Q1 2024 Earnings Presentation30 slides · May 9, 2024