Applied Optoelectronics, Inc. · NASDAQ:AAOI
Applied Optoelectronics — Q1 2025 Earnings Presentation
6 slides from Applied Optoelectronics's earnings presentation, 2025
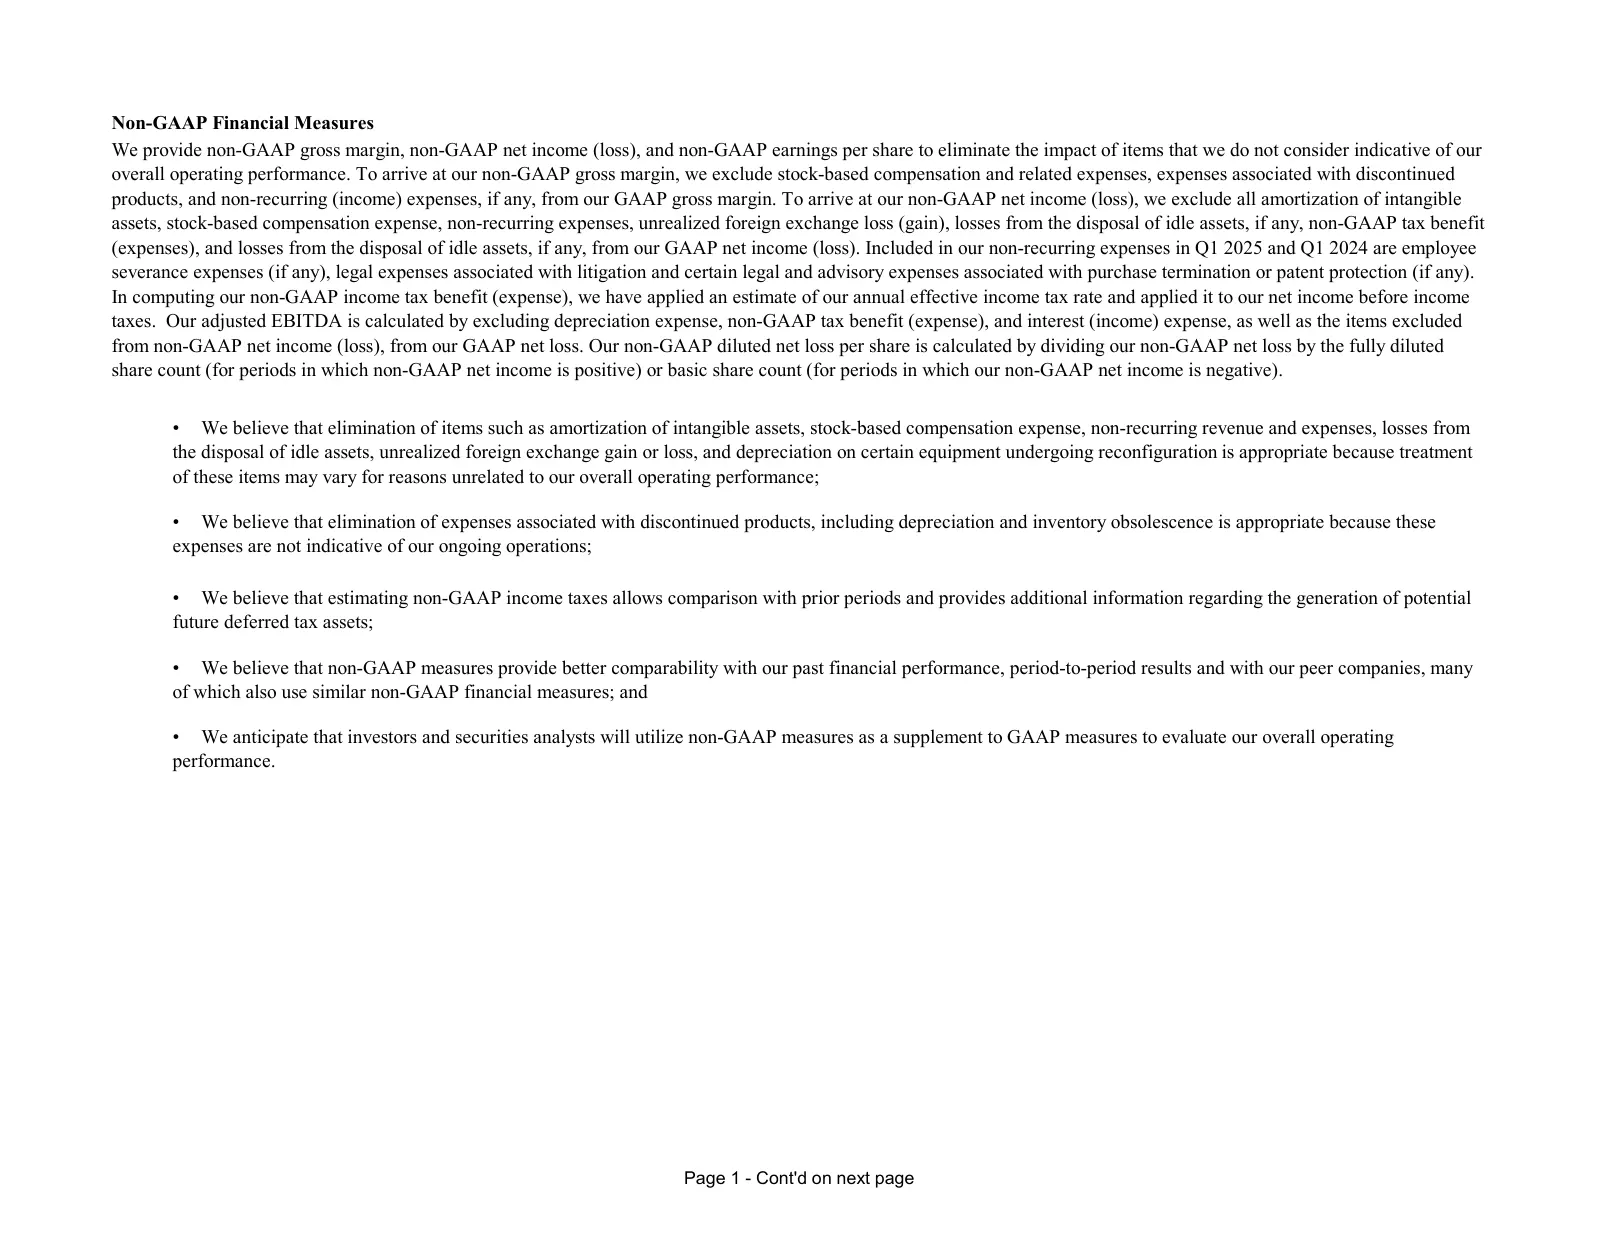
Slide 1: Non-GAAP Financial Measures
Non-GAAP Financial Measures We provide non-GAAP gross margin, non-GAAP net income (loss), and non-GAAP earnings per share to eliminate the impact of items that we do not consider indicative of our overall operating performance. To arrive at our non-GAAP gross margin, we exclude stock-based compensat
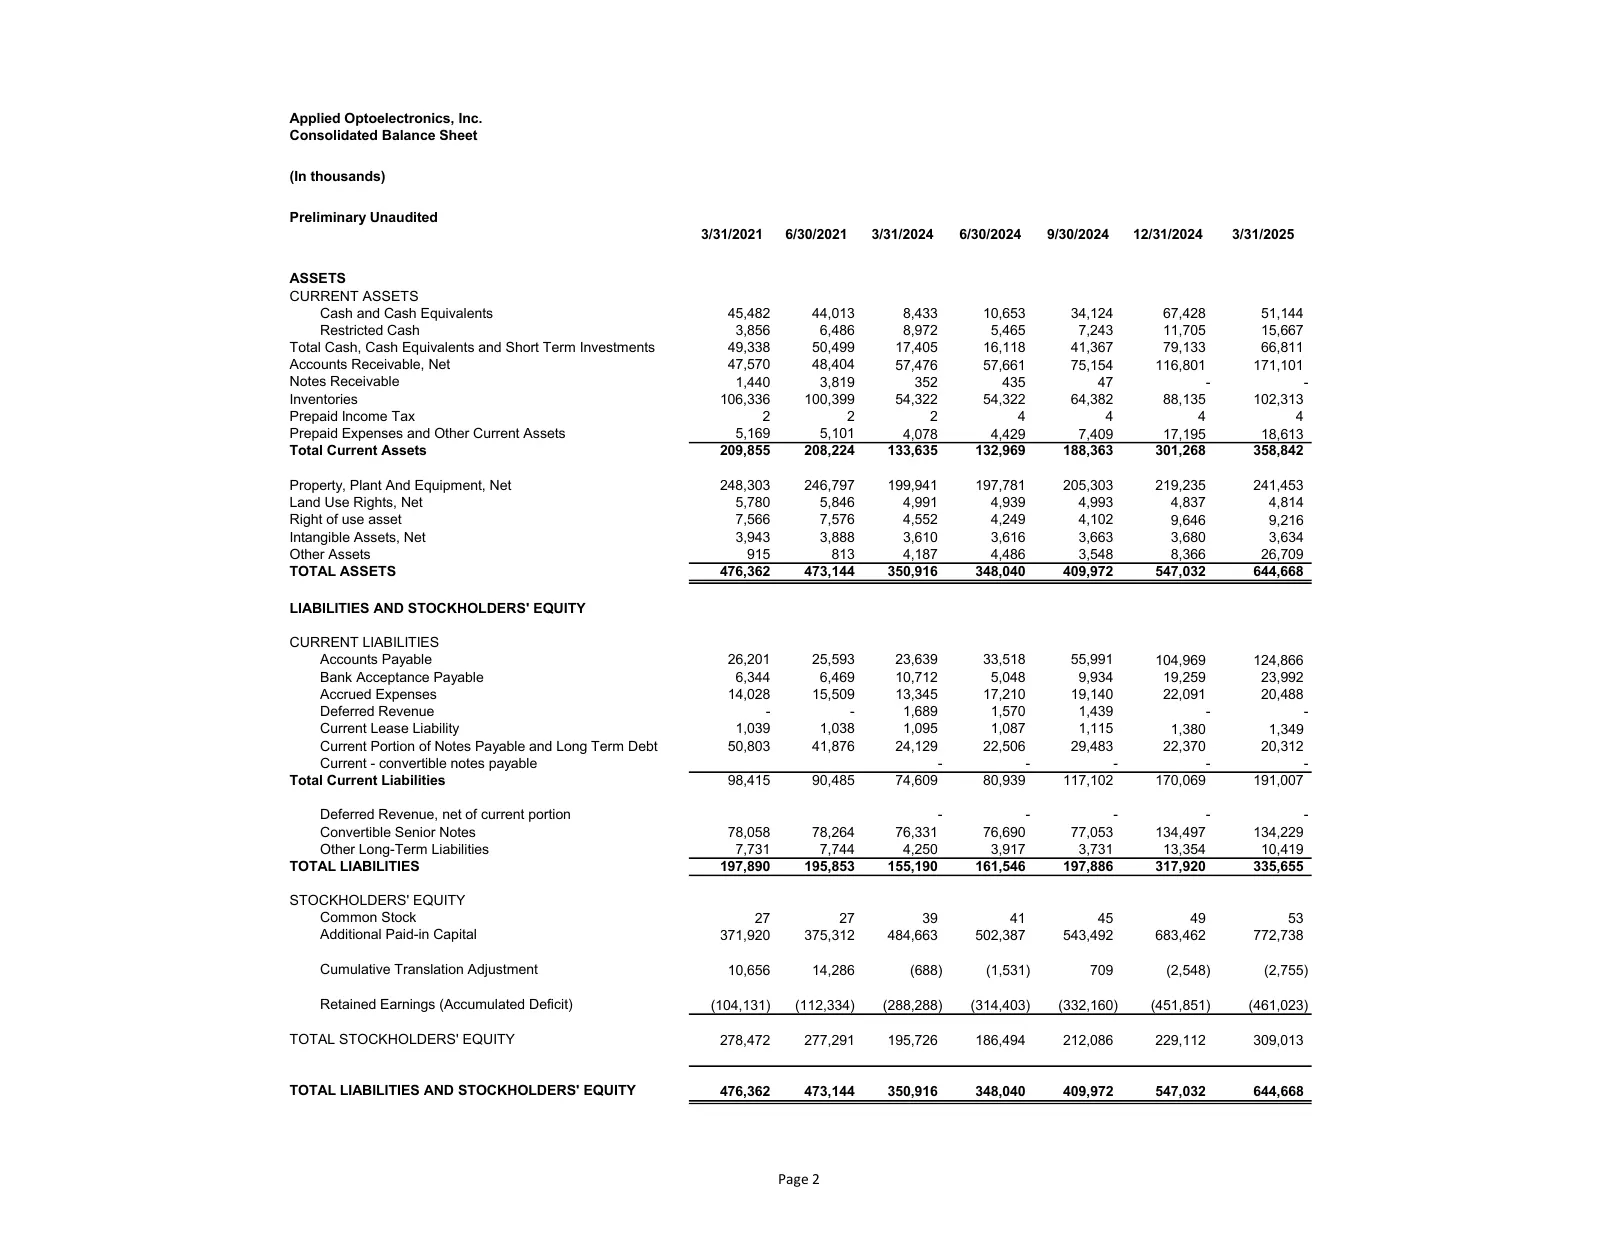
Slide 2: Consolidated Balance Sheet
Applied Optoelectronics, Inc. Consolidated Balance Sheet (In thousands) Preliminary Unaudited 3/31/2021 6/30/2021 3/31/2024 6/30/2024 9/30/2024 12/31/2024 3/31/2025 ASSETS CURRENT ASSETS Cash and Cash Equivalents 45,482 44,013 8,433 10,653 34,124 67,428 51,144 Restricted Cash 3,856 6,486 8,972 5,465
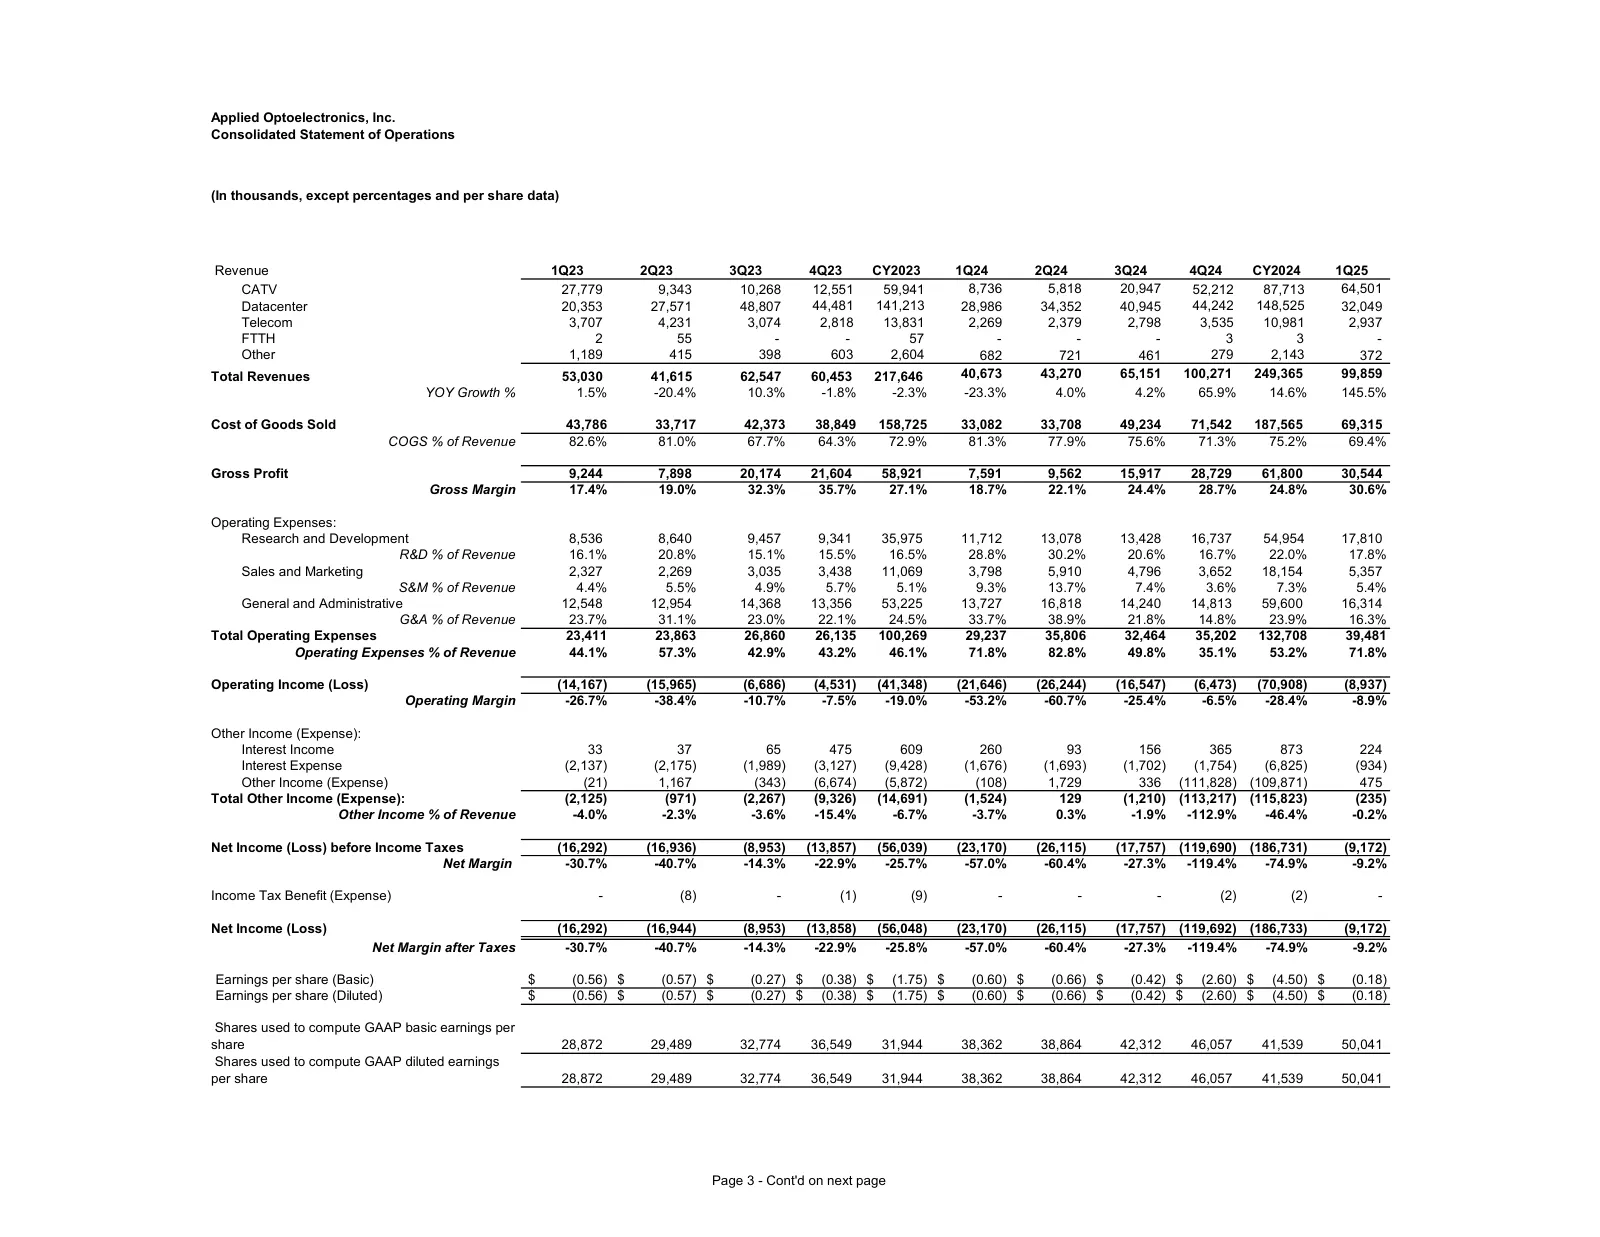
Slide 3: Consolidated Statement of Operations
Applied Optoelectronics, Inc. Consolidated Statement of Operations (In thousands, except percentages and per share data) Revenue 1Q23 2Q23 3Q23 4Q23 CY2023 1Q24 2Q24 3Q24 4Q24 CY2024 1Q25 CATV 27,779 9,343 10,268 12,551 59,941 8,736 5,818 20,947 52,212 87,713 64,501 Datacenter 20,353 27,571 48,807 4
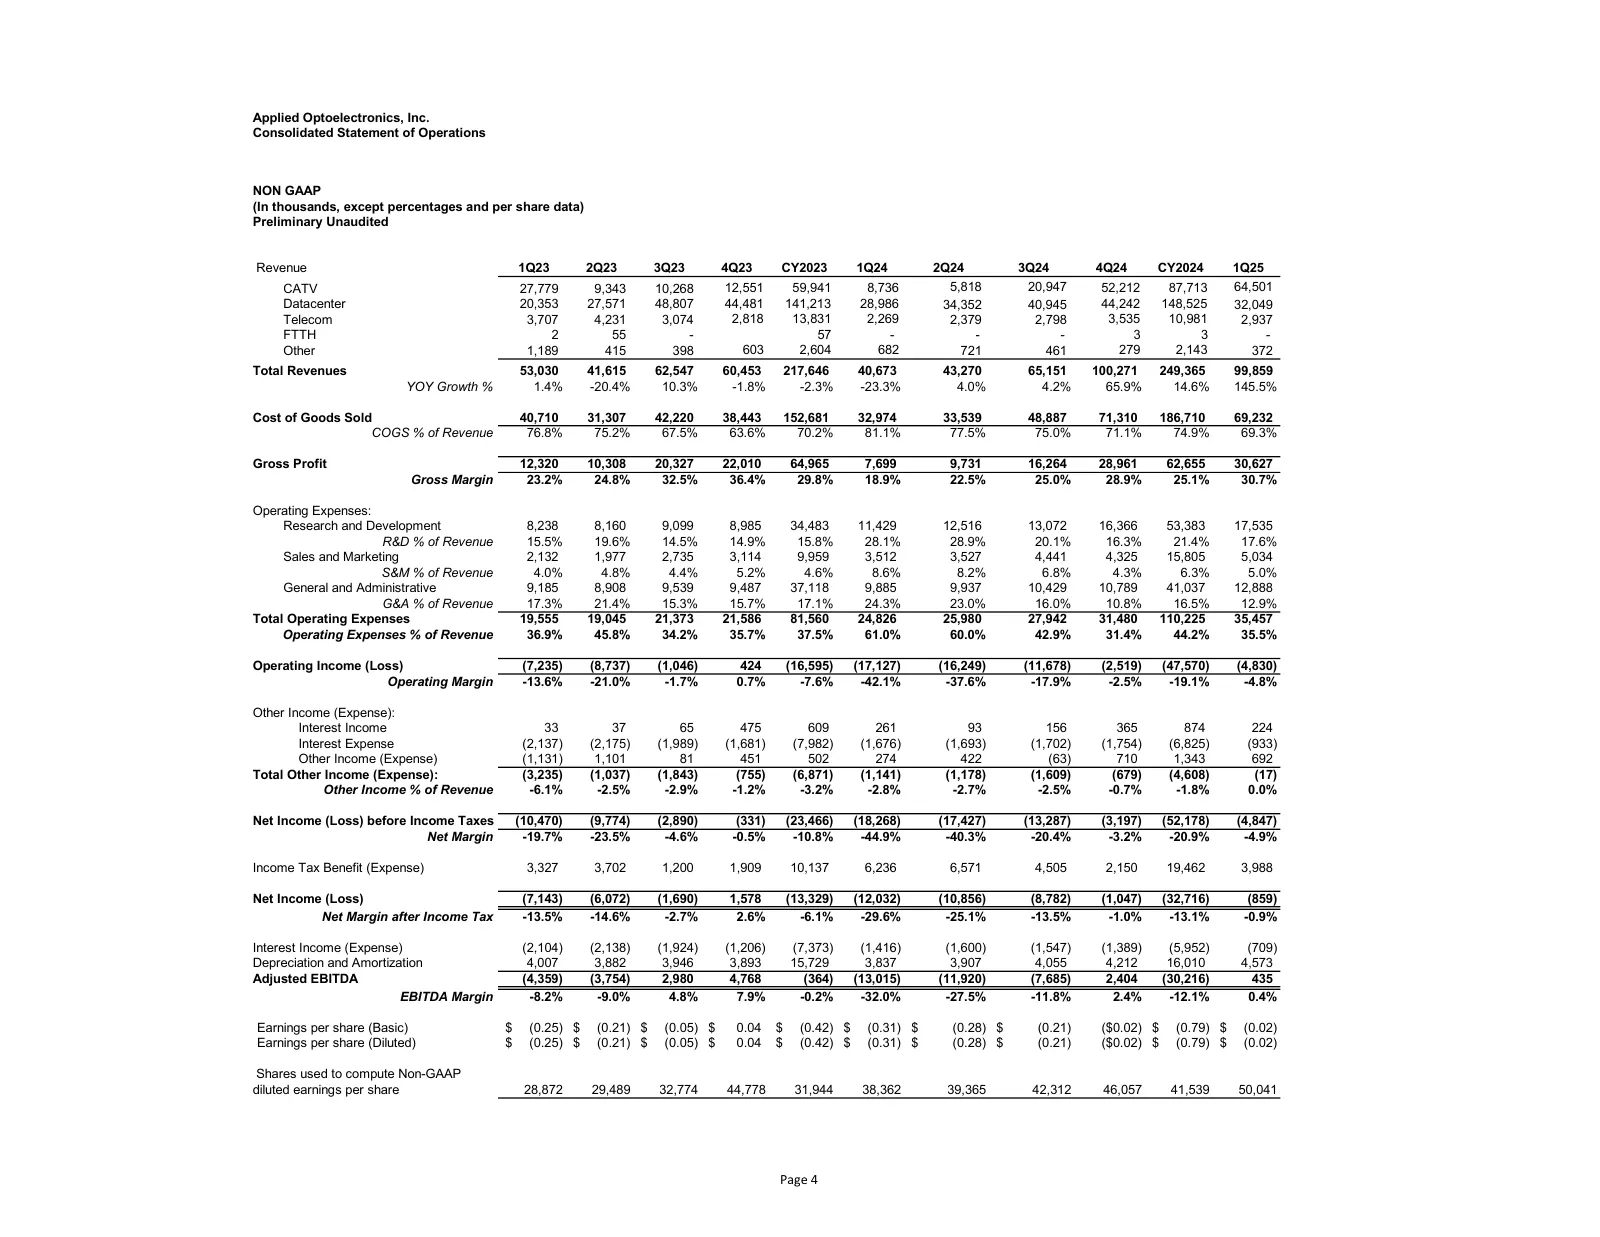
Slide 4: Statement of Operations (Non-GAAP)
Applied Optoelectronics, Inc. Consolidated Statement of Operations NON GAAP (In thousands, except percentages and per share data) Preliminary Unaudited Revenue 1Q23 2Q23 3Q23 4Q23 CY2023 1Q24 2Q24 3Q24 4Q24 CY2024 1Q25 CATV 27,779 9,343 10,268 12,551 59,941 8,736 5,818 20,947 52,212 87,713 64,501 Da
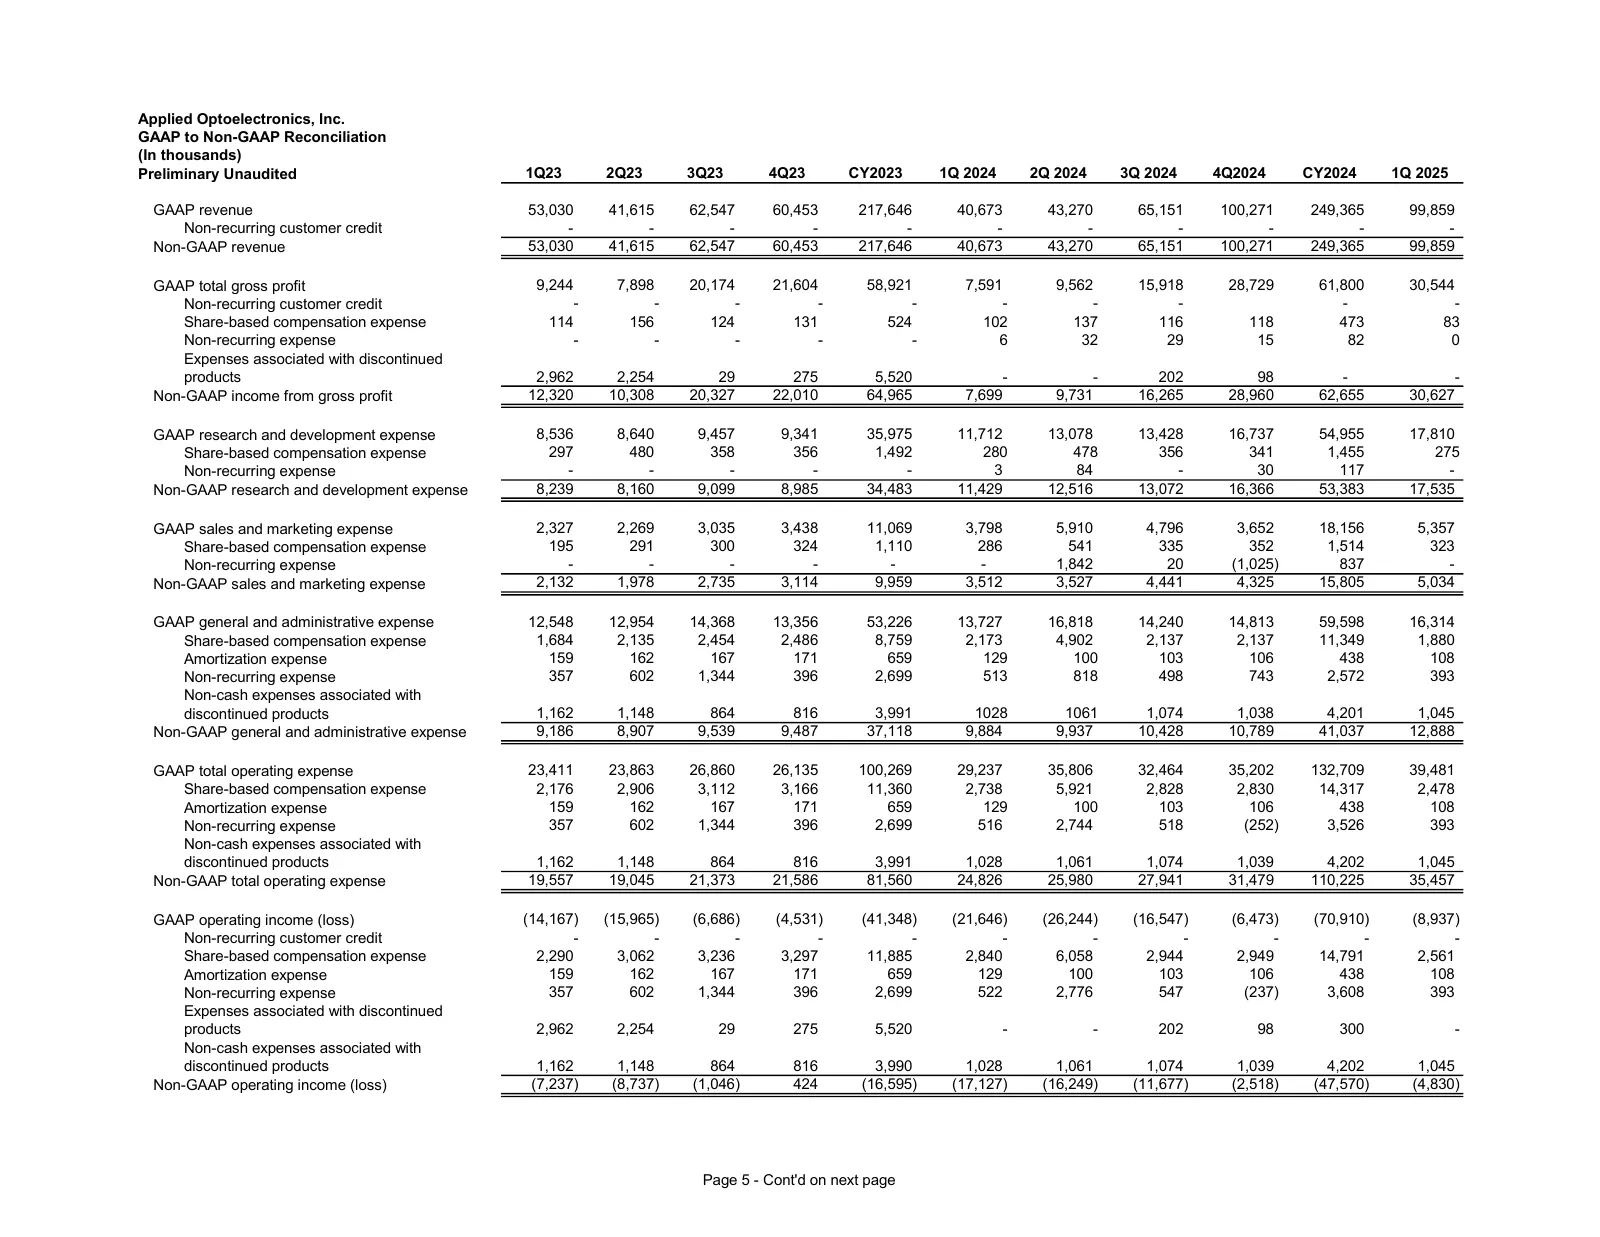
Slide 5: GAAP to Non-GAAP Reconciliation
Applied Optoelectronics, Inc. GAAP to Non-GAAP Reconciliation (In thousands) Preliminary Unaudited 1Q23 2Q23 3Q23 4Q23 CY2023 1Q 2024 2Q 2024 3Q 2024 4Q2024 CY2024 1Q 2025 GAAP revenue 53,030 41,615 62,547 60,453 217,646 40,673 43,270 65,151 100,271 249,365 99,859 Non-recurring customer credit - - -
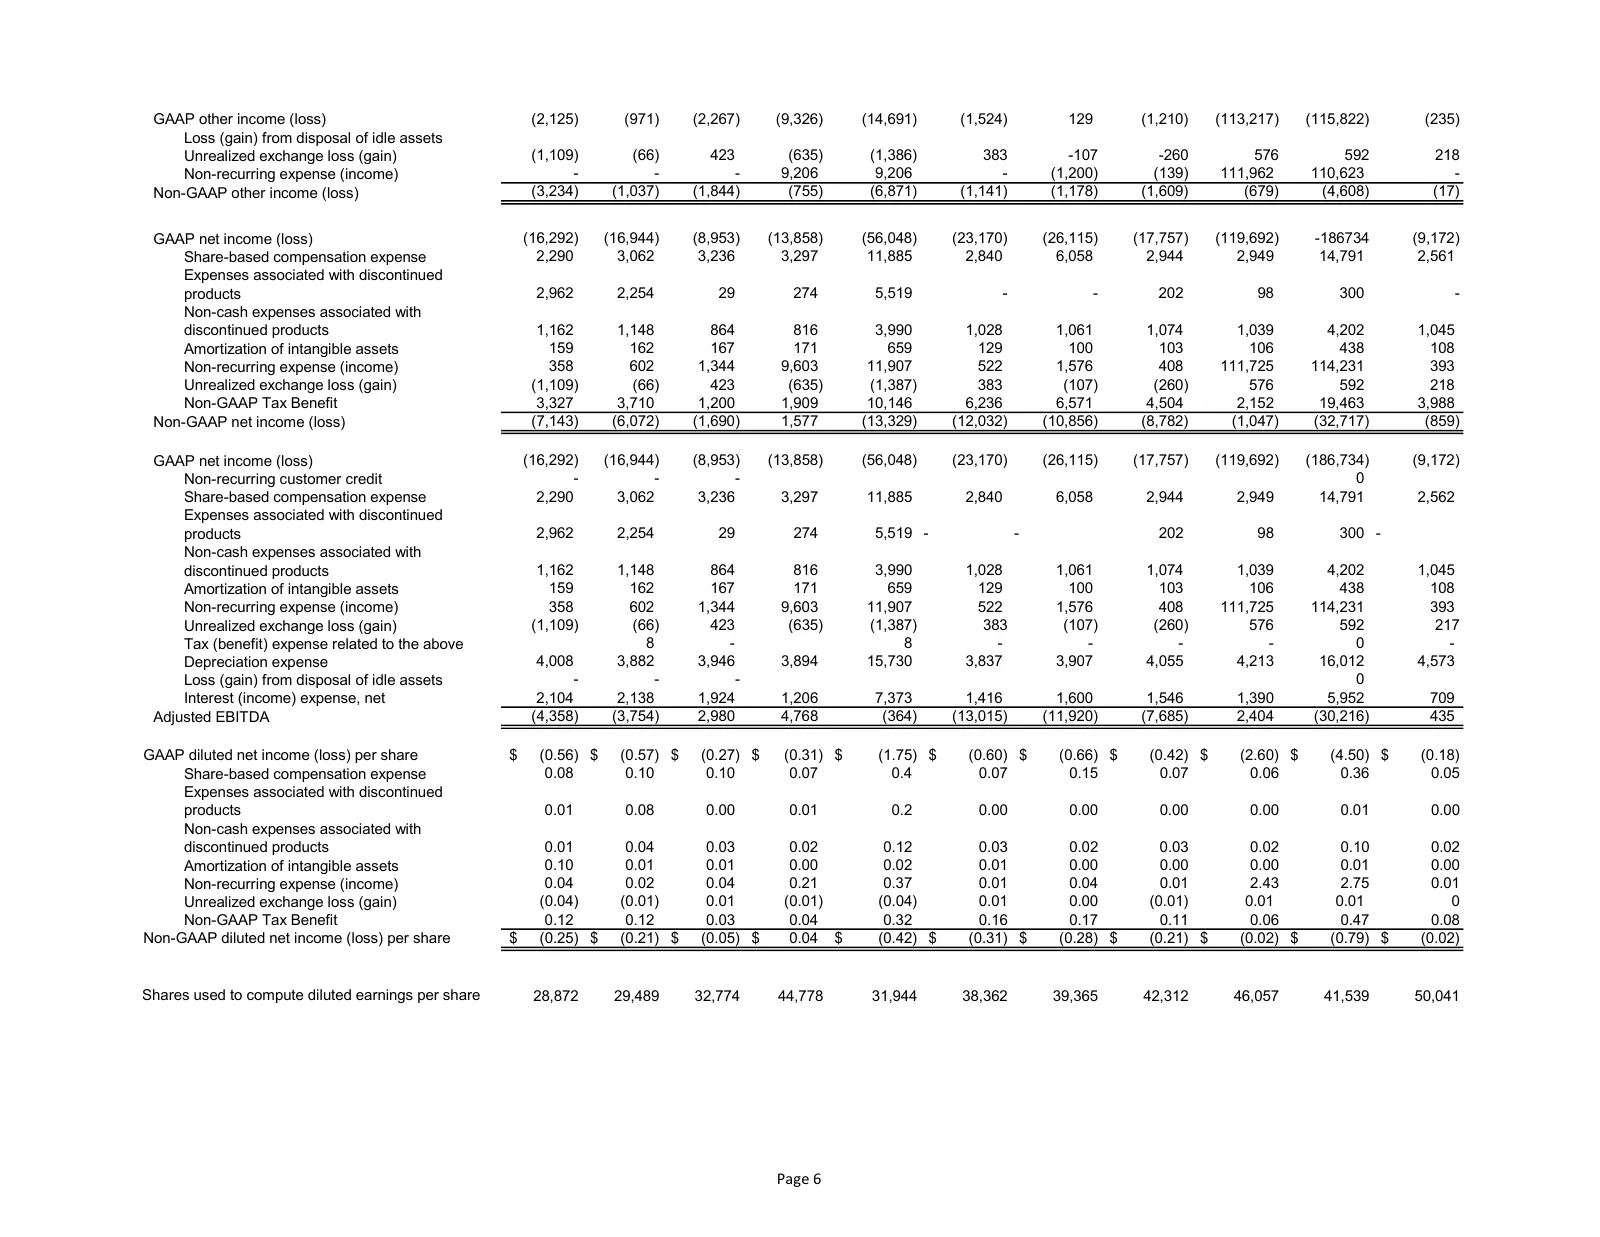
Slide 6: GAAP to Non-GAAP Reconciliation (continued)
GAAP other income (loss) (2,125) (971) (2,267) (9,326) (14,691) (1,524) 129 (1,210) (113,217) (115,822) (235) Loss (gain) from disposal of idle assets Unrealized exchange loss (gain) (1,109) (66) 423 (635) (1,386) 383 -107 -260 576 592 218 Non-recurring expense (income) - - - 9,206 9,206 - (1,200) (
Source: company website
More decks from Applied Optoelectronics, Inc.
 Q2 2026 Earnings Presentation32 slides · August 2026
 Investor Presentation (February 2026)33 slides · February 2026
 Q2 2024 Earnings Presentation30 slides · Aug 6, 2024
 Q2 2024 Earnings Presentation6 slides · August 2024
 Q1 2024 Earnings Presentation30 slides · May 9, 2024
 Q3 2023 Earnings Presentation31 slides · Nov 9, 2023