K+s AG · XETR:SDF
K+s — K+S Aktiengesellschaft — Non-Deal Roadshow (December 2016)
39 slides from K+s's roadshow presentation, Dec 8, 2016
Slide 1: Roadshow Amsterdam
K+S Aktiengesellschaft Roadshow Amsterdam 8 December 2016 Martin Heistermann, Senior Investor Relations Manager
Slide 2: Content
K+S Group Content A K+S’ Unique Strategic Position 1 Potash and Magnesium Products 2 Salt B Current Trading C Outlook K+S Group 2
Slide 3: Investment Case
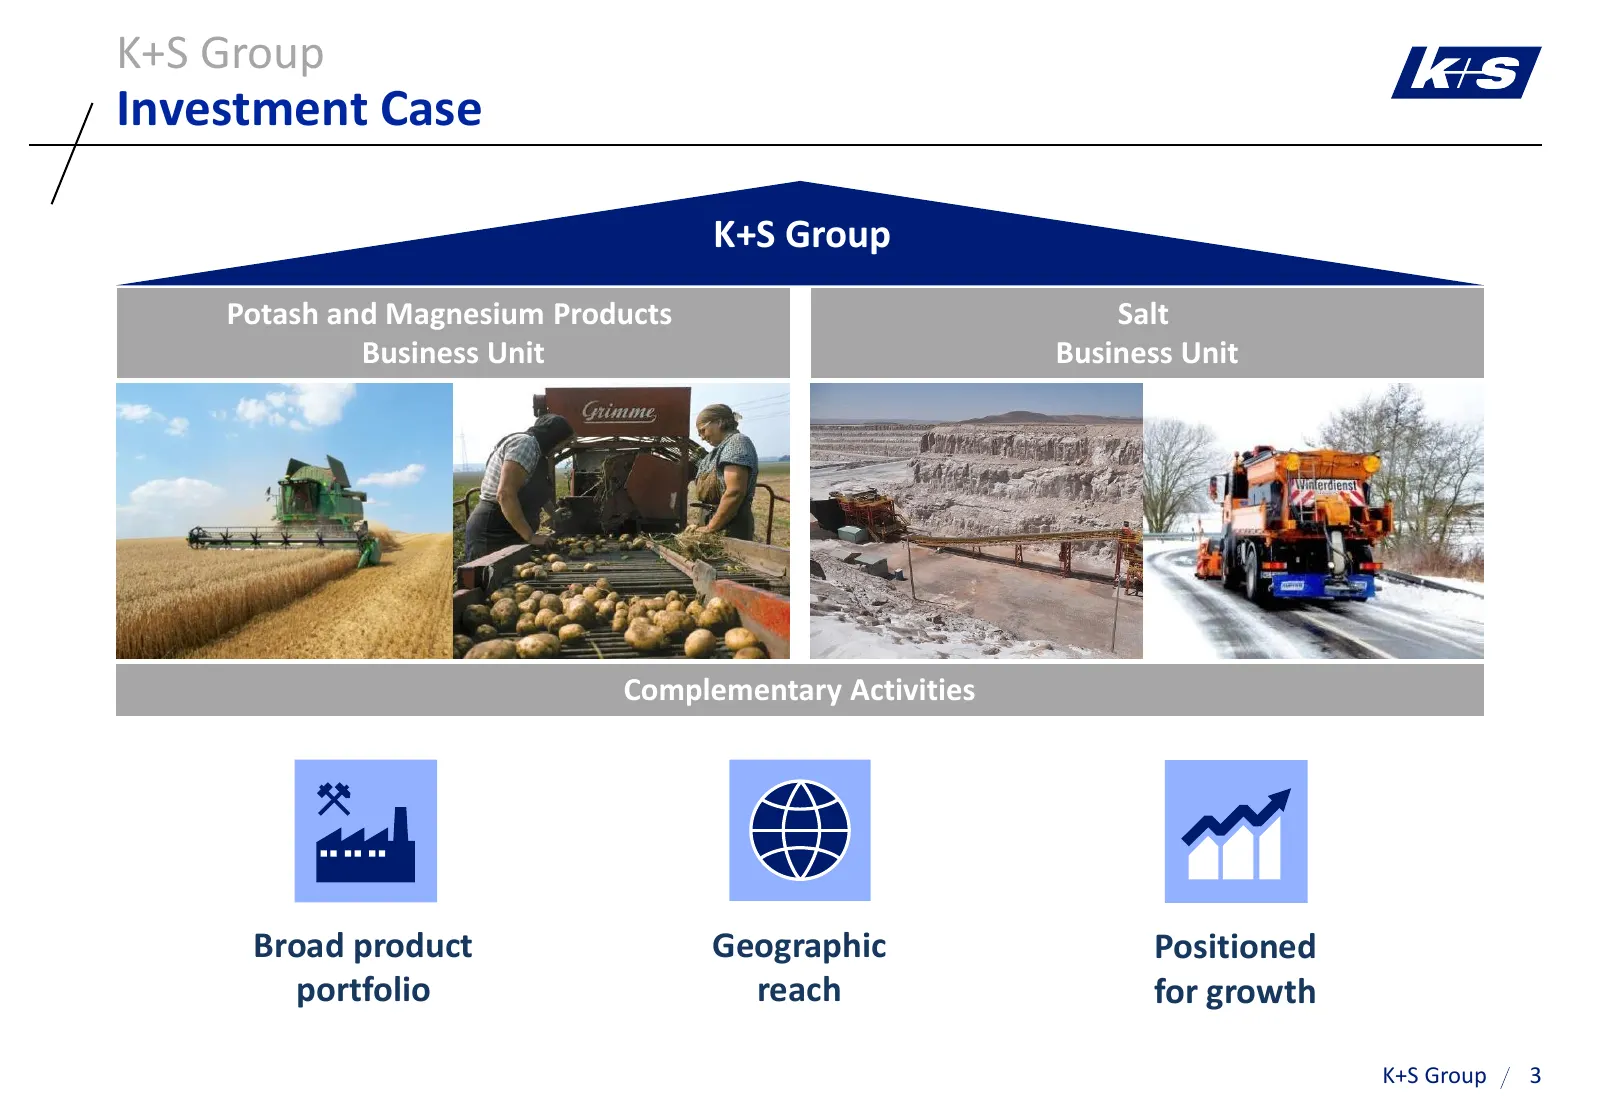
K+S Group Investment Case K+S Group Potash and Magnesium Products Salt Business Unit Business Unit Complementary Activities Broad product Geographic Positioned portfolio reach for growth K+S Group 3
Slide 4: Our Products
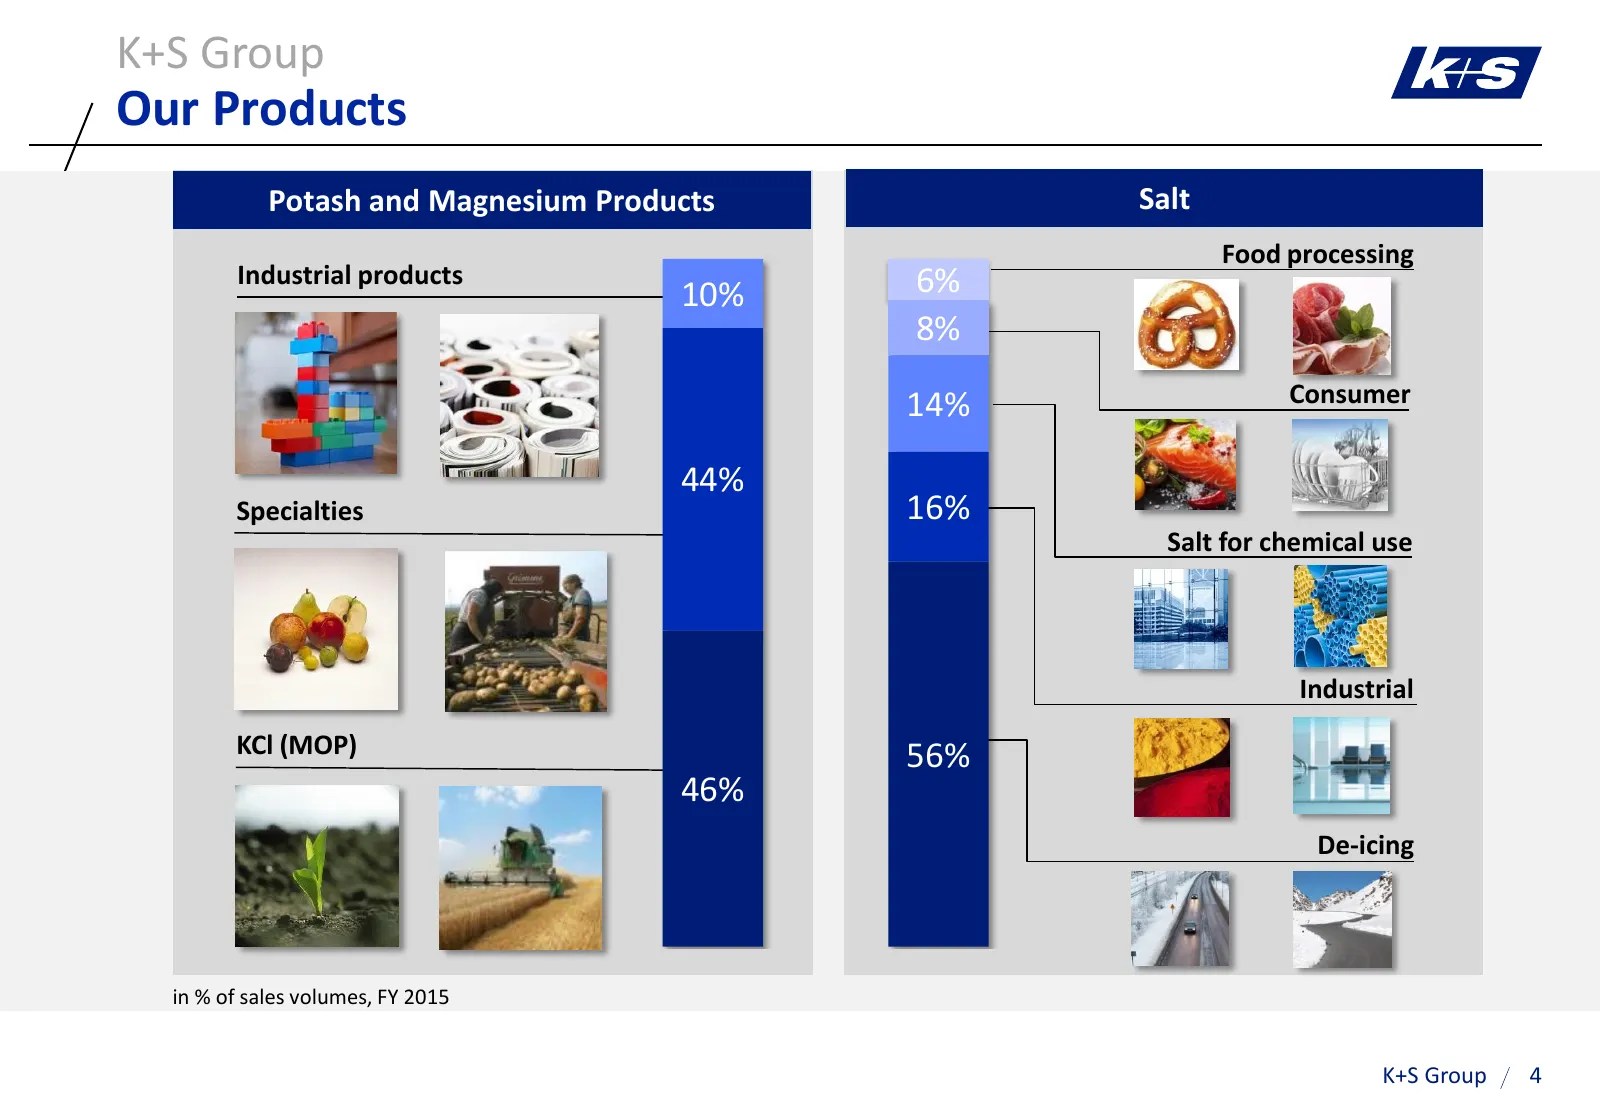
K+S Group Our Products Potash and Magnesium Products Salt Food processing Industrial products 6% 10% 8% 14% Consumer 44% Specialties 16% Salt for chemical use Industrial KCl (MOP) 56% 46% De-icing in % of sales volumes, FY 2015 K+S Group 4
Slide 5: Our Products
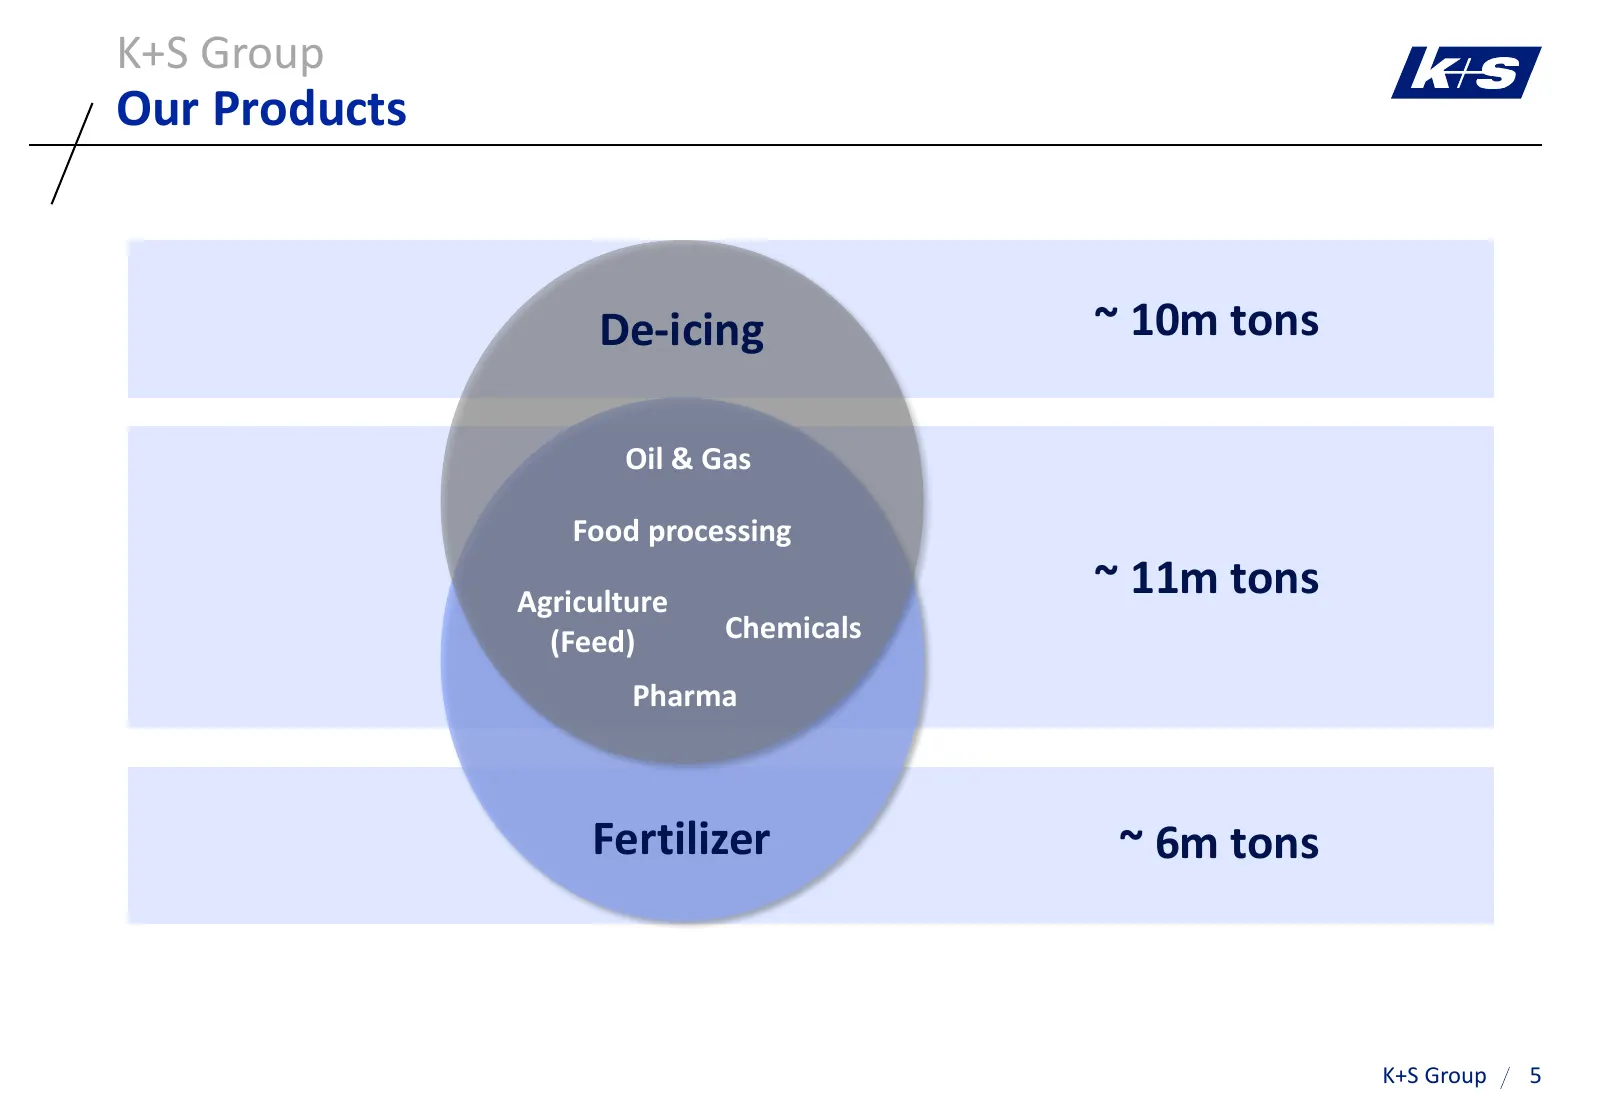
K+S Group Our Products De-icing ~ 10m tons Oil & Gas Food processing Agriculture ~ 11m tons (Feed) Chemicals Pharma Fertilizer ~ 6m tons K+S Group 5
Slide 6: From Capex to Cash
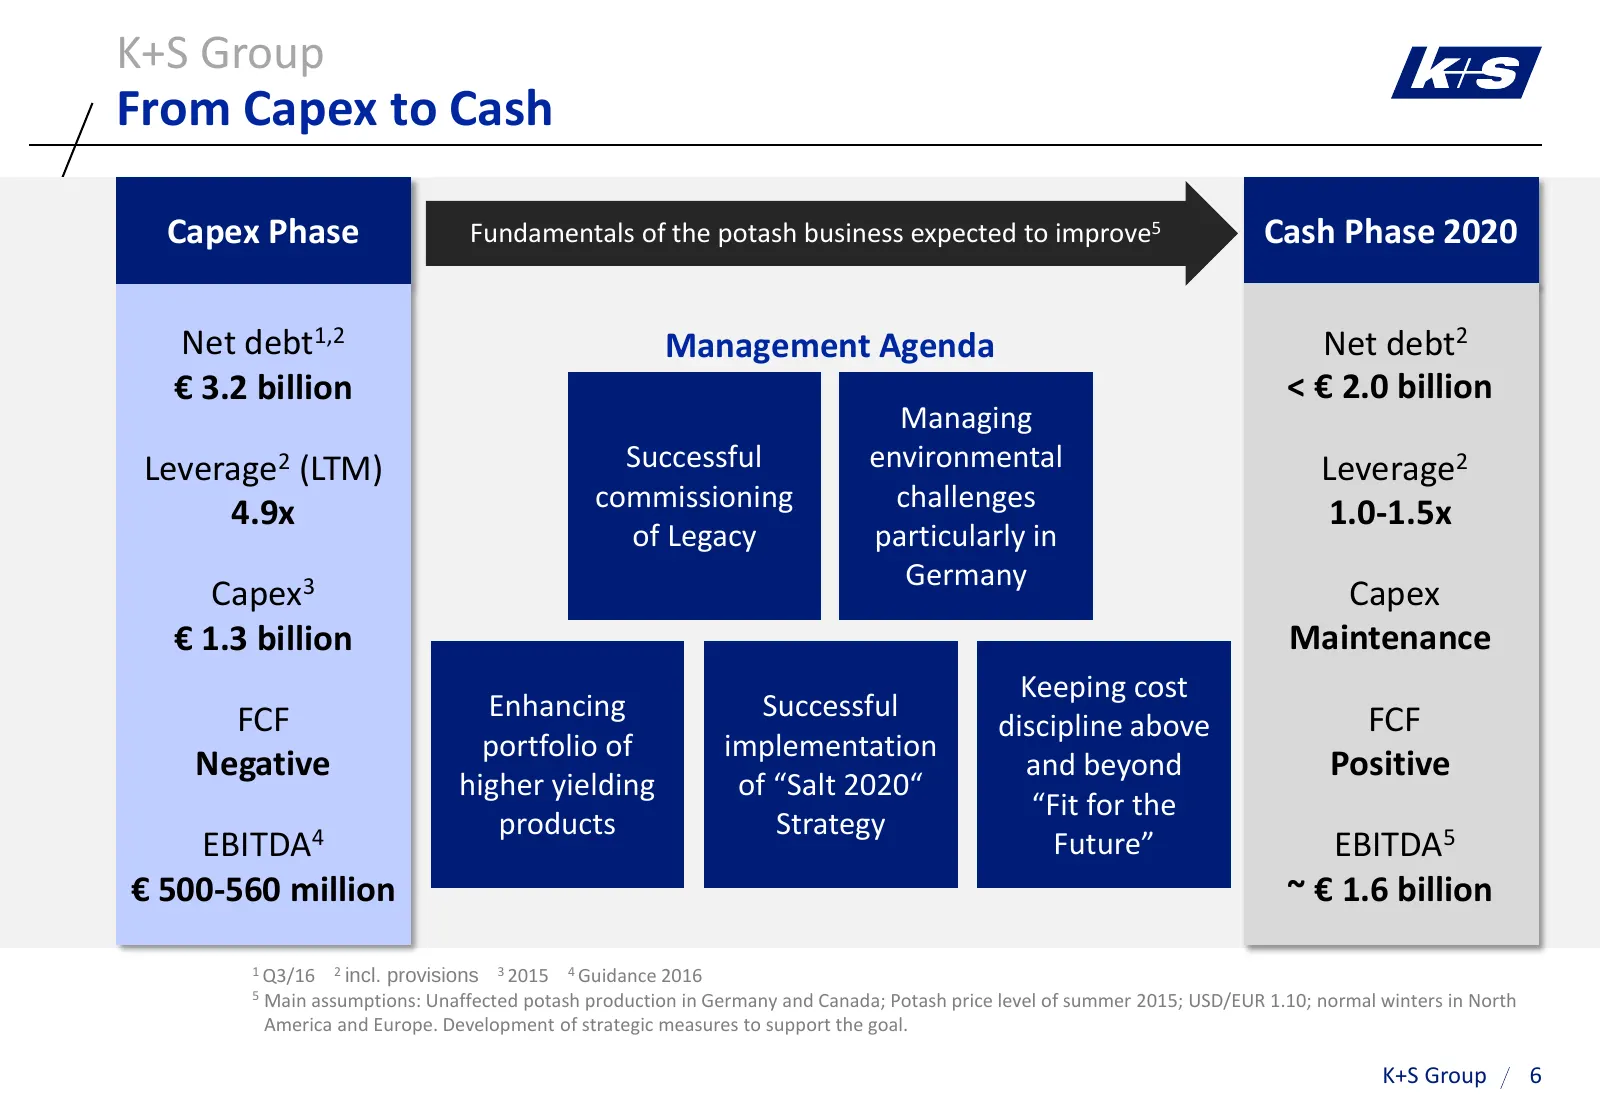
K+S Group From Capex to Cash Capex Phase Fundamentals of the potash business expected to improve5 Cash Phase 2020 Net debt1,2 Management Agenda Net debt2 € 3.2 billion < € 2.0 billion Managing Leverage2 (LTM) Successful environmental Leverage2 commissioning challenges 4.9x 1.0-1.5x of Legacy particu
Slide 7: Content
K+S Group Content A K+S’ Unique Strategic Position 1 Potash and Magnesium Products 2 Salt B Current Trading C Outlook K+S Group 7
Slide 8: Long-Term Dynamics Positive for Fertilizer
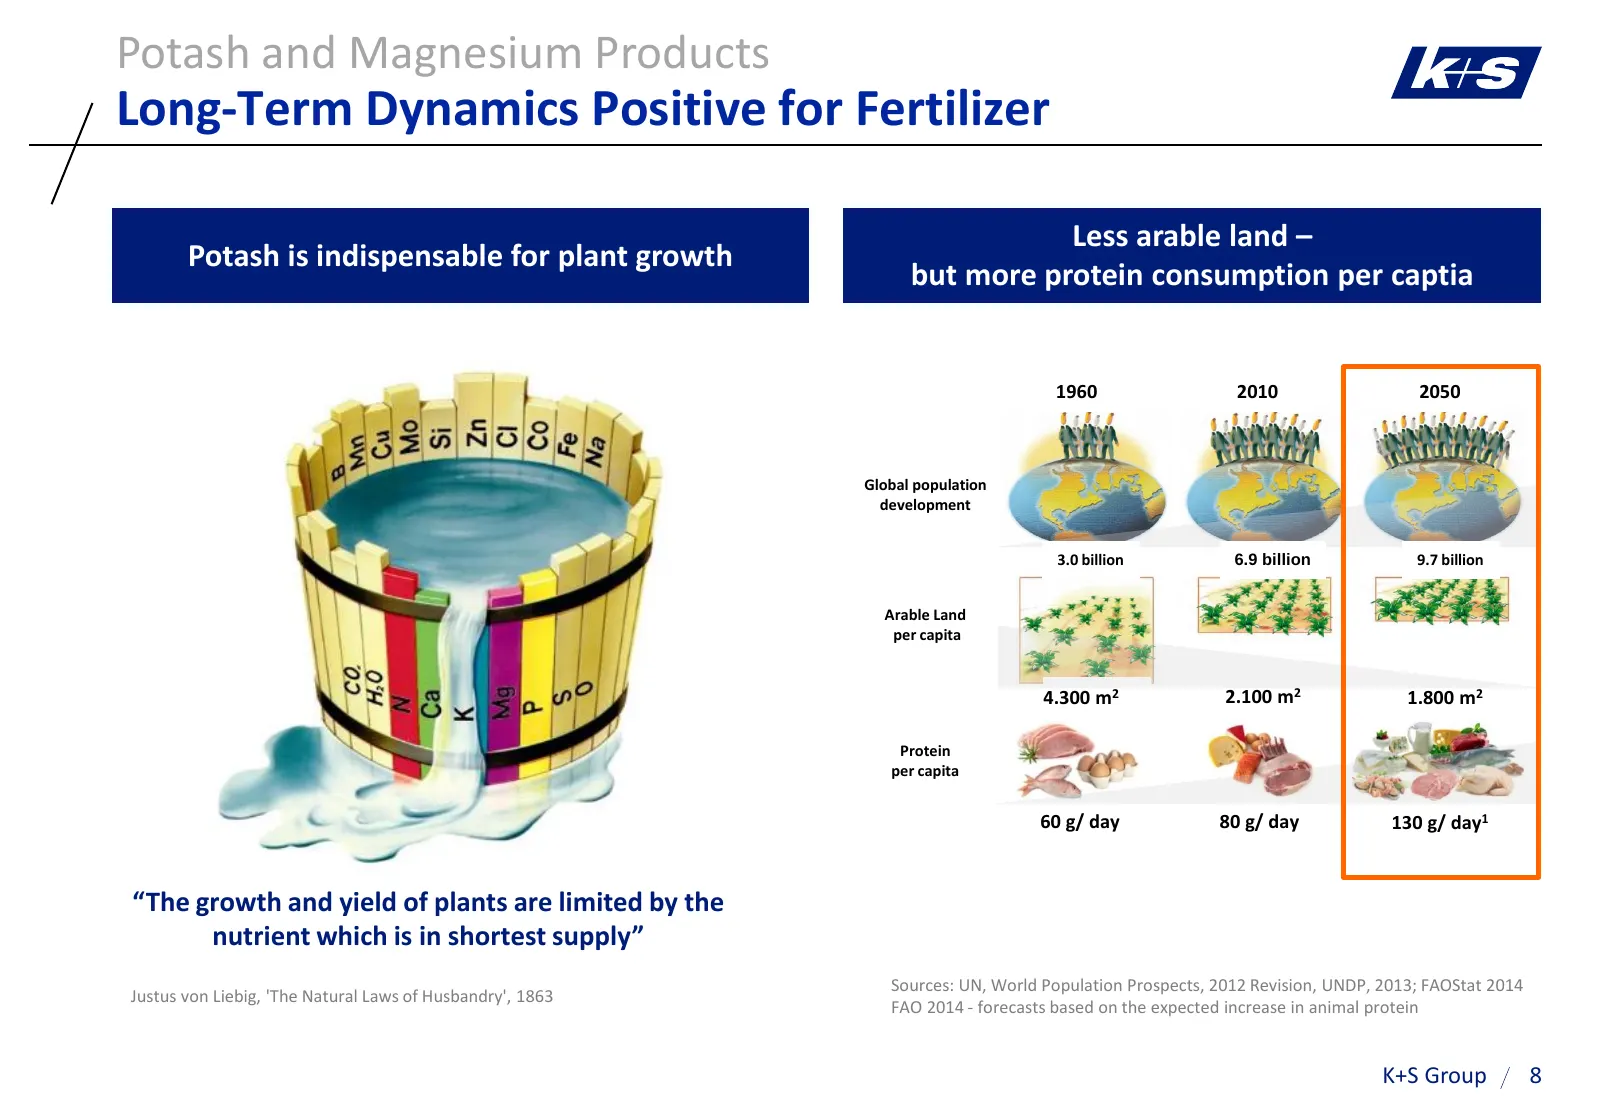
Potash and Magnesium Products Long-Term Dynamics Positive for Fertilizer Less arable land – Potash is indispensable for plant growth but more protein consumption per captia Jahr 1960 2010 2050 Global population development 3.0 billion 6.9 billion 9.7 billion Arable Land per capita 4.300 m2 2.100 m2
Slide 9: Utilizing Entire Range of Minerals in Complex Deposits
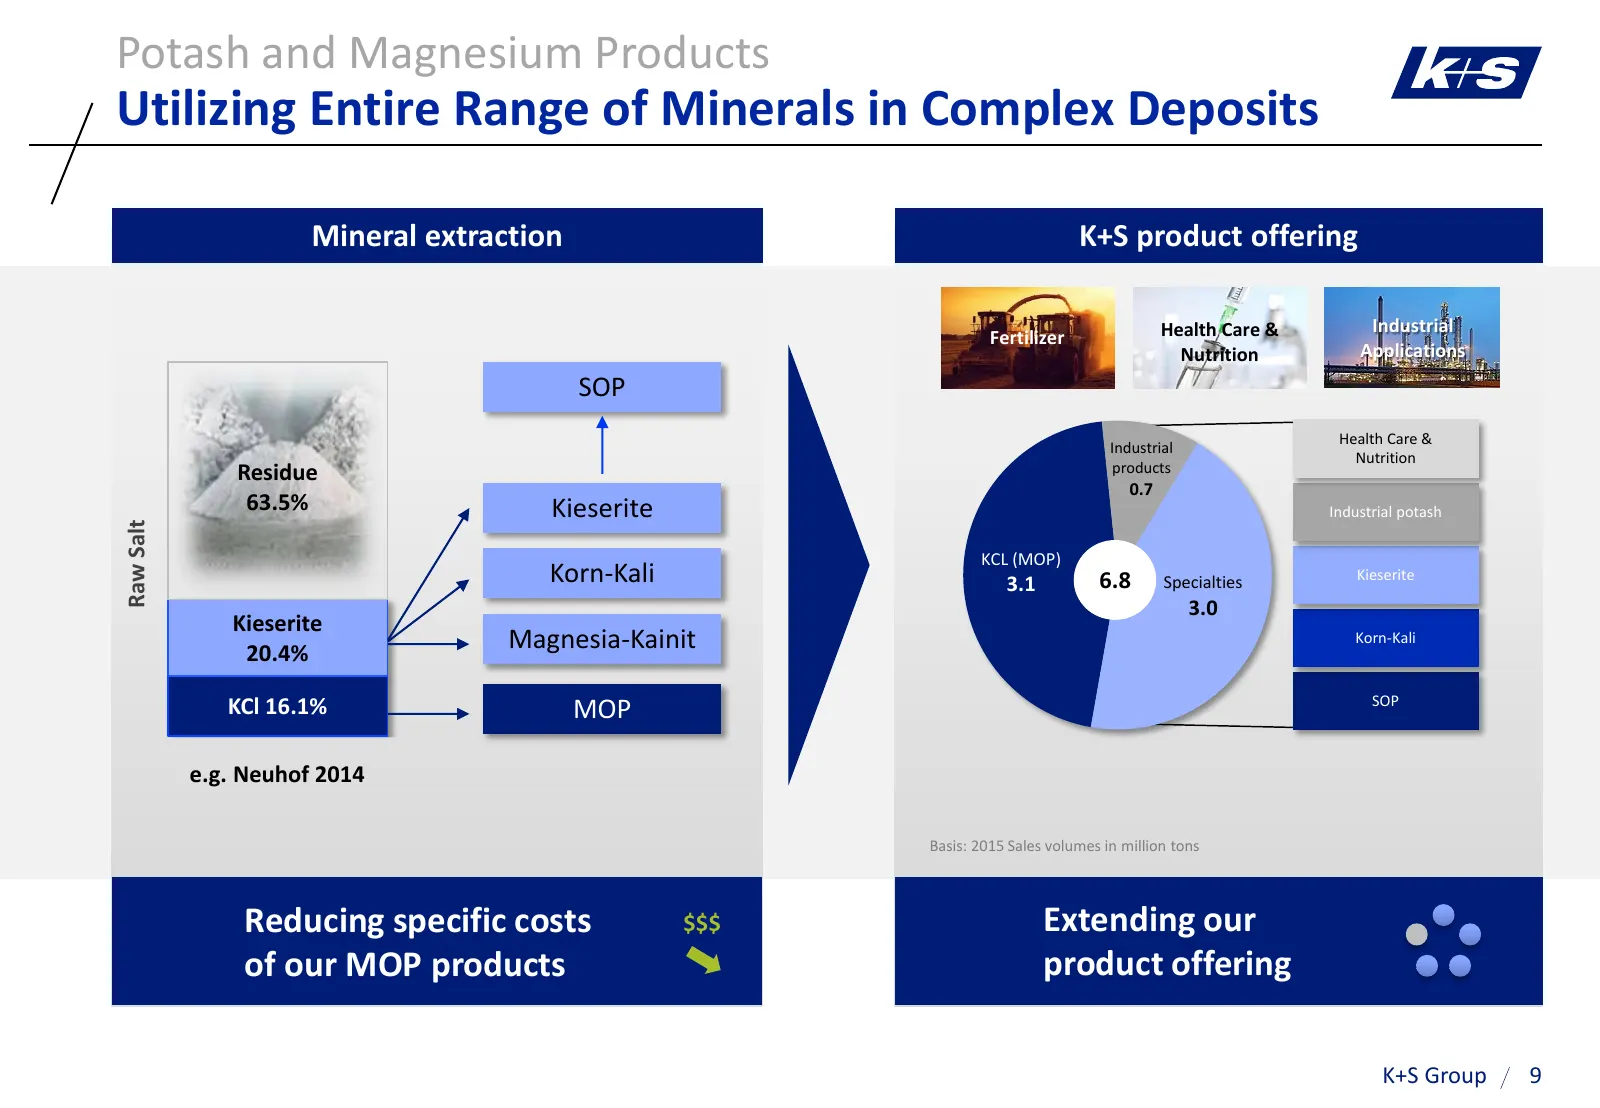
Potash and Magnesium Products Utilizing Entire Range of Minerals in Complex Deposits Mineral extraction K+S product offering Health Care & Industrial Fertilizer Nutrition Applications SOP Health Care & Industrial Nutrition Residue products 0.7 63.5% Kieserite Industrial potash Raw Salt KCL (MOP) Kor
Slide 10: Leading Position in Europe
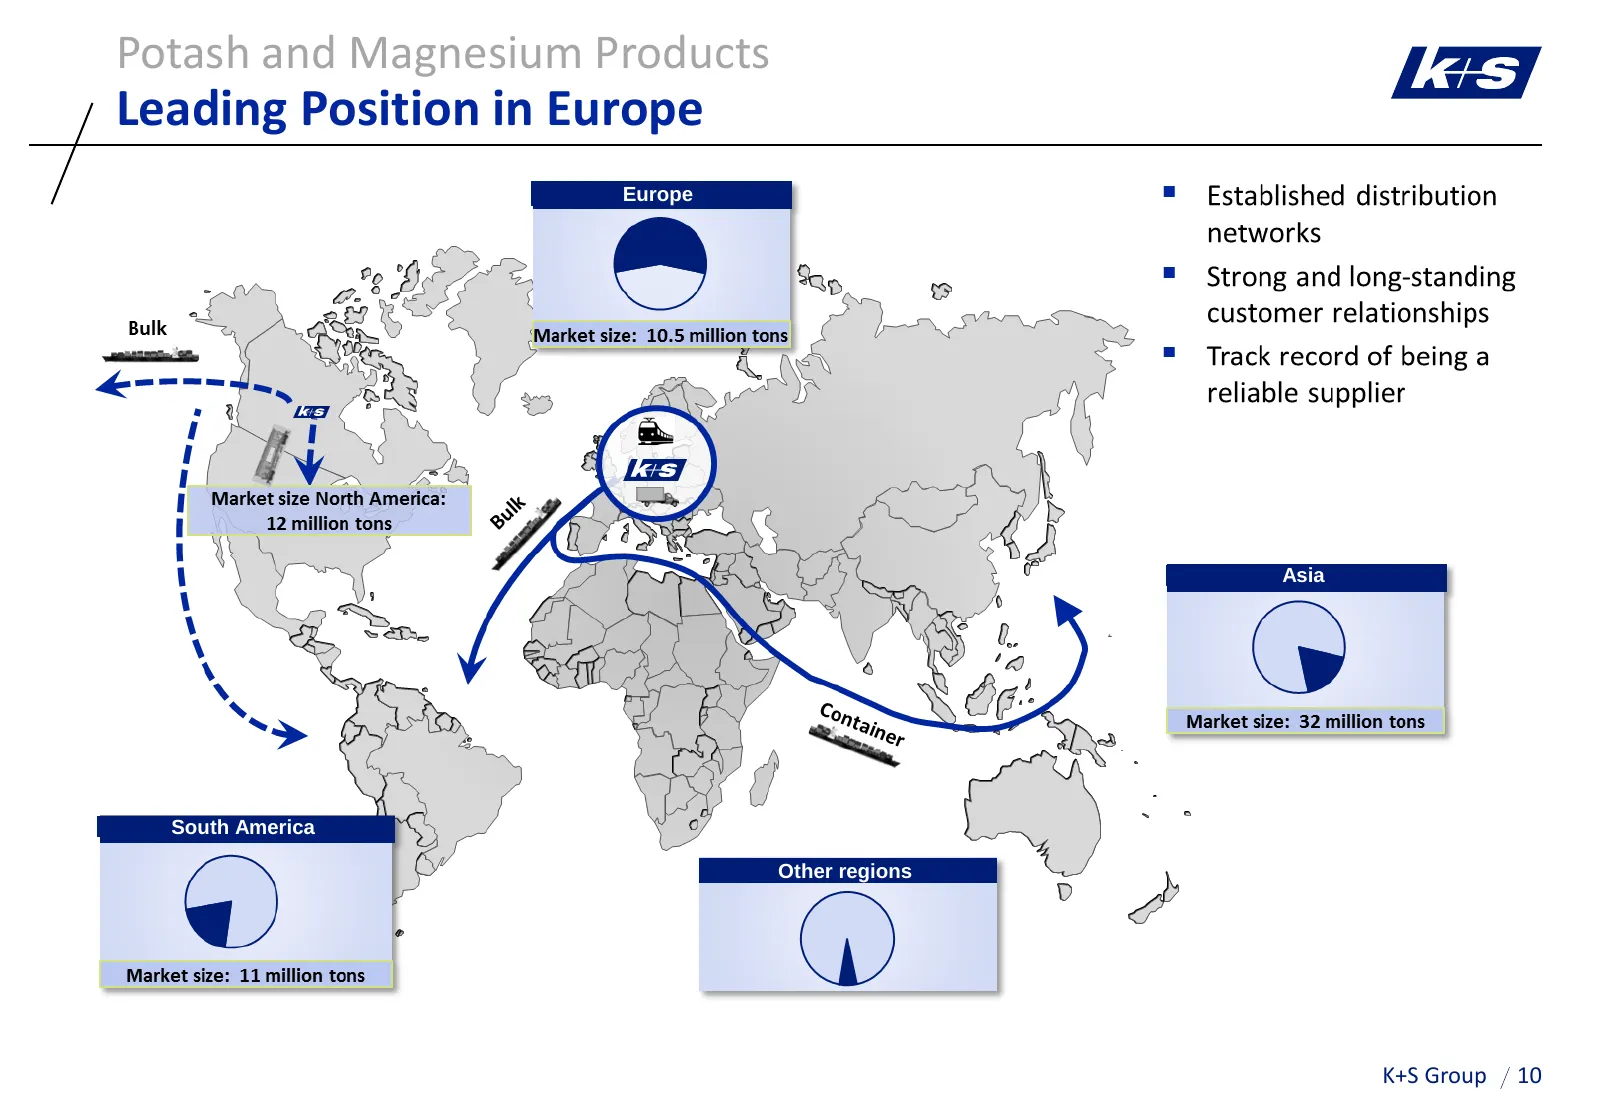
Potash and Magnesium Products Leading Position in Europe Europe Asia South America Other regions K+S Group 10
Slide 11: Our Unique Portfolio Makes Us More Robust
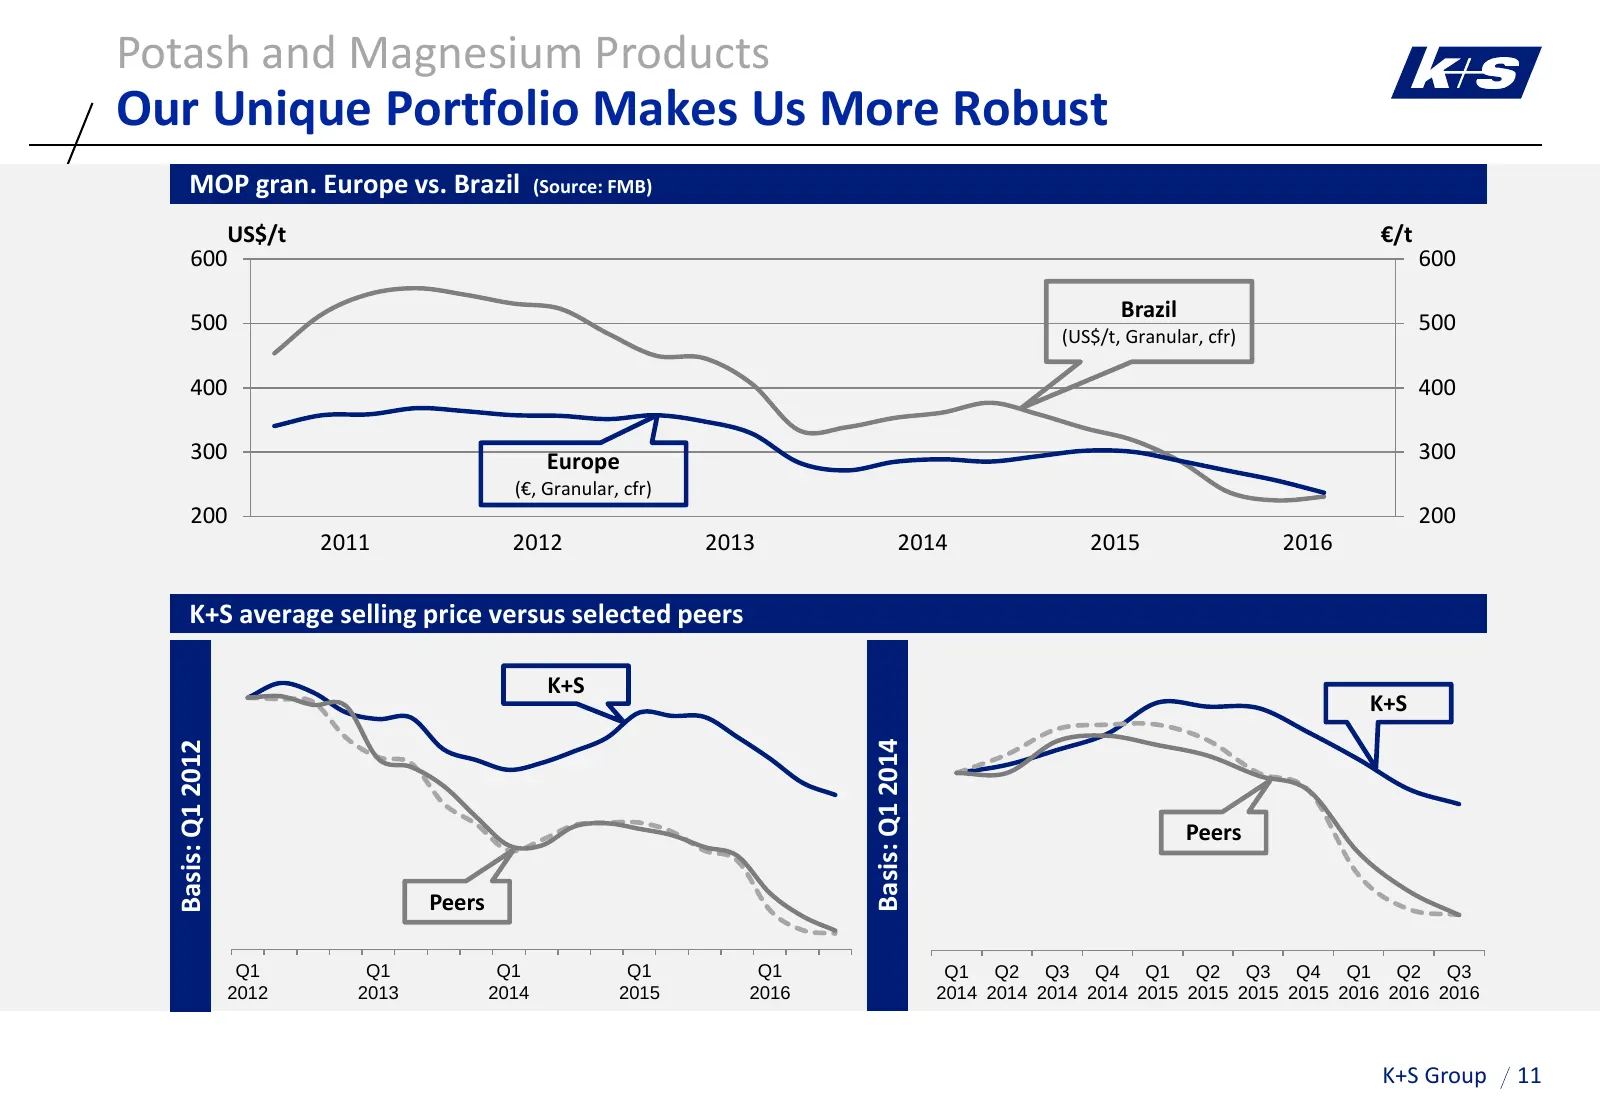
Potash and Magnesium Products Our Unique Portfolio Makes Us More Robust MOP gran. Europe vs. Brazil (Source: FMB) US$/t €/t 600 600 Brazil 500 500 (US$/t, Granular, cfr) 400 400 300 Europe 300 (€, Granular, cfr) 200 200 2011 2012 2013 2014 2015 2016 K+S average selling price versus selected peers K+
Slide 12: Environmental Roadmap
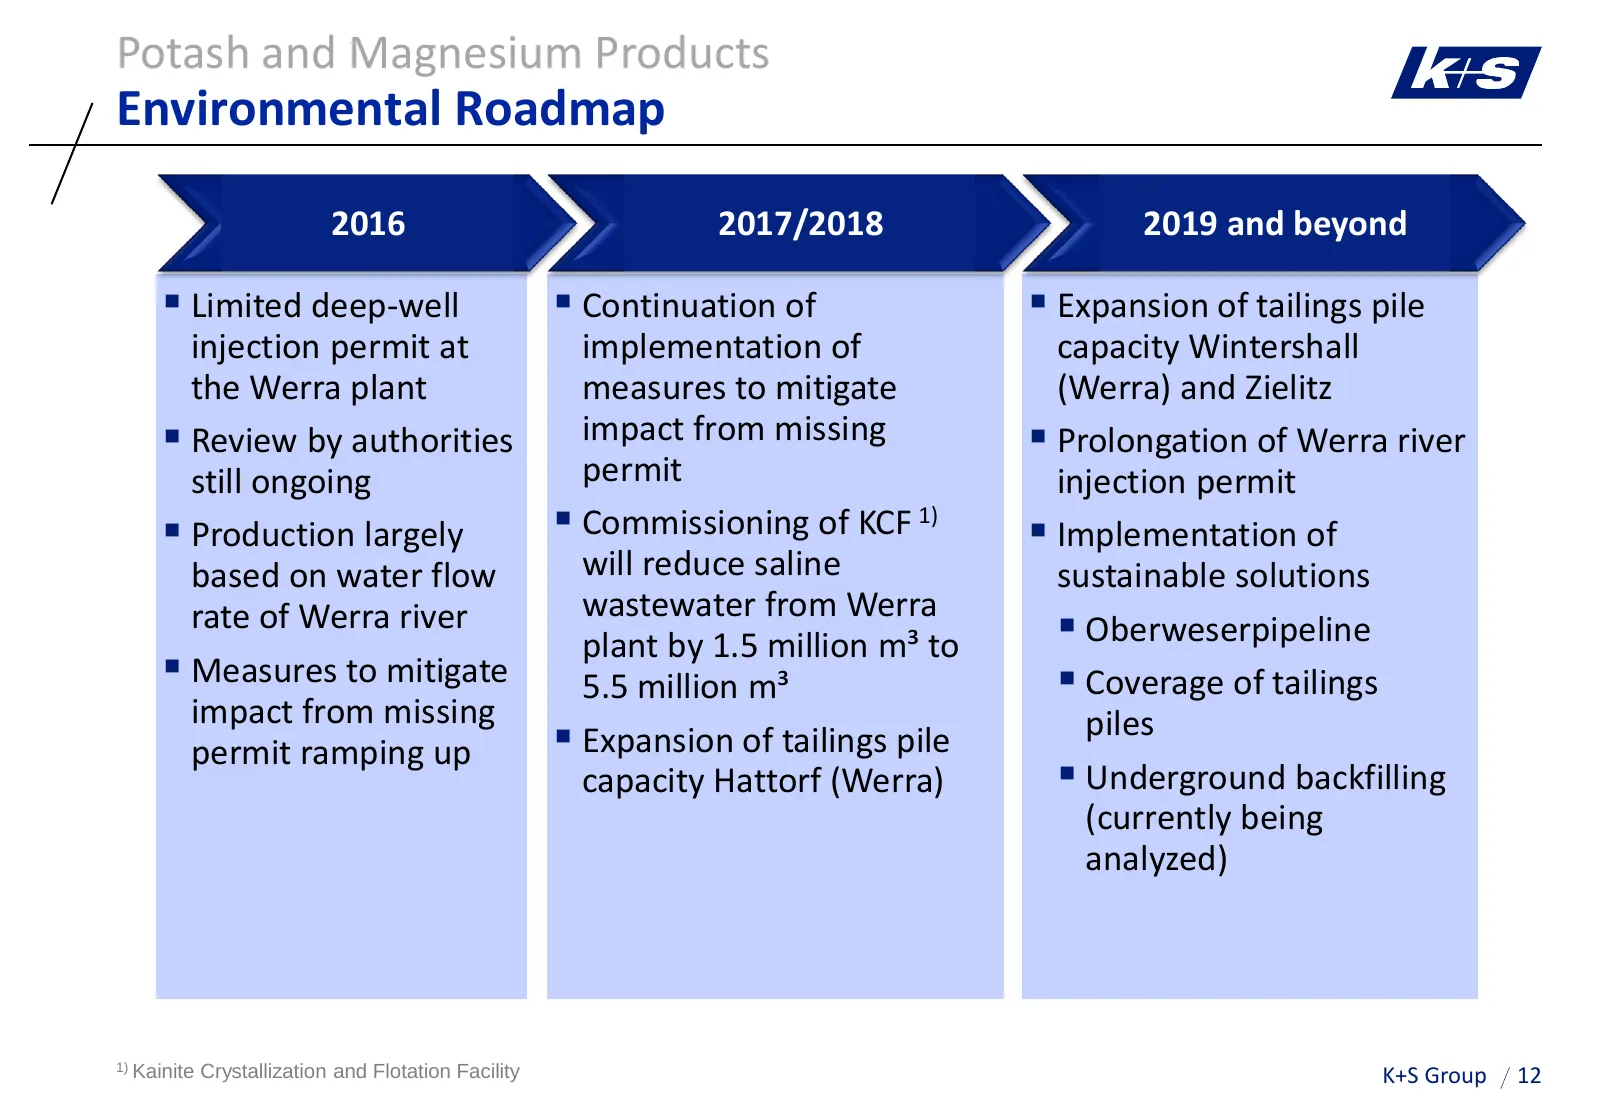
Potash and Magnesium Products Environmental Roadmap 2016 2017/2018 2019 and beyond Limited deep-well Continuation of Expansion of tailings pile injection permit at implementation of capacity Wintershall the Werra plant measures to mitigate (Werra) and Zielitz Review by authorities impact fro
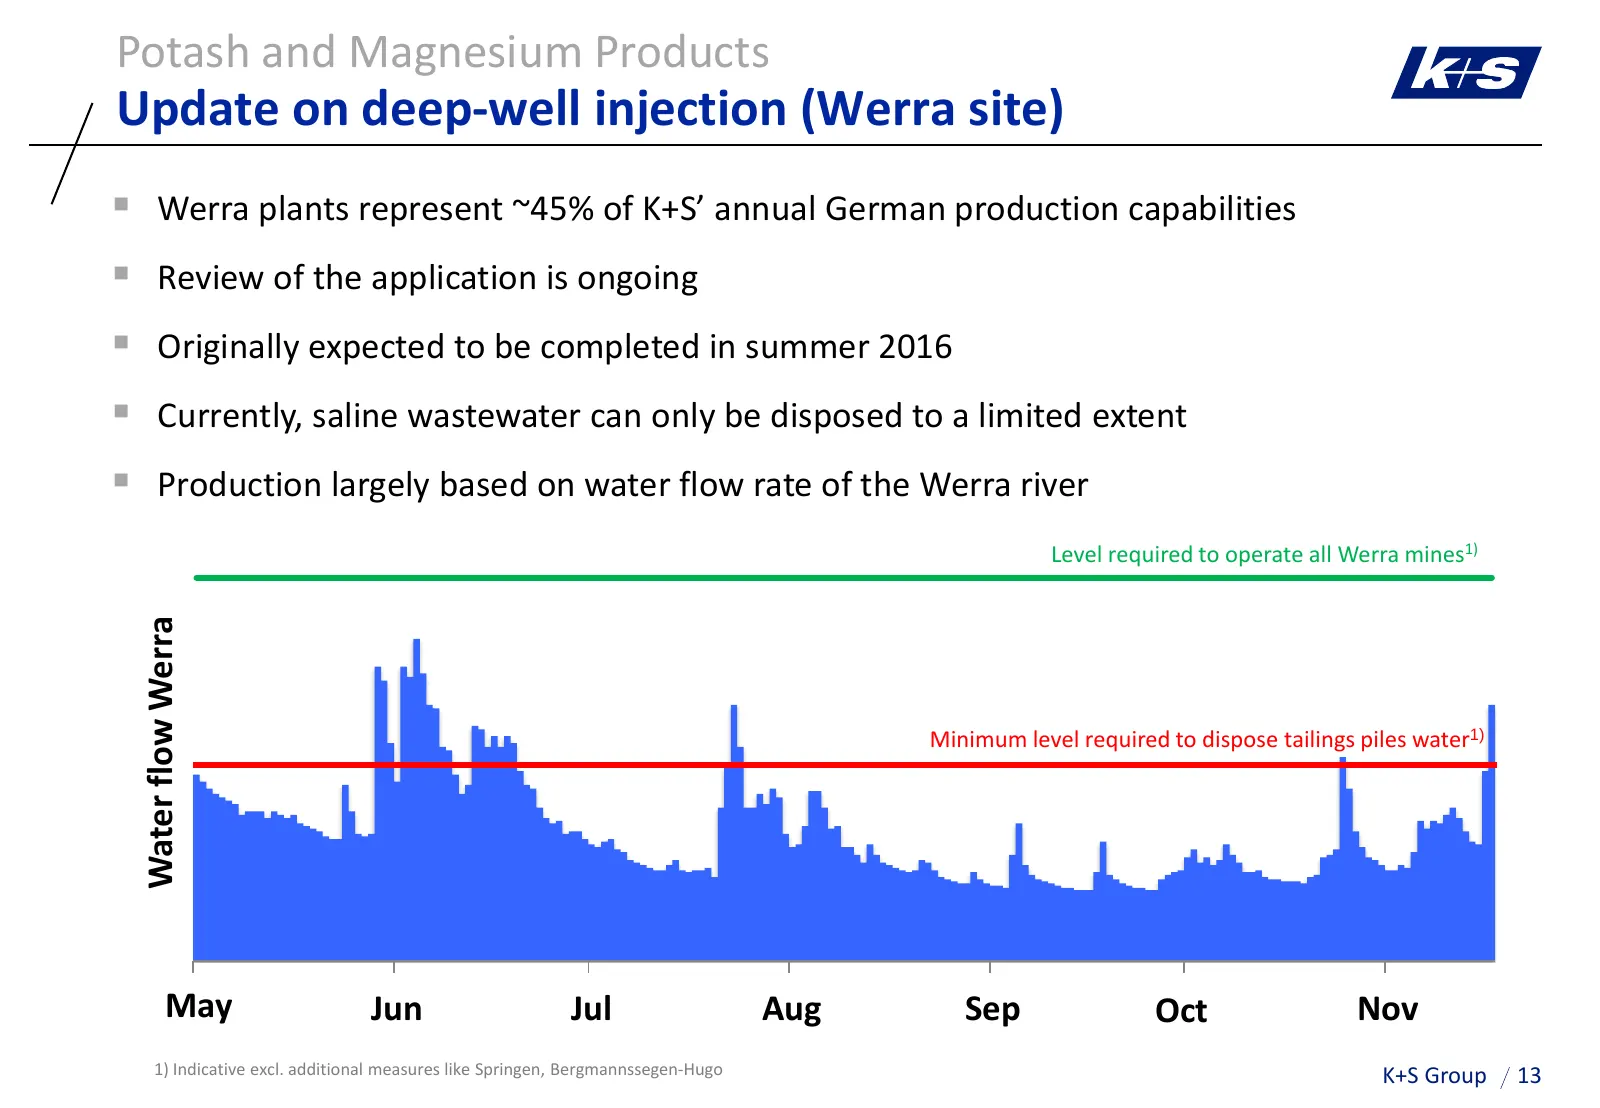
Slide 13: Update on deep-well injection (Werra site)
Potash and Magnesium Products Update on deep-well injection (Werra site) Werra plants represent ~45% of K+S’ annual German production capabilities Review of the application is ongoing Originally expected to be completed in summer 2016 Currently, saline wastewater can only be disposed to a li
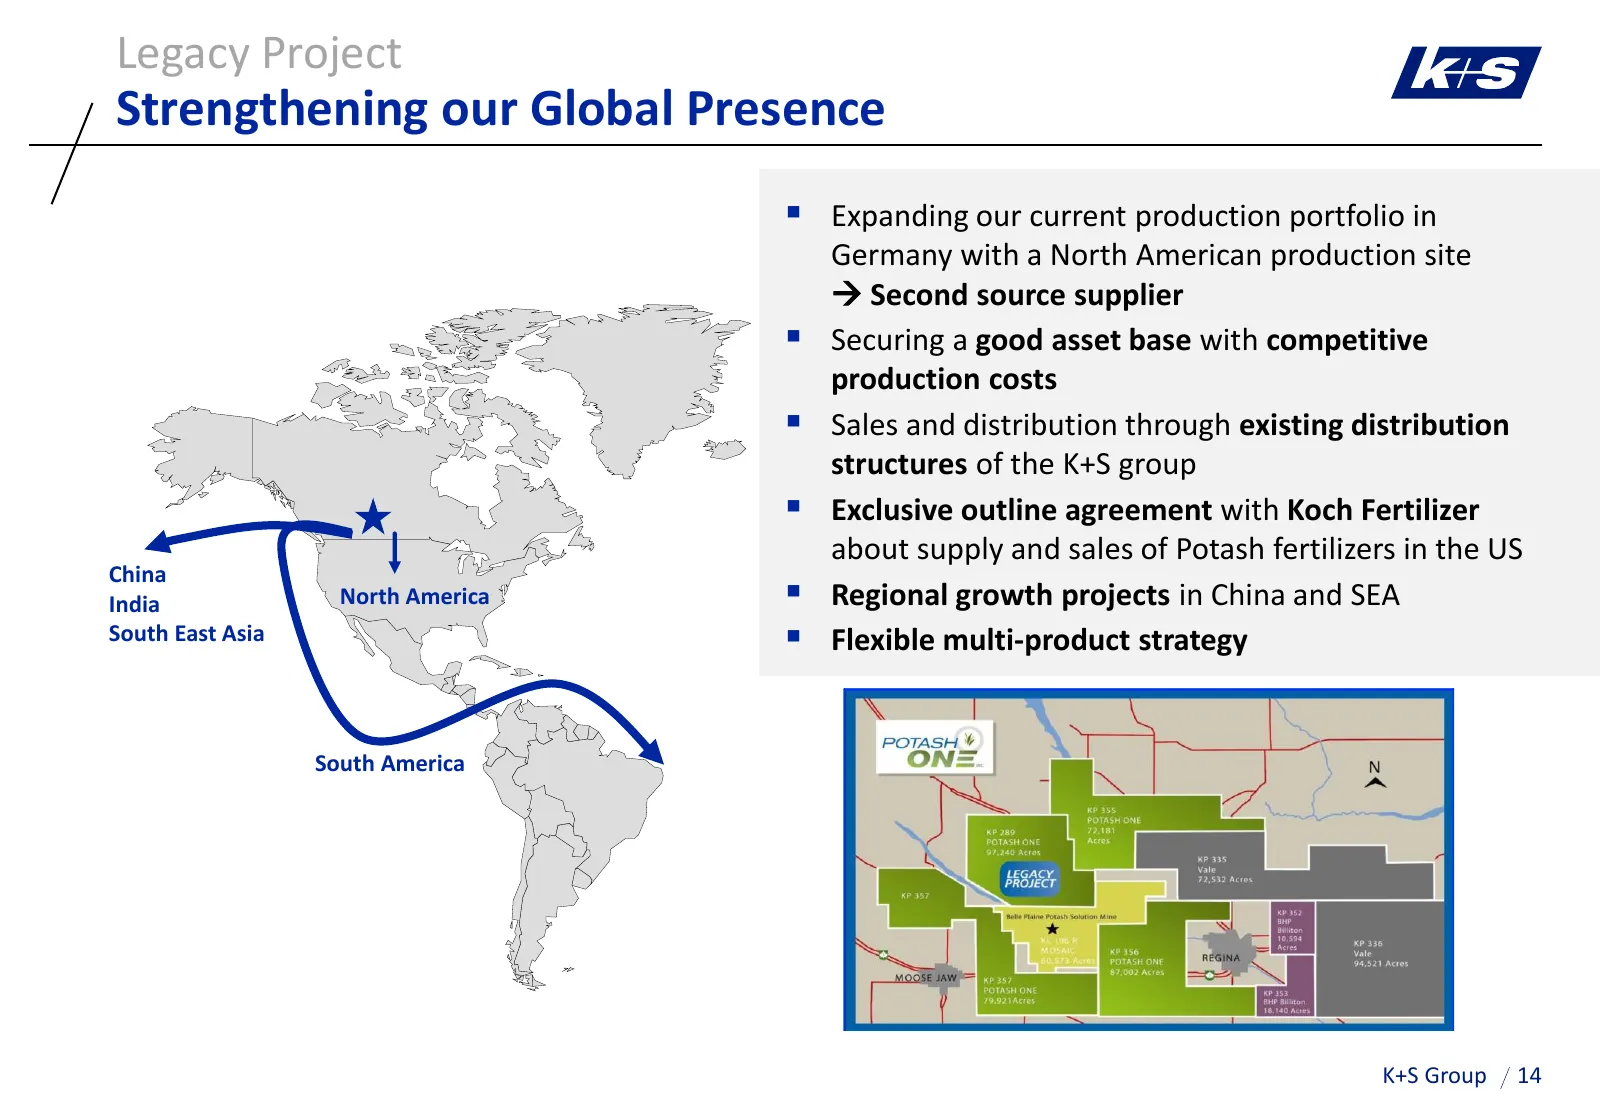
Slide 14: Legacy Project: Strengthening our Global Presence
Legacy Project Strengthening our Global Presence Expanding our current production portfolio in Germany with a North American production site Second source supplier Securing a good asset base with competitive production costs Sales and distribution through existing distribution structures of
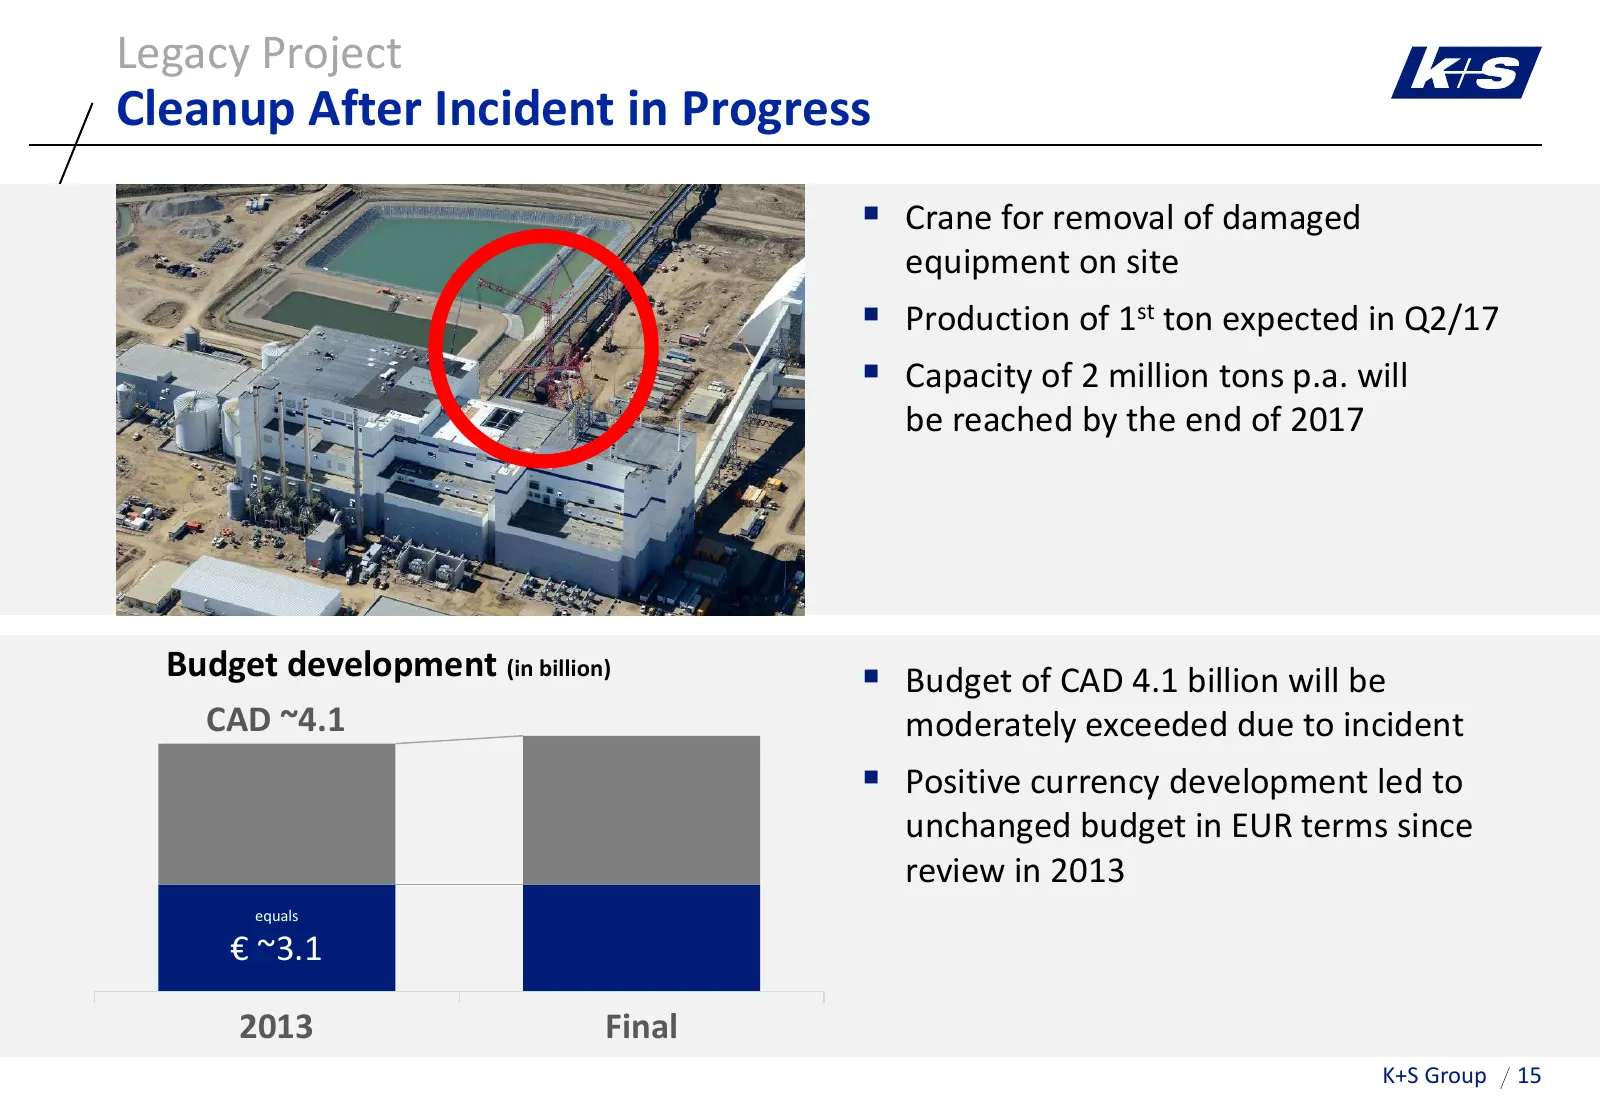
Slide 15: Legacy Project: Cleanup After Incident in Progress
Legacy Project Cleanup After Incident in Progress Crane for removal of damaged equipment on site Production of 1st ton expected in Q2/17 Capacity of 2 million tons p.a. will be reached by the end of 2017 Budget development (in billion) Budget of CAD 4.1 billion will be CAD ~4.1 moderately ex
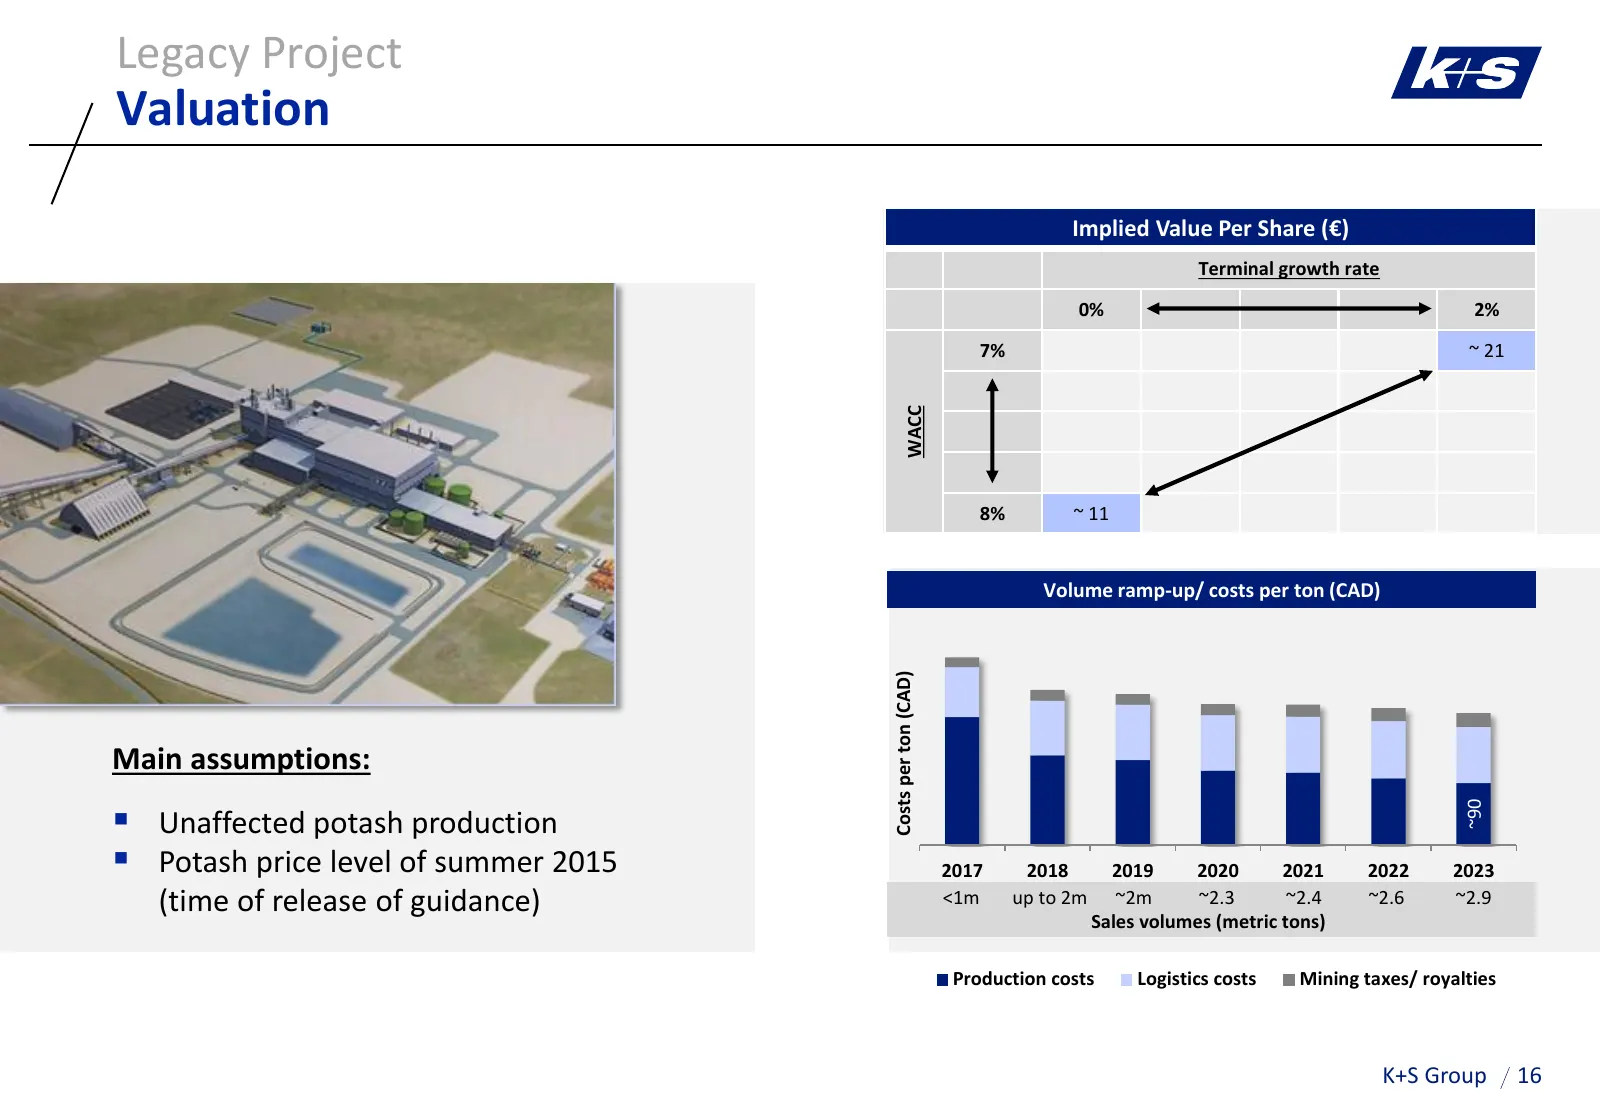
Slide 16: Legacy Project Valuation
Legacy Project Valuation Implied Value Per Share (€) Terminal growth rate 0% 2% 7% ~ 21 WACC 8% ~ 11 Volume ramp-up/ Volume ramp-up (m metriccosts tons)per tonper /costs (CAD) ton (CAD) Costs per ton (CAD) Main assumptions: Unaffected potash production ~90 Potash price level of summer 2015 2017
Slide 17: Acquisition in China
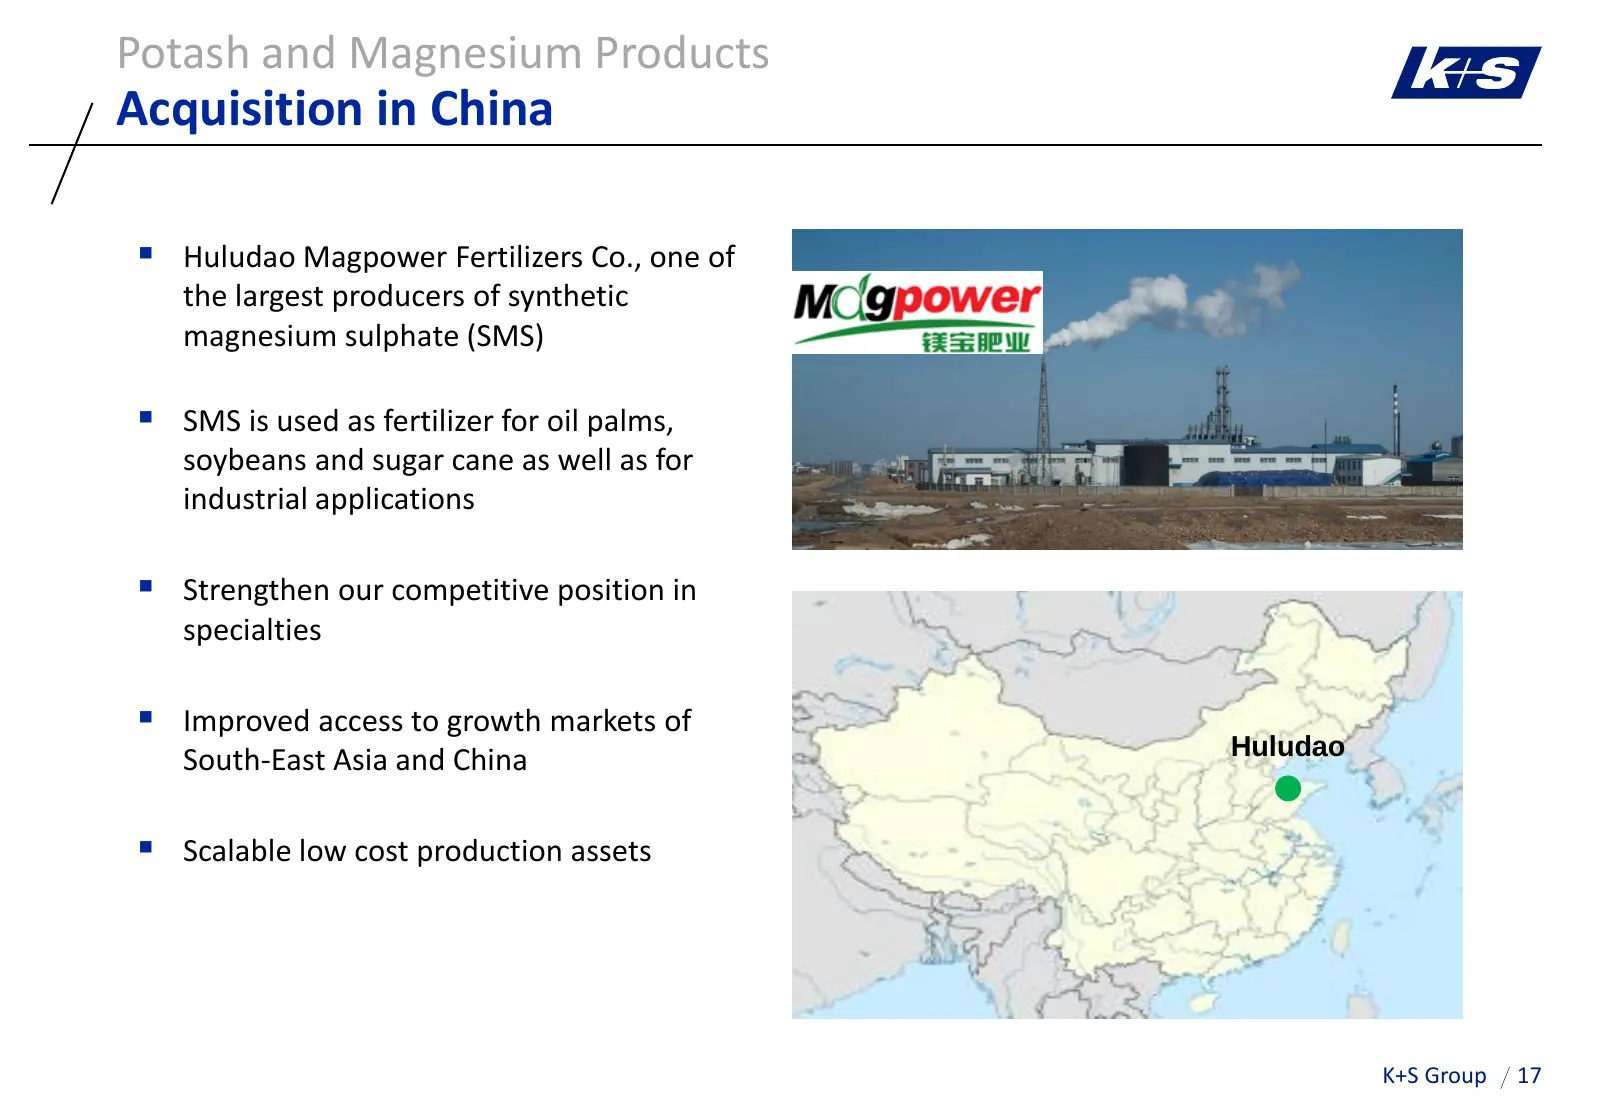
Potash and Magnesium Products Acquisition in China Huludao Magpower Fertilizers Co., one of the largest producers of synthetic magnesium sulphate (SMS) SMS is used as fertilizer for oil palms, soybeans and sugar cane as well as for industrial applications Strengthen our competitive position in
Slide 18: Content
K+S Group Content A K+S’ Unique Strategic Position 1 Potash and Magnesium Products 2 Salt B Current Trading C Outlook K+S Group 18
Slide 19: Long-Term Dynamics in Salt Demand
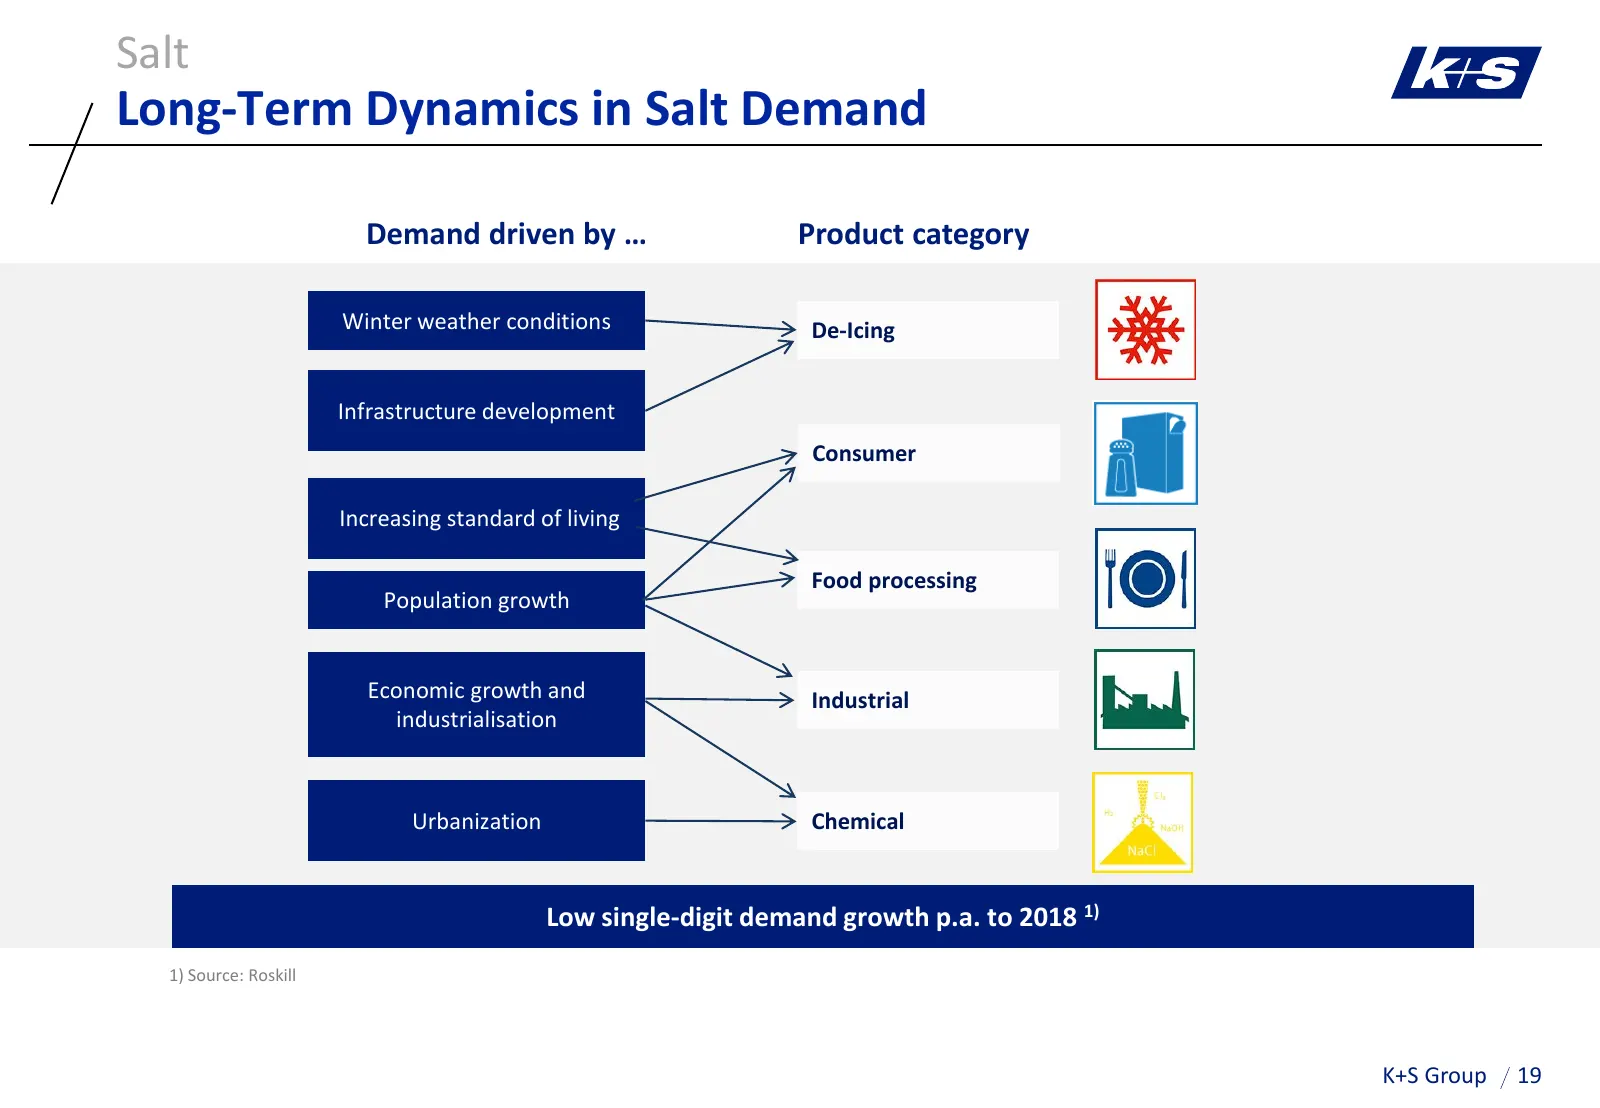
Salt Long-Term Dynamics in Salt Demand Demand driven by … Product category Winter weather conditions De-Icing Infrastructure development Consumer Increasing standard of living Food processing Population growth Economic growth and Industrial industrialisation Urbanization Chemical Low single-digit de
Slide 20: Salt: Inevitable for life
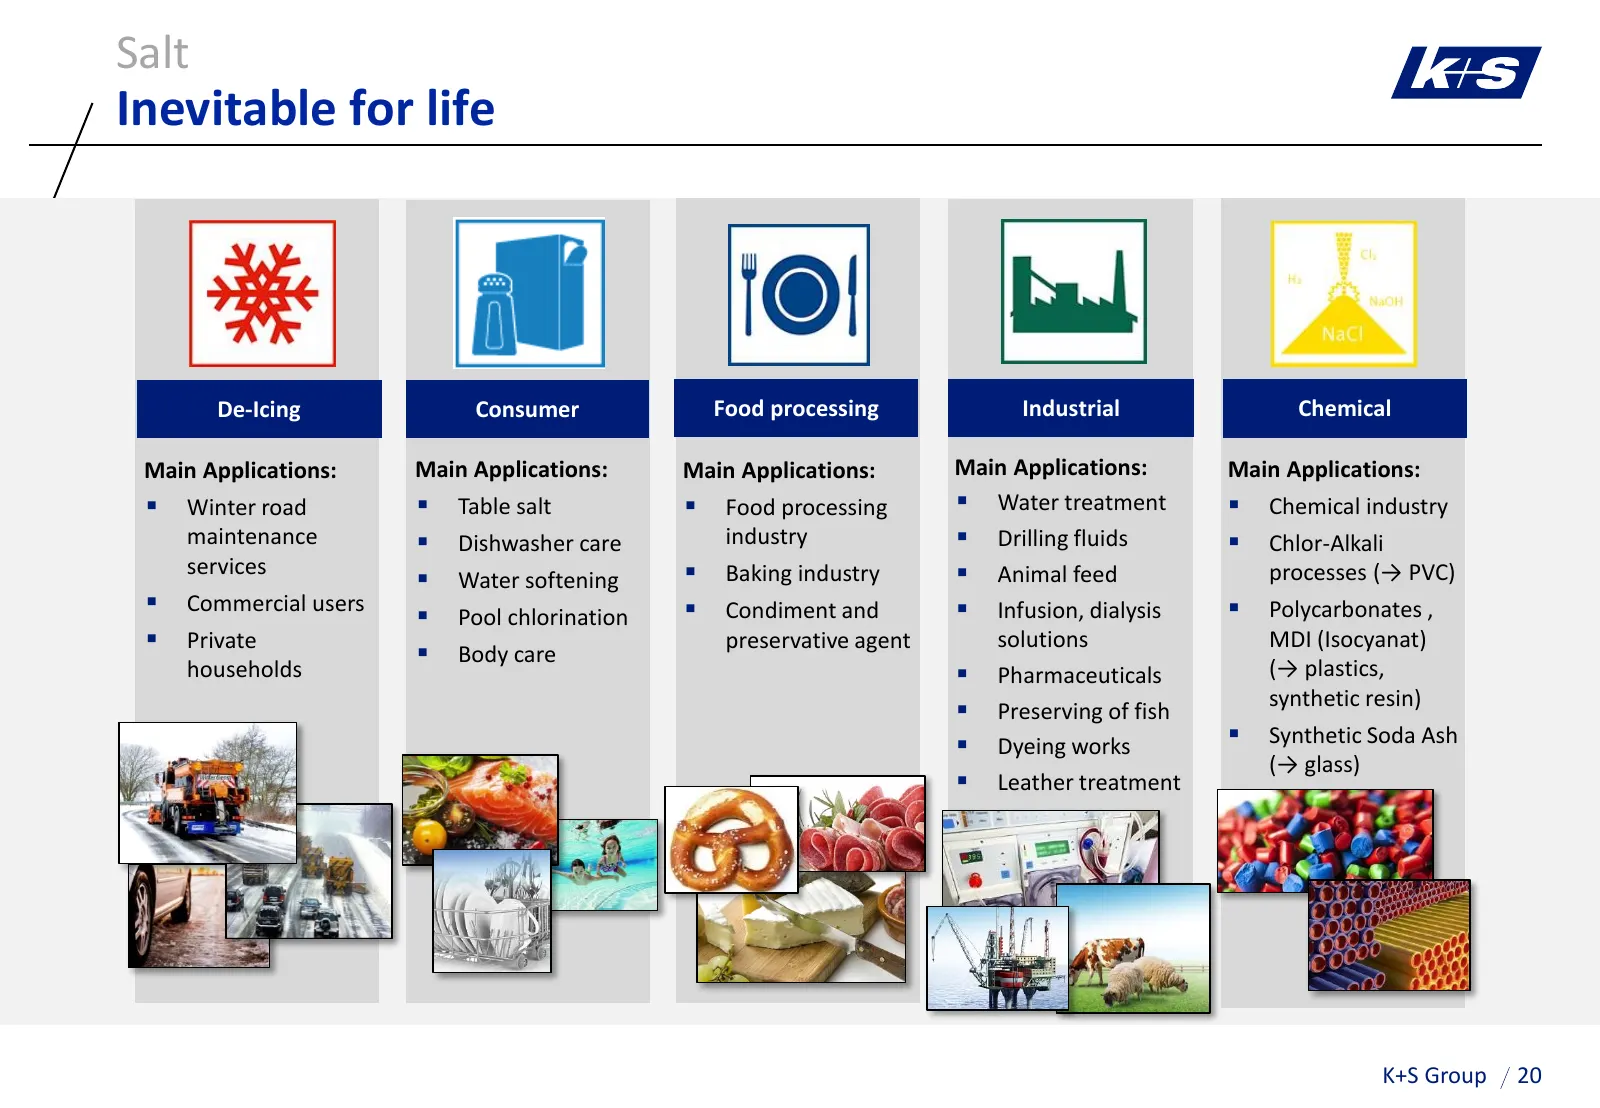
Salt Inevitable for life De-Icing Consumer Food processing Industrial Chemical Main Applications: Main Applications: Main Applications: Main Applications: Main Applications: Winter road Table salt Food processing Water treatment Chemical industry maintenance Dishwasher care industry Dr
Slide 21: Unrivalled Global Production Network
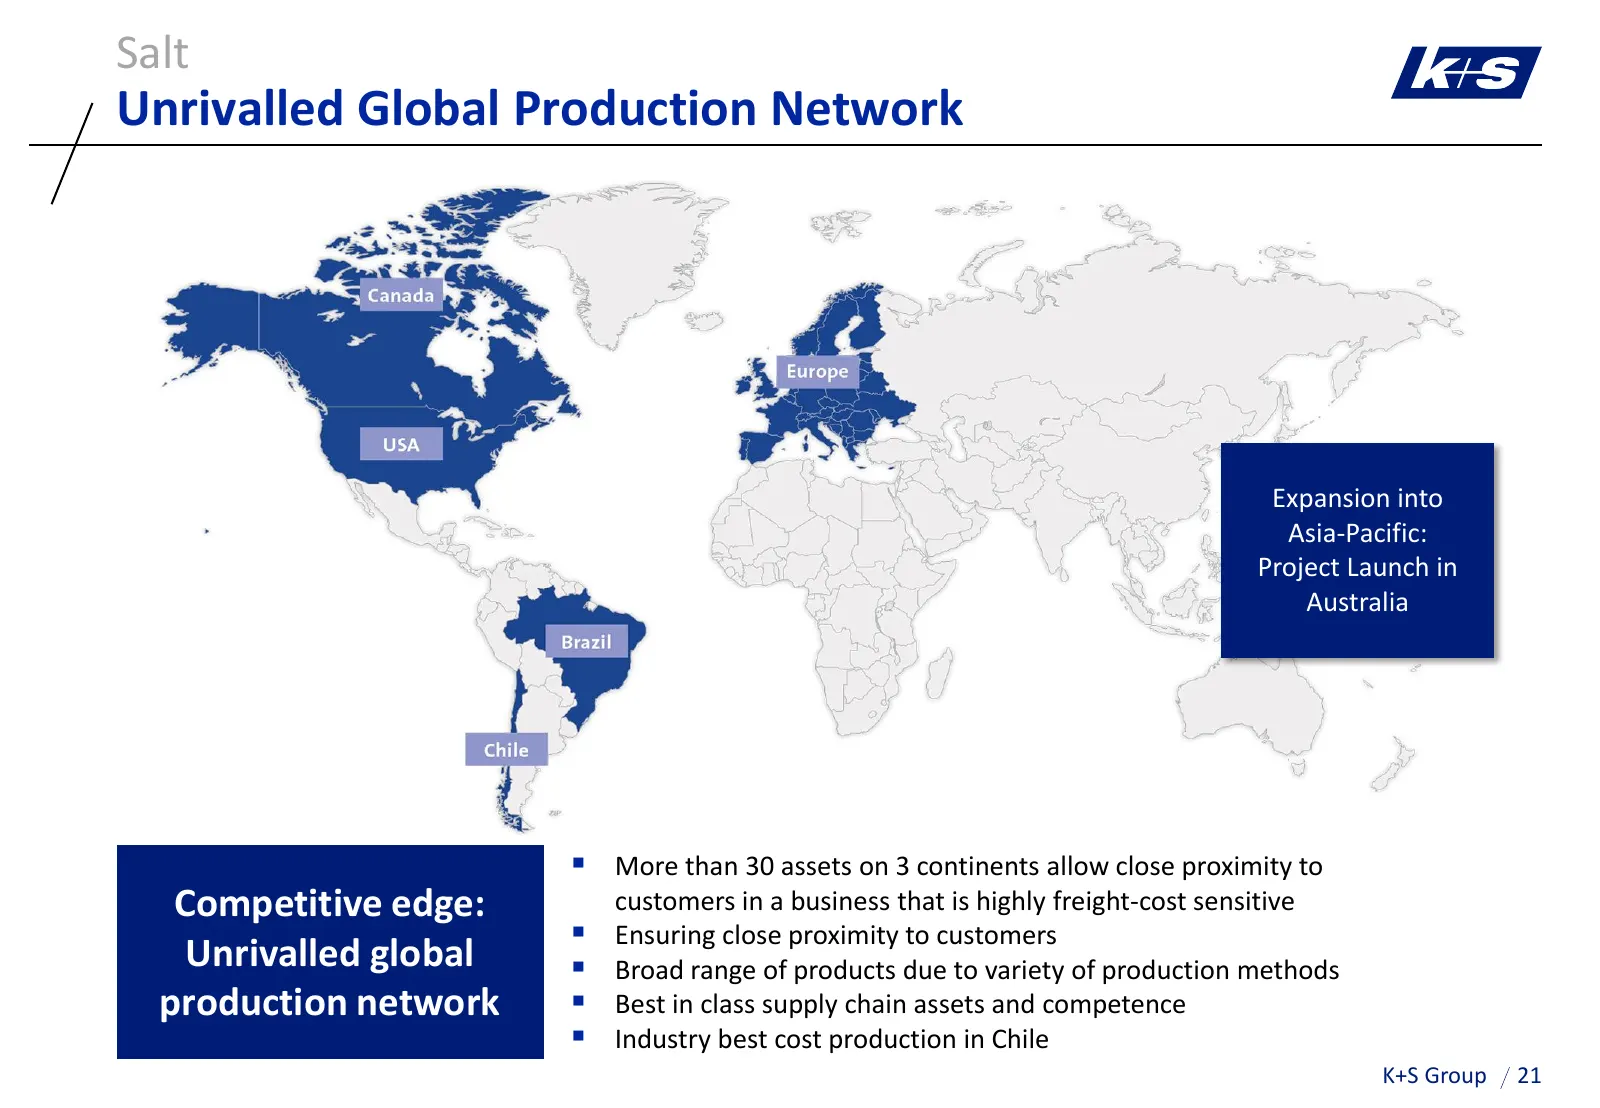
Salt Unrivalled Global Production Network Expansion into Asia-Pacific: Project Launch in Australia More than 30 assets on 3 continents allow close proximity to Competitive edge: customers in a business that is highly freight-cost sensitive Ensuring close proximity to customers Unrivalled global
Slide 22: Diverse Regional and Product Portfolio
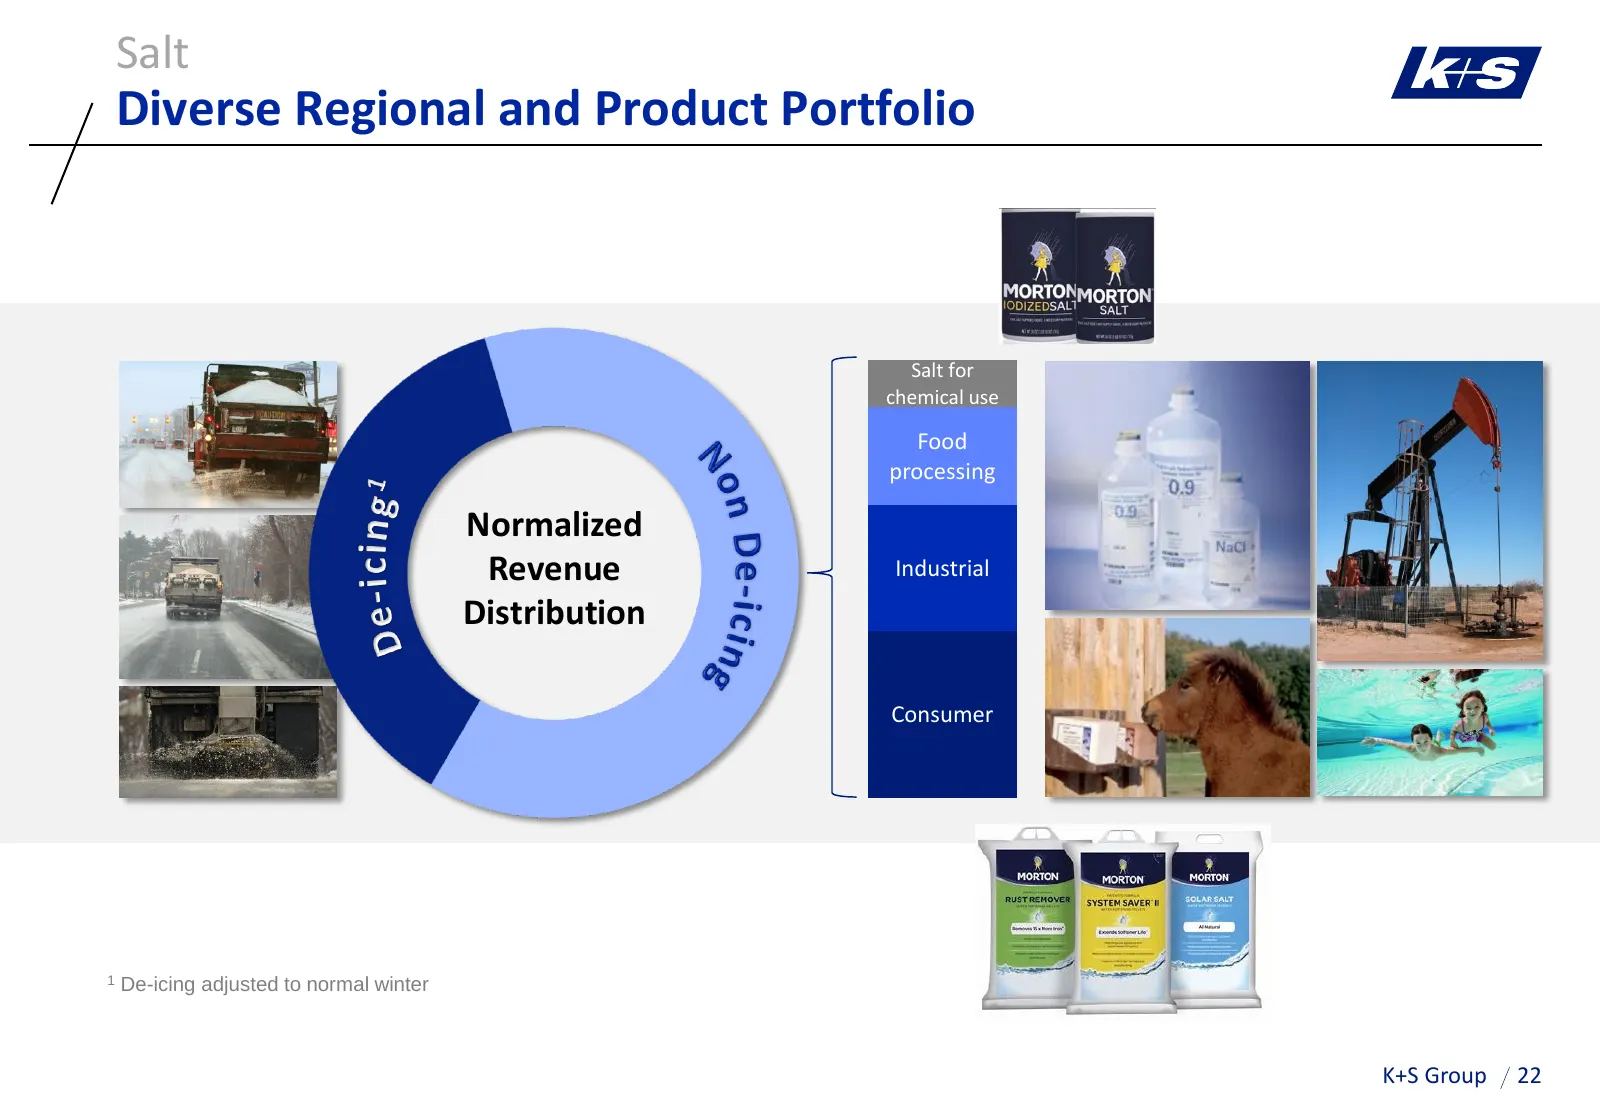
Salt Diverse Regional and Product Portfolio Salt for chemical use Food processing Normalized Revenue Industrial Distribution Consumer 1 De-icing adjusted to normal winter K+S Group 22
Slide 23: Presence in Attractive De-Icing Markets
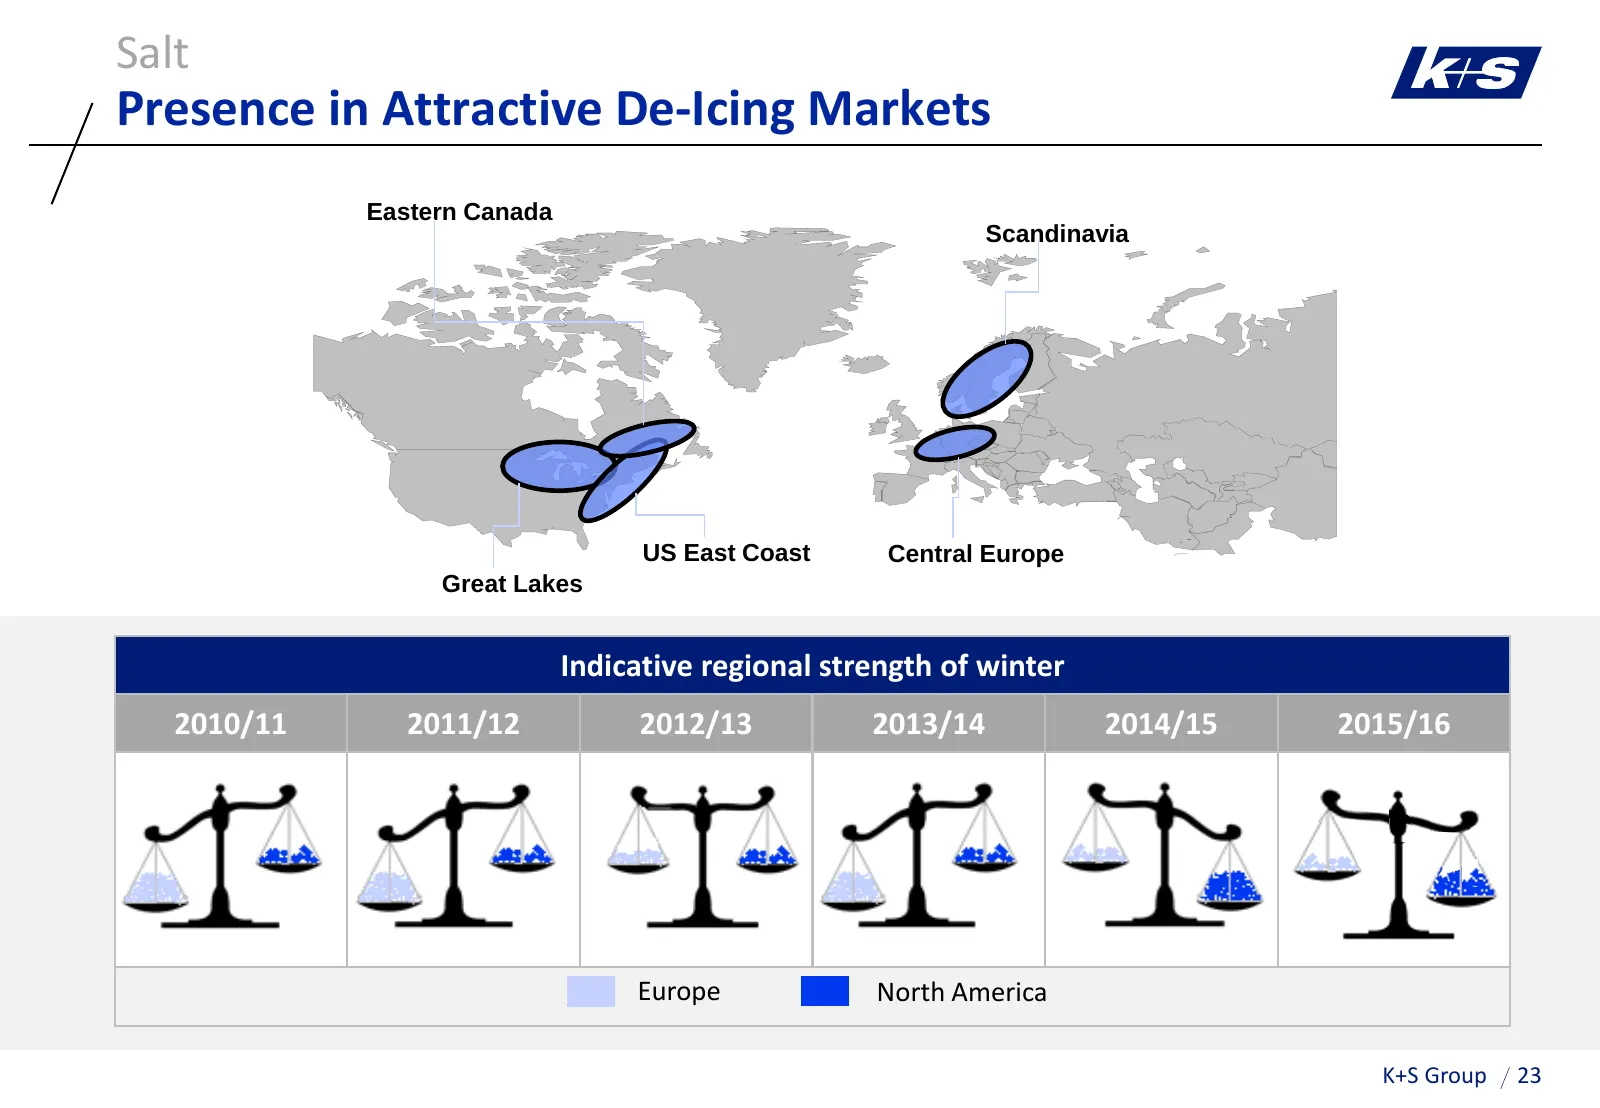
Salt Presence in Attractive De-Icing Markets Eastern Canada Scandinavia US East Coast Central Europe Great Lakes Indicative regional strength of winter 2010/11 2011/12 2012/13 2013/14 2014/15 2015/16 Europe North America K+S Group 23
Slide 24: 'Salt 2020' Strategy – On Track
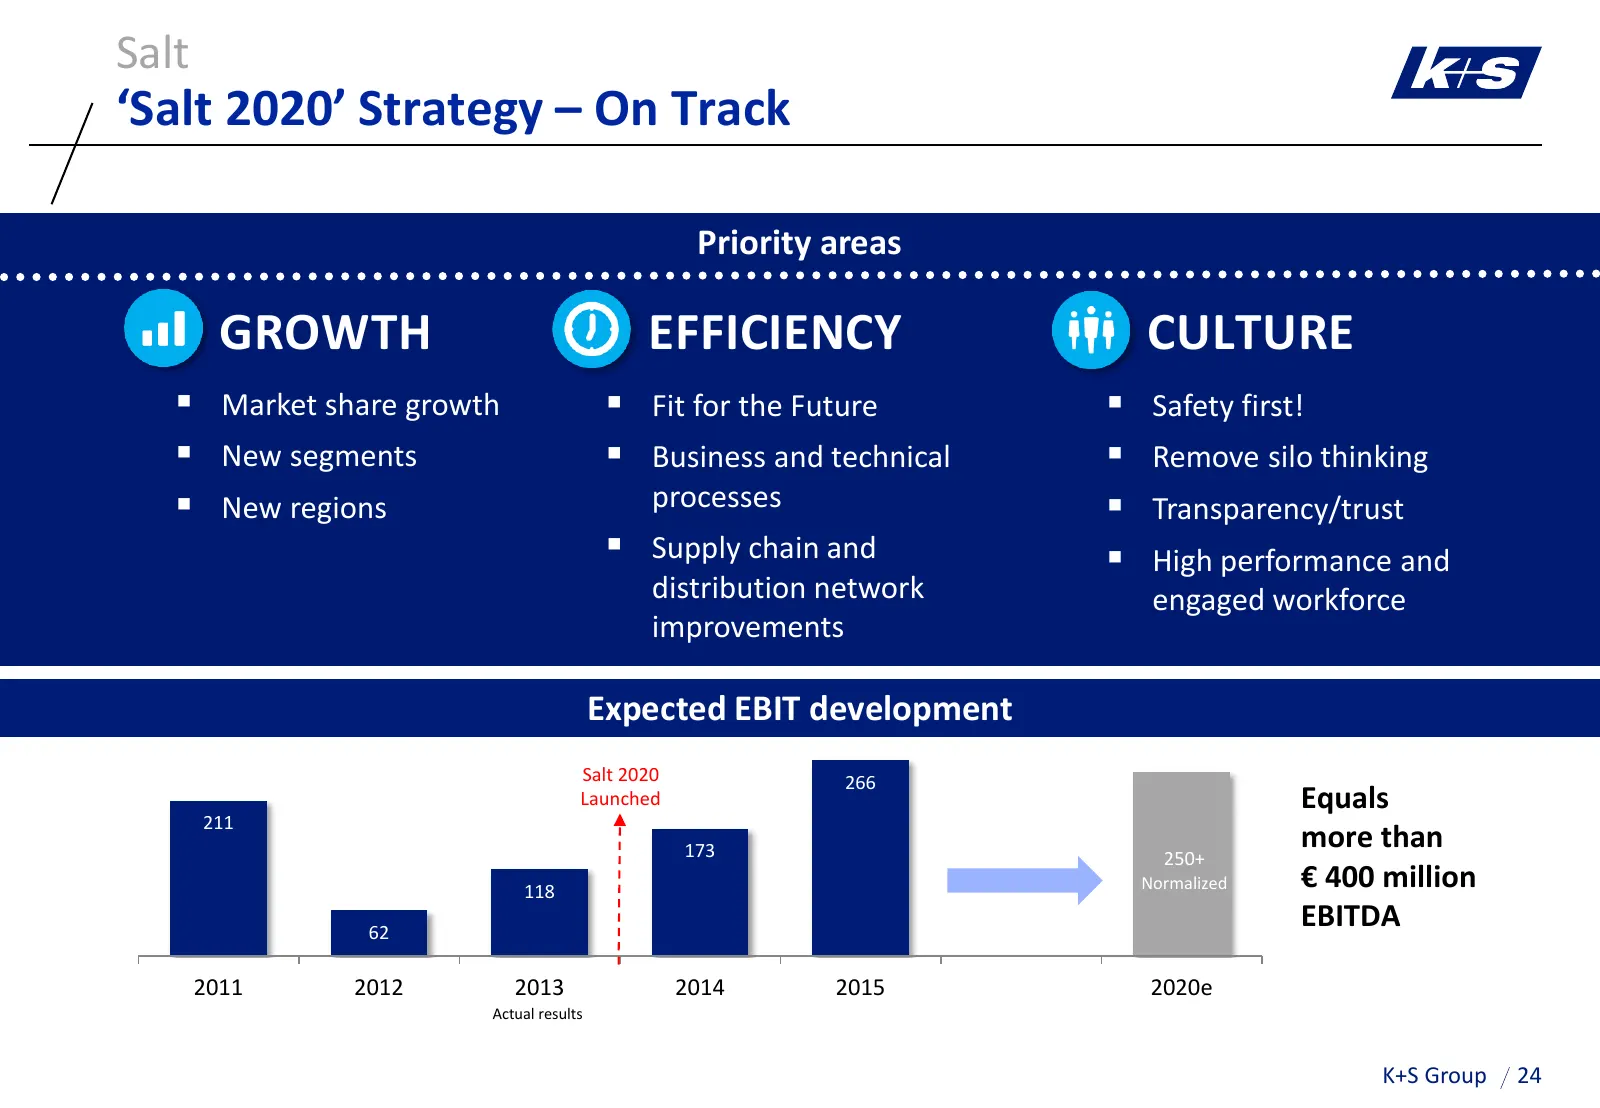
Salt ‘Salt 2020’ Strategy – On Track Priority areas GROWTH EFFICIENCY CULTURE Market share growth Fit for the Future Safety first! New segments Business and technical Remove silo thinking New regions processes Transparency/trust Supply chain and High performance and distribution
Slide 25: Expansion into Asia-Pacific: Project Launch in Australia
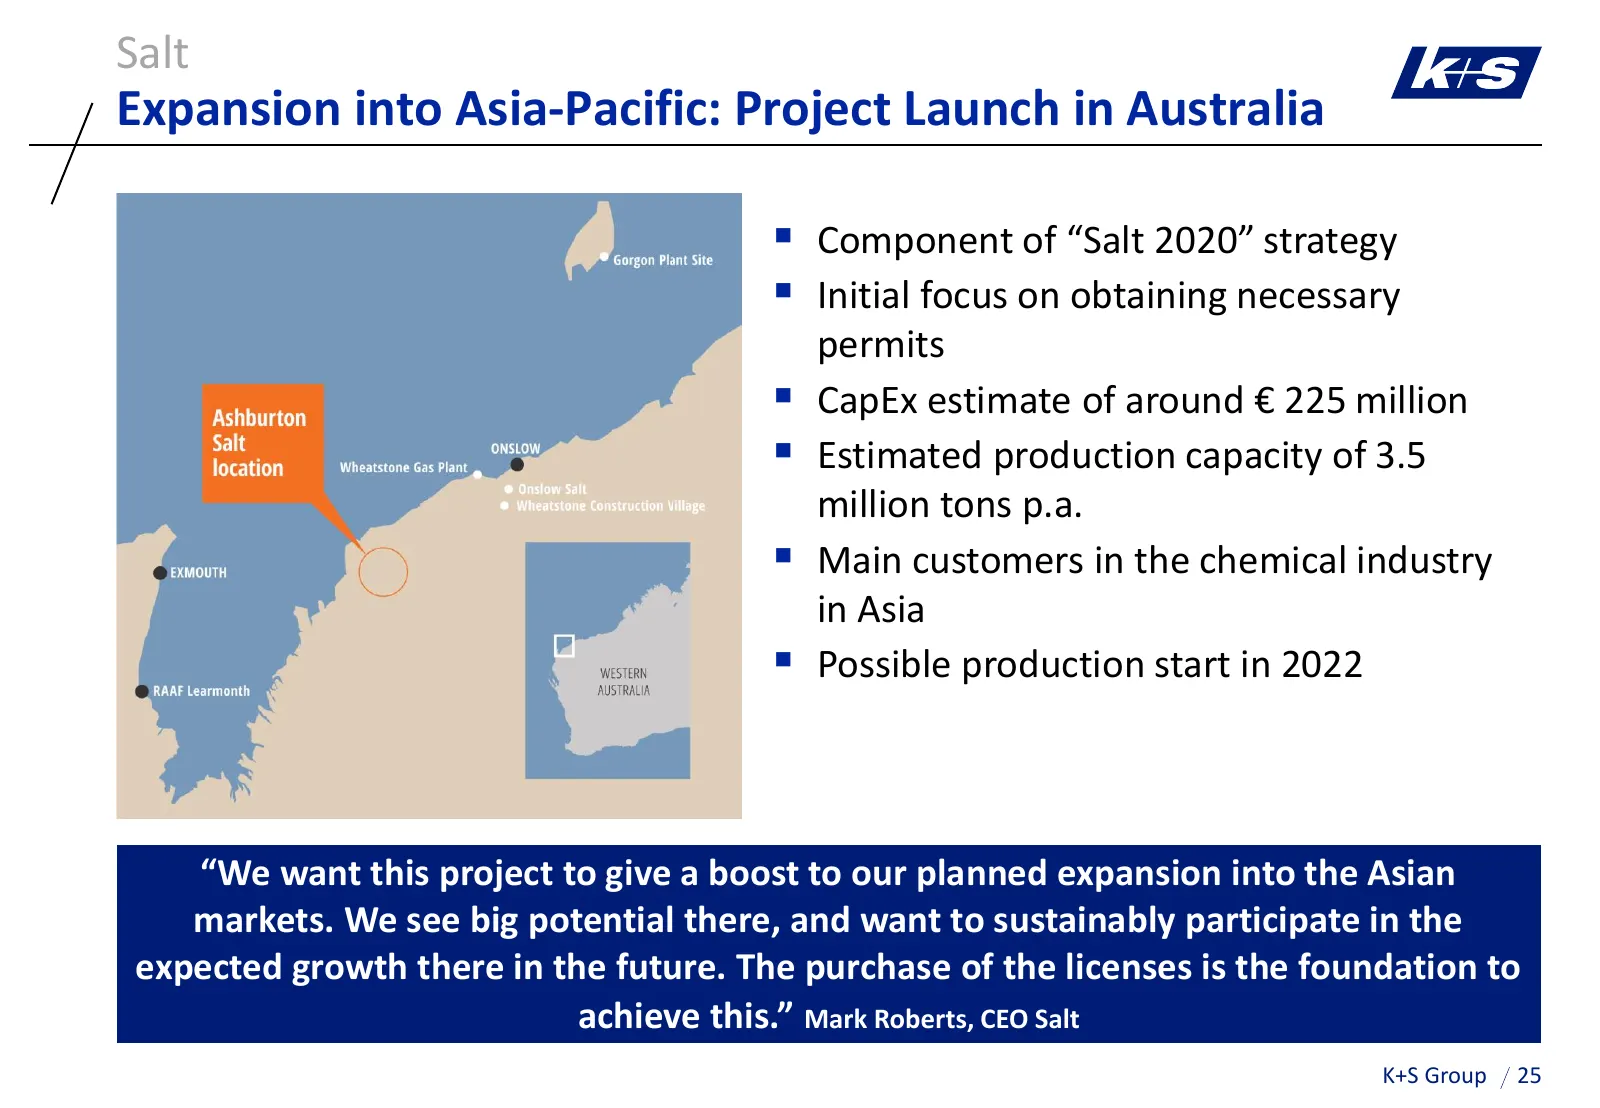
Salt Expansion into Asia-Pacific: Project Launch in Australia Component of “Salt 2020” strategy Initial focus on obtaining necessary permits CapEx estimate of around € 225 million Estimated production capacity of 3.5 million tons p.a. Main customers in the chemical industry in Asia Possi
Slide 26: Content
K+S Group Content A K+S’ Unique Strategic Position 1 Potash and Magnesium Products 2 Salt B Current Trading C Outlook K+S Group 26
Slide 27: P&L
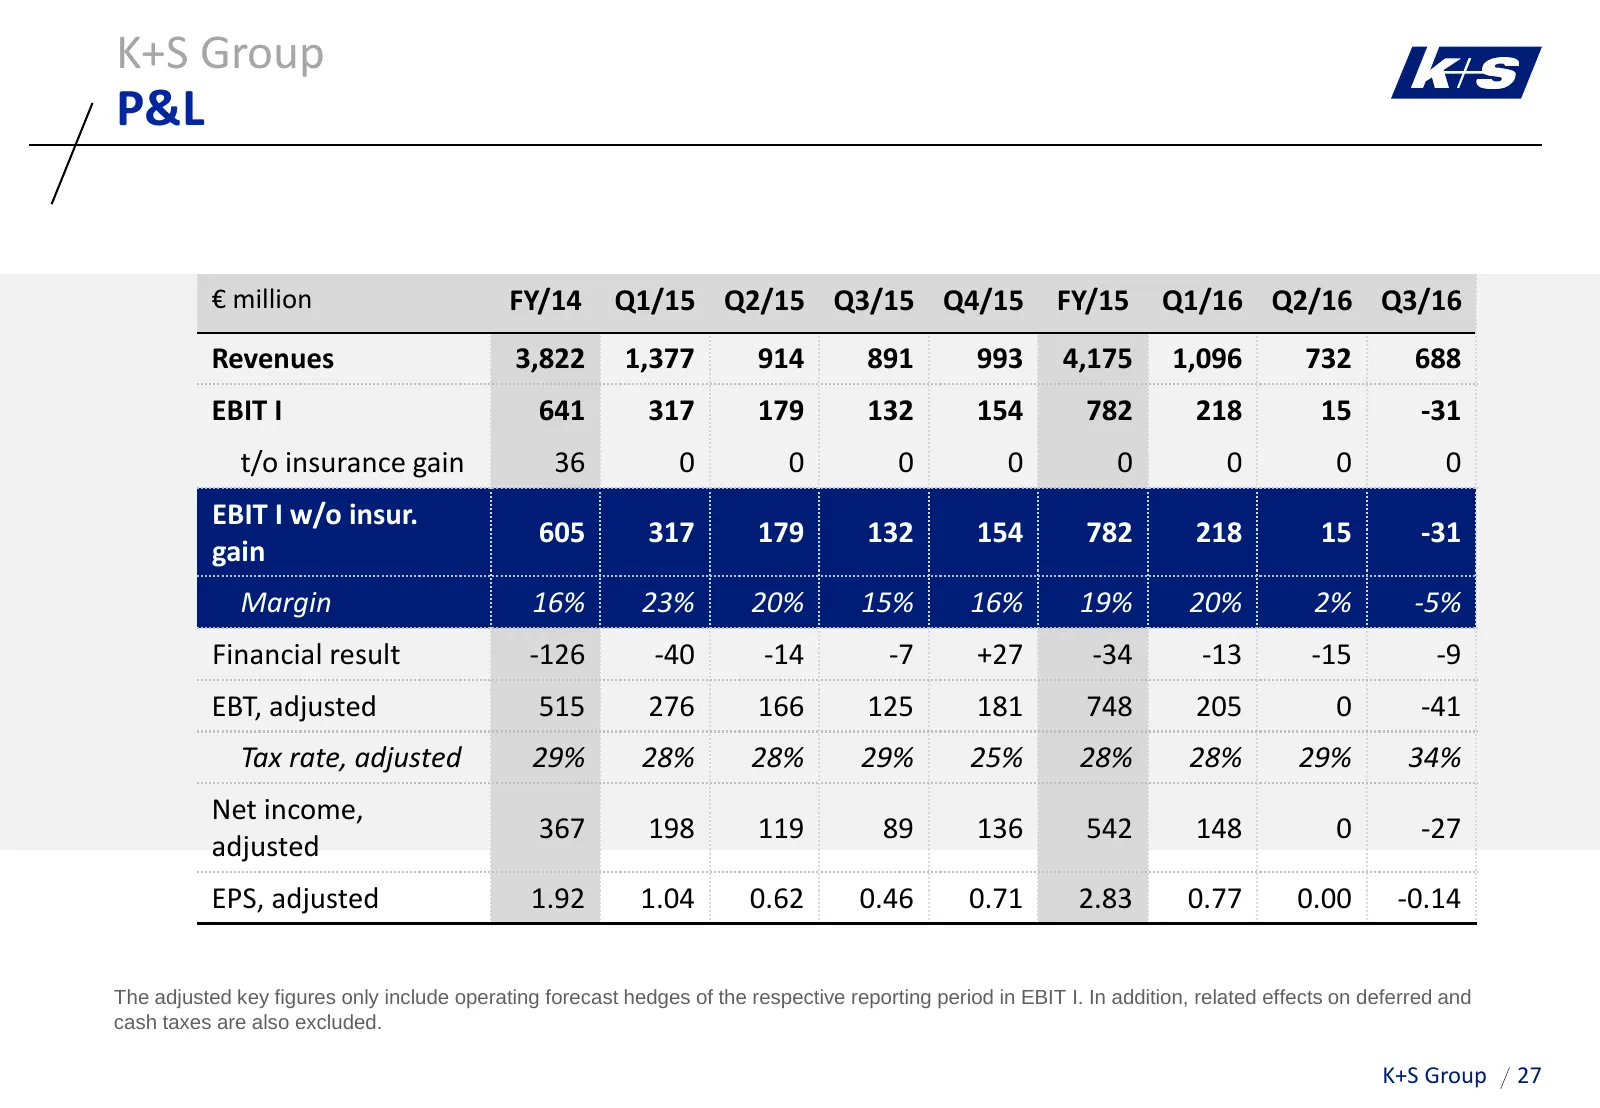
K+S Group P&L € million FY/14 Q1/15 Q2/15 Q3/15 Q4/15 FY/15 Q1/16 Q2/16 Q3/16 Revenues 3,822 1,377 914 891 993 4,175 1,096 732 688 EBIT I 641 317 179 132 154 782 218 15 -31 t/o insurance gain 36 0 0 0 0 0 0 0 0 EBIT I w/o insur. 605 317 179 132 154 782 218 15 -31 gain Margin 16% 23% 20% 15% 16% 19%
Slide 28: Cost Discipline Will Remain High
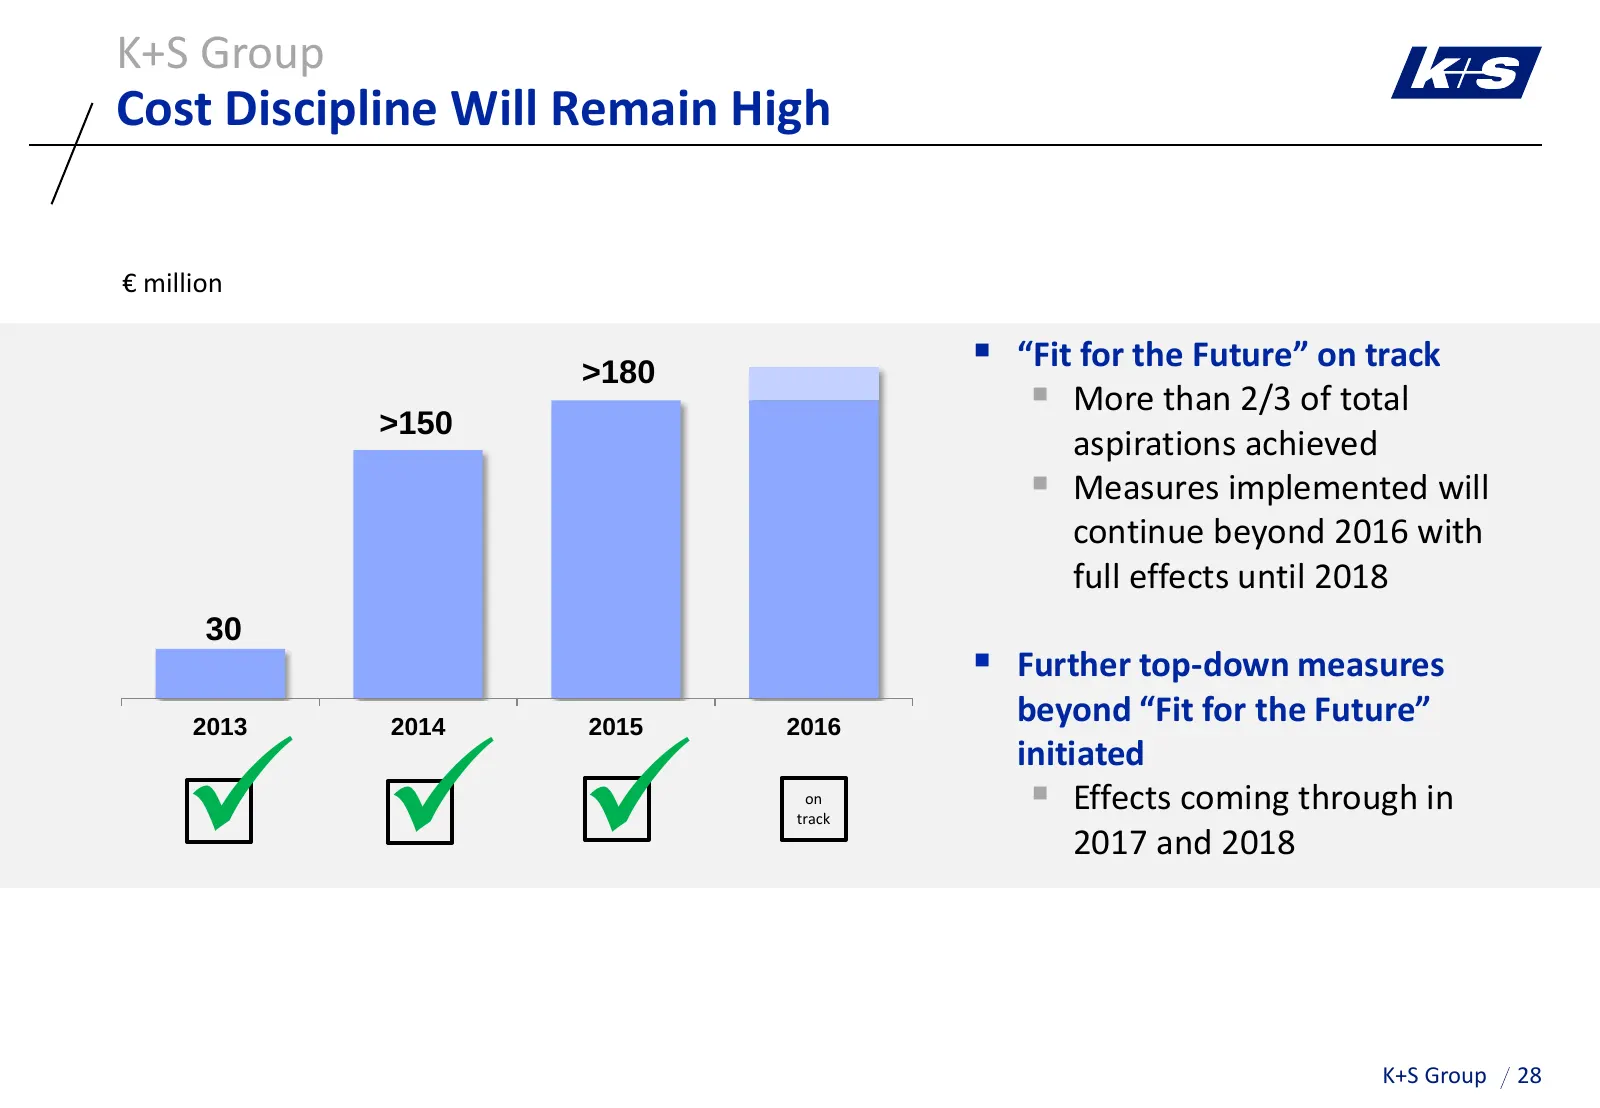
K+S Group Cost Discipline Will Remain High € million >180 “Fit for the Future” on track More than 2/3 of total >150 aspirations achieved Measures implemented will continue beyond 2016 with full effects until 2018 30 Further top-down measures beyond “Fit for the Future” 2013 2014 2015 2
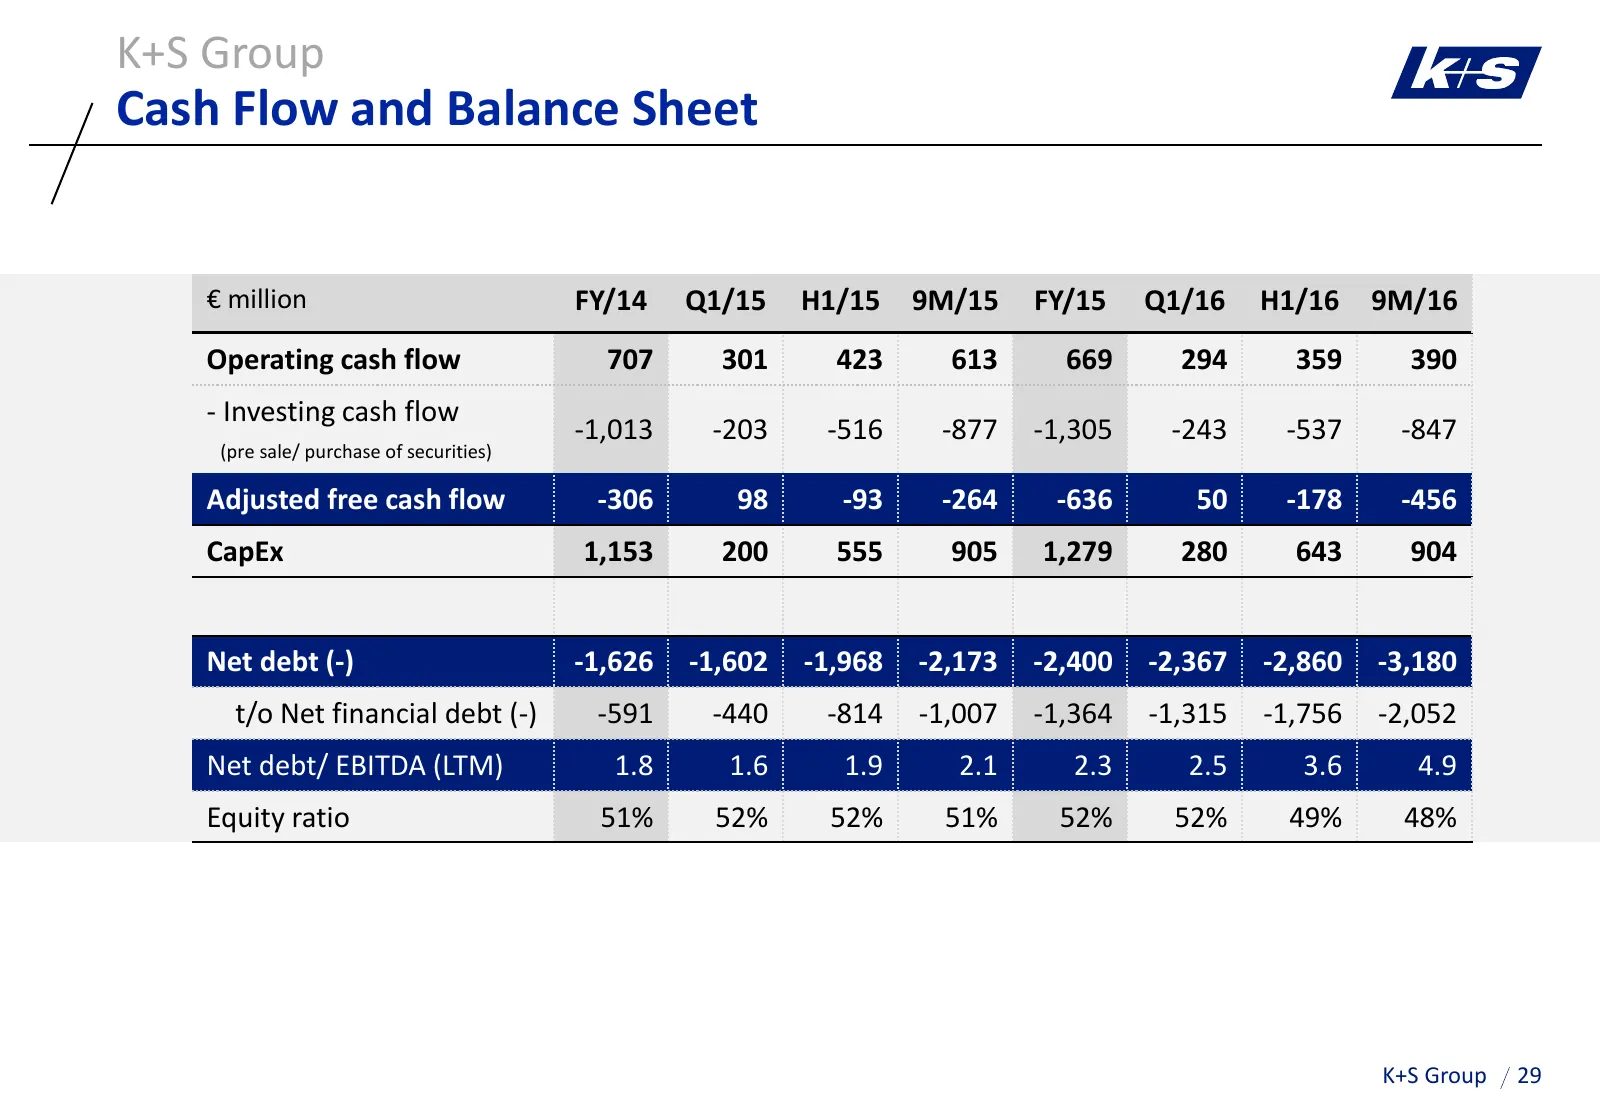
Slide 29: Cash Flow and Balance Sheet
K+S Group Cash Flow and Balance Sheet € million FY/14 Q1/15 H1/15 9M/15 FY/15 Q1/16 H1/16 9M/16 Operating cash flow 707 301 423 613 669 294 359 390 - Investing cash flow -1,013 -203 -516 -877 -1,305 -243 -537 -847 (pre sale/ purchase of securities) Adjusted free cash flow -306 98 -93 -264 -636 50 -1
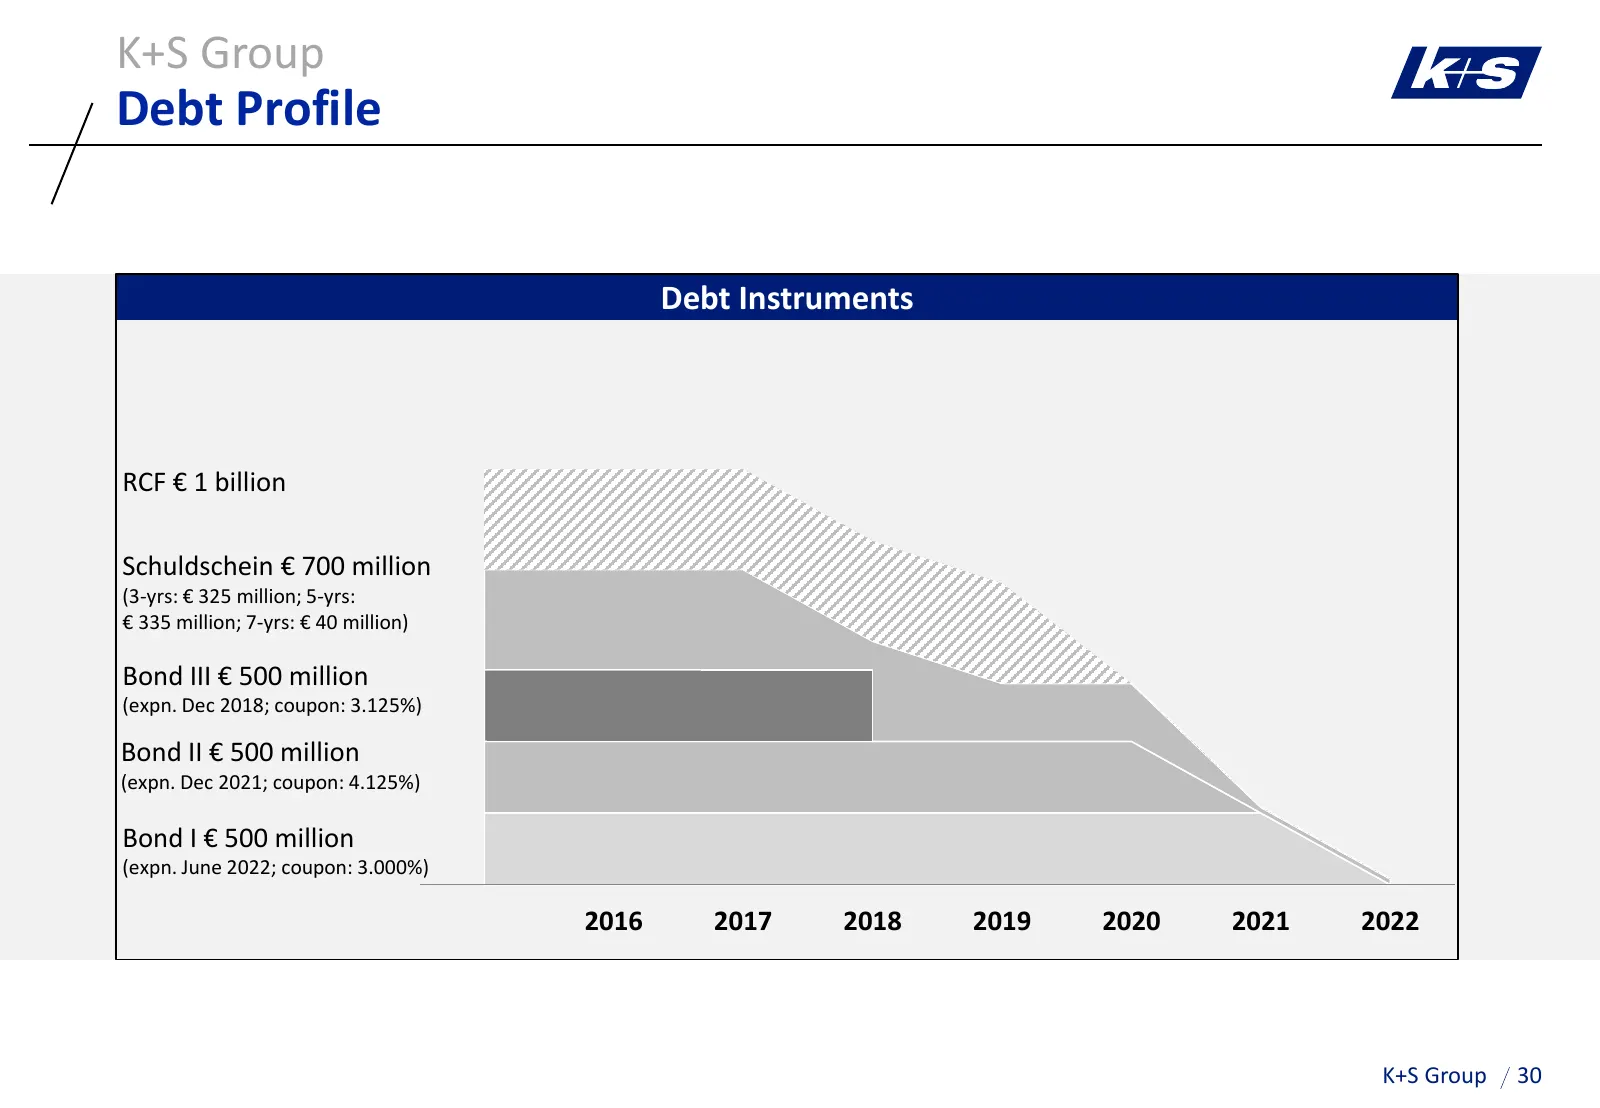
Slide 30: Debt Profile
K+S Group Debt Profile Debt Instruments RCF € 1 billion Schuldschein € 700 million (3-yrs: € 325 million; 5-yrs: € 335 million; 7-yrs: € 40 million) Bond III € 500 million (expn. Dec 2018; coupon: 3.125%) Bond II € 500 million (expn. Dec 2021; coupon: 4.125%) Bond I € 500 million (expn. June 2022; c
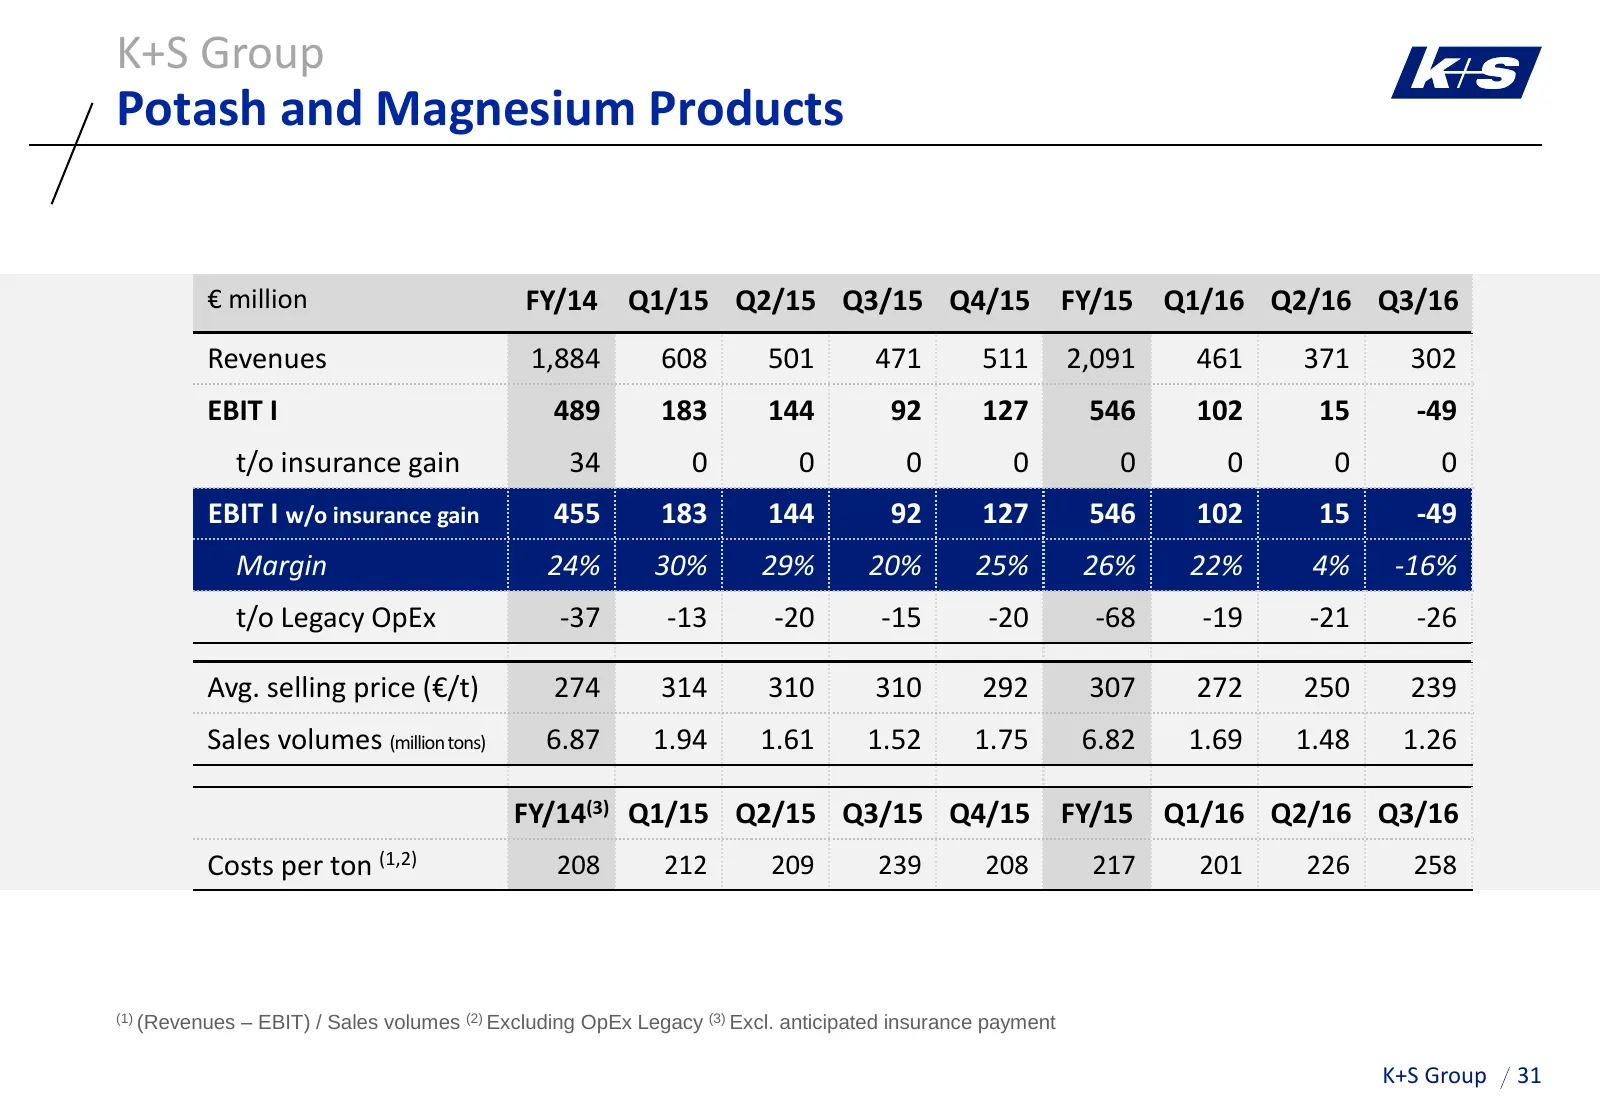
Slide 31: Potash and Magnesium Products
K+S Group Potash and Magnesium Products € million FY/14 Q1/15 Q2/15 Q3/15 Q4/15 FY/15 Q1/16 Q2/16 Q3/16 Revenues 1,884 608 501 471 511 2,091 461 371 302 EBIT I 489 183 144 92 127 546 102 15 -49 t/o insurance gain 34 0 0 0 0 0 0 0 0 EBIT I w/o insurance gain 455 183 144 92 127 546 102 15 -49 Margin 2
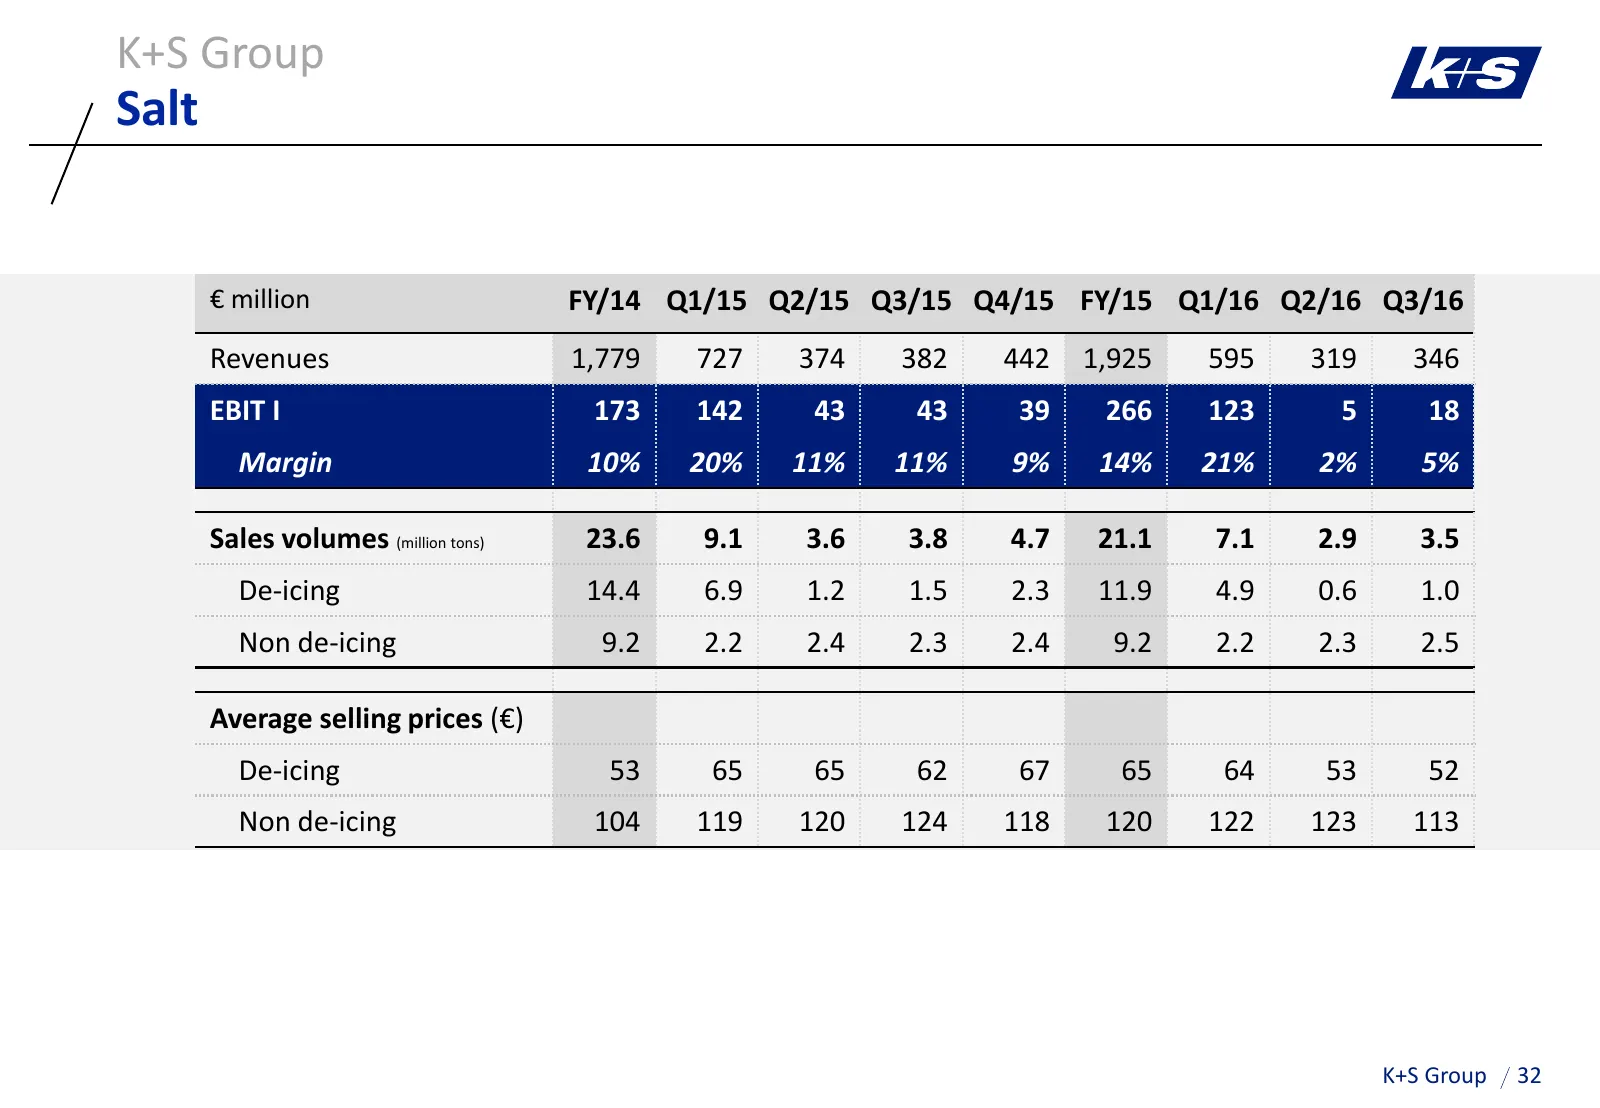
Slide 32: Salt
K+S Group Salt € million FY/14 Q1/15 Q2/15 Q3/15 Q4/15 FY/15 Q1/16 Q2/16 Q3/16 Revenues 1,779 727 374 382 442 1,925 595 319 346 EBIT I 173 142 43 43 39 266 123 5 18 Margin 10% 20% 11% 11% 9% 14% 21% 2% 5% Sales volumes (million tons) 23.6 9.1 3.6 3.8 4.7 21.1 7.1 2.9 3.5 De-icing 14.4 6.9 1.2 1.5 2.
Slide 33: Content
K+S Group Content A K+S’ Unique Strategic Position 1 Potash and Magnesium Products 2 Salt B Current Trading C Outlook K+S Group 33
Slide 34: Guidance FY 2016: EBIT I Bridge
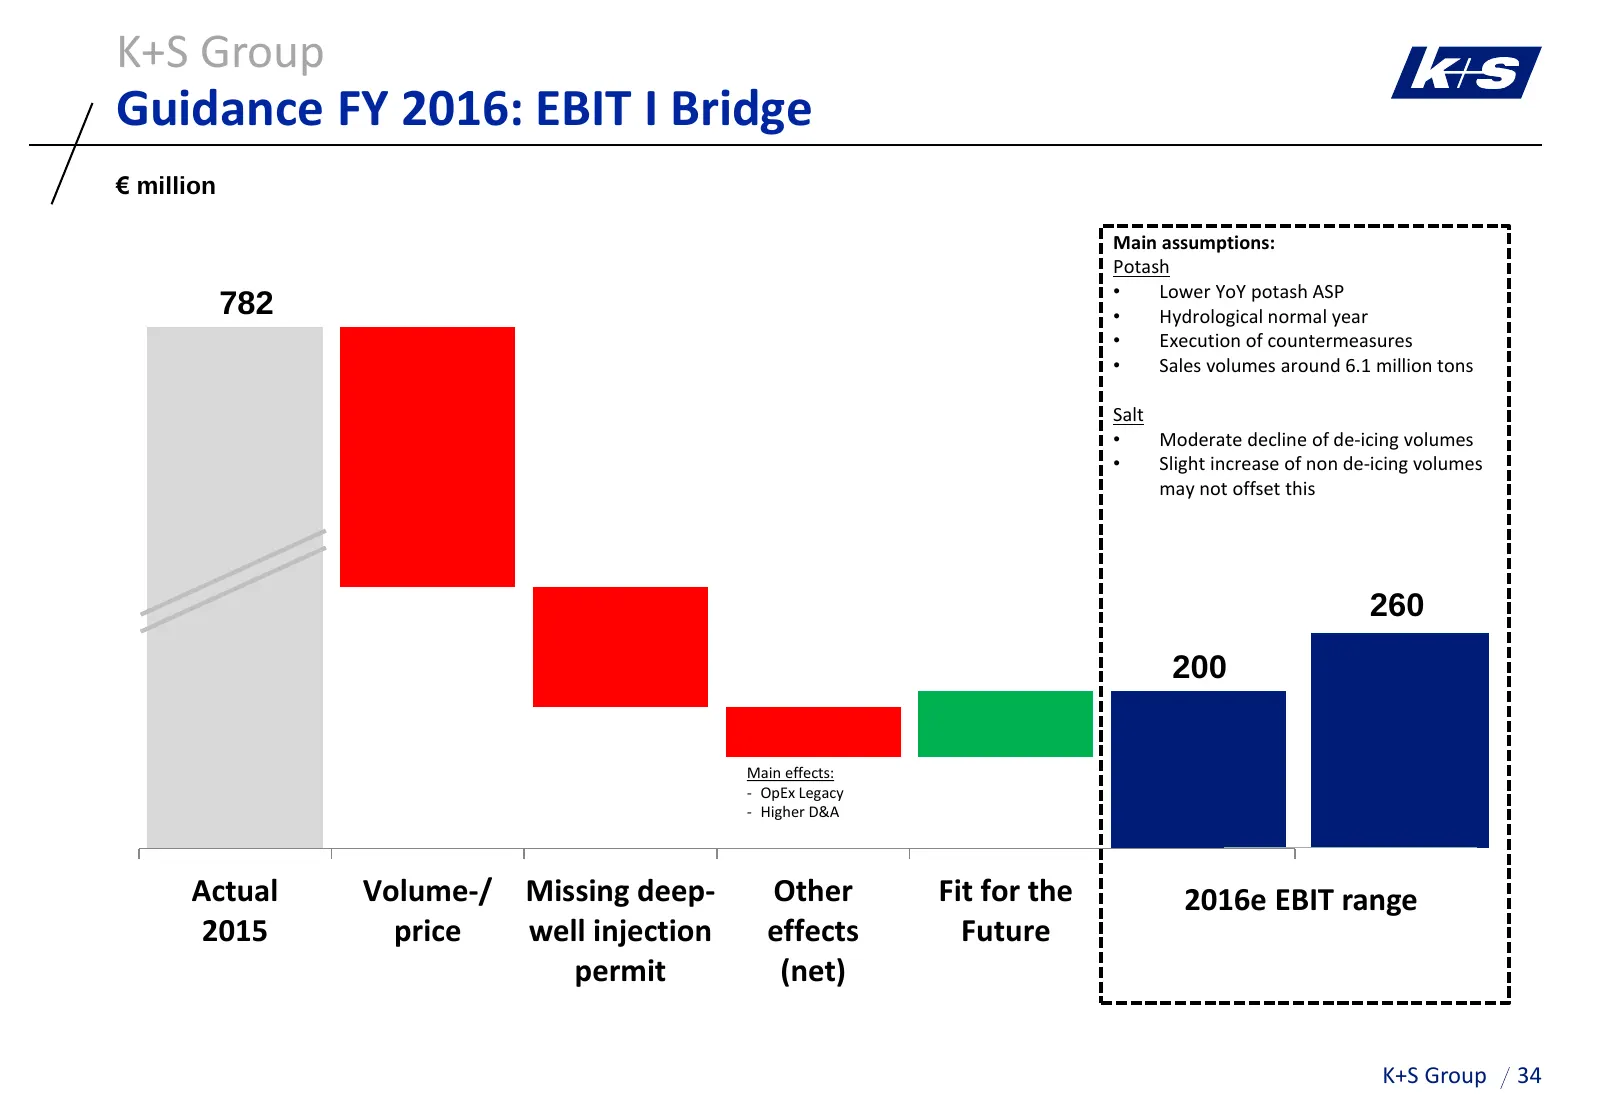
K+S Group Guidance FY 2016: EBIT I Bridge € million Main assumptions: Potash • Lower YoY potash ASP 782 • Hydrological normal year • Execution of countermeasures • Sales volumes around 6.1 million tons Salt • Moderate decline of de-icing volumes • Slight increase of non de-icing volumes may not offs
Slide 35: Dividend policy
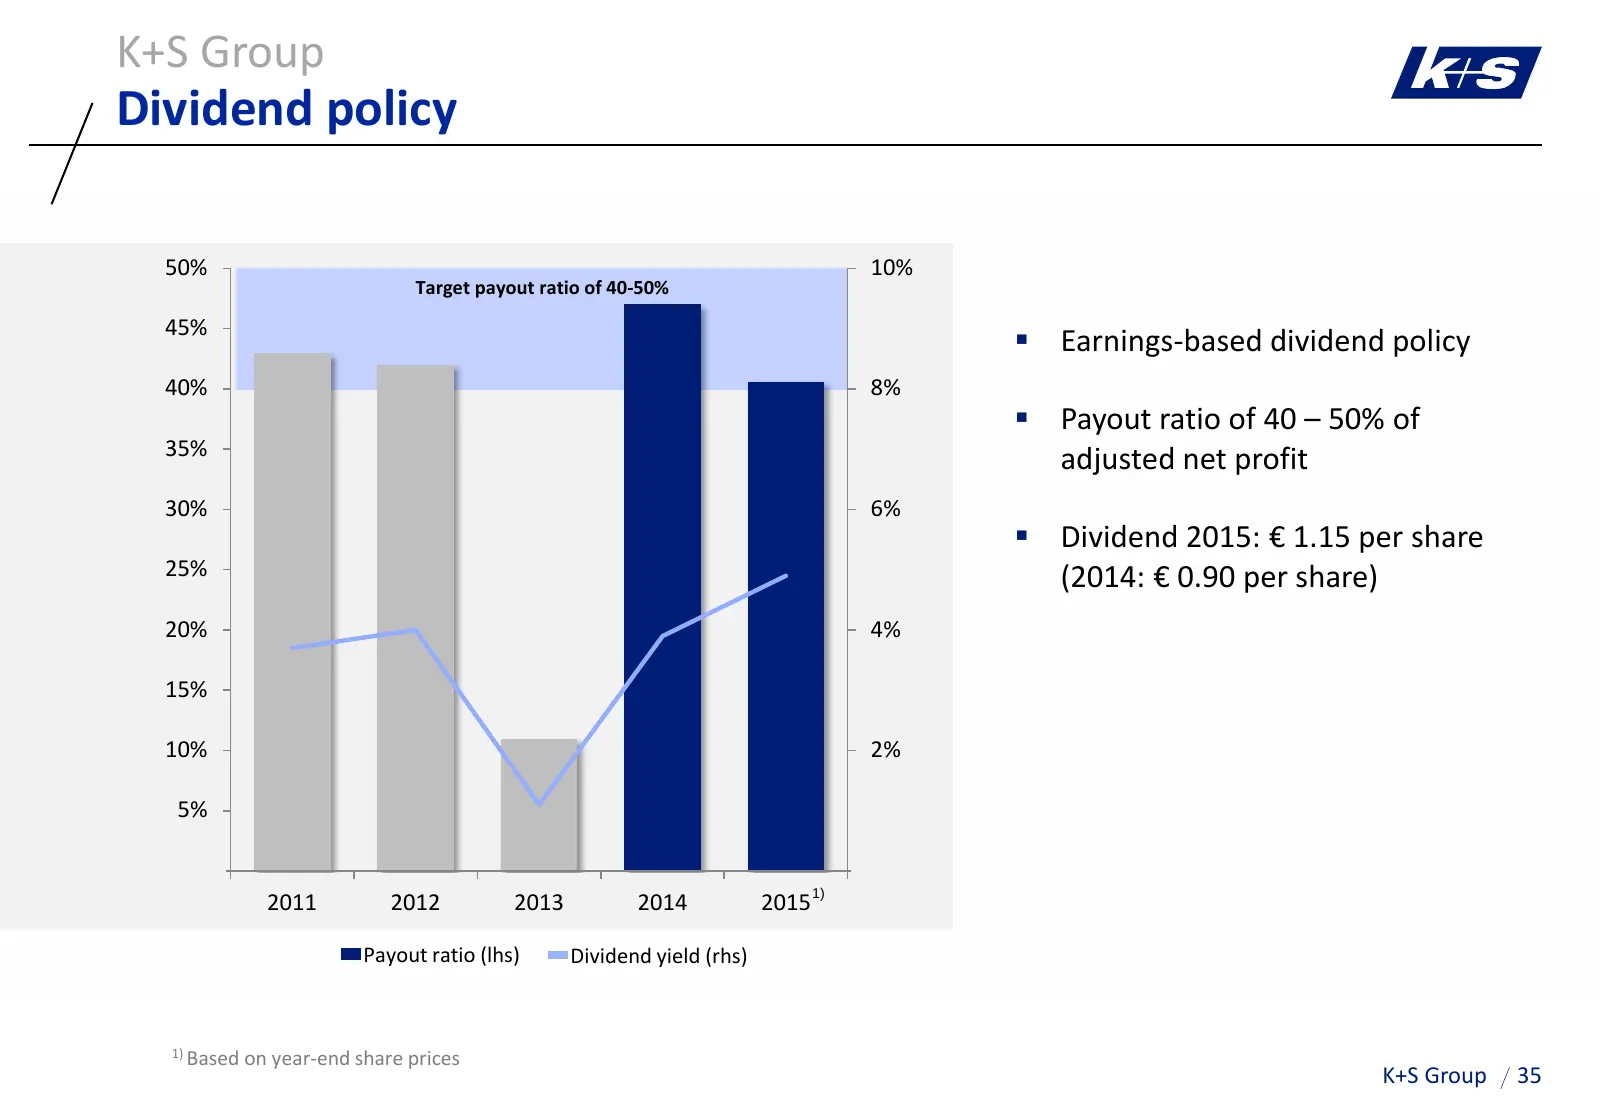
K+S Group Dividend policy 50% 10% Target payout ratio of 40-50% 45% Earnings-based dividend policy 40% 8% Payout ratio of 40 – 50% of 35% adjusted net profit 30% 6% Dividend 2015: € 1.15 per share 25% (2014: € 0.90 per share) 20% 4% 15% 10% 2% 5% 0% 0% 2011 2012 2013 2014 2015 1) Payout ratio
Slide 36: IR Contact Details
K+S Group IR Contact Details K+S Aktiengesellschaft Bertha-von-Suttner-Str. 7 34131 Kassel (Germany) E-Mail: investor-relations@k-plus-s.com Homepage: www.k-plus-s.com IR-website: www.k-plus-s.com/en/ir Thorsten Boeckers Andrea Rach Head of Investor Relations Investor Relations Assistant Phone: +49
Slide 37: Forward-Looking Statements
K+S Group Forward-Looking Statements This presentation contains facts and forecasts that relate to the future development of the K+S Group and its companies. The forecasts are estimates that we have made on the basis of all the information available to us at this moment in time. Should the assumptio

Slide 38: K+S Group
K+S Group
Slide 39: K+S Share, ADR and Bond identifiers
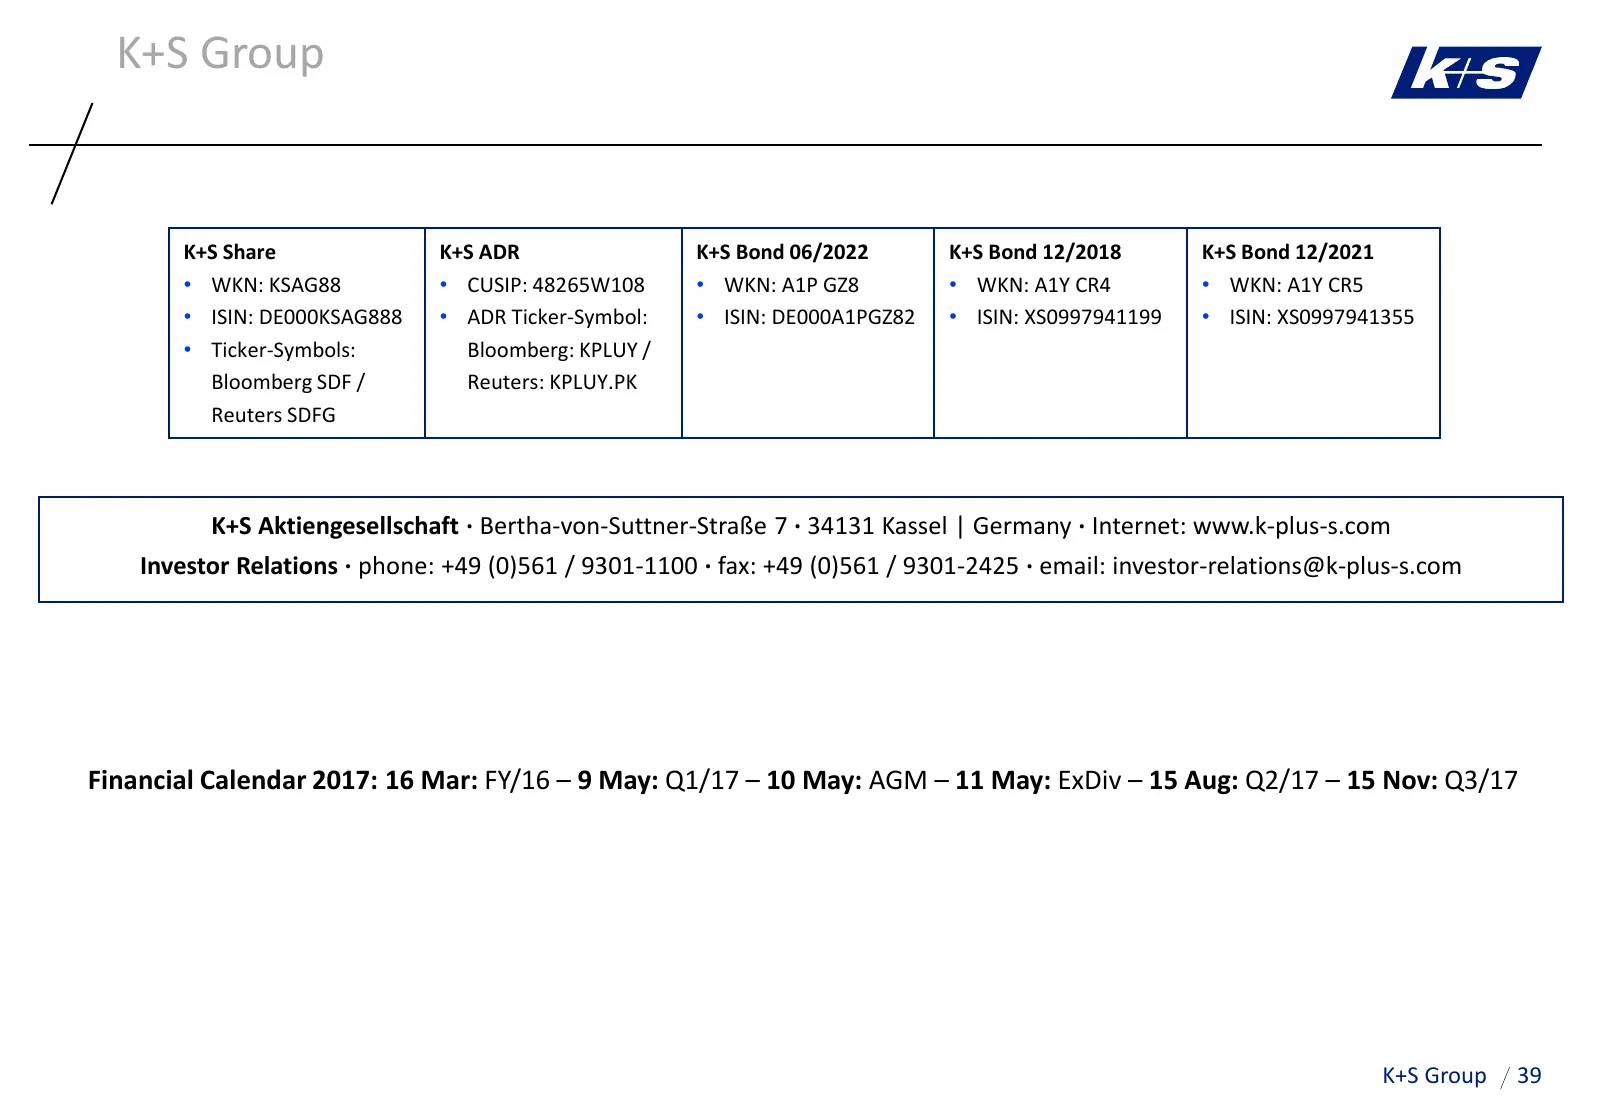
K+S Group K+S Share K+S ADR K+S Bond 06/2022 K+S Bond 12/2018 K+S Bond 12/2021 • WKN: KSAG88 • CUSIP: 48265W108 • WKN: A1P GZ8 • WKN: A1Y CR4 • WKN: A1Y CR5 • ISIN: DE000KSAG888 • ADR Ticker-Symbol: • ISIN: DE000A1PGZ82 • ISIN: XS0997941199 • ISIN: XS0997941355 • Ticker-Symbols: Bloomberg: KPLUY / B
Source: Internet Archive copy of k-plus-s.com
More decks from K+s AG
 Investor Presentation (October 2026)100 slides · October 2026
 Q2 2026 Earnings Presentation9 slides · Aug 12, 2026
 Investor Presentation (August 2026)102 slides · August 2026
 Q1 2026 Earnings Presentation11 slides · May 11, 2026
 Investor Presentation (May 2026)89 slides · May 2026
 Q4 2025 Earnings Presentation11 slides · Mar 13, 2026