comScore, Inc. · NASDAQ:SCOR
comScore — DLD Conference (2011)
15 slides from comScore's conference presentation, 2011
Slide 1: Connected Europe
CONNECTED EUROPE How smartphones and tablets are shifting media consumption Linda Abraham, CMO comScore René Schuster, CEO Telefónica Germany
Slide 2: Cross-platform consumption has created a vastly different landscape
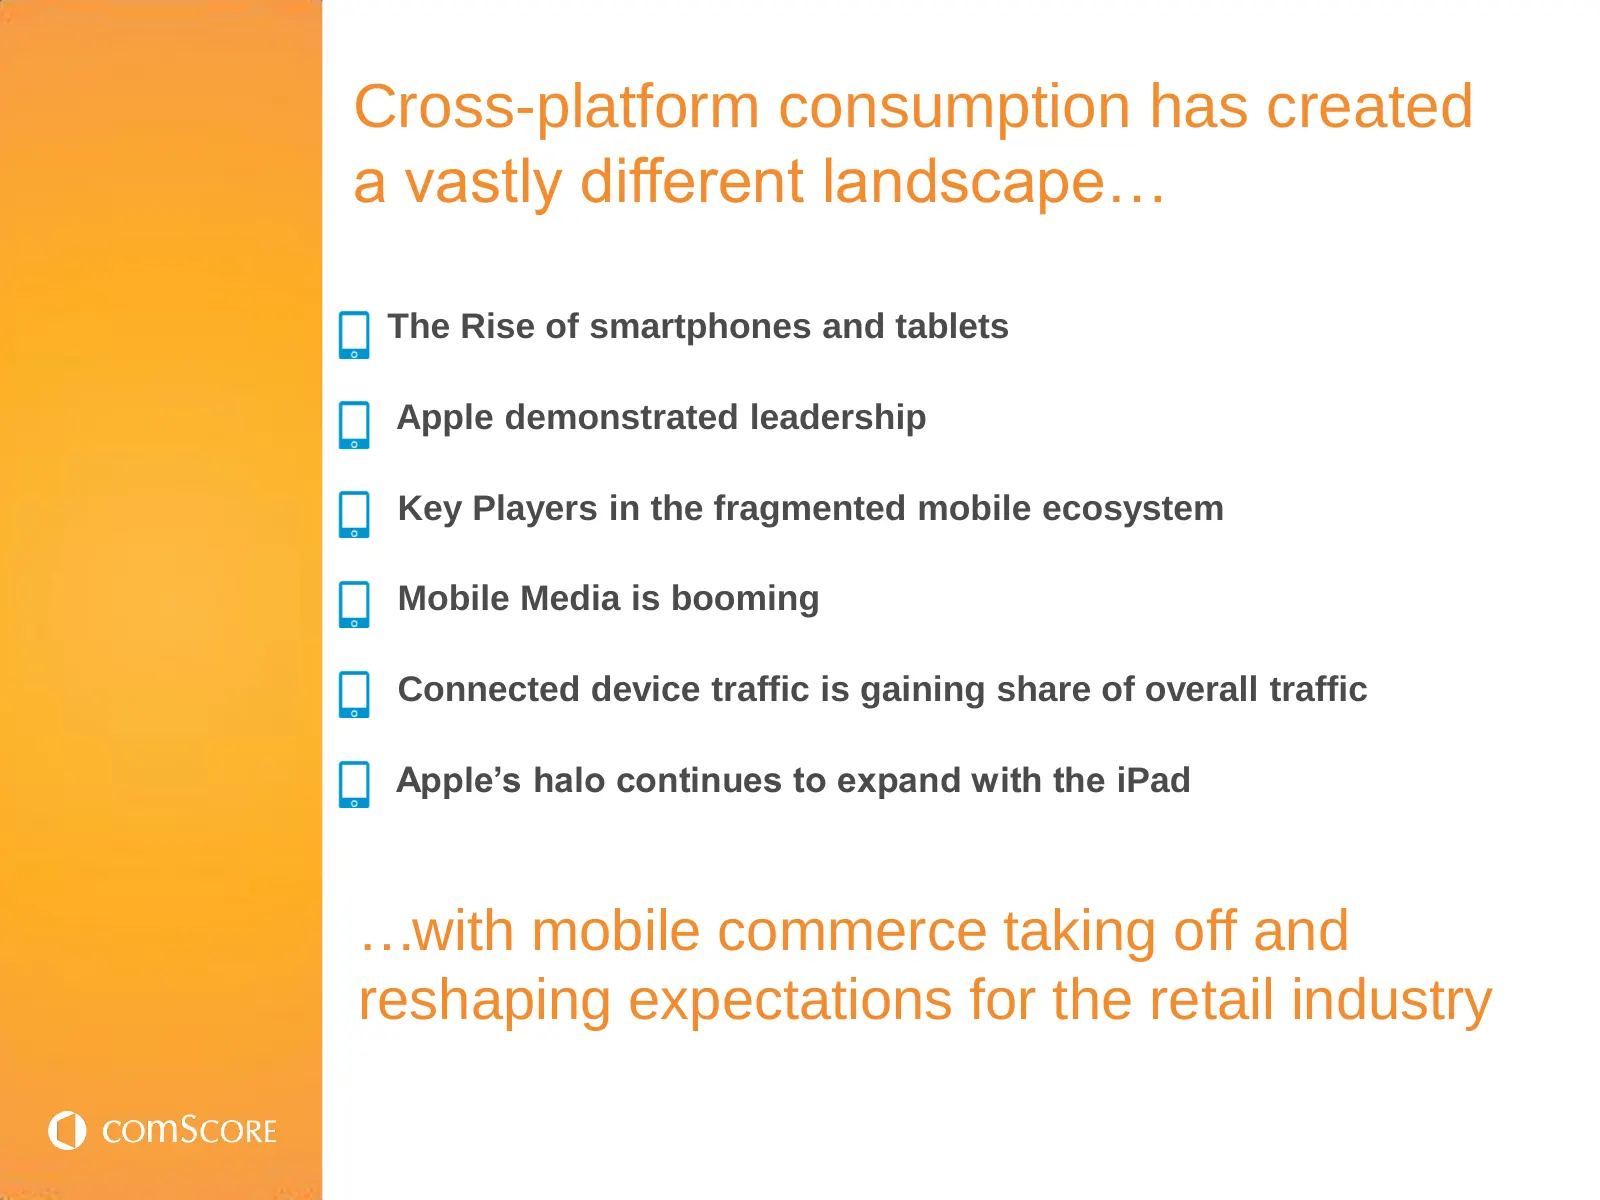
Cross-platform consumption has created a vastly different landscape… The Rise of smartphones and tablets . Apple demonstrated leadership Key Players in the fragmented mobile ecosystem Mobile Media is booming Connected device traffic is gaining share of overall traffic Apple’s halo continues to expan
Slide 3: The Rise of Smartphones: EU5 Leads the US
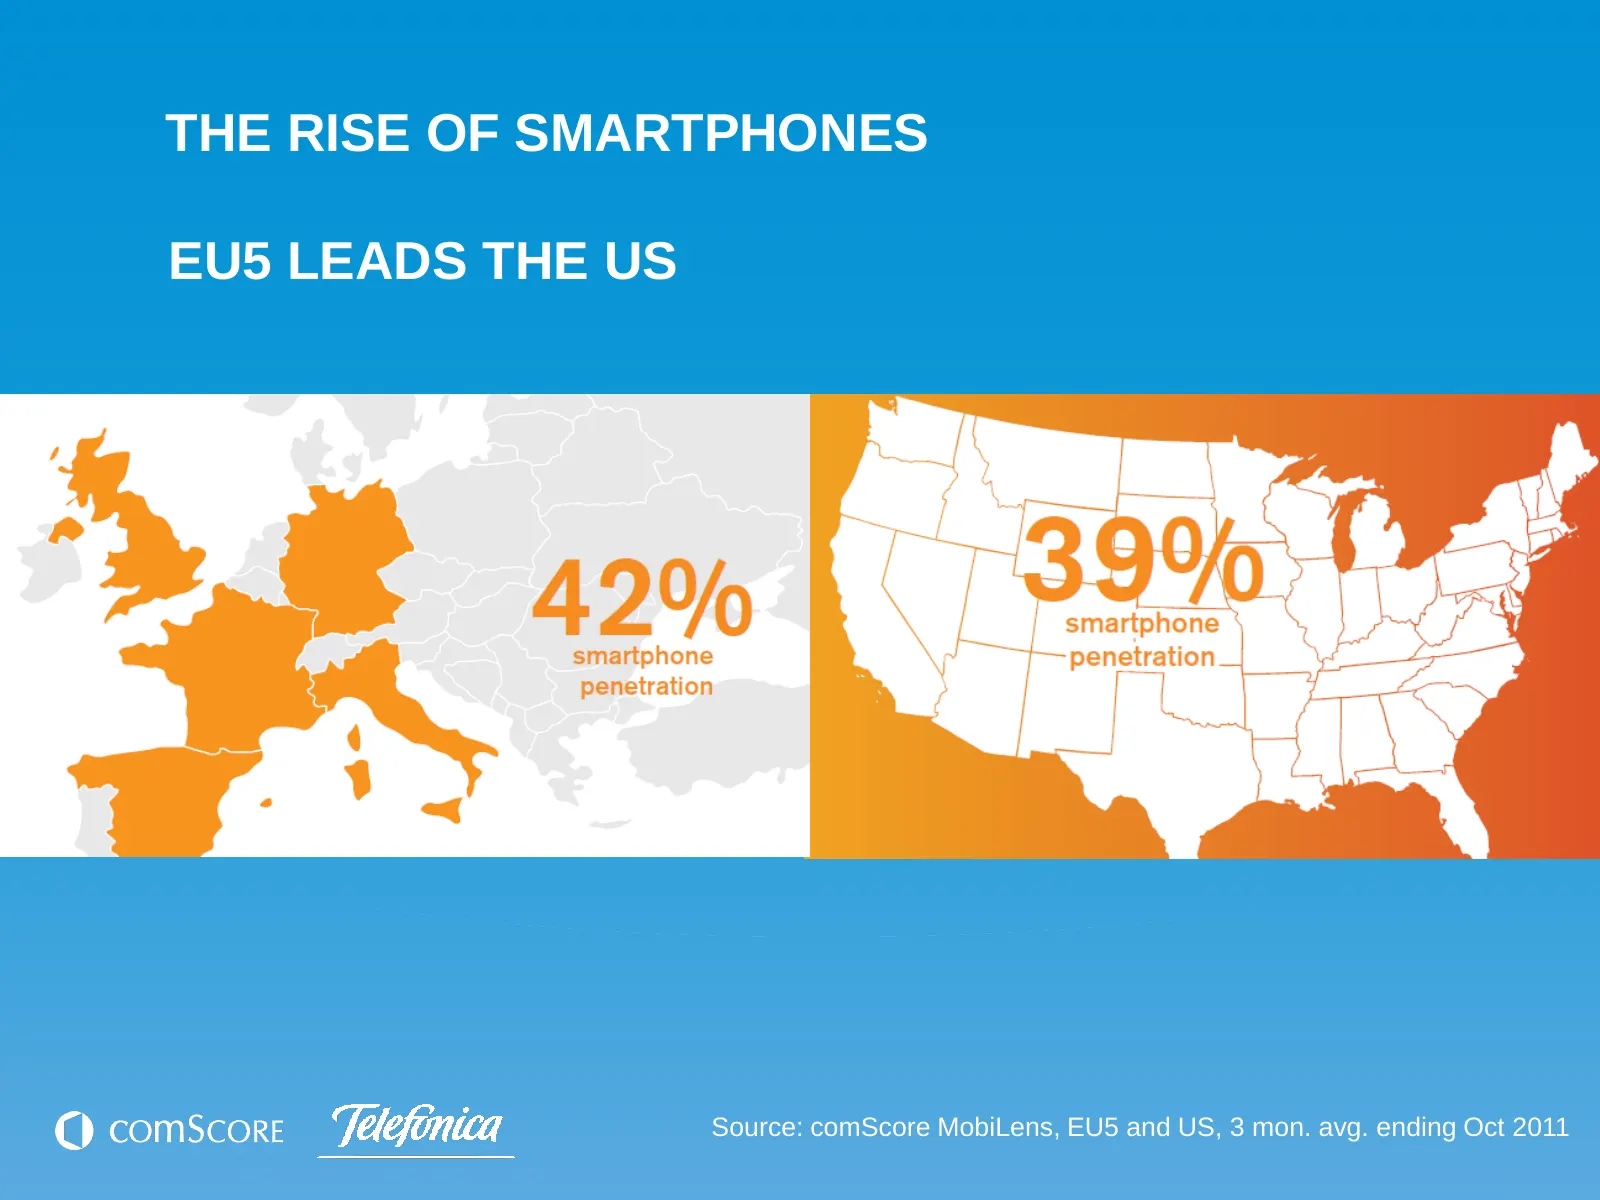
THE RISE OF SMARTPHONES EU5 LEADS THE US Source: comScore MobiLens, EU5 and US, 3 mon. avg. ending Oct 2011
Slide 4: Android Goes Mainstream
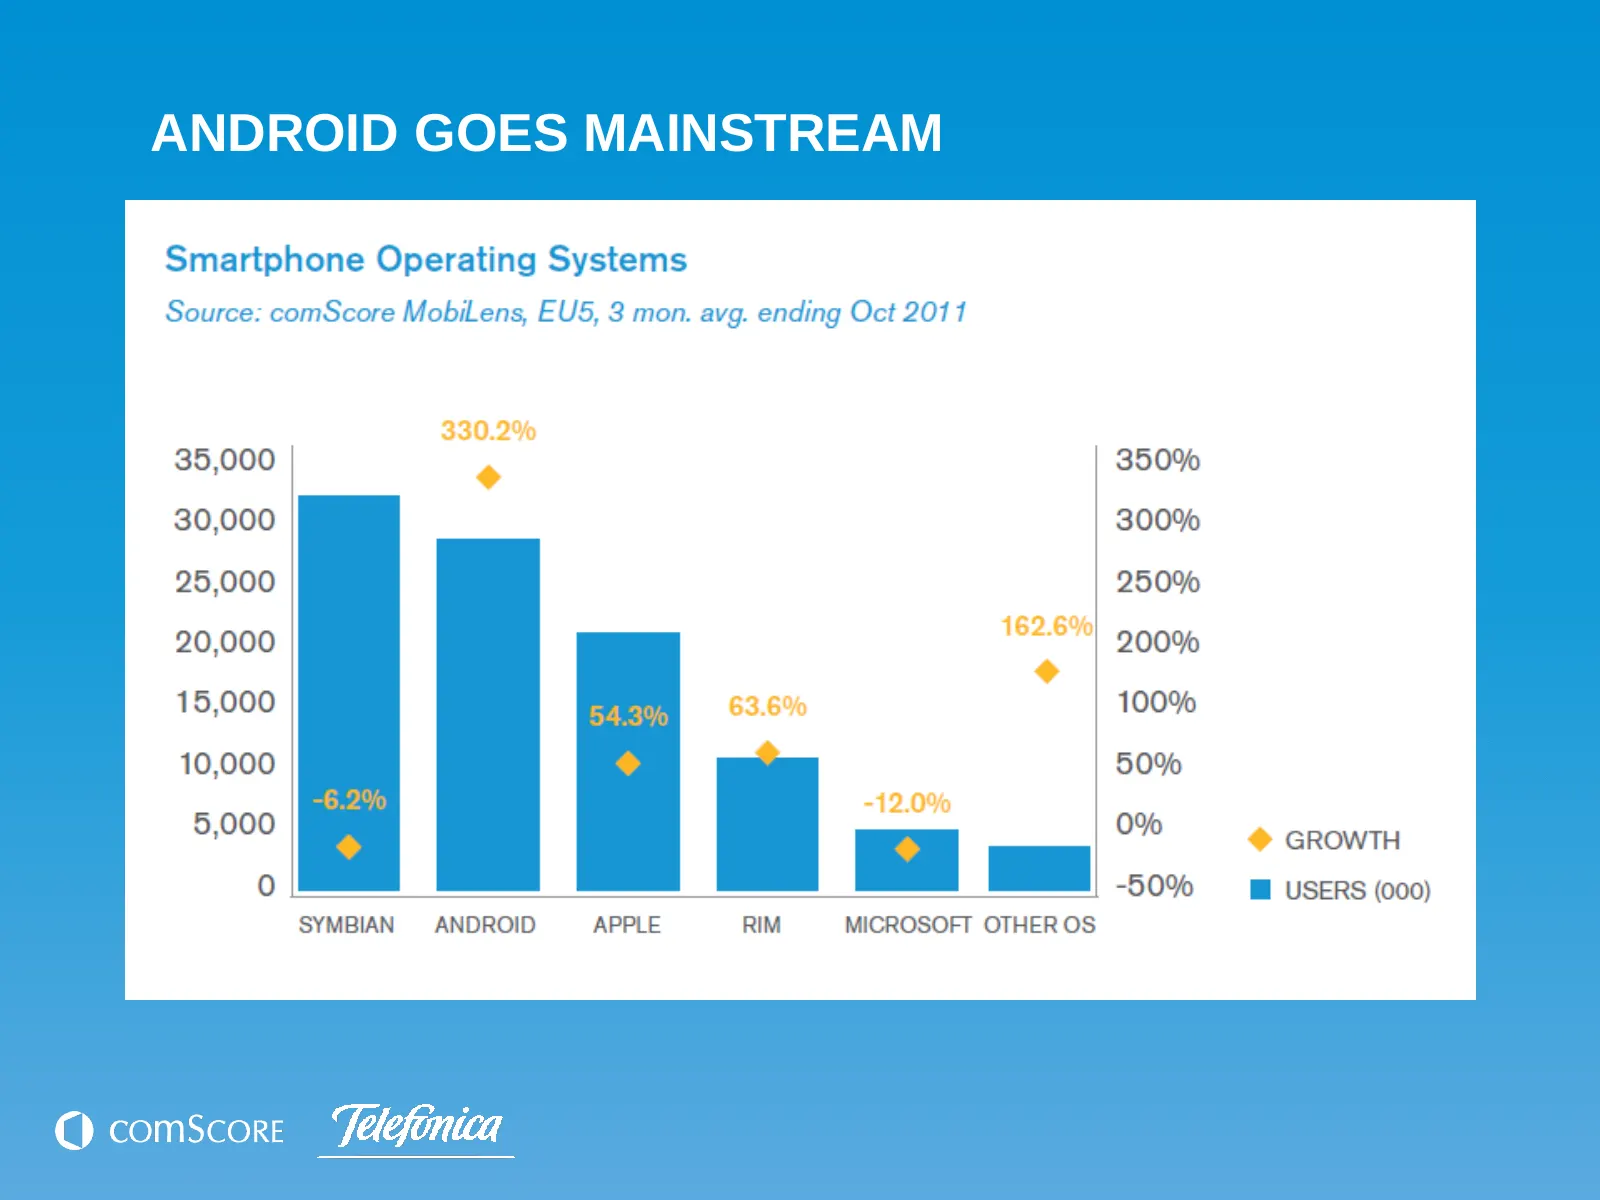
ANDROID GOES MAINSTREAM Smartphone Operating Systems Source: comScore MobiLens, EU5, 3 mon. avg. ending Oct 2011 @ GROWTH li USERS (000) Ocomscore Yeefonica
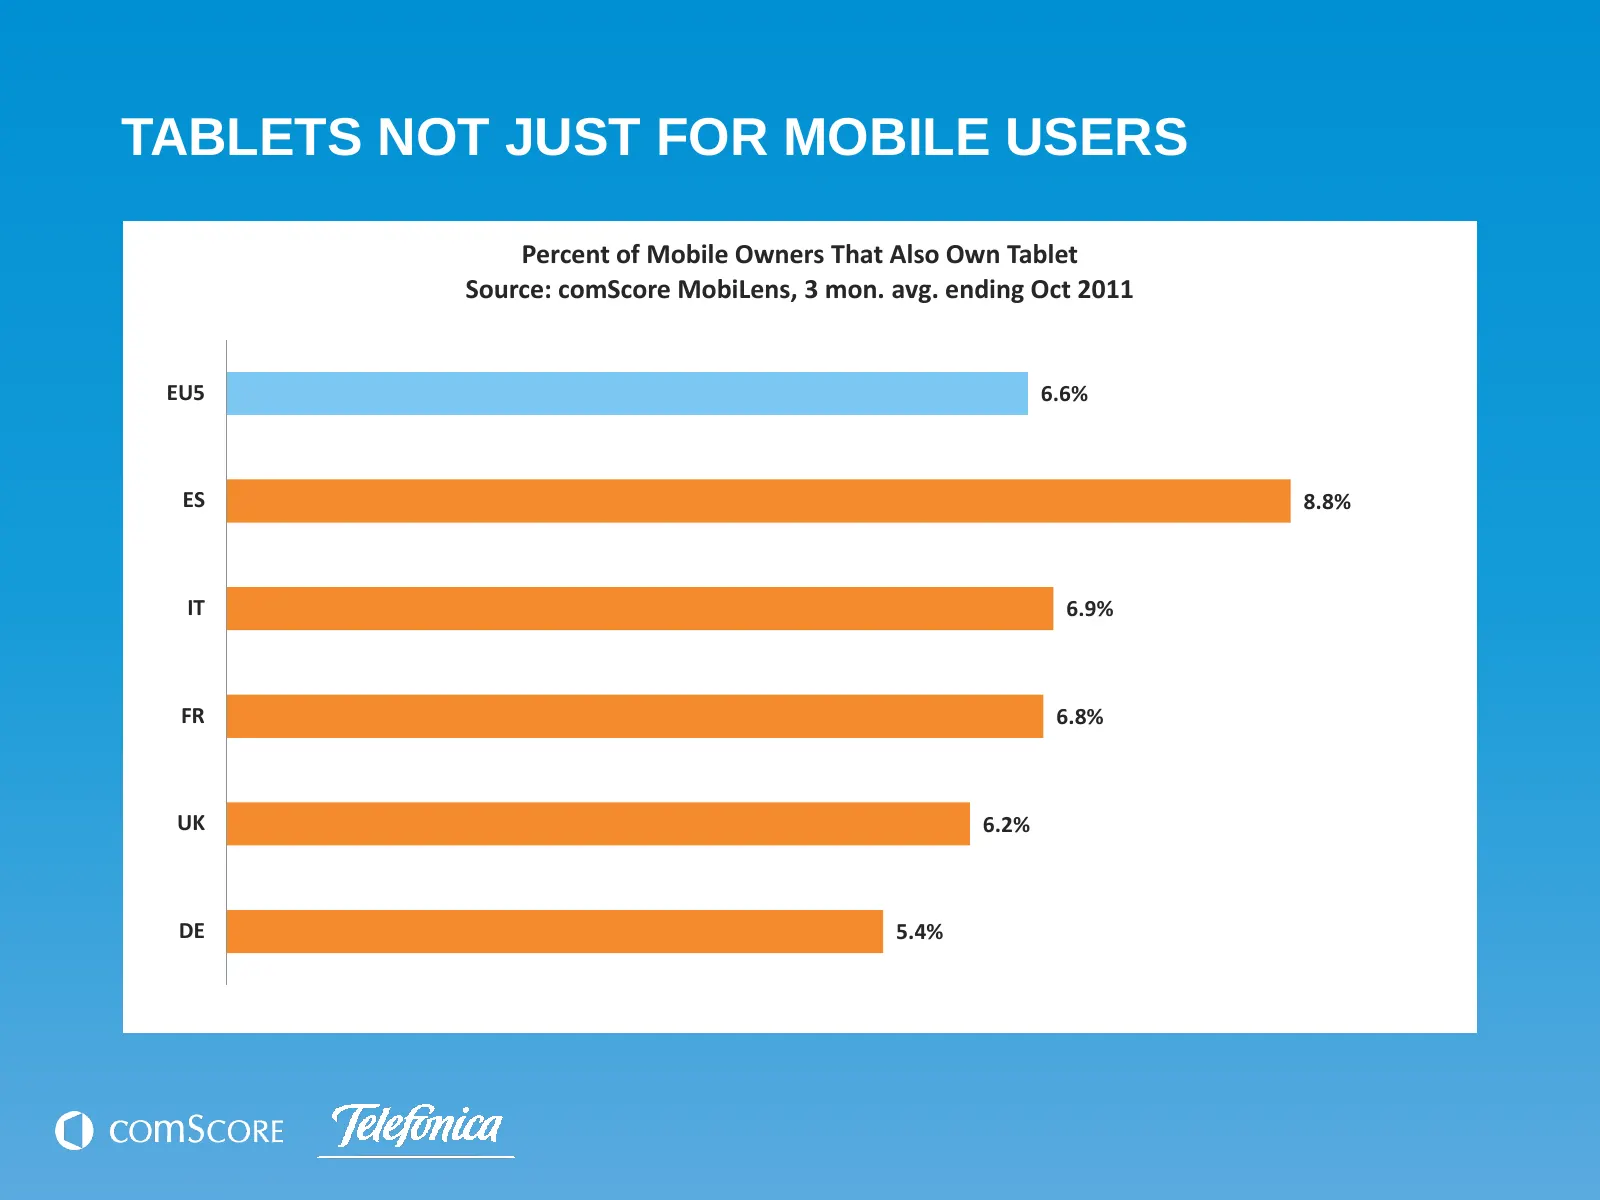
Slide 5: Tablets Not Just for Mobile Users
TABLETS NOT JUST FOR MOBILE USERS Percent of Mobile Owners That Also Own Tablet Source: comScore MobiLens, 3 mon. avg. ending Oct 2011 EU5 6.6% ES 8.8% IT 6.9% FR 6.8% UK 6.2% DE 5.4%
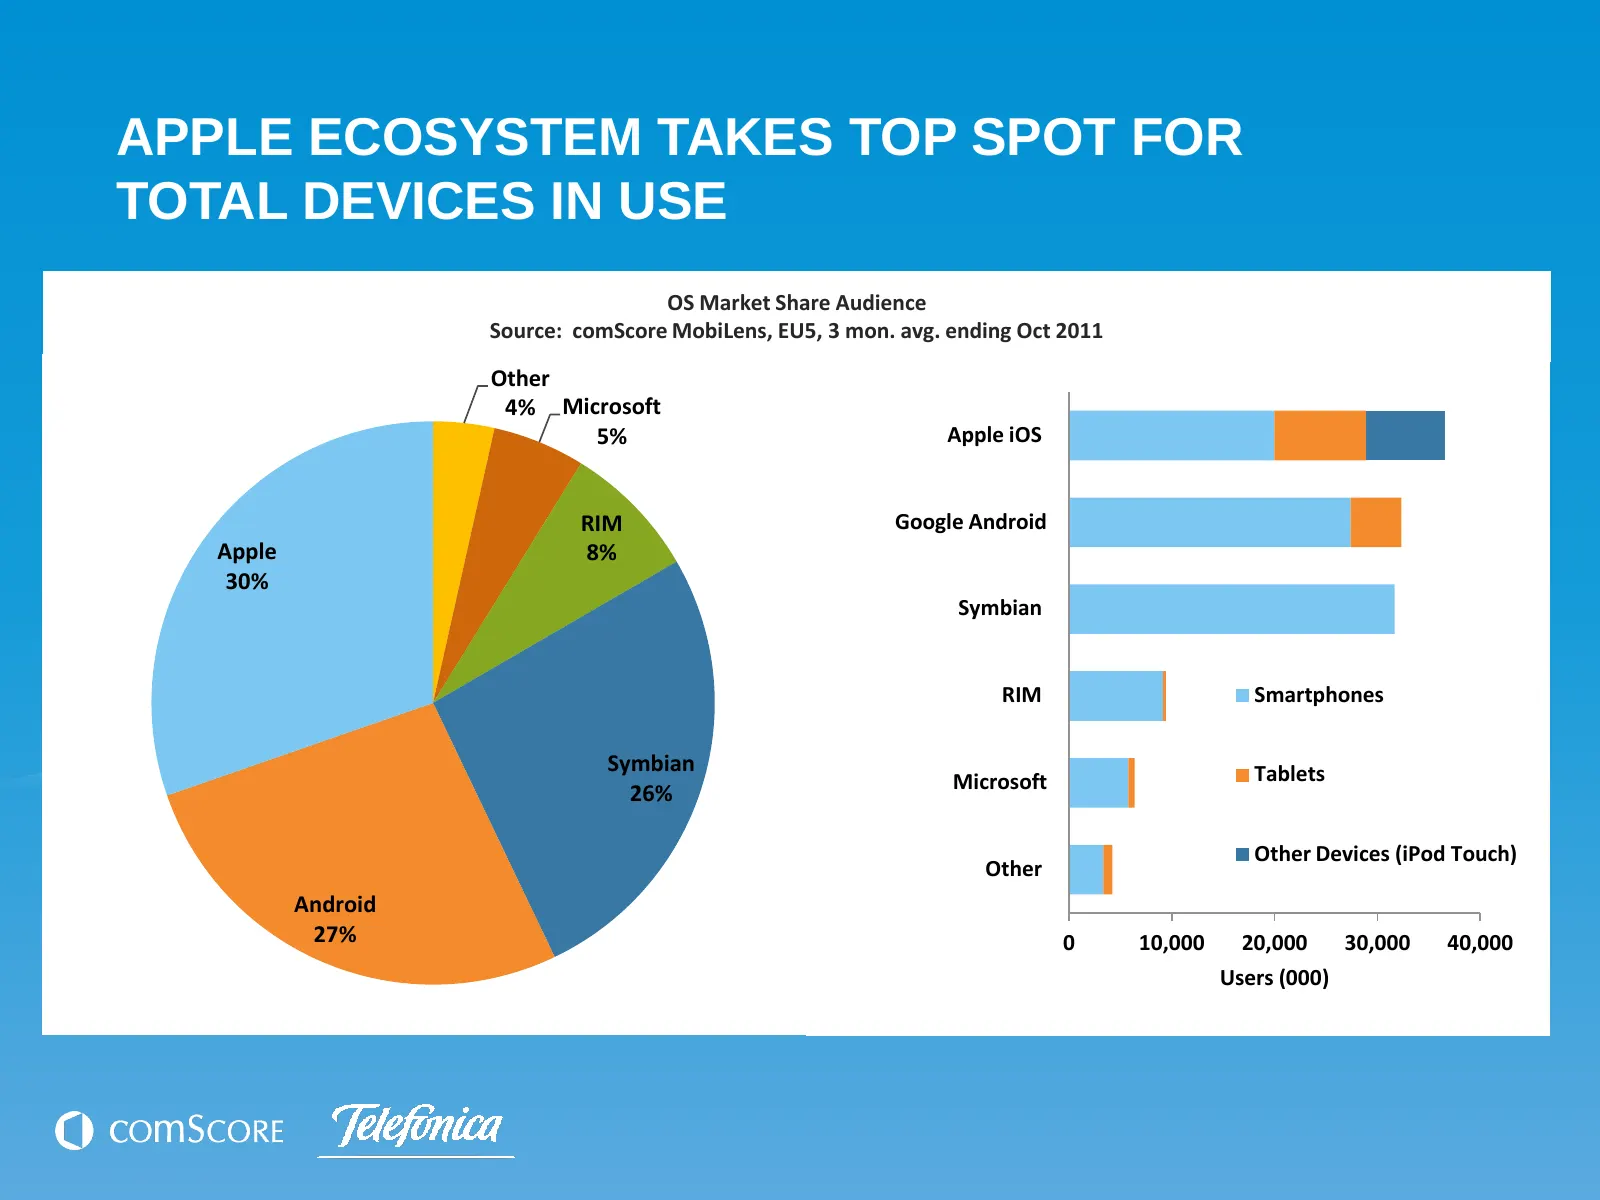
Slide 6: Apple Ecosystem Takes Top Spot for Total Devices in Use
APPLE ECOSYSTEM TAKES TOP SPOT FOR TOTAL DEVICES IN USE OS Market Share Audience Source: comScore MobiLens, EU5, 3 mon. avg. ending Oct 2011 Other 4% Microsoft 5% Apple iOS RIM Google Android Apple 8% 30% Symbian RIM Smartphones Symbian Tablets 26% Microsoft Other Devices (iPod Touch) Other Android
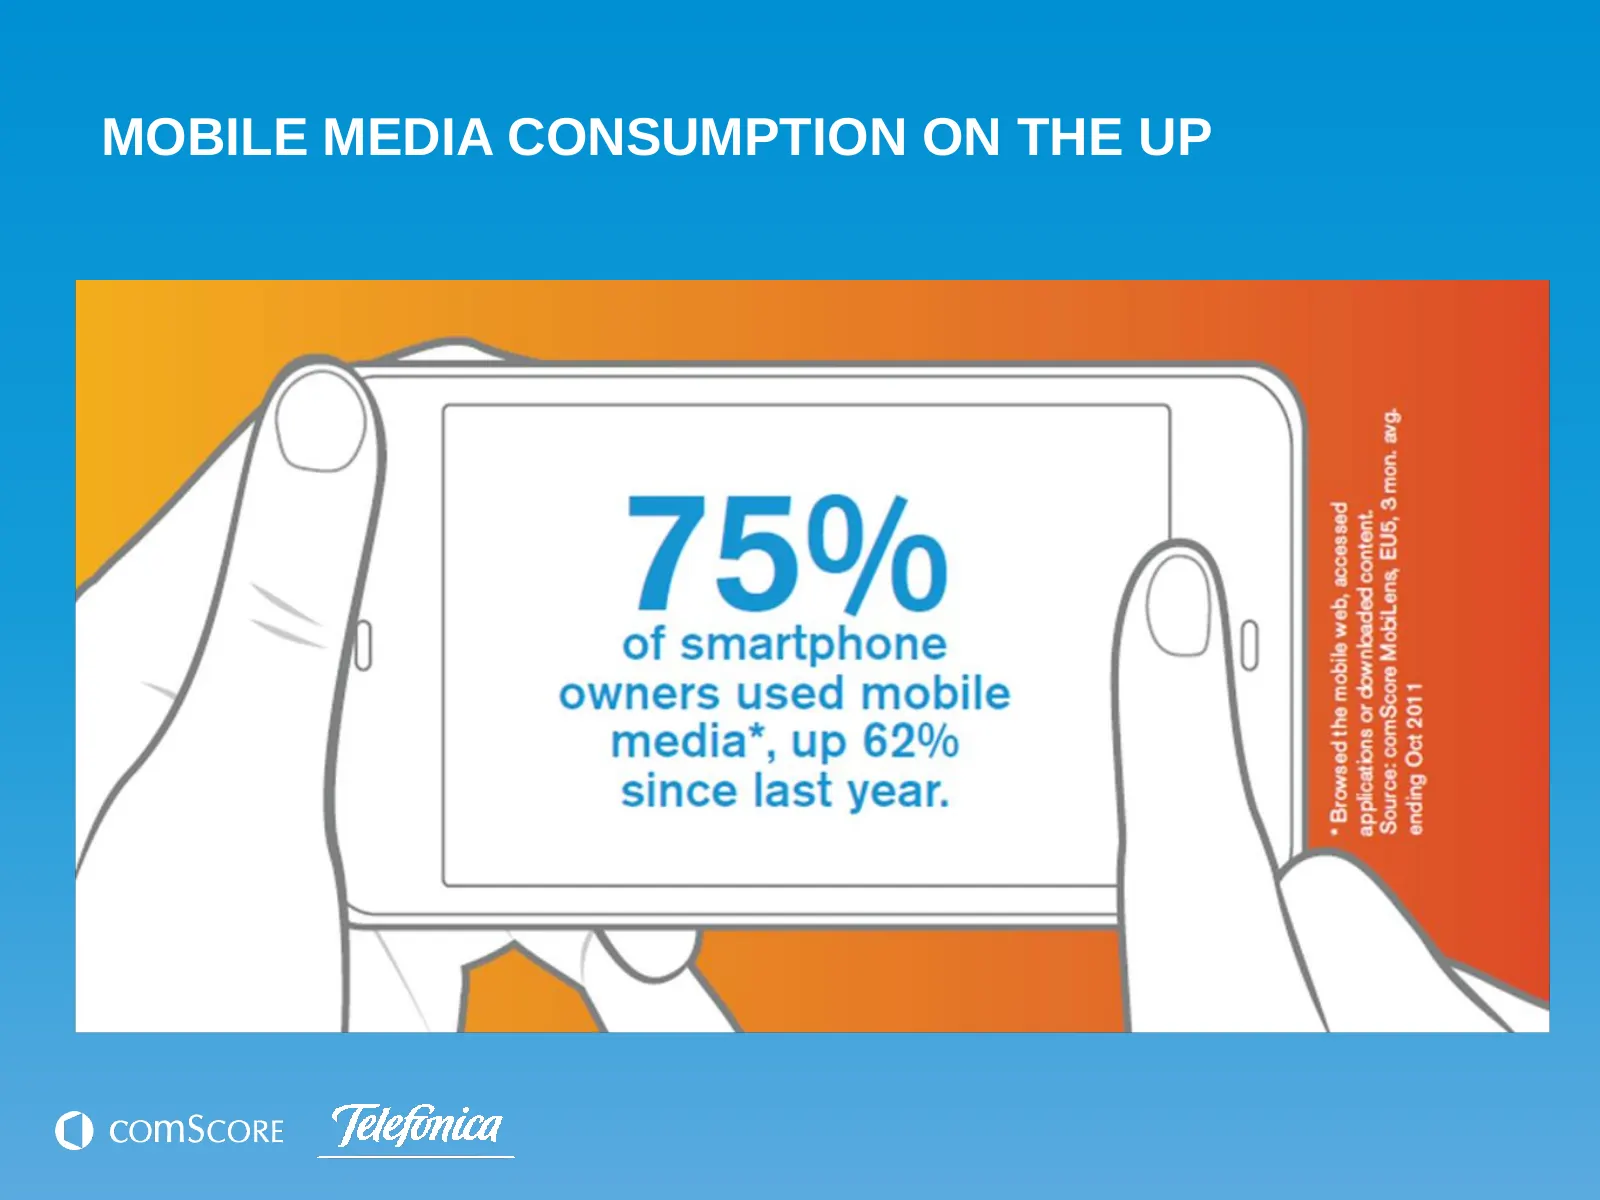
Slide 7: Mobile Media Consumption on the Up
MOBILE MEDIA CONSUMPTION ON THE UP
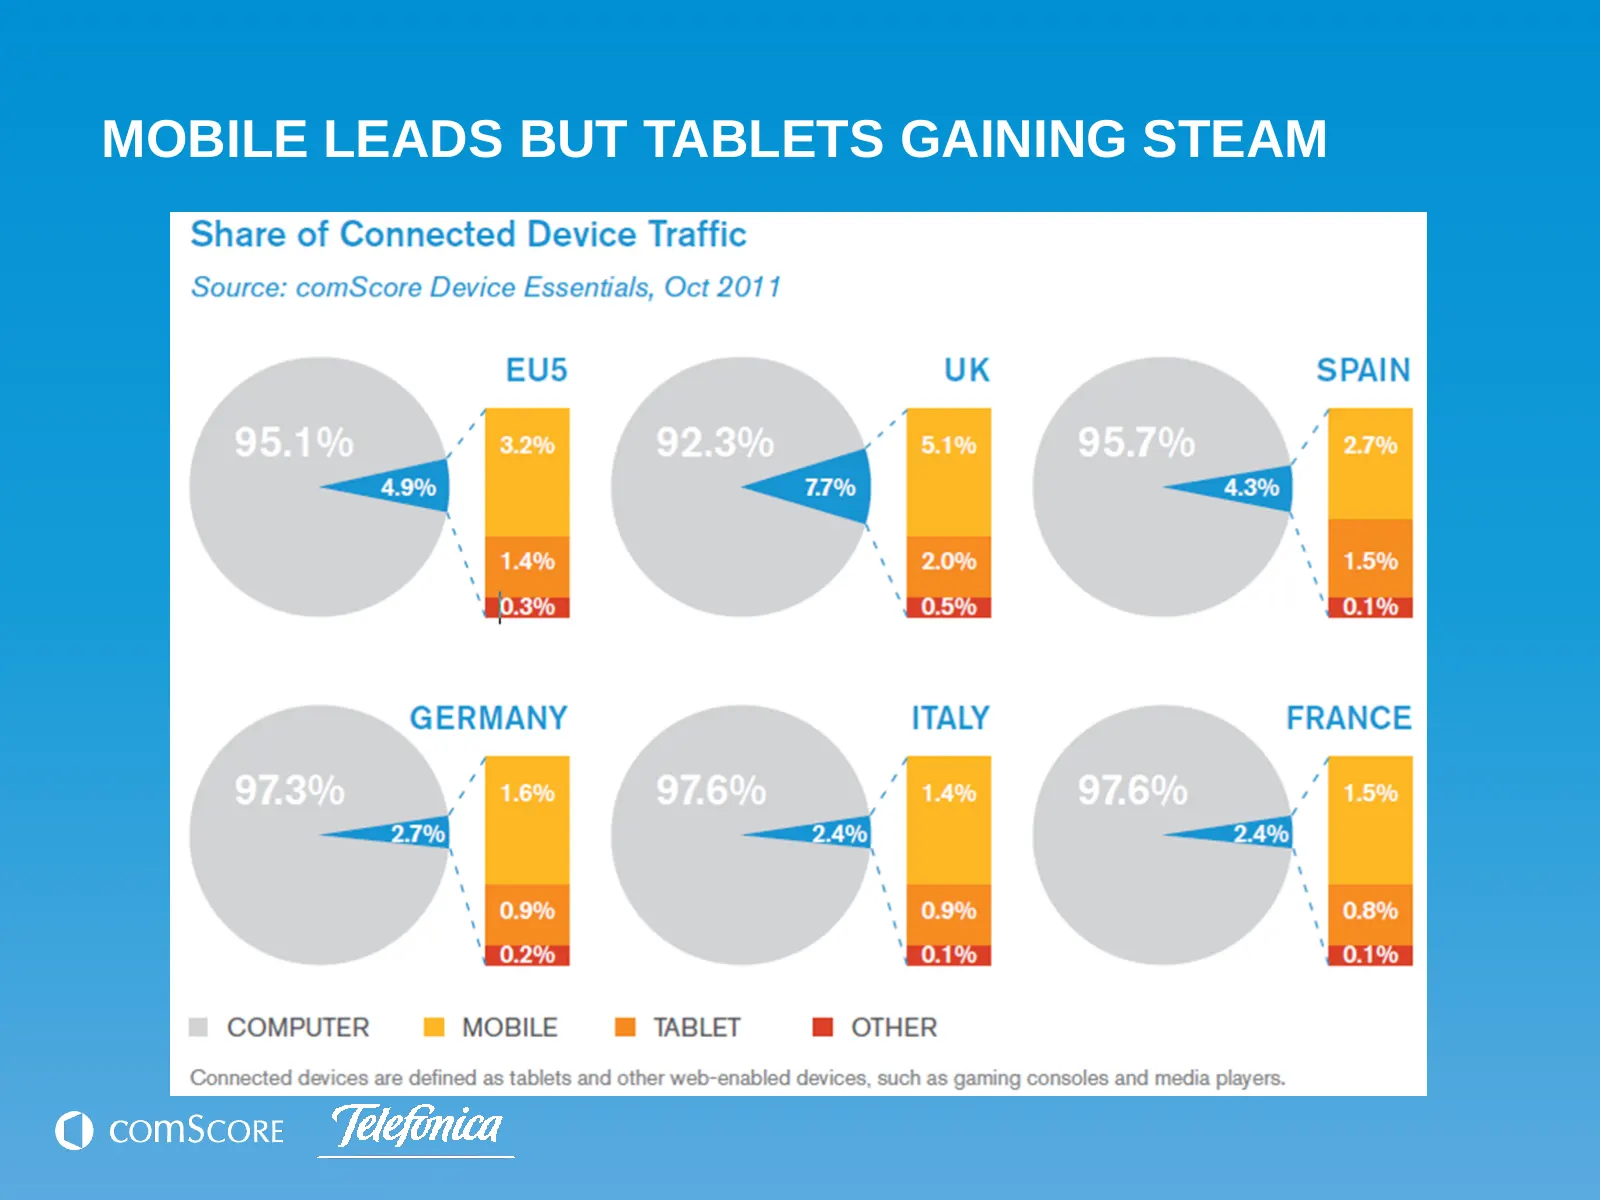
Slide 8: Mobile Leads but Tablets Gaining Steam
MOBILE LEADS BUT TABLETS GAINING STEAM
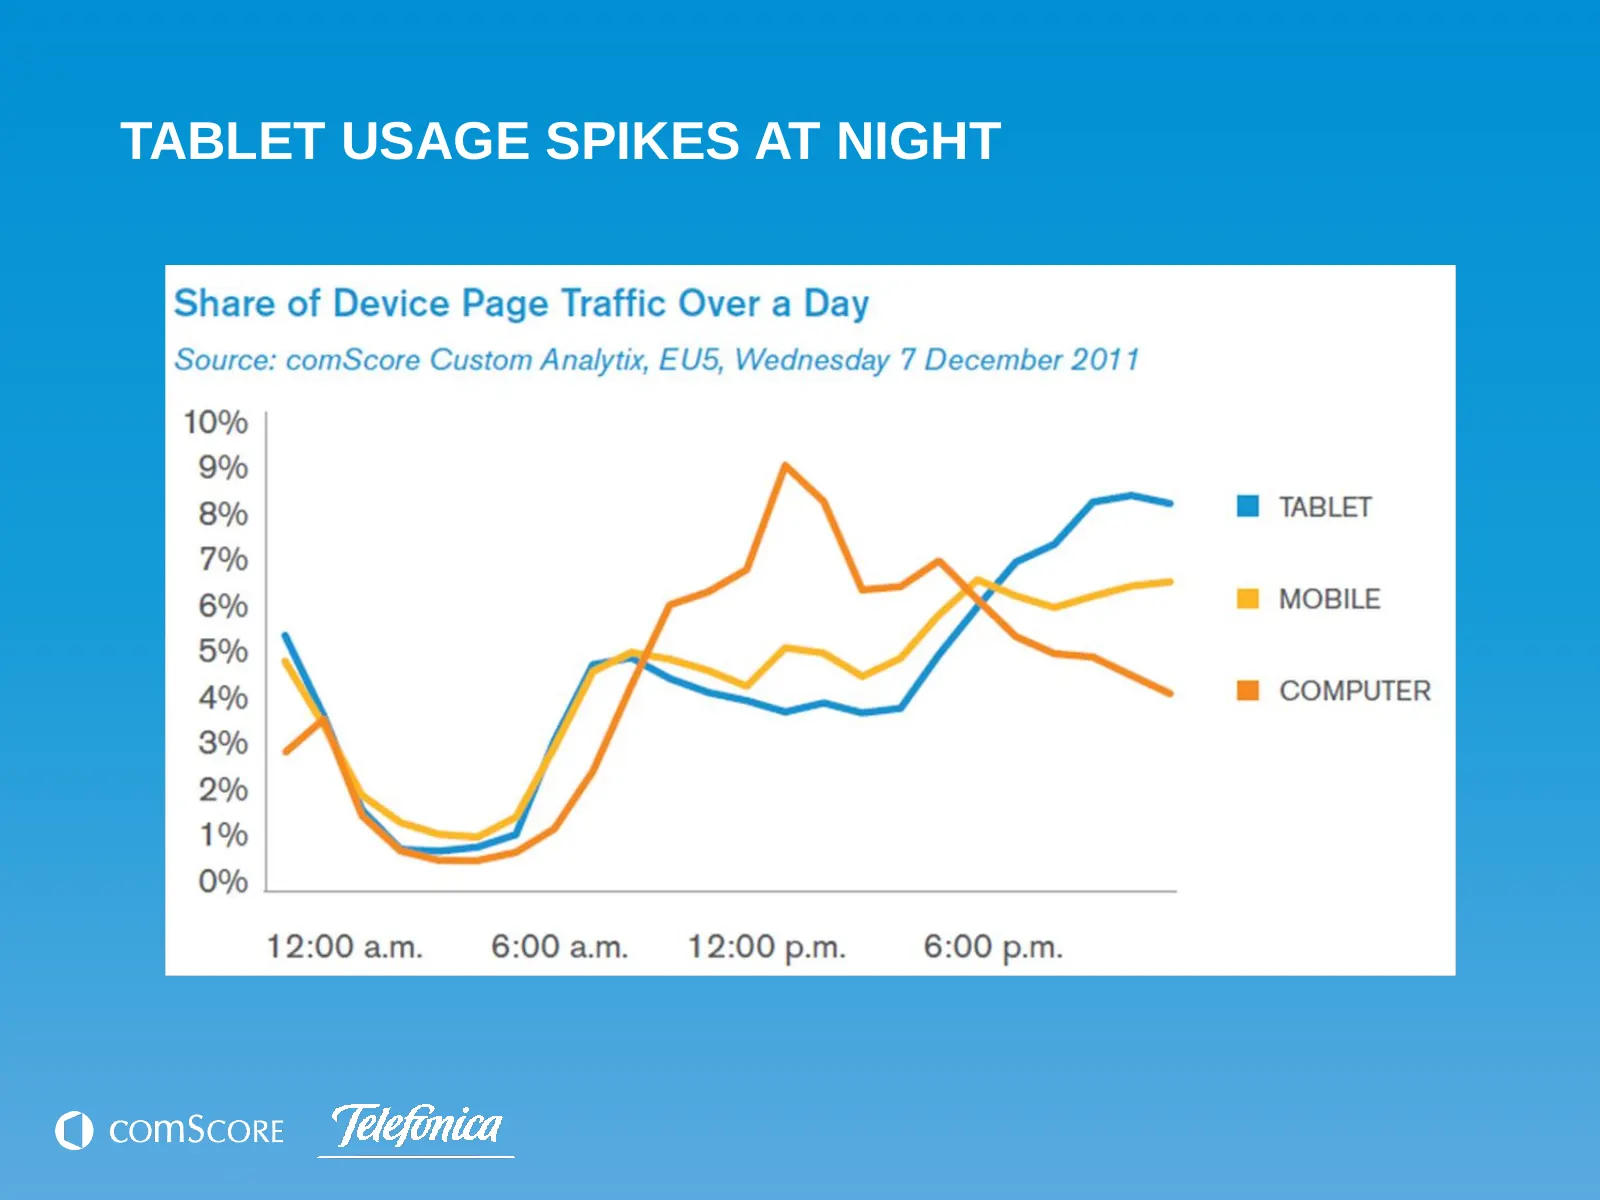
Slide 9: Tablet Usage Spikes at Night
TABLET USAGE SPIKES AT NIGHT Share of Device Page Traffic Over a Day Source: comScore Custom Analytix, EUS, Wednesday 7 December 2011 1 0% 9% 8% 7% 6% 5% 4% 12:00am. 6:00am. 12:00p.m. 6:00 p.m. Ocomscore Yeefonica
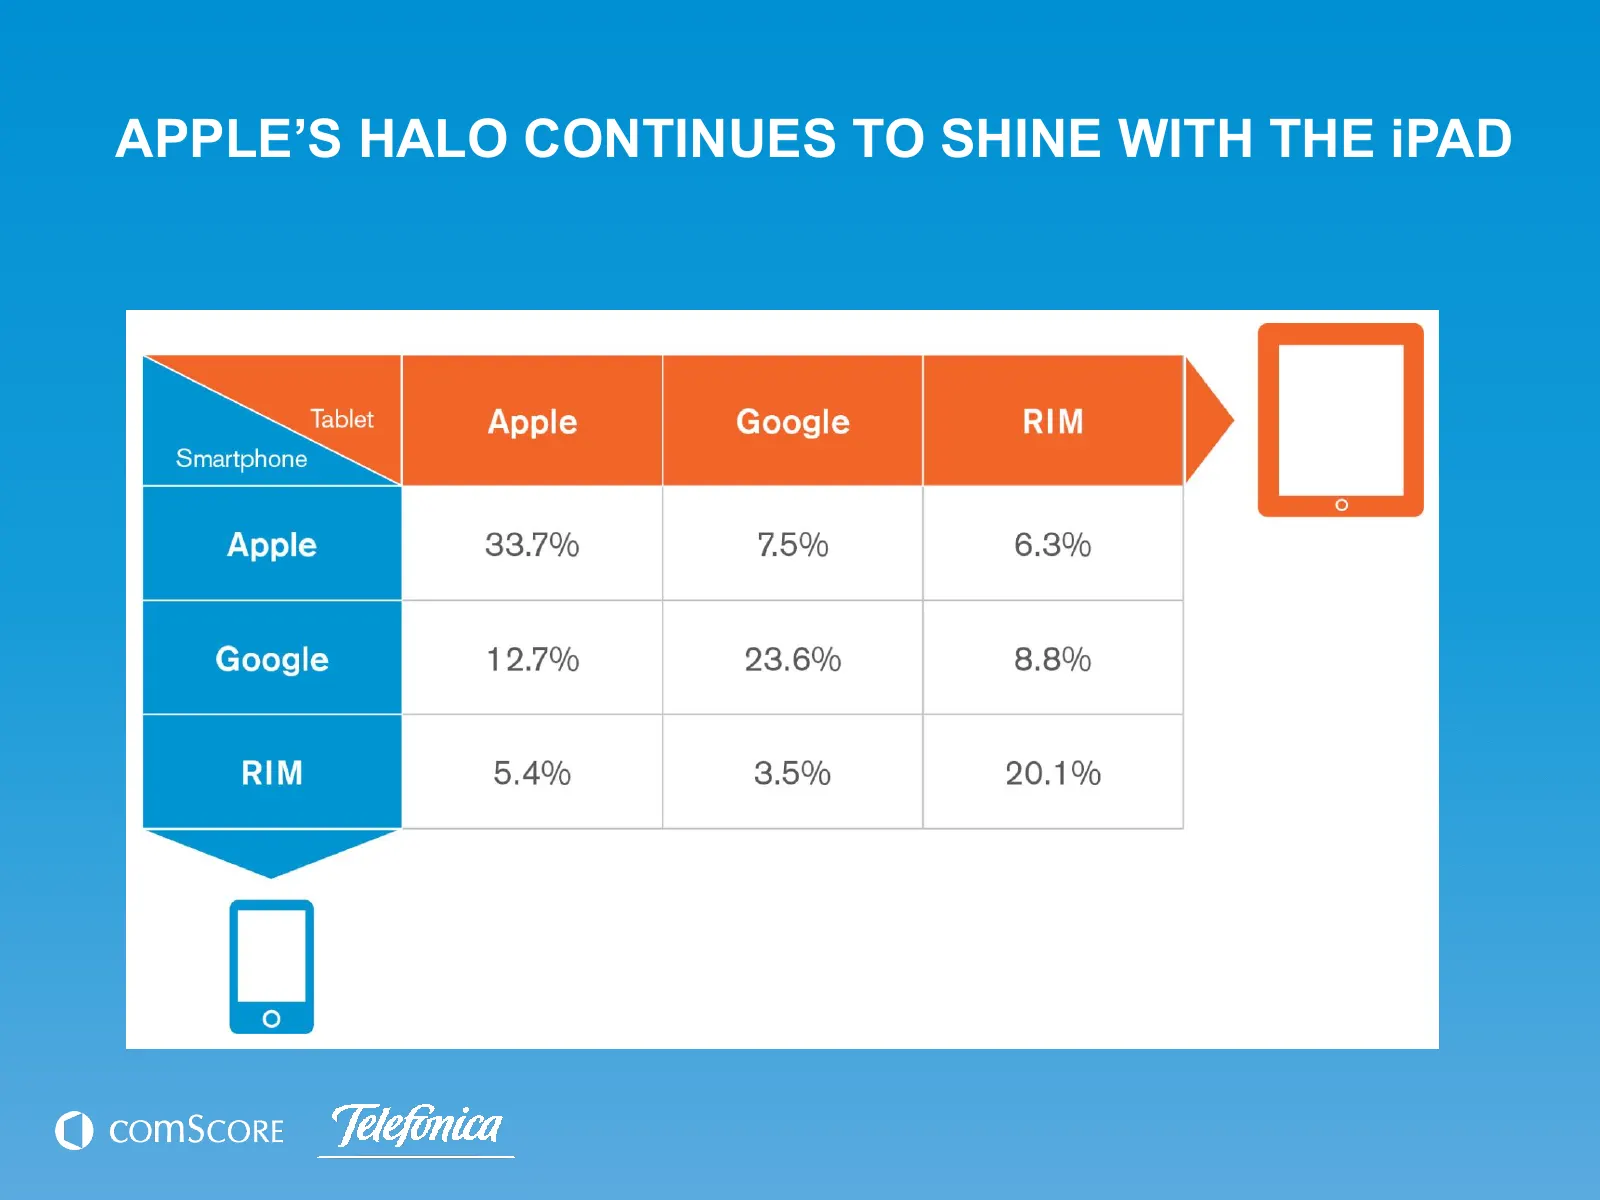
Slide 10: Apple's Halo Continues to Shine with the iPad
APPLE’S HALO CONTINUES TO SHINE WITH THE iPAD Tablet Ownership Amongst Smartphone Owners Source: comScore MobiLens, EU5, 3 mon. avg. ending Oct 2011
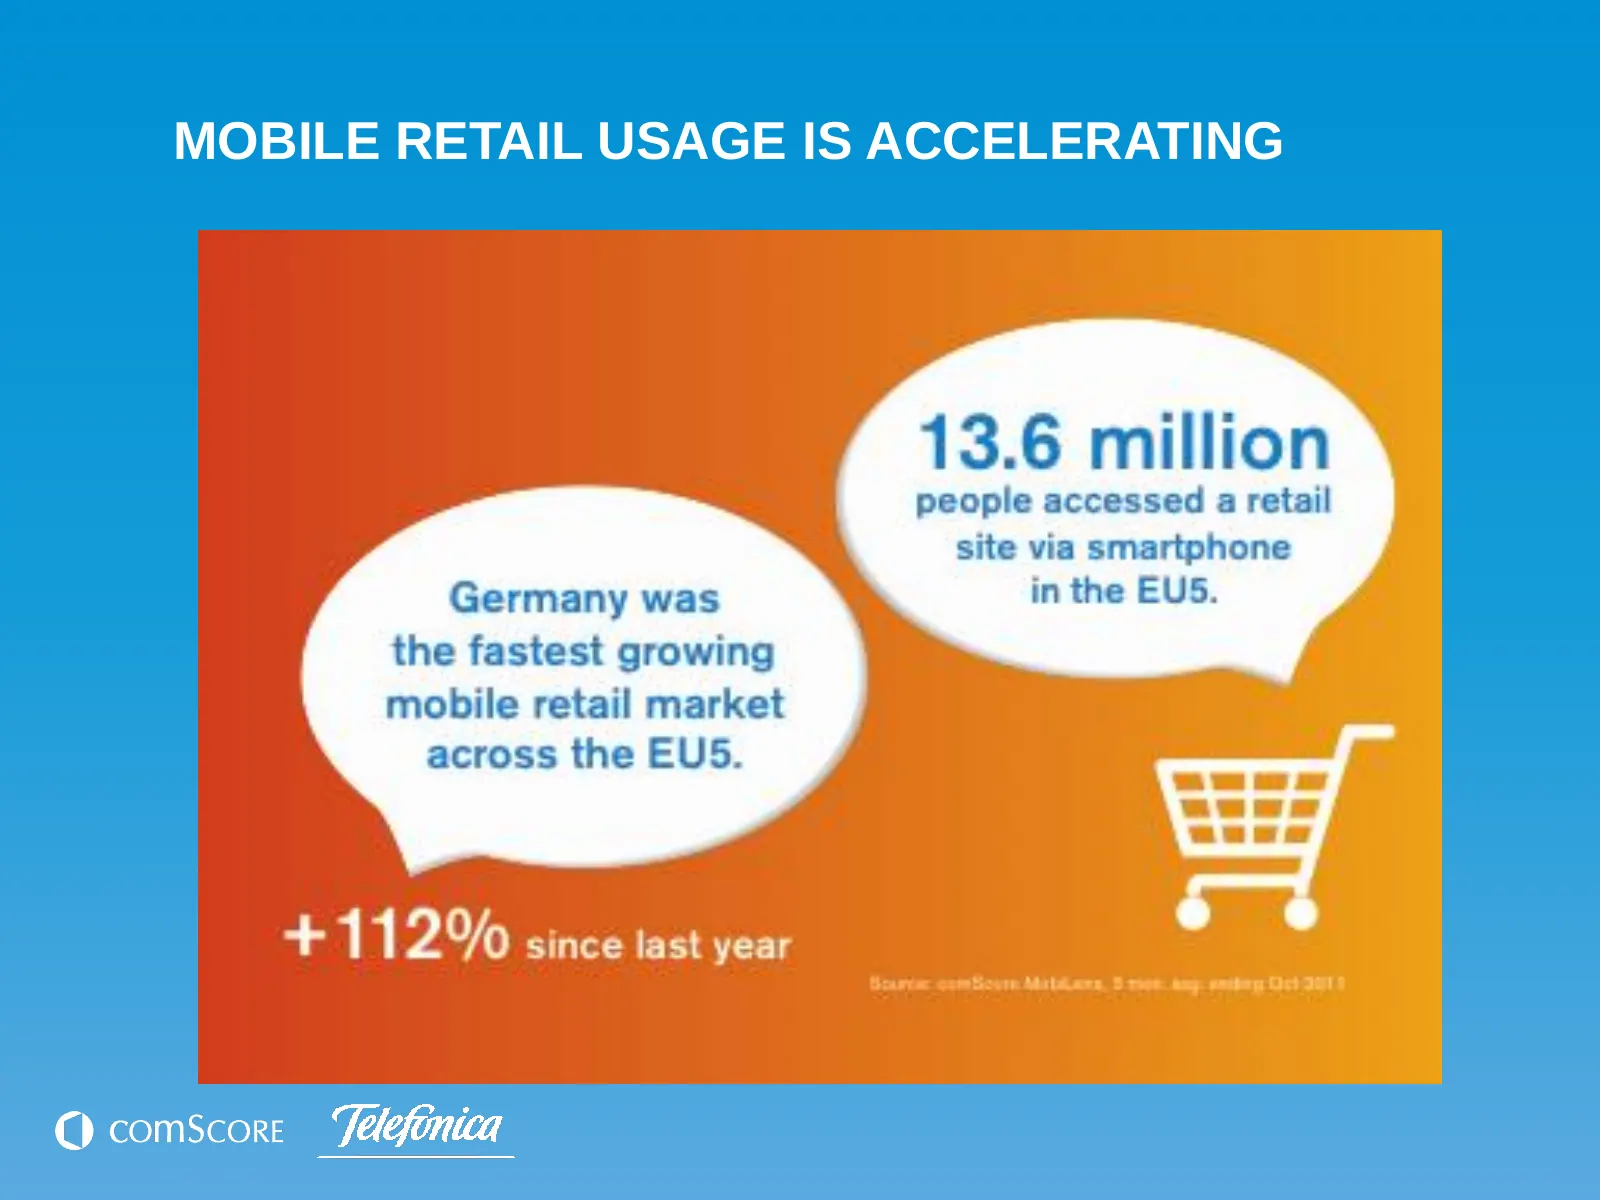
Slide 11: Mobile Retail Usage Is Accelerating
MOBILE RETAIL USAGE IS ACCELERATING
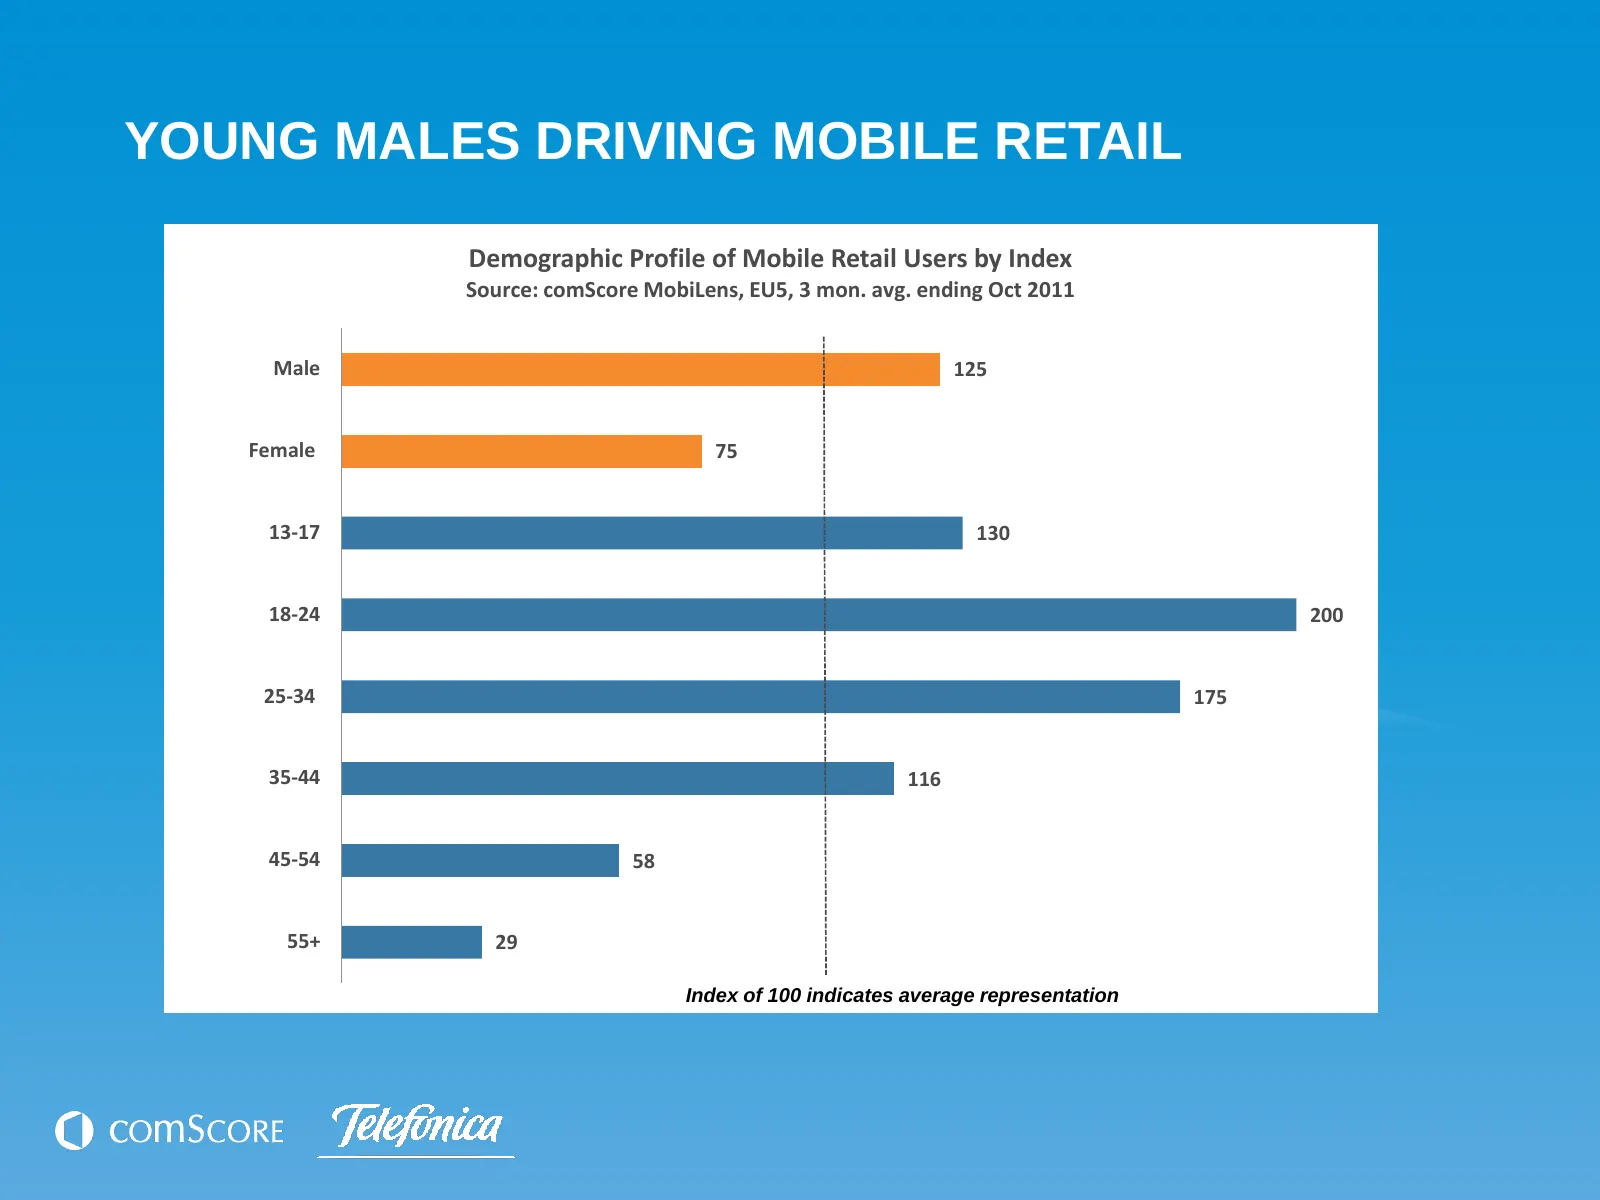
Slide 12: Young Males Driving Mobile Retail
YOUNG MALES DRIVING MOBILE RETAIL Demographic Profile of Mobile Retail Users by Index Source: comScore MobiLens, EU5, 3 mon. avg. ending Oct 2011 Male 125 Female 75 13-17 130 18-24 200 25-34 175 35-44 116 45-54 58 55+ 29 Index of 100 indicates average representation
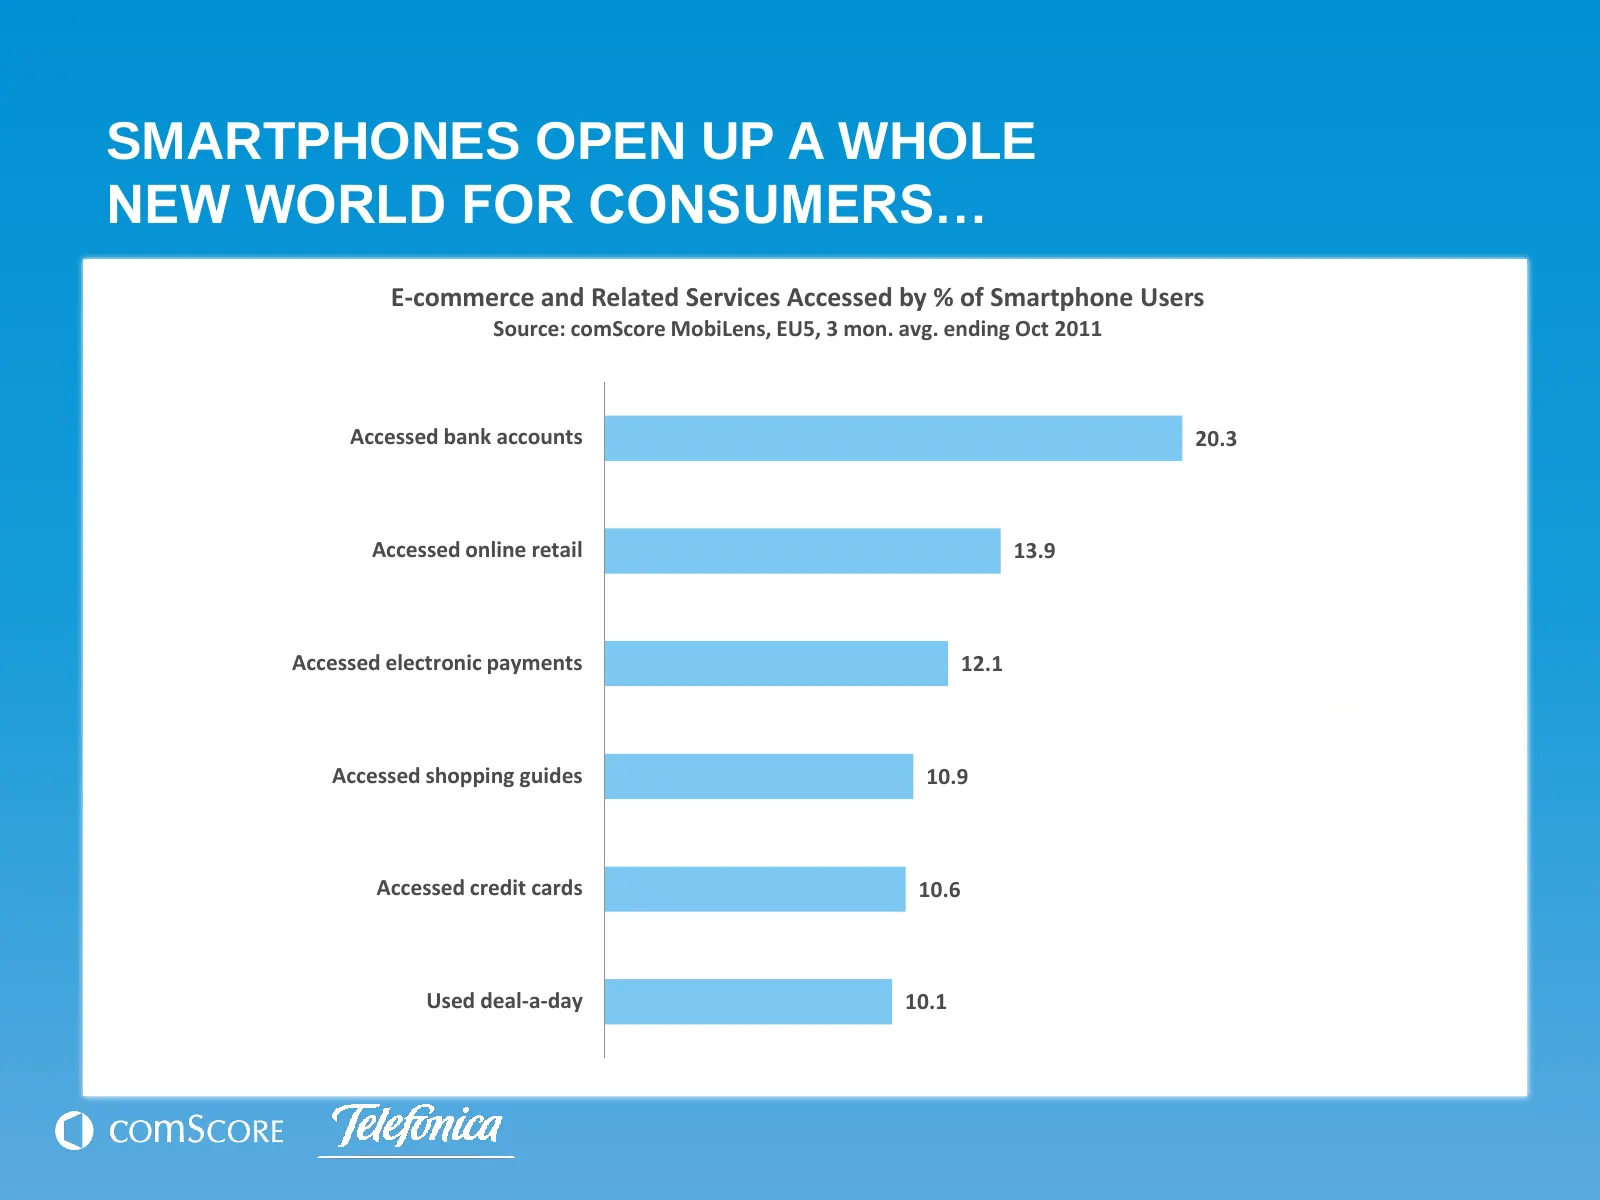
Slide 13: Smartphones Open Up a Whole New World for Consumers
SMARTPHONES OPEN UP A WHOLE NEW WORLD FOR CONSUMERS… E-commerce and Related Services Accessed by % of Smartphone Users Source: comScore MobiLens, EU5, 3 mon. avg. ending Oct 2011 Accessed bank accounts 20.3 Accessed online retail 13.9 Accessed electronic payments 12.1 Accessed shopping guides 10.9 A
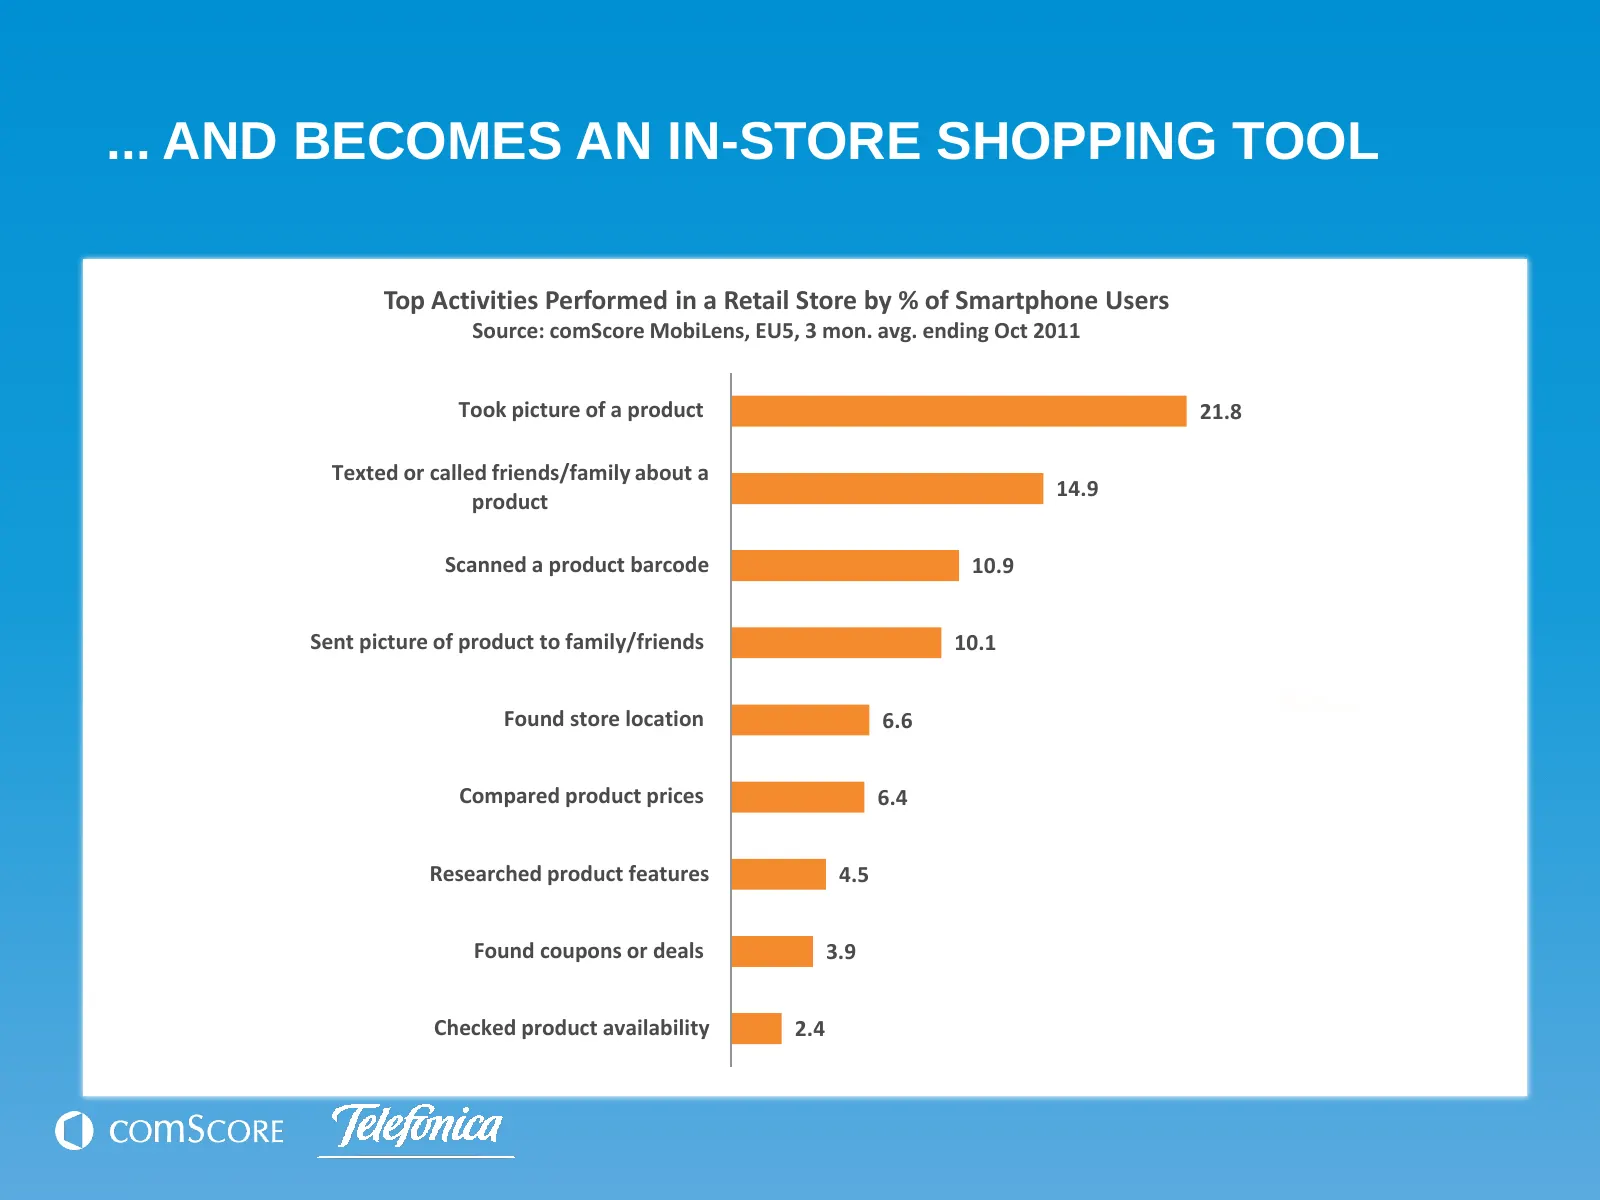
Slide 14: ...And Becomes an In-Store Shopping Tool
... AND BECOMES AN IN-STORE SHOPPING TOOL Top Activities Performed in a Retail Store by % of Smartphone Users Source: comScore MobiLens, EU5, 3 mon. avg. ending Oct 2011 Took picture of a product 21.8 Texted or called friends/family about a 14.9 product Scanned a product barcode 10.9 Sent picture of
Slide 15: Connected Europe
Connected Europe Download a complimentary copy of the report www.comscore.com/connected-europe Questions? Email worldpress@comscore.com or reach out on Twitter @comScoreEMEA
Source: Internet Archive copy of comscore.com
More decks from comScore, Inc.
 Q3 2026 Earnings Presentation17 slides · Nov 3, 2026
 Q2 2026 Earnings Presentation20 slides · Aug 12, 2026
 Investor Presentation (June 2026)27 slides · Jun 10, 2026
 Q4 2025 Earnings Presentation13 slides · Mar 17, 2026
 Q3 2025 Earnings Presentation15 slides · Nov 4, 2025
 Q2 2025 Earnings Presentation11 slides · Aug 5, 2025