Havas NV · EURONEXT:HAVAS
Havas NV — Shareholder Meeting (May 2004)
86 slides from Havas NV's shareholder meeting presentation, May 26, 2004
Slide 1: Annual General Meeting
ANNUAL GENERAL MEETING Suresnes - May 26, 2004
Slide 2: Forward-Looking Information
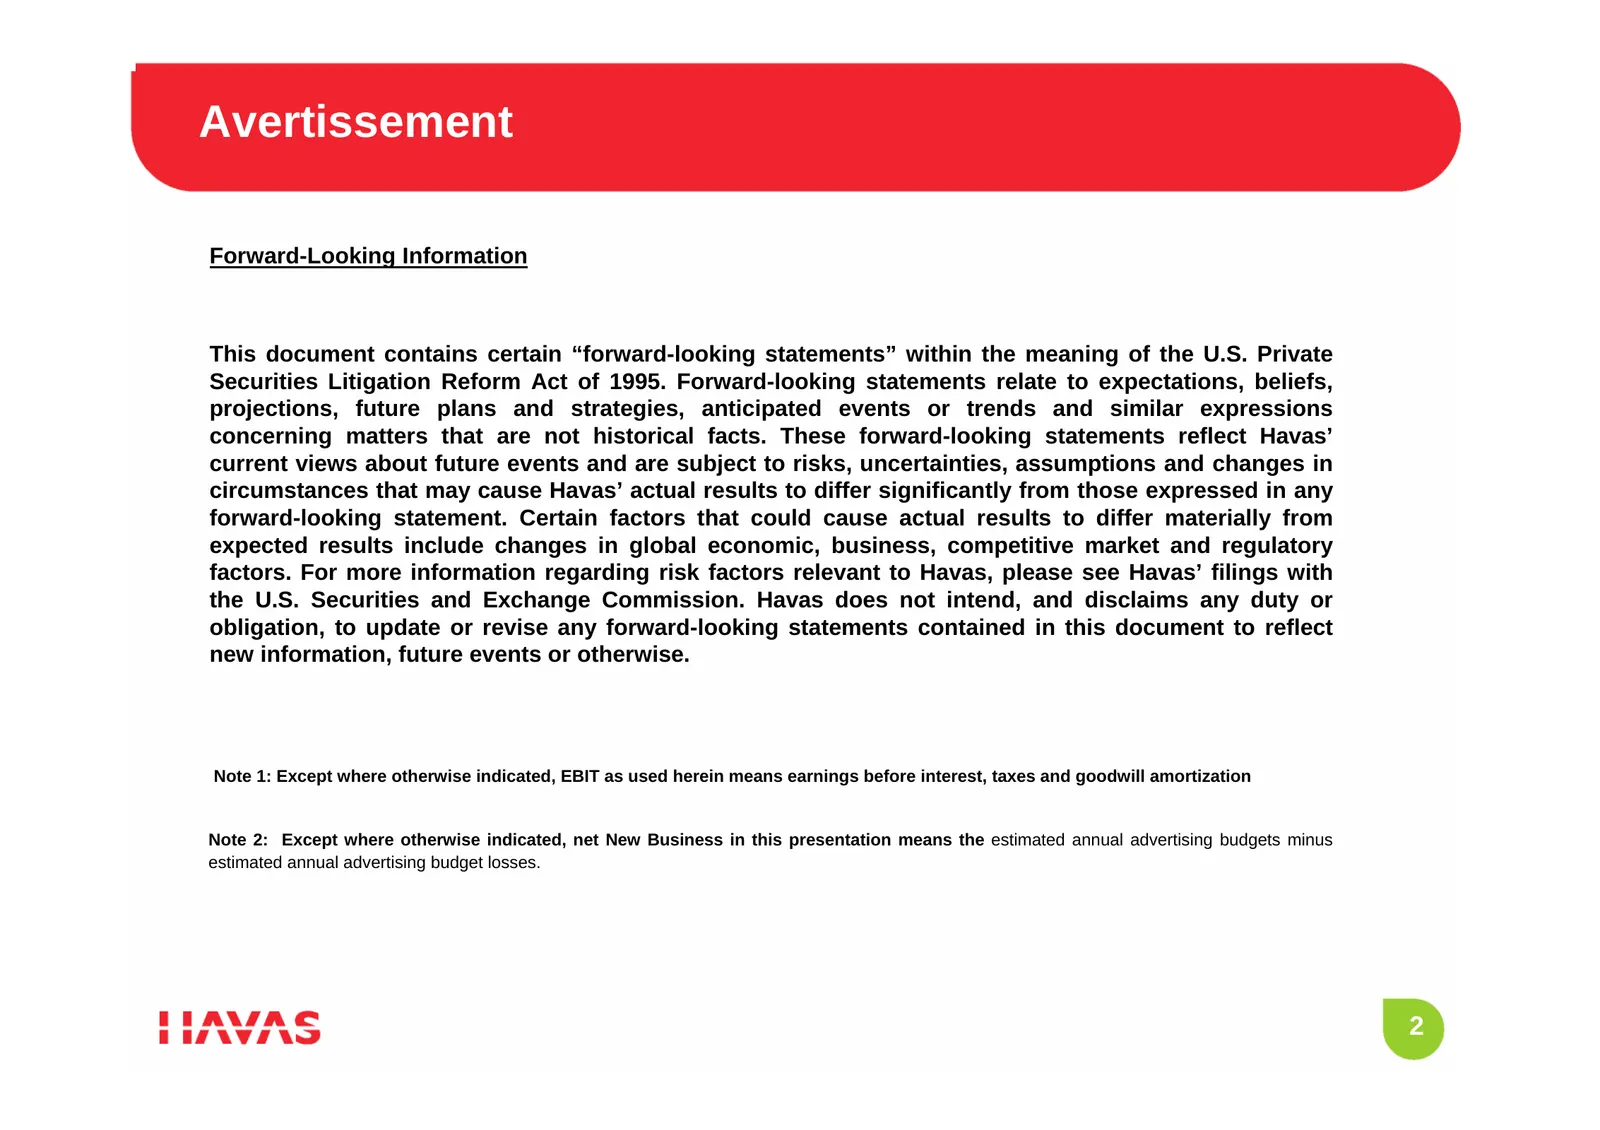
Avertissement Forward-Looking Information This document contains certain “forward-looking statements” within the meaning of the U.S. Private Securities Litigation Reform Act of 1995. Forward-looking statements relate to expectations, beliefs, projections, future plans and strategies, anticipated eve
Slide 3: Summary
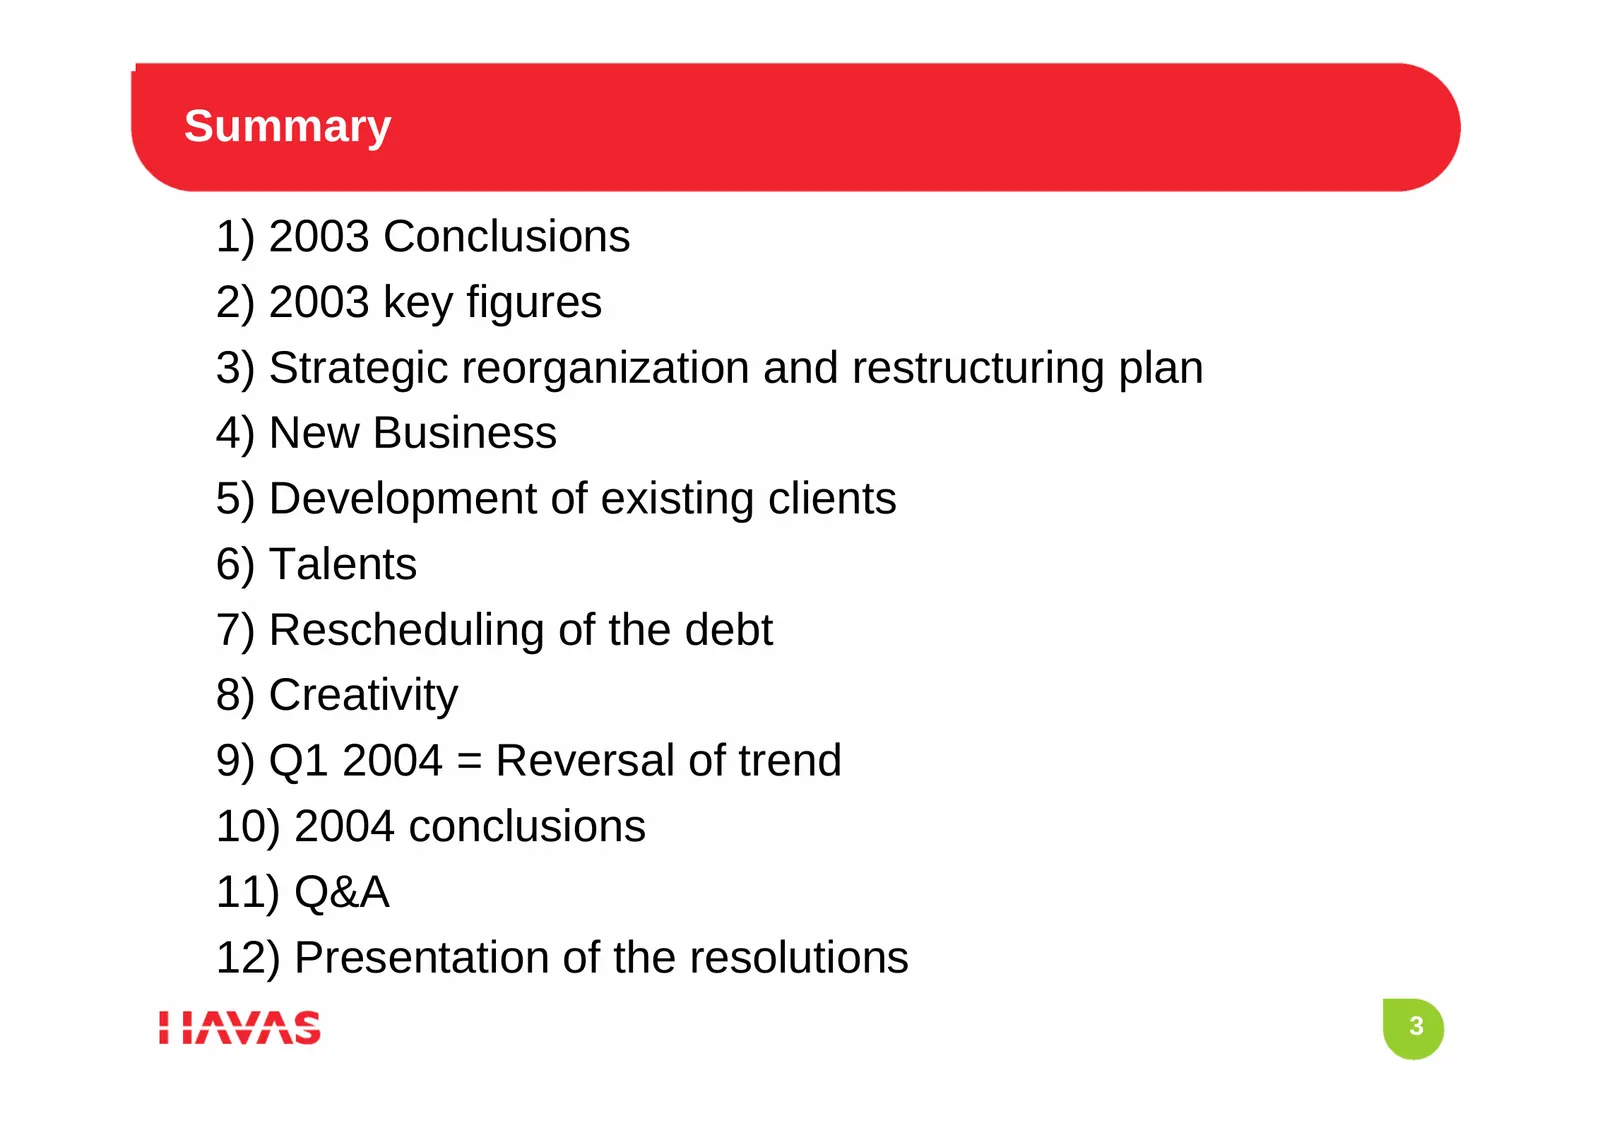
Summary 1) 2003 Conclusions 2) 2003 key figures 3) Strategic reorganization and restructuring plan 4) New Business 5) Development of existing clients 6) Talents 7) Rescheduling of the debt 8) Creativity 9) Q1 2004 = Reversal of trend 10) 2004 conclusions 11) Q&A 12) Presentation of the resolutions 3
Slide 4: 2003 Conclusions
2003 CONCLUSIONS 4
Slide 5: 2003 Conclusions
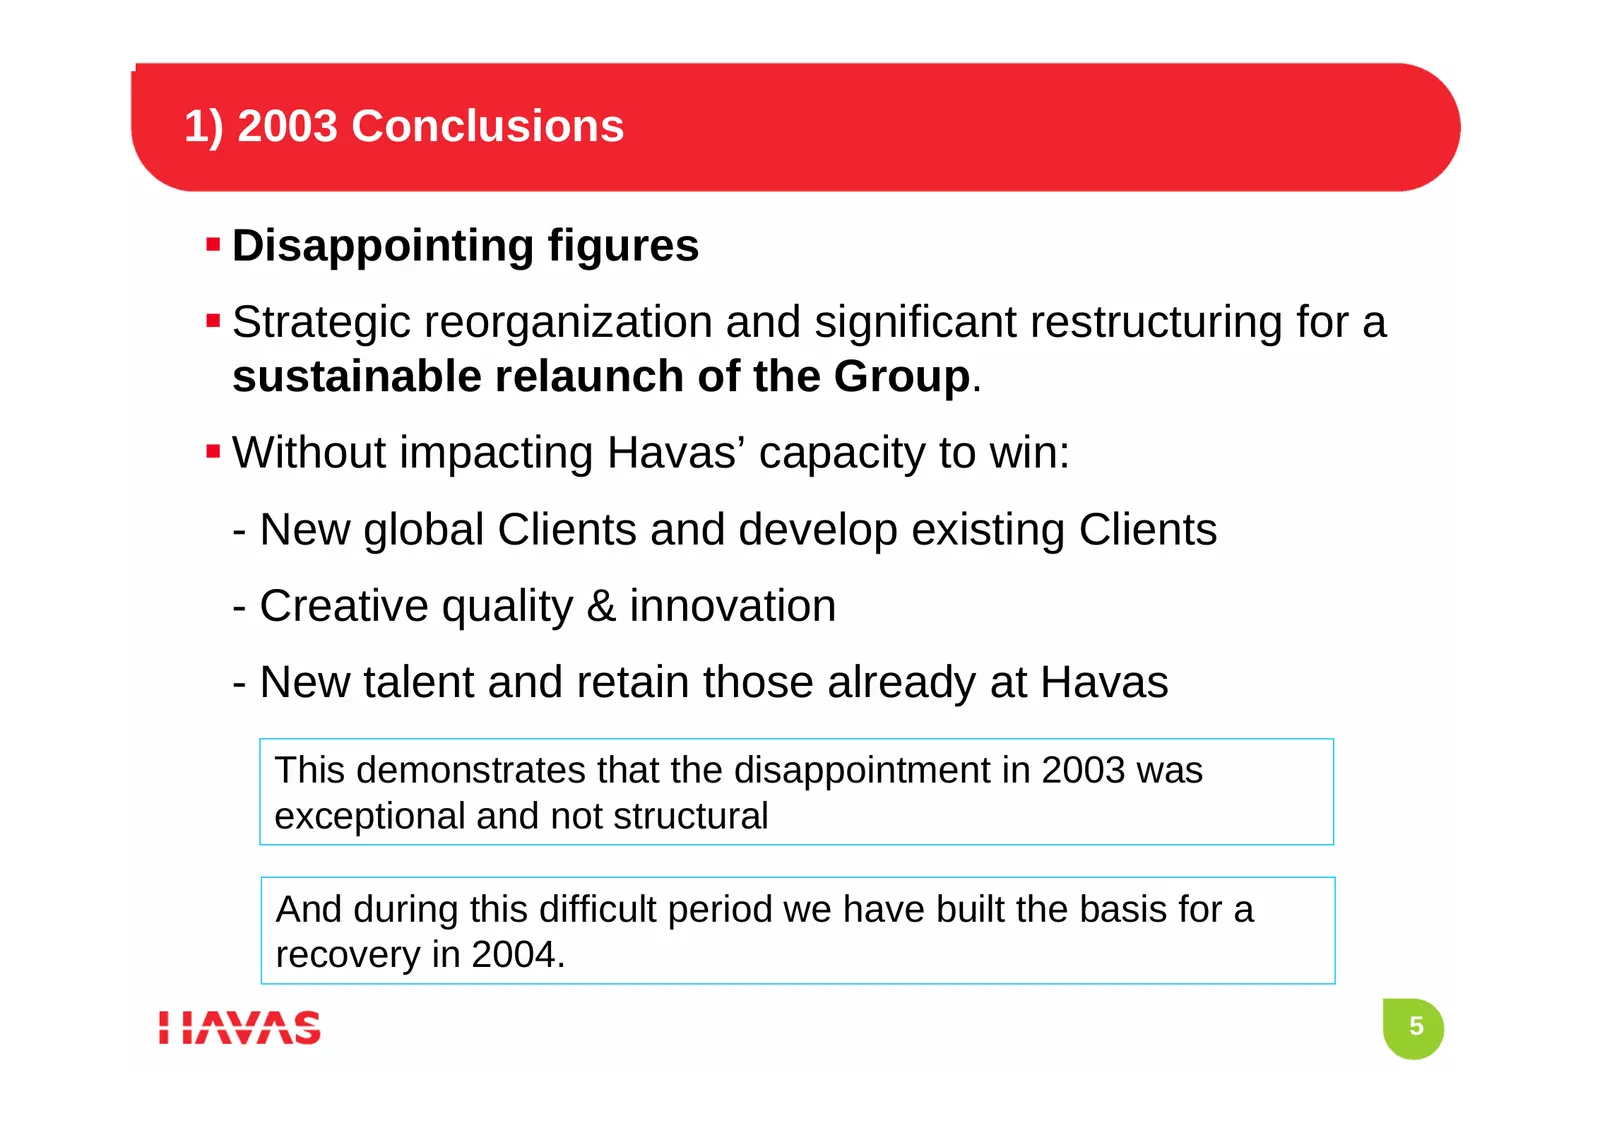
1) 2003 Conclusions Disappointing figures Strategic reorganization and significant restructuring for a sustainable relaunch of the Group. Without impacting Havas’ capacity to win: - New global Clients and develop existing Clients - Creative quality & innovation - New talent and retain those al
Slide 6: 2003 Key Figures
2003 KEY FIGURES 6
Slide 7: 2003 Key Figures
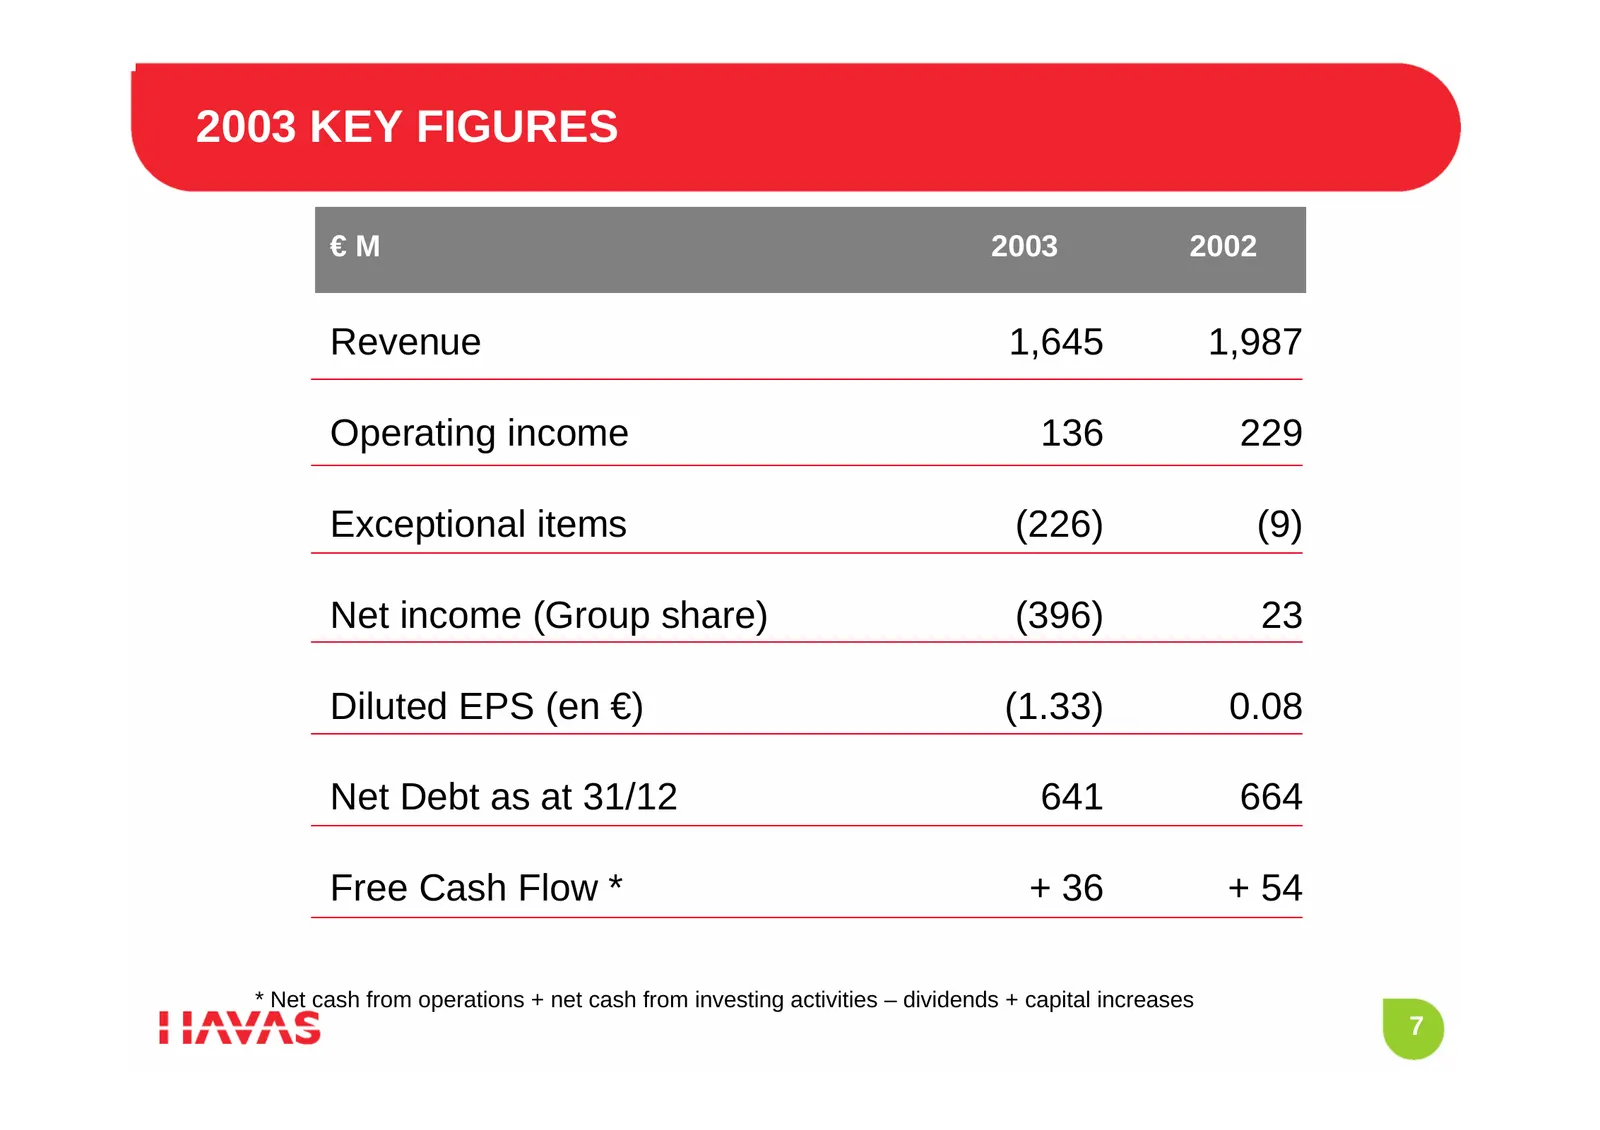
2003 KEY FIGURES €M 2003 2002 Revenue 1,645 1,987 Operating income 136 229 Exceptional items (226) (9) Net income (Group share) (396) 23 Diluted EPS (en €) (1.33) 0.08 Net Debt as at 31/12 641 664 Free Cash Flow * + 36 + 54 * Net cash from operations + net cash from investing activities – dividends
Slide 8: 2003 Results Analysis
2003 RESULTS Analysis 8
Slide 9: 2003 Revenue
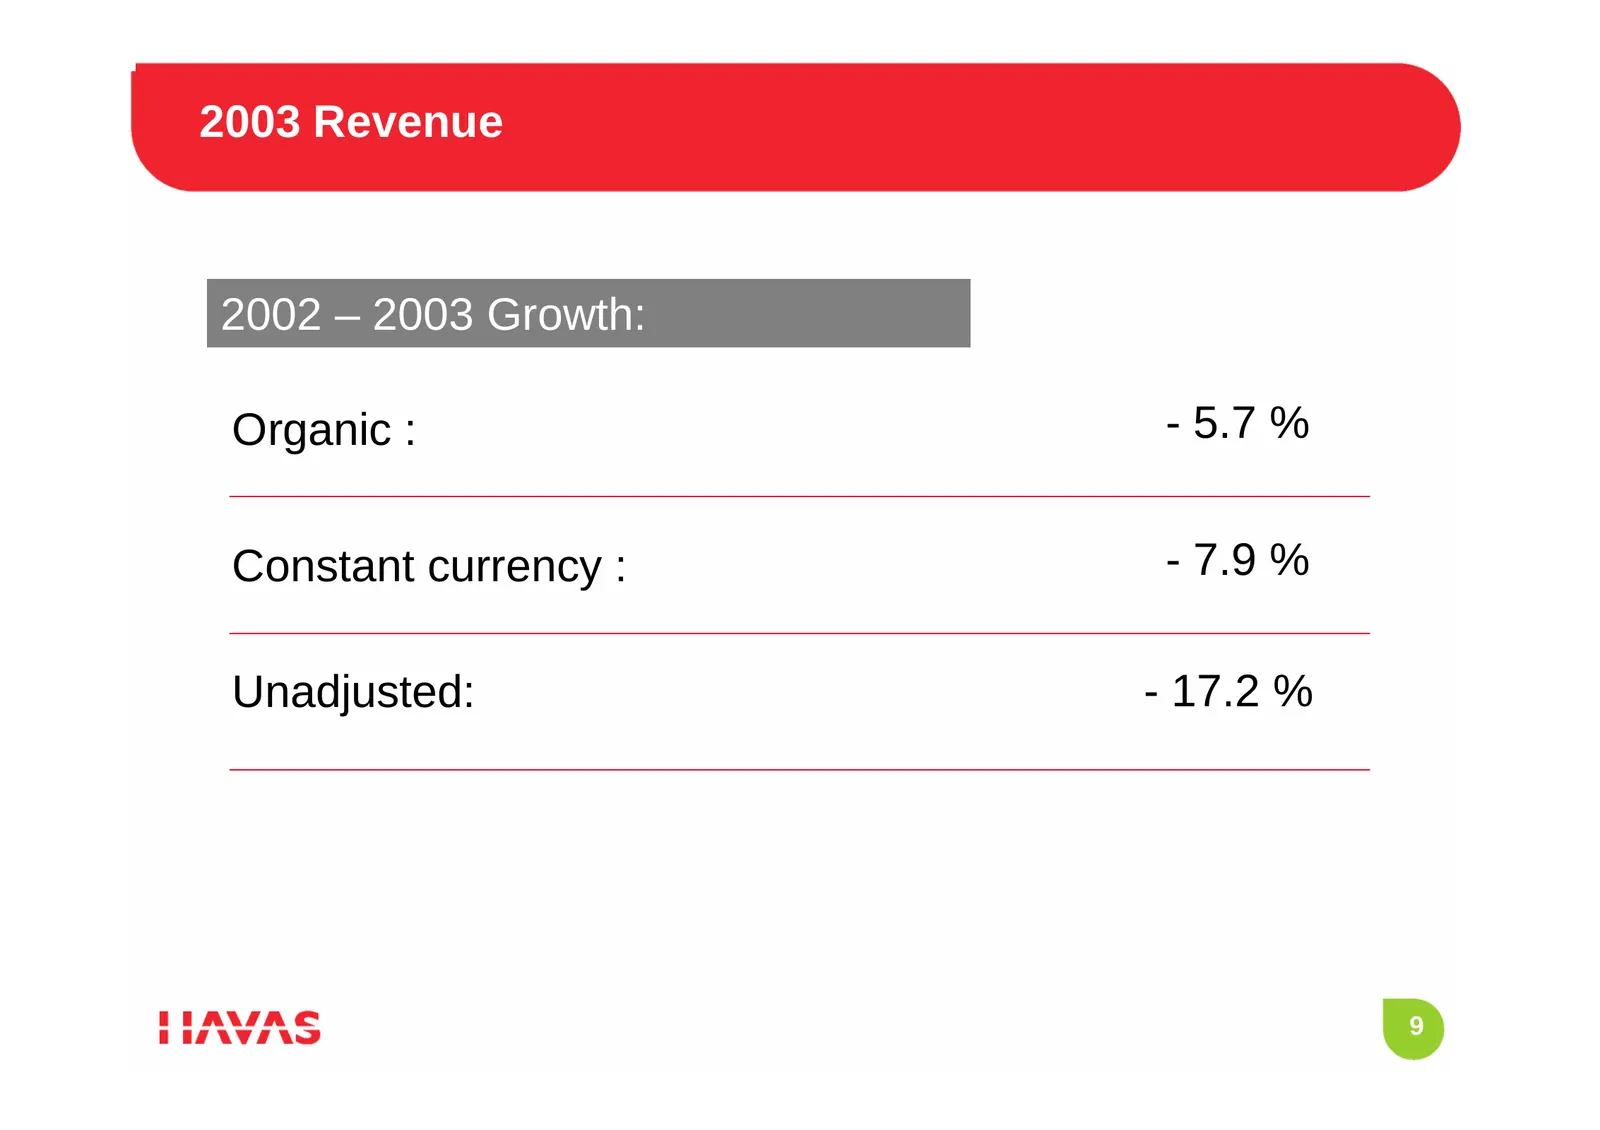
2003 Revenue 2002 – 2003 Growth: Organic : - 5.7 % Constant currency : - 7.9 % Unadjusted: - 17.2 % 9
Slide 10: 2003 Revenue by Region
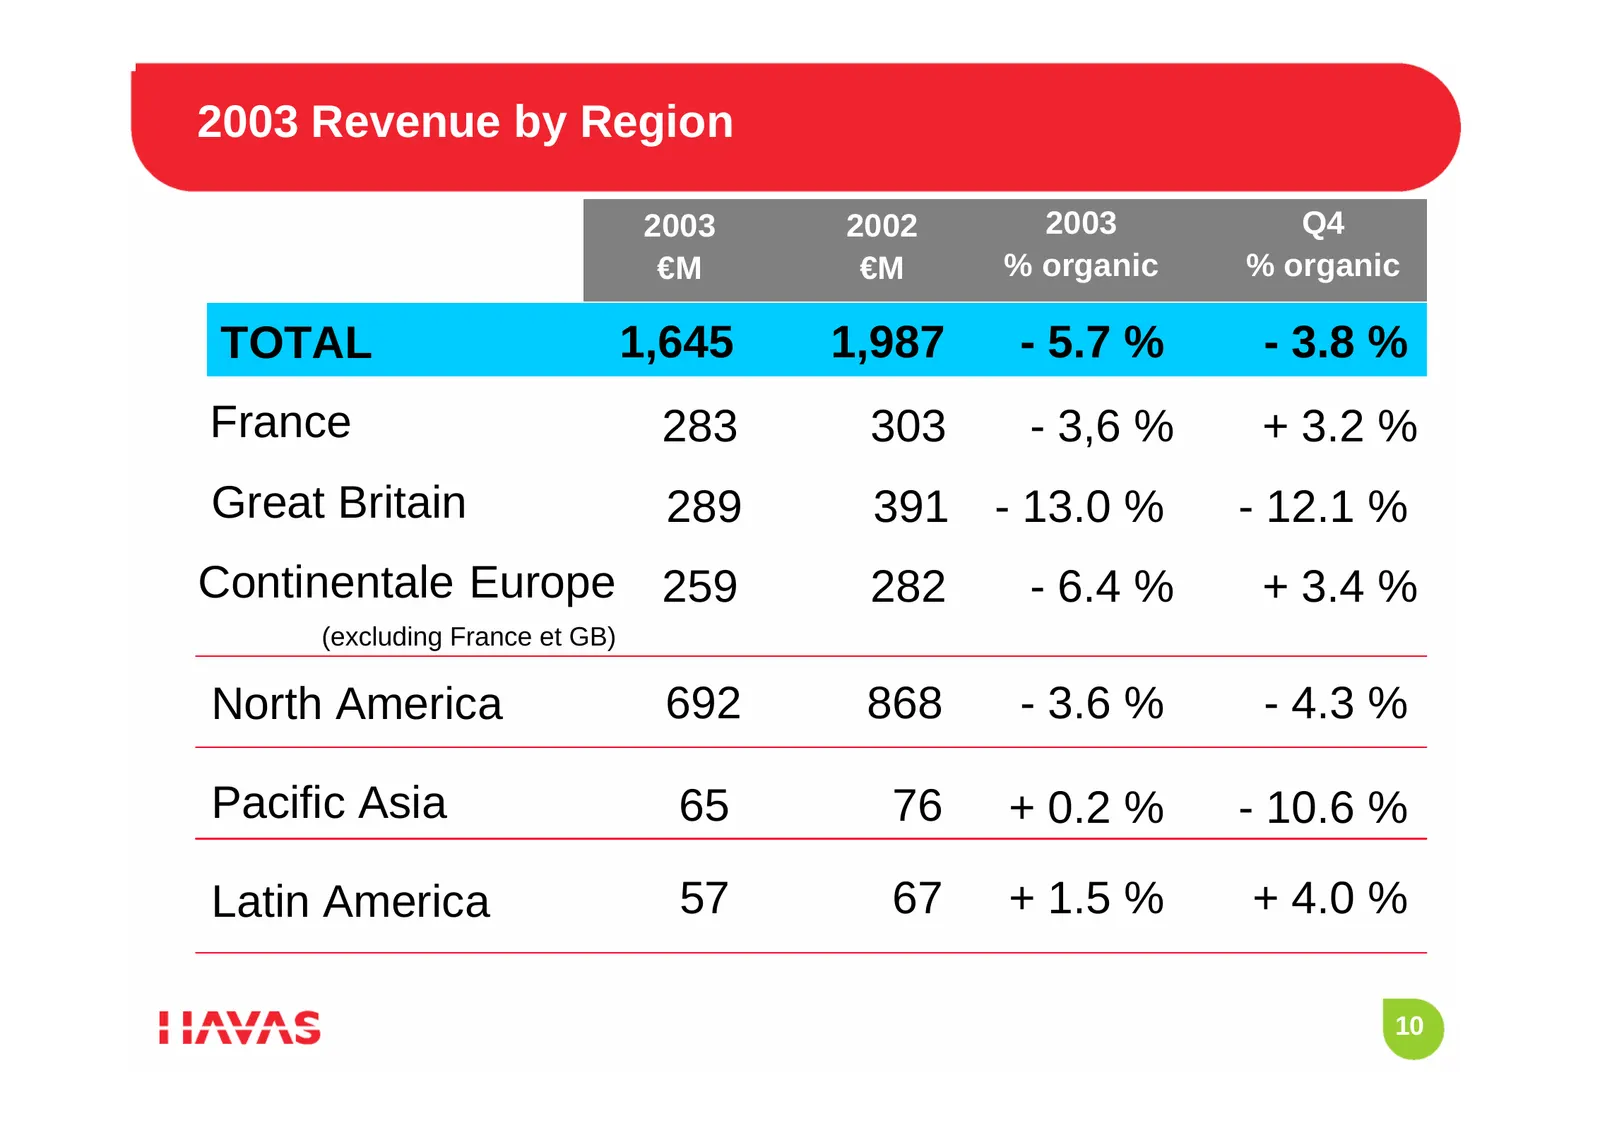
2003 Revenue by Region 2003 2002 2003 Q4 €M €M % organic % organic TOTAL 1,645 1,987 - 5.7 % - 3.8 % France 283 303 - 3,6 % + 3.2 % Great Britain 289 391 - 13.0 % - 12.1 % Continentale Europe 259 282 - 6.4 % + 3.4 % (excluding France et GB) North America 692 868 - 3.6 % - 4.3 % Pacific Asia 65 76 +
Slide 11: 2003 Revenue by Division
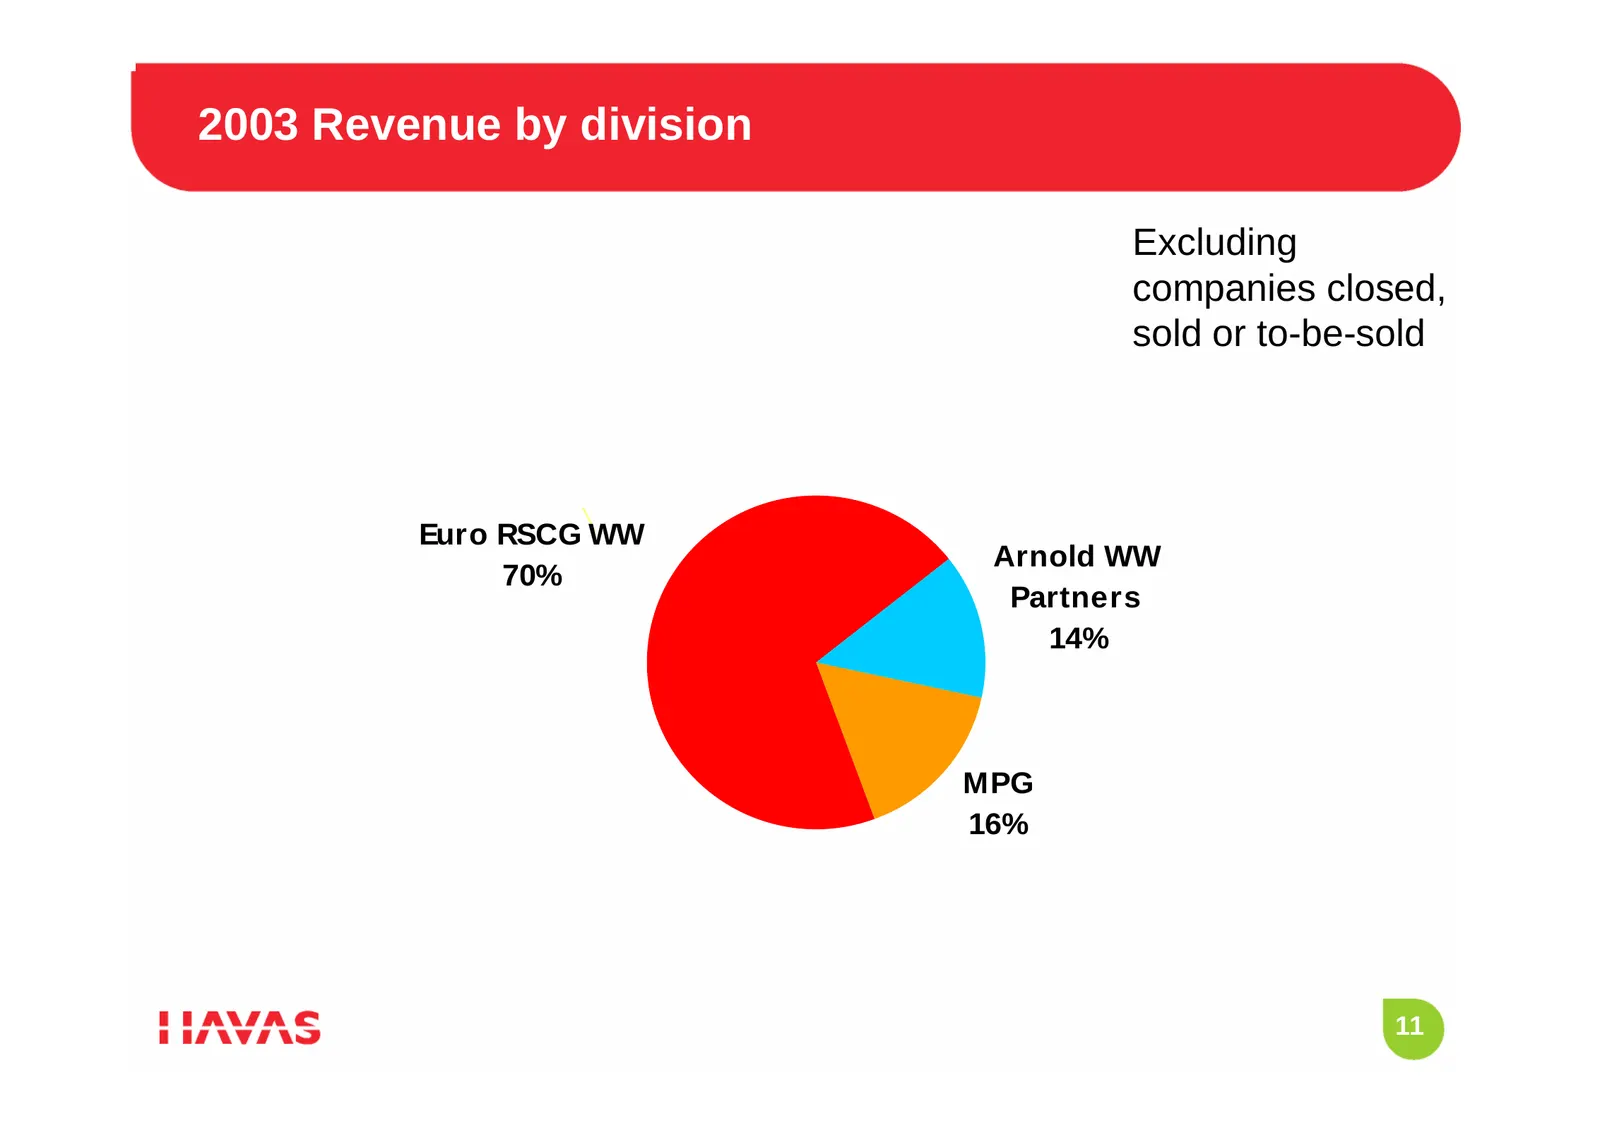
2003 Revenue by division Excluding companies closed, sold or to-be-sold Euro RSCG WW Arnold WW 70% Partners 14% MPG 16% 11
Slide 12: 2003 Revenue: Geographical Breakdown
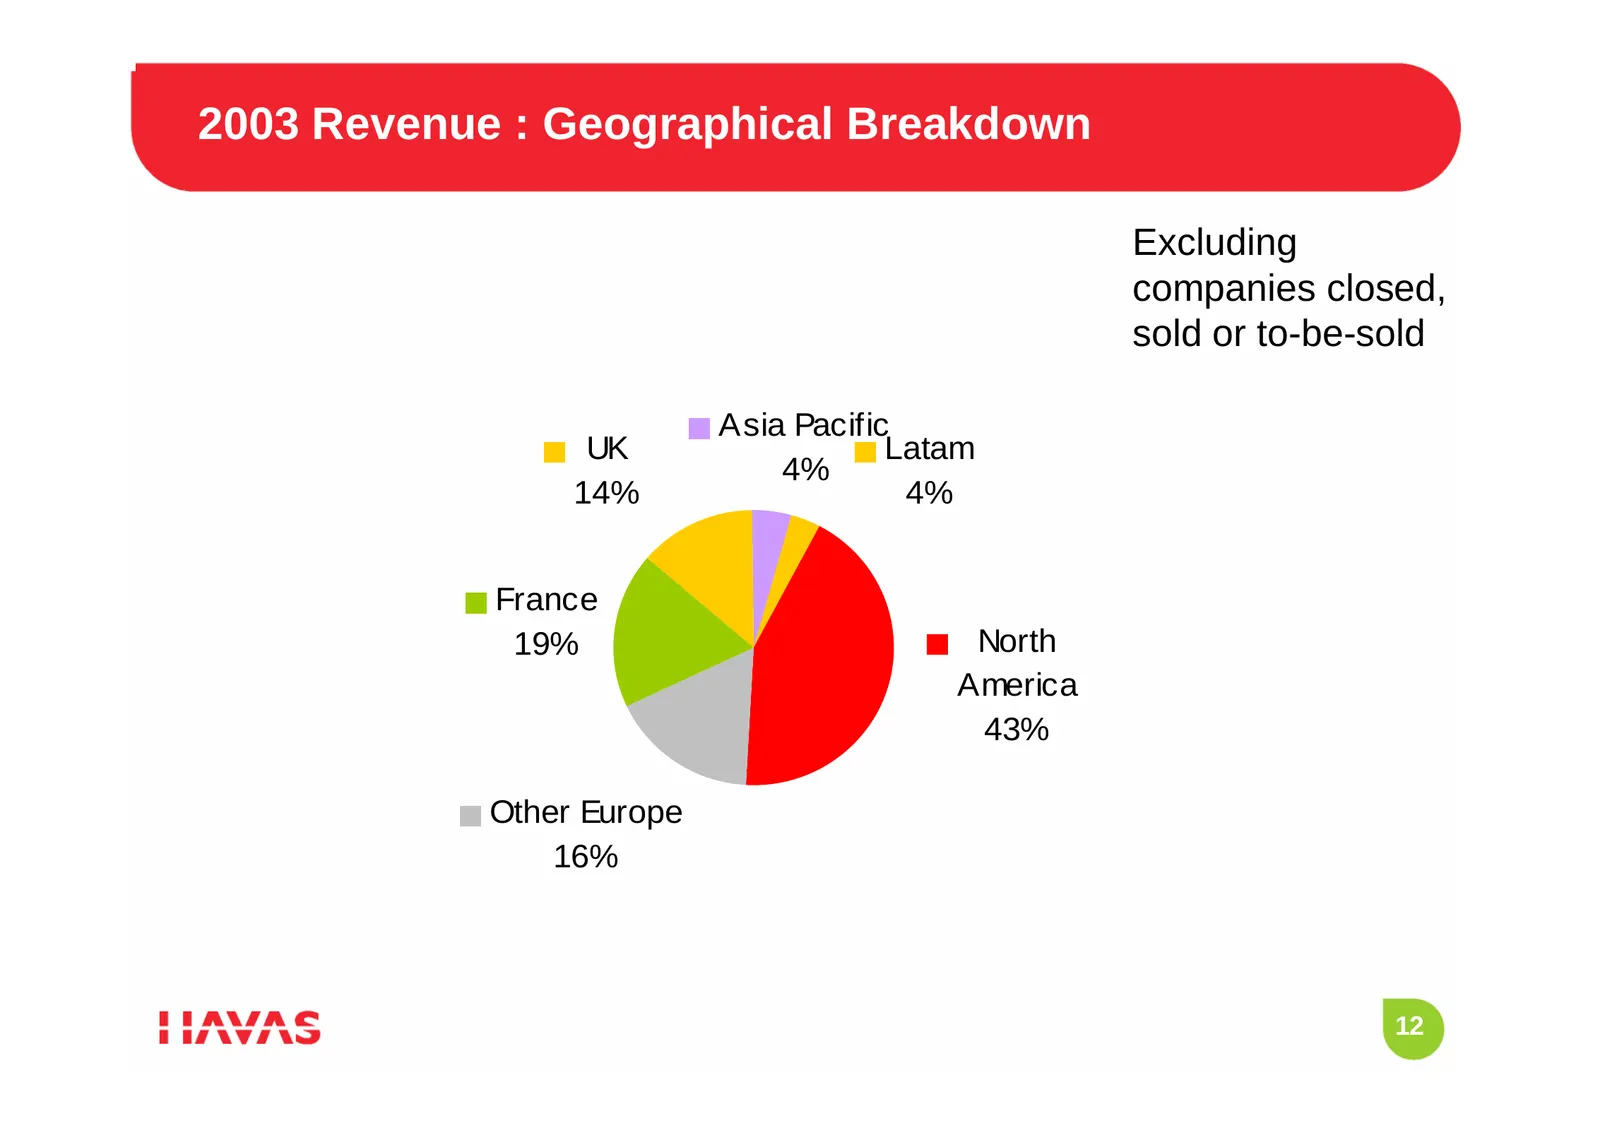
2003 Revenue : Geographical Breakdown Excluding companies closed, sold or to-be-sold Asia Pacific UK Latam 4% 14% 4% France 19% North America 43% Other Europe 16% 12
Slide 13: 2003 – Operating Income
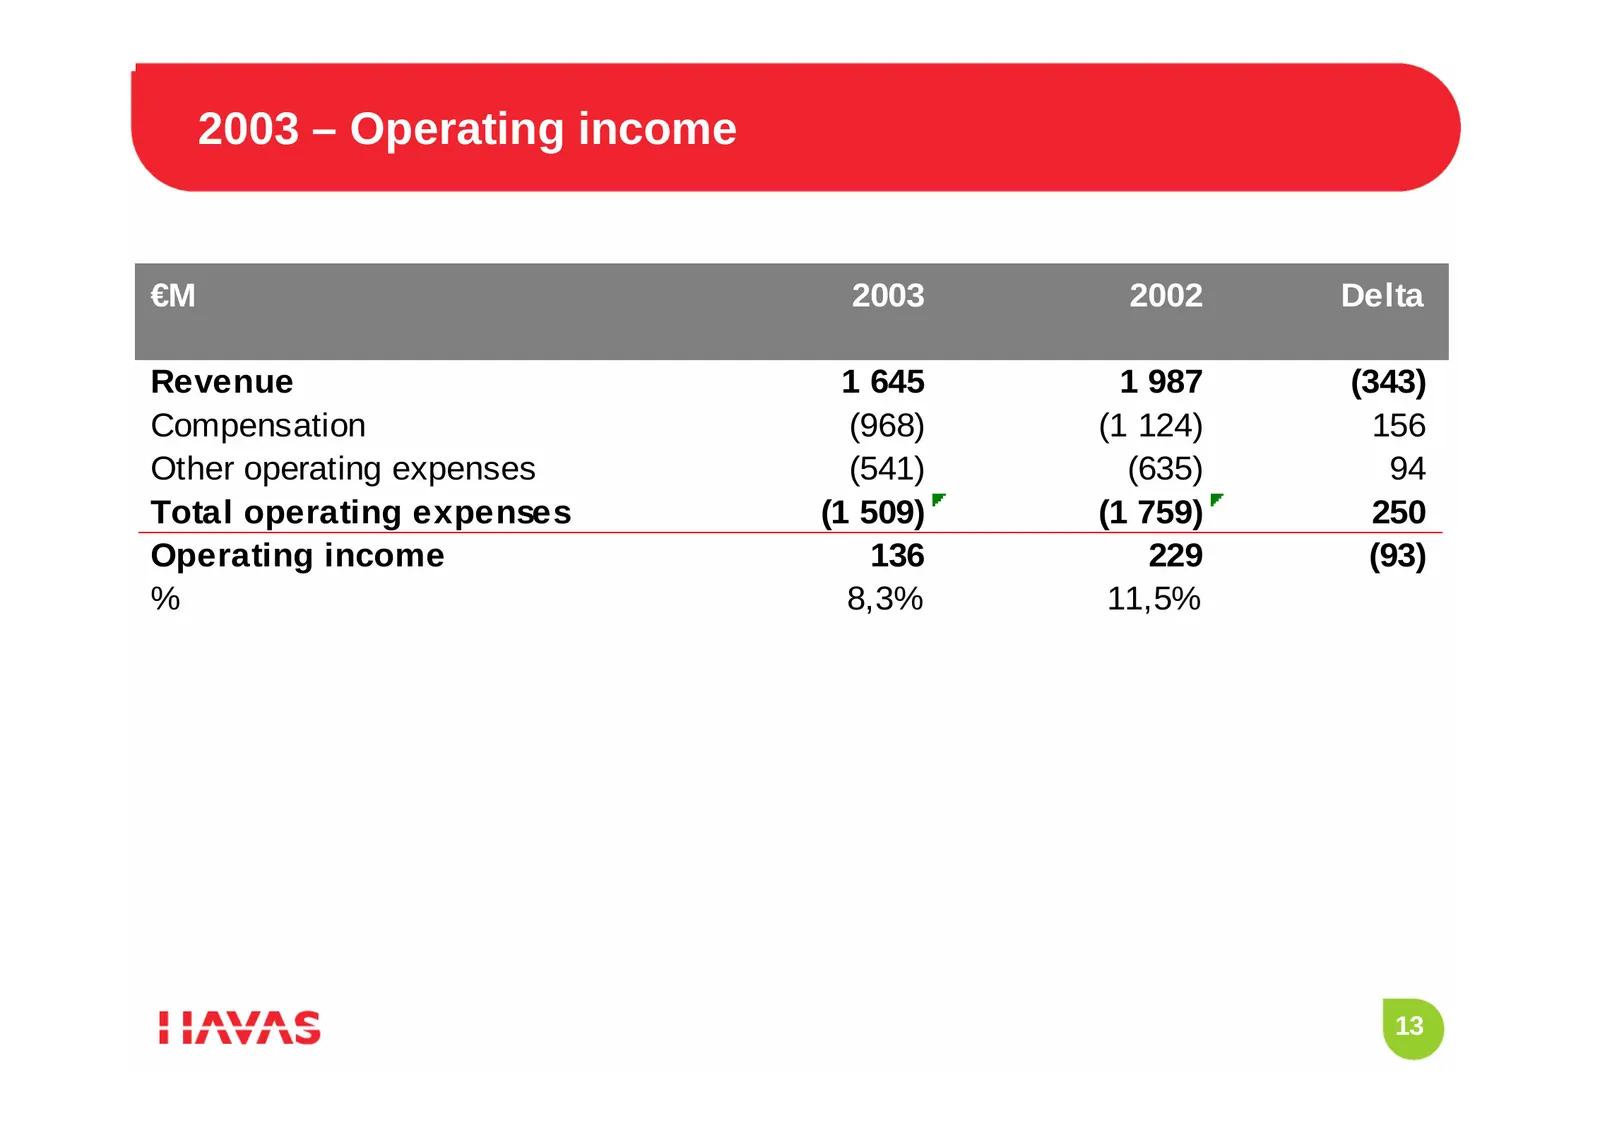
2003 – Operating income €M 2003 2002 Delta Revenue 1 645 1 987 (343) Compensation (968) (1 124) 156 Other operating expenses (541) (635) 94 Total operating expenses (1 509) (1 759) 250 Operating income 136 229 (93) % 8,3% 11,5% 13
Slide 14: Staff Costs
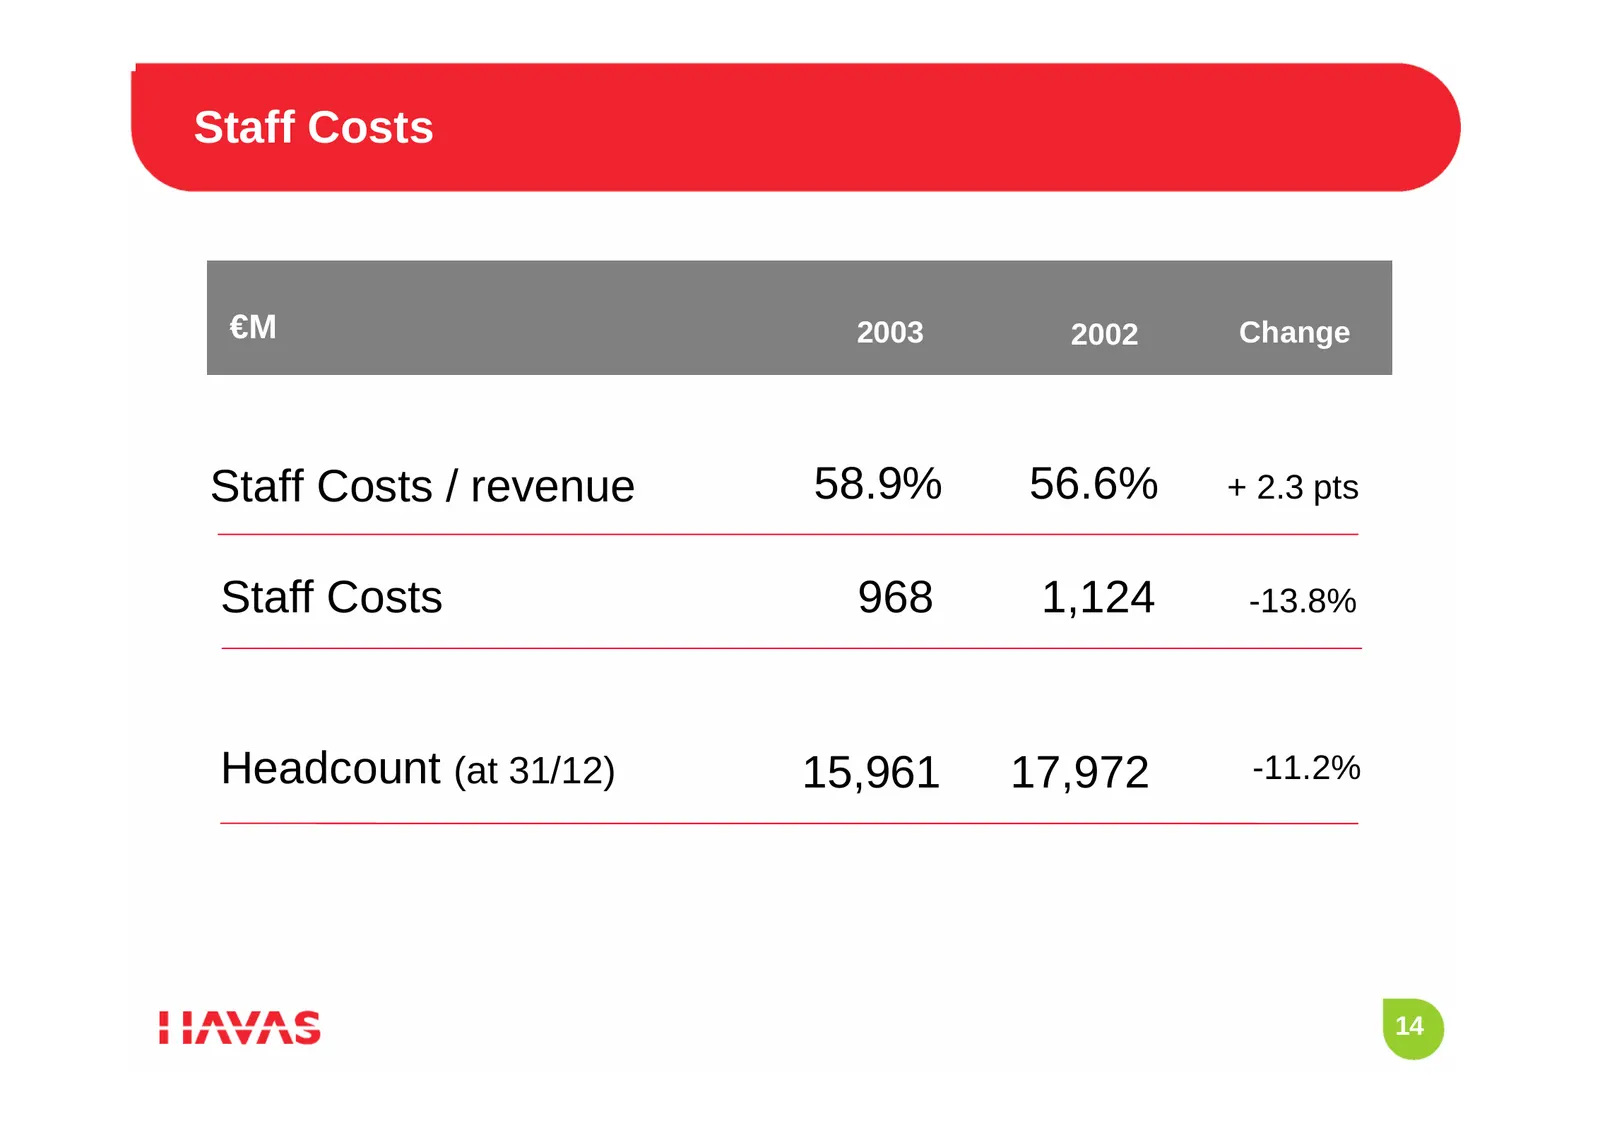
Staff Costs €M 2003 2002 Change Staff Costs / revenue 58.9% 56.6% + 2.3 pts Staff Costs 968 1,124 -13.8% Headcount (at 31/12) 15,961 17,972 -11.2% 14
Slide 15: 2003 - Headcount Evolution
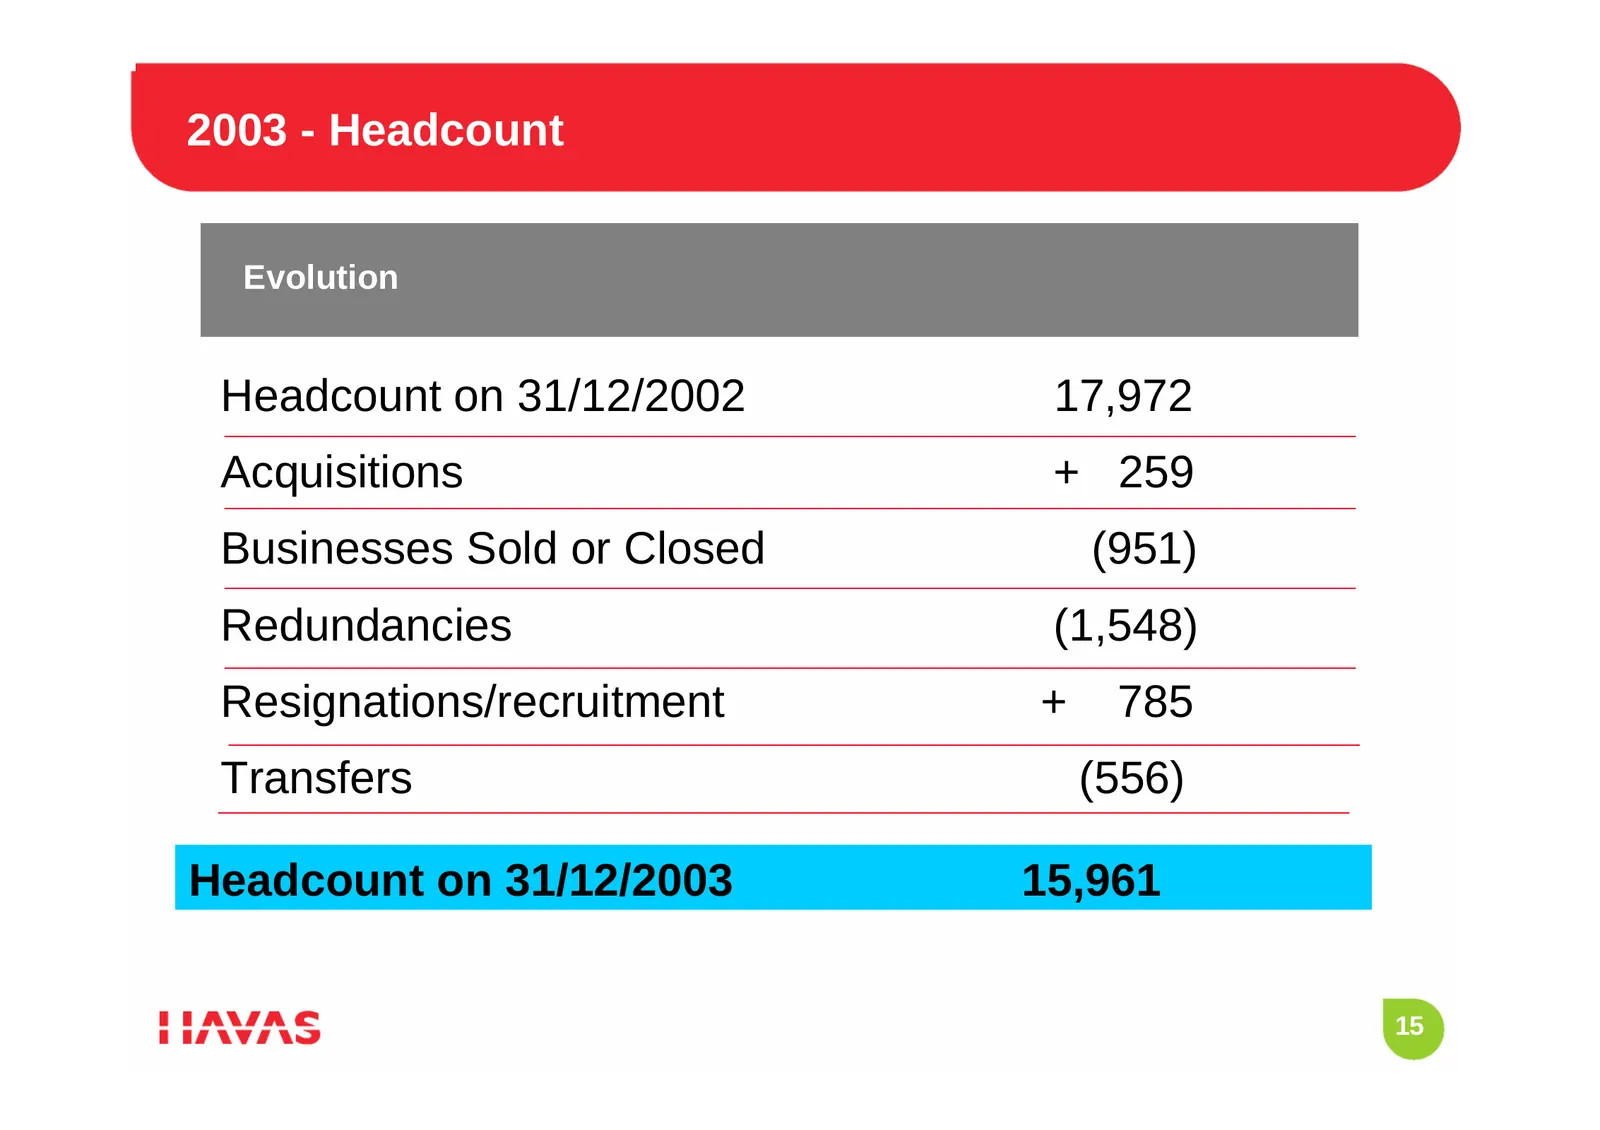
2003 - Headcount Evolution Headcount on 31/12/2002 17,972 Acquisitions + 259 Businesses Sold or Closed (951) Redundancies (1,548) Resignations/recruitment + 785 Transfers (556) Headcount on 31/12/2003 15,961 15
Slide 16: Other Expenses
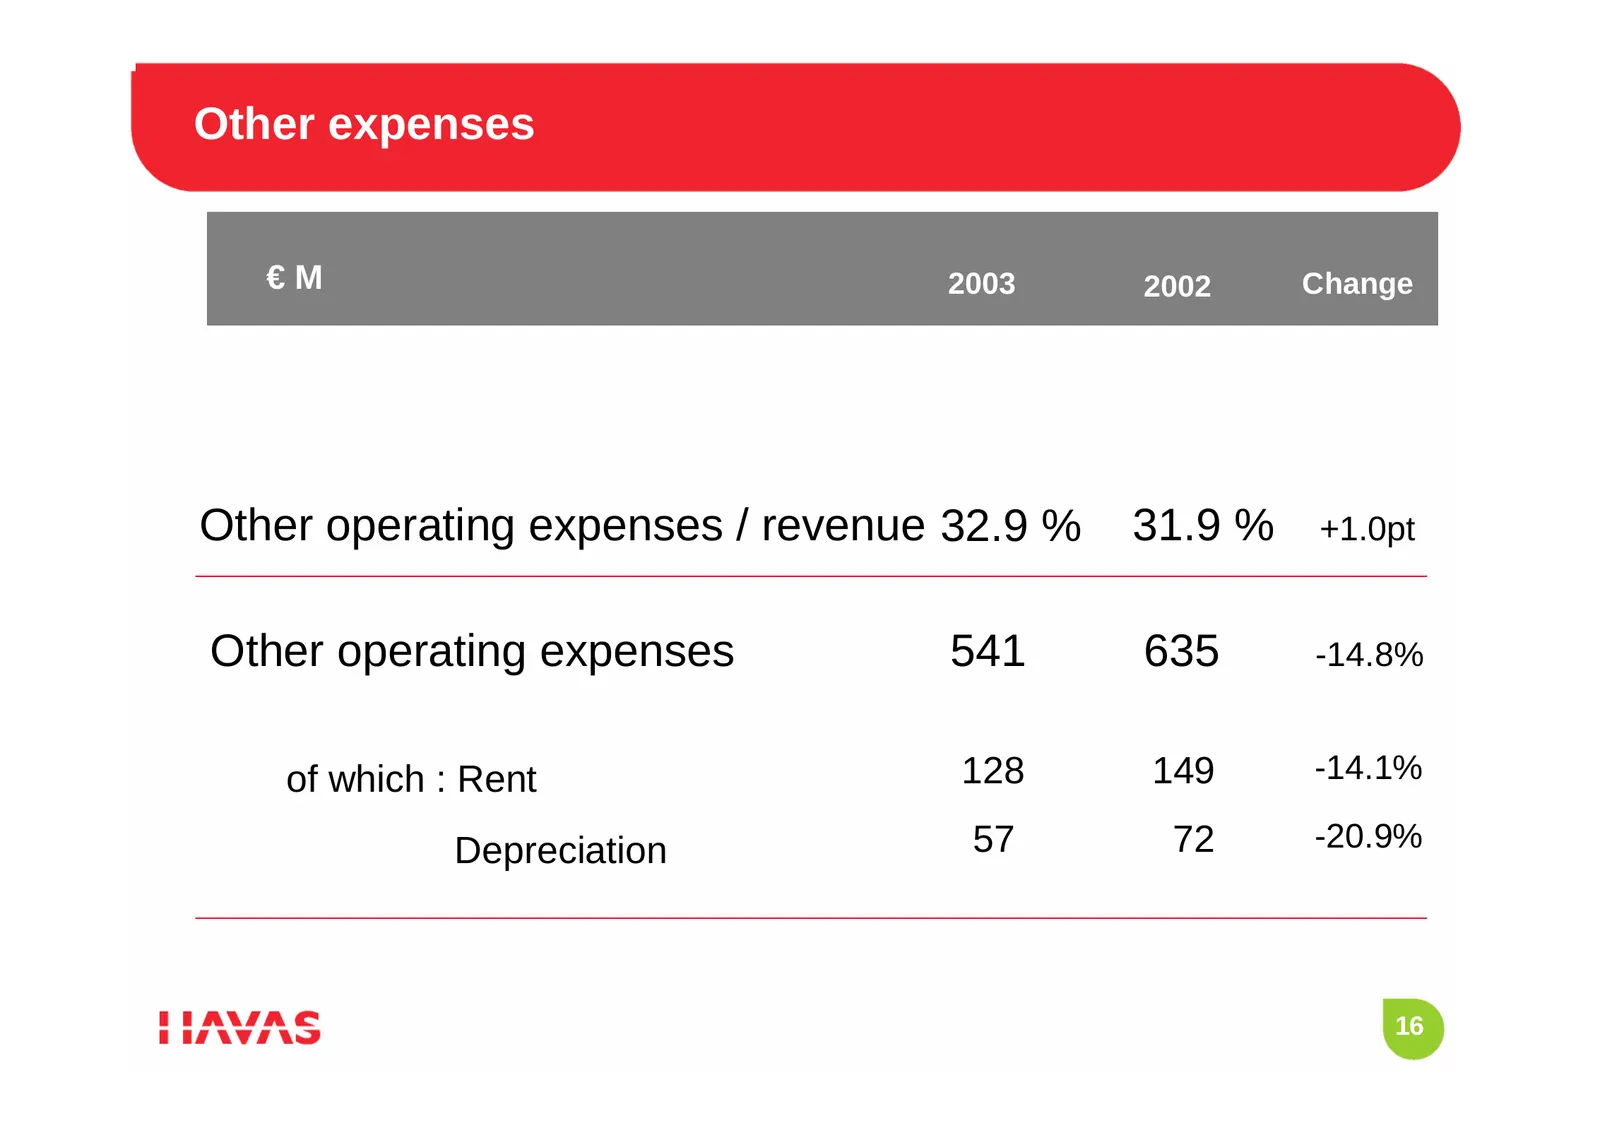
Other expenses €M 2003 2002 Change Other operating expenses / revenue 32.9 % 31.9 % +1.0pt Other operating expenses 541 635 -14.8% of which : Rent 128 149 -14.1% Depreciation 57 72 -20.9% 16
Slide 17: 2003 – P&L
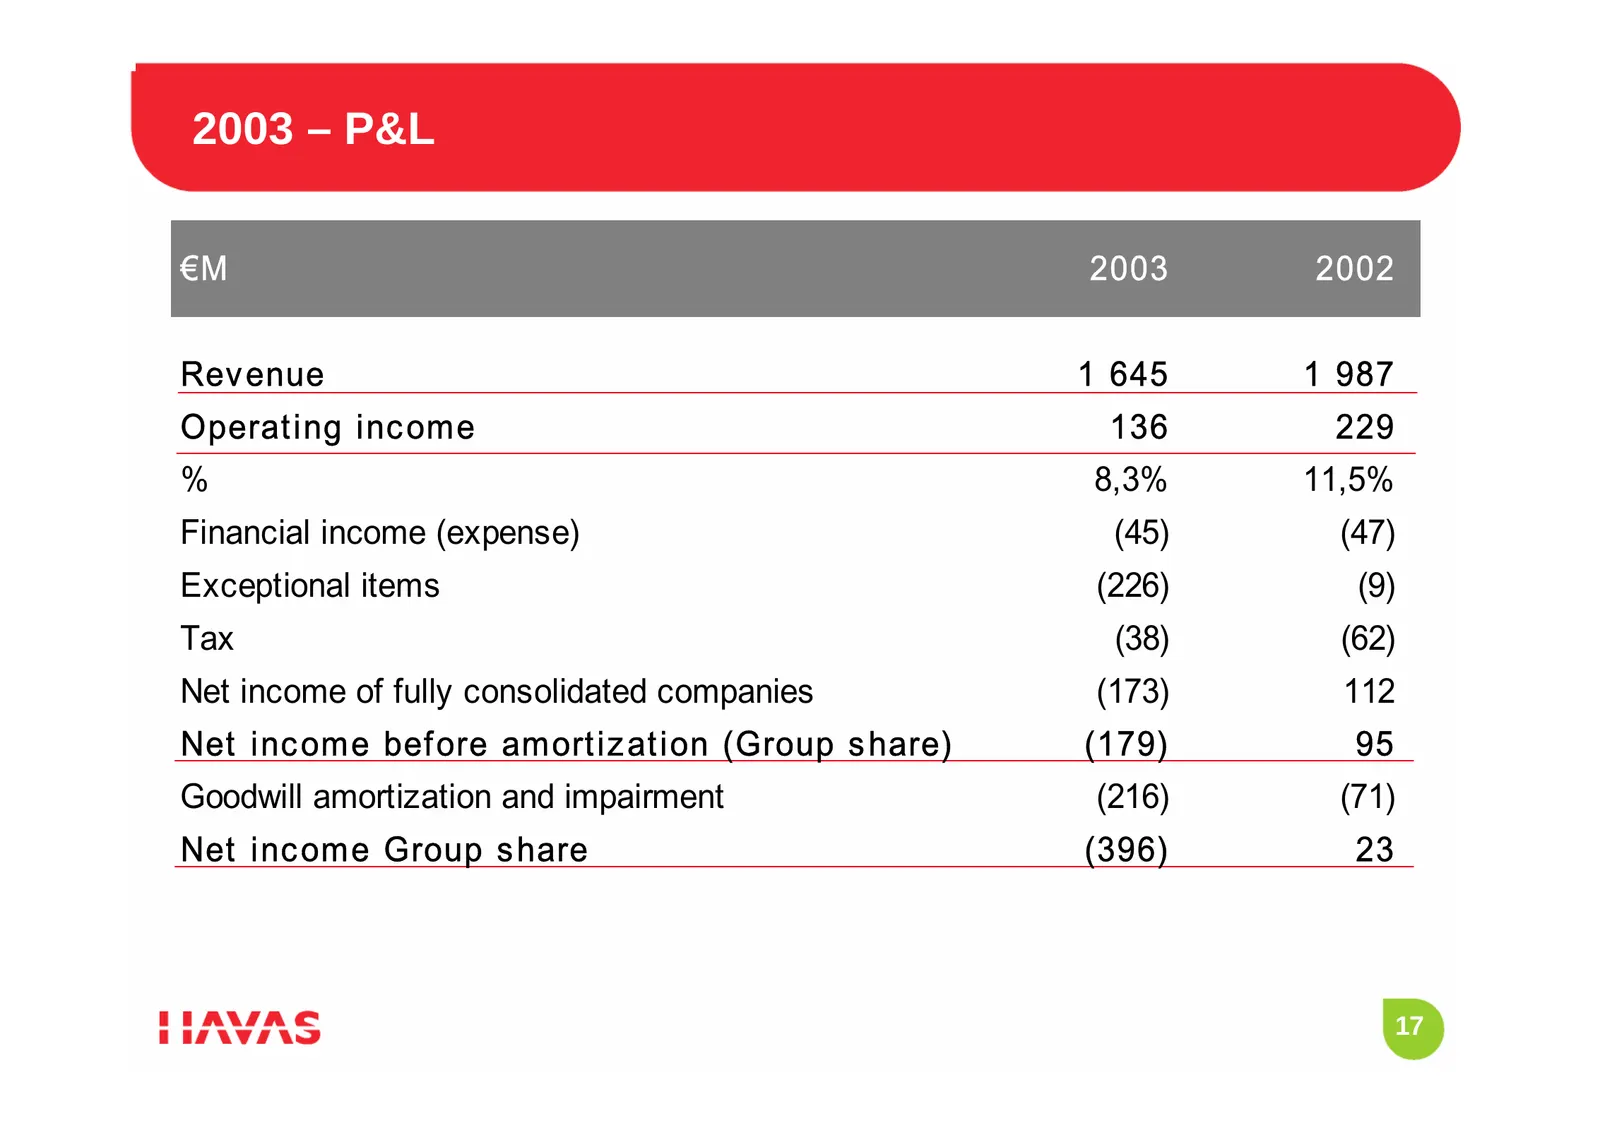
2003 – P&L €M 2003 2002 Rev enue 1 645 1 987 Operat ing inc ome 136 229 % 8,3% 11,5% Financial income (expense) (45) (47) Exceptional items (226) (9) Tax (38) (62) Net income of fully consolidated companies (173) 112 Net inc ome bef ore amort iz at ion (Group s hare) (179) 95 Goodwill amortization a
Slide 18: Exceptional Items 2003
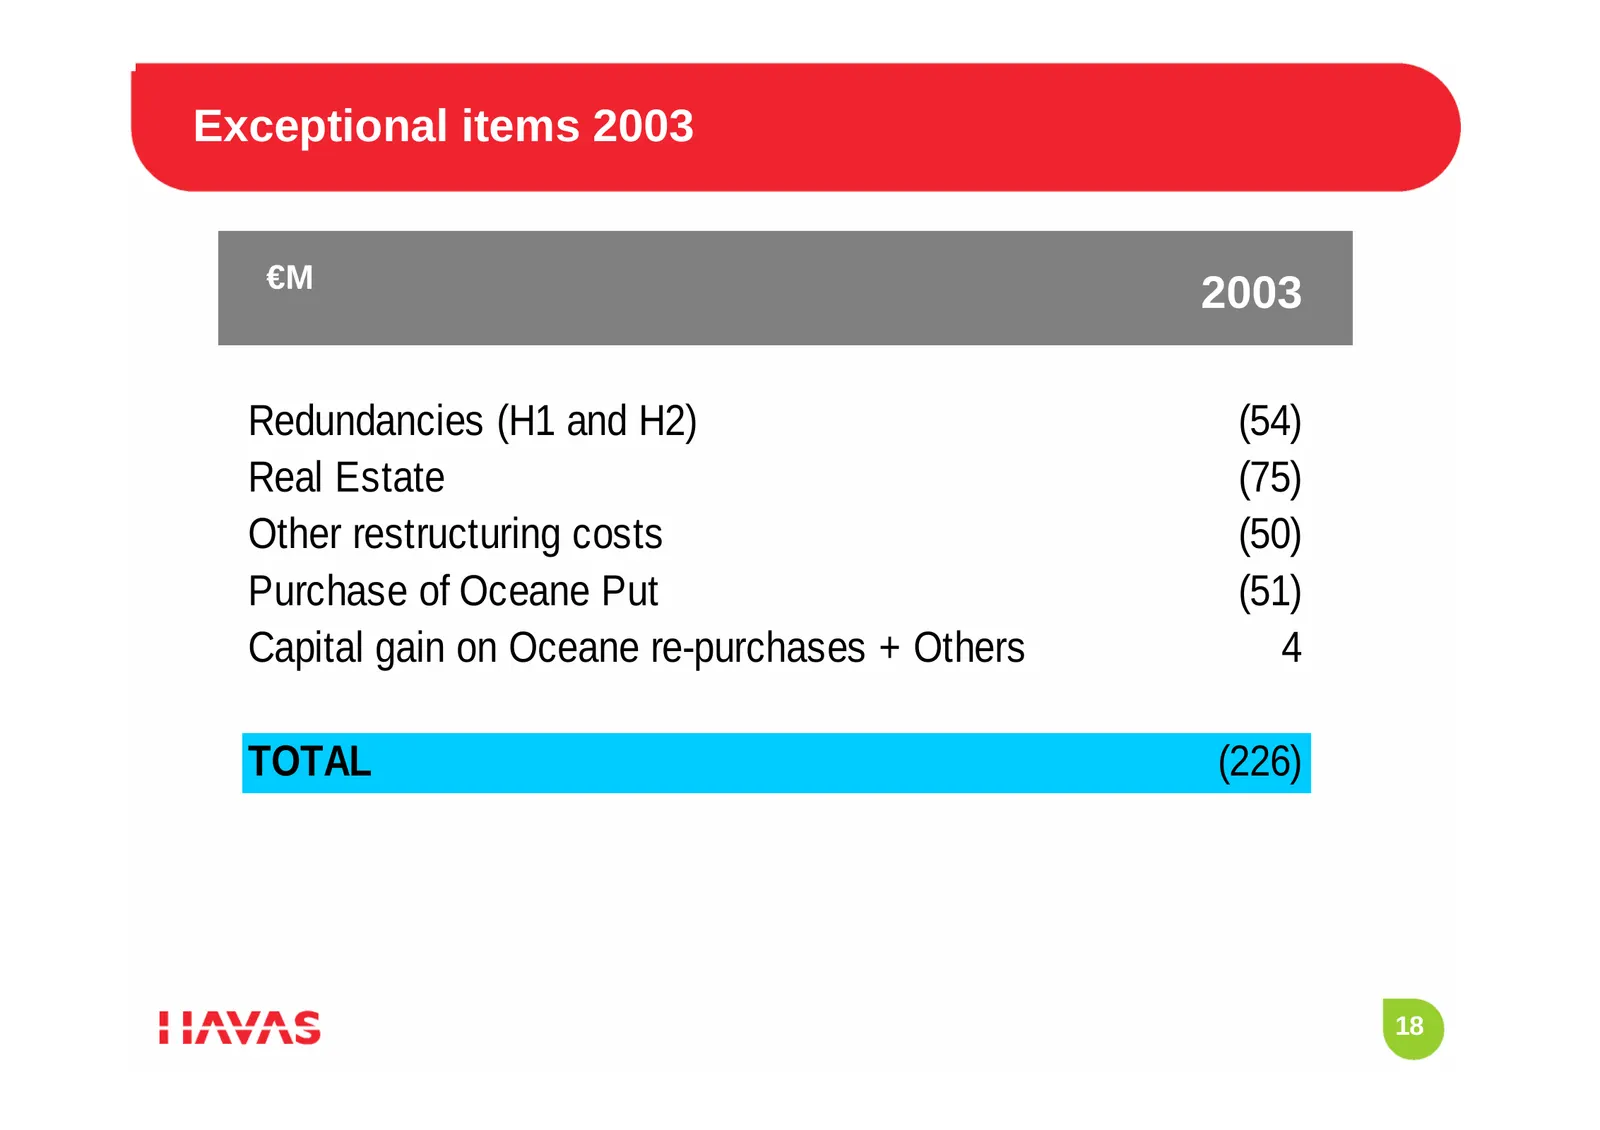
Exceptional items 2003 €M 2003 Redundancies (H1 and H2) (54) Real Estate (75) Other restructuring costs (50) Purchase of Oceane Put (51) Capital gain on Oceane re-purchases + Others 4 TOTAL (226) 18
Slide 19: 2003 2nd Half Restructuring Plan
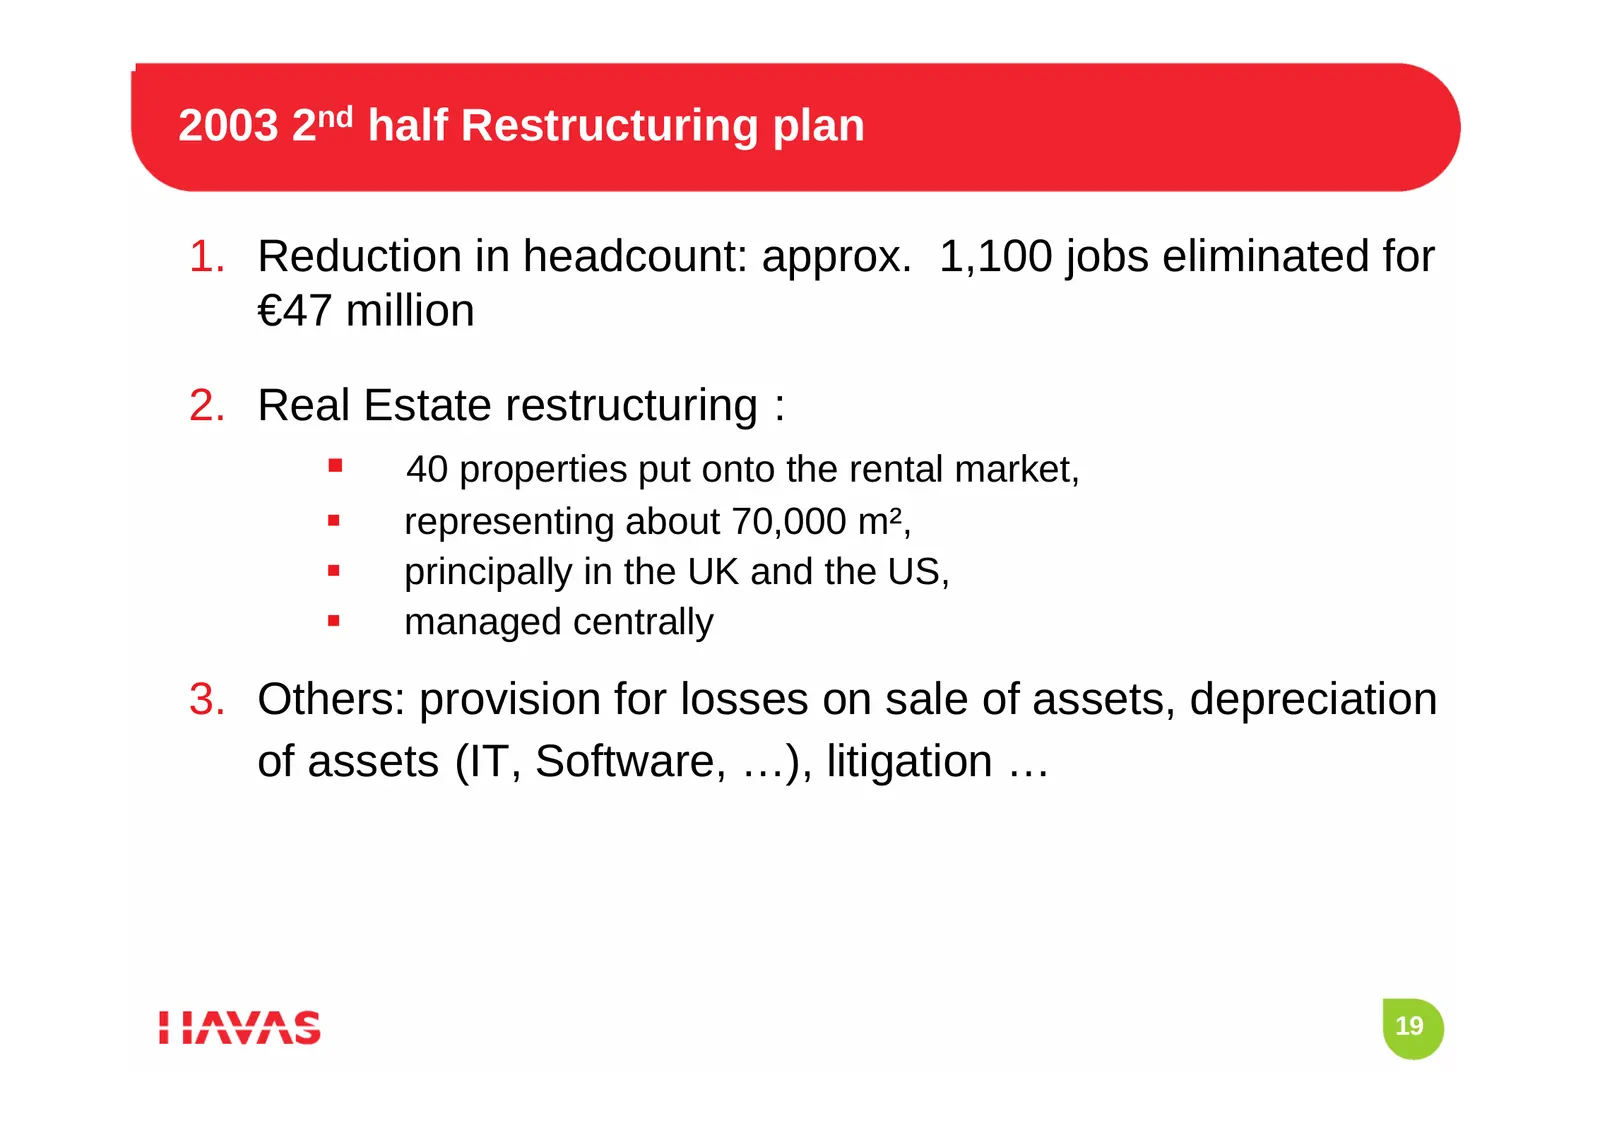
2003 2nd half Restructuring plan 1. Reduction in headcount: approx. 1,100 jobs eliminated for €47 million 2. Real Estate restructuring : 40 properties put onto the rental market, representing about 70,000 m², principally in the UK and the US, managed centrally 3. Others: provision for losses
Slide 20: Restructuring Costs
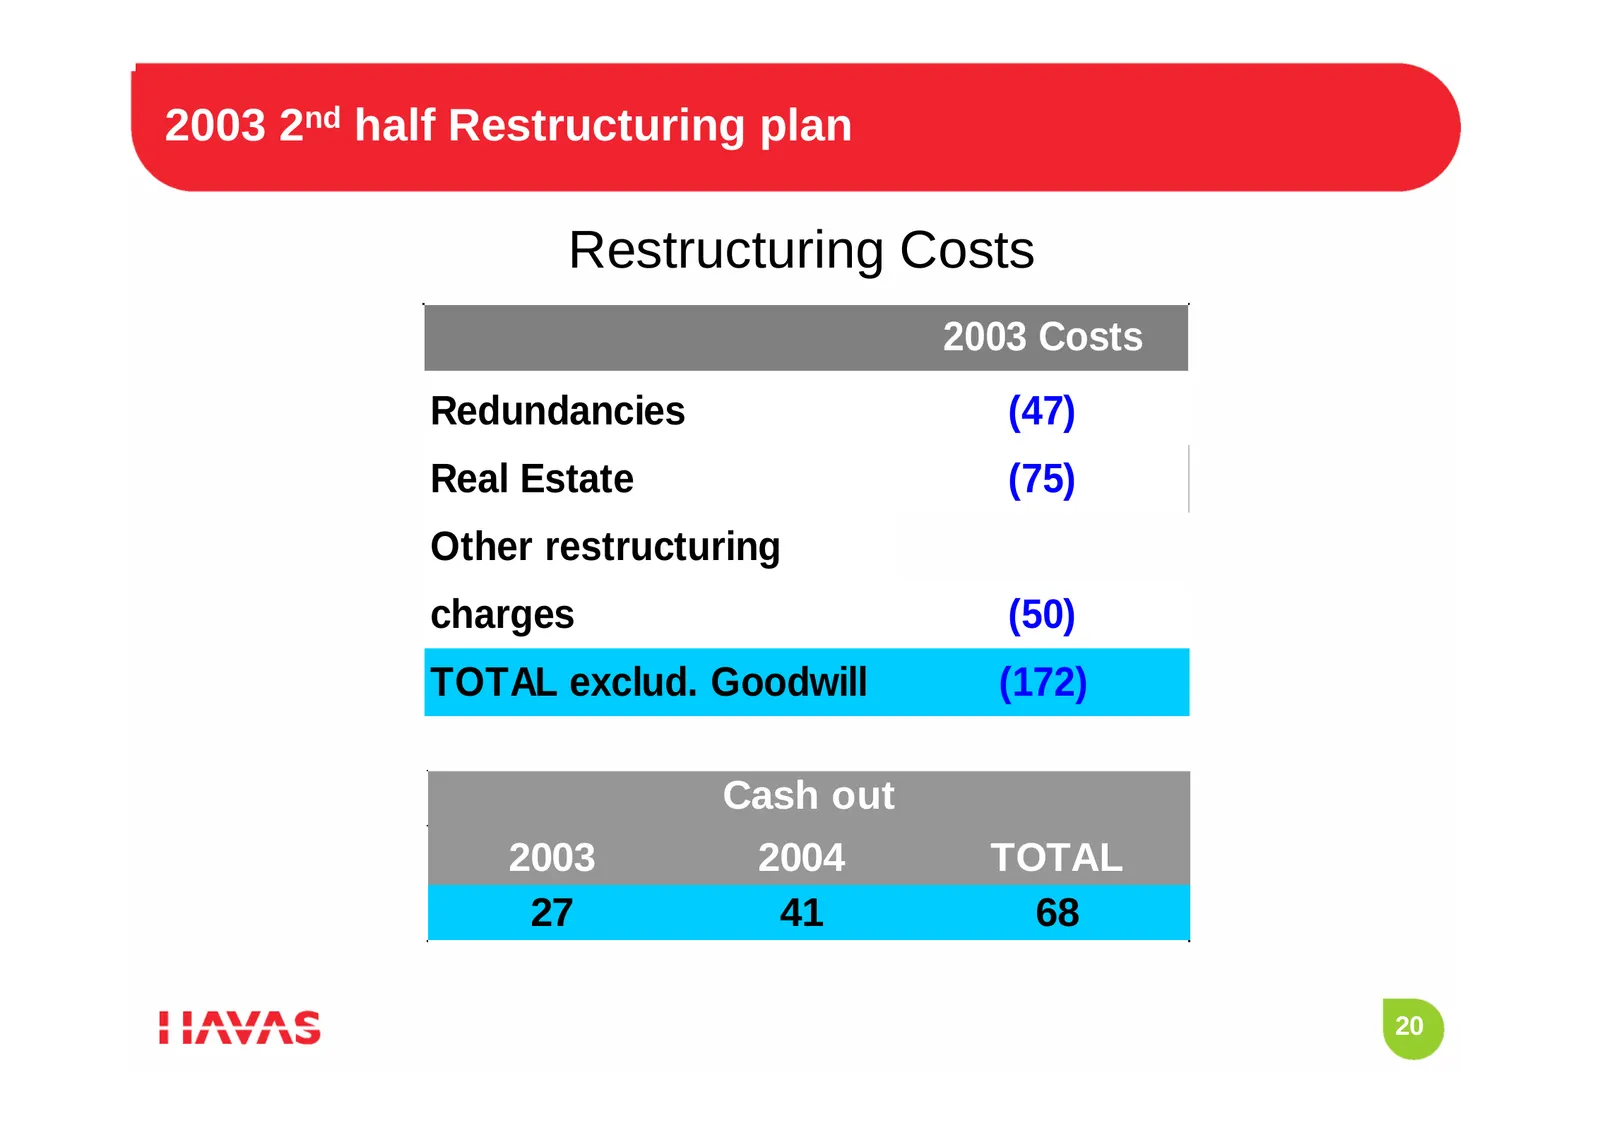
2003 2nd half Restructuring plan Restructuring Costs €M 2003 Costs Redundancies (47) Real Estate (75) Other restructuring charges (50) TOTAL exclud. Goodwill (172) Cash out 2003 2004 TOTAL 27 41 68 20
Slide 21: P&L Impact
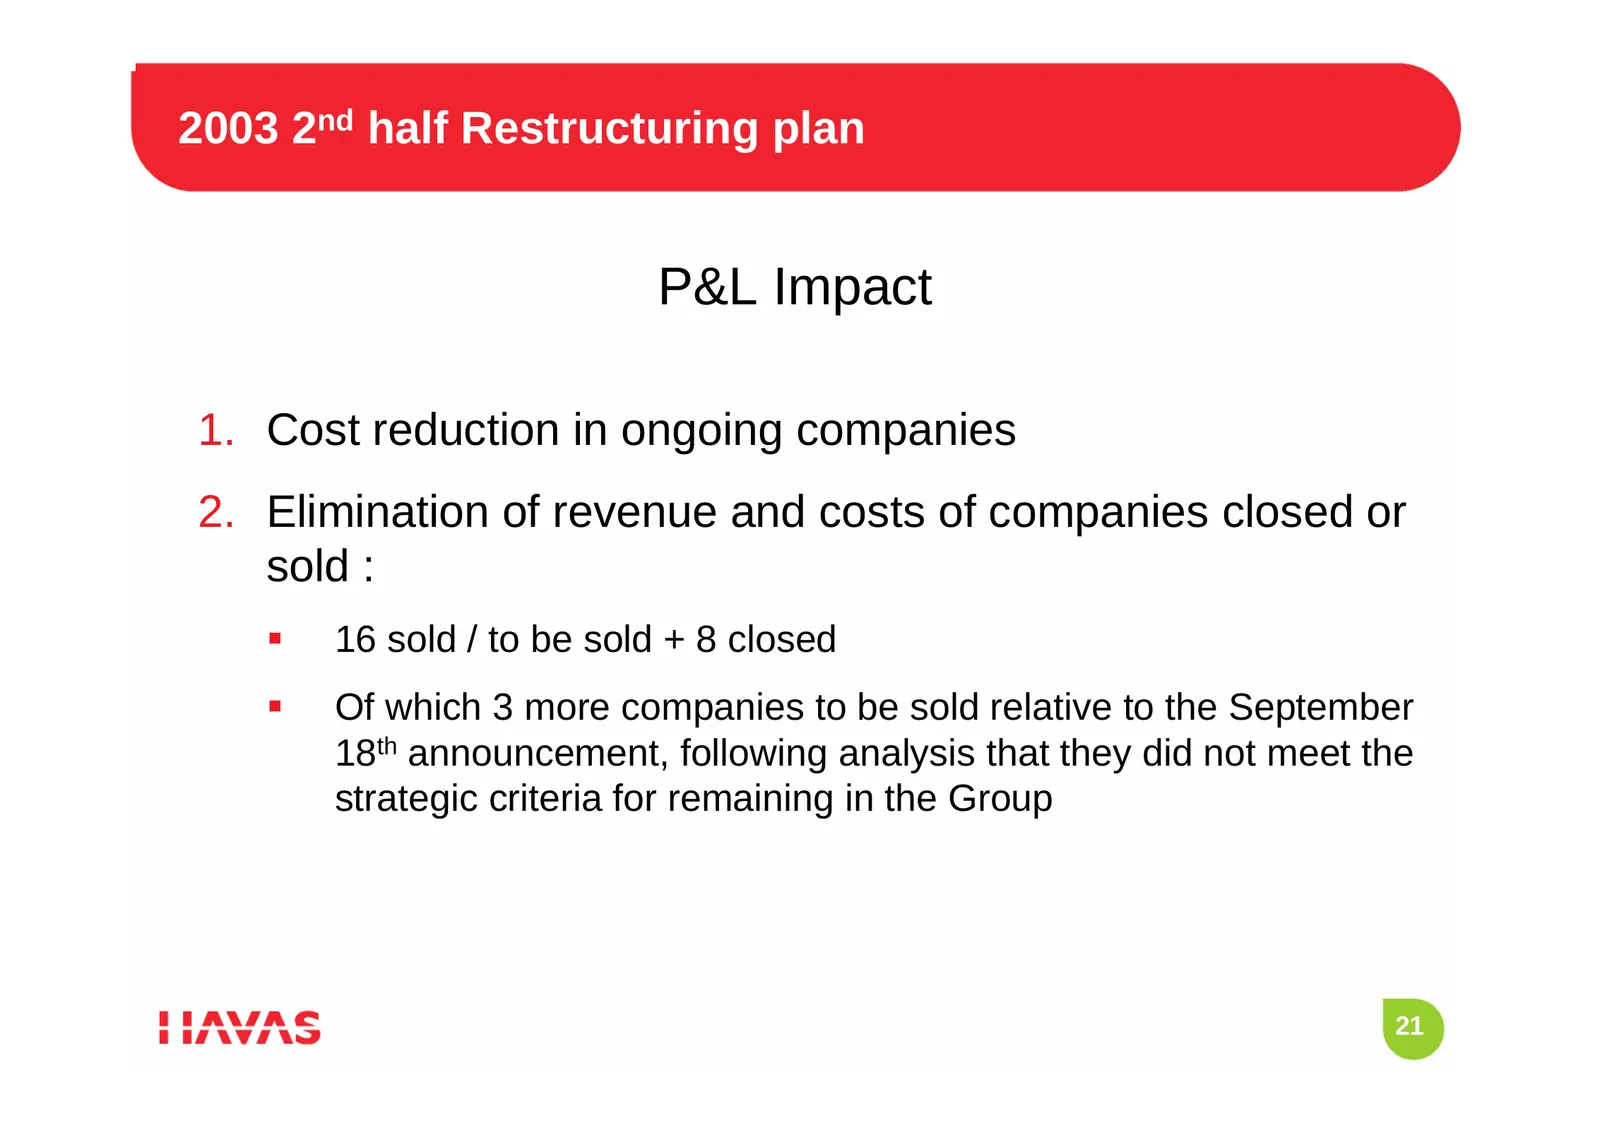
2003 2nd half Restructuring plan P&L Impact 1. Cost reduction in ongoing companies 2. Elimination of revenue and costs of companies closed or sold : 16 sold / to be sold + 8 closed Of which 3 more companies to be sold relative to the September 18th announcement, following analysis that they did
Slide 22: Cost Reduction in Ongoing Companies
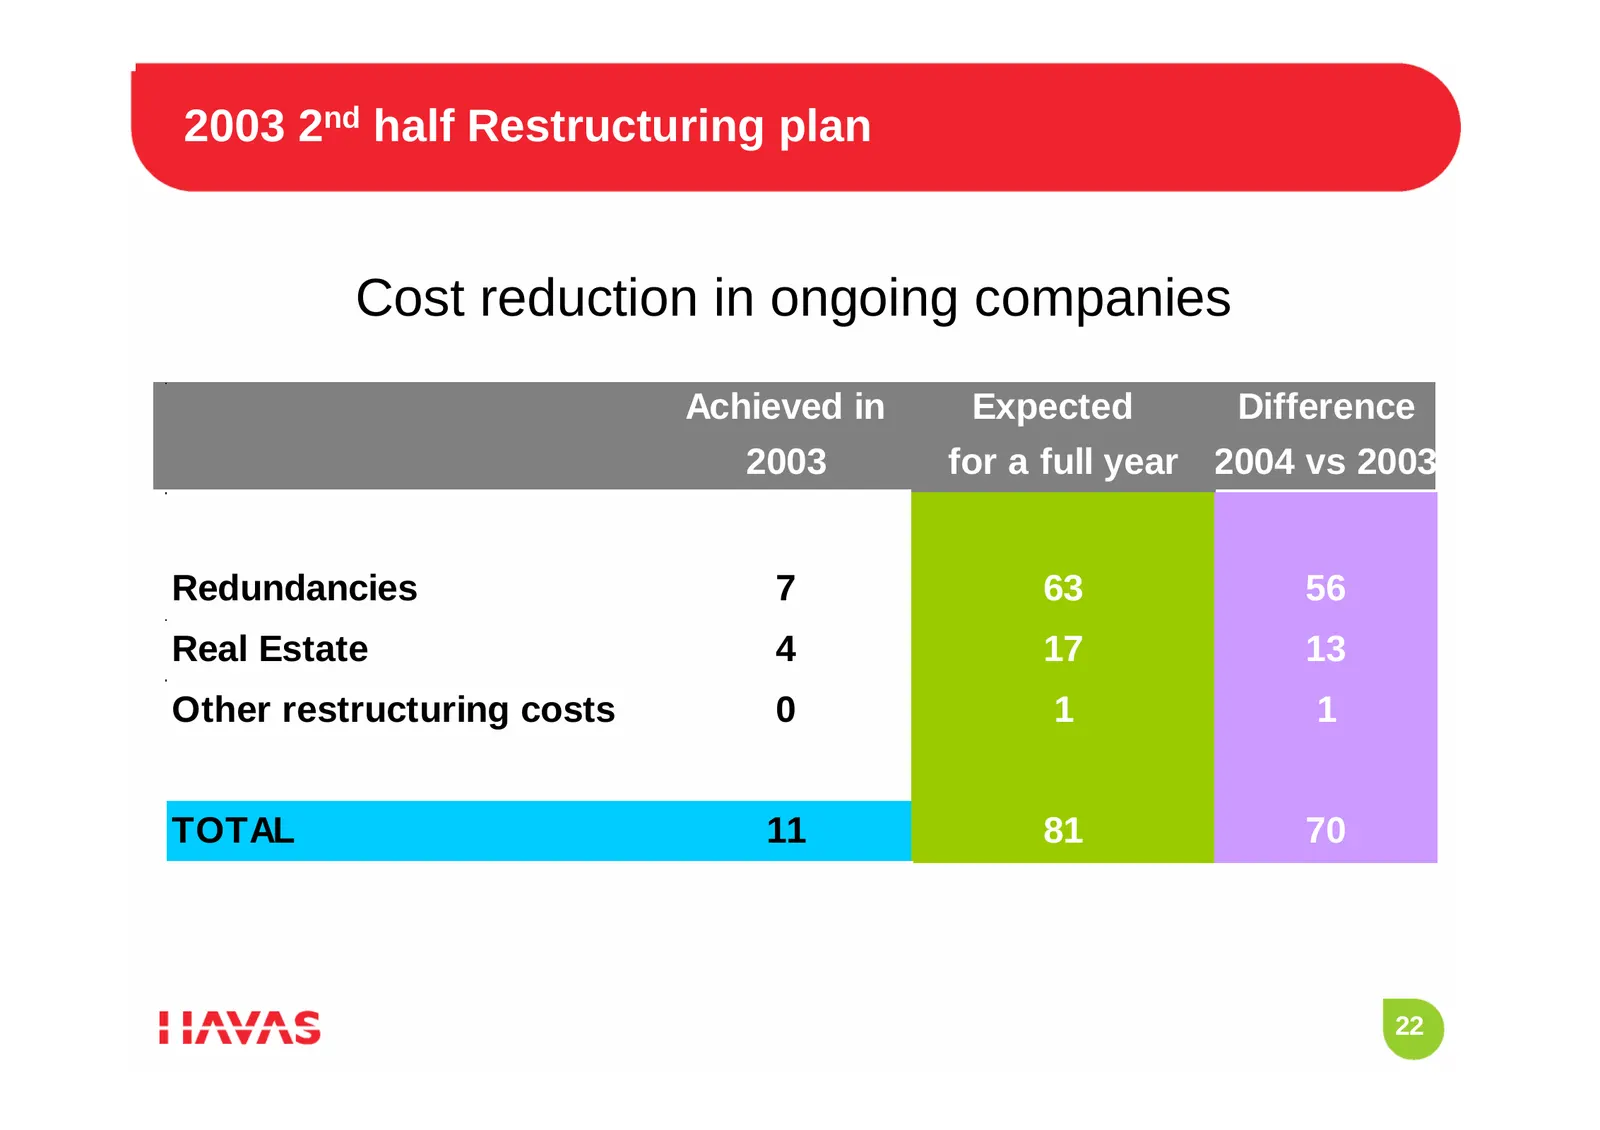
2003 2nd half Restructuring plan Cost reduction in ongoing companies Achieved in Expected Difference 2003 for a full year 2004 vs 2003 Redundancies 7 63 56 Real Estate 4 17 13 Other restructuring costs 0 1 1 TOTAL 11 81 70 22
Slide 23: Elimination of Revenue and Costs of Companies Sold or Closed
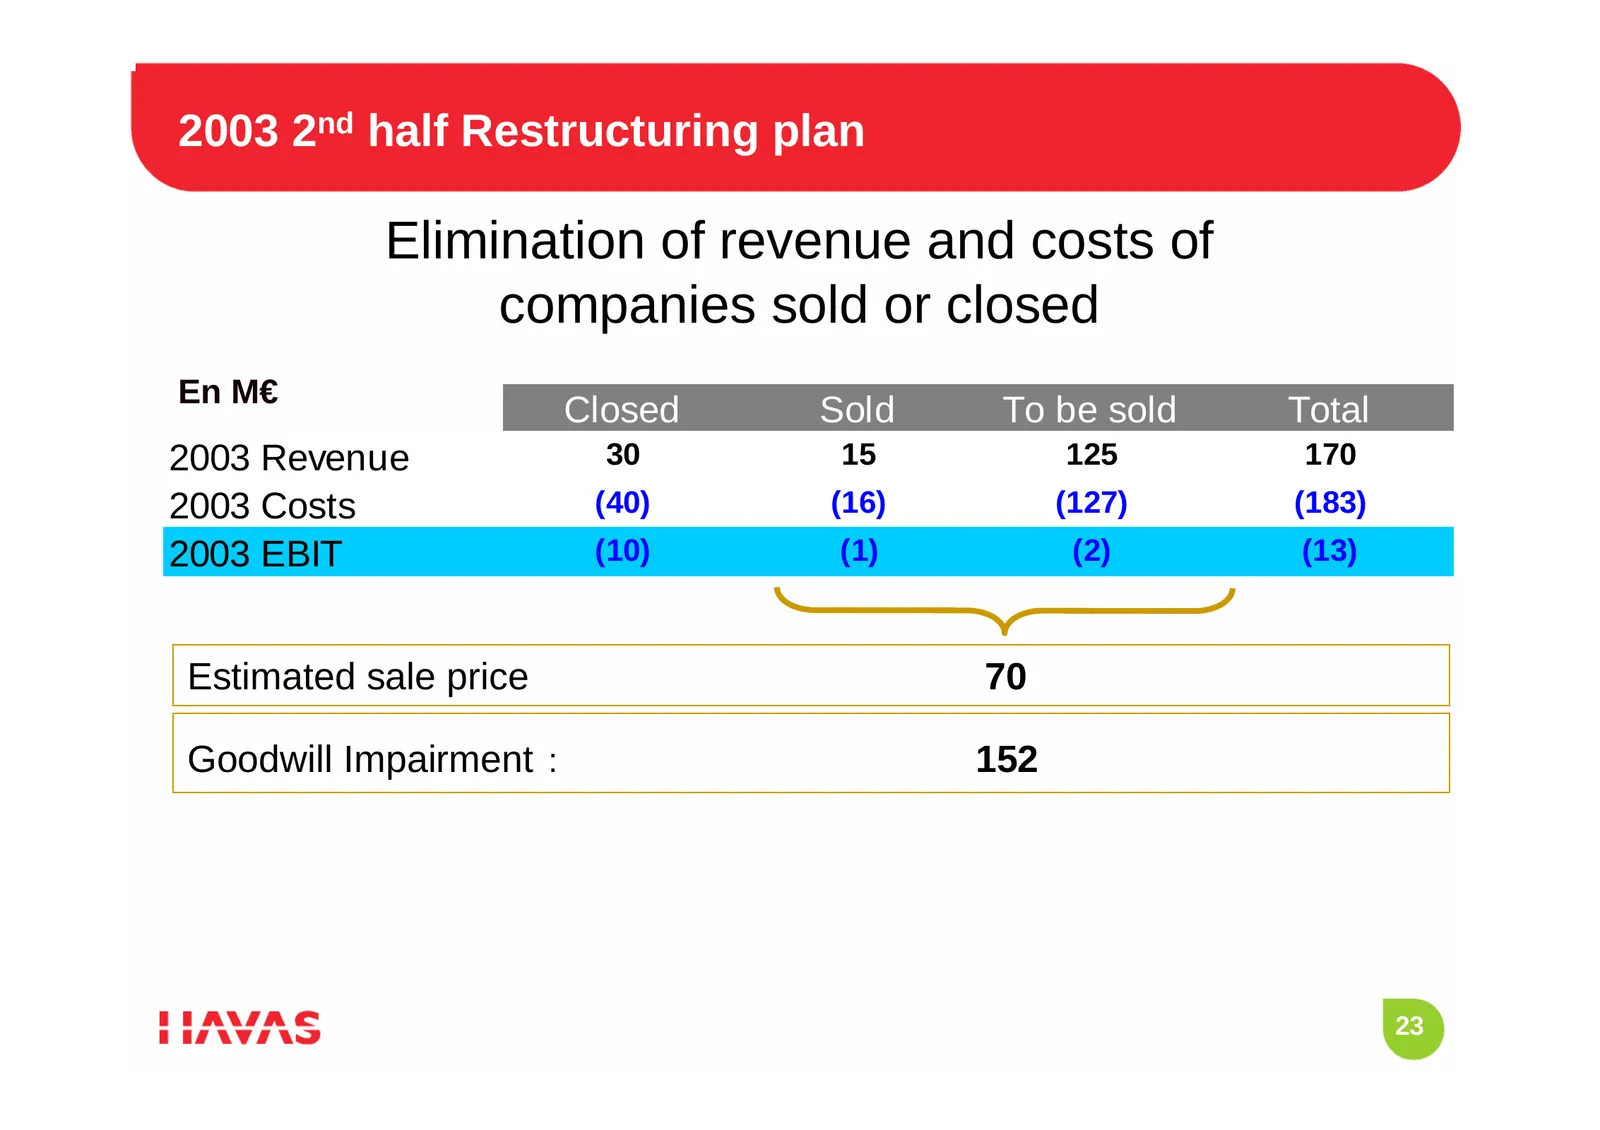
2003 2nd half Restructuring plan Elimination of revenue and costs of companies sold or closed En M€ Closed Sold To be sold Total 2003 Revenue 30 15 125 170 2003 Costs (40) (16) (127) (183) 2003 EBIT (10) (1) (2) (13) Estimated sale price 70 Goodwill Impairment : 152 23
Slide 24: Pro-forma Summary of 2003 Events
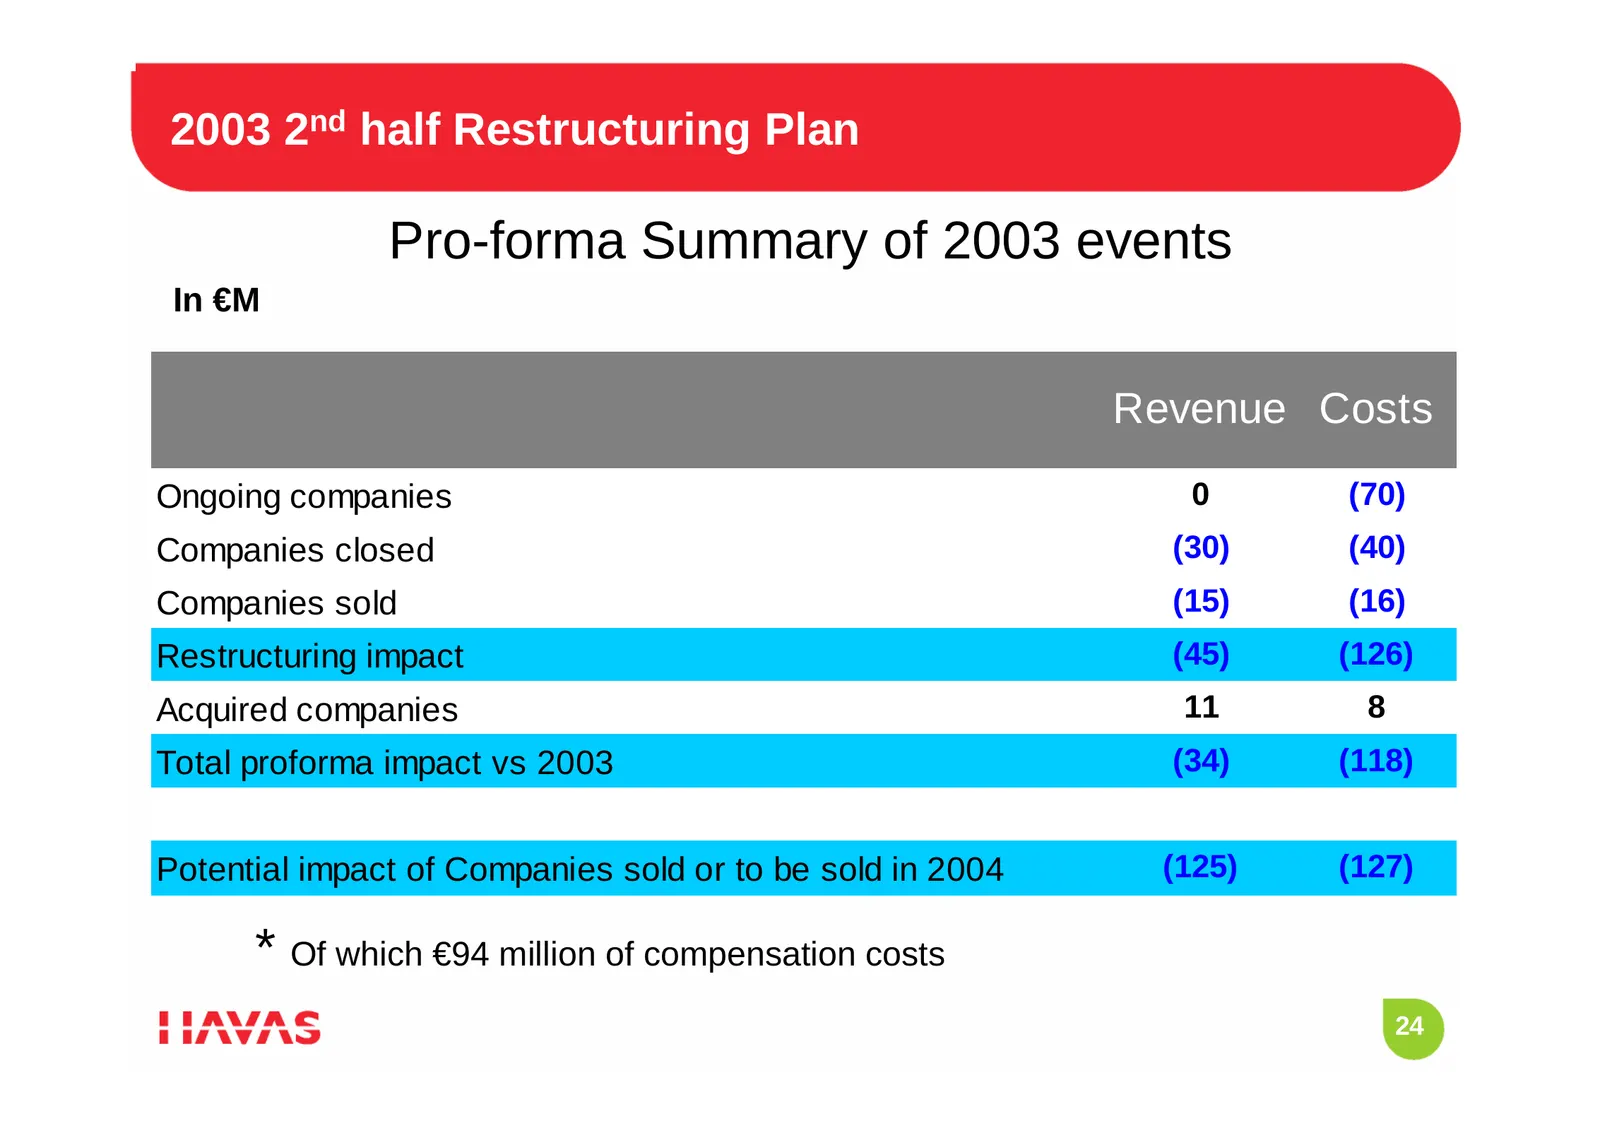
2003 2nd half Restructuring Plan Pro-forma Summary of 2003 events In €M Impact sur 2004 par rapport à 2003 Revenue Costs Ongoing companies 0 (70) Companies closed (30) (40) Companies sold (15) (16) Restructuring impact (45) (126) Acquired companies 11 8 Total proforma impact vs 2003 (34) (118) Poten
Slide 25: 2003 - Tax
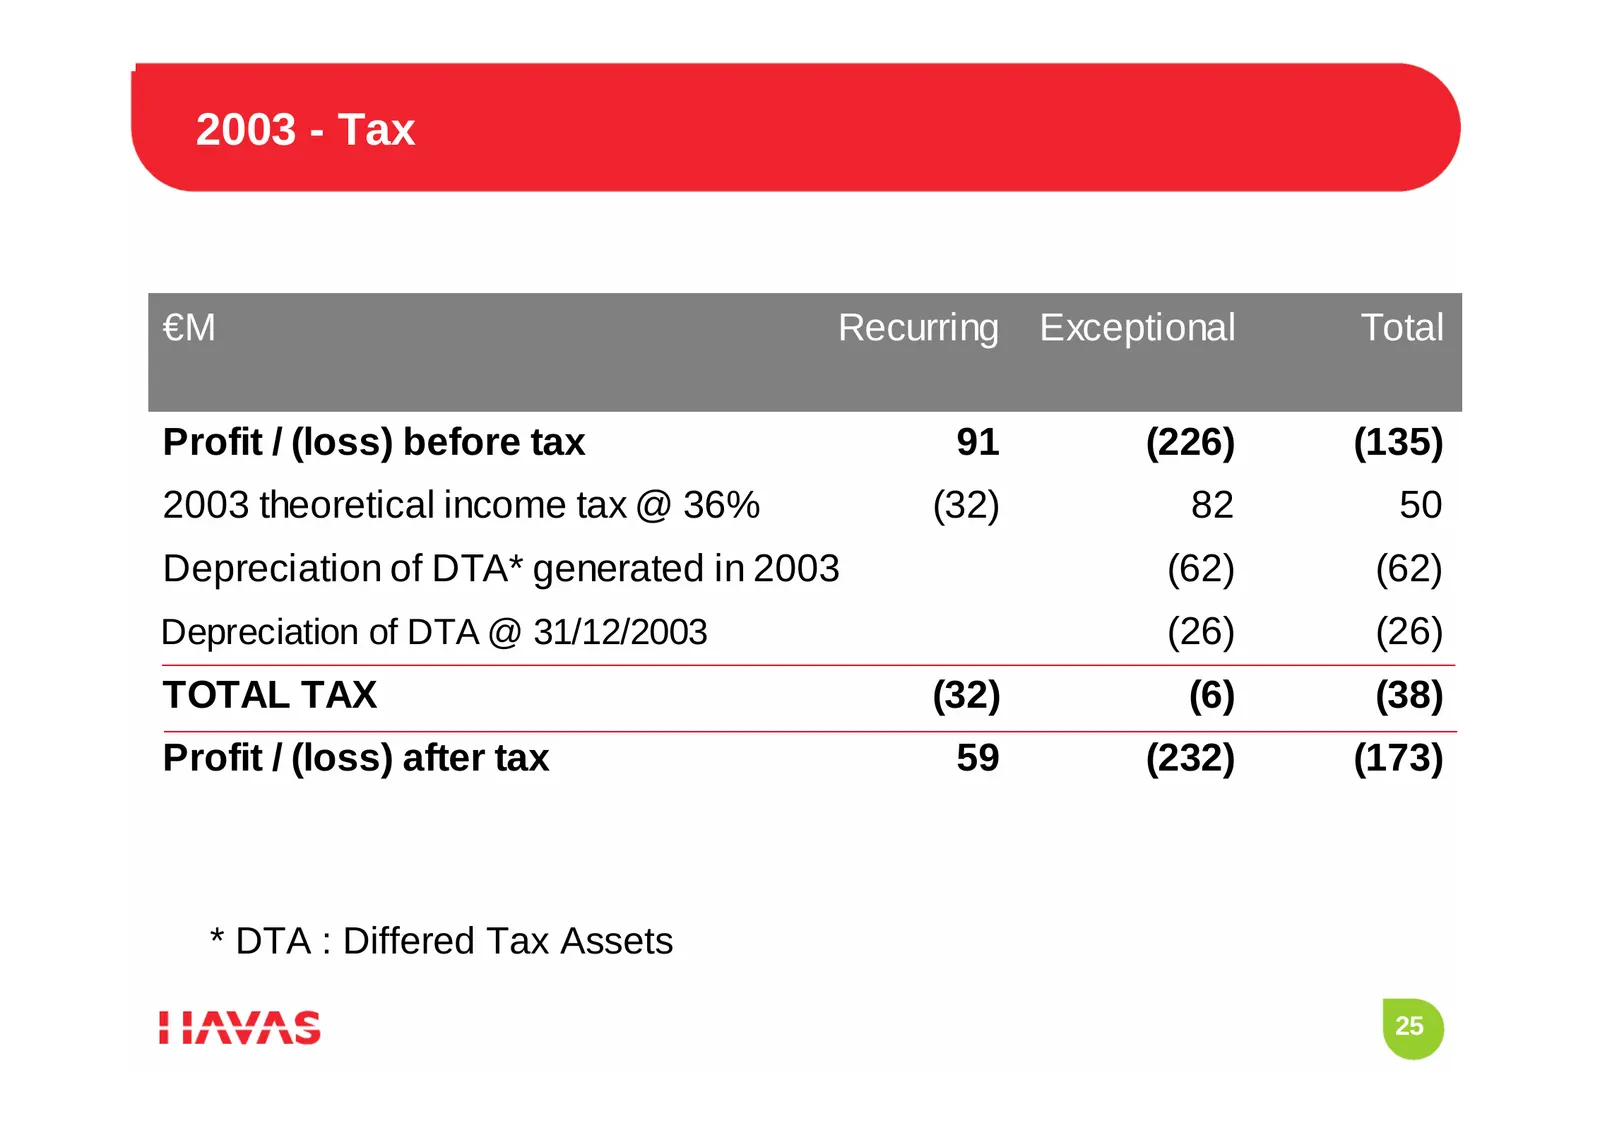
2003 - Tax €M Recurring Exceptional Total Profit / (loss) before tax 91 (226) (135) 2003 theoretical income tax @ 36% (32) 82 50 Depreciation of DTA* generated in 2003 (62) (62) Depreciation of DTA @ 31/12/2003 (26) (26) TOTAL TAX (32) (6) (38) Profit / (loss) after tax 59 (232) (173) * DTA : Differ
Slide 26: 2003 - Goodwill
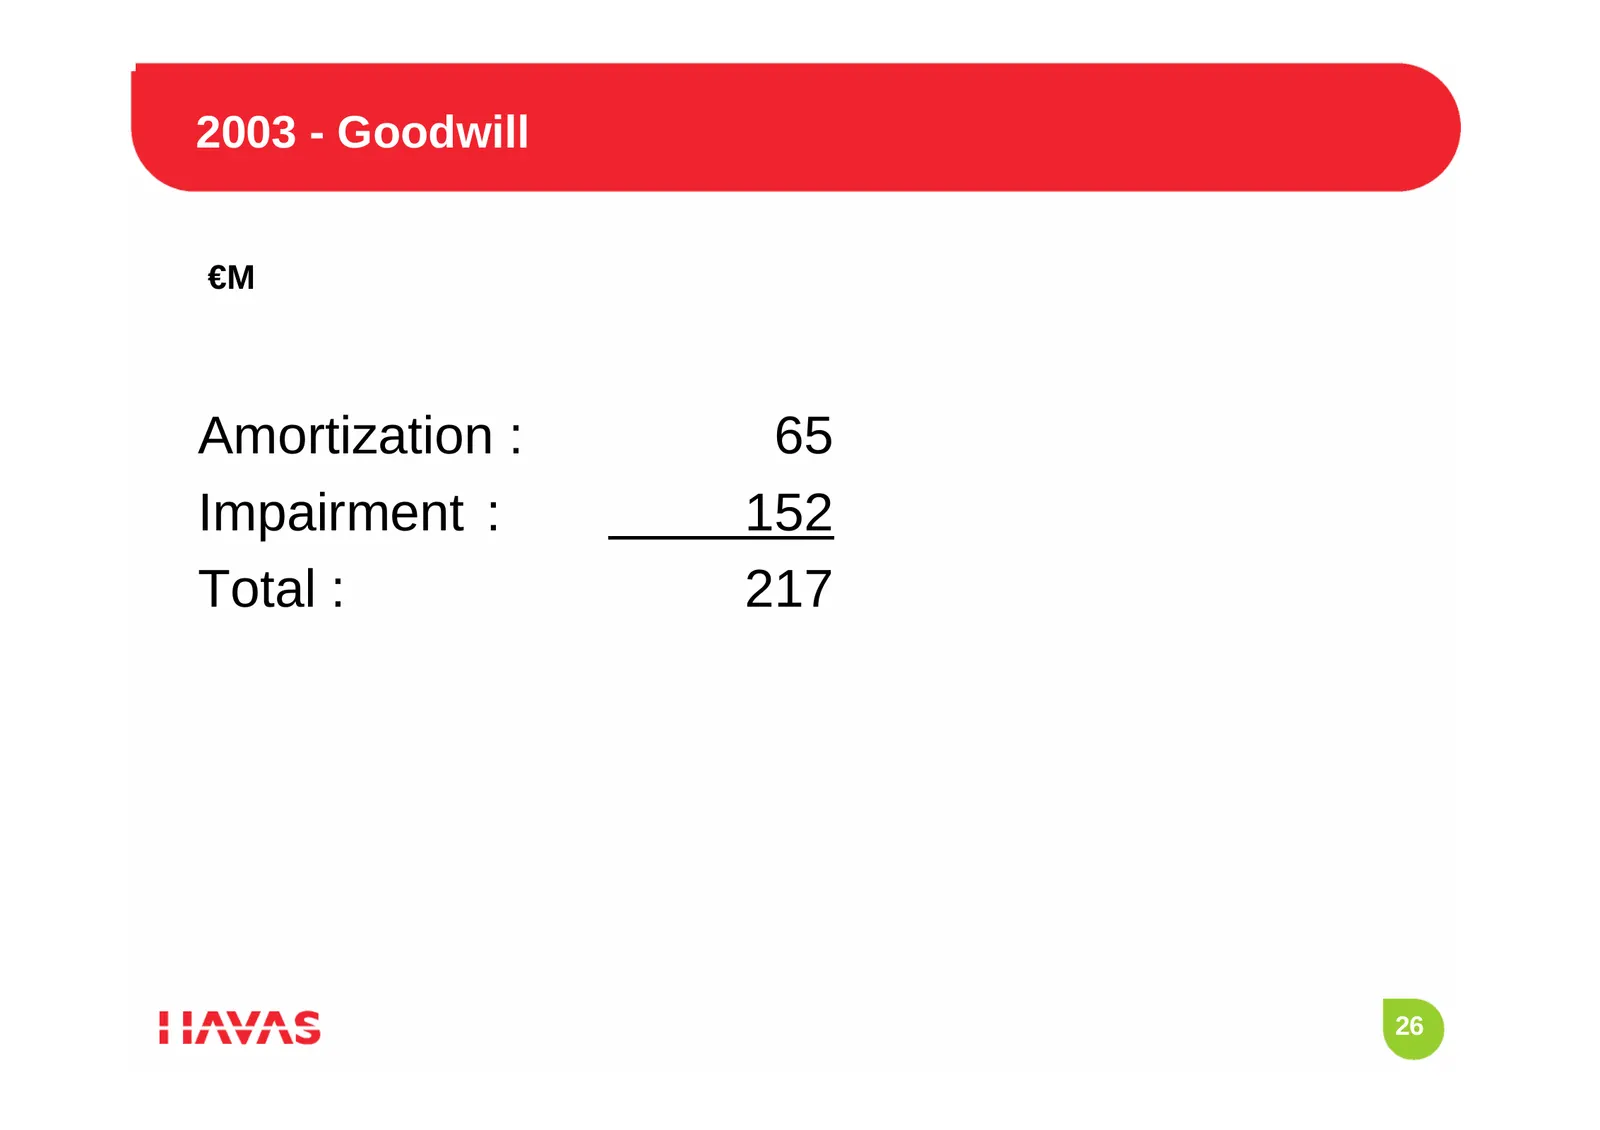
2003 - Goodwill €M Amortization : 65 Impairment : 152 Total : 217 26
Slide 27: 2003 – Earnings per Share
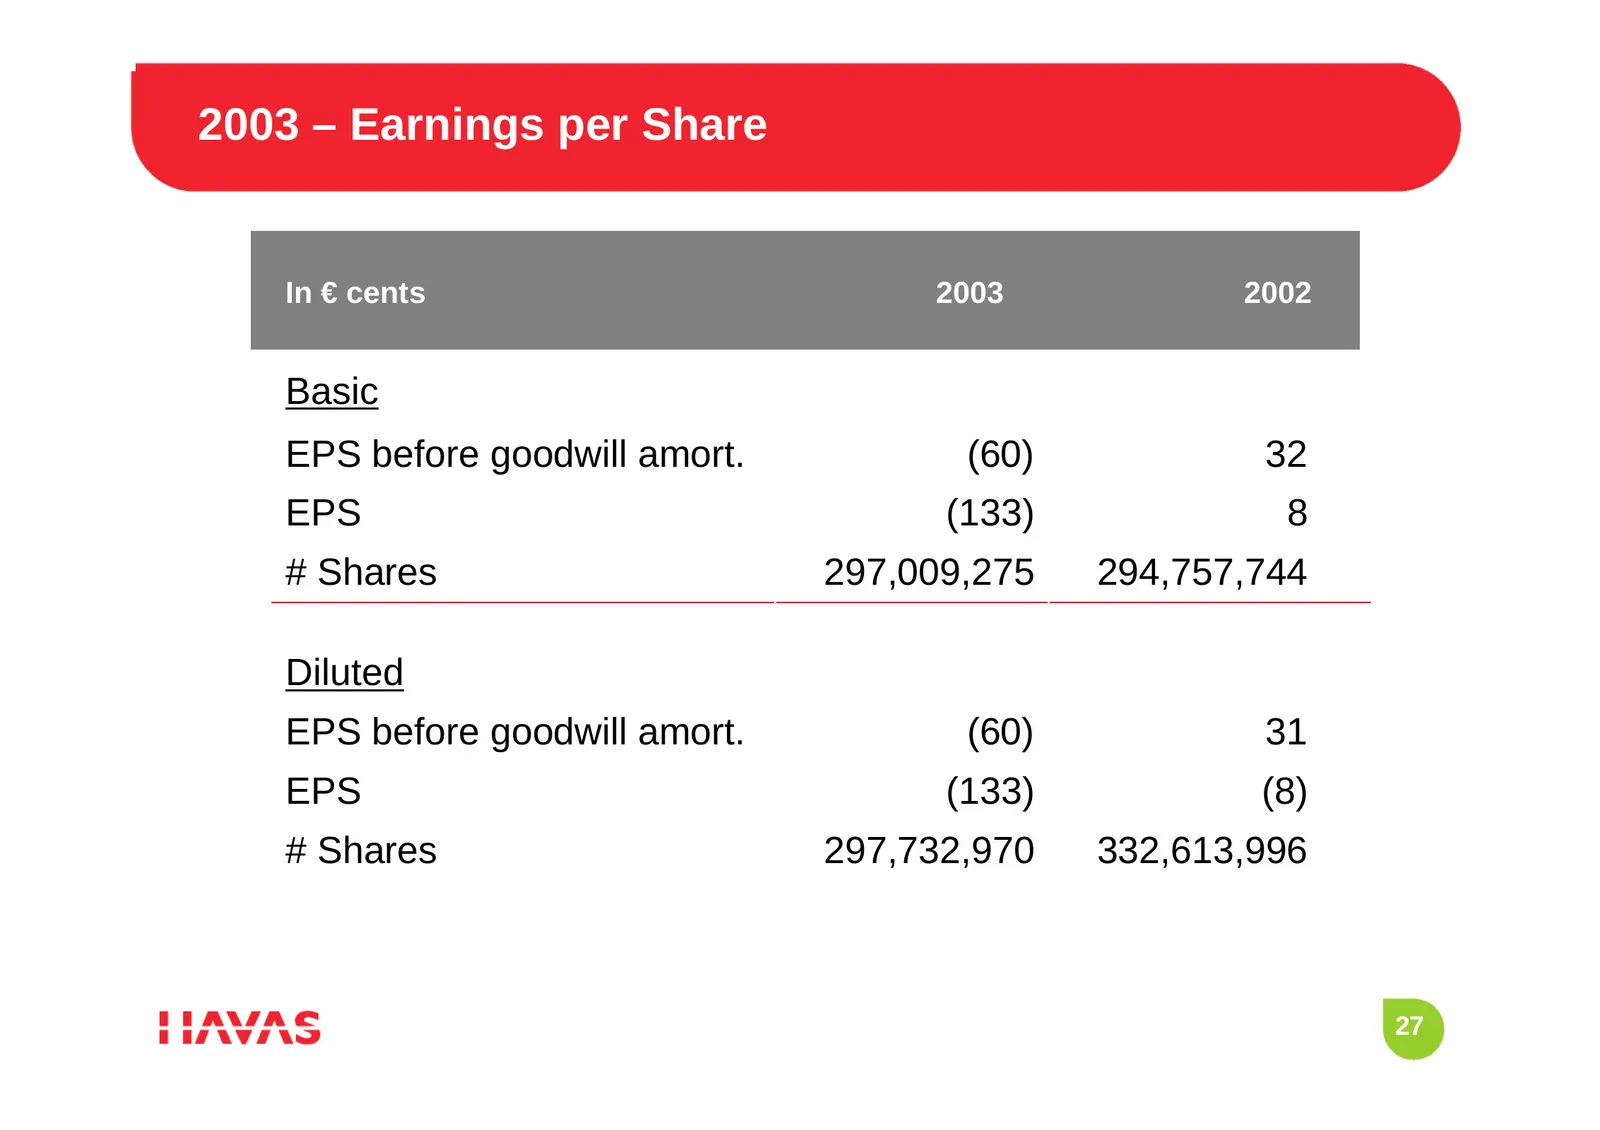
2003 – Earnings per Share In € cents 2003 2002 Basic EPS before goodwill amort. (60) 32 EPS (133) 8 # Shares 297,009,275 294,757,744 Diluted EPS before goodwill amort. (60) 31 EPS (133) (8) # Shares 297,732,970 332,613,996 27

Slide 28: Cash Flow Statement and Balance Sheet as at 31/12/03
CASH FLOW STATEMENT AND BALANCE SHEET AS AT 31/12/03 28
Slide 29: 2003 – Cash Flow Statement
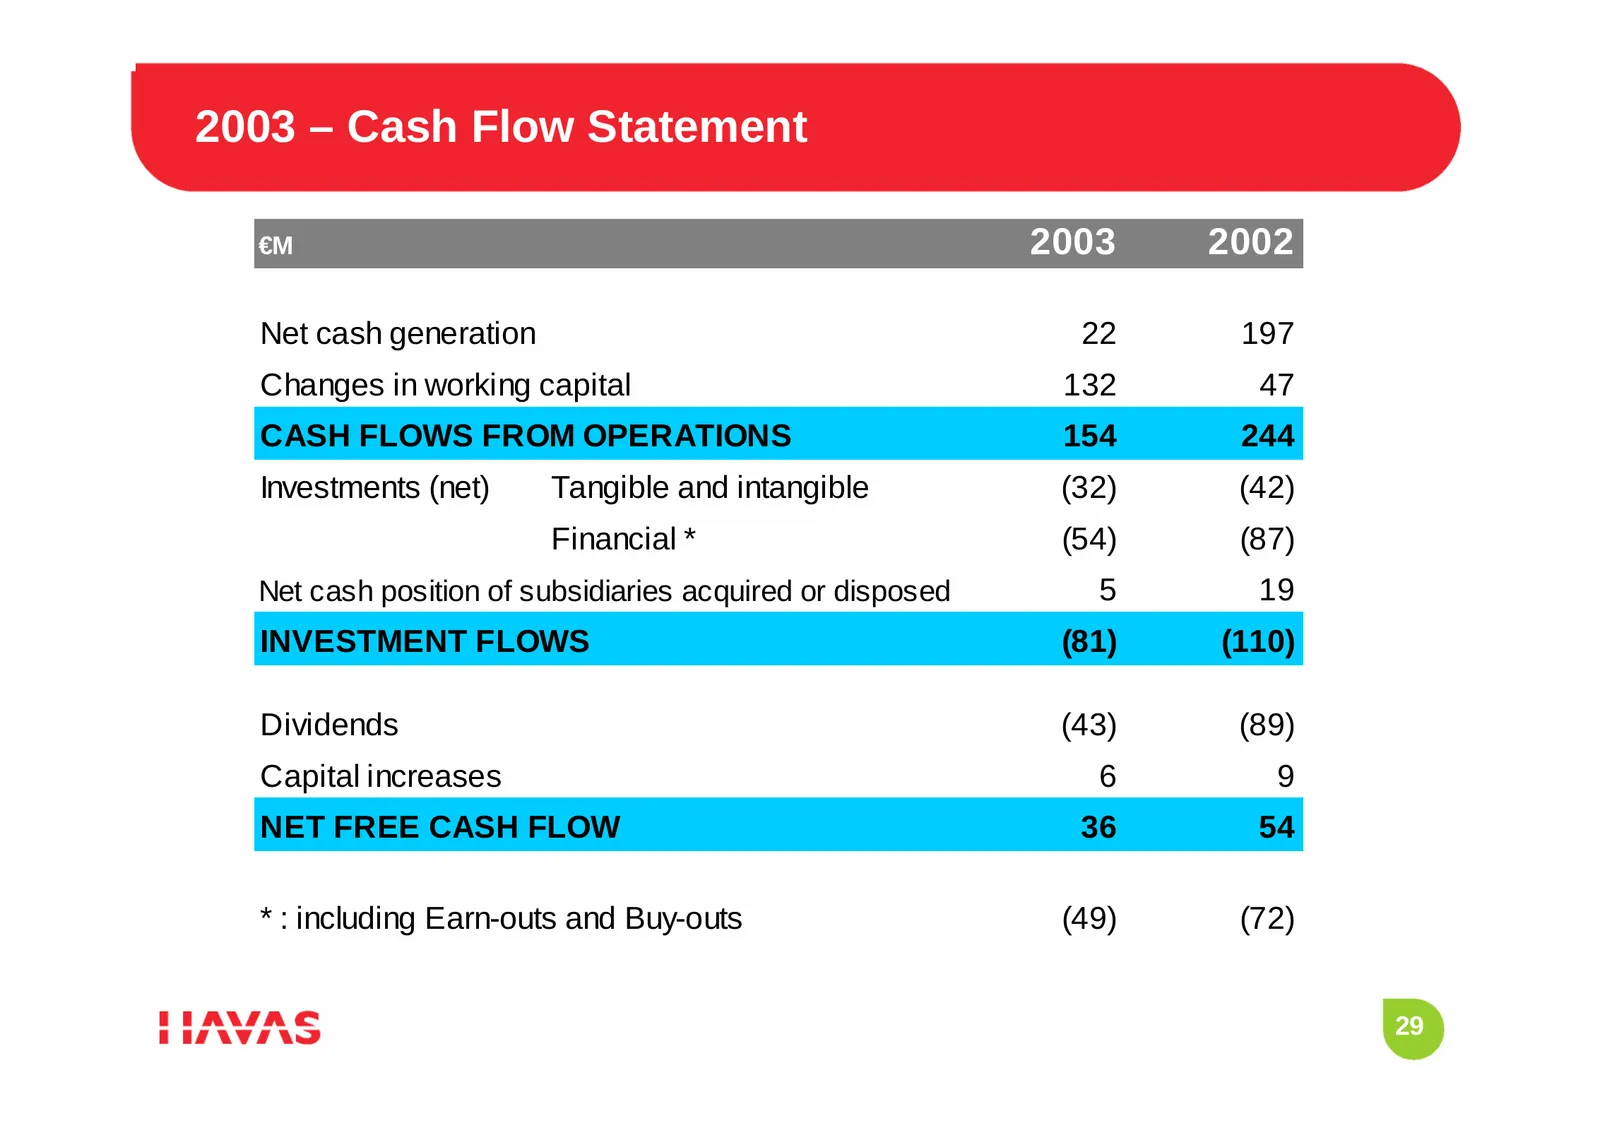
2003 – Cash Flow Statement €M 2003 2002 Net cash generation 22 197 Changes in working capital 132 47 CASH FLOWS FROM OPERATIONS 154 244 Investments (net) Tangible and intangible (32) (42) Financial * (54) (87) Net cash position of subsidiaries acquired or disposed 5 19 INVESTMENT FLOWS (81) (110) Di
Slide 30: 2003 – Working Capital Analysis
2003 – Working Capital Analysis A positive flow of €132 million €82 million coming from a multi-year group-wide program to improve working capital, following an excellent performance in 2002 €50 million of exceptional items, including €41 million of restructuring costs which will be expensed in
Slide 31: 2003 – Working Capital Analysis
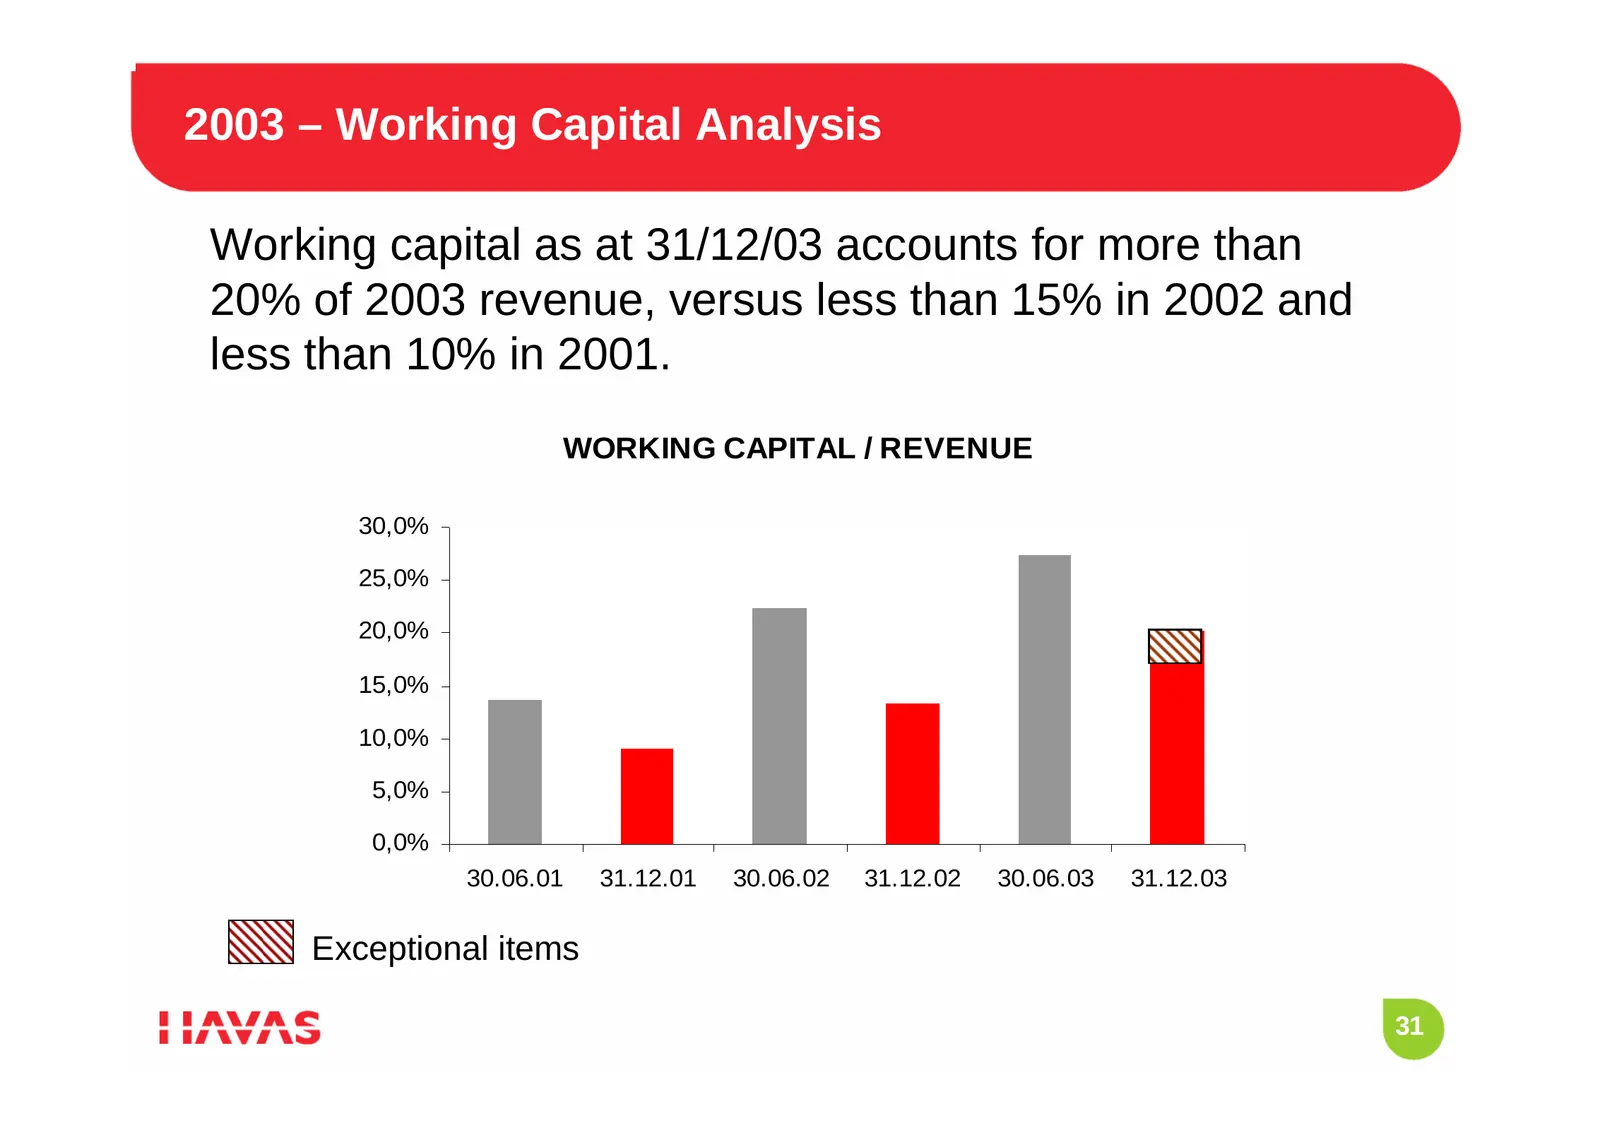
2003 – Working Capital Analysis Working capital as at 31/12/03 accounts for more than 20% of 2003 revenue, versus less than 15% in 2002 and less than 10% in 2001. WORKING CAPITAL / REVENUE 30,0% 25,0% 20,0% 15,0% 10,0% 5,0% 0,0% 30.06.01 31.12.01 30.06.02 31.12.02 30.06.03 31.12.03 Exceptional items
Slide 32: 2003 – Evolution of Net Debt
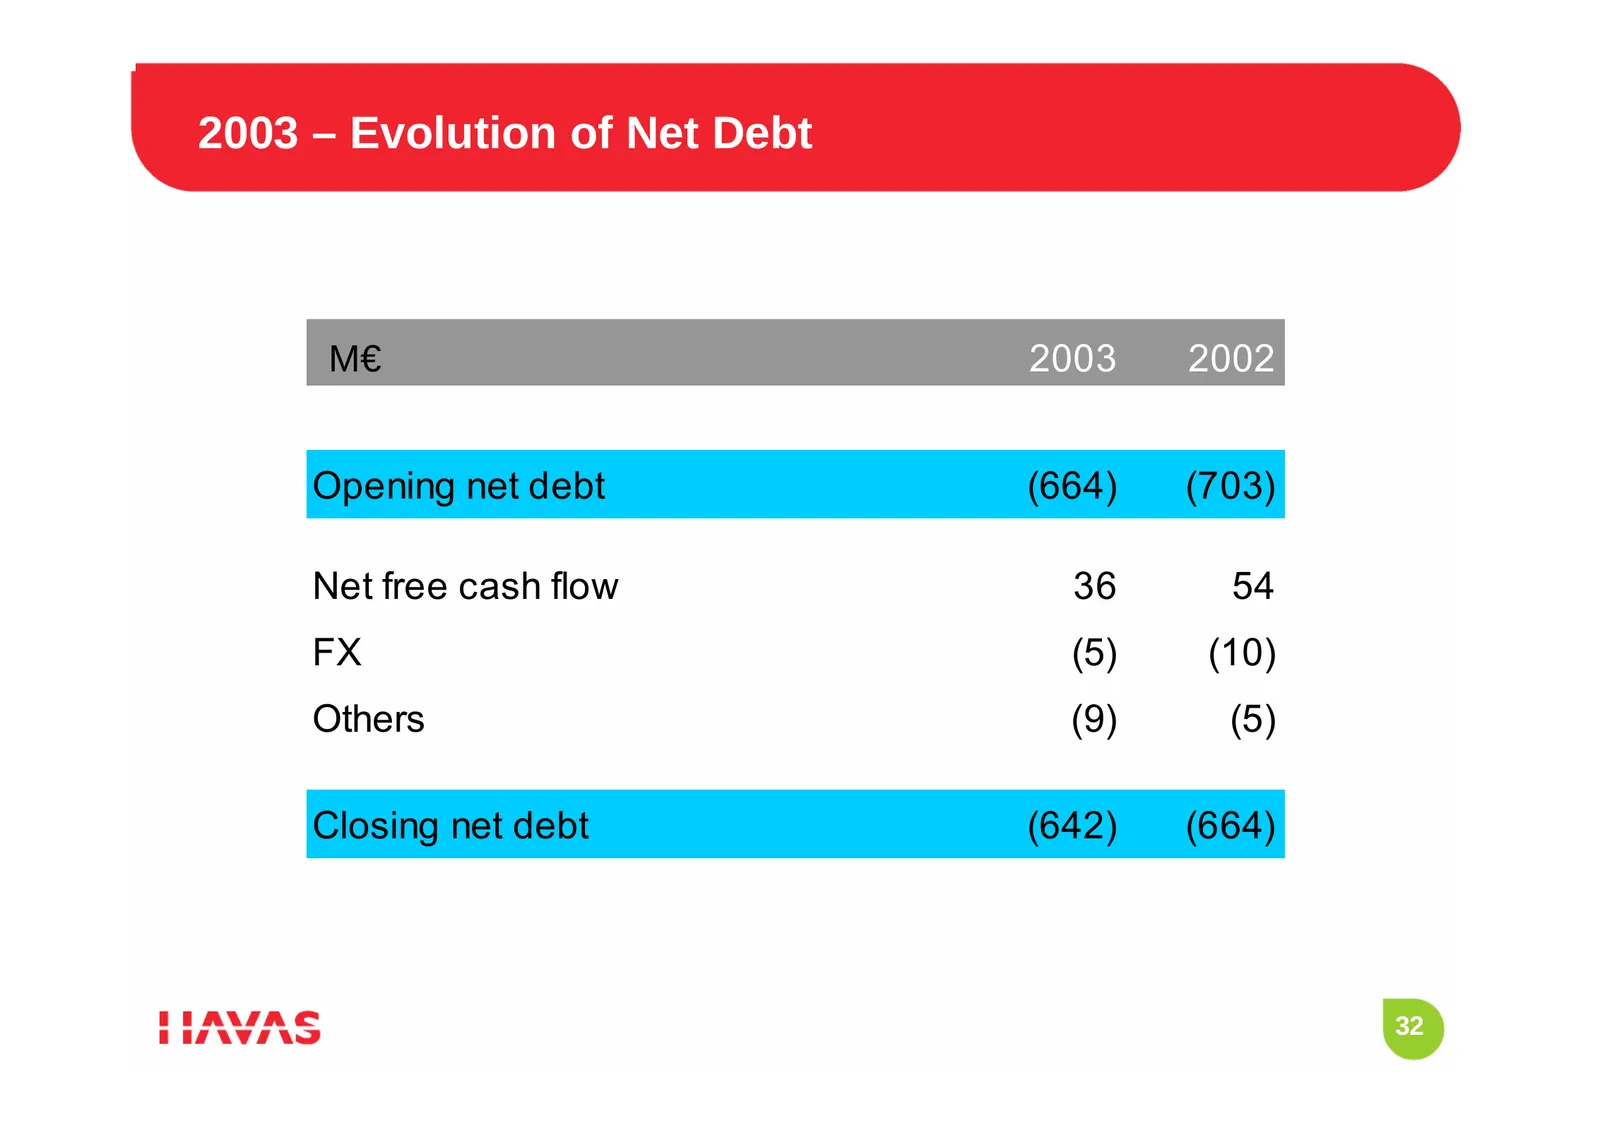
2003 – Evolution of Net Debt €M M€ 2003 2002 Opening net debt (664) (703) Net free cash flow 36 54 FX (5) (10) Others (9) (5) Closing net debt (642) (664) 32
Slide 33: 2003 – Structure of Net Debt
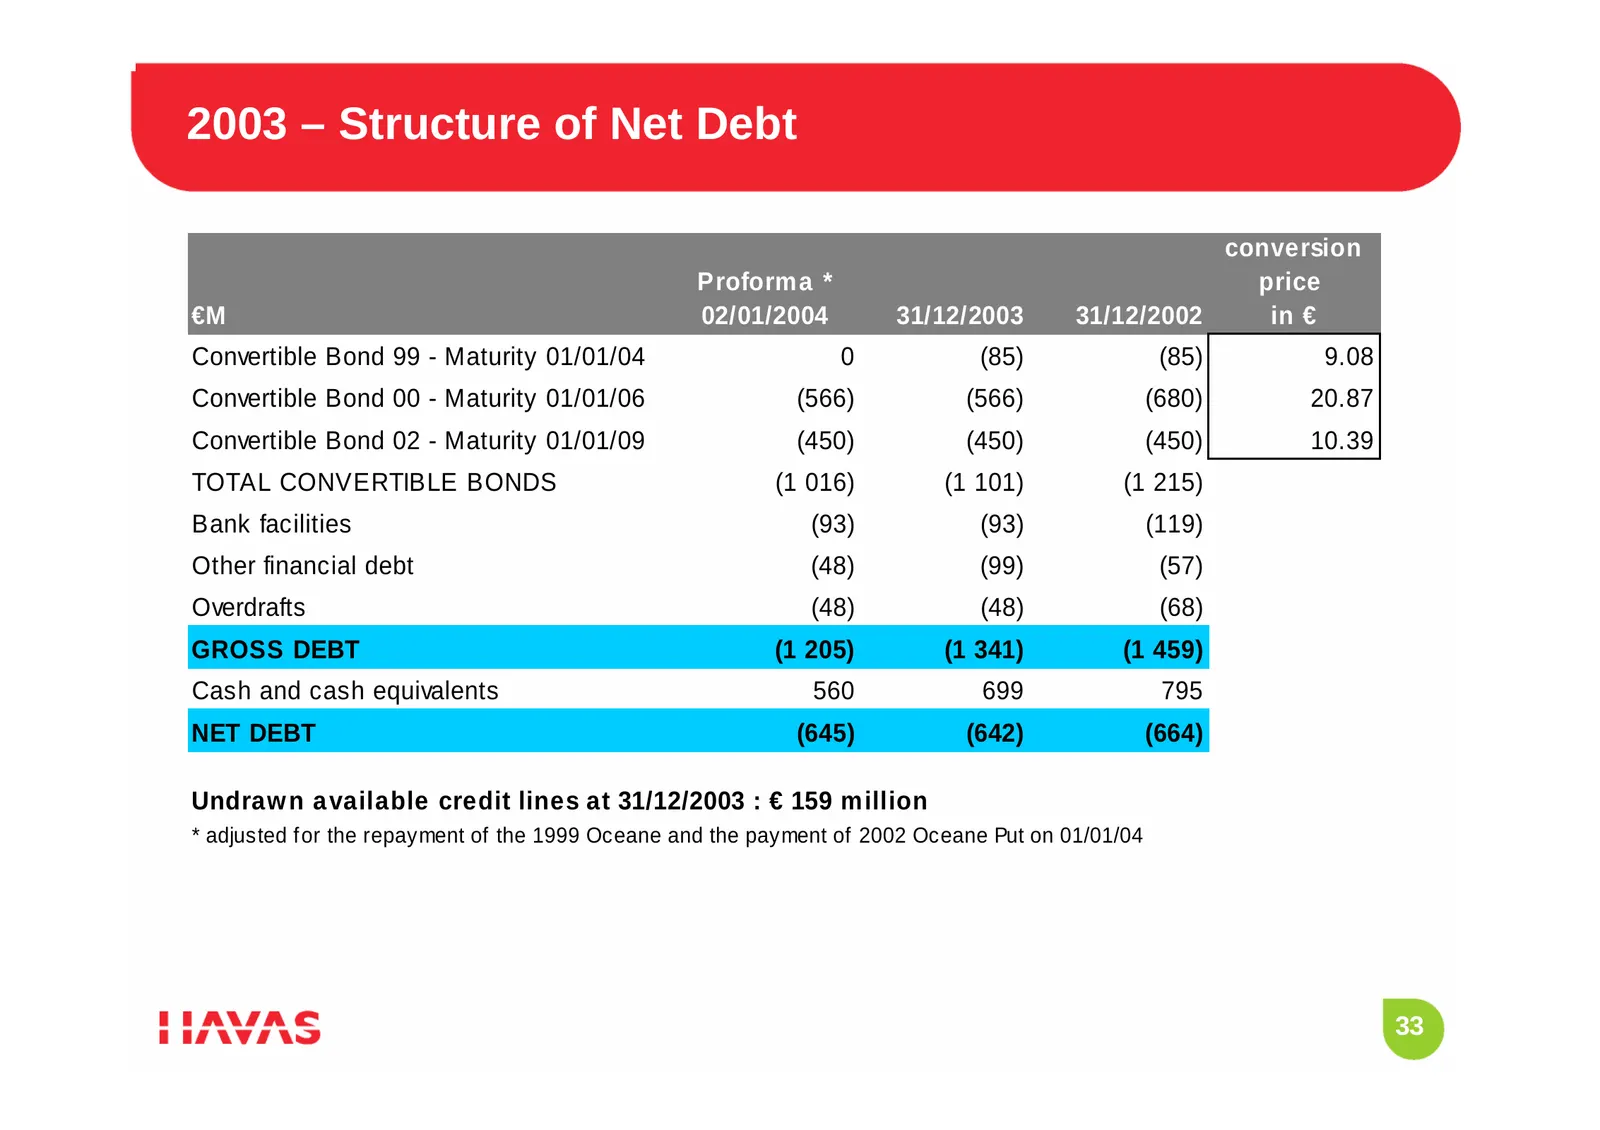
2003 – Structure of Net Debt conversion Proforma * price €M 02/01/2004 31/12/2003 31/12/2002 in € Convertible Bond 99 - Maturity 01/01/04 0 (85) (85) 9.08 Convertible Bond 00 - Maturity 01/01/06 (566) (566) (680) 20.87 Convertible Bond 02 - Maturity 01/01/09 (450) (450) (450) 10.39 TOTAL CONVERTIBLE
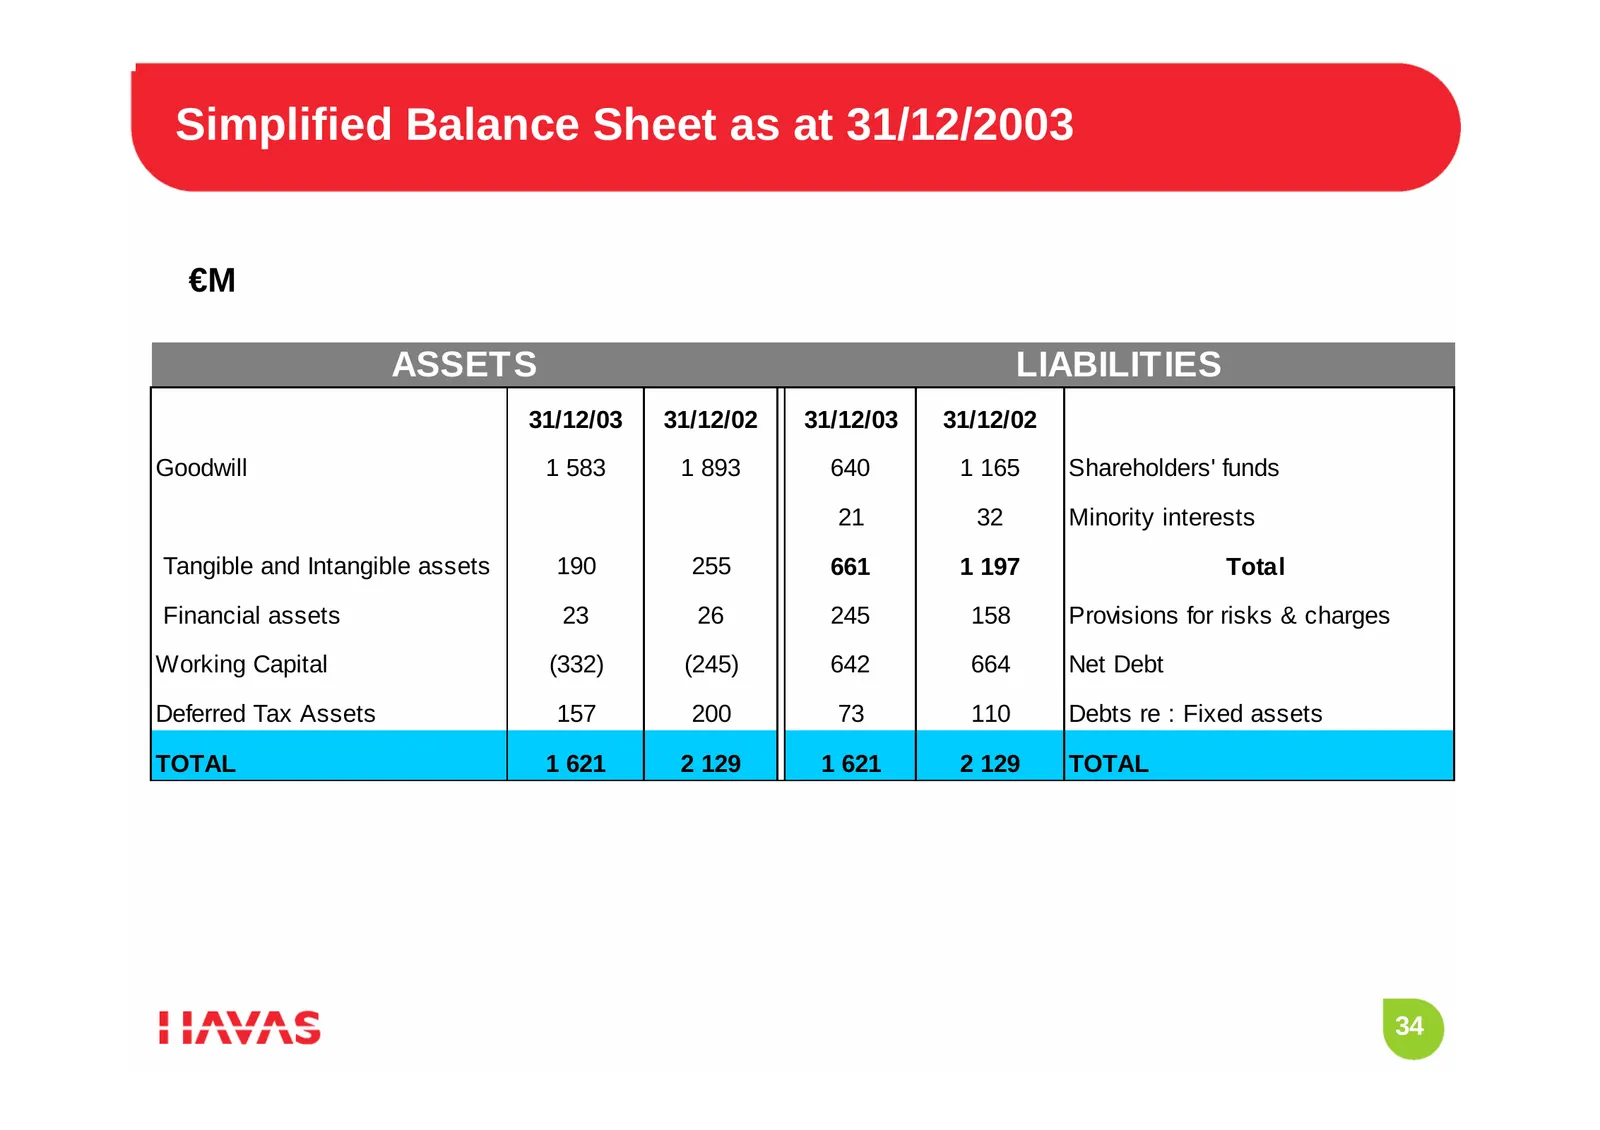
Slide 34: Simplified Balance Sheet as at 31/12/2003
Simplified Balance Sheet as at 31/12/2003 €M ASSETS LIABILITIES 31/12/03 31/12/02 31/12/03 31/12/02 Goodwill 1 583 1 893 640 1 165 Shareholders' funds 21 32 Minority interests Tangible and Intangible assets 190 255 661 1 197 Total Financial assets 23 26 245 158 Provisions for risks & charges Working
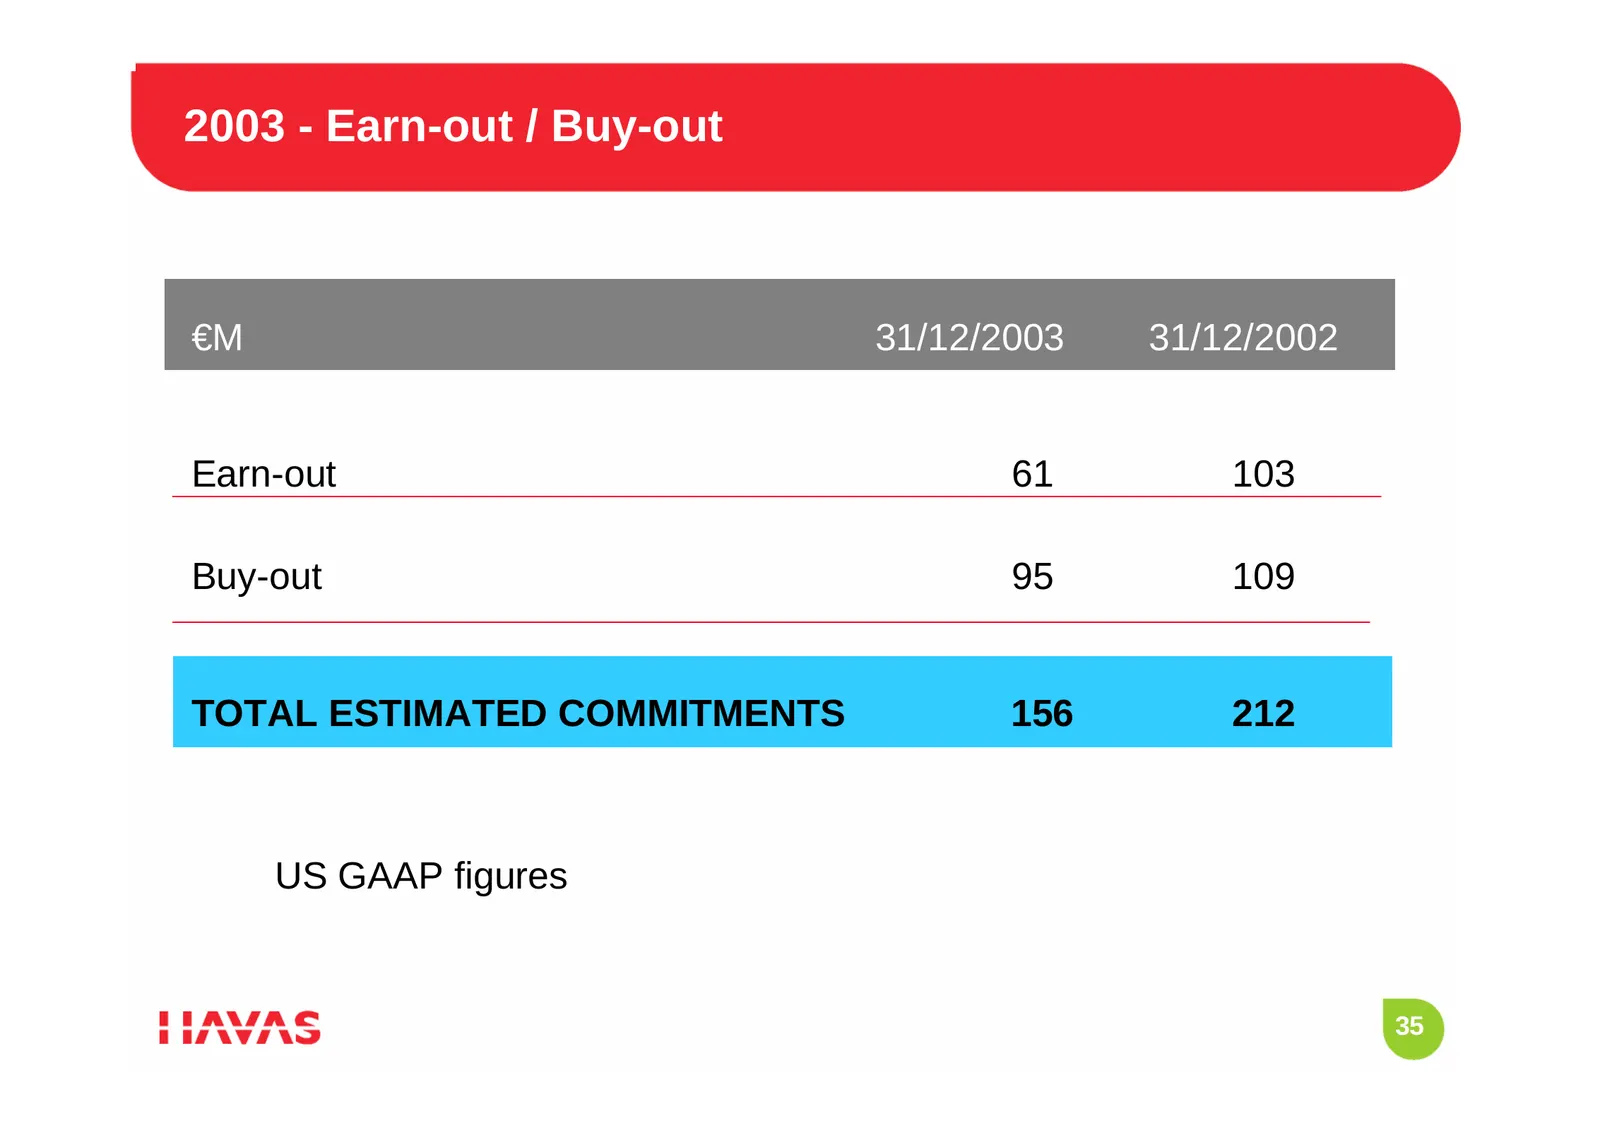
Slide 35: 2003 - Earn-out / Buy-out
2003 - Earn-out / Buy-out €M 31/12/2003 31/12/2002 Earn-out 61 103 Buy-out 95 109 TOTAL ESTIMATED COMMITMENTS 156 212 US GAAP figures 35
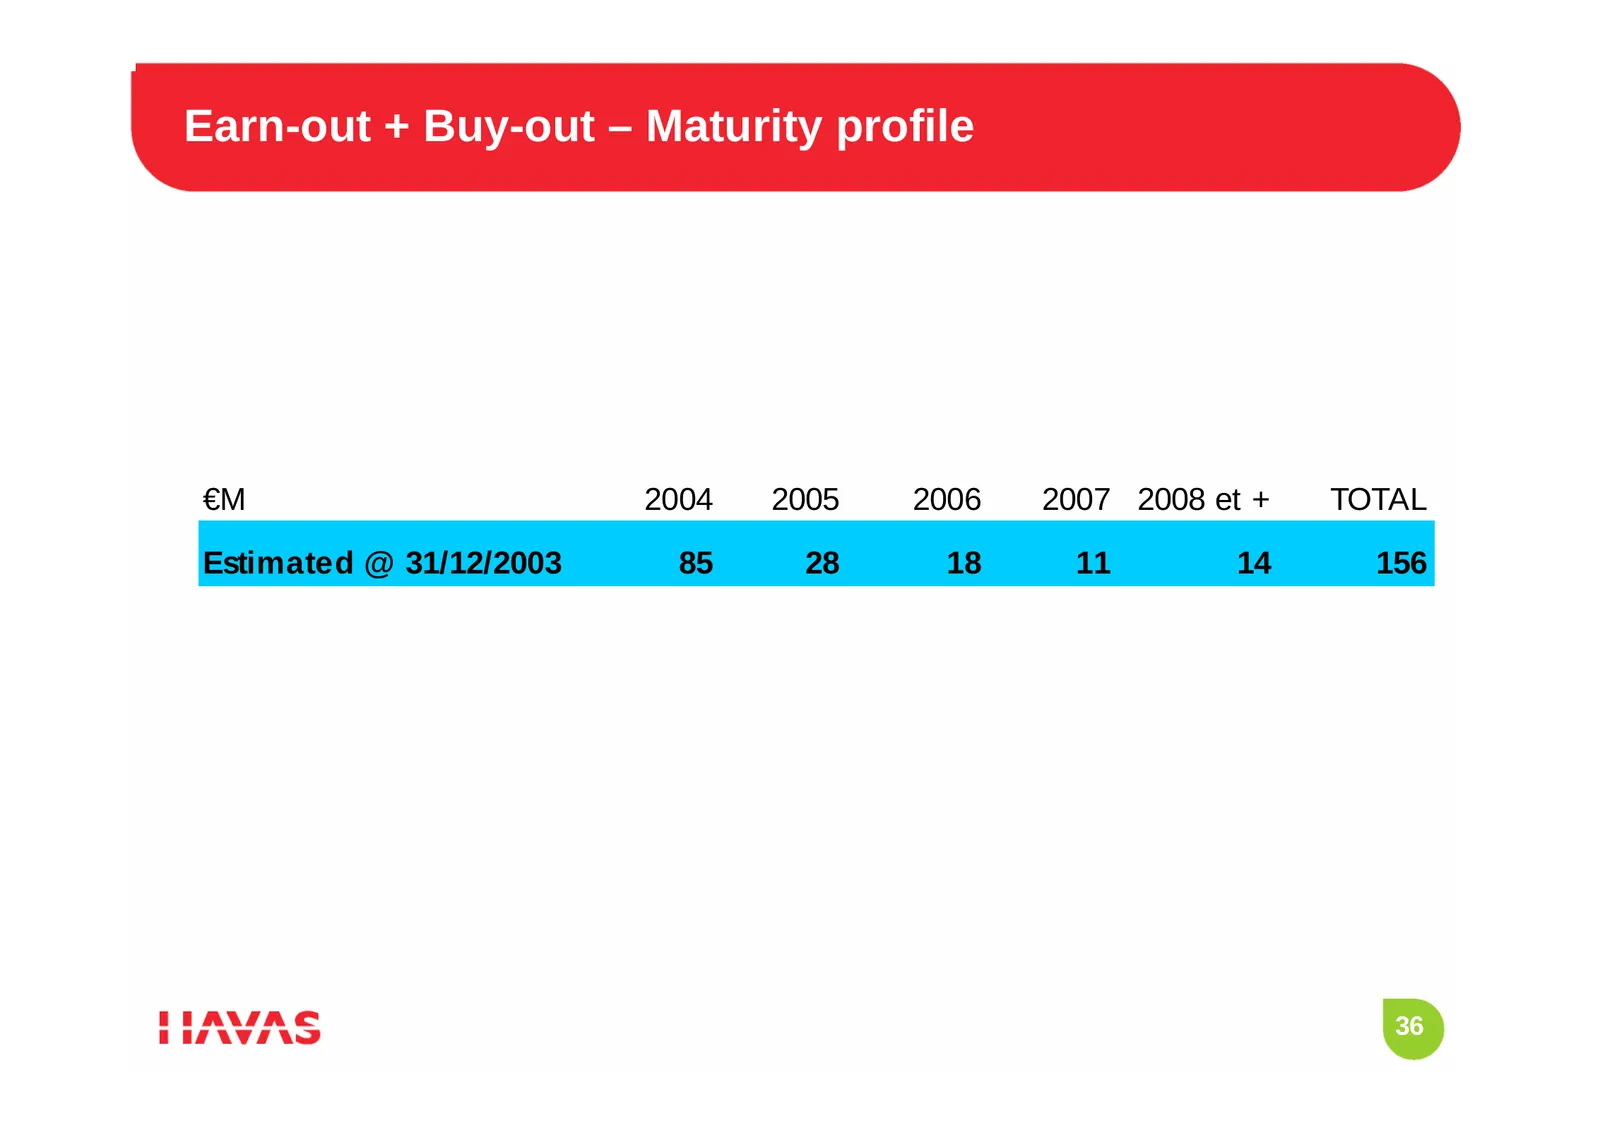
Slide 36: Earn-out + Buy-out – Maturity Profile
Earn-out + Buy-out – Maturity profile €M 2004 2005 2006 2007 2008 et + TOTAL Estimated @ 31/12/2003 85 28 18 11 14 156 36
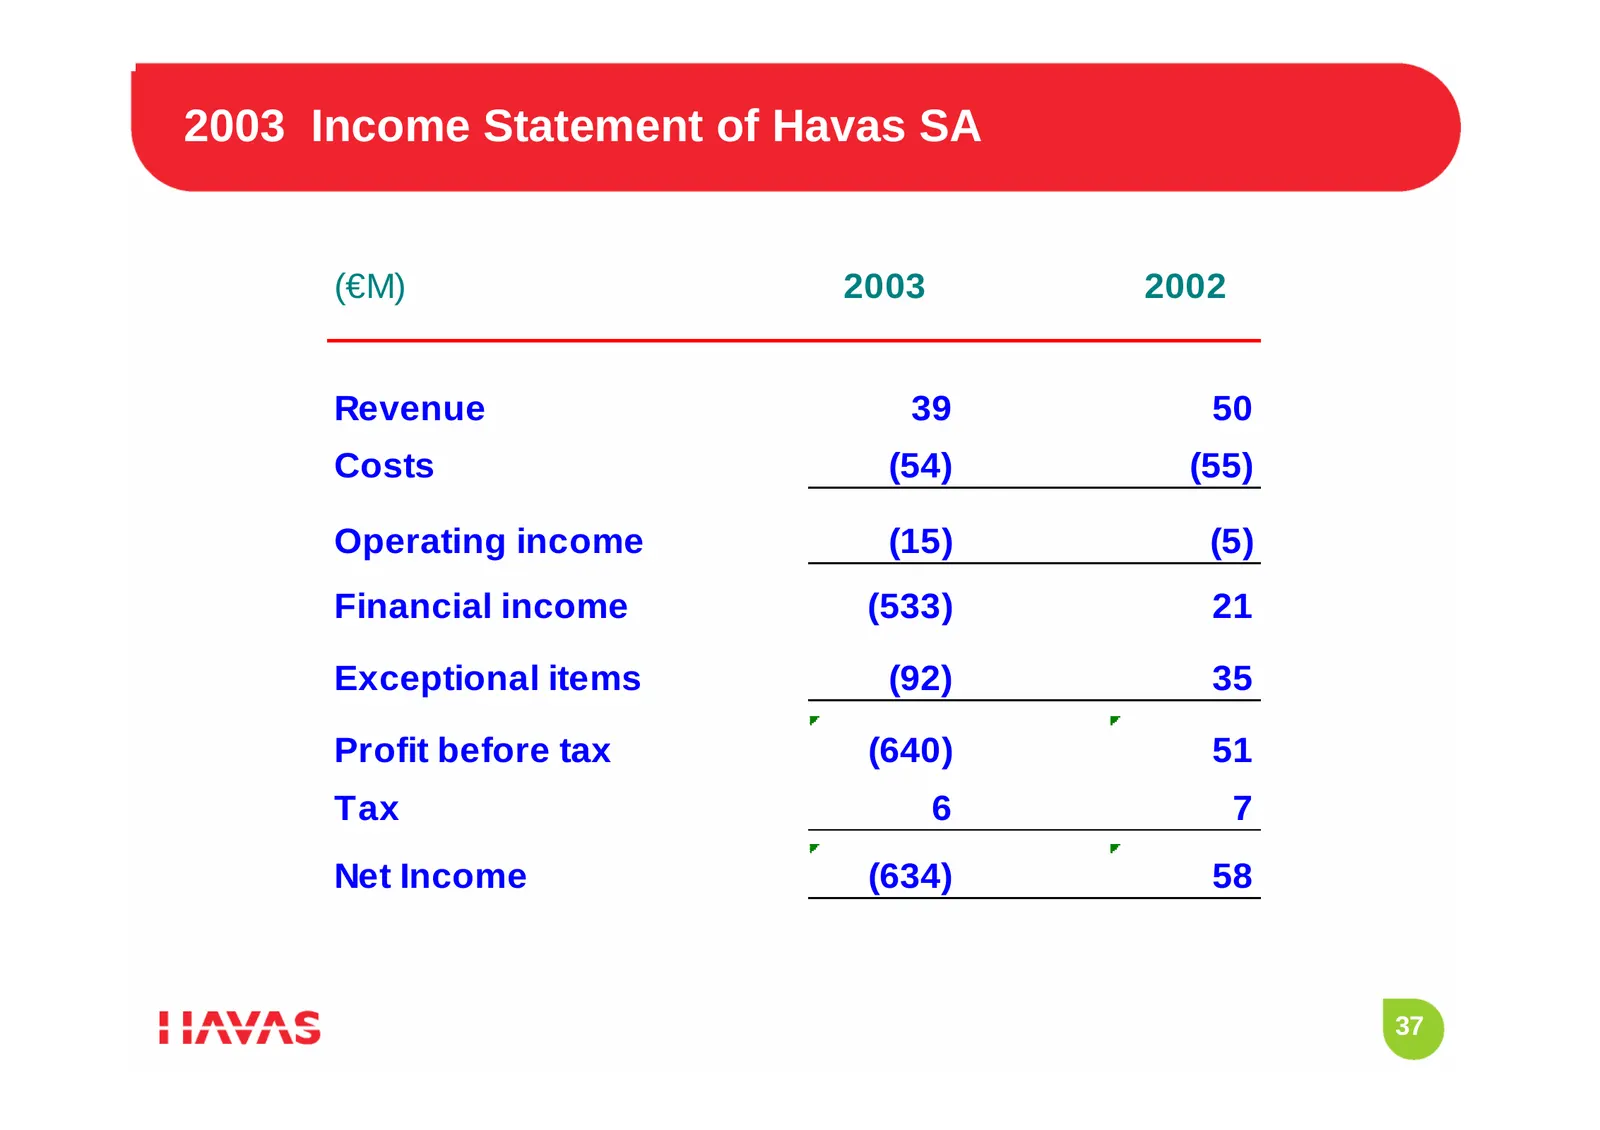
Slide 37: 2003 Income Statement of Havas SA
2003 Income Statement of Havas SA (€M) 2003 2002 Revenue 39 50 Costs (54) (55) Operating income (15) (5) Financial income (533) 21 Exceptional items (92) 35 Profit before tax (640) 51 Tax 6 7 Net Income (634) 58 37
Slide 38: Dividend Policy
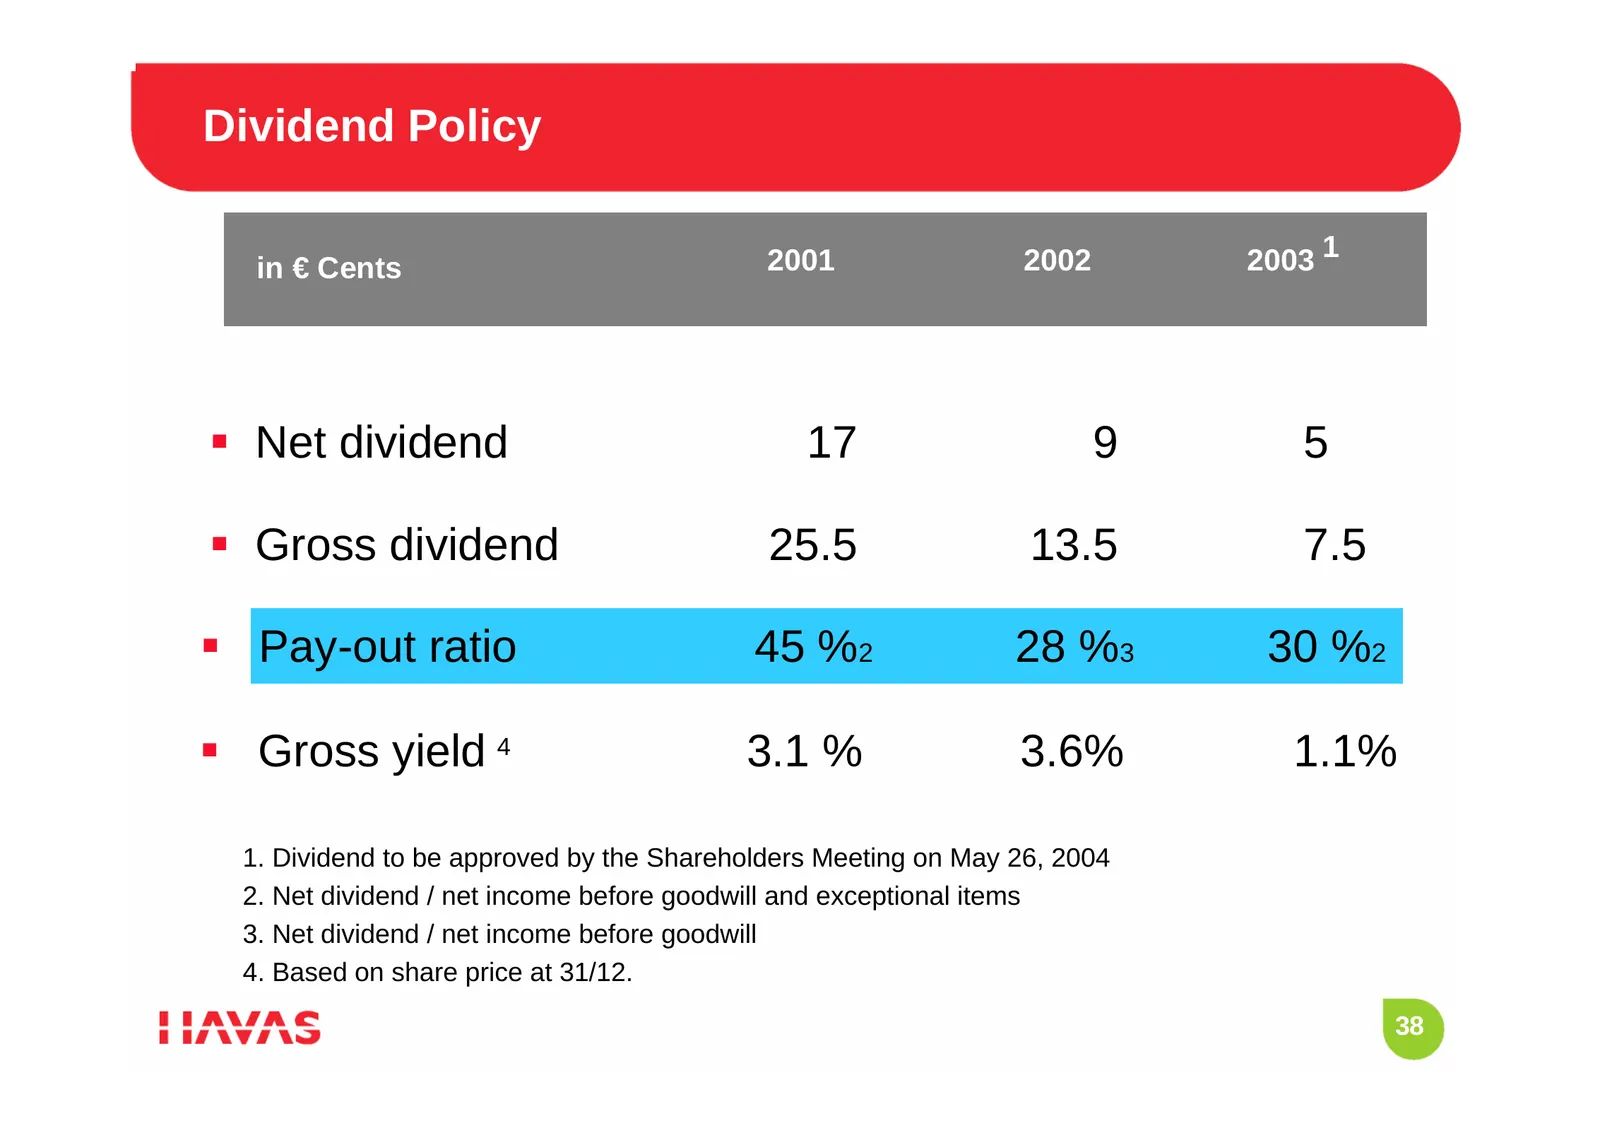
Dividend Policy in € Cents 2001 2002 2003 1 Net dividend 17 9 5 Gross dividend 25.5 13.5 7.5 Pay-out ratio 45 %2 28 %3 30 %2 Gross yield 4 3.1 % 3.6% 1.1% 1. Dividend to be approved by the Shareholders Meeting on May 26, 2004 2. Net dividend / net income before goodwill and exceptional items
Slide 39: Relative Share Price Performance in 2003 to Today
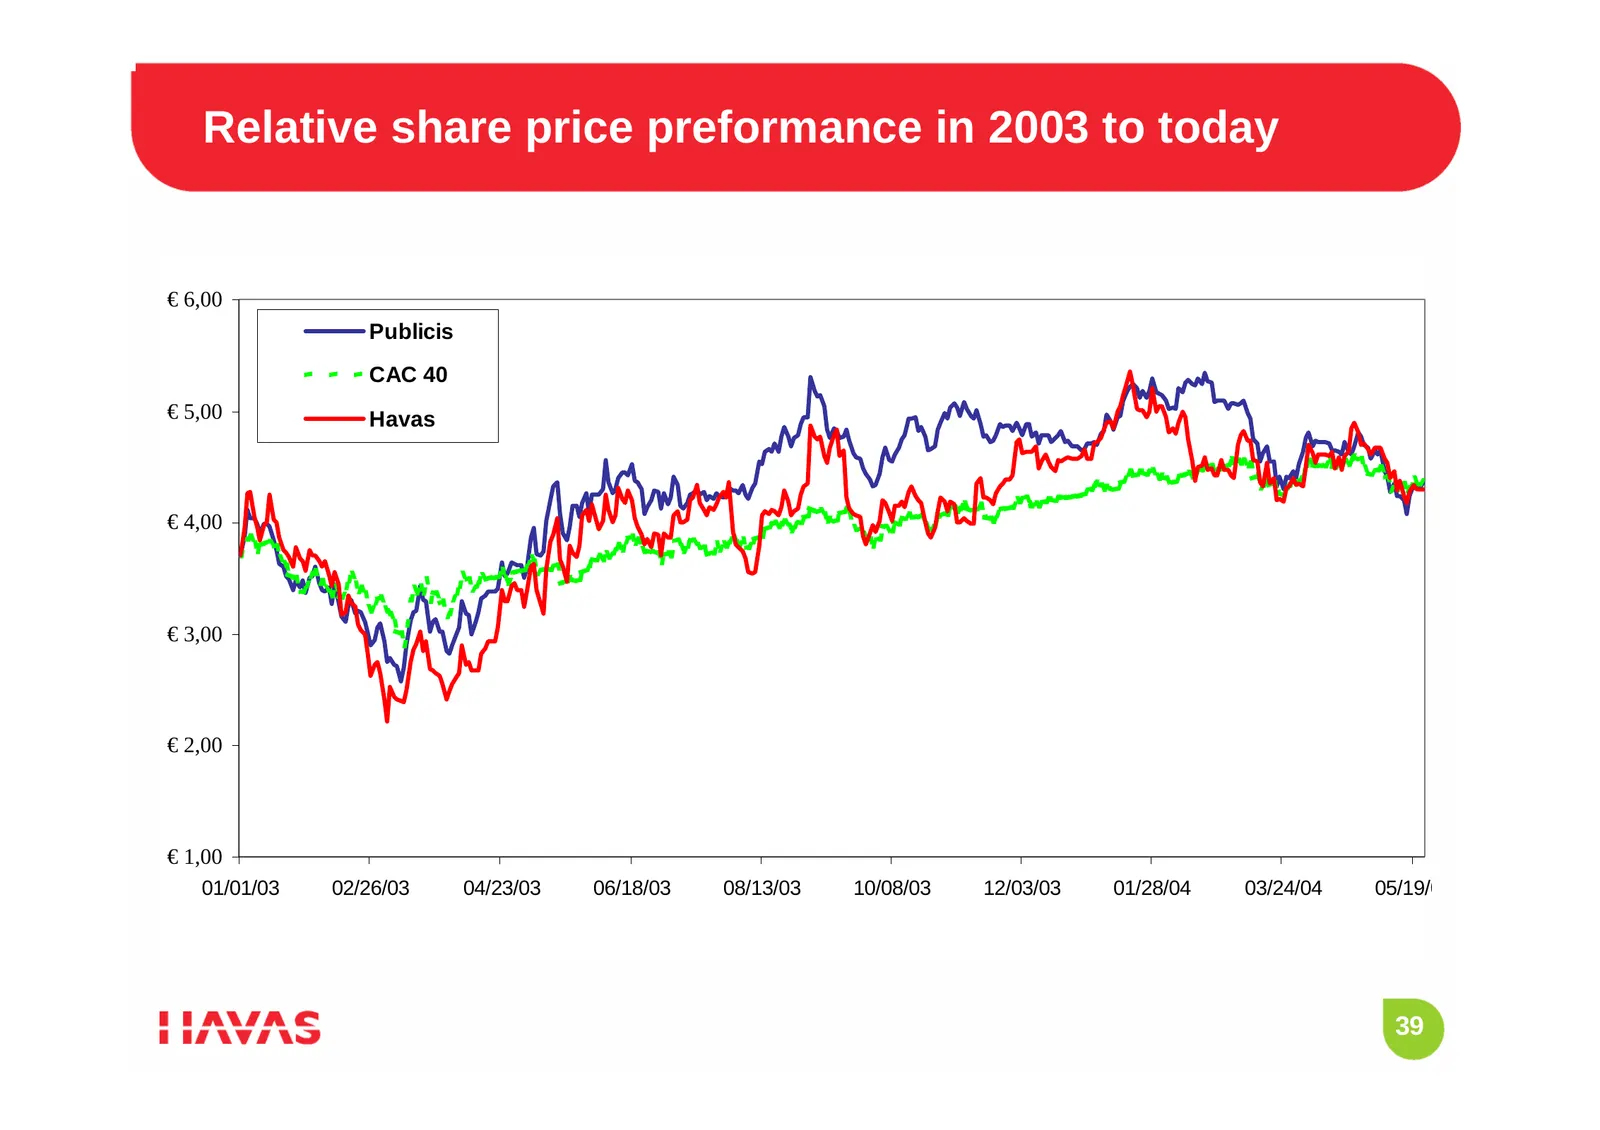
Relative share price preformance in 2003 to today € 6,00 Publicis CAC 40 € 5,00 Havas € 4,00 € 3,00 € 2,00 € 1,00 01/01/03 02/26/03 04/23/03 06/18/03 08/13/03 10/08/03 12/03/03 01/28/04 03/24/04 05/19/0 39
Slide 40: Strategic Reorganization and Restructuring Plan
STRATEGIC REORGANIZATION AND RESTRUCTURING PLAN During Q4 2003 and beginning of 2004 40
Slide 41: Strategic Reorganization and Restructuring Plan
3) Strategic Reorganization and Restructuring Plan This restructuration has been tough and profound because we have reorganized, restructured and sold companies in order to move the Group forward this year. 41
Slide 42: Strategic Reorganization and Restructuring Plan
3) Strategic Reorganization and Restructuring Plan The strategic reorganization and the restructuring plan were necessary in order to: implement a new organization to strengthen Havas’ competitiveness and efficiency in 2004, in a sustainable manner, respond to new Client needs, significantly impro
Slide 43: Organization Based on Two Global Networks
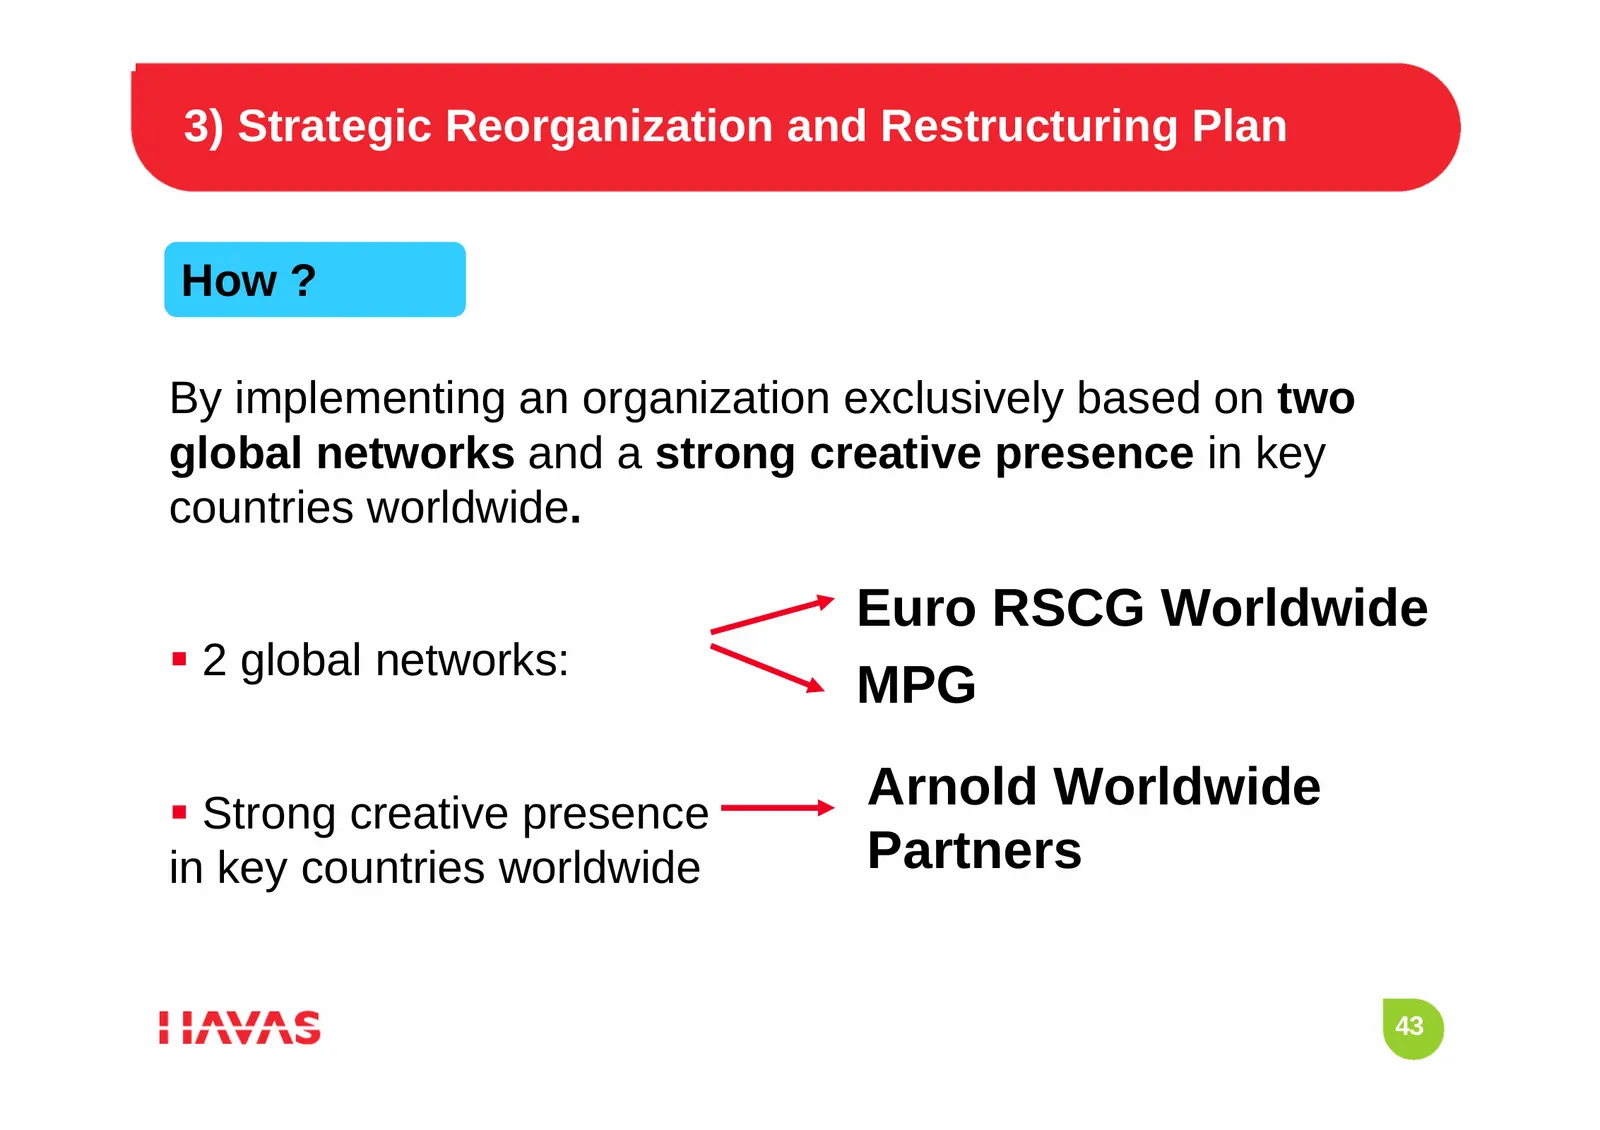
3) Strategic Reorganization and Restructuring Plan How ? By implementing an organization exclusively based on two global networks and a strong creative presence in key countries worldwide. Euro RSCG Worldwide 2 global networks: MPG Strong creative presence Arnold Worldwide in key countries world
Slide 44: Restructuring Companies That Penalized Havas
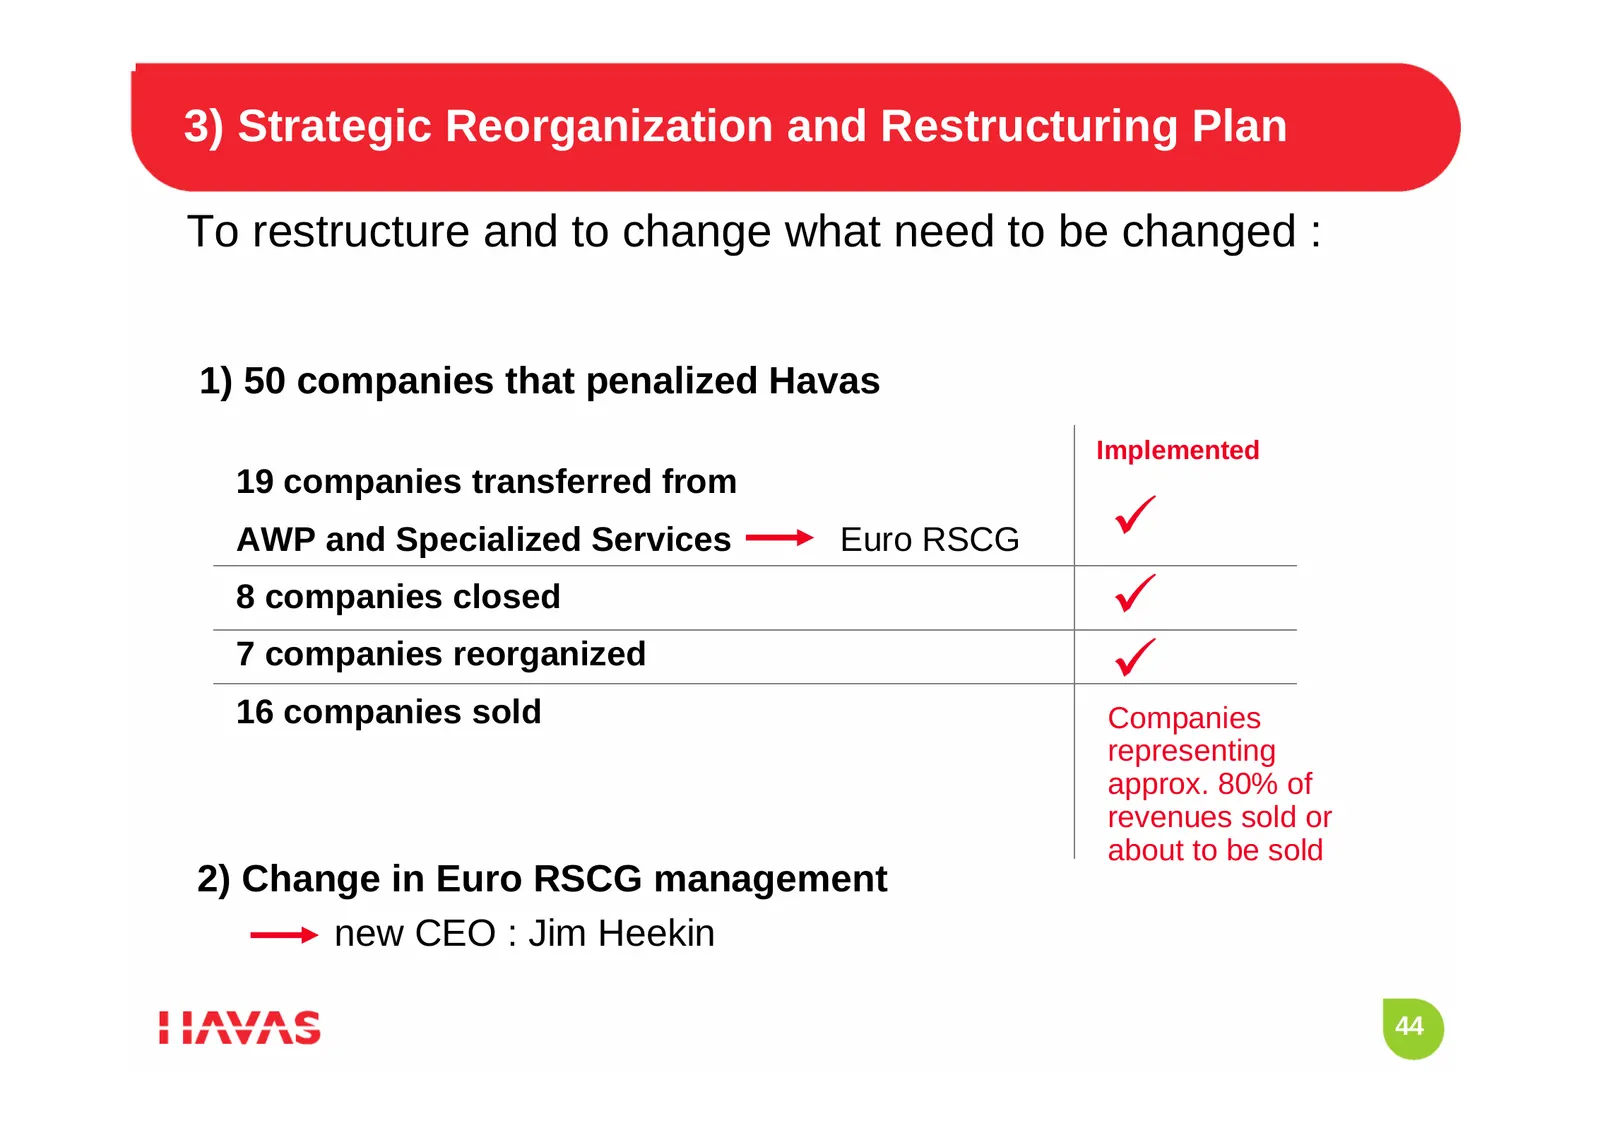
3) Strategic Reorganization and Restructuring Plan To restructure and to change what need to be changed : 1) 50 companies that penalized Havas Implemented 19 companies transferred from AWP and Specialized Services Euro RSCG 9 8 companies closed 9 7 companies reorganized 9 16 companies sold Companies
Slide 45: Improve Our Financial Performance
3) Strategic Reorganization and Restructuring Plan Improve our financial performance We have taken advantage of the restructuring to: Reduce our staff costs by €94 million Reduce our administrative costs including Real Estate: 70 000 m² made available for sub-letting Identify cost savings sign
Slide 46: Two Executive Committees
3) Strategic Reorganization and Restructuring Plan We have created two Executive Committees one in charge of strategy and finance one in charge of creativity 46
Slide 47: Executive Committee for Strategy and Finance
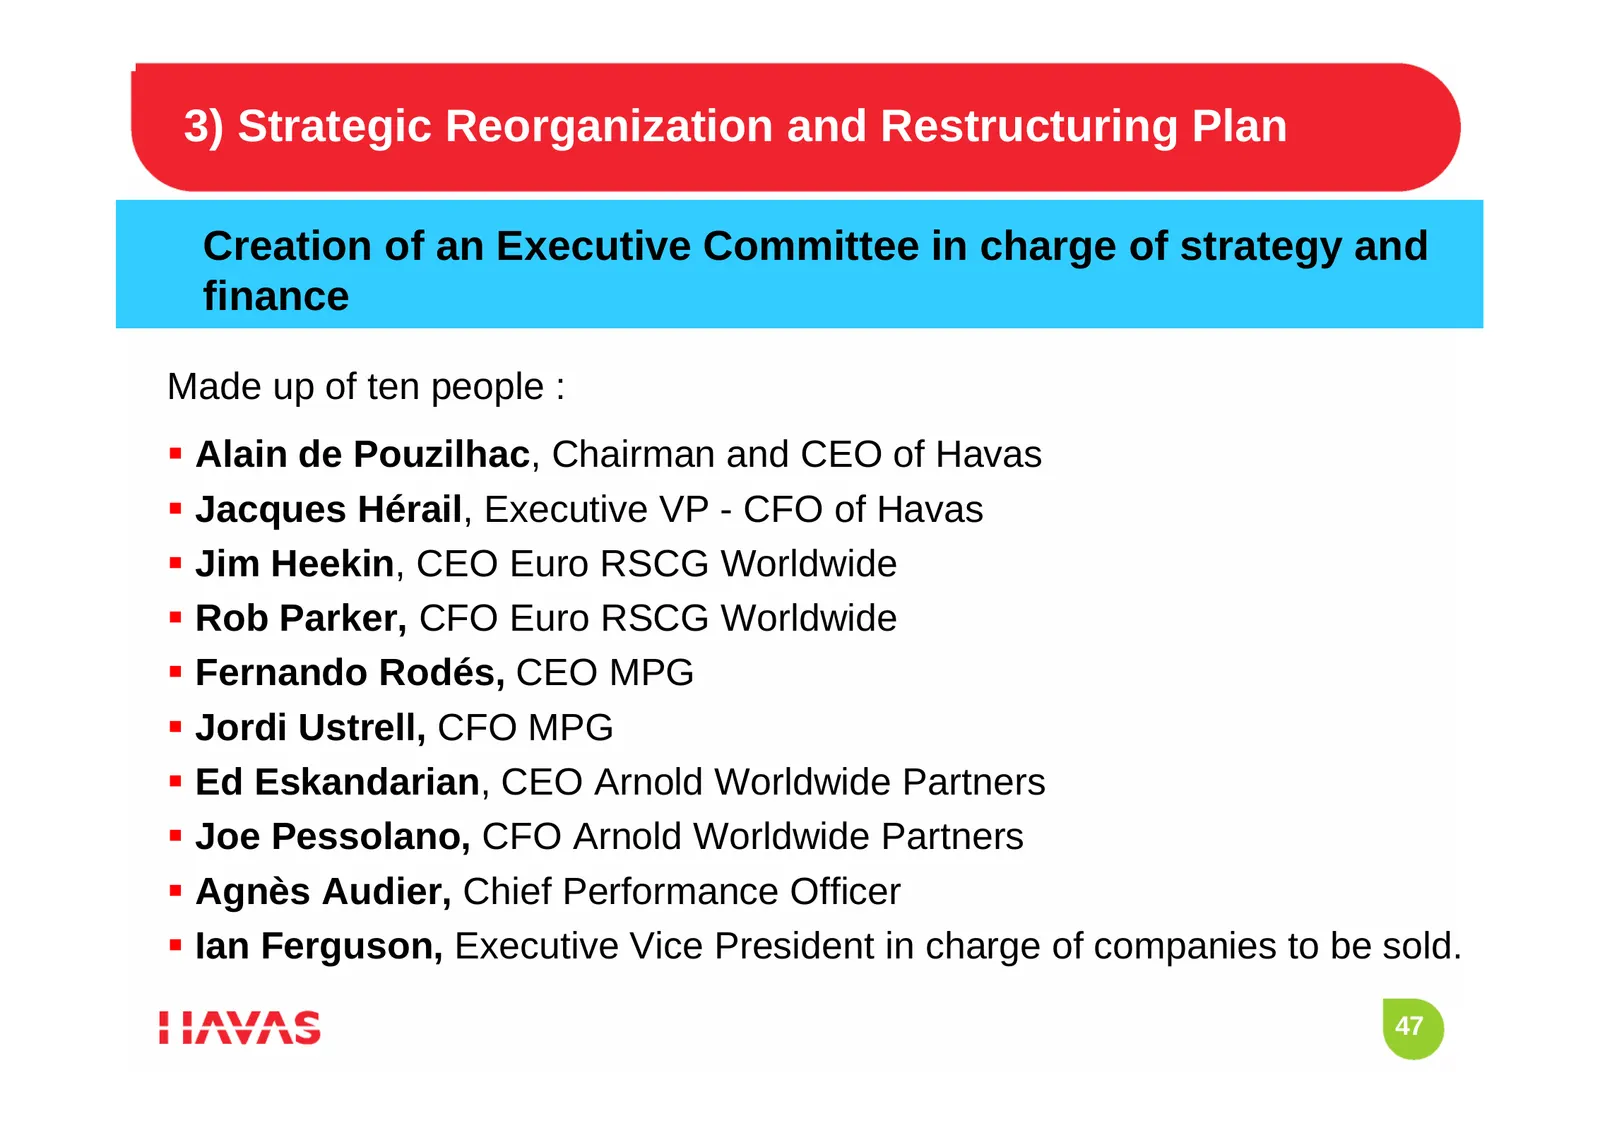
3) Strategic Reorganization and Restructuring Plan Creation of an Executive Committee in charge of strategy and finance Made up of ten people : Alain de Pouzilhac, Chairman and CEO of Havas Jacques Hérail, Executive VP - CFO of Havas Jim Heekin, CEO Euro RSCG Worldwide Rob Parker, CFO Euro R
Slide 48: Creative Executive Committee
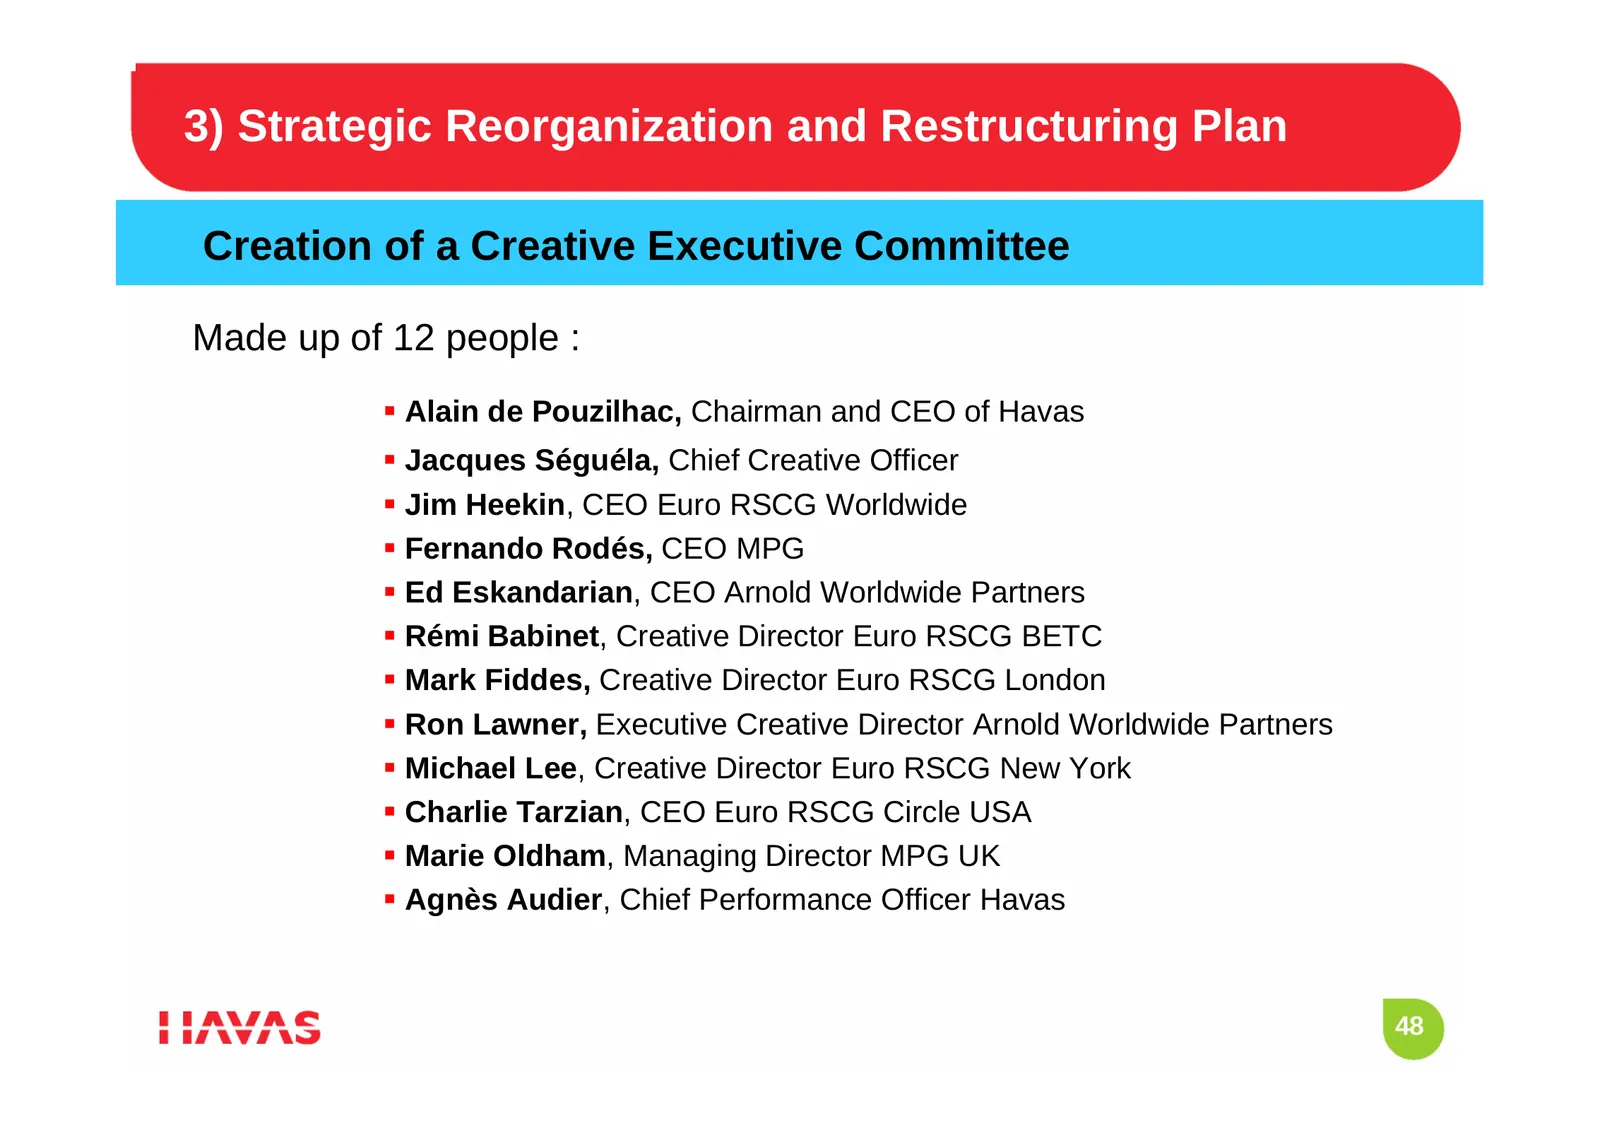
3) Strategic Reorganization and Restructuring Plan Creation of a Creative Executive Committee Made up of 12 people : Alain de Pouzilhac, Chairman and CEO of Havas Jacques Séguéla, Chief Creative Officer Jim Heekin, CEO Euro RSCG Worldwide Fernando Rodés, CEO MPG Ed Eskandarian, CEO Arnold
Slide 49: New Business
NEW BUSINESS During the strategic reorganization / restructuring, we have won several new clients 49
Slide 50: New Business: Global & Pan Regional Level
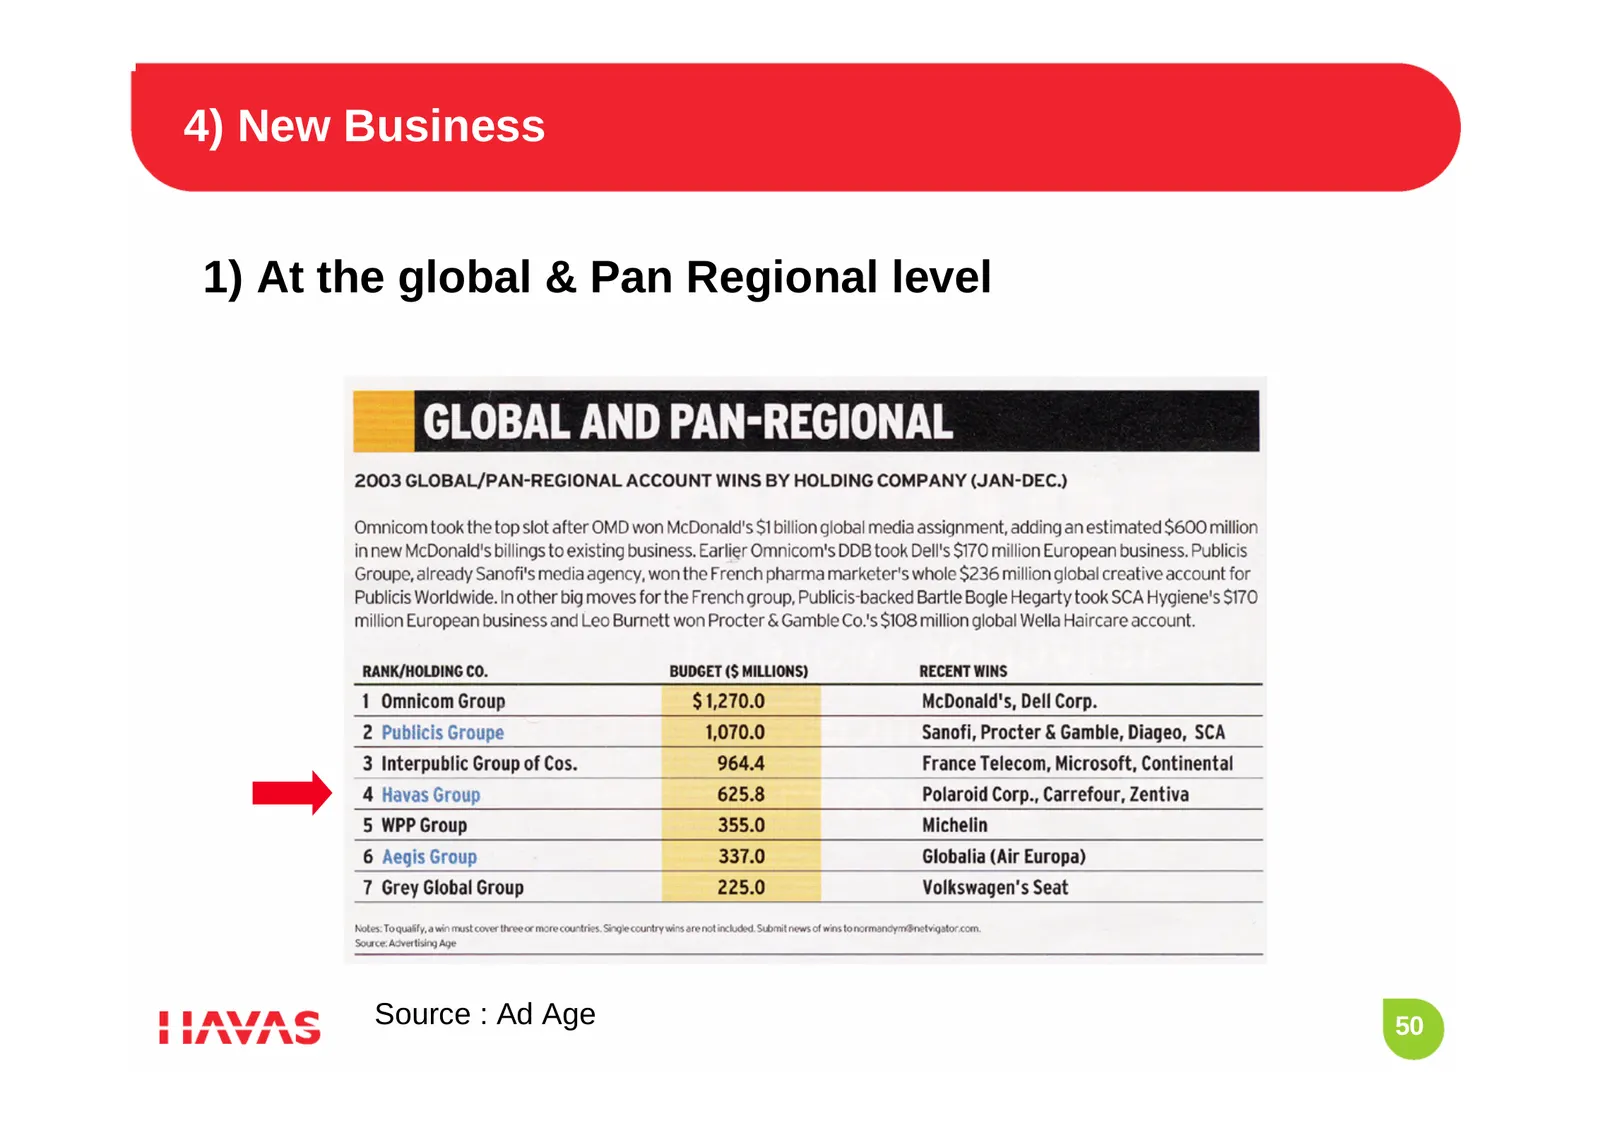
4) New Business 1) At the global & Pan Regional level Source : Ad Age 50
Slide 51: Net New Business Change 2003
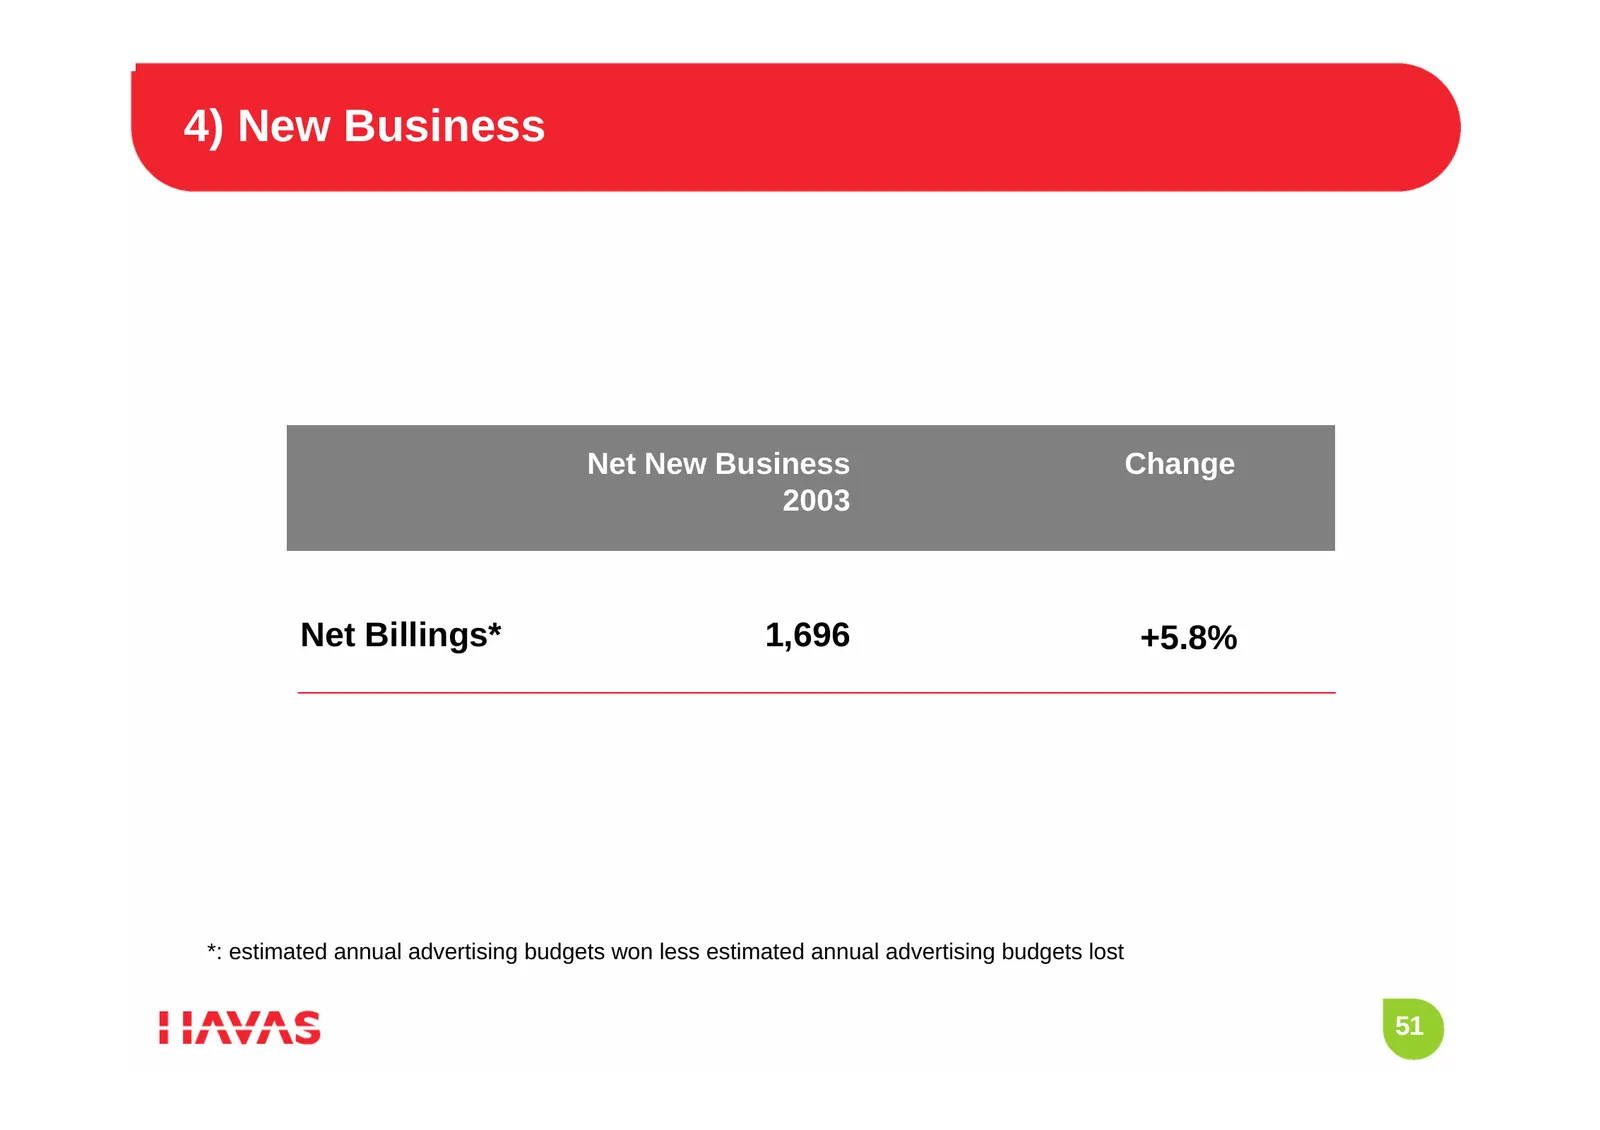
4) New Business Net New Business Change 2003 Net Billings* 1,696 +5.8% *: estimated annual advertising budgets won less estimated annual advertising budgets lost 51
Slide 52: New Business Major Wins
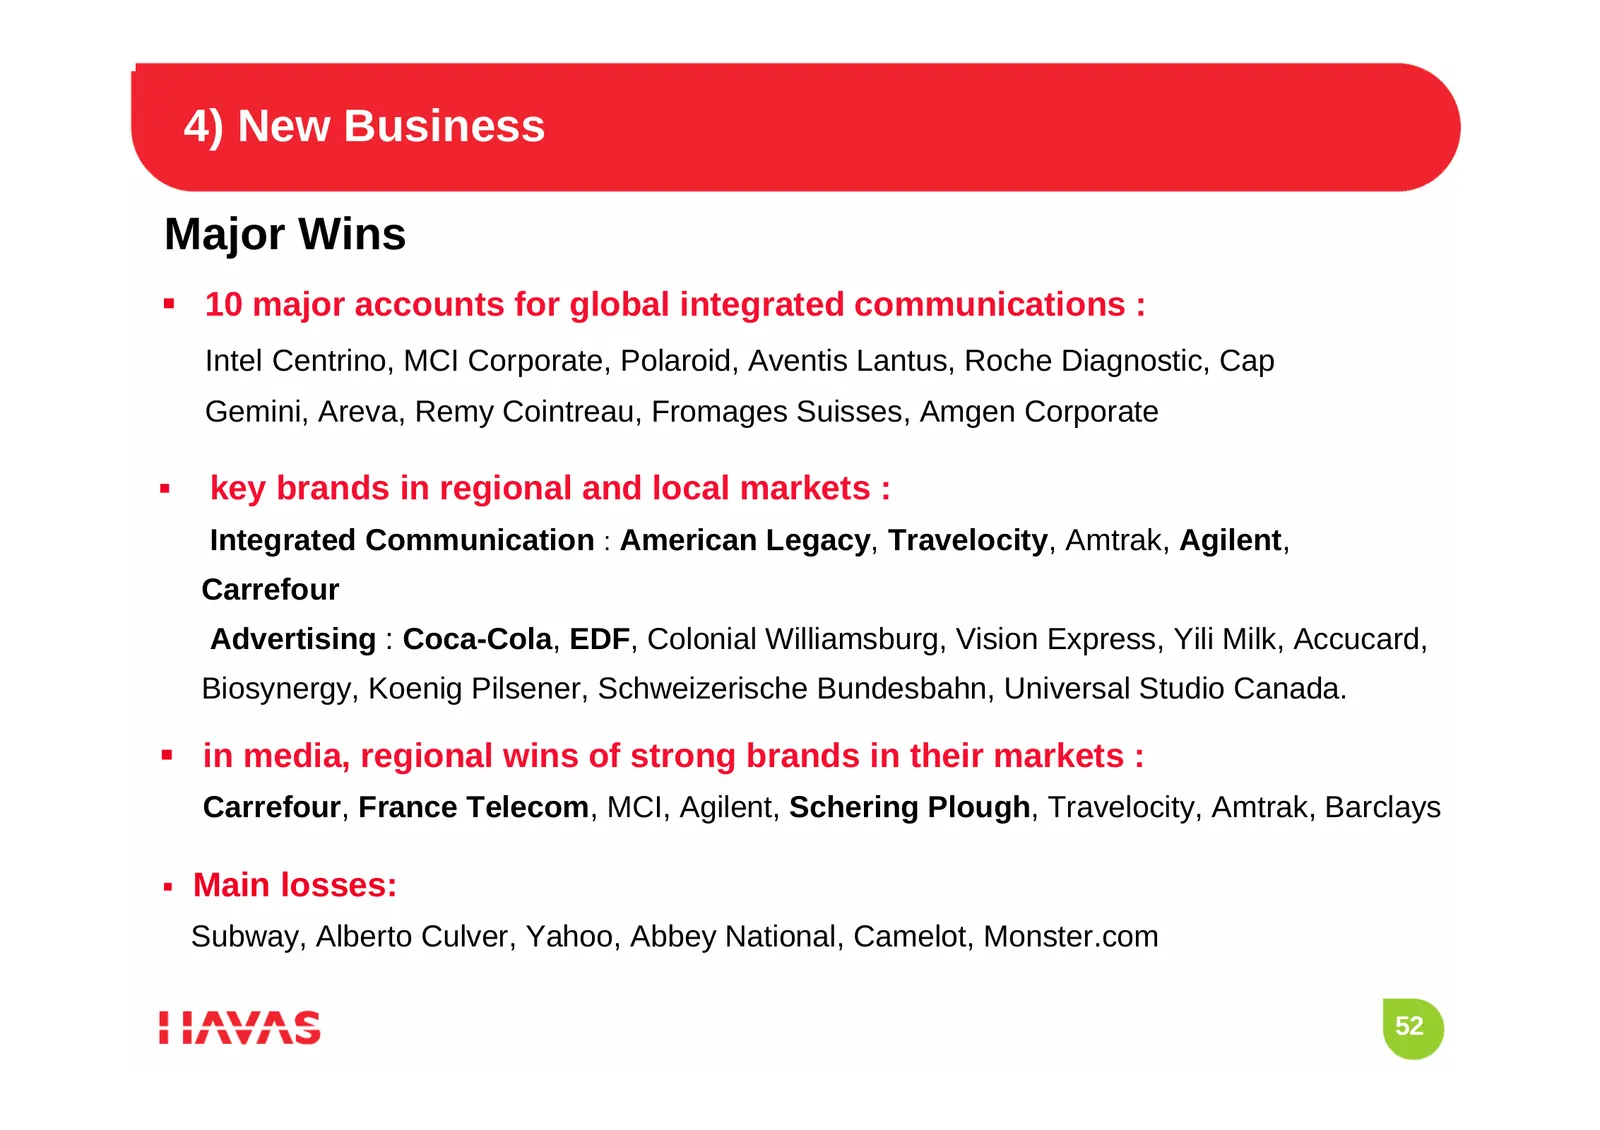
4) New Business Major Wins 10 major accounts for global integrated communications : Intel Centrino, MCI Corporate, Polaroid, Aventis Lantus, Roche Diagnostic, Cap Gemini, Areva, Remy Cointreau, Fromages Suisses, Amgen Corporate key brands in regional and local markets : Integrated Communication
Slide 53: Development of Existing Clients
During the strategic reogarnization / restructuring, we have developed our existing clients DEVELOPMENT OF EXISTING CLIENTS 53
Slide 54: Our Major Clients
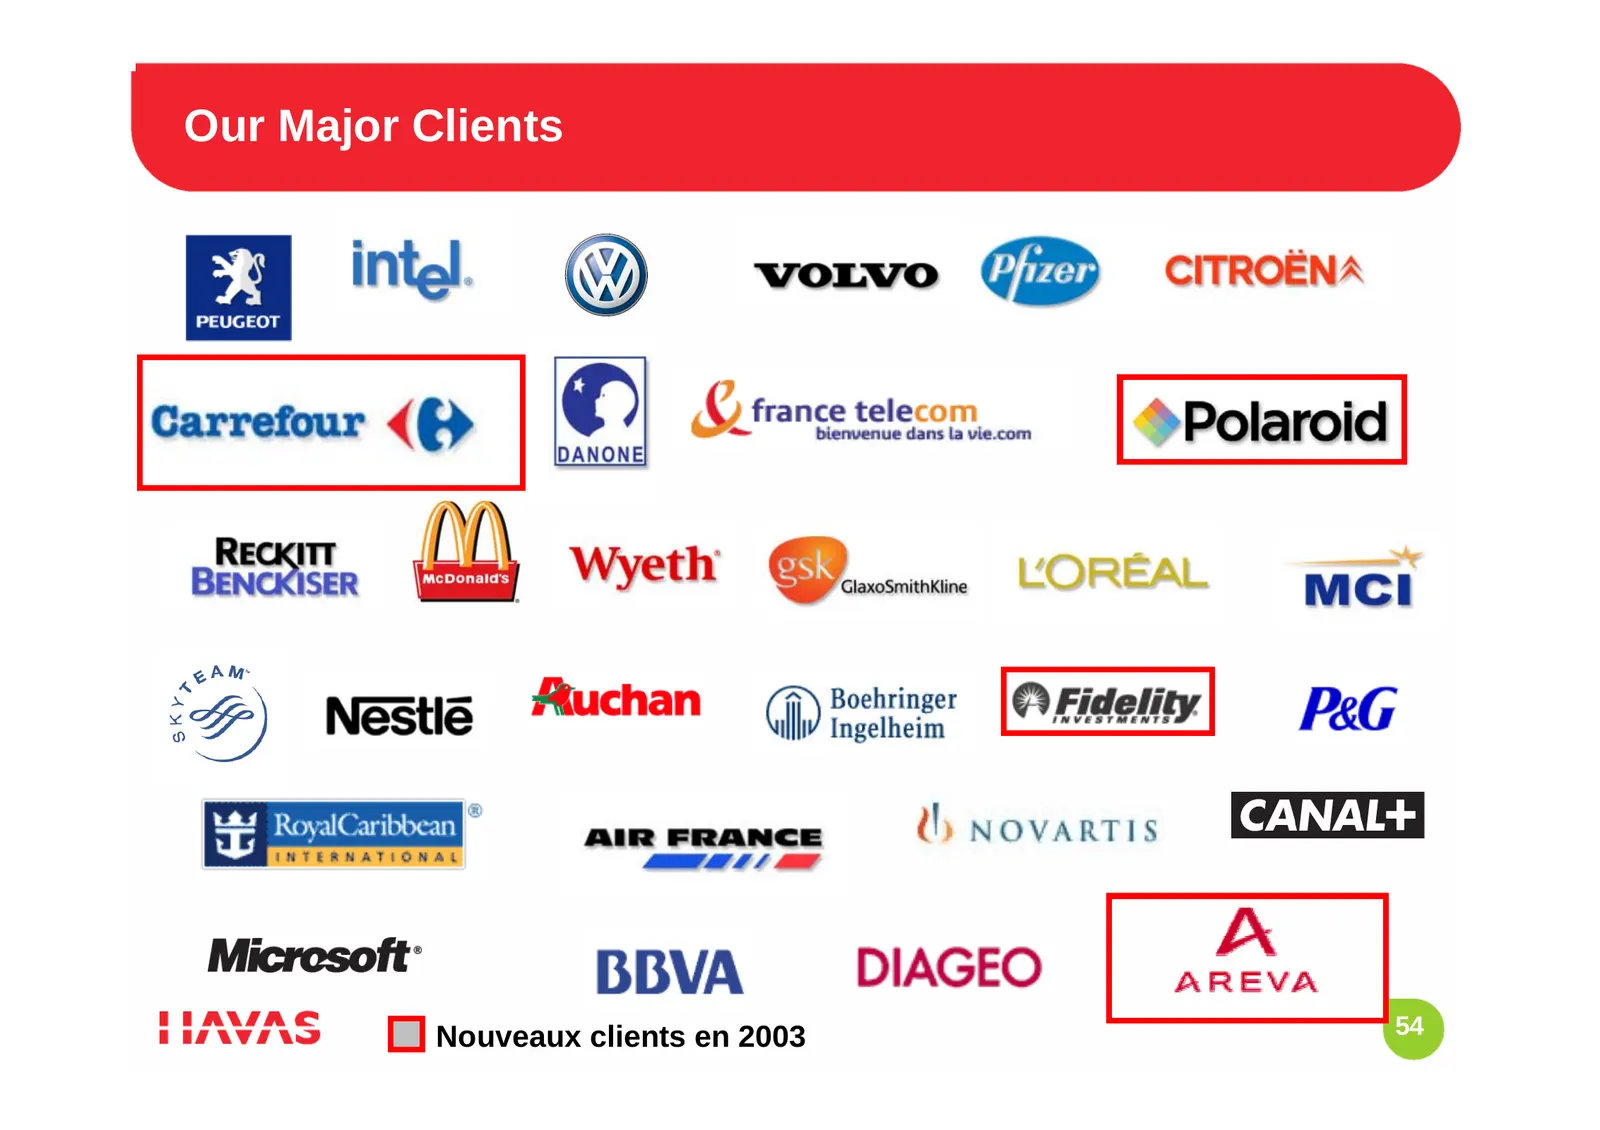
Our Major Clients Nouveaux clients en 2003 54
Slide 55: Development of Existing Clients
5) Development of existing clients Significant development of existing Clients geographically and in different disciplines France Télécom (18), Peugeot (15), Reckitt Benckiser (10), Danone (7), Diageo (7), L’Oréal (7), Air France (6), Nestlé (6), Alcatel (5), Cadbury (5), Intel (5) 55
Slide 56: Client Concentration
5) Development of existing clients Leading client represents ~ 3% of revenue Top 25 clients represent ~ 30% of revenue The leading sector is Automotive ~ 15% of revenue 56
Slide 57: Talents
During the strategic reorganization / restructuring, we have developed our human capital in retaining our existing talents and attracting new ones TALENTS 57
Slide 58: Talents
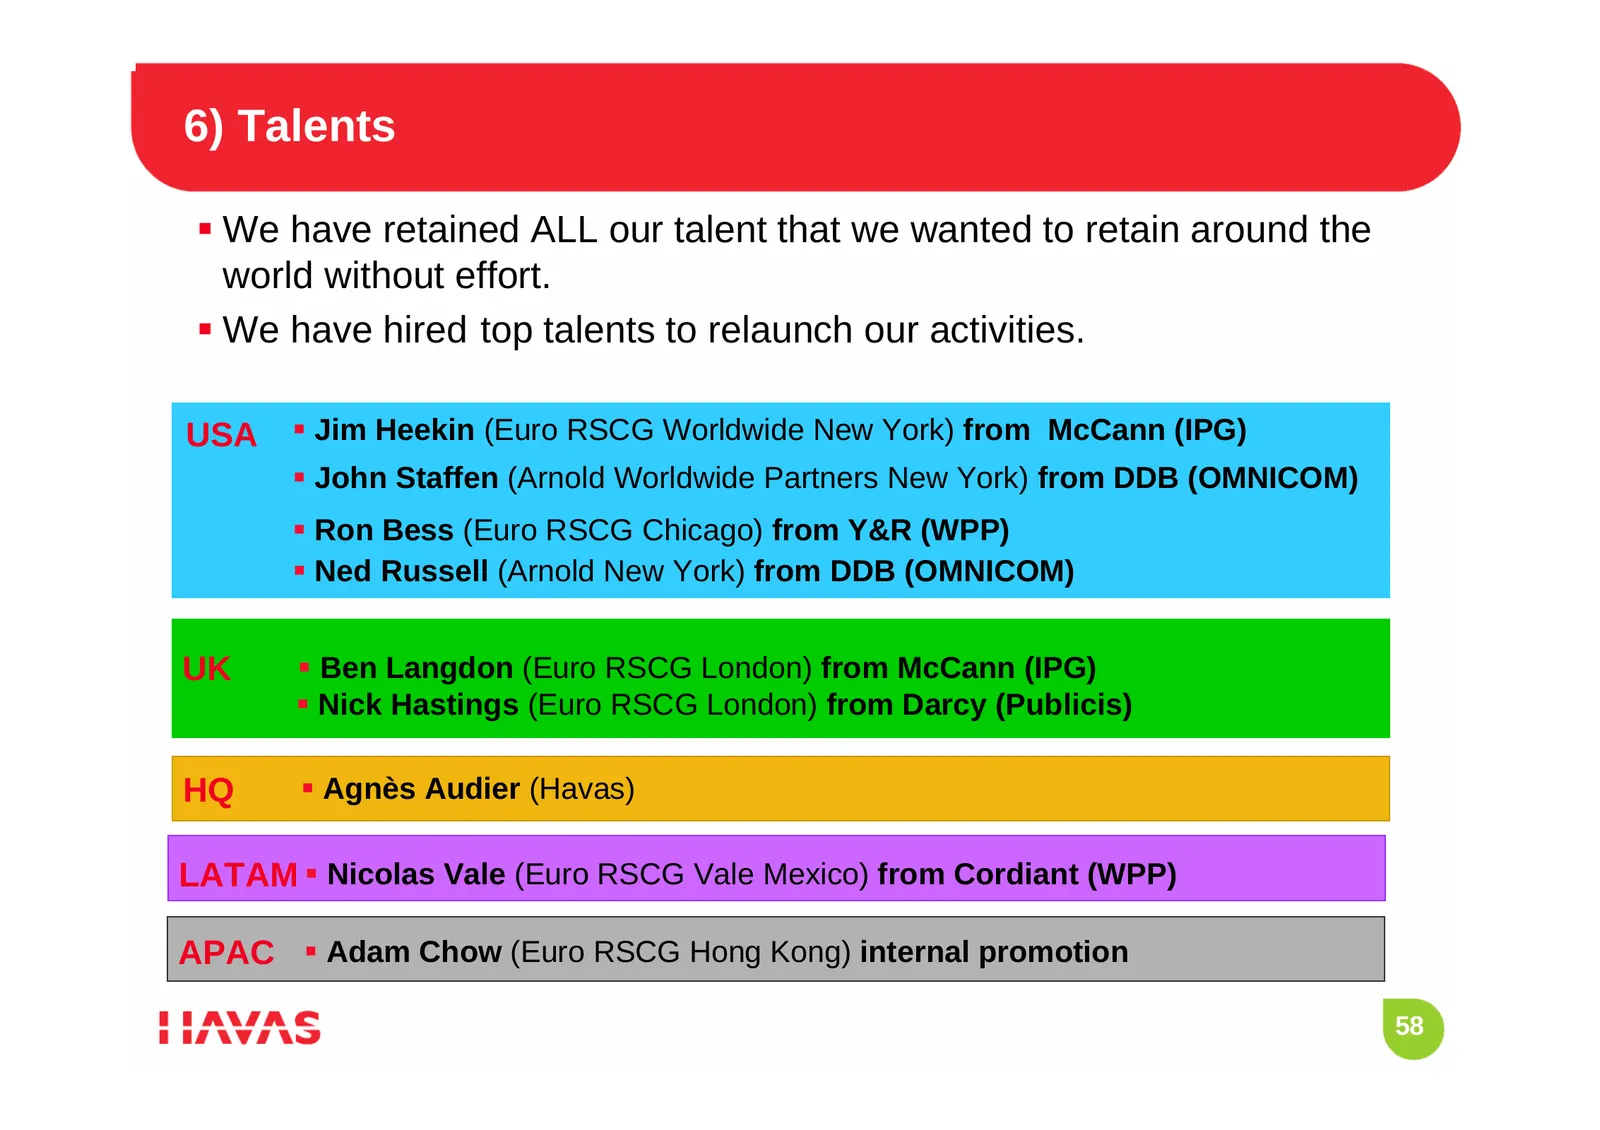
6) Talents We have retained ALL our talent that we wanted to retain around the world without effort. We have hired top talents to relaunch our activities. USA Jim Heekin (Euro RSCG Worldwide New York) from McCann (IPG) John Staffen (Arnold Worldwide Partners New York) from DDB (OMNICOM) Ro
Slide 59: Rescheduling of the Debt
During the strategic reogarnization / restructuring, we have rescheduled certain elements of our debt. RESCHEDULING OF THE DEBT 59
Slide 60: Rescheduling of the Debt
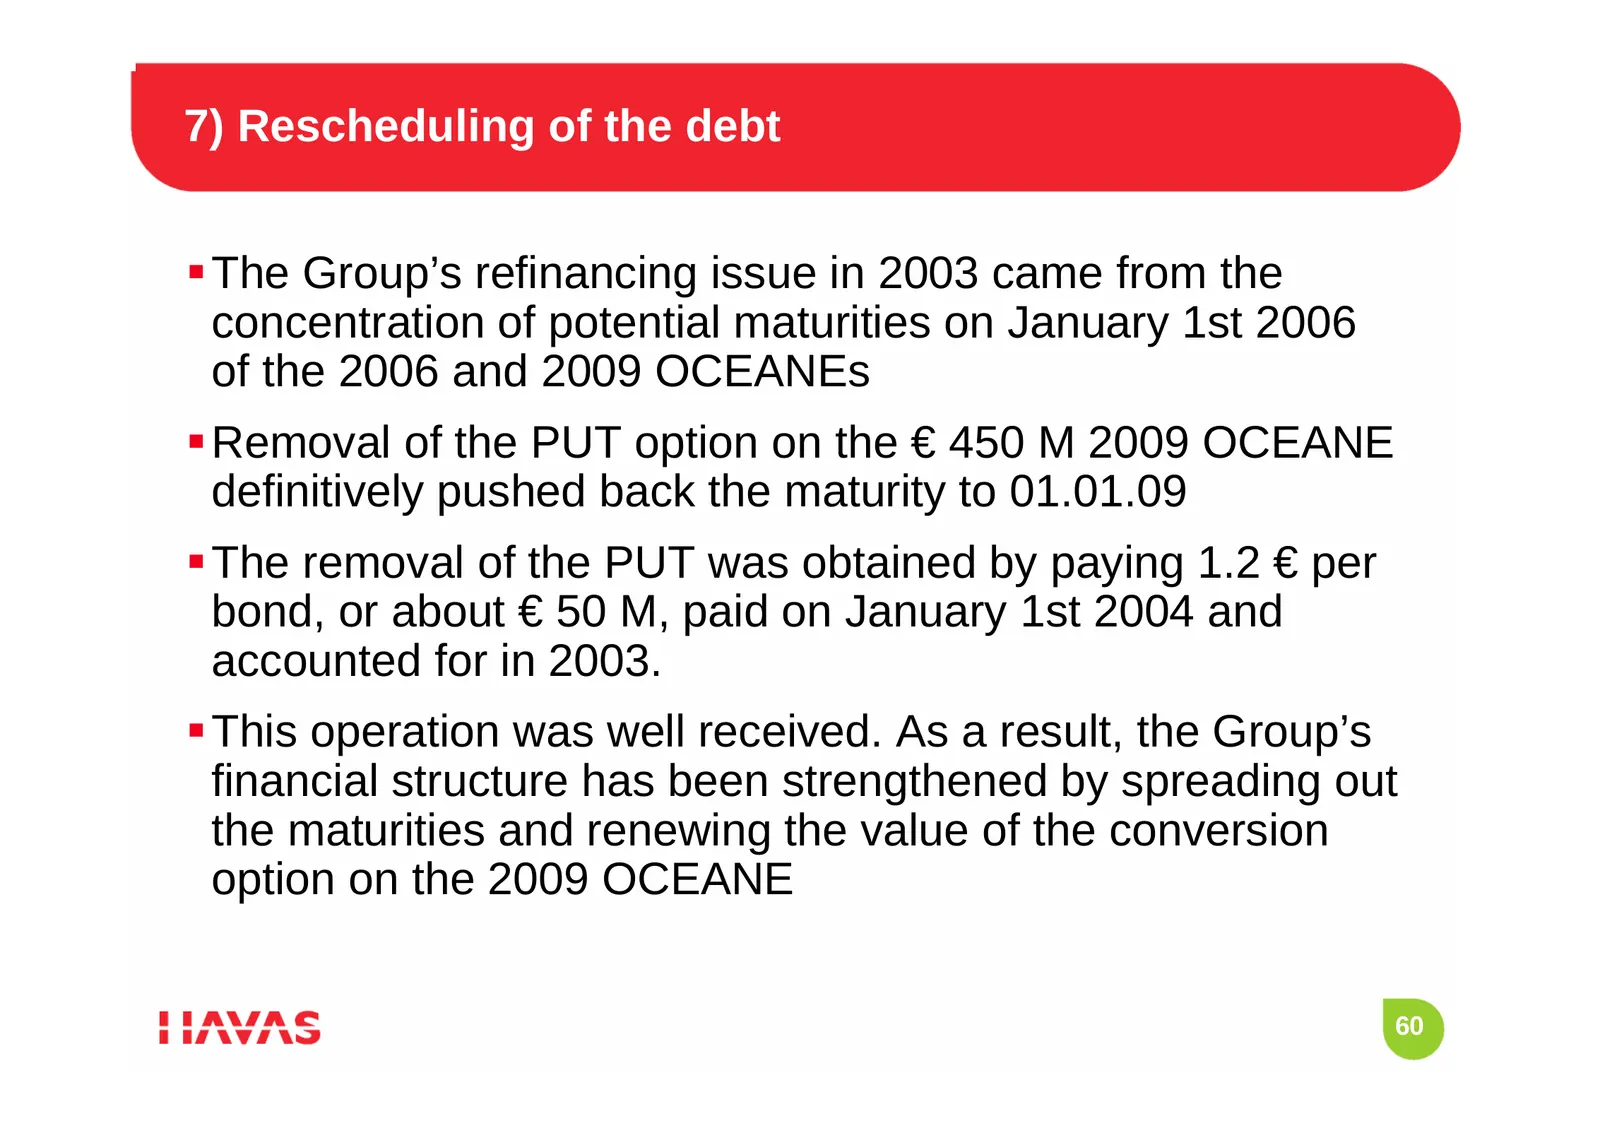
7) Rescheduling of the debt The Group’s refinancing issue in 2003 came from the concentration of potential maturities on January 1st 2006 of the 2006 and 2009 OCEANEs Removal of the PUT option on the € 450 M 2009 OCEANE definitively pushed back the maturity to 01.01.09 The removal of the PUT w

Slide 61: Creativity
Throughout 2003 and the strategic reorganization / restructuring we have realized the best creative year of our history CREATIVITY 61
Slide 62: Q1 2004: Reversal of Trend
Q1 2004 : REVERSAL OF TREND All the actions implemented have allowed us to reverse the trend since the beginning of 2004. 62
Slide 63: Reversal of Trend in the 1st Quarter 2004
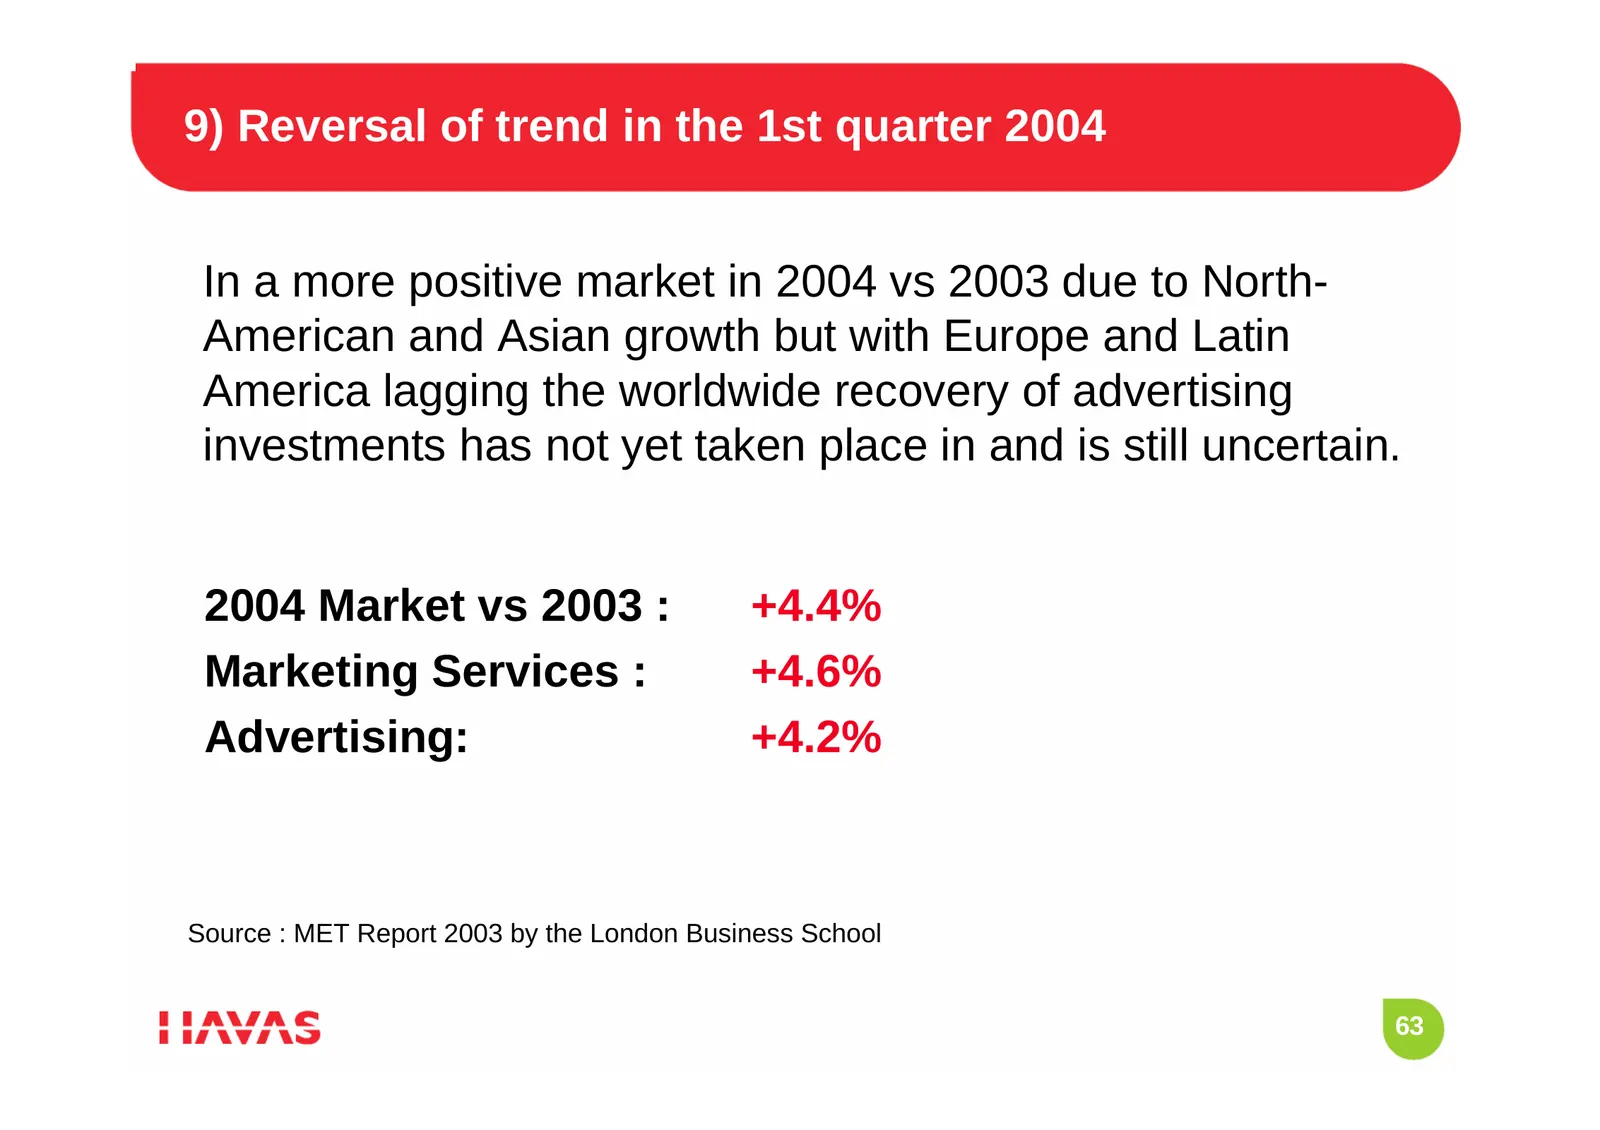
9) Reversal of trend in the 1st quarter 2004 In a more positive market in 2004 vs 2003 due to North- American and Asian growth but with Europe and Latin America lagging the worldwide recovery of advertising investments has not yet taken place in and is still uncertain. 2004 Market vs 2003 : +4.4% Ma
Slide 64: Havas Reversed the Trend in Q1 2004
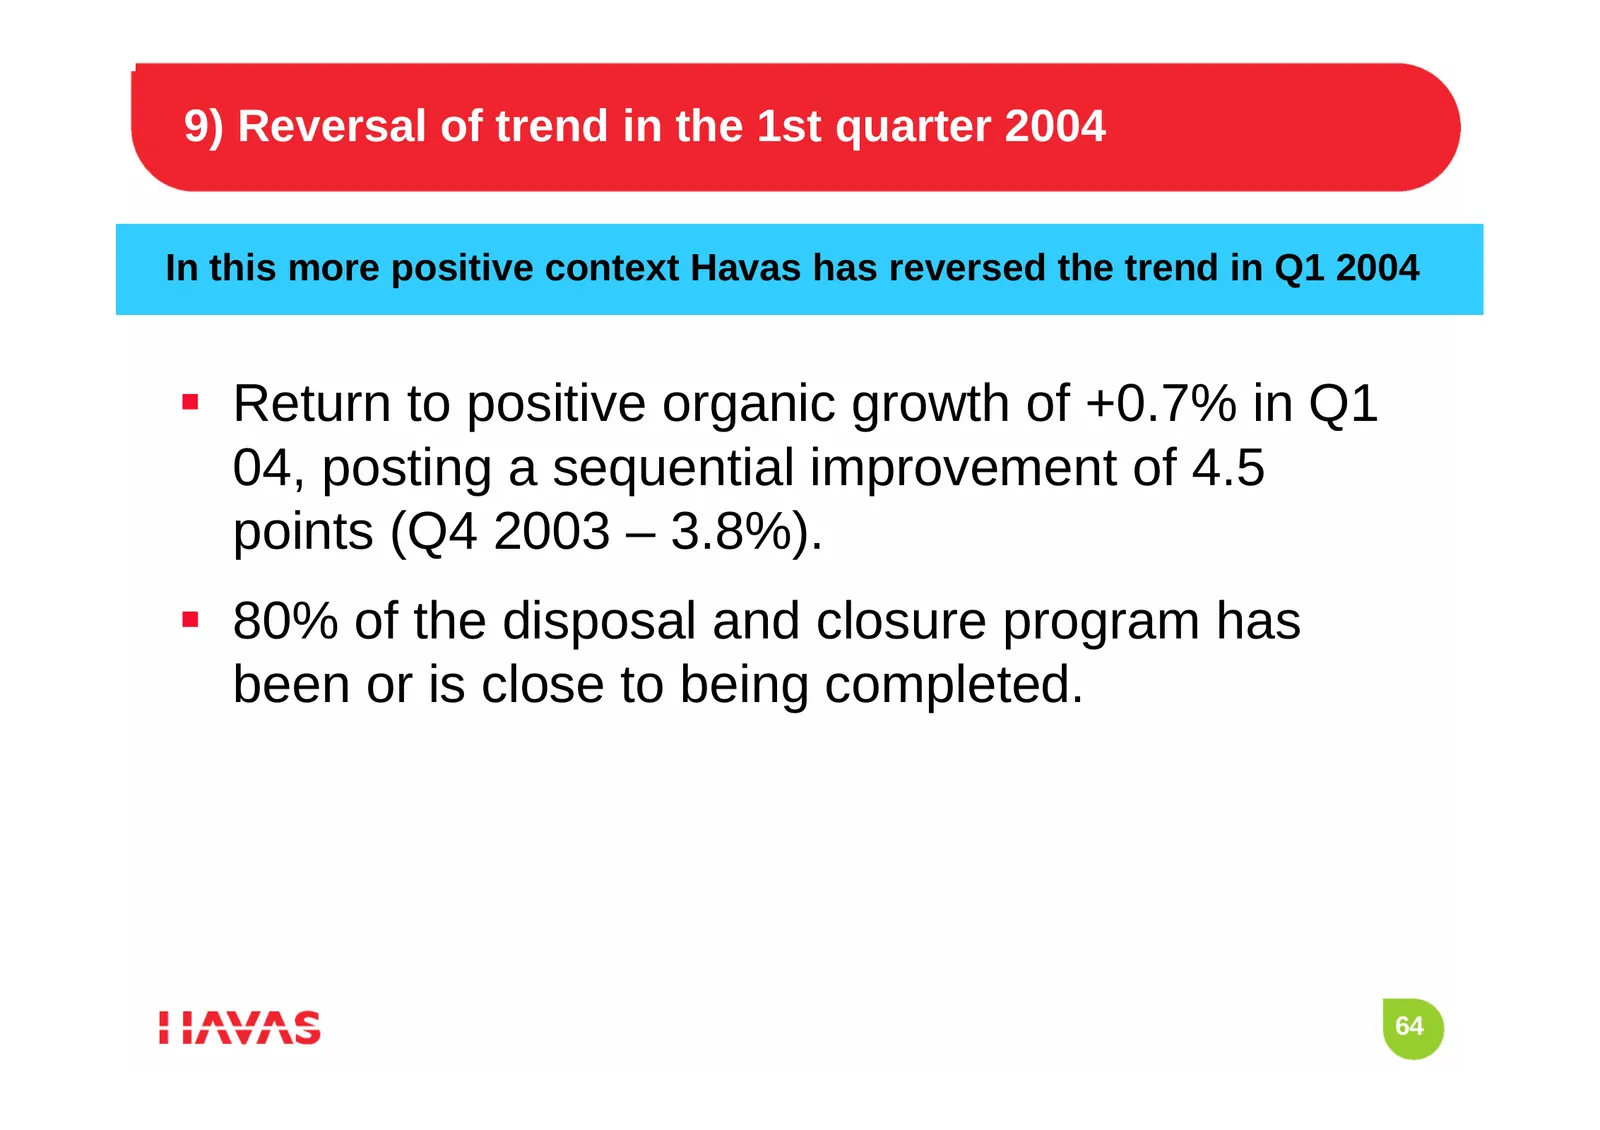
9) Reversal of trend in the 1st quarter 2004 In this more positive context Havas has reversed the trend in Q1 2004 Return to positive organic growth of +0.7% in Q1 04, posting a sequential improvement of 4.5 points (Q4 2003 – 3.8%). 80% of the disposal and closure program has been or is close to
Slide 65: Revenue Q1 2004
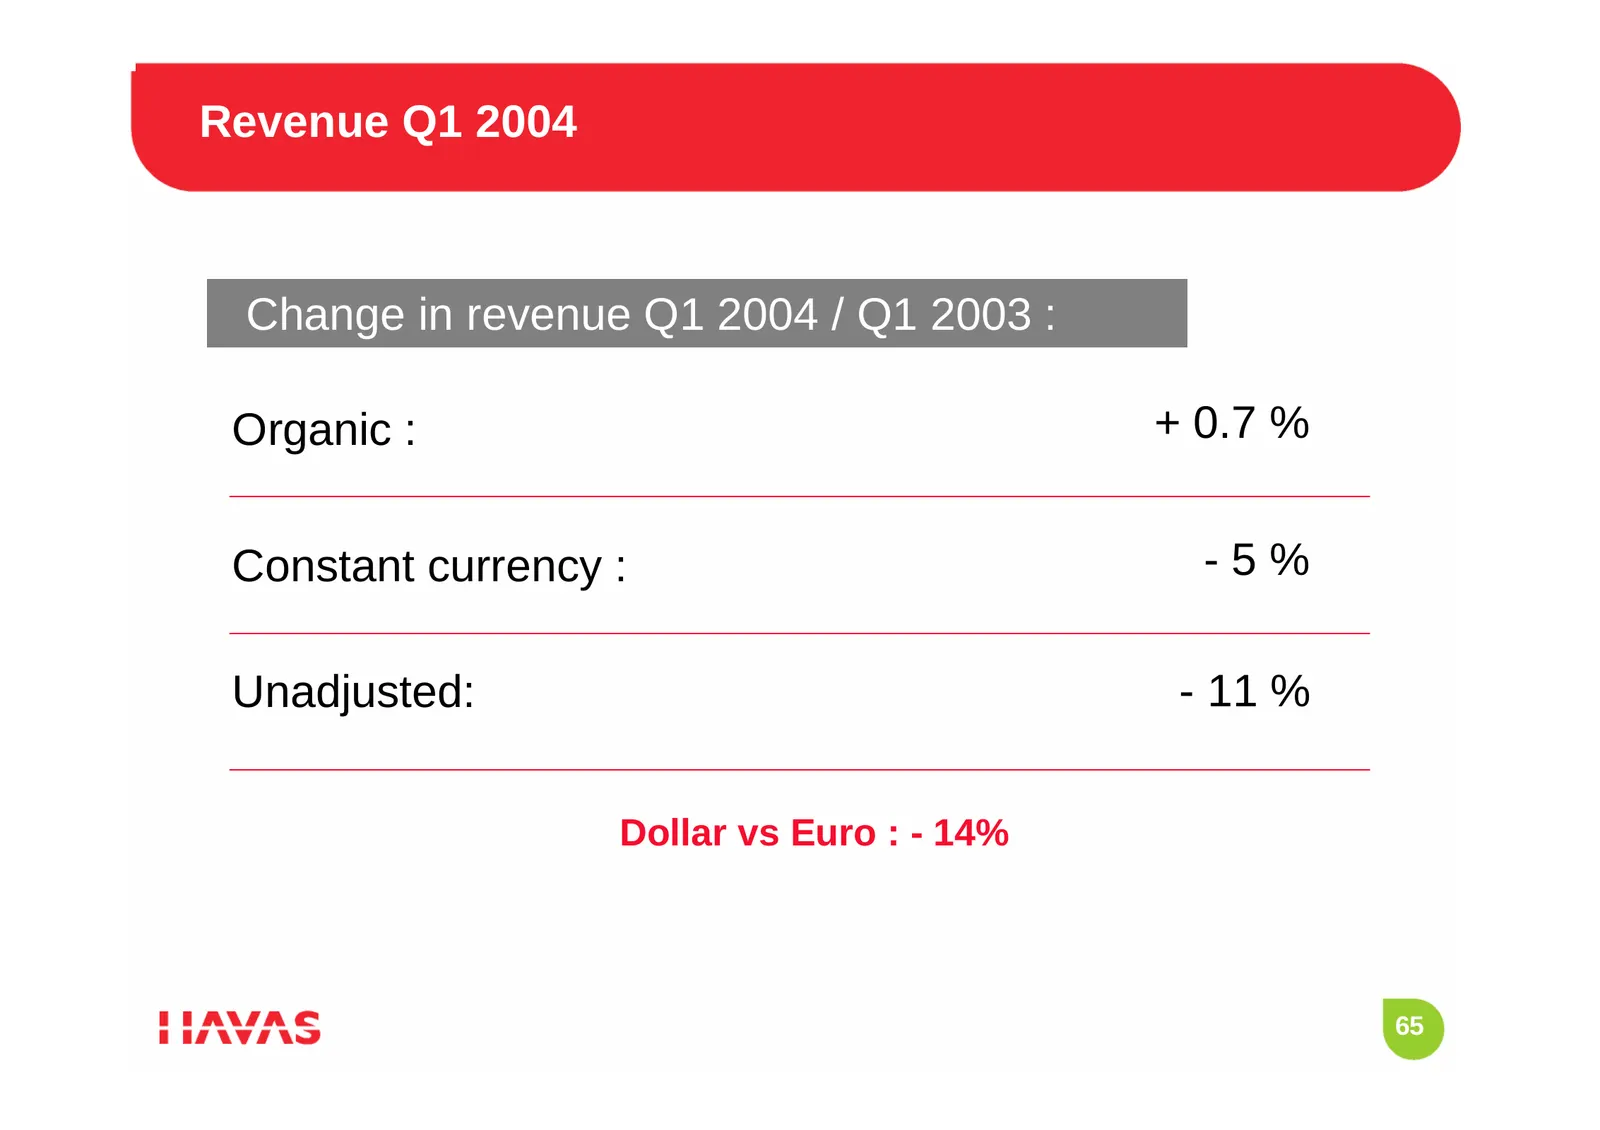
Revenue Q1 2004 Change in revenue Q1 2004 / Q1 2003 : Organic : + 0.7 % Constant currency : -5% Unadjusted: - 11 % Dollar vs Euro : - 14% 65
Slide 66: Q1 2004 Analysis
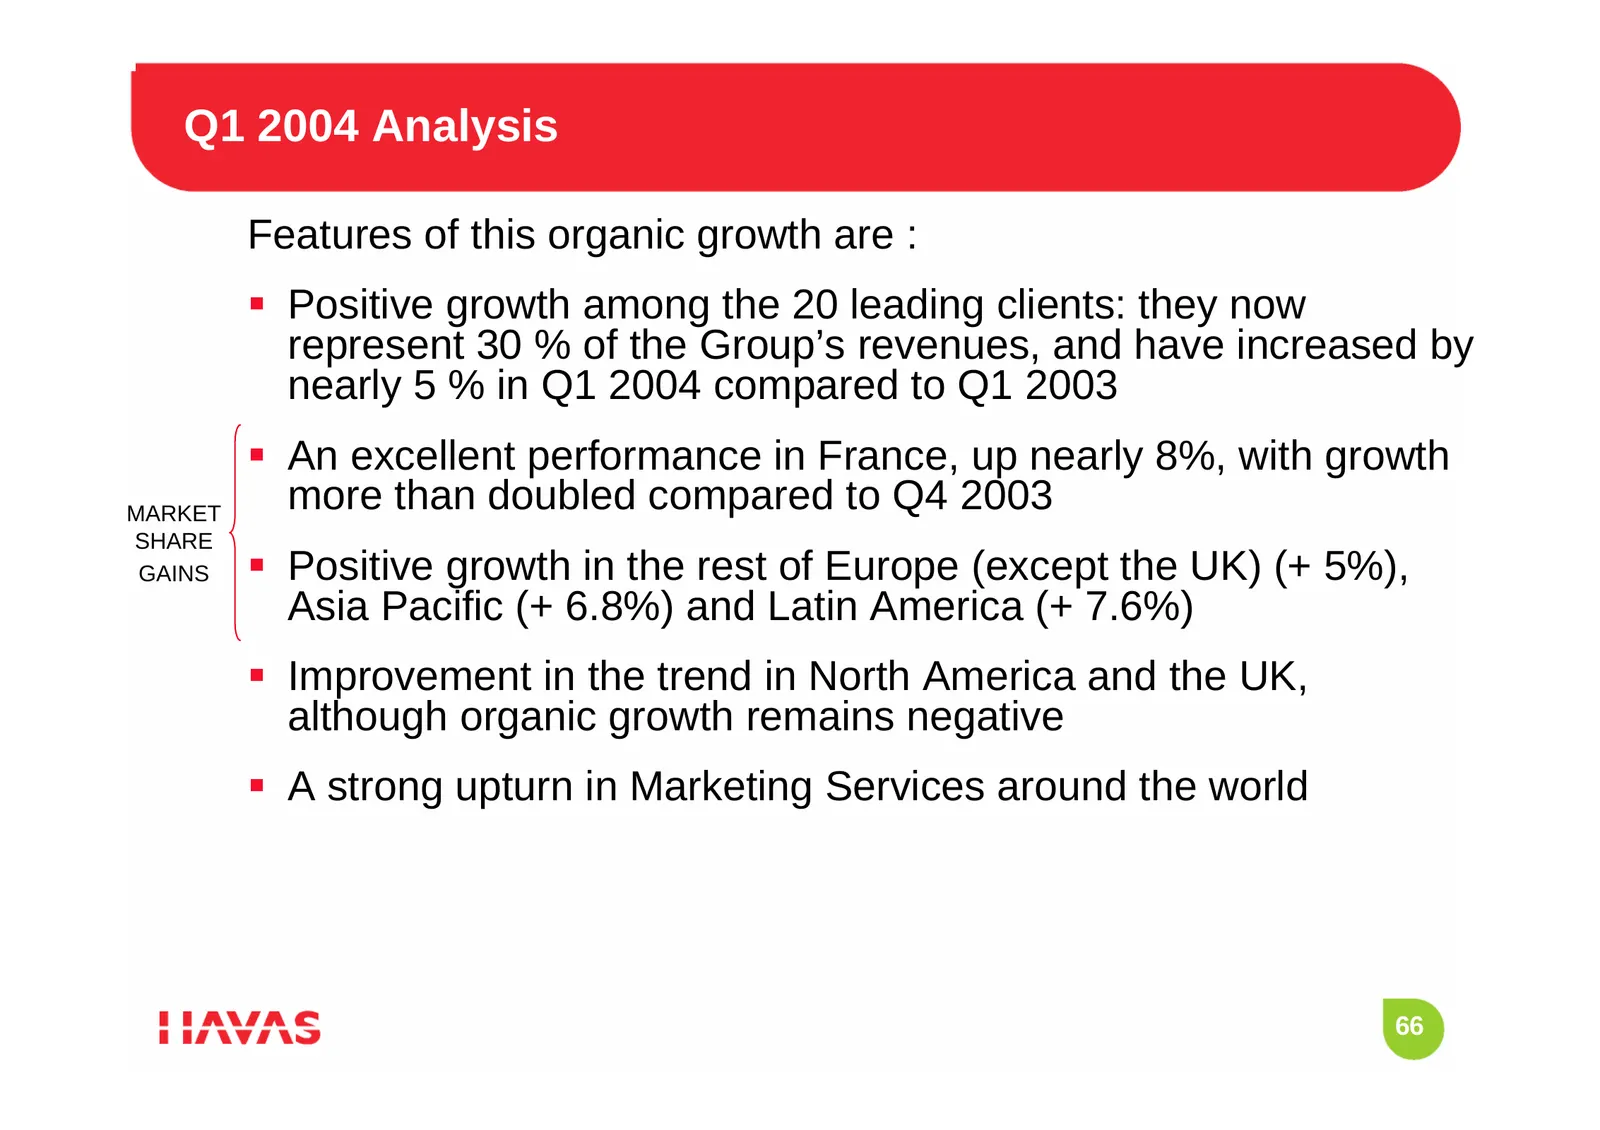
Q1 2004 Analysis Features of this organic growth are : Positive growth among the 20 leading clients: they now represent 30 % of the Group’s revenues, and have increased by nearly 5 % in Q1 2004 compared to Q1 2003 An excellent performance in France, up nearly 8%, with growth MARKET more than dou
Slide 67: Q1 2004 Analysis: Marketing Services Recovery
Q1 2004 Analysis This recovery in Marketing Services is an opportunity for Havas because of its strong presence. 51% of our revenue comes from these higher growth and higher margin activities 67
Slide 68: 2004 - Worldwide Services on the Peugeot Account
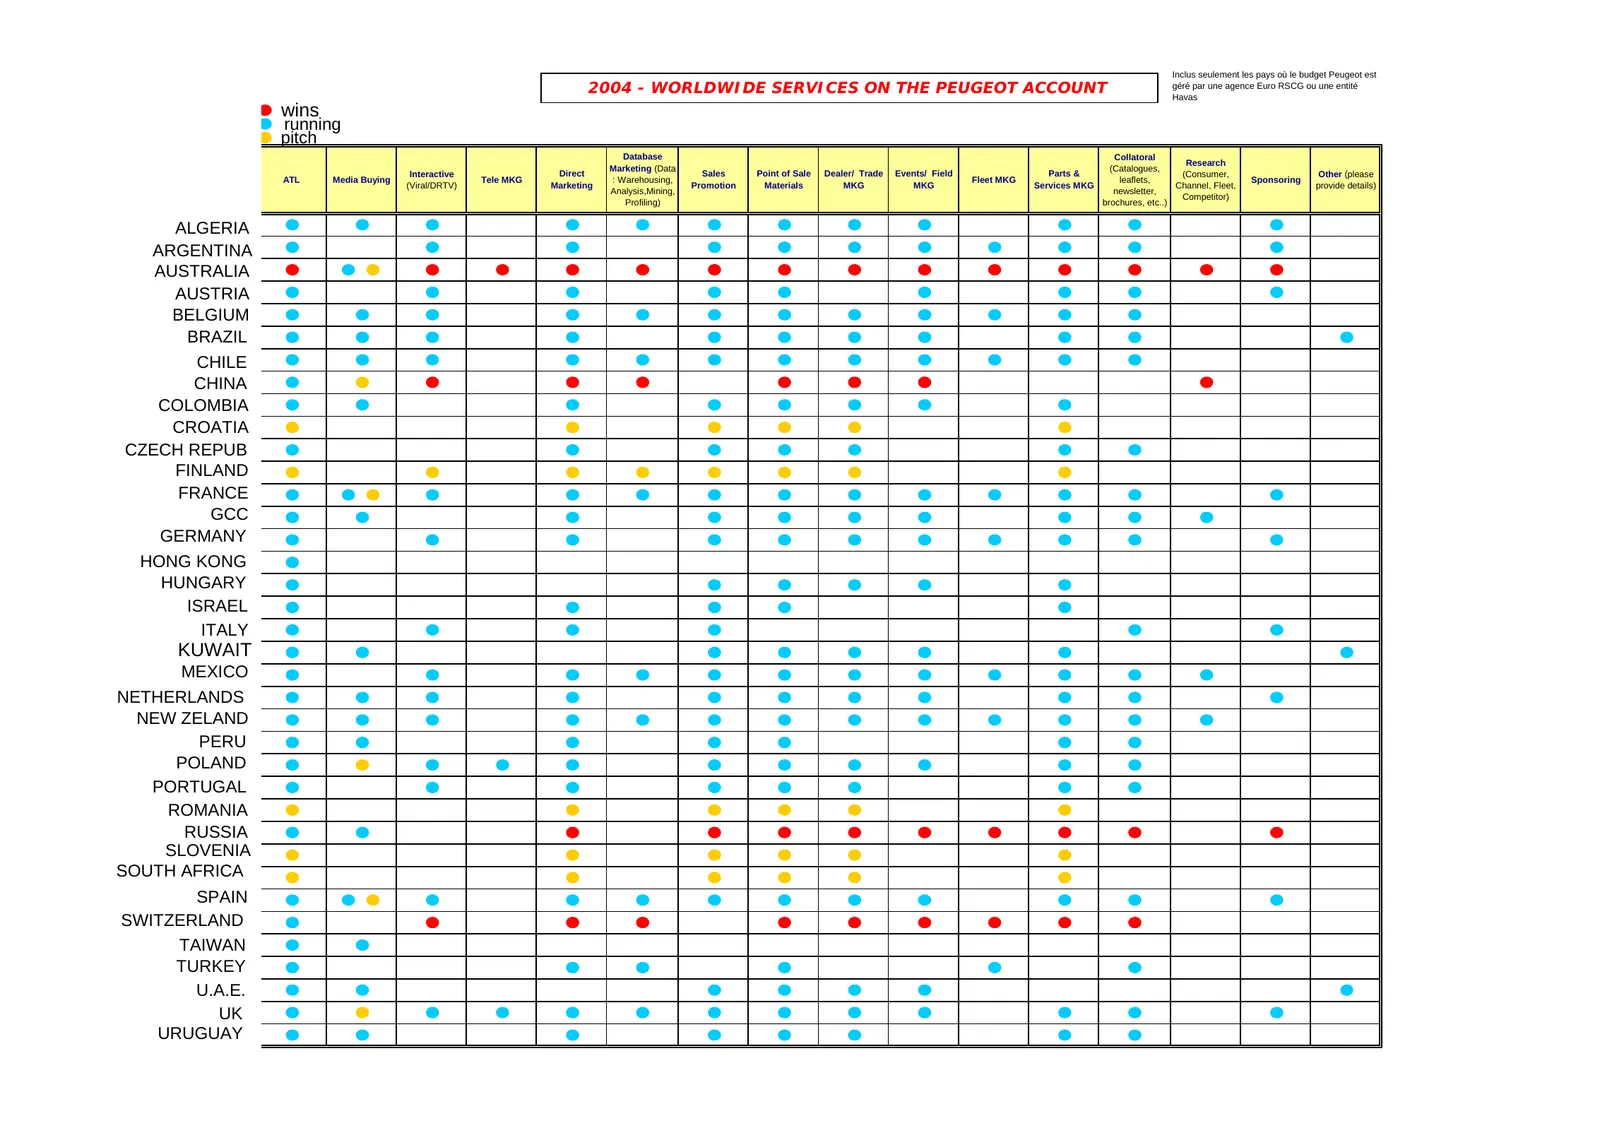
Inclus seulement les pays où le budget Peugeot est 2004 - WORLDWIDE SERVICES ON THE PEUGEOT ACCOUNT géré par une agence Euro RSCG ou une entité Havas wins running pitch Database Collatoral Research Marketing (Data (Catalogues, Interactive Direct Sales Point of Sale Dealer/ Trade Events/ Field Parts
Slide 69: Q1 2004 Analysis: Performance by Region
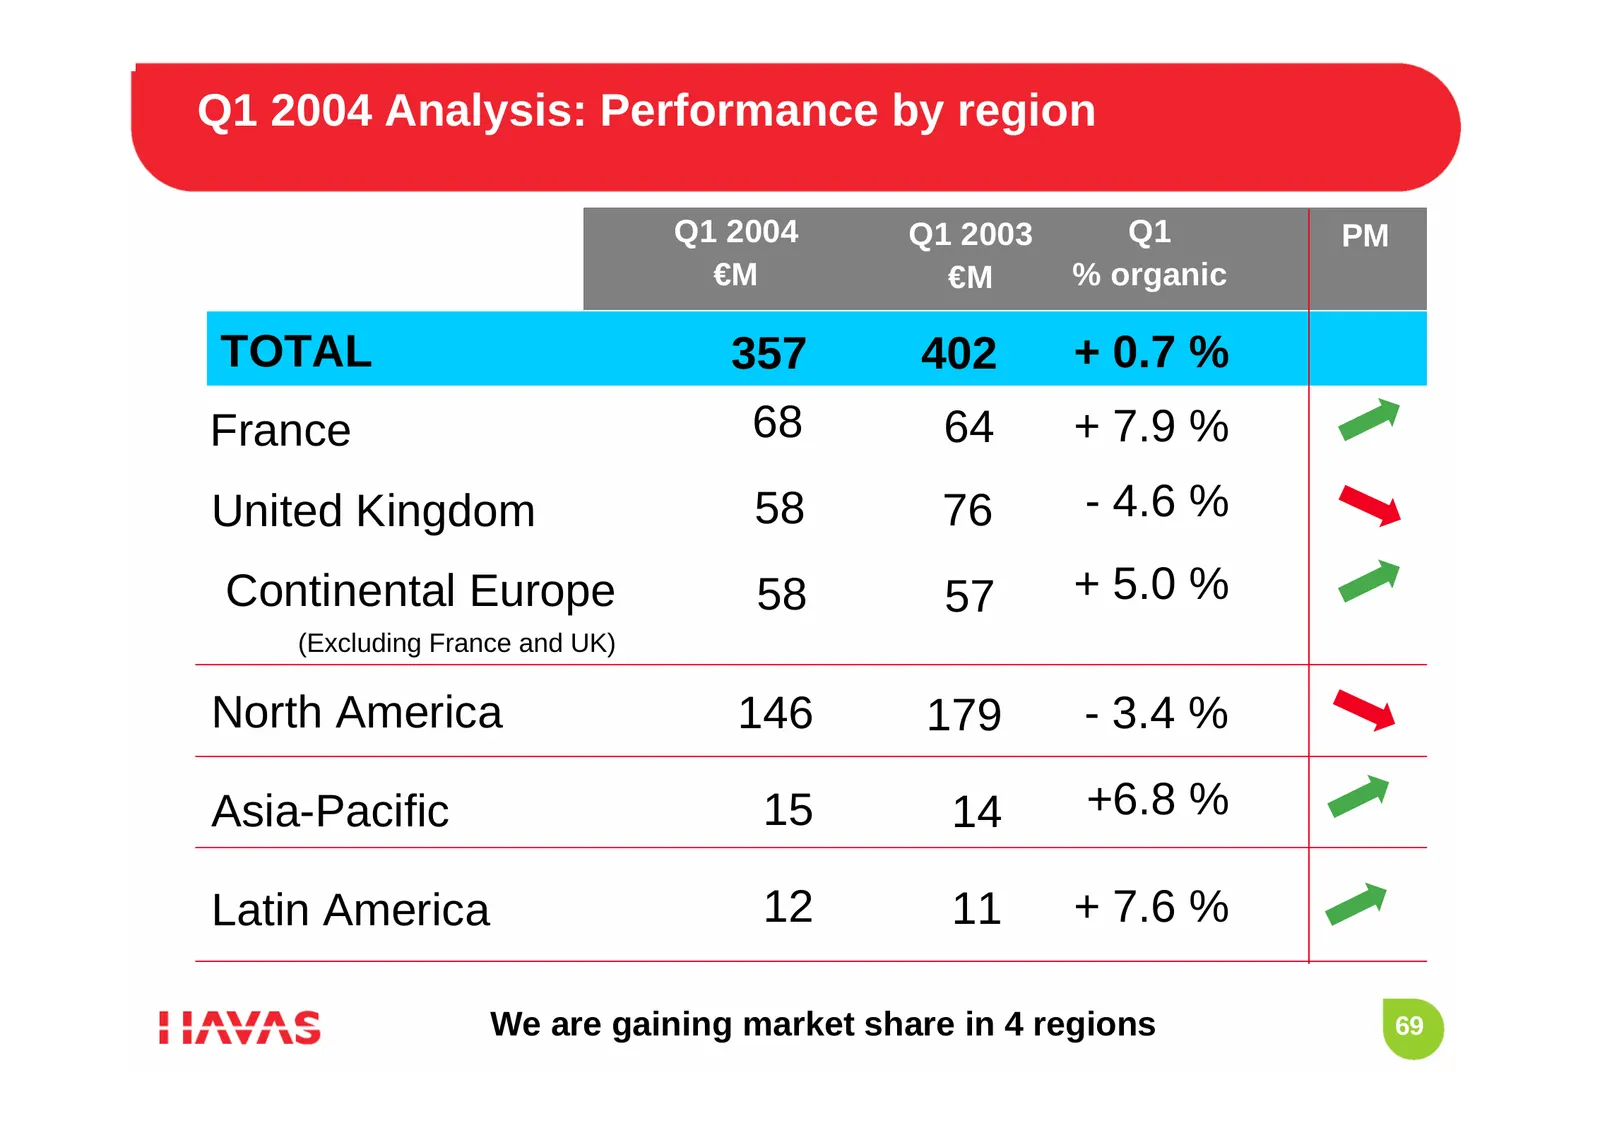
Q1 2004 Analysis: Performance by region Q1 2004 Q1 2003 Q1 PM €M €M % organic TOTAL 357 402 + 0.7 % France 68 64 + 7.9 % United Kingdom 58 76 - 4.6 % Continental Europe 58 57 + 5.0 % (Excluding France and UK) North America 146 179 - 3.4 % Asia-Pacific 15 14 +6.8 % Latin America 12 11 + 7.6 % We are
Slide 70: Organic Growth by Region – Sequential Trends
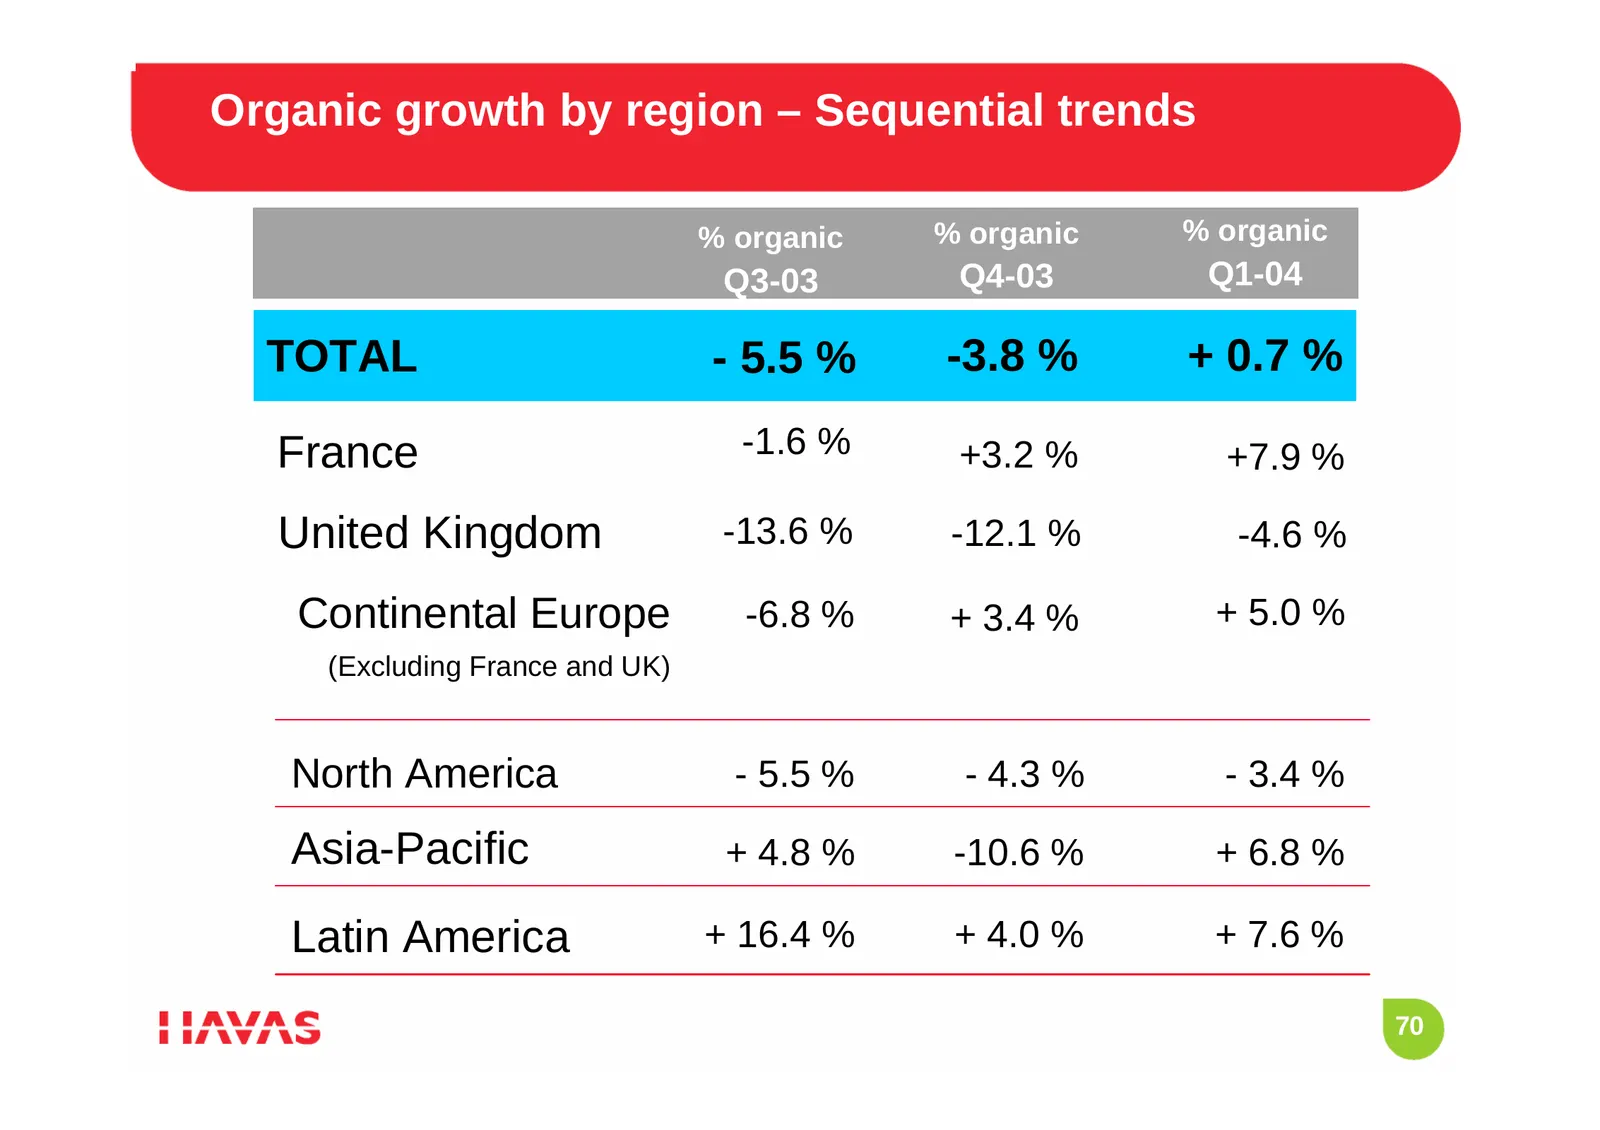
Organic growth by region – Sequential trends % organic % organic % organic Q3-03 Q4-03 Q1-04 TOTAL - 5.5 % -3.8 % + 0.7 % France -1.6 % +3.2 % +7.9 % United Kingdom -13.6 % -12.1 % -4.6 % Continental Europe -6.8 % + 3.4 % + 5.0 % (Excluding France and UK) North America - 5.5 % - 4.3 % - 3.4 % Asia-P
Slide 71: Net New Business Q1 2004
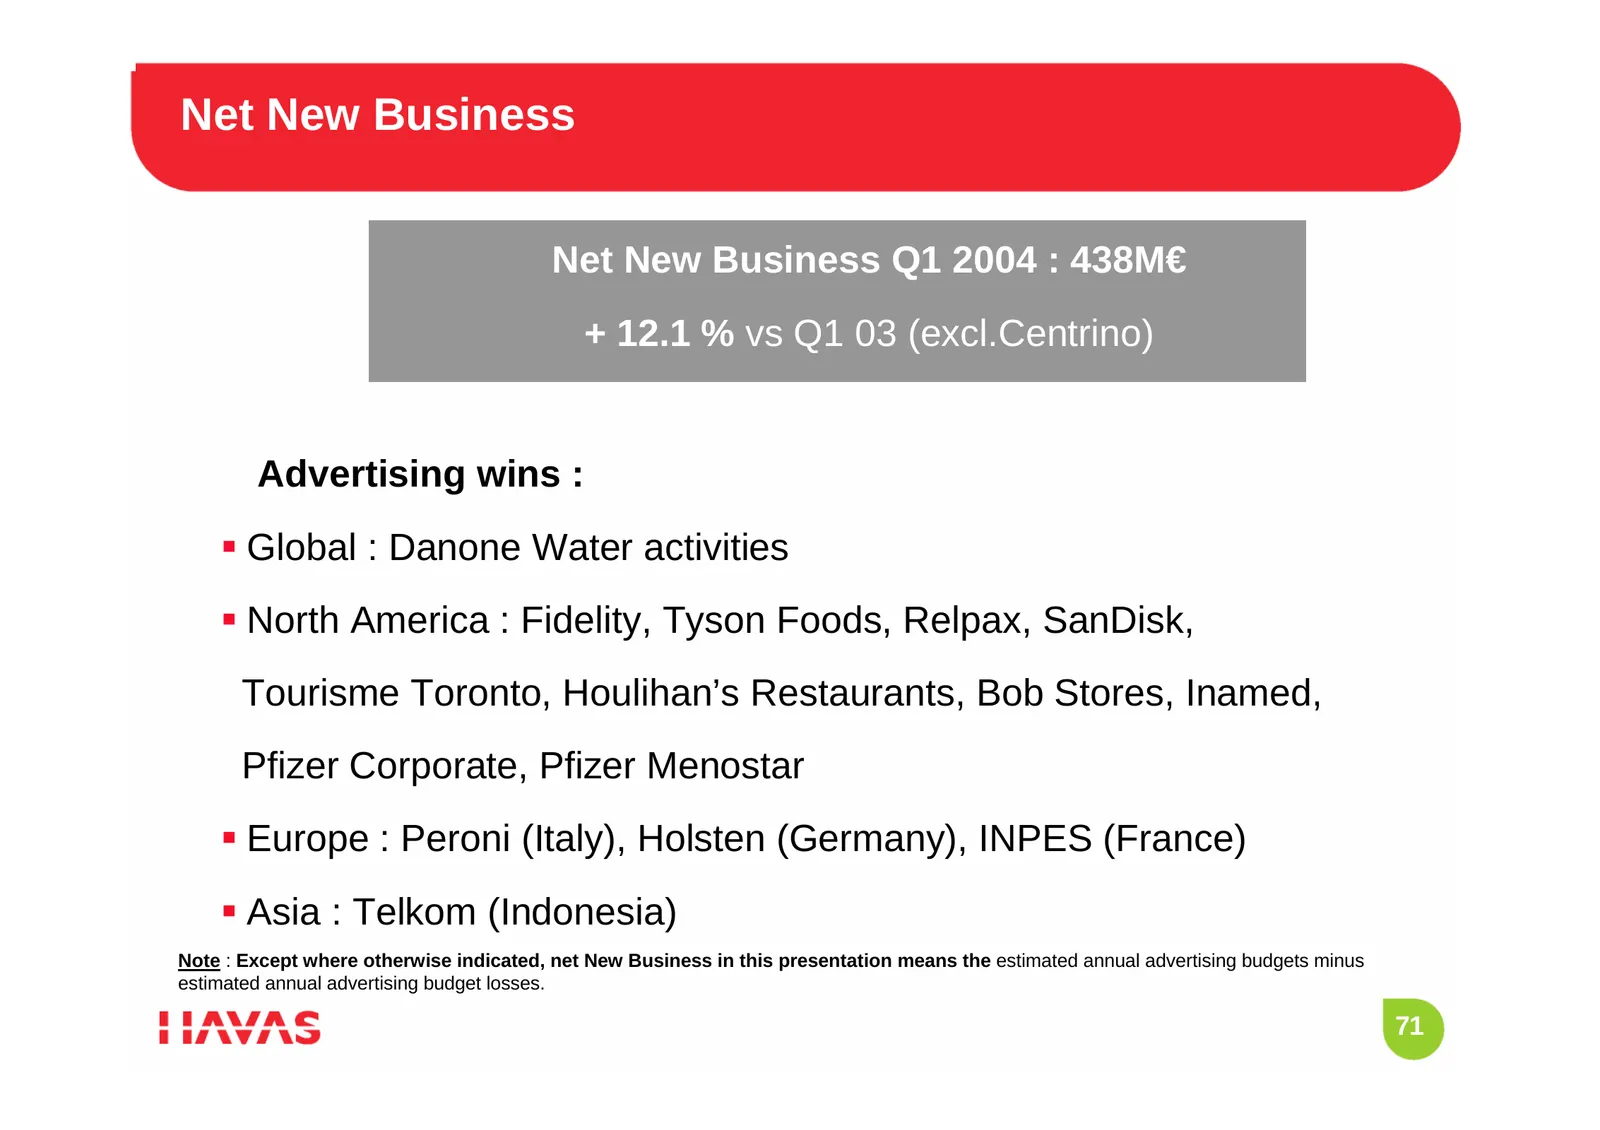
Net New Business Net New Business Q1 2004 : 438M€ + 12.1 % vs Q1 03 (excl.Centrino) Advertising wins : Global : Danone Water activities North America : Fidelity, Tyson Foods, Relpax, SanDisk, Tourisme Toronto, Houlihan’s Restaurants, Bob Stores, Inamed, Pfizer Corporate, Pfizer Menostar Europe
Slide 72: Net New Business
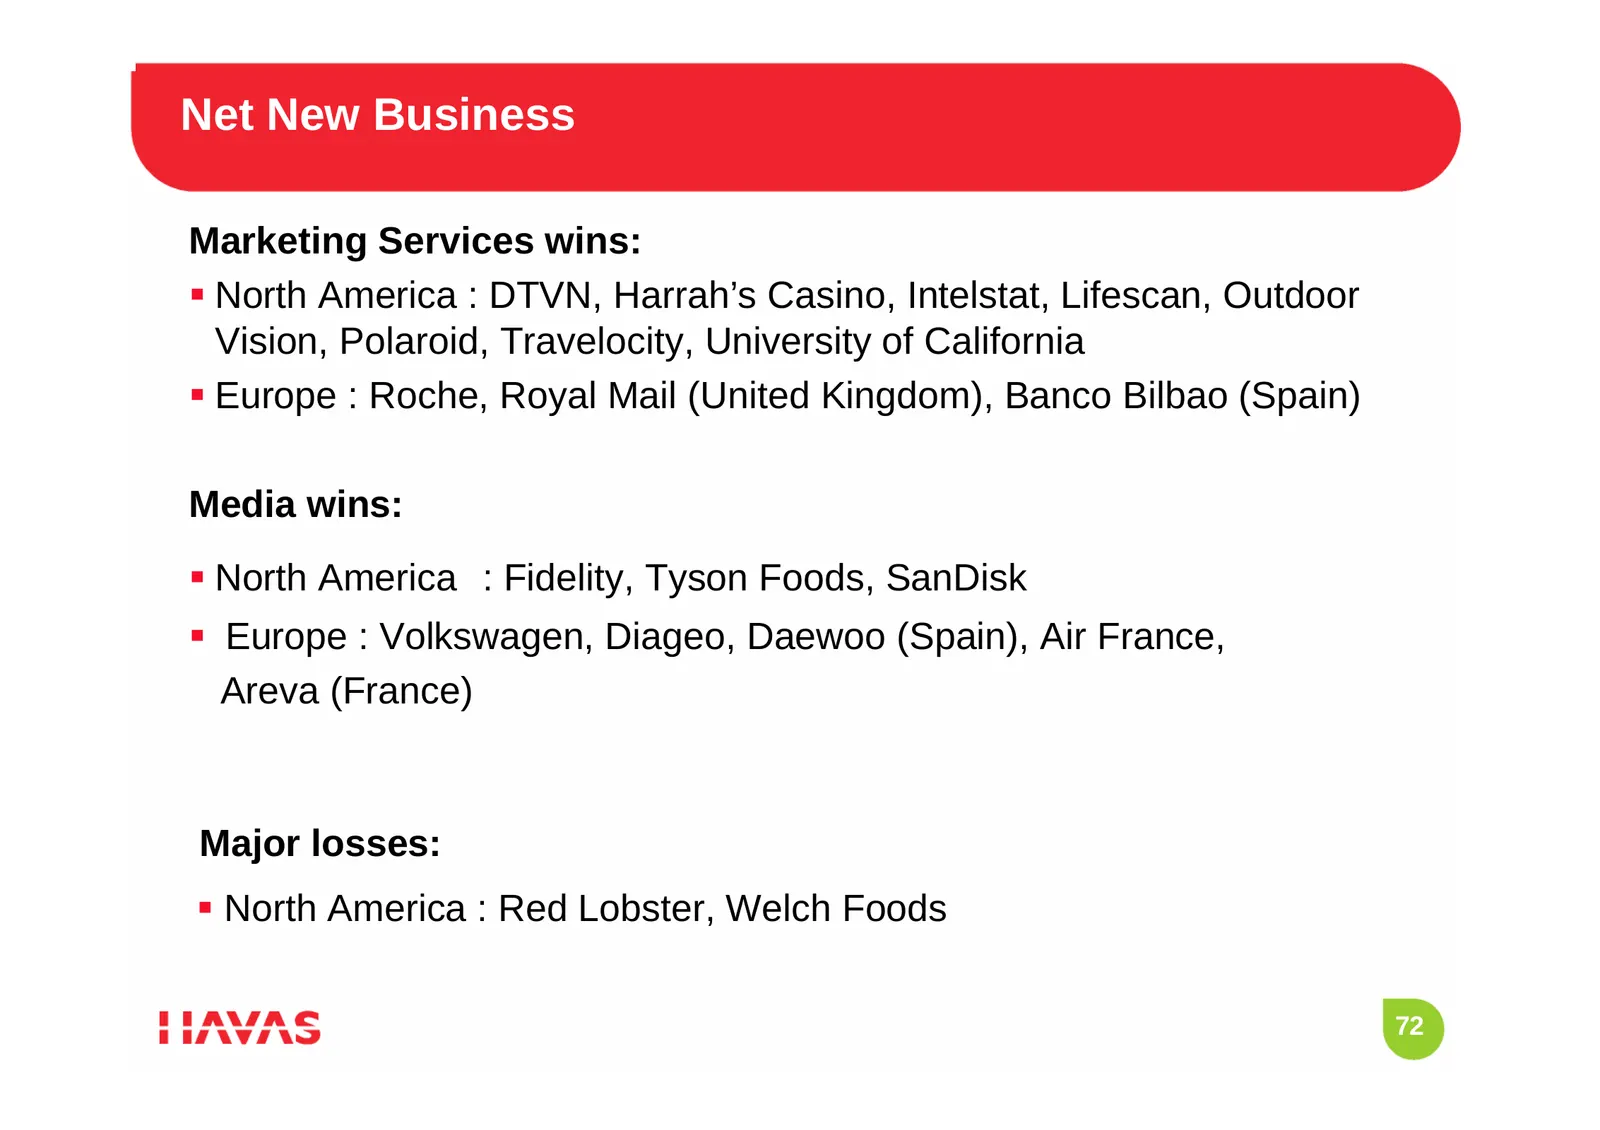
Net New Business Marketing Services wins: North America : DTVN, Harrah’s Casino, Intelstat, Lifescan, Outdoor Vision, Polaroid, Travelocity, University of California Europe : Roche, Royal Mail (United Kingdom), Banco Bilbao (Spain) Media wins: North America : Fidelity, Tyson Foods, SanDisk E
Slide 73: Our Brands Have More Positive Evolutions
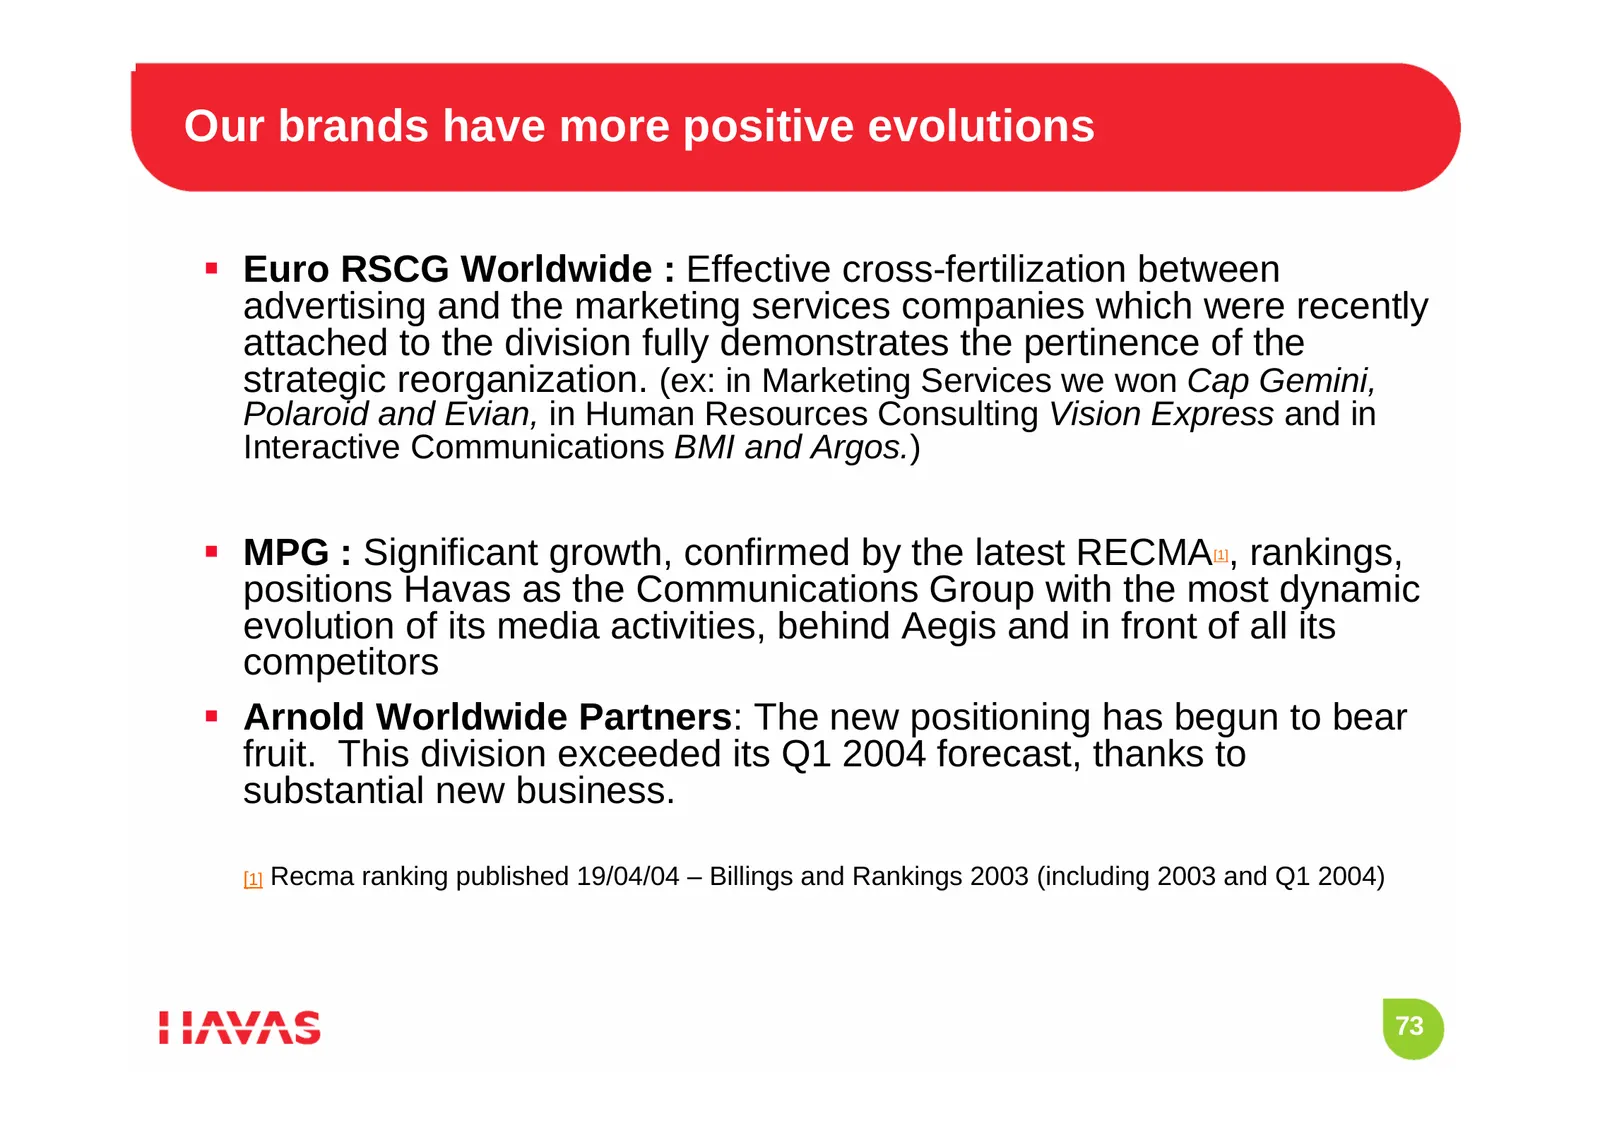
Our brands have more positive evolutions Euro RSCG Worldwide : Effective cross-fertilization between advertising and the marketing services companies which were recently attached to the division fully demonstrates the pertinence of the strategic reorganization. (ex: in Marketing Services we won Ca
Slide 74: Creativity
Creativity The Group has won a considerable number of awards reflecting the constant drive to invest in outstanding creative ideas as well as the efficiency of its campaigns. Prominent award winners were: Arnold Worldwide Partners in Boston, BETC Euro RSCG in Paris, and Euro RSCG Flagship in Bangkok
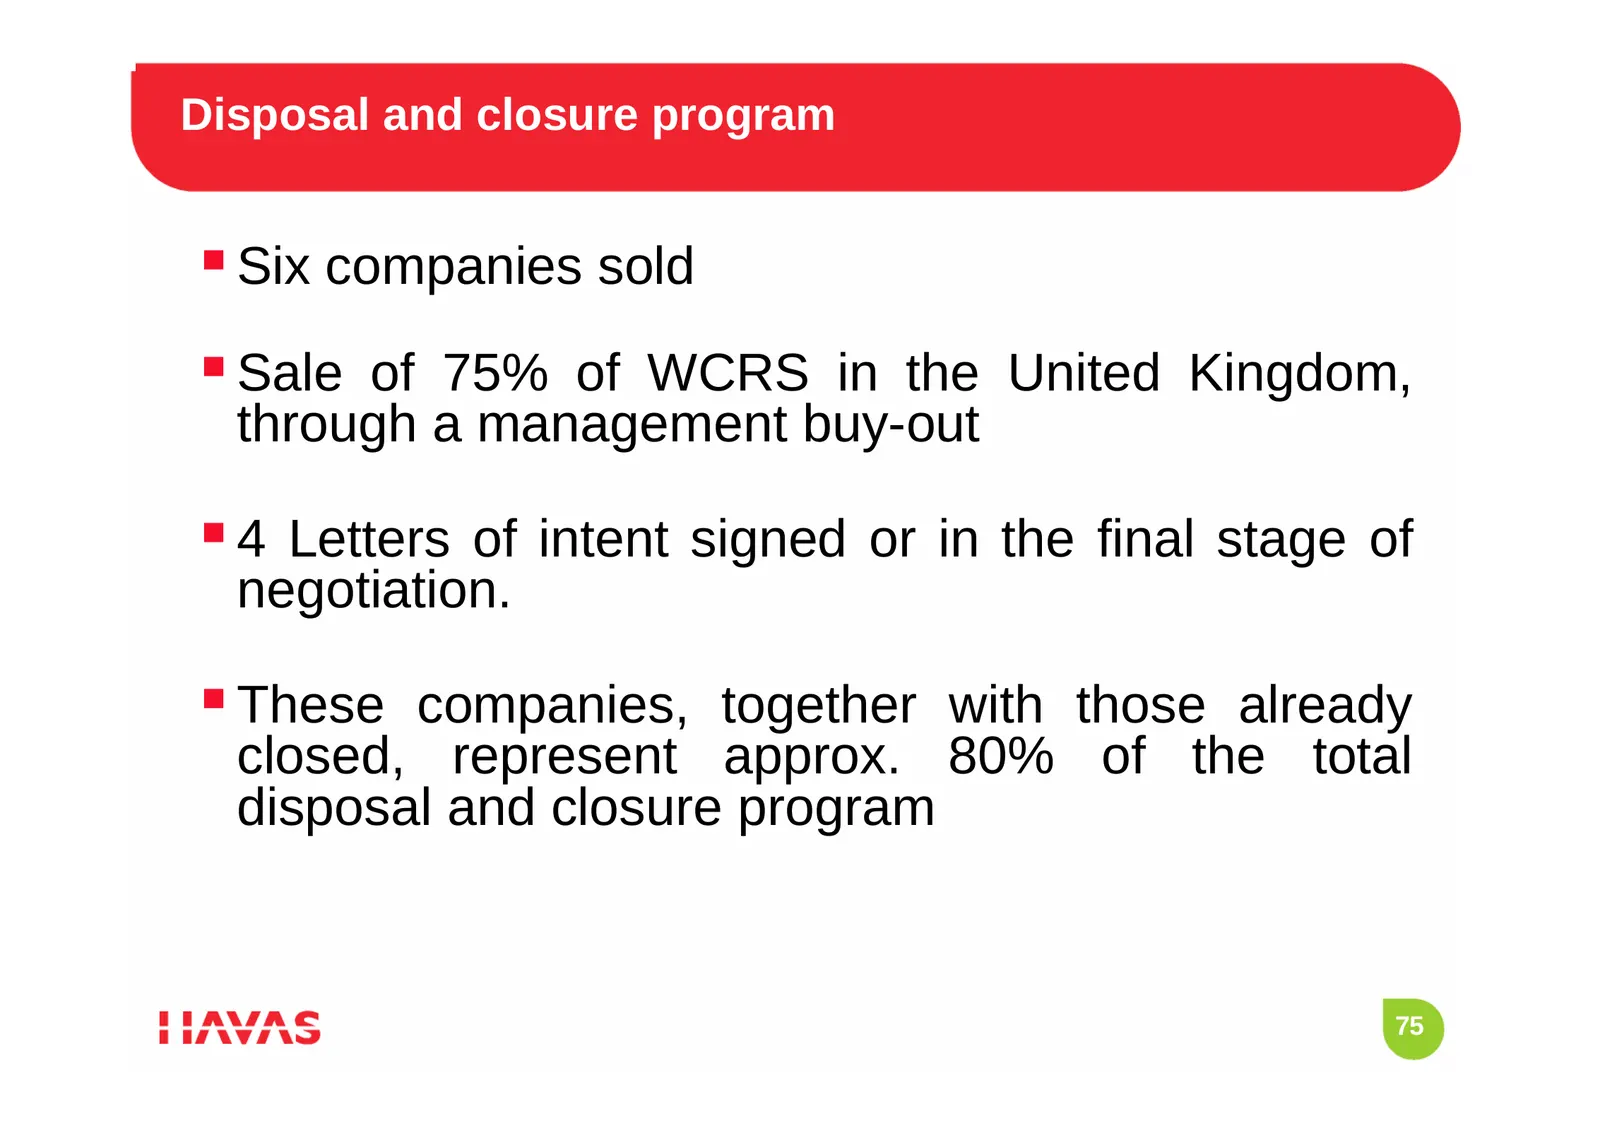
Slide 75: Disposal and Closure Program
Disposal and closure program Six companies sold Sale of 75% of WCRS in the United Kingdom, through a management buy-out 4 Letters of intent signed or in the final stage of negotiation. These companies, together with those already closed, represent approx. 80% of the total disposal and closur
Slide 76: Conclusions for 2004
CONCLUSIONS FOR 2004 76
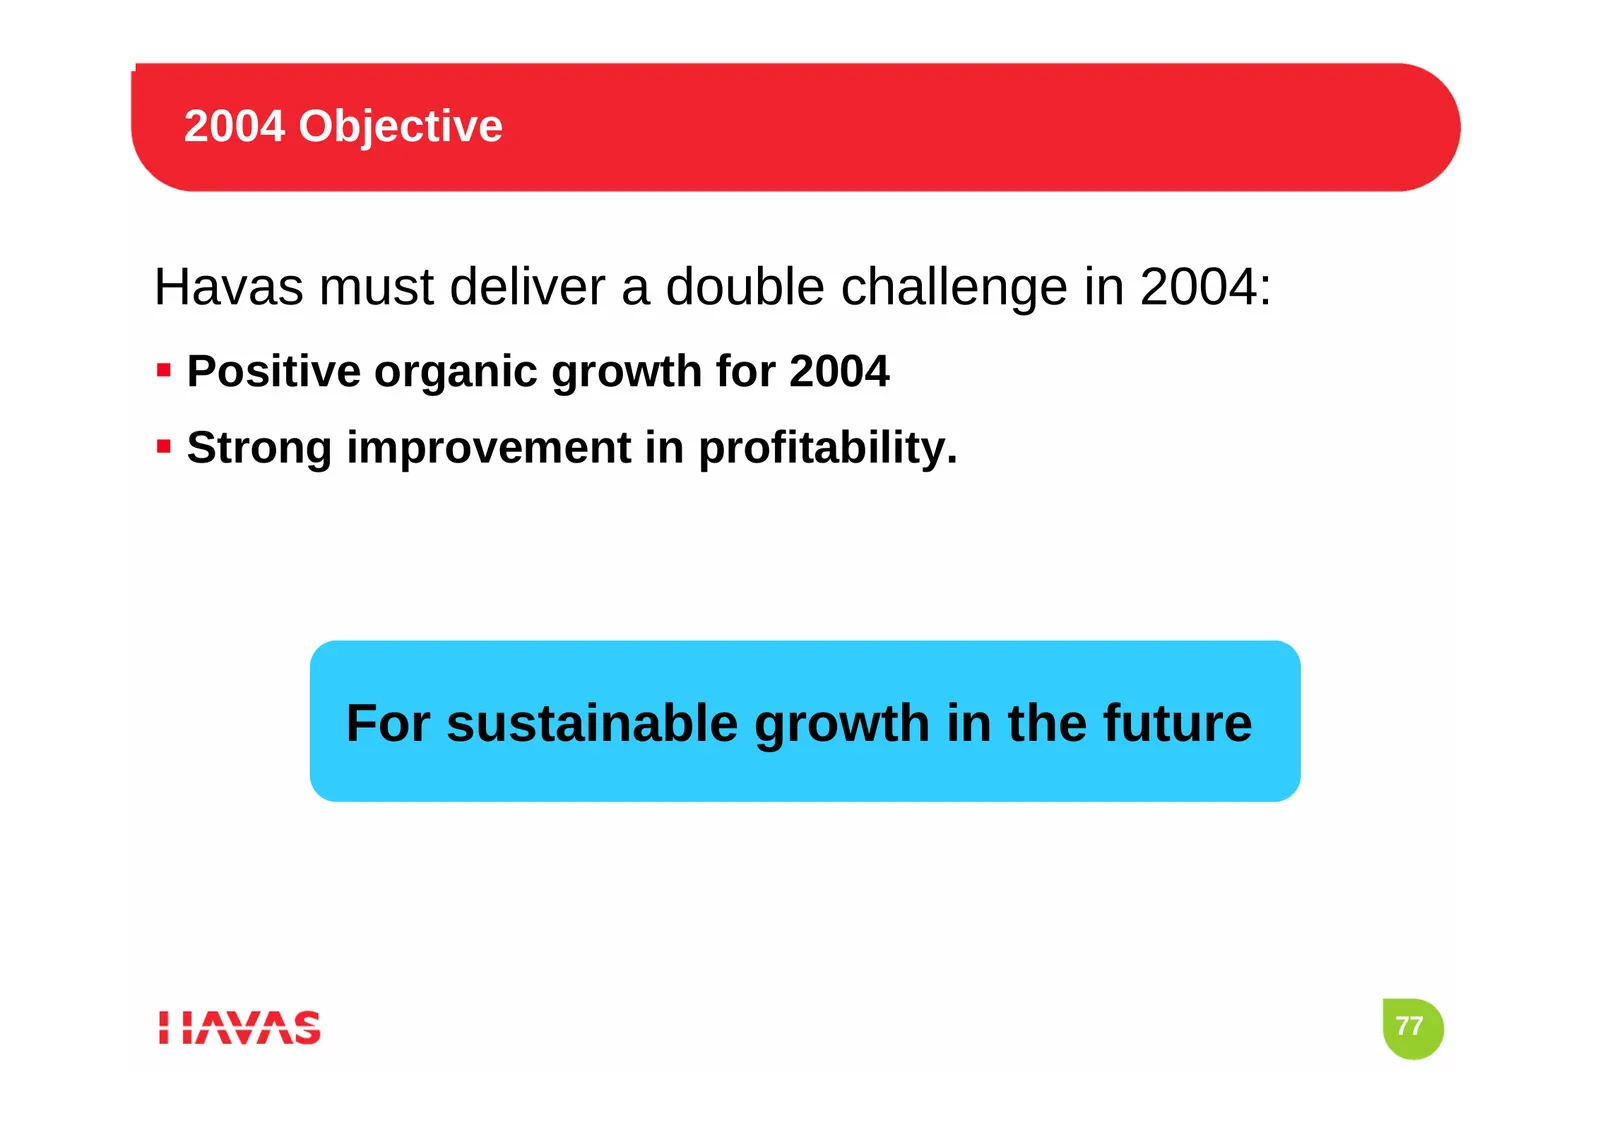
Slide 77: 2004 Objective
2004 Objective Havas must deliver a double challenge in 2004: Positive organic growth for 2004 Strong improvement in profitability. For sustainable growth in the future 77
Slide 78: Presentation of the Resolutions
PRESENTATION OF THE RESOLUTIONS 78
Slide 79: Resolutions 1 to 4
11) Resolutions 1 to 4 1. Approval of the Parent Company’s 2003 financial statements 2. Approval of the Group’s 2003 consolidated accounts 3. Approval of Regulated Agreements 4. Approval of the allocation of earnings and the payment of a dividend of 5 centimes. 79
Slide 80: 2004 Directors Fees
11) Resolution 5 – 2004 Directors fees Fixed fee 30,000 euros per Director, of which 8,000 euros paid in Havas shares Variable fee dependent upon presence at meetings and increase in Havas EBIT margin Total Fees fixed at 900,000 euros, of which a maximum of 112,000 euros may be paid in Hav
Slide 81: Re-election of Directors
11) Resolutions 6 to 11 – Re-election of Directors Re-election as Director for a period of 3 years of 6. Mr Ed Eskandarian, Chairman and CEO Arnold Worldwide Partners 7. Mr Pierre Lescure, Independant * 8. Mr Leopoldo Rodès Castane, Chairman MPG 9. Mr Patrick Soulard, Independant * 10. La Société Ce
Slide 82: Share Buyback Program
11) Resolutions 12 & 13 – Share buyback program Request authorization to trade in Company’s own shares: To stabilize the share price To deliver shares in payment or exhange for acquisitions To implement stock option plans To make stock awards to employees of the Company To deliver shares u
Slide 83: Financial Authorizations
11) Resolutions 14 to 17 – Financial authorizations Three authorizations to issue shares and share equivalents providing the Group with greater flexibility to cover its financing needs, in particular, if needs be, by issuing, at an appropriate moment, convertible bonds, which require in the current
Slide 84: Amendments to Bylaws
11) Resolutions 18 to 24 – amendments to bylaws to reflect legislative changes 18. To reduce the notification period for disclosure of threshold breach from 15 to 5 days - Article 11 19. To extend the exceptions in terms of the number of Directors - Article 15 20. To require the Chairman and the Chi
Slide 85: Powers to Carry Out All Formalities
11) Resolution 25 Powers to carry out all formalities 85
Slide 86: Annual General Meeting
ANNUAL GENERAL MEETING Suresnes - May 26, 2004
Source: Internet Archive copy of havas.com
More decks from Havas NV
 Q3 2026 Earnings Presentation24 slides · Oct 14, 2026
 Conference Presentation (September 2026)37 slides · September 2026
 H1 2026 Earnings Presentation43 slides · Jul 23, 2026
 Q1 2026 Earnings Presentation19 slides · Apr 14, 2026
 FY2025 Earnings Presentation44 slides · Feb 17, 2026
 H1 2025 Earnings Presentation38 slides · Jul 29, 2025