Norbit ASA · OSL:NORBT
Norbit ASA — Q3 2026 Earnings Presentation
30 slides from Norbit ASA's earnings presentation, Nov 12, 2026
Slide 1: Third quarter 2026 presentation
Third quarter 2026 presentation CEO Per Jørgen Weisethaunet CFO Per Kristian Reppe 12 November 2026
Slide 2: Disclaimer
Disclaimer This presentation has been prepared by Norbit ASA (the "Company", and together with its consolidated subsidiaries, the "Group"). It does not constitute or form part of, and should not be relied on in connection with, any offer, solicitation or invitation to subscribe for, underwrite or ot
Slide 3: Growth and improved profitability year-over-year
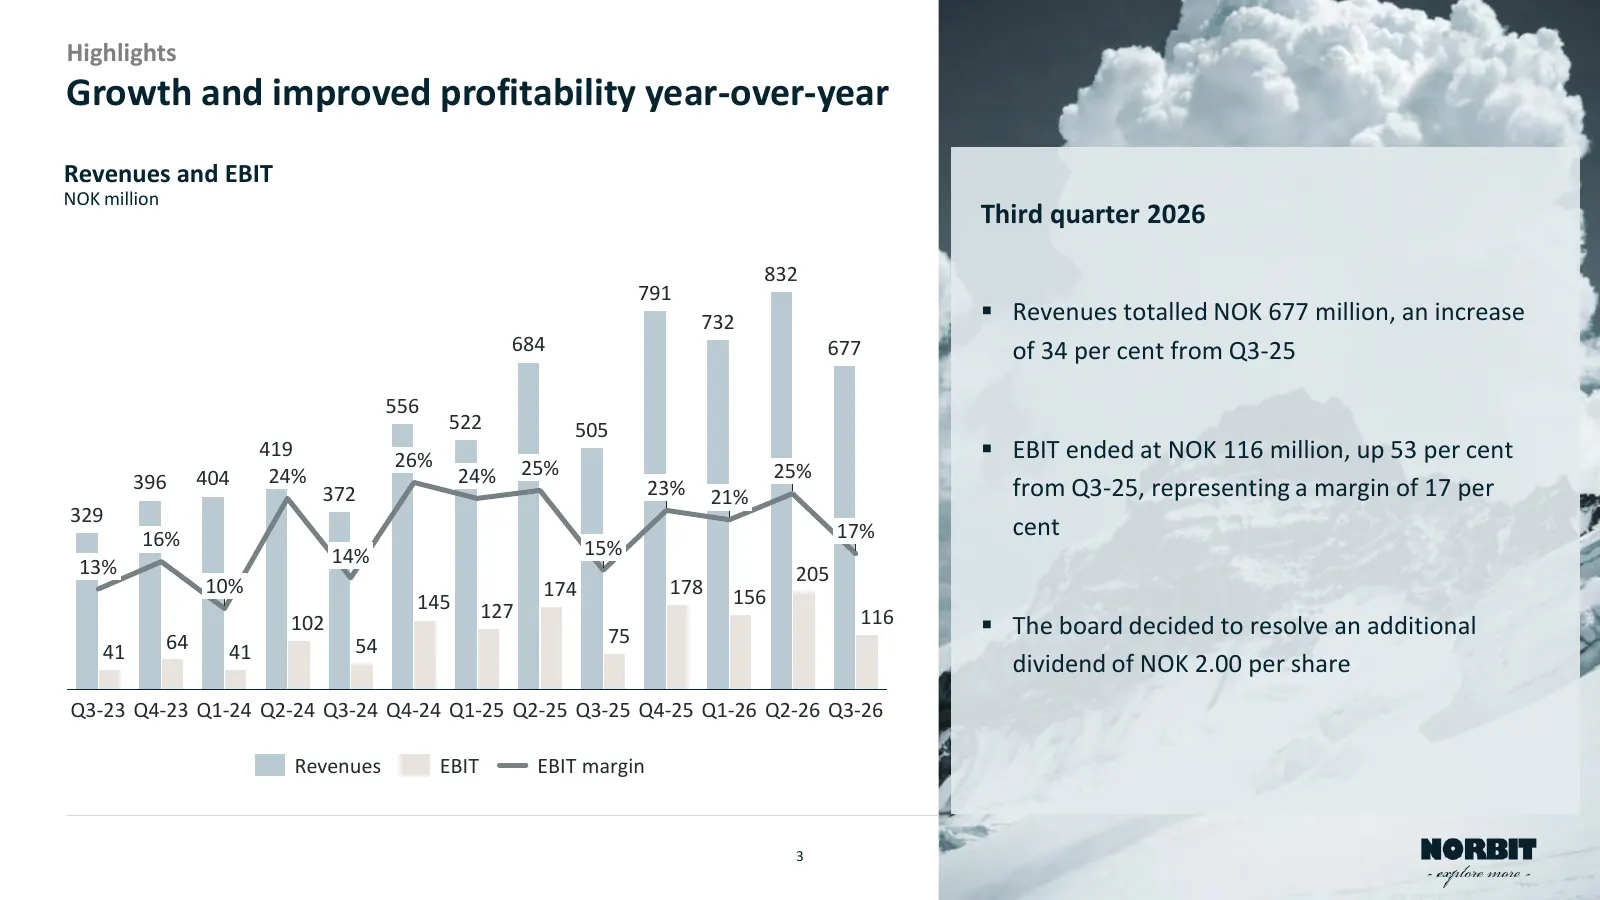
Highlights Growth and improved profitability year-over-year Revenues and EBIT NOK million Third quarter 2026 832 791 732 ▪ Revenues totalled NOK 677 million, an increase 684 677 of 34 per cent from Q3-25 556 522 505 419 26% ▪ EBIT ended at NOK 116 million, up 53 per cent 404 24% 24% 25% 25% 396 23%
Slide 4: Continued profitable growth in 2026
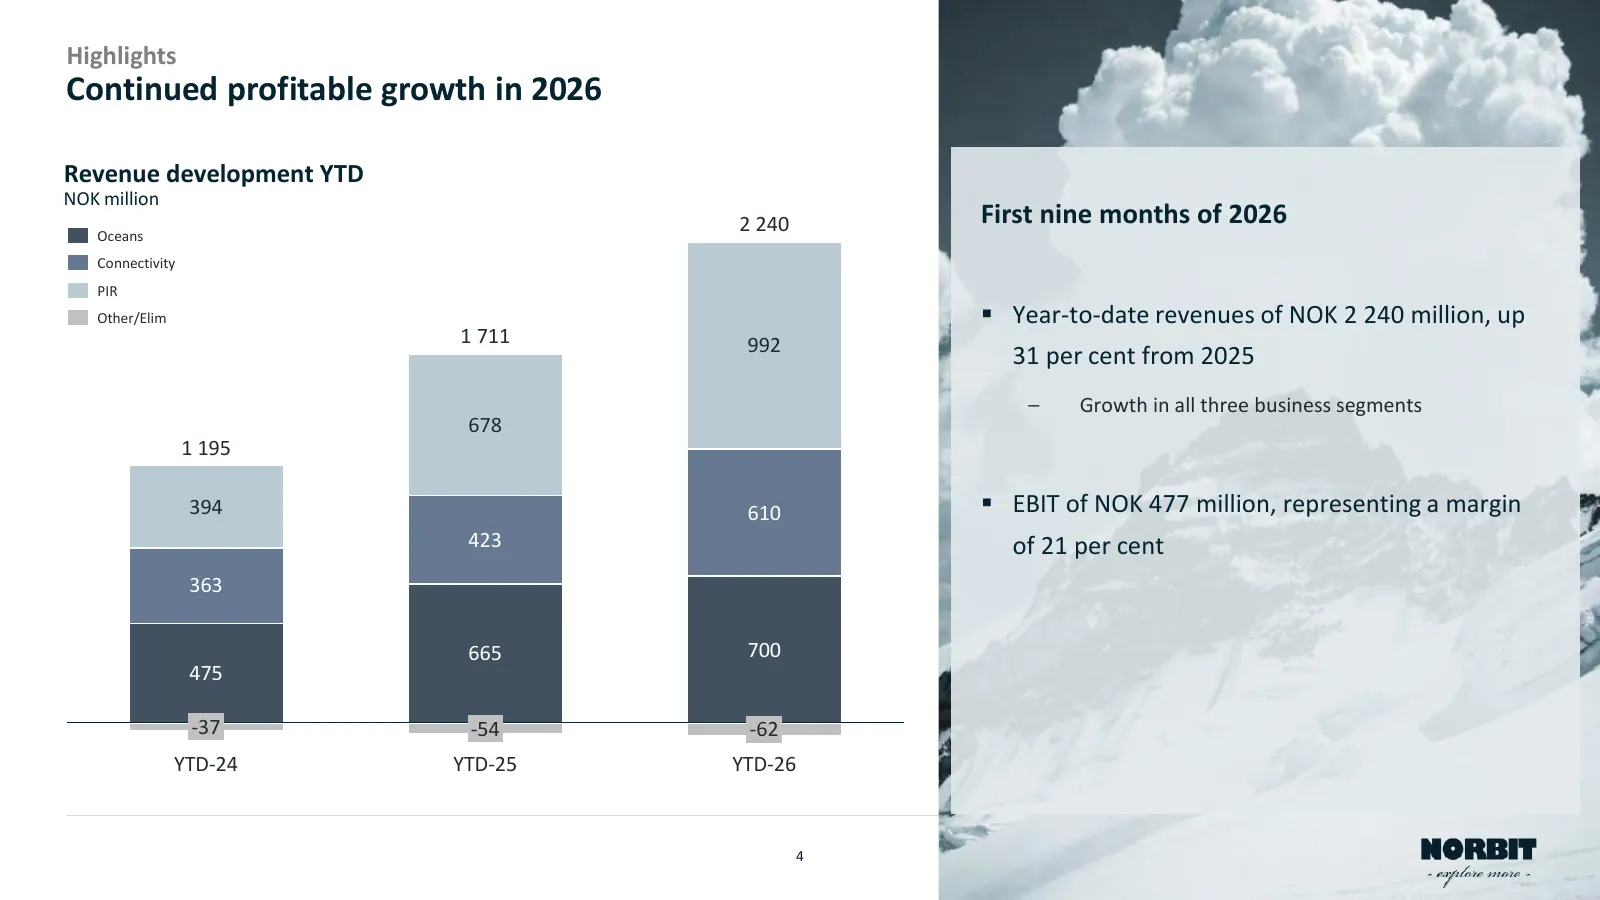
Highlights Continued profitable growth in 2026 Revenue development YTD NOK million 2 240 First nine months of 2026 Oceans Connectivity PIR Other/Elim ▪ Year-to-date revenues of NOK 2 240 million, up 1 711 992 31 per cent from 2025 – Growth in all three business segments 678 1 195 394 610 ▪ EBIT of N

Slide 5: Oceans
Slide 6: Oceans: Solid performance in a seasonally slower quarter
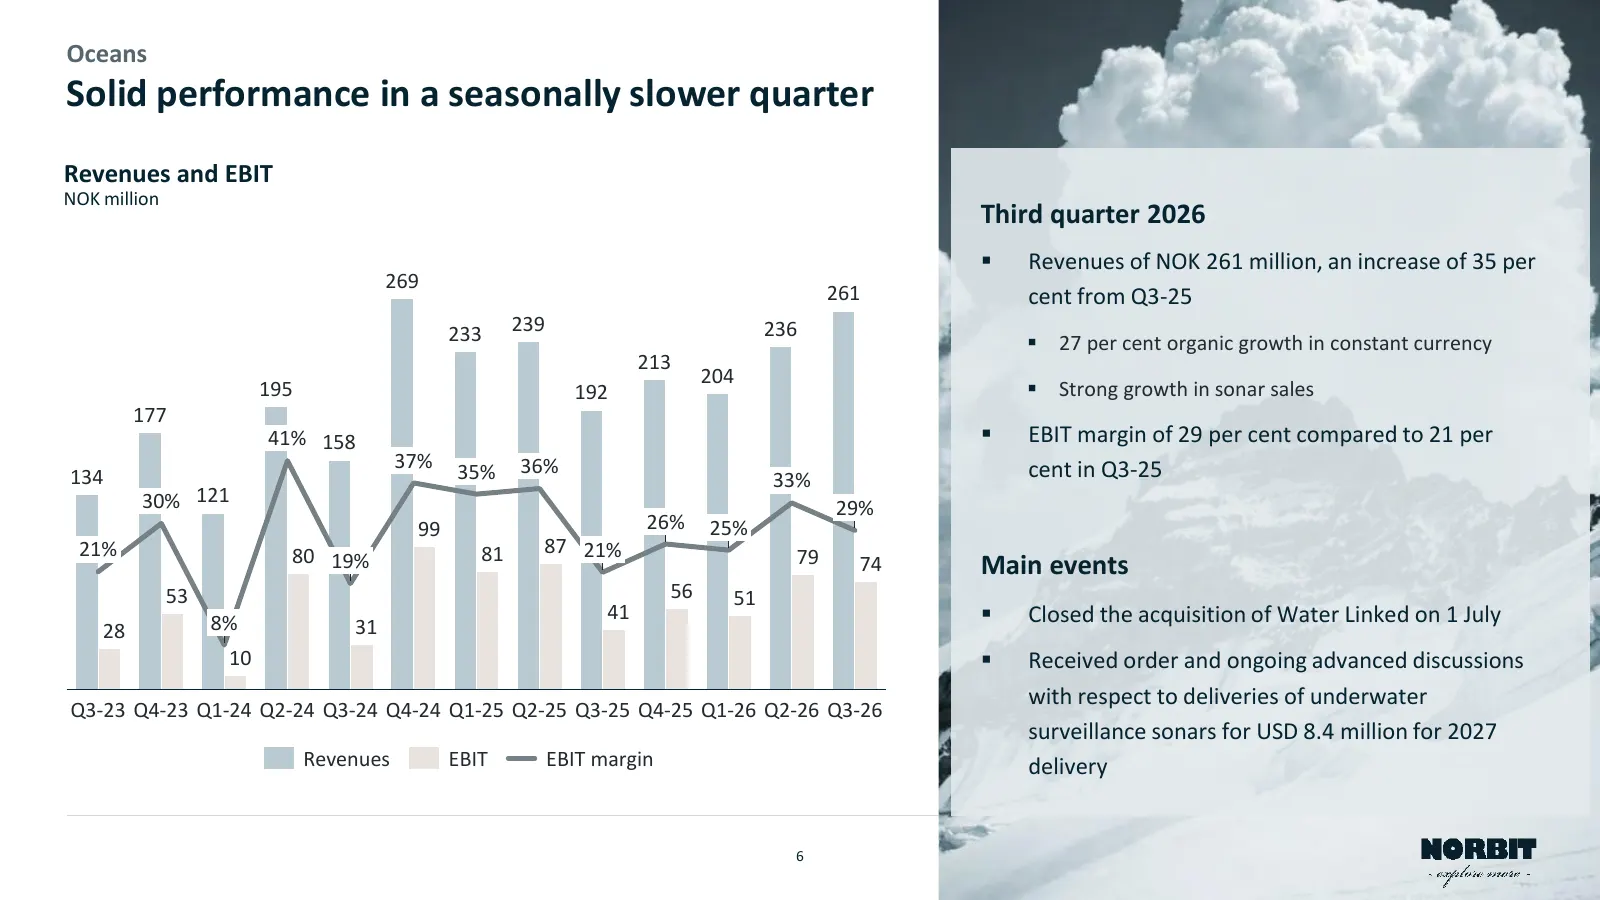
Oceans Solid performance in a seasonally slower quarter Revenues and EBIT NOK million Third quarter 2026 ▪ Revenues of NOK 261 million, an increase of 35 per 269 261 cent from Q3-25 233 239 236 ▪ 27 per cent organic growth in constant currency 213 204 195 192 ▪ Strong growth in sonar sales 177 41% 1
Slide 7: Oceans: Currency adjusted organic growth of 7 per cent
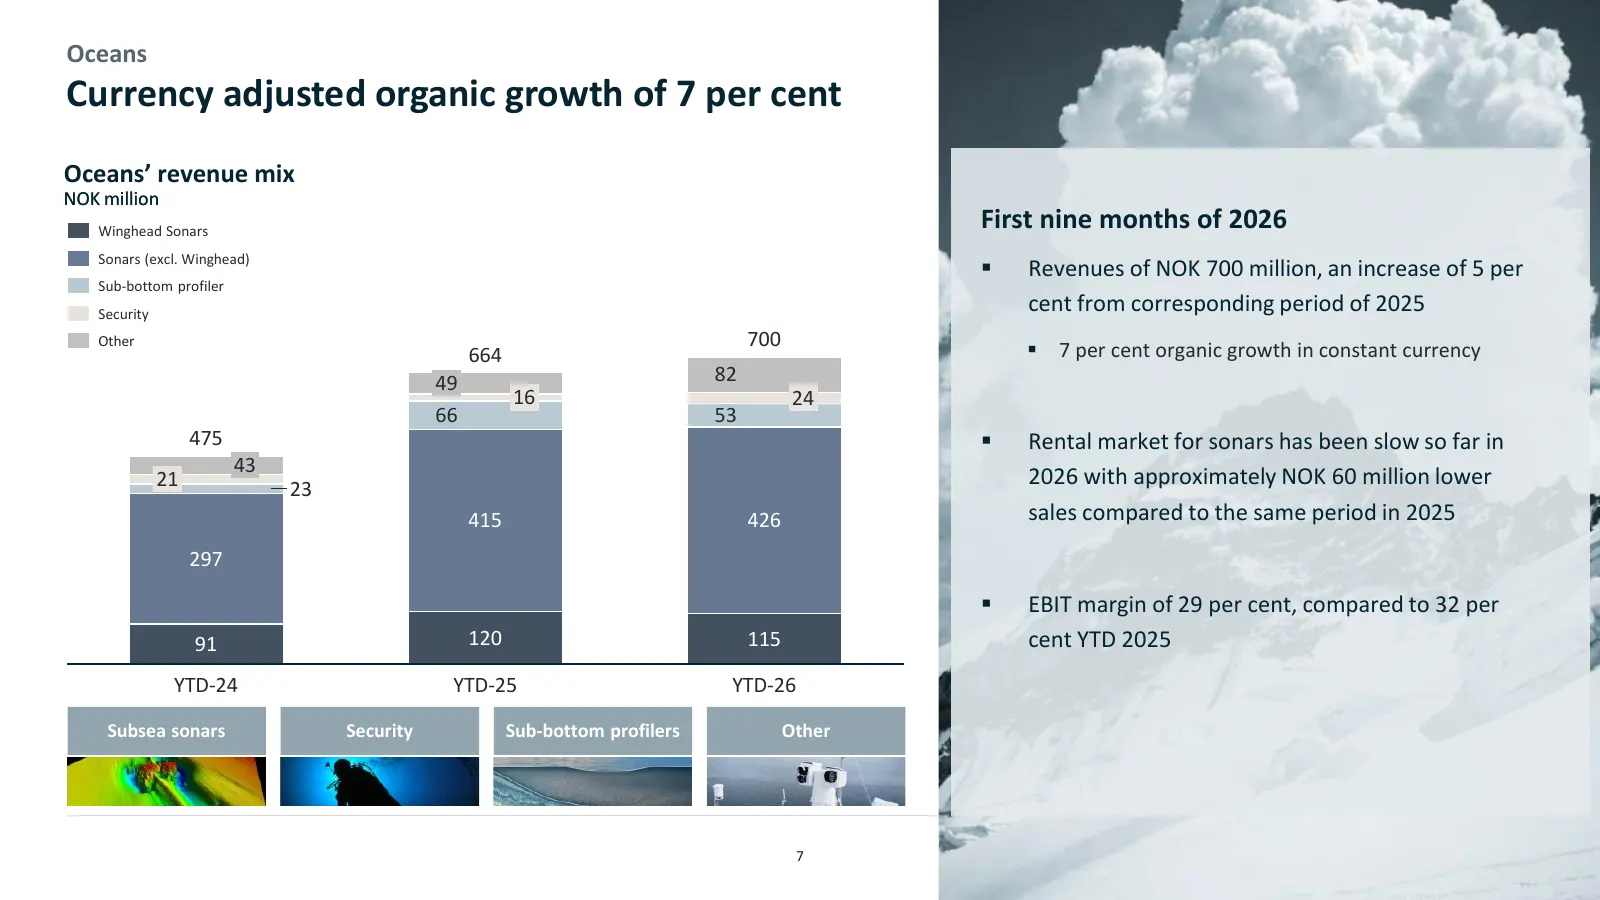
Oceans Currency adjusted organic growth of 7 per cent Oceans’ revenue mix NOK million Winghead Sonars First nine months of 2026 Sonars (excl. Winghead) ▪ Revenues of NOK 700 million, an increase of 5 per Sub-bottom profiler Security cent from corresponding period of 2025 Other 700 ▪ 7 per cent organ
Slide 8: Completed the acquisition of Water Linked
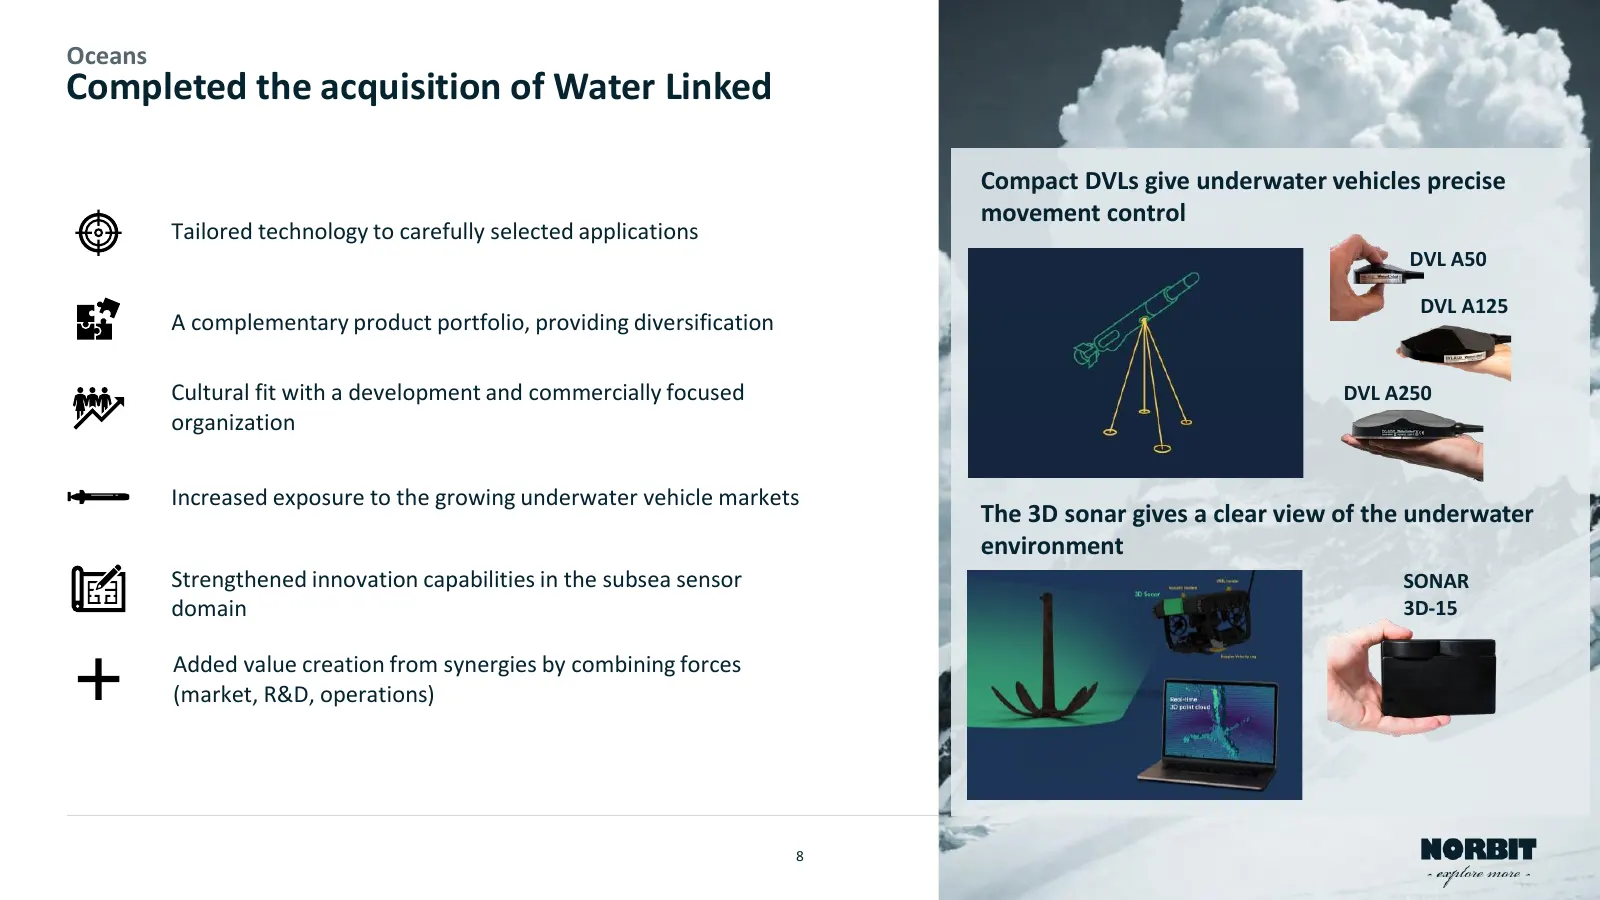
Oceans Completed the acquisition of Water Linked Compact DVLs give underwater vehicles precise movement control Tailored technology to carefully selected applications DVL A50 DVL A125 A complementary product portfolio, providing diversification Cultural fit with a development and commercially focuse

Slide 9: Connectivity
j | } mins Sig
Slide 10: Connectivity: Year-over-year revenue growth and EBIT uplift
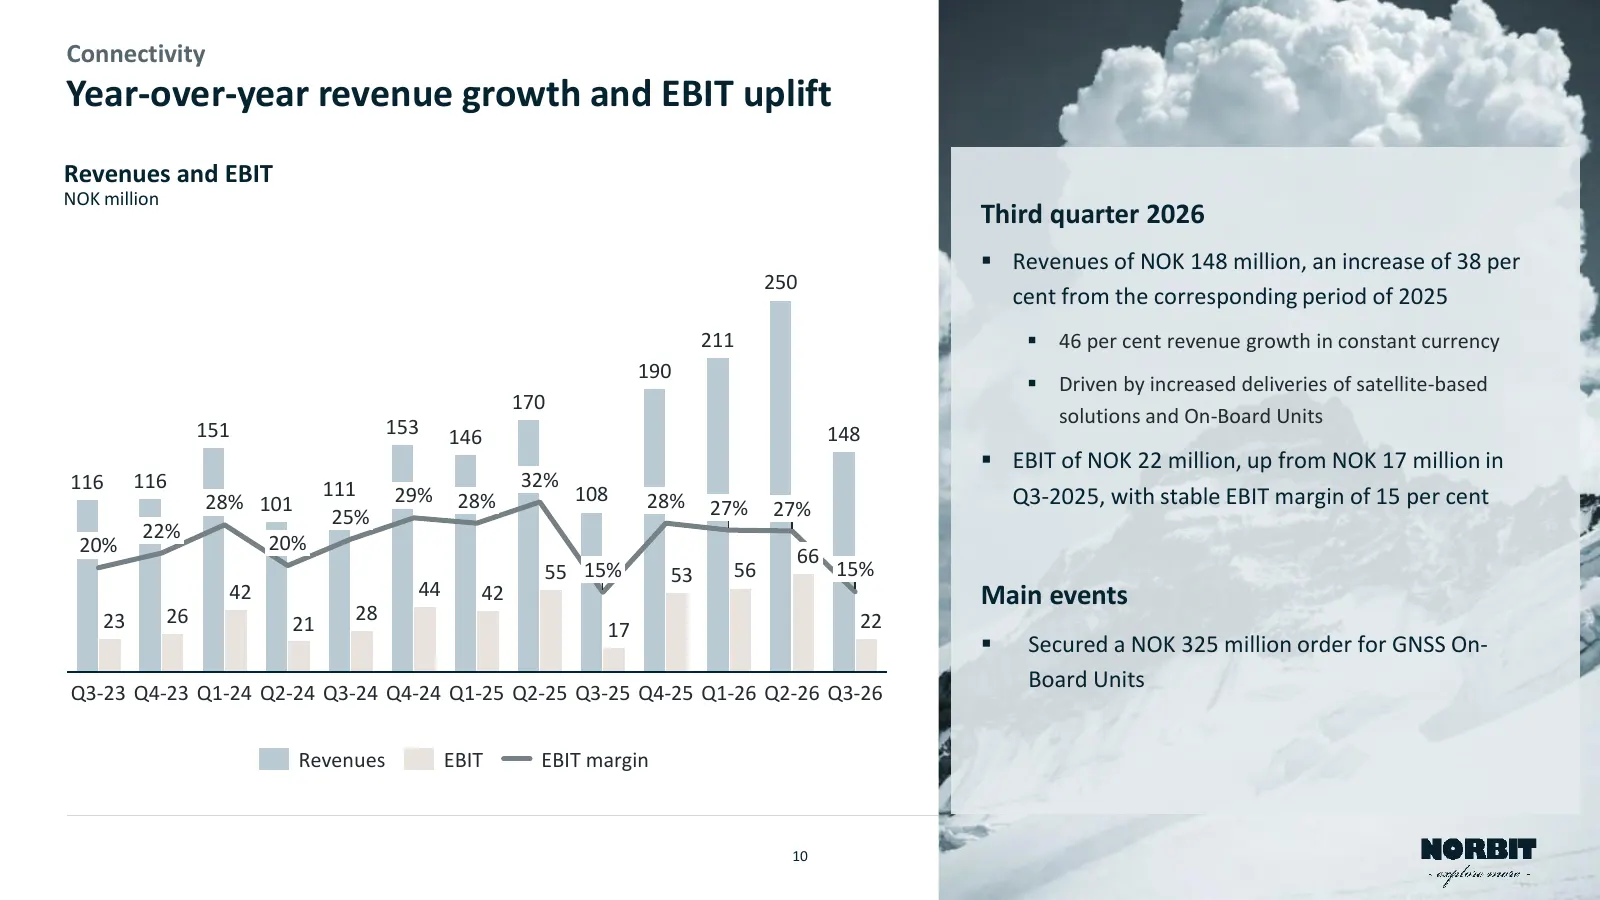
Connectivity Year-over-year revenue growth and EBIT uplift Revenues and EBIT NOK million Third quarter 2026 ▪ Revenues of NOK 148 million, an increase of 38 per 250 cent from the corresponding period of 2025 211 ▪ 46 per cent revenue growth in constant currency 190 ▪ Driven by increased deliveries o
Slide 11: Growth primarily driven by satellite-based tolling
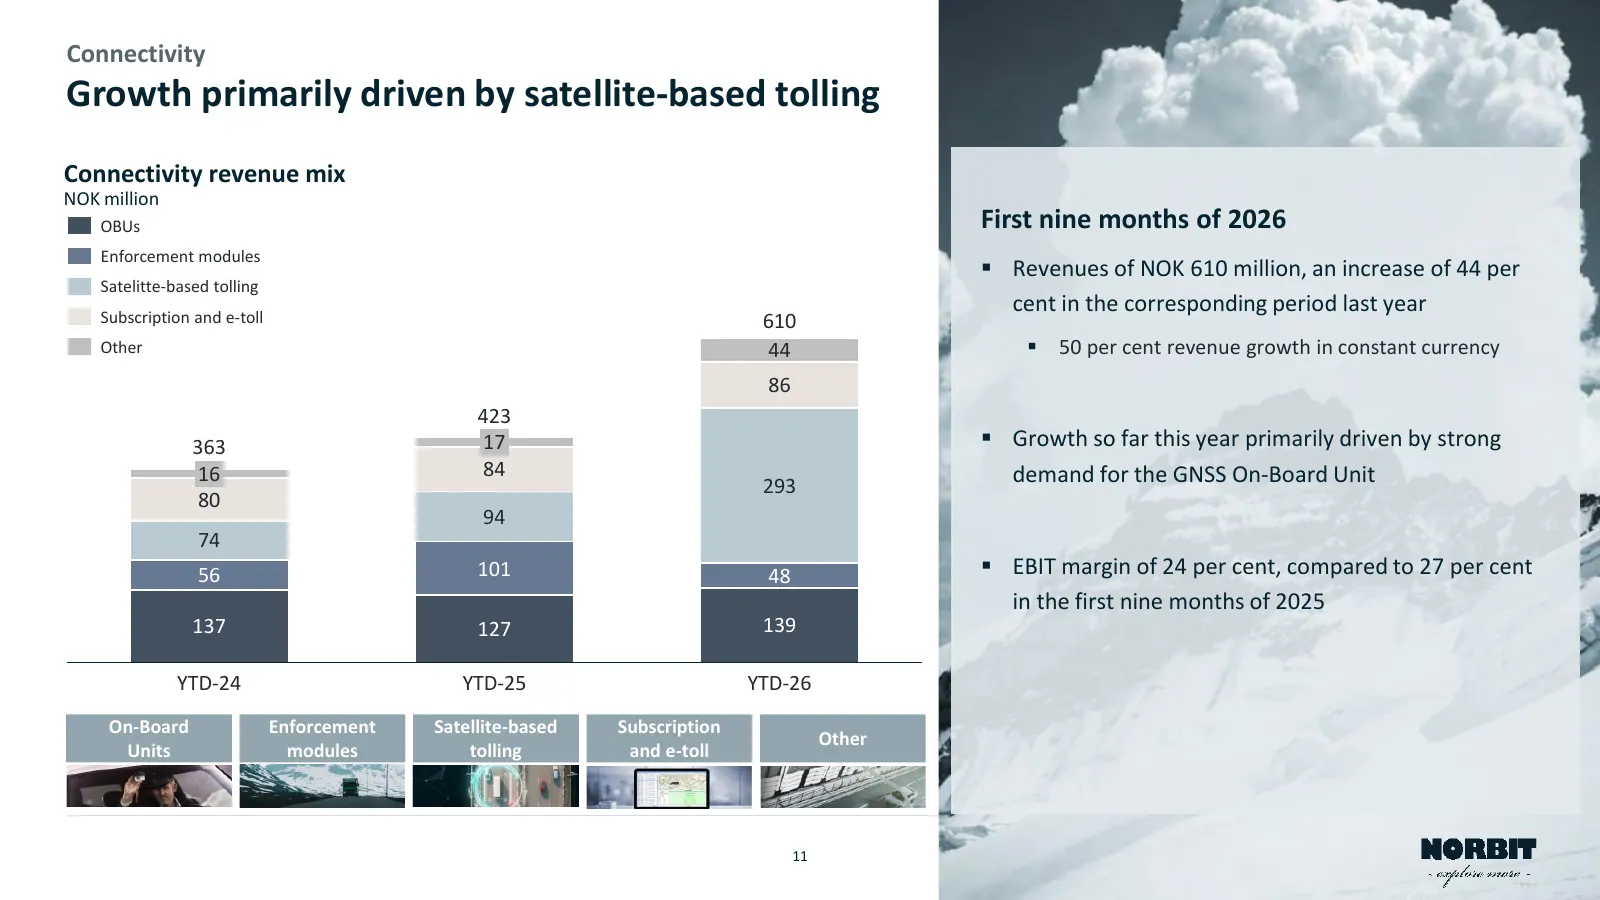
Connectivity Growth primarily driven by satellite-based tolling Connectivity revenue mix NOK million OBUs First nine months of 2026 Enforcement modules ▪ Revenues of NOK 610 million, an increase of 44 per Satelitte-based tolling Subscription and e-toll cent in the corresponding period last year 610
Slide 12: Secured order for GNSS On-Board Units
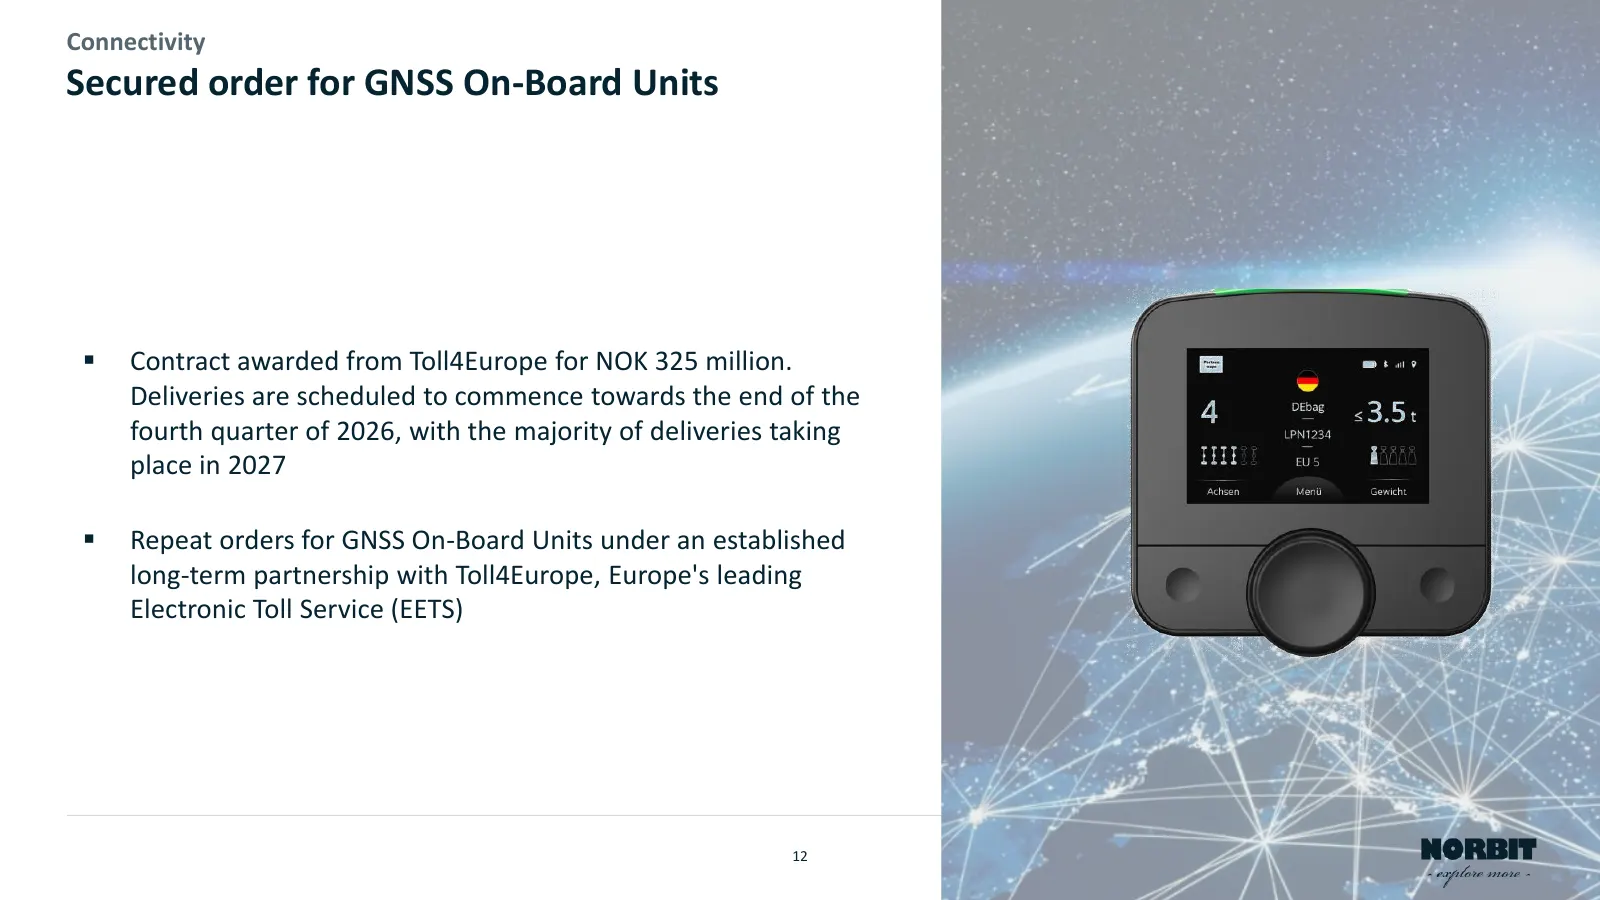
Connectivity Secured order for GNSS On-Board Units ▪ Contract awarded from Toll4Europe for NOK 325 million. Deliveries are scheduled to commence towards the end of the fourth quarter of 2026, with the majority of deliveries taking place in 2027 ▪ Repeat orders for GNSS On-Board Units under an establ
Slide 13: Product Innovation & Realization
Slide 14: Solid performance by PIR in the quarter
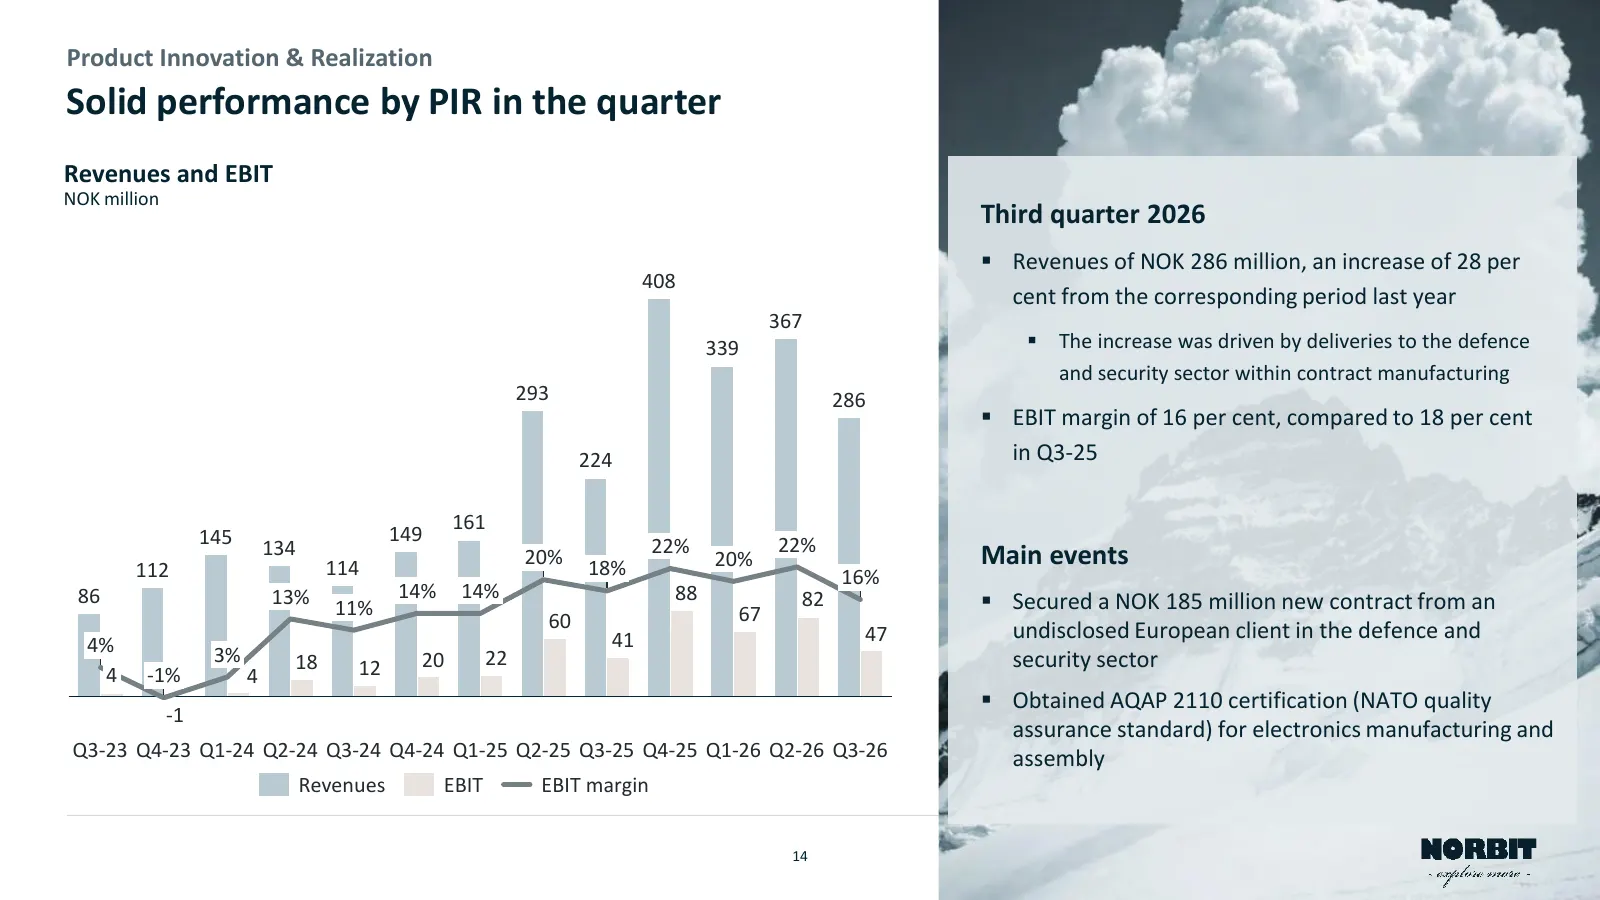
Product Innovation & Realization Solid performance by PIR in the quarter Revenues and EBIT NOK million Third quarter 2026 ▪ Revenues of NOK 286 million, an increase of 28 per 408 cent from the corresponding period last year 367 339 ▪ The increase was driven by deliveries to the defence and security
Slide 15: Continued solid demand from defence and security
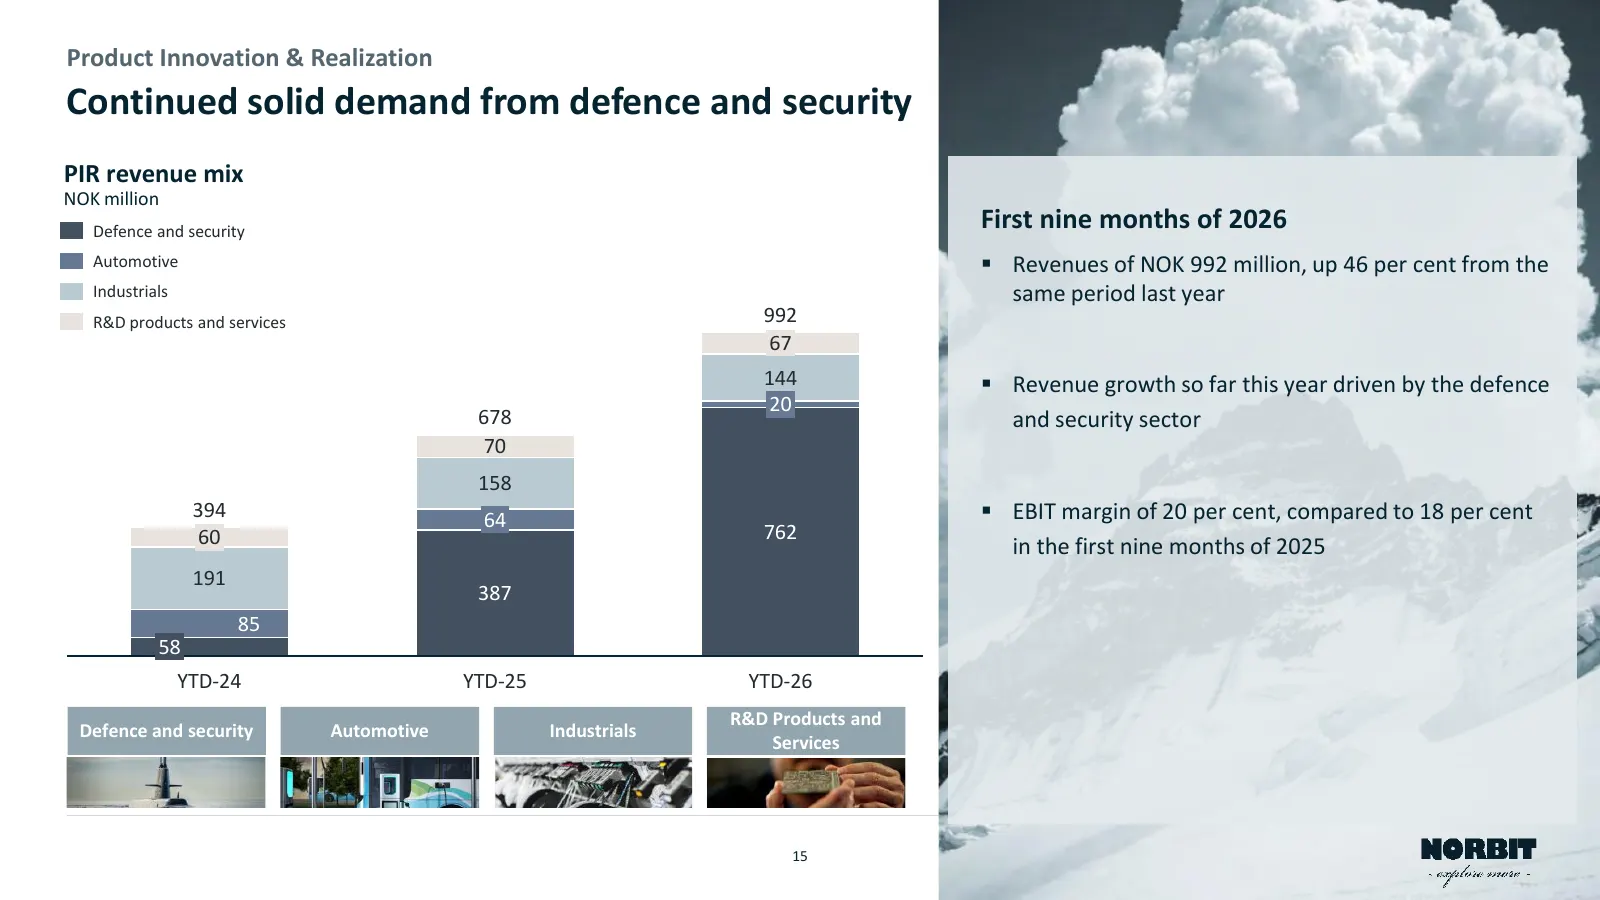
Product Innovation & Realization Continued solid demand from defence and security PIR revenue mix NOK million Defence and security First nine months of 2026 Automotive ▪ Revenues of NOK 992 million, up 46 per cent from the Industrials same period last year R&D products and services 992 67 144 ▪ Reve
Slide 16: New order within defence and security
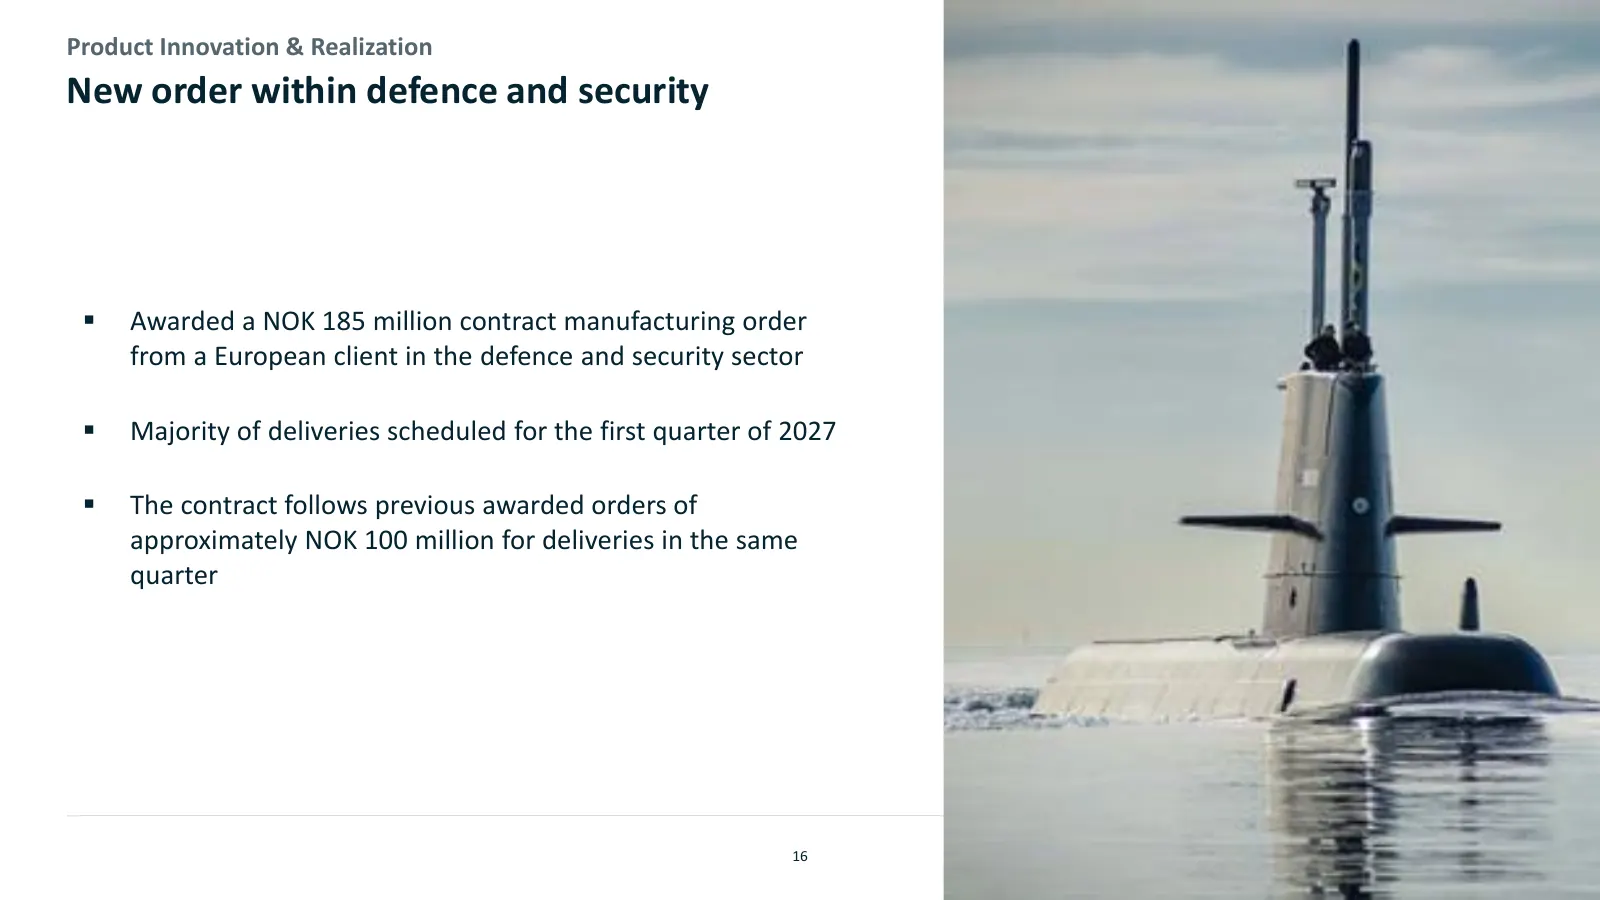
Product Innovation & Realization New order within defence and security ▪ Awarded a NOK 185 million contract manufacturing order from a European client in the defence and security sector ▪ Majority of deliveries scheduled for the first quarter of 2027 ▪ The contract follows previous awarded orders of

Slide 17: Group financials
Group financials
Slide 18: Improved year-over-year performance in a seasonally slower quarter
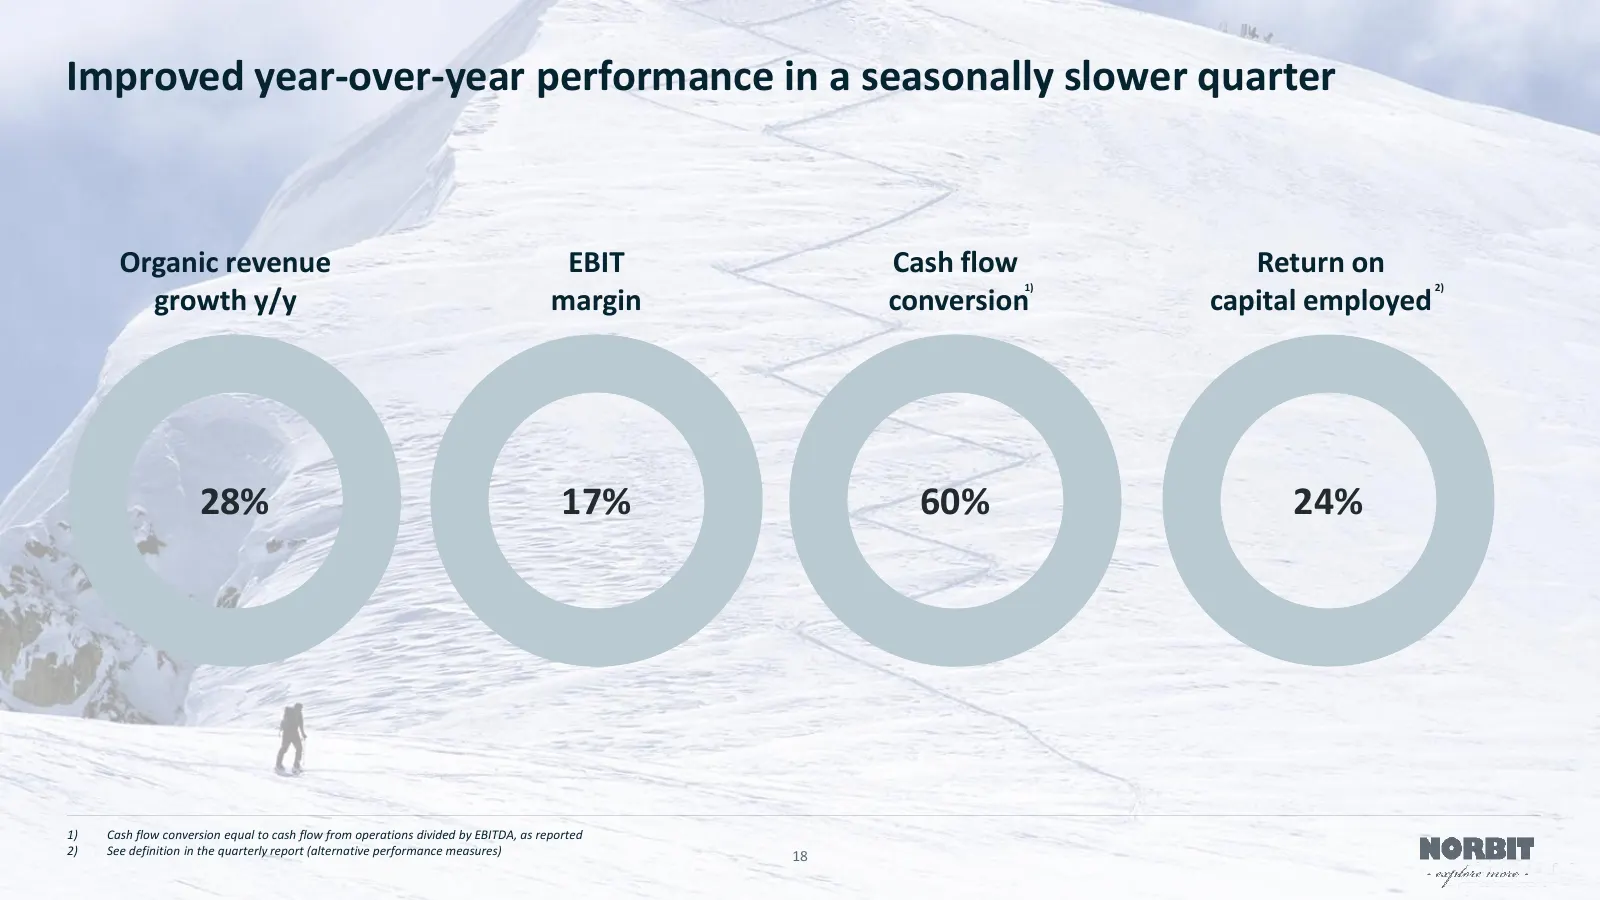
Improved year-over-year performance in a seasonally slower quarter Organic revenue EBIT Cash flow Return on 1) 2) growth y/y margin conversion capital employed 28% 17% 60% 24% 1) Cash flow conversion equal to cash flow from operations divided by EBITDA, as reported 2) See definition in the quarterly
Slide 19: Profit and loss statement
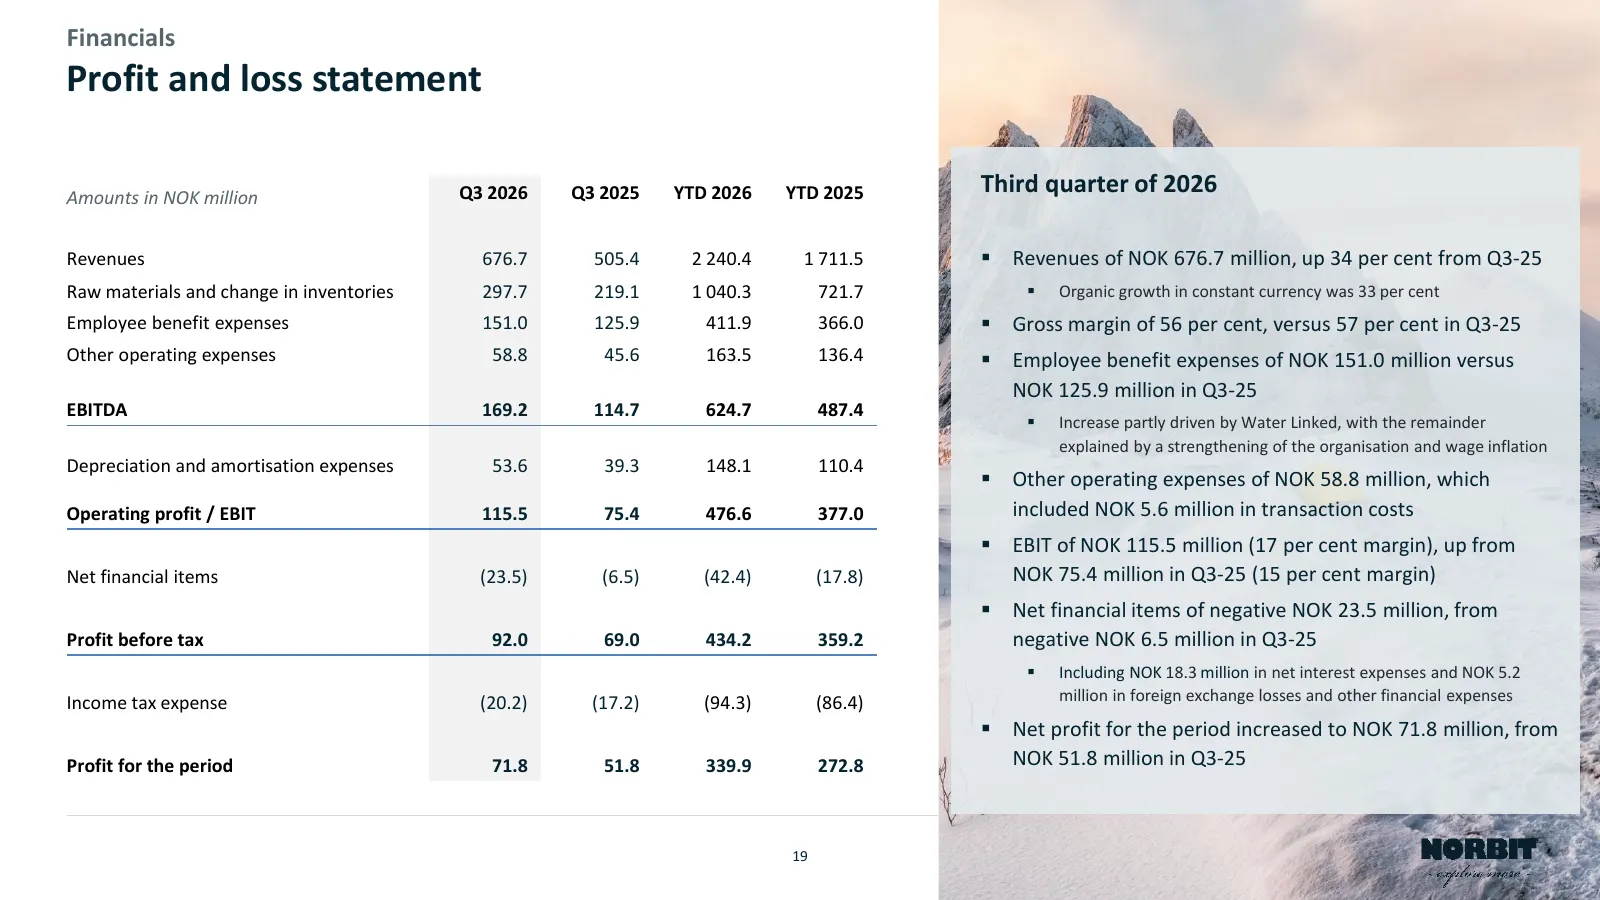
Financials Profit and loss statement Amounts in NOK million Q3 2026 Q3 2025 YTD 2026 YTD 2025 Third quarter of 2026 Revenues 676.7 505.4 2 240.4 1 711.5 ▪ Revenues of NOK 676.7 million, up 34 per cent from Q3-25 Raw materials and change in inventories 297.7 219.1 1 040.3 721.7 ▪ Organic growth in co
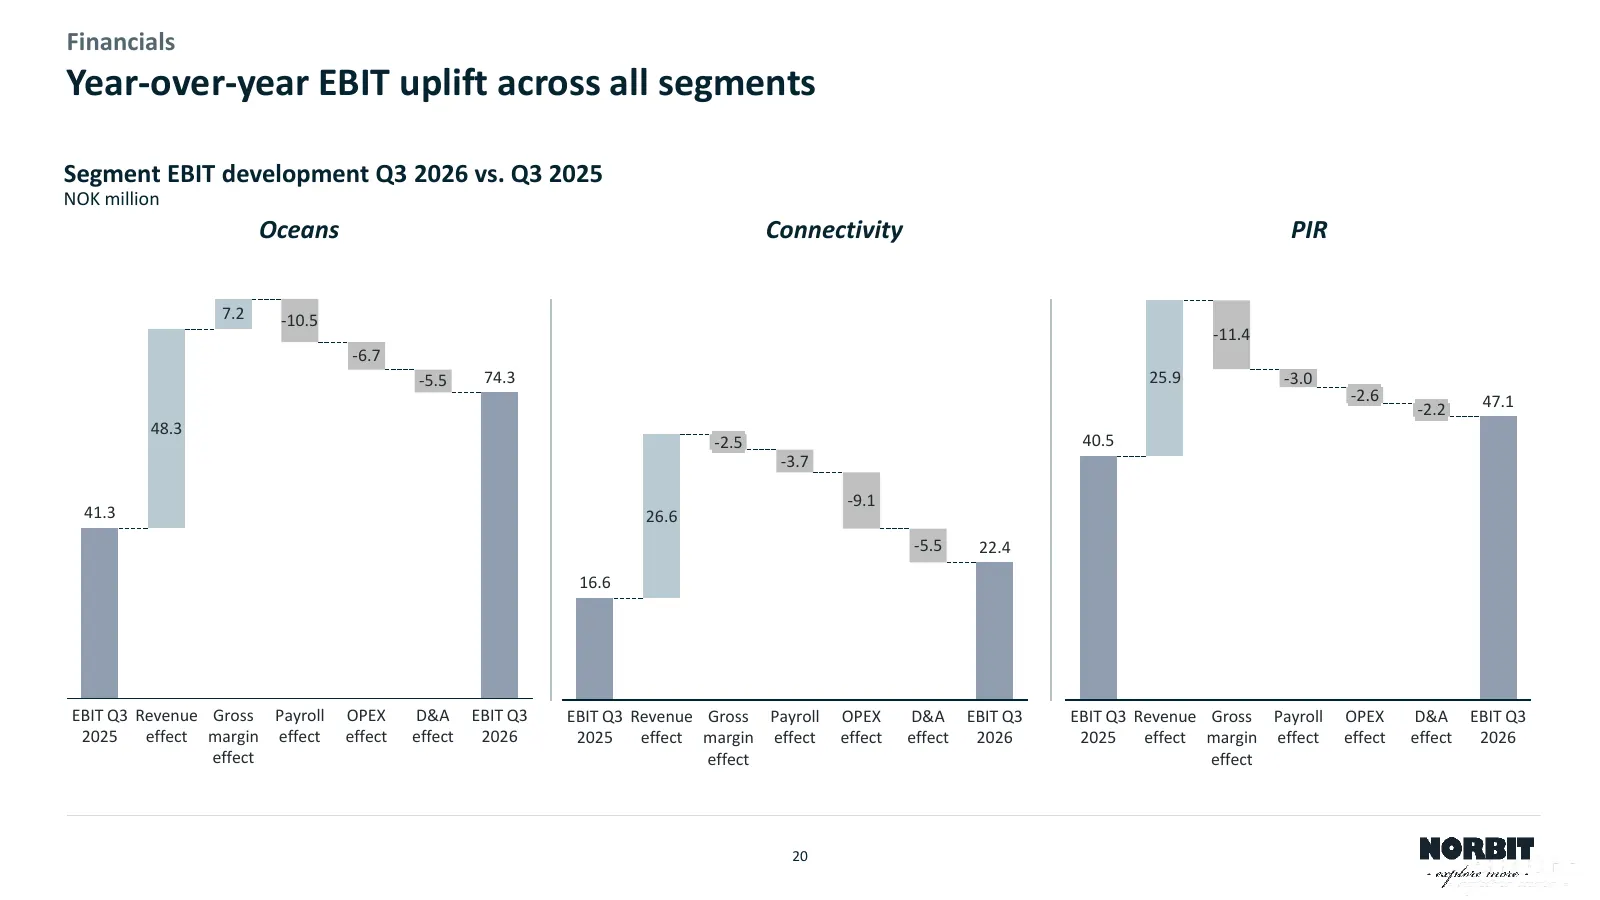
Slide 20: Year-over-year EBIT uplift across all segments
Financials Year-over-year EBIT uplift across all segments Segment EBIT development Q3 2026 vs. Q3 2025 NOK million Oceans Connectivity PIR 7.2 -10.5 -11.4 -6.7 -5.5 74.3 25.9 -3.0 -2.6 47.1 -2.2 48.3 -2.5 40.5 -3.7 -9.1 41.3 26.6 -5.5 22.4 16.6 EBIT Q3 Revenue Gross Payroll OPEX D&A EBIT Q3 EBIT Q3
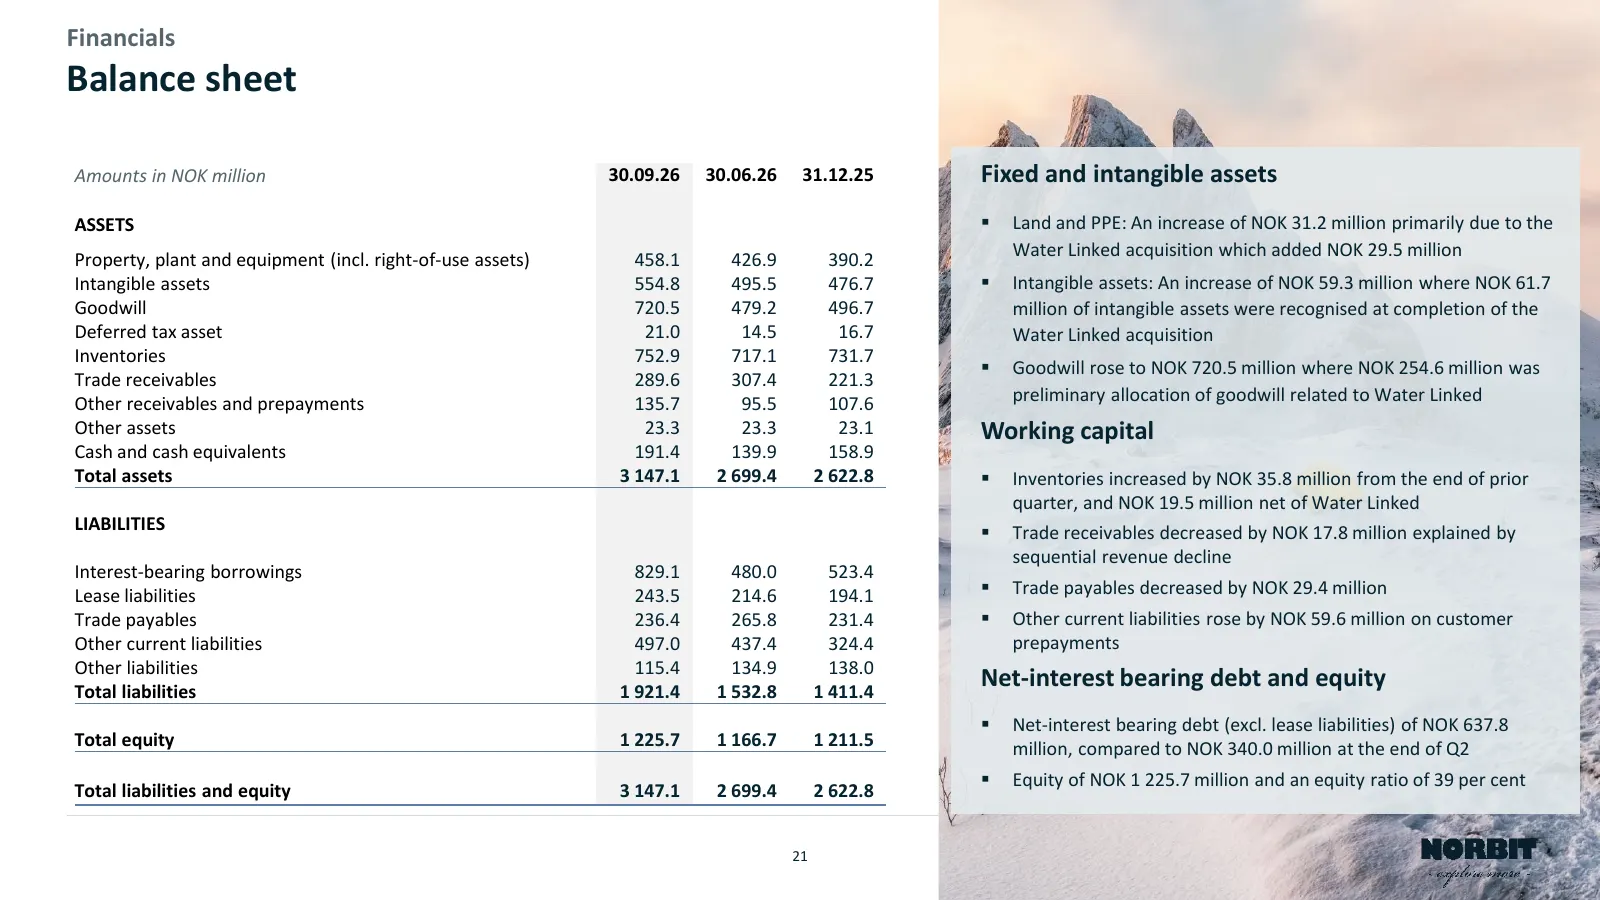
Slide 21: Balance sheet
Financials Balance sheet Amounts in NOK million 30.09.26 30.06.26 31.12.25 Fixed and intangible assets ASSETS ▪ Land and PPE: An increase of NOK 31.2 million primarily due to the Water Linked acquisition which added NOK 29.5 million Property, plant and equipment (incl. right-of-use assets) 458.1 426
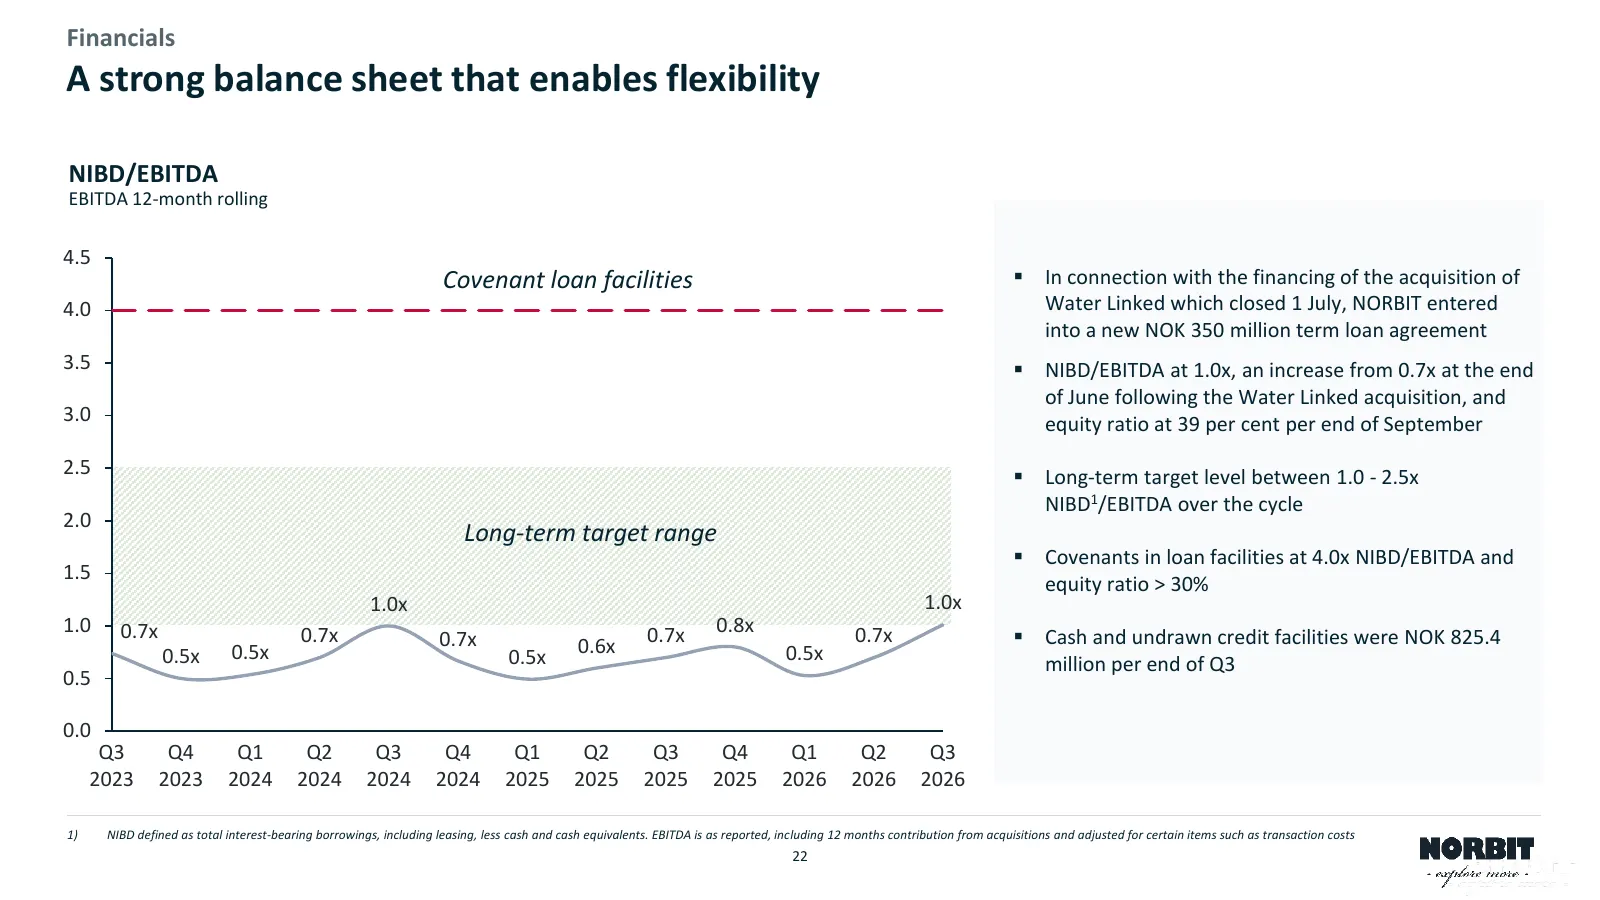
Slide 22: A strong balance sheet that enables flexibility
Financials A strong balance sheet that enables flexibility NIBD/EBITDA EBITDA 12-month rolling 4.5 Covenant loan facilities ▪ In connection with the financing of the acquisition of 4.0 Water Linked which closed 1 July, NORBIT entered into a new NOK 350 million term loan agreement 3.5 ▪ NIBD/EBITDA a
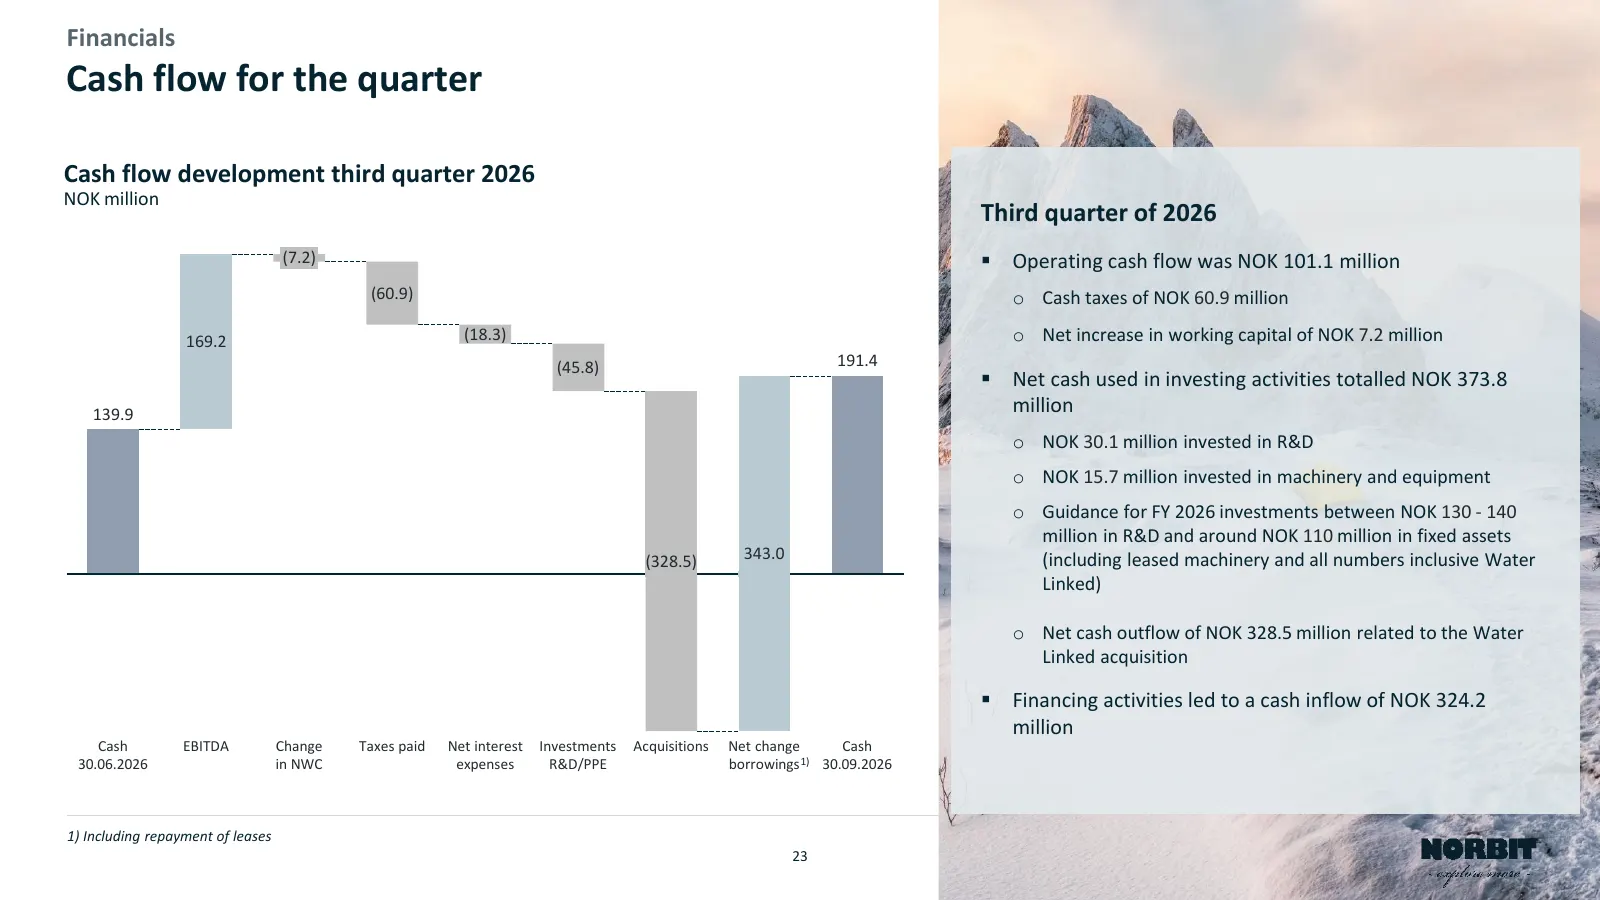
Slide 23: Cash flow for the quarter
Financials Cash flow for the quarter Cash flow development third quarter 2026 NOK million Third quarter of 2026 (7.2) ▪ Operating cash flow was NOK 101.1 million (60.9) o Cash taxes of NOK 60.9 million 169.2 (18.3) o Net increase in working capital of NOK 7.2 million (45.8) 191.4 ▪ Net cash used in

Slide 24: Outlook
Outlook
Slide 25: 2026 outlook
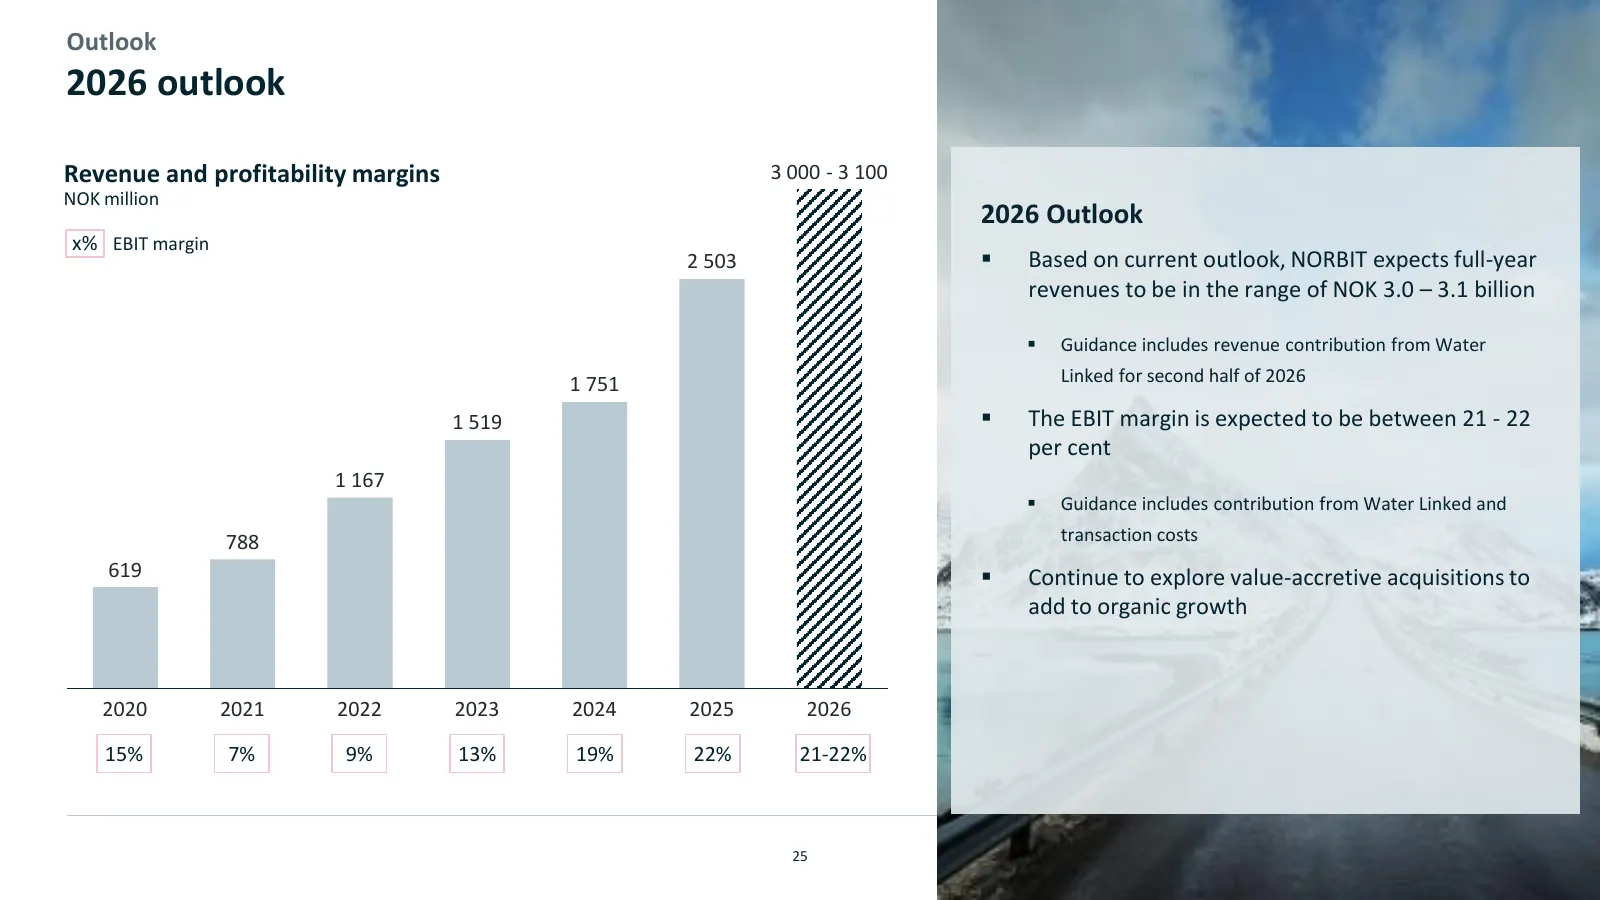
Outlook 2026 outlook Revenue and profitability margins 3 000 - 3 100 NOK million 2026 Outlook x% EBIT margin 2 503 ▪ Based on current outlook, NORBIT expects full-year revenues to be in the range of NOK 3.0 – 3.1 billion ▪ Guidance includes revenue contribution from Water 1 751 Linked for second hal
Slide 26: Short-term outlook
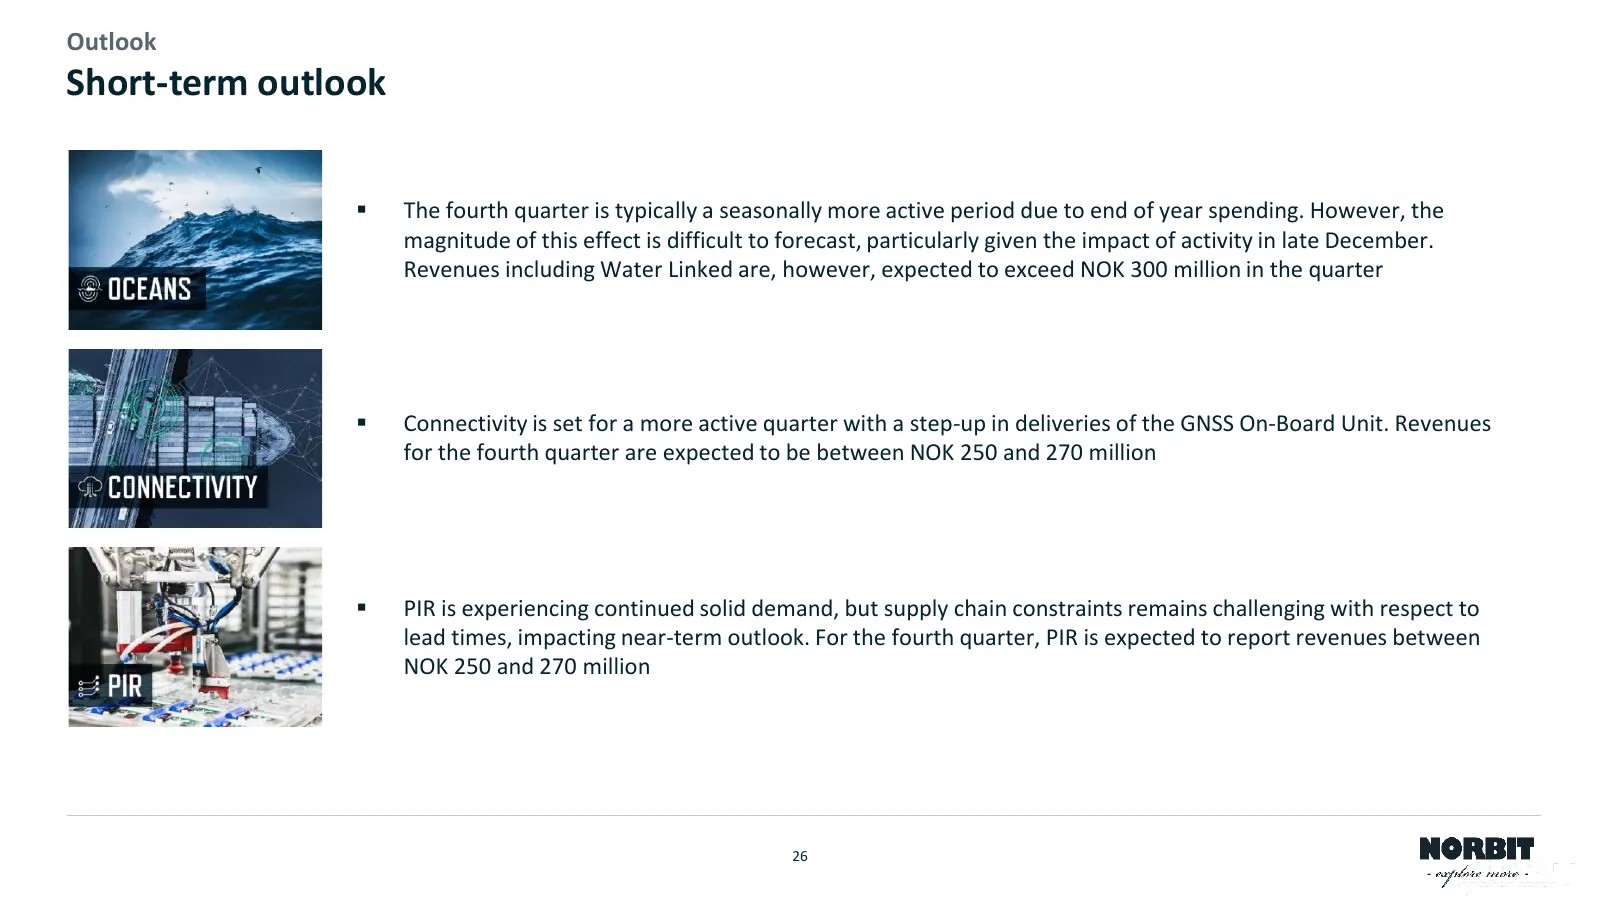
Outlook Short-term outlook ▪ The fourth quarter is typically a seasonally more active period due to end of year spending. However, the magnitude of this effect is difficult to forecast, particularly given the impact of activity in late December. Revenues including Water Linked are, however, expected
Slide 27: Technology is part of the solution
TECHNOLOGY IS PART OF THE SOLUTION: - explore re
Slide 28: NORBIT is to be recognised as world class, enabling people to explore more
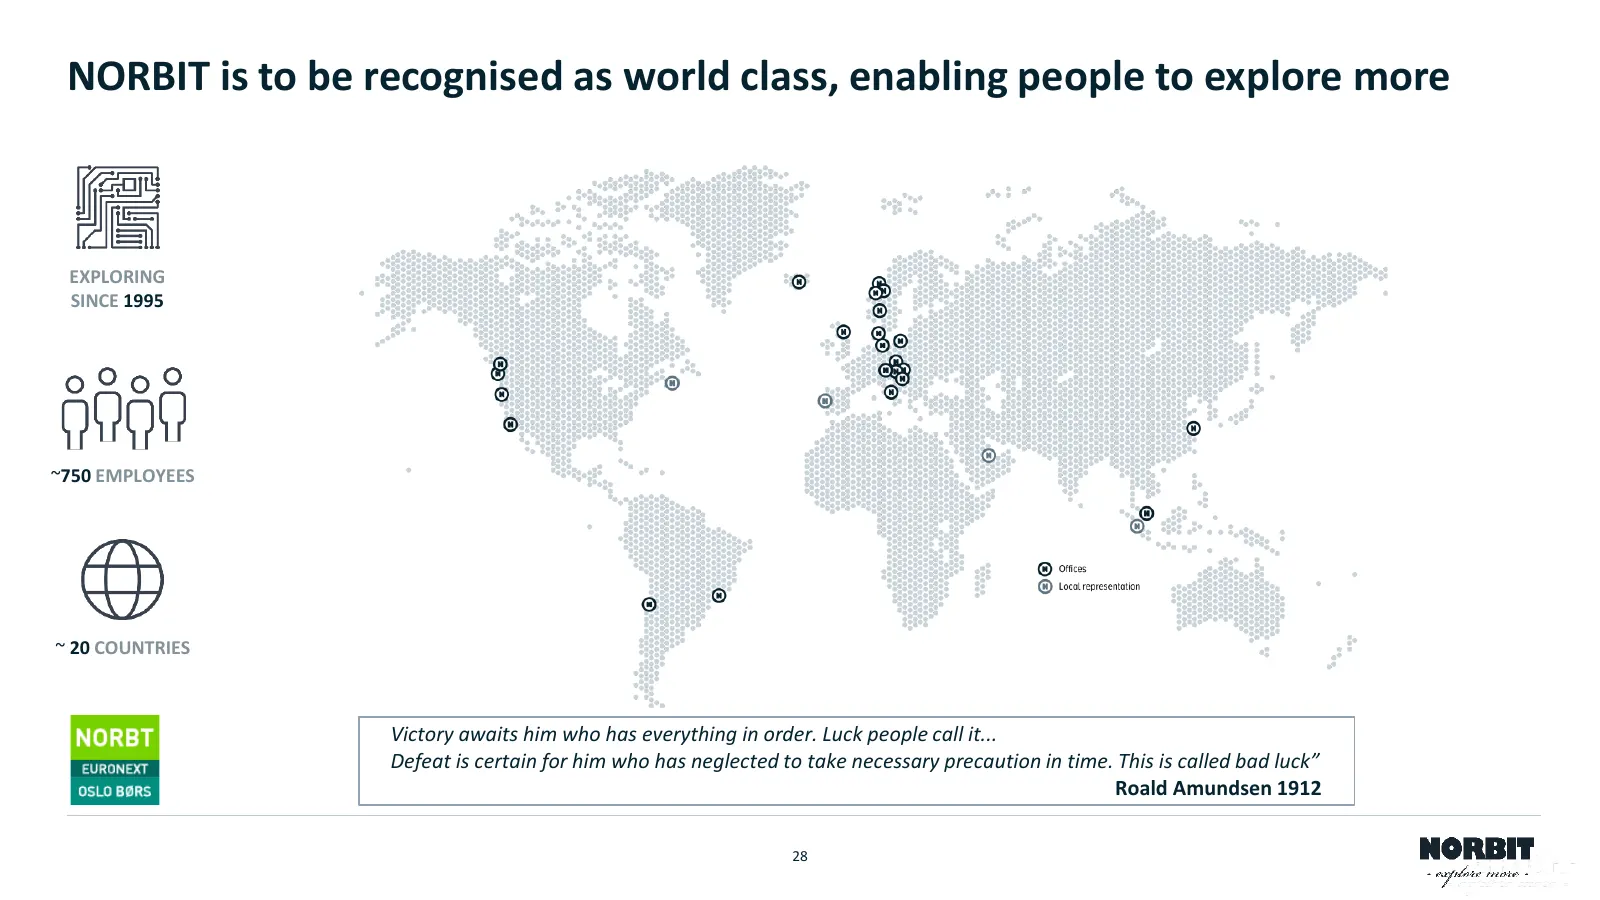
NORBIT is to be recognised as world class, enabling people to explore more EXPLORING SINCE 1995 ~750 EMPLOYEES ~ 20 COUNTRIES Victory awaits him who has everything in order. Luck people call it... Defeat is certain for him who has neglected to take necessary precaution in time. This is called bad lu
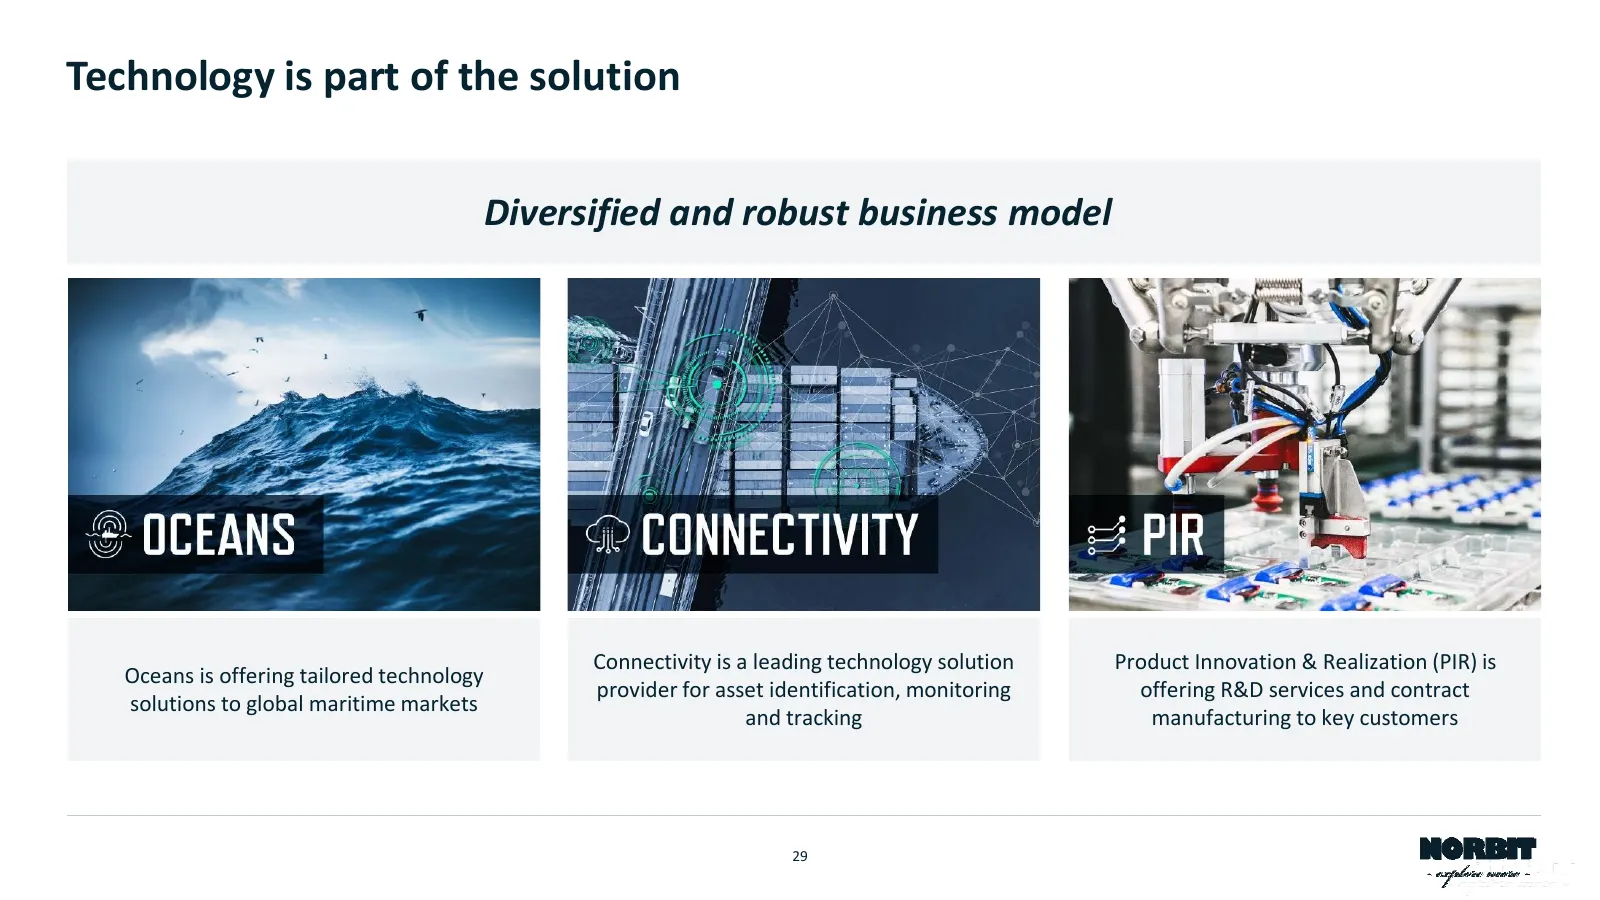
Slide 29: Technology is part of the solution
Technology is part of the solution Diversified and robust business model Connectivity is a leading technology solution Product Innovation & Realization (PIR) is Oceans is offering tailored technology provider for asset identification, monitoring offering R&D services and contract solutions to global
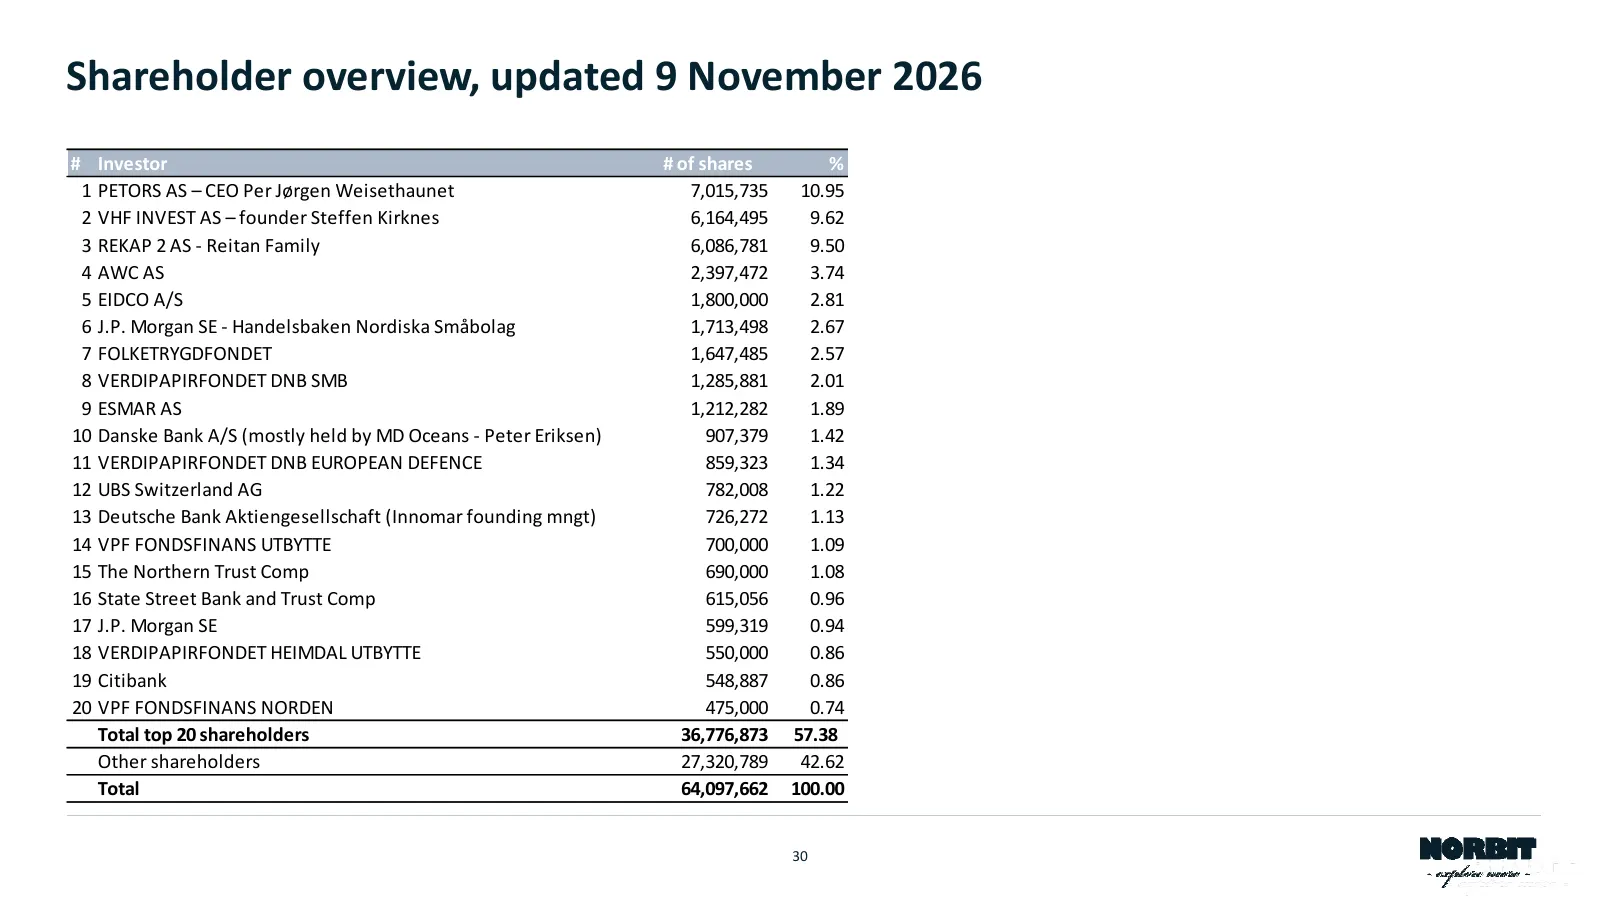
Slide 30: Shareholder overview, updated November 2026
Shareholder overview, updated 9 November 2026 # Investor # of shares % 1 PETORS AS – CEO Per Jørgen Weisethaunet 7,015,735 10.95 2 VHF INVEST AS – founder Steffen Kirknes 6,164,495 9.62 3 REKAP 2 AS - Reitan Family 6,086,781 9.50 4 AWC AS 2,397,472 3.74 5 EIDCO A/S 1,800,000 2.81 6 J.P. Morgan SE -
Source: company website
More decks from Norbit ASA
 Q2 2026 Earnings Presentation59 slides · Aug 13, 2026
 Q1 2026 Earnings Presentation28 slides · May 13, 2026
 Q4 2025 Earnings Presentation32 slides · Feb 11, 2026
 Q3 2025 Earnings Presentation28 slides · Nov 13, 2025
 Q2 2025 Earnings Presentation26 slides · Aug 14, 2025
 Q1 2025 Earnings Presentation27 slides · May 14, 2025