Navistar International Corporation
Navistar International — Q4 2011 Earnings Presentation
57 slides from Navistar International's earnings presentation, Dec 20, 2011
Slide 1: 4th Quarter 2011 Earnings Presentation
Exhibit 99.2 4th Quarter 2011 Earnings Presentation December 20, 2011
Slide 2: Safe Harbor Statement
Safe Harbor Statement Information provided and statements contained in this presentation that are not purely historical are forward-looking statements within the meaning of Section 27A of the Securities Act of 1933, as amended, Section 21E of the Securities Exchange Act of 1934, as amended, and the
Slide 3: Other Cautionary Notes
Other Cautionary Notes • The financial information herein contains audited and unaudited information and has been prepared by management in good faith and based on data currently available to the Company. • Certain Non-GAAP measures are used in this presentation to assist the reader in understanding
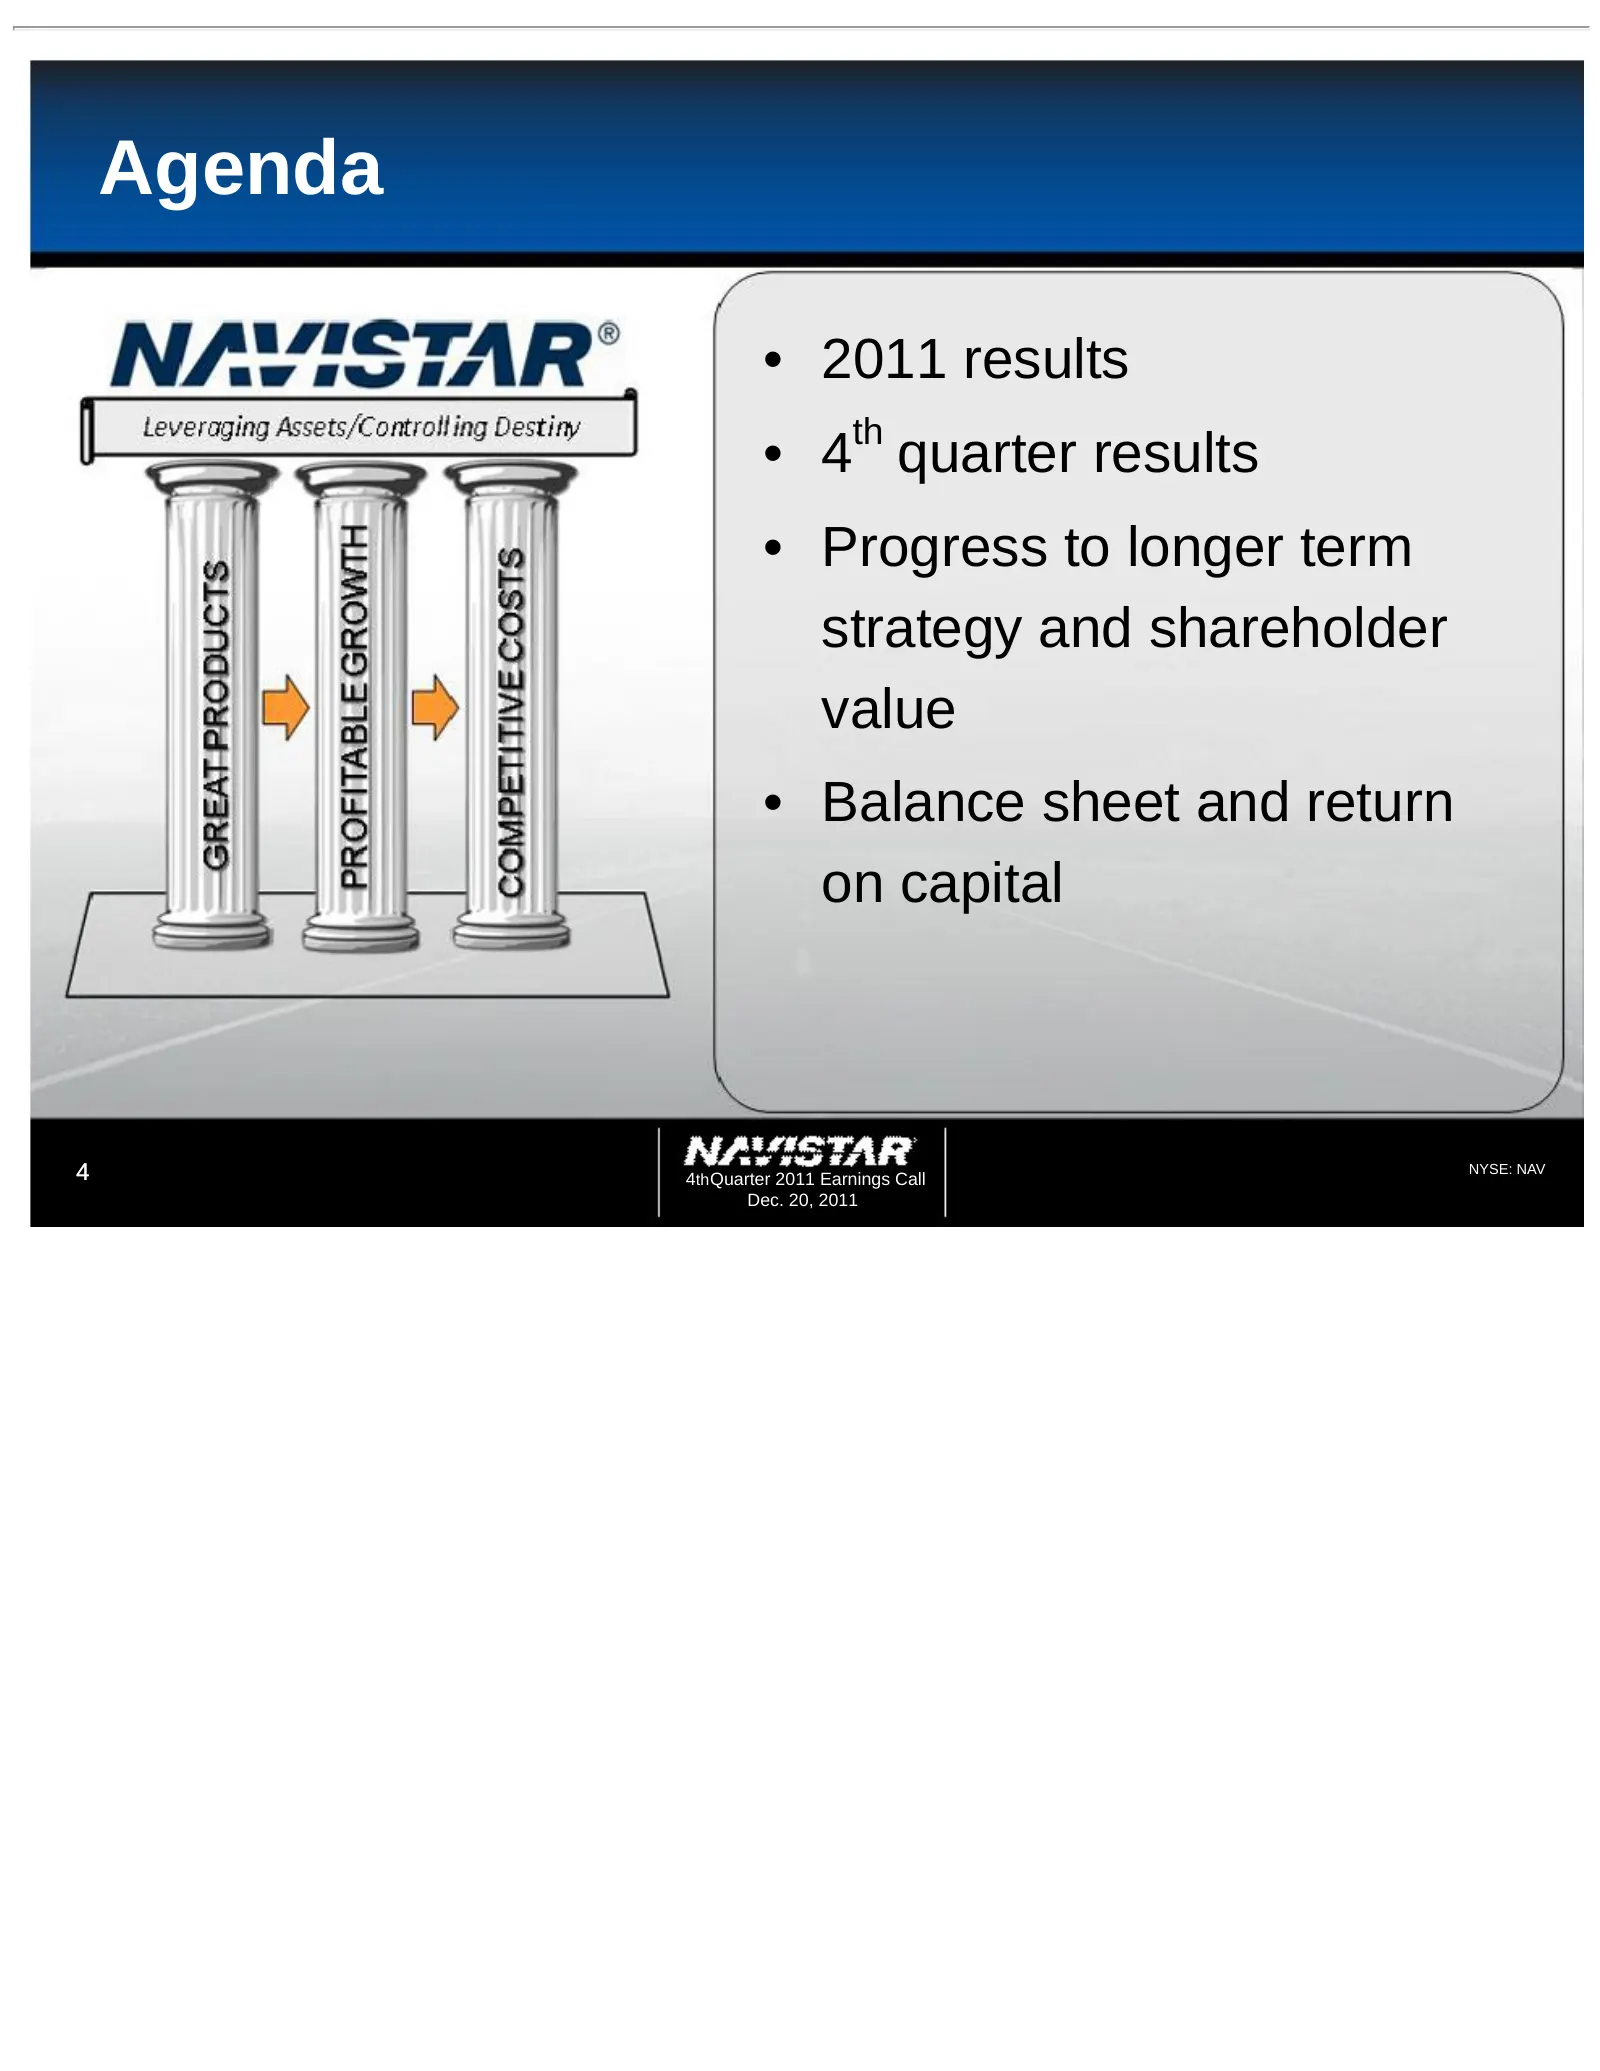
Slide 4: Agenda
Agenda • 2011 results • 4th quarter results • Progress to longer term strategy and shareholder value • Balance sheet and return on capital 4 4th Quarter 2011 Earnings Call NYSE: NAV Dec. 20, 2011
Slide 5: Actual Results vs. Guidance
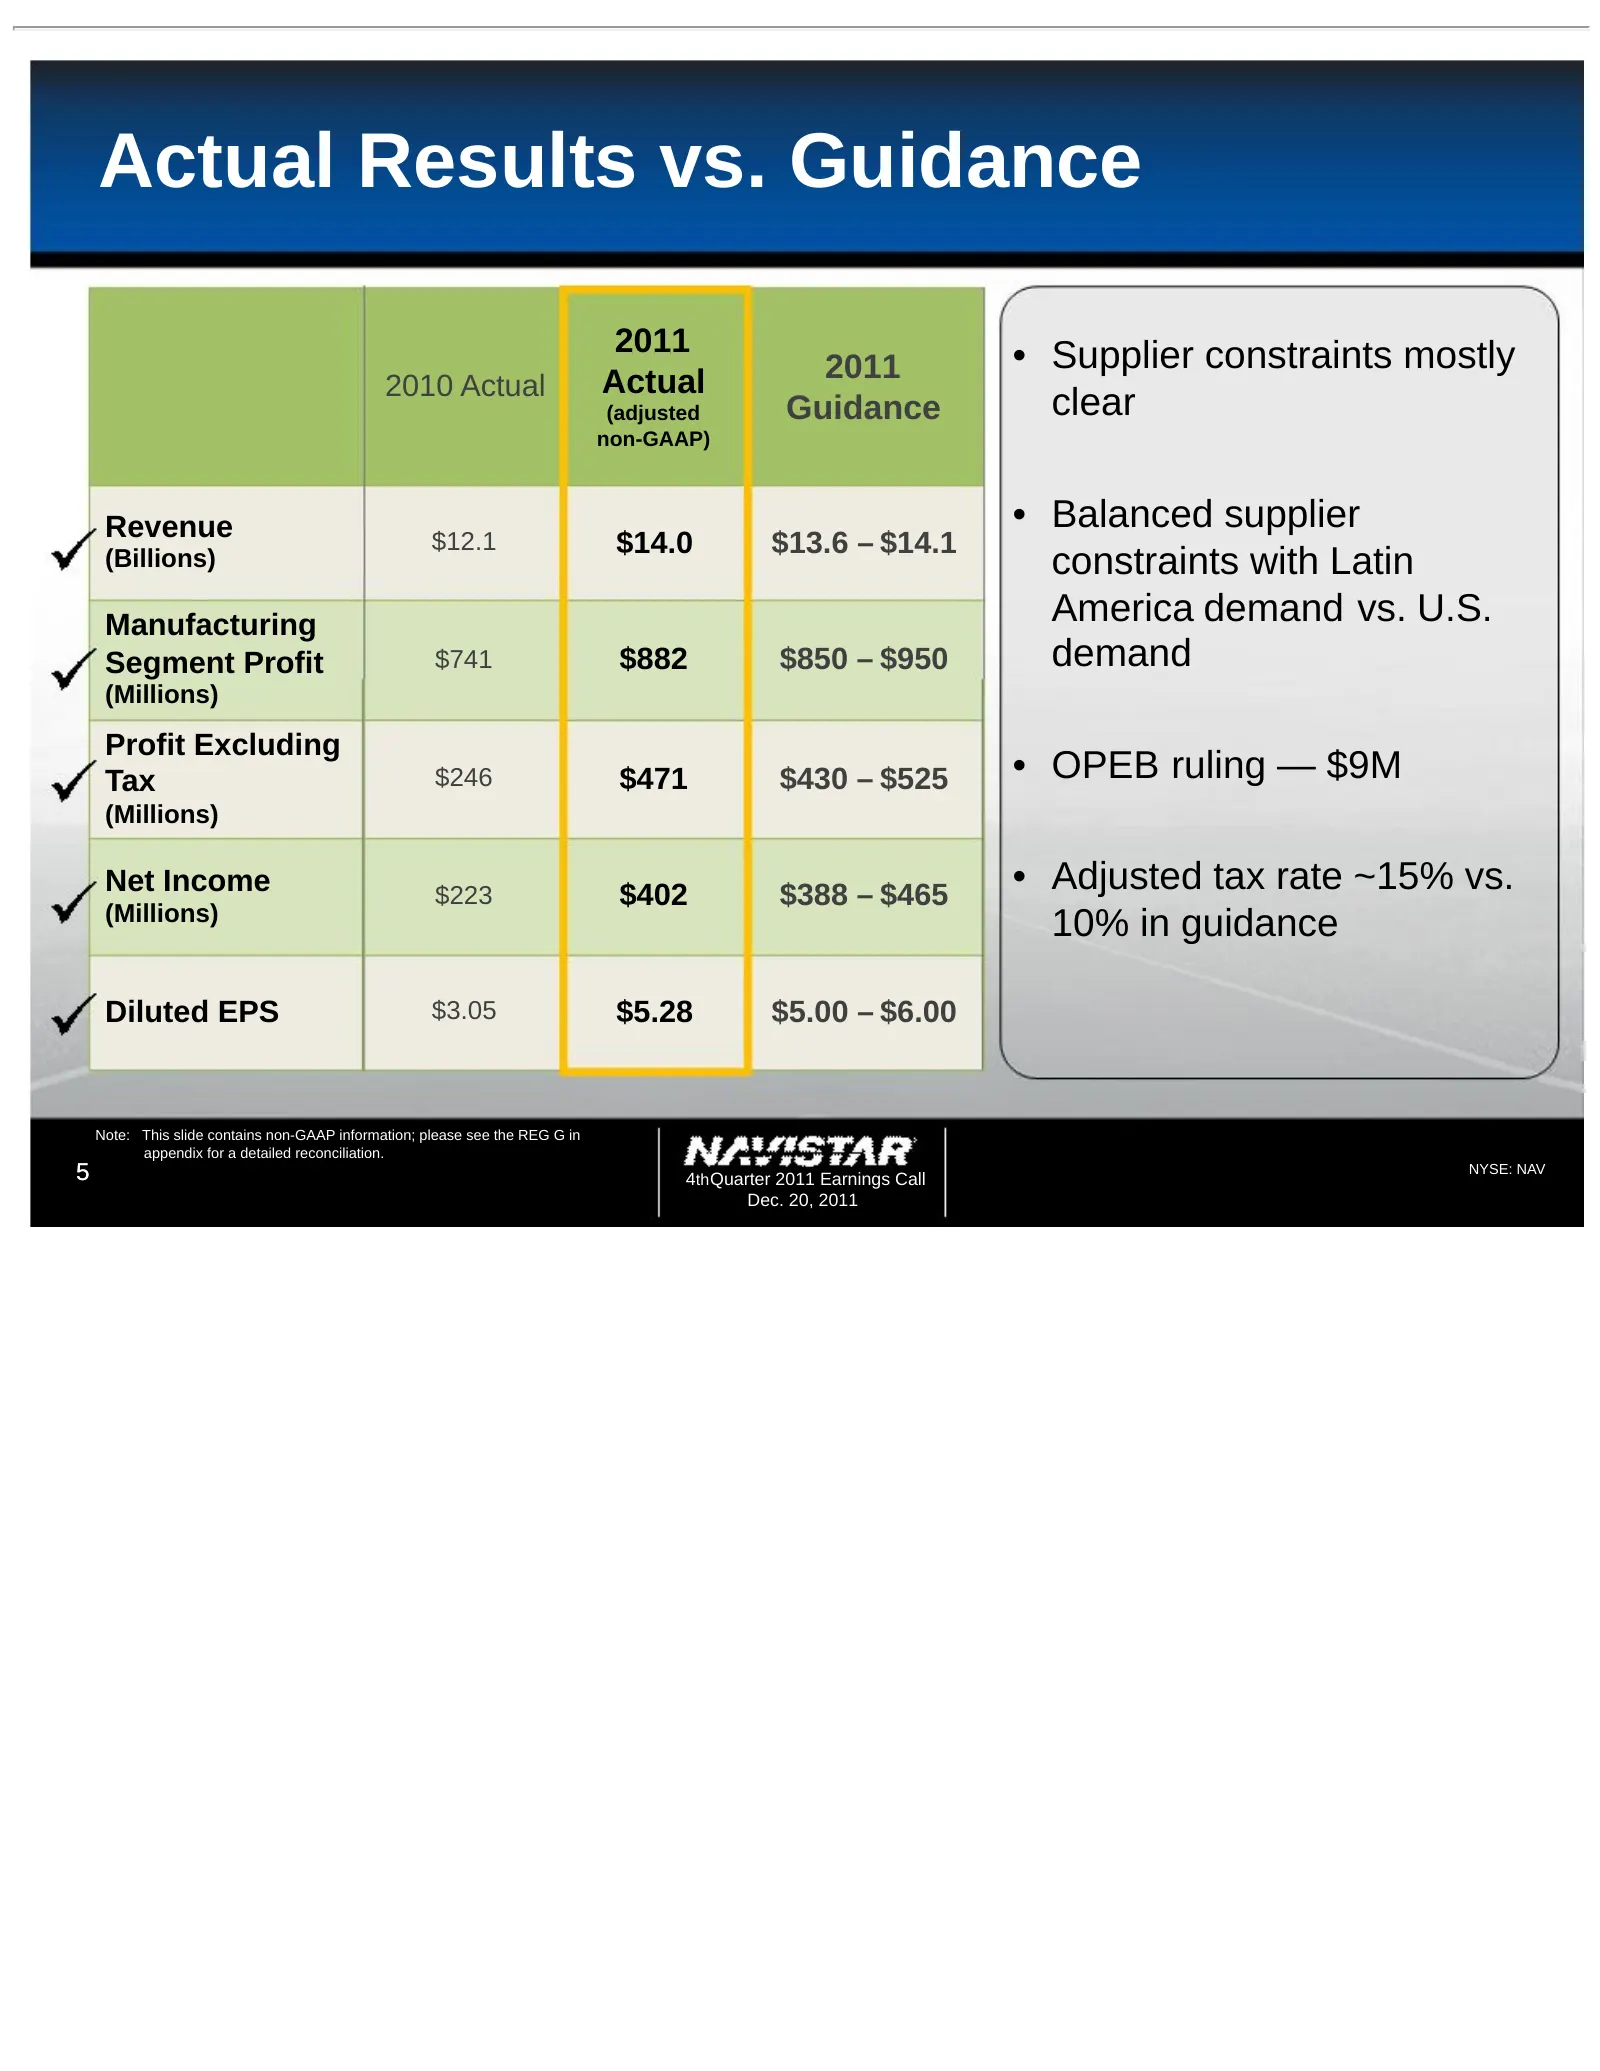
Actual Results vs. Guidance 2011 • Supplier constraints mostly Actual 2011 2010 Actual (adjusted Guidance clear non-GAAP) Revenue • Balanced supplier $12.1 $14.0 $13.6 – $14.1 (Billions) constraints with Latin Manufacturing America demand vs. U.S. Segment Profit $741 $882 $850 – $950 demand (Million
Slide 6: Revenue Growth and 2011 Highlights
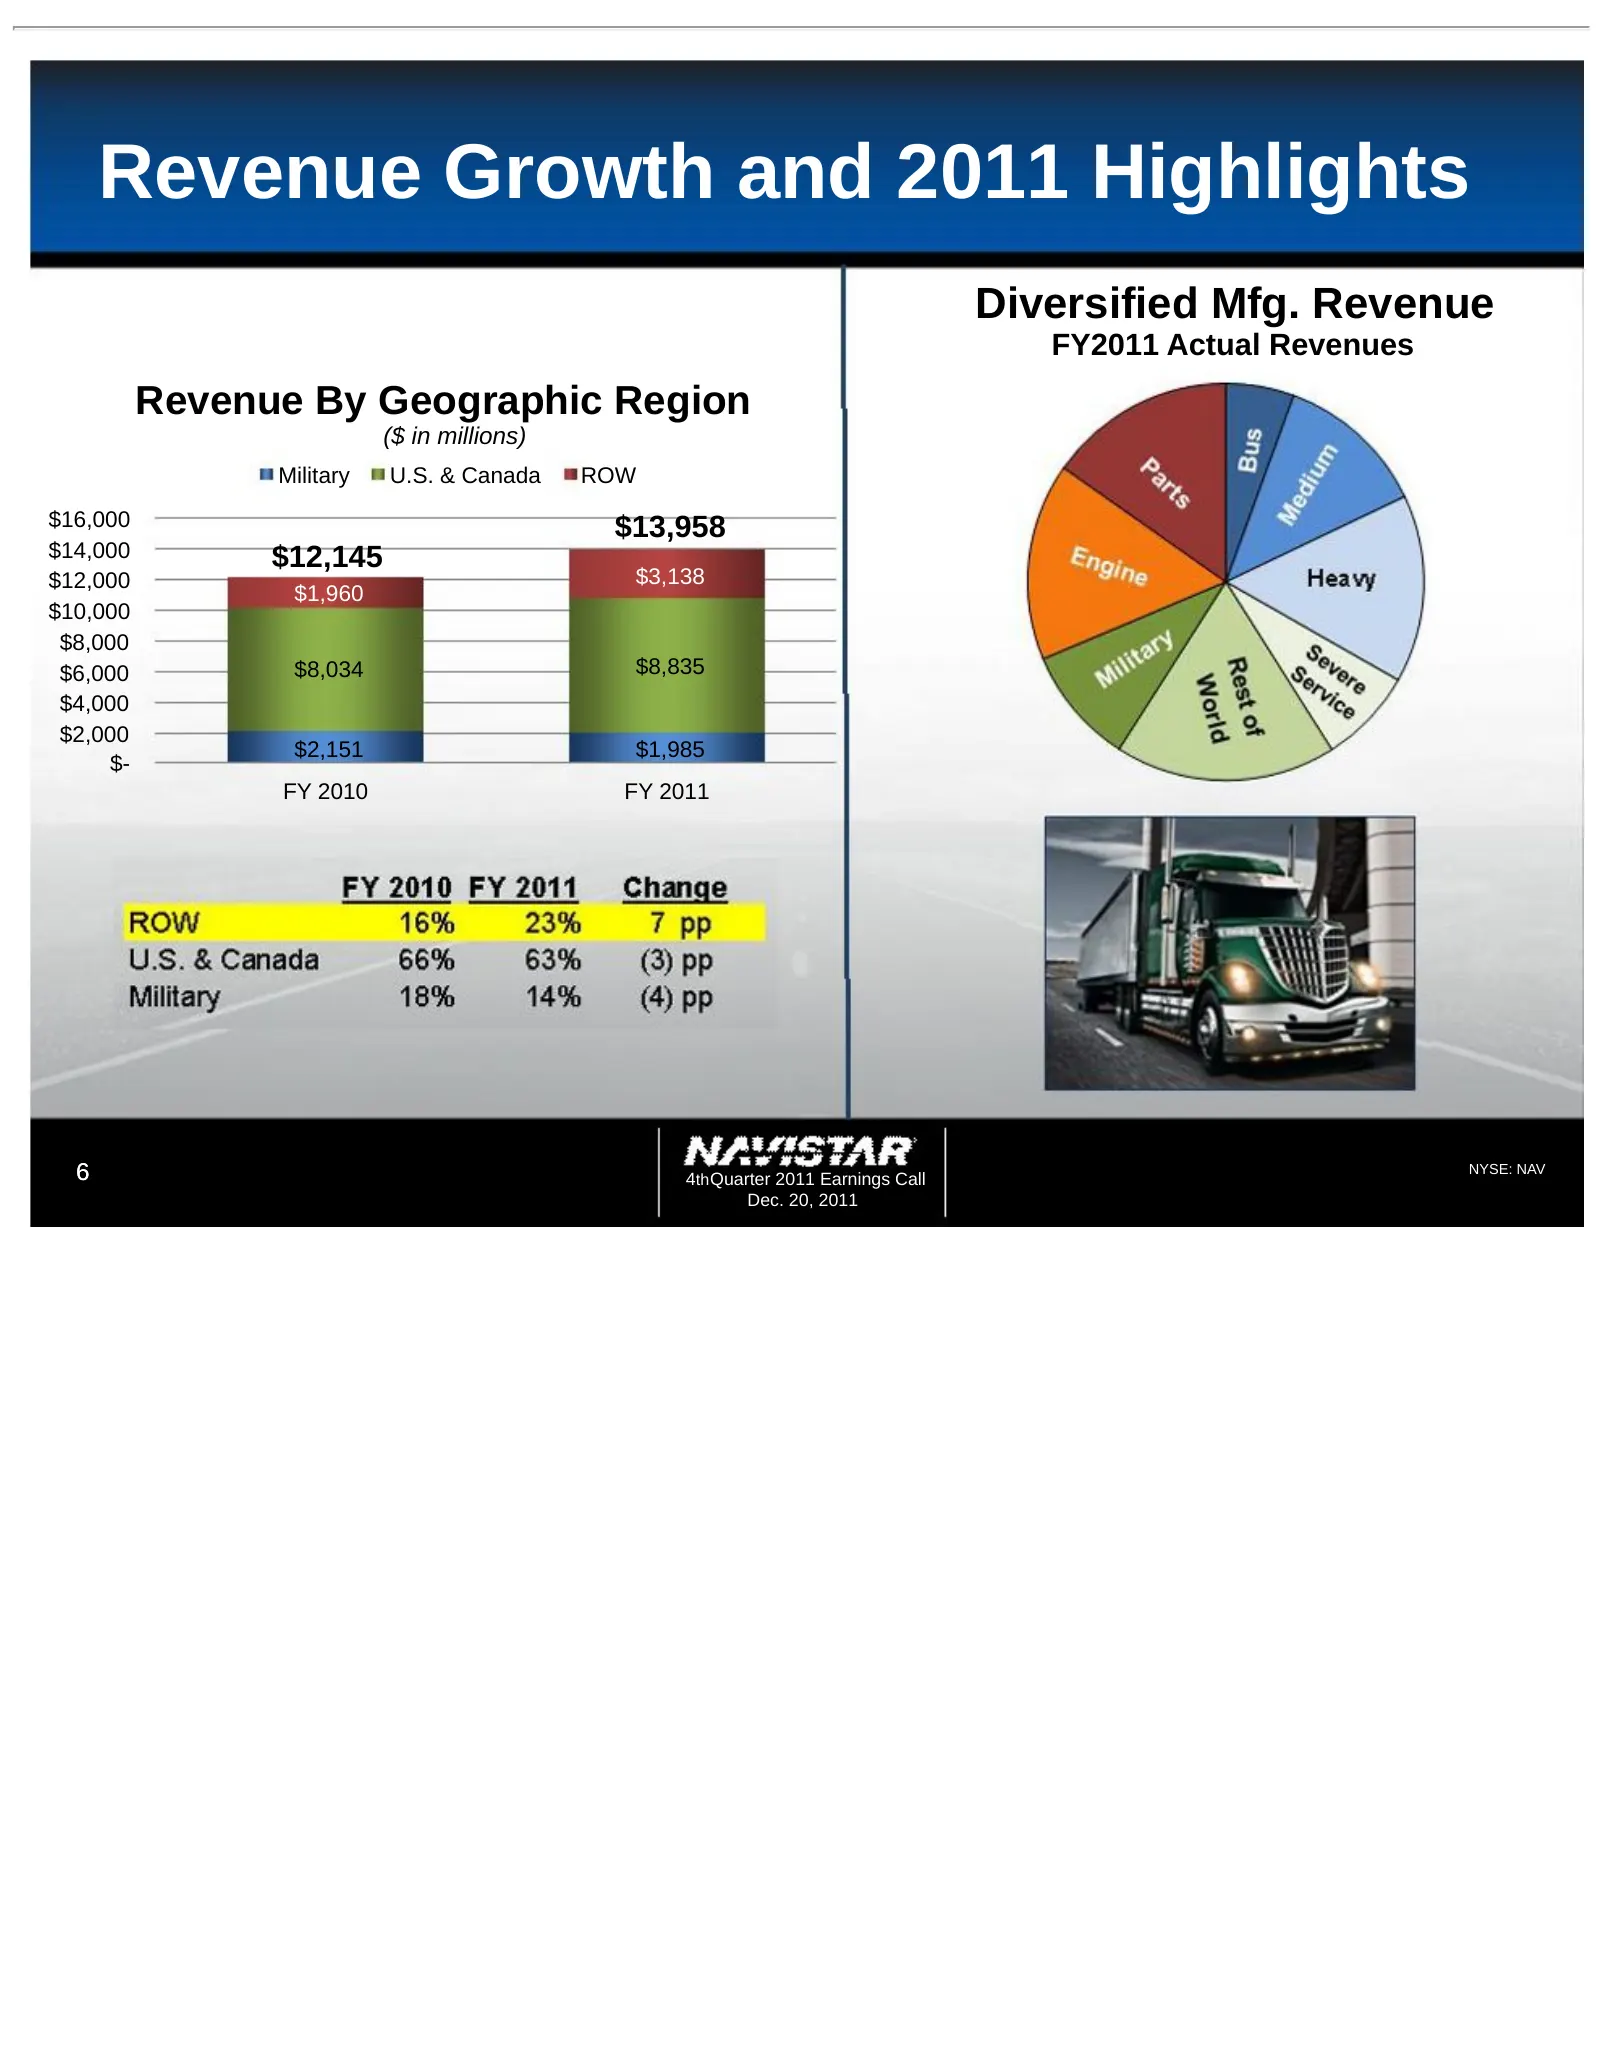
Revenue Growth and 2011 Highlights Diversified Mfg. Revenue FY2011 Actual Revenues Revenue By Geographic Region ($ in millions) Military U.S. & Canada ROW $16,000 $13,958 $14,000 $12,145 $12,000 $3,138 $1,960 $10,000 $8,000 $6,000 $8,034 $8,835 $4,000 $2,000 $2,151 $1,985 $- FY 2010 FY 2011 6 4th Qu
Slide 7: Q4 & Full Year Financial Information
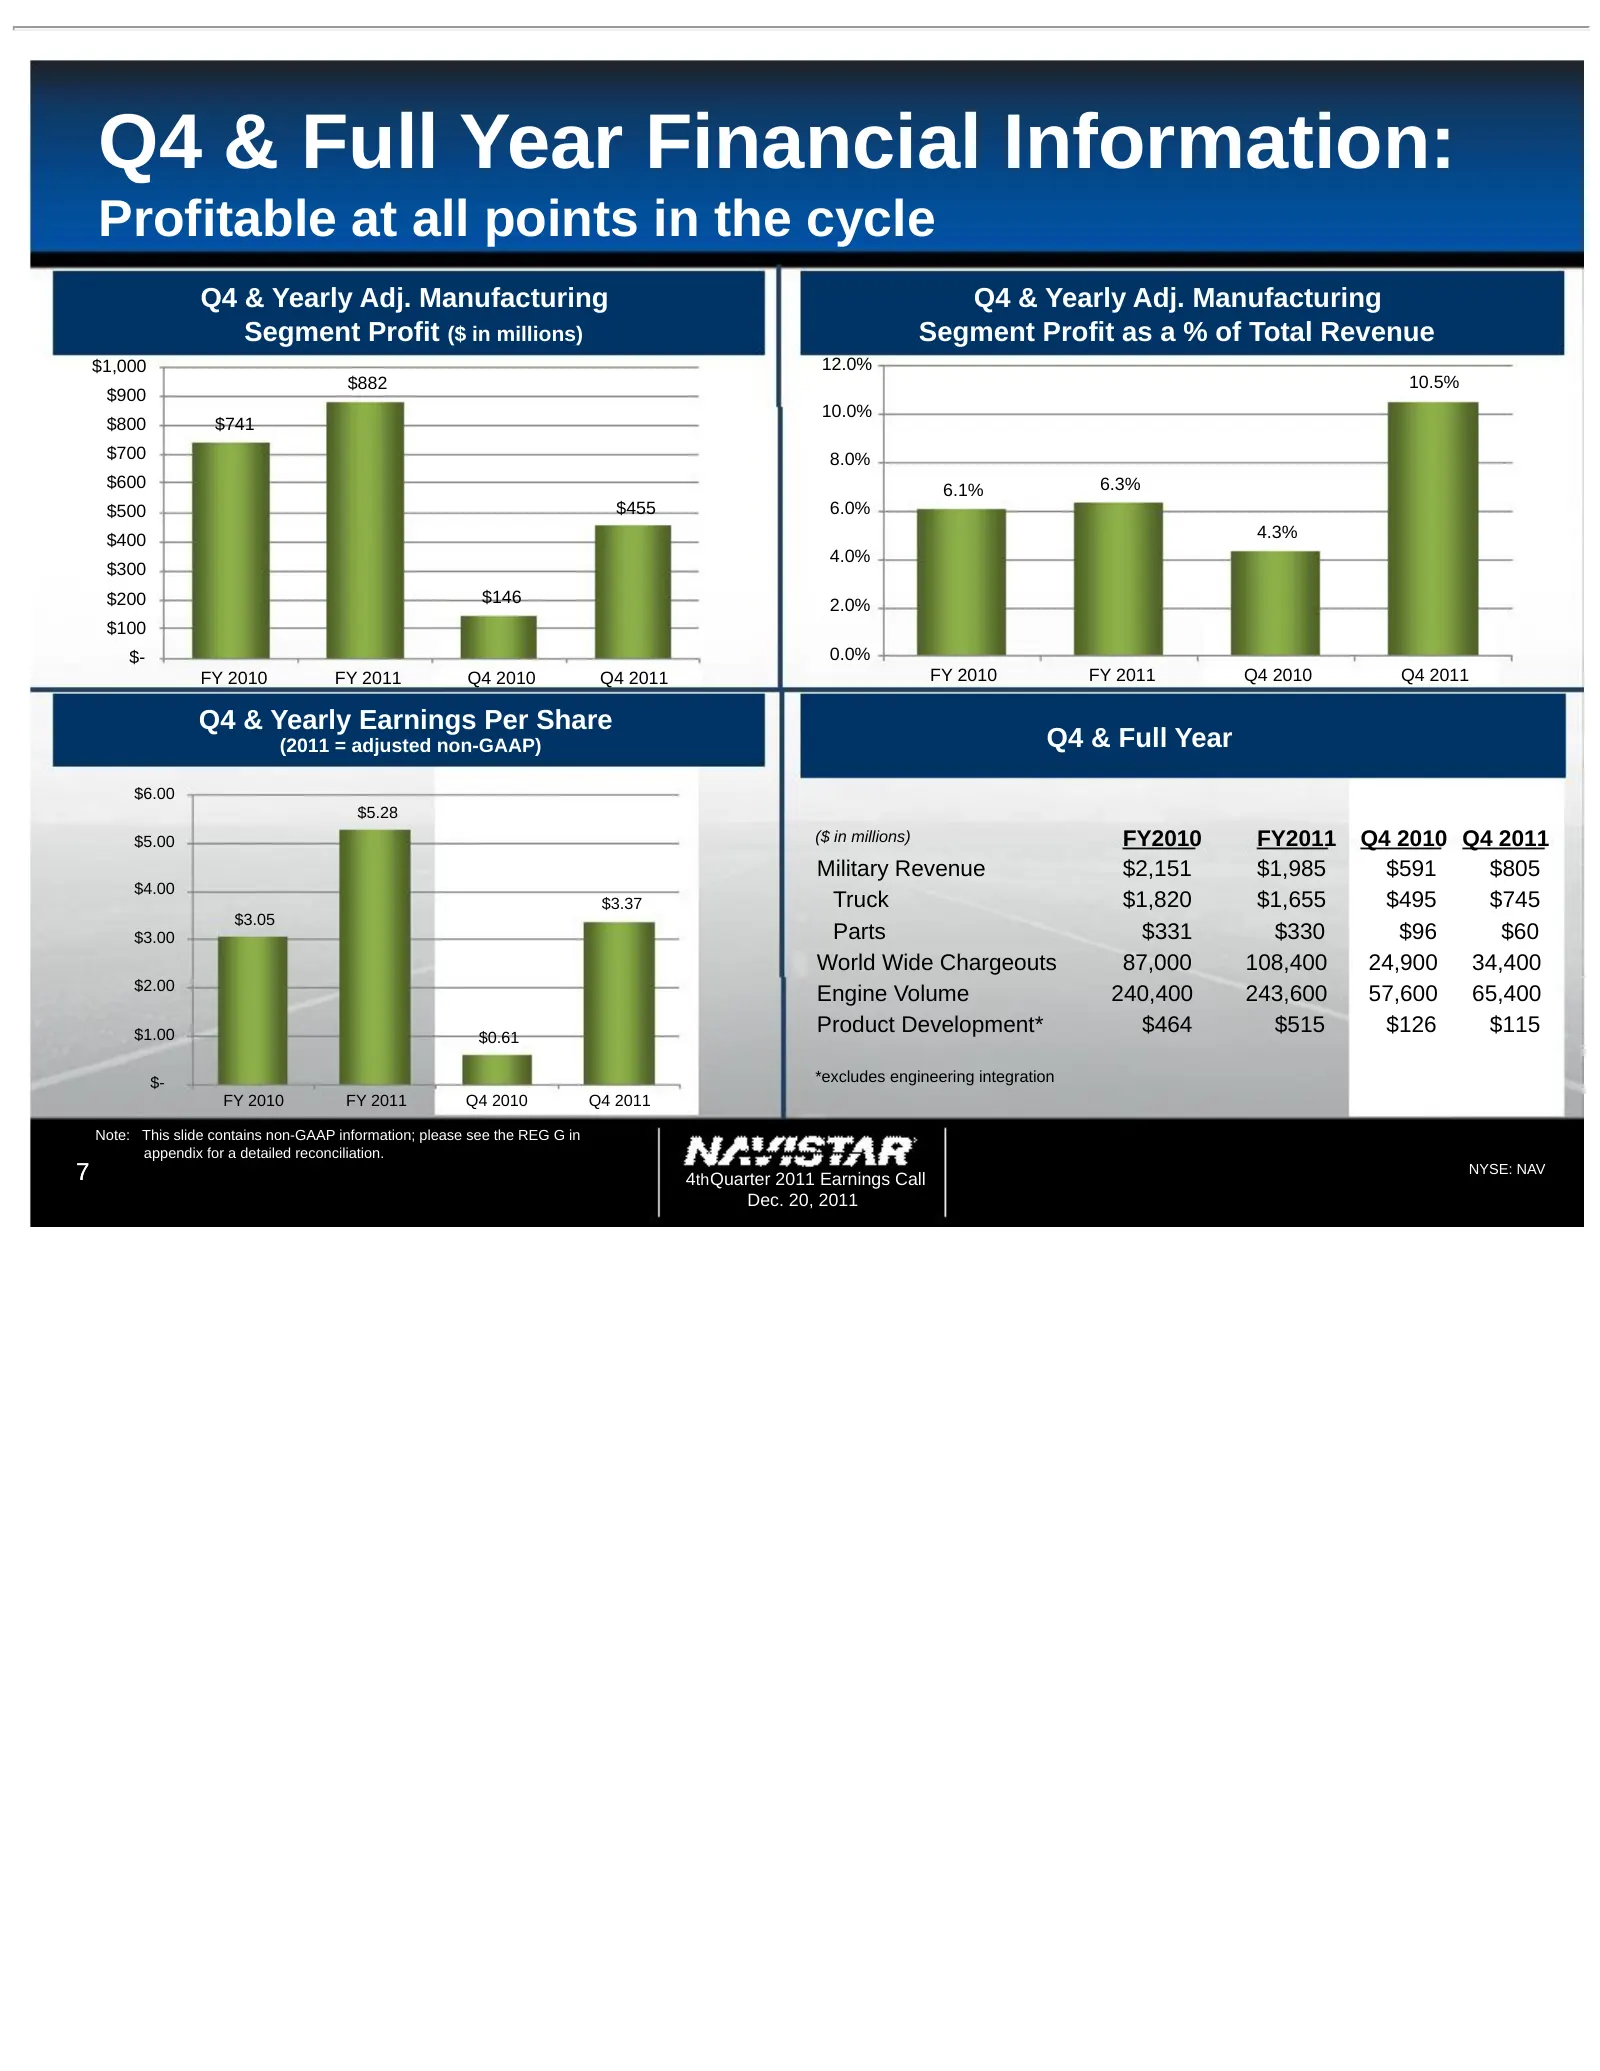
Q4 & Full Year Financial Information: Profitable at all points in the cycle Q4 & Yearly Adj. Manufacturing Q4 & Yearly Adj. Manufacturing Segment Profit ($ in millions) Segment Profit as a % of Total Revenue $1,000 12.0% $882 10.5% $900 10.0% $800 $741 $700 8.0% $600 6.1% 6.3% $500 $455 6.0% $400 4.
Slide 8: Q4 and Full Year Operational Results
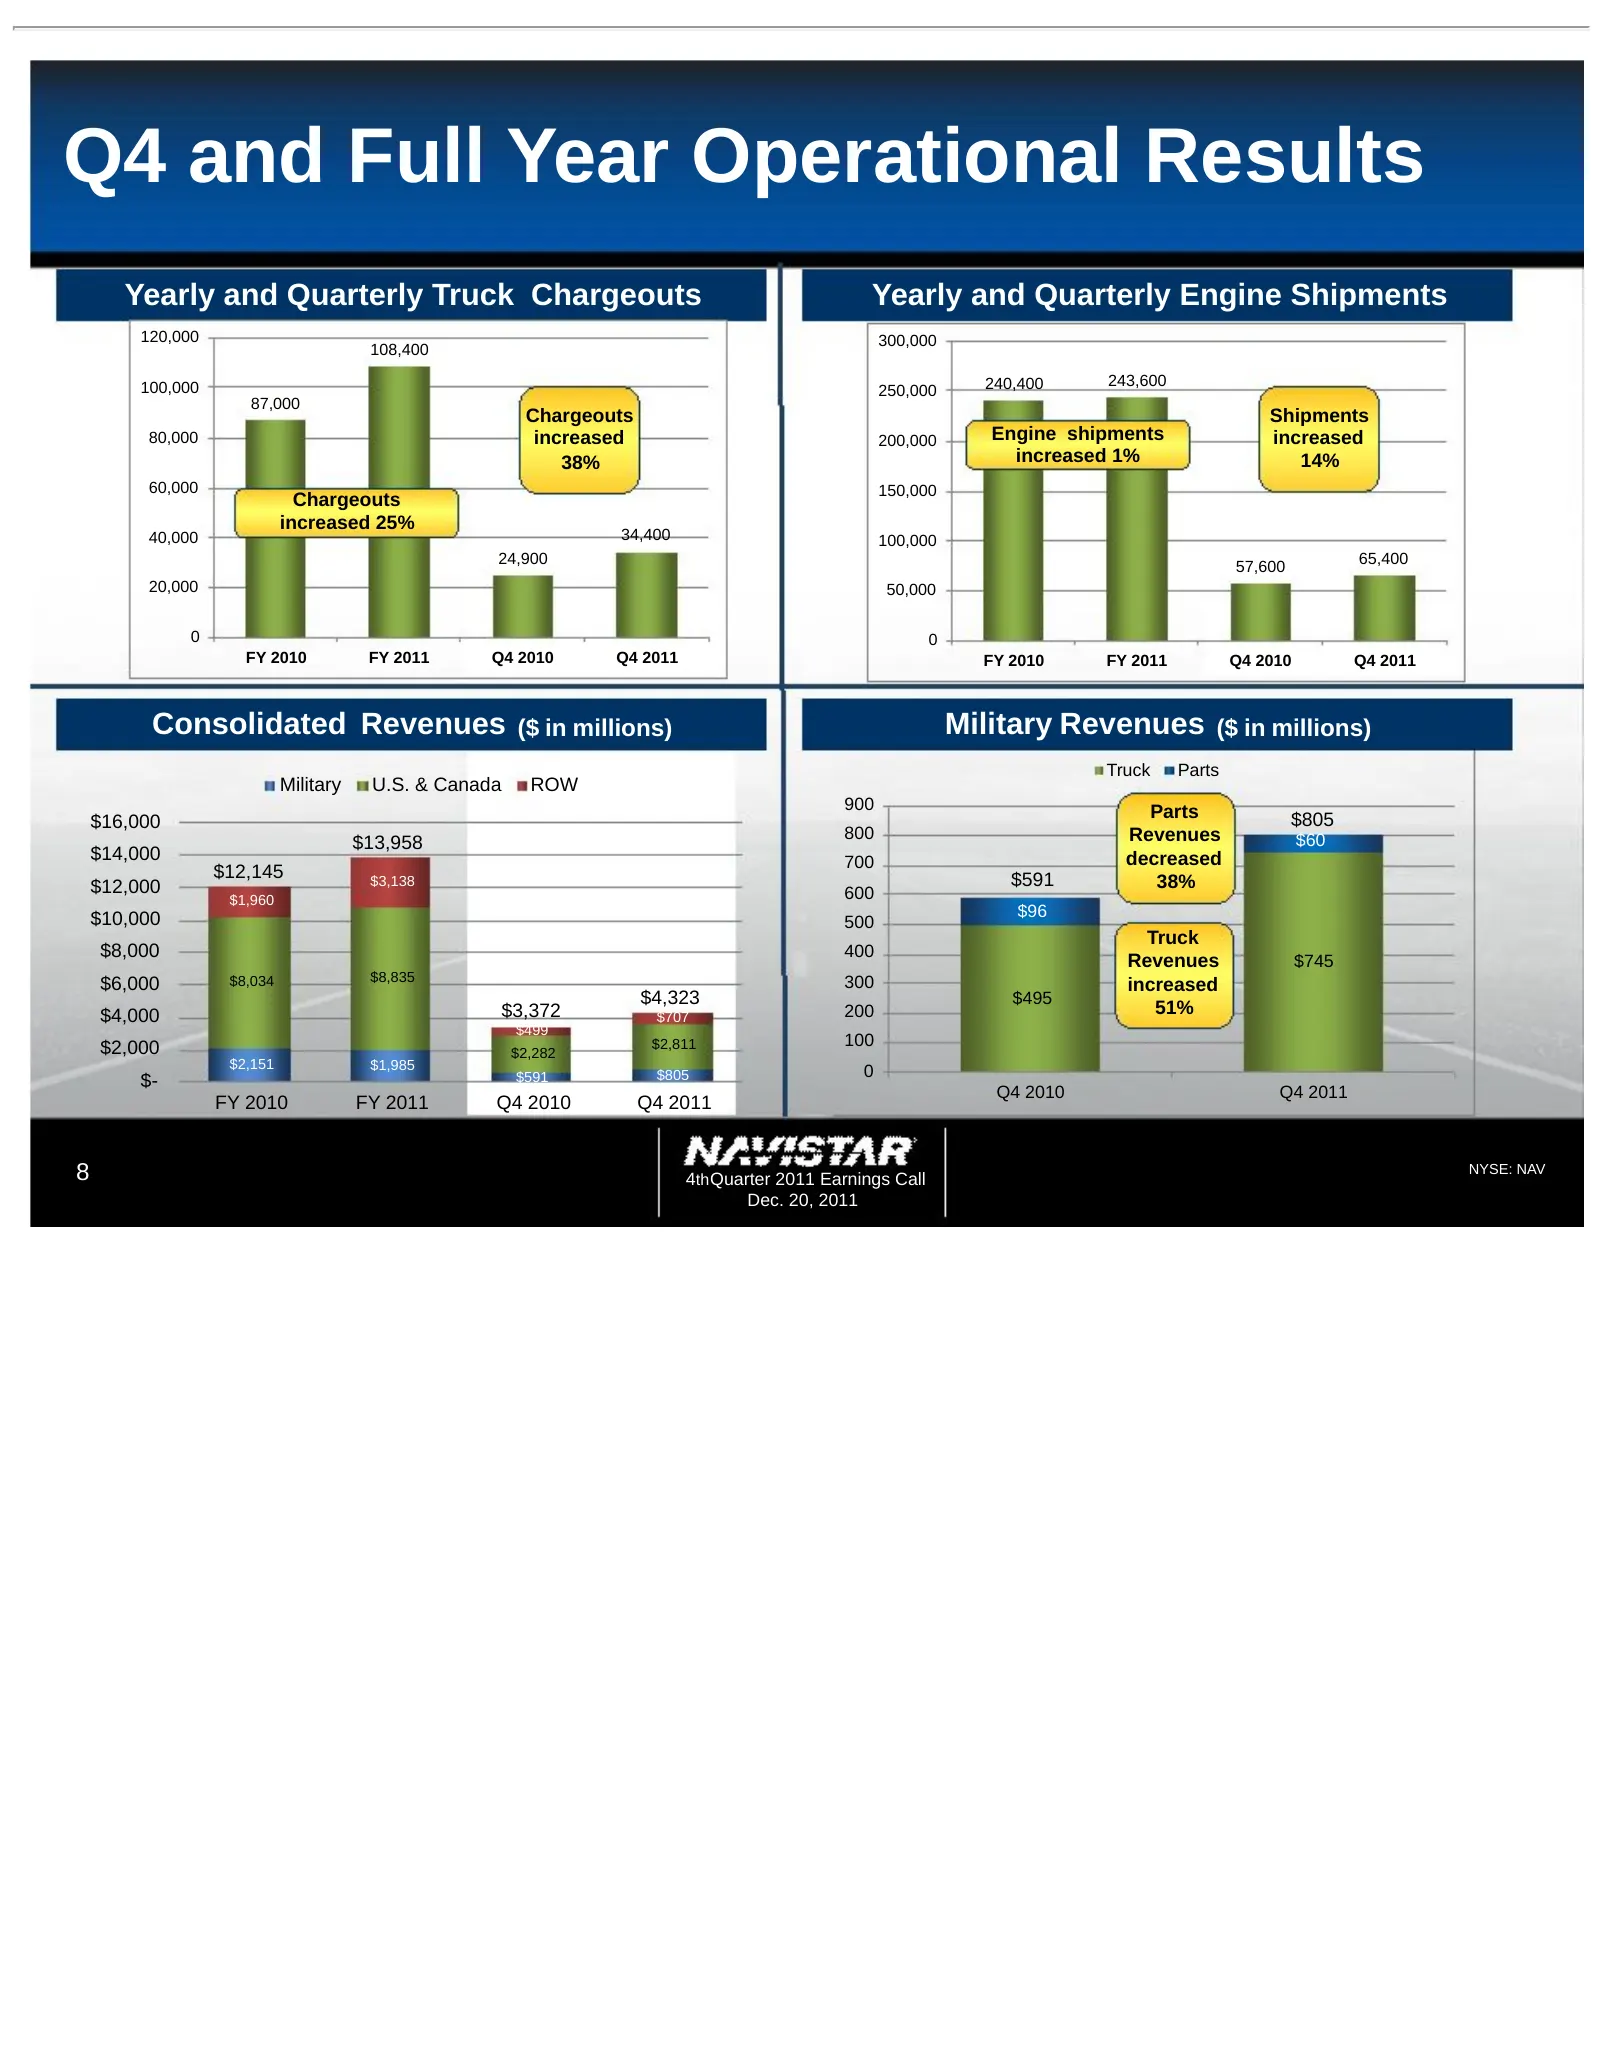
Q4 and Full Year Operational Results Yearly and Quarterly Truck Chargeouts Yearly and Quarterly Engine Shipments 120,000 300,000 108,400 100,000 240,400 243,600 250,000 87,000 Chargeouts Shipments 80,000 increased 200,000 Engine shipments increased 38% increased 1% 14% 60,000 150,000 Chargeouts incr
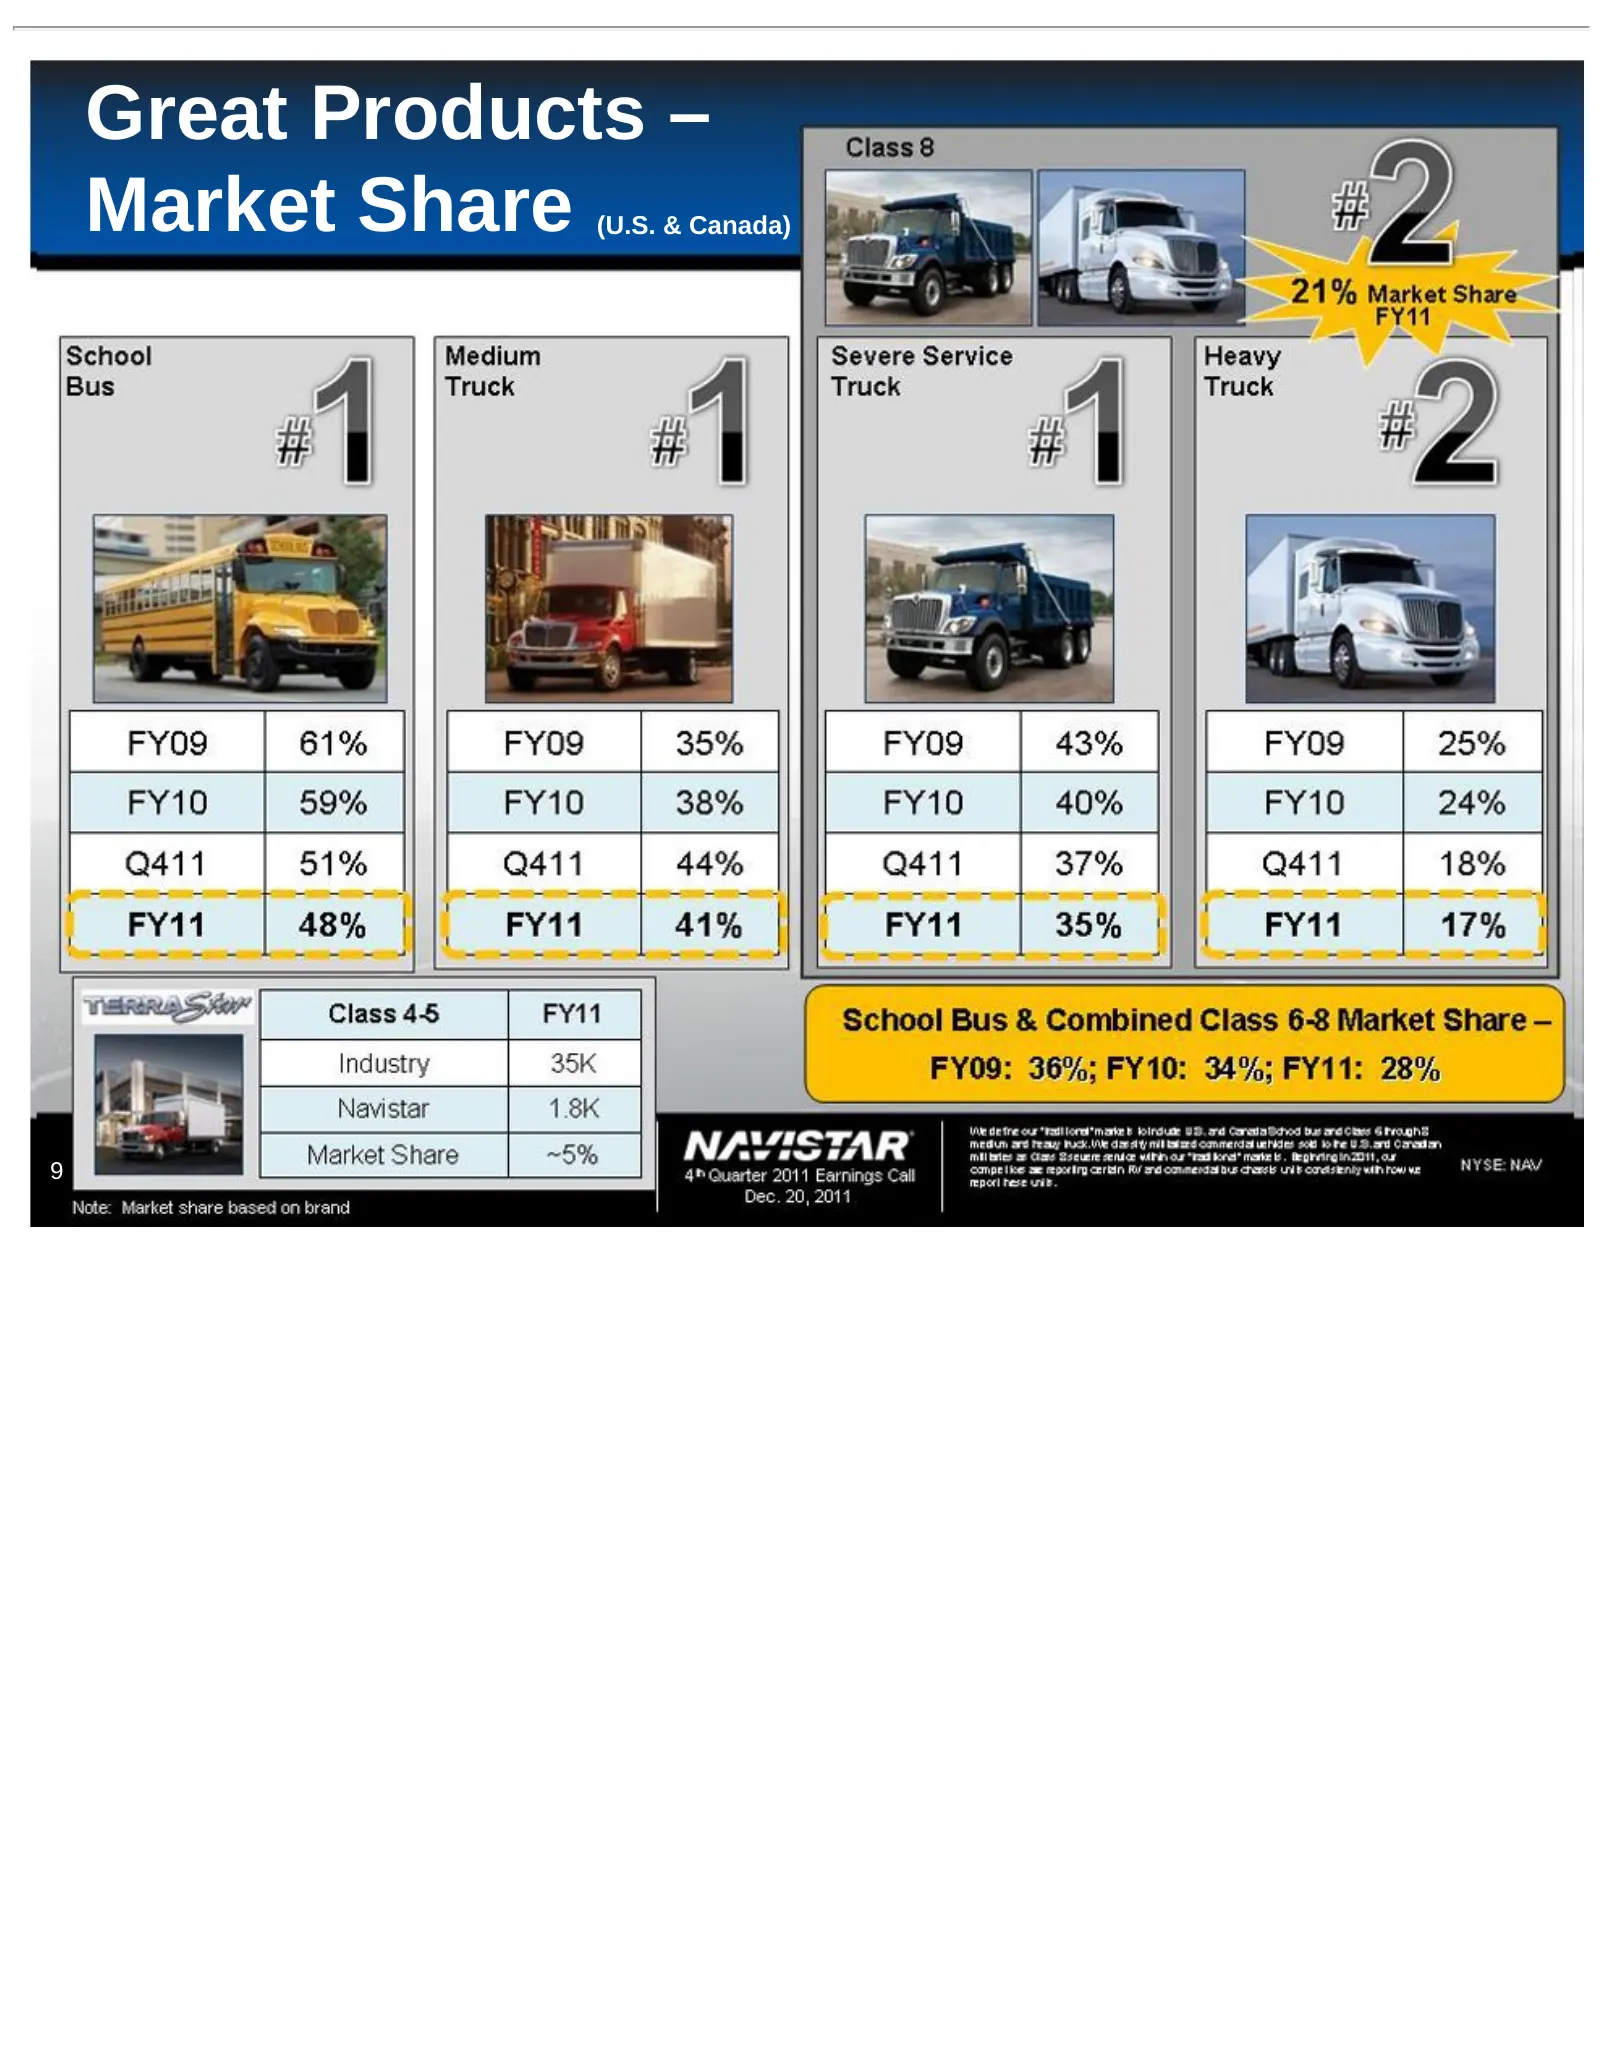
Slide 9: Great Products – Market Share
Great Products – Market Share (U.S. & Canada) 9
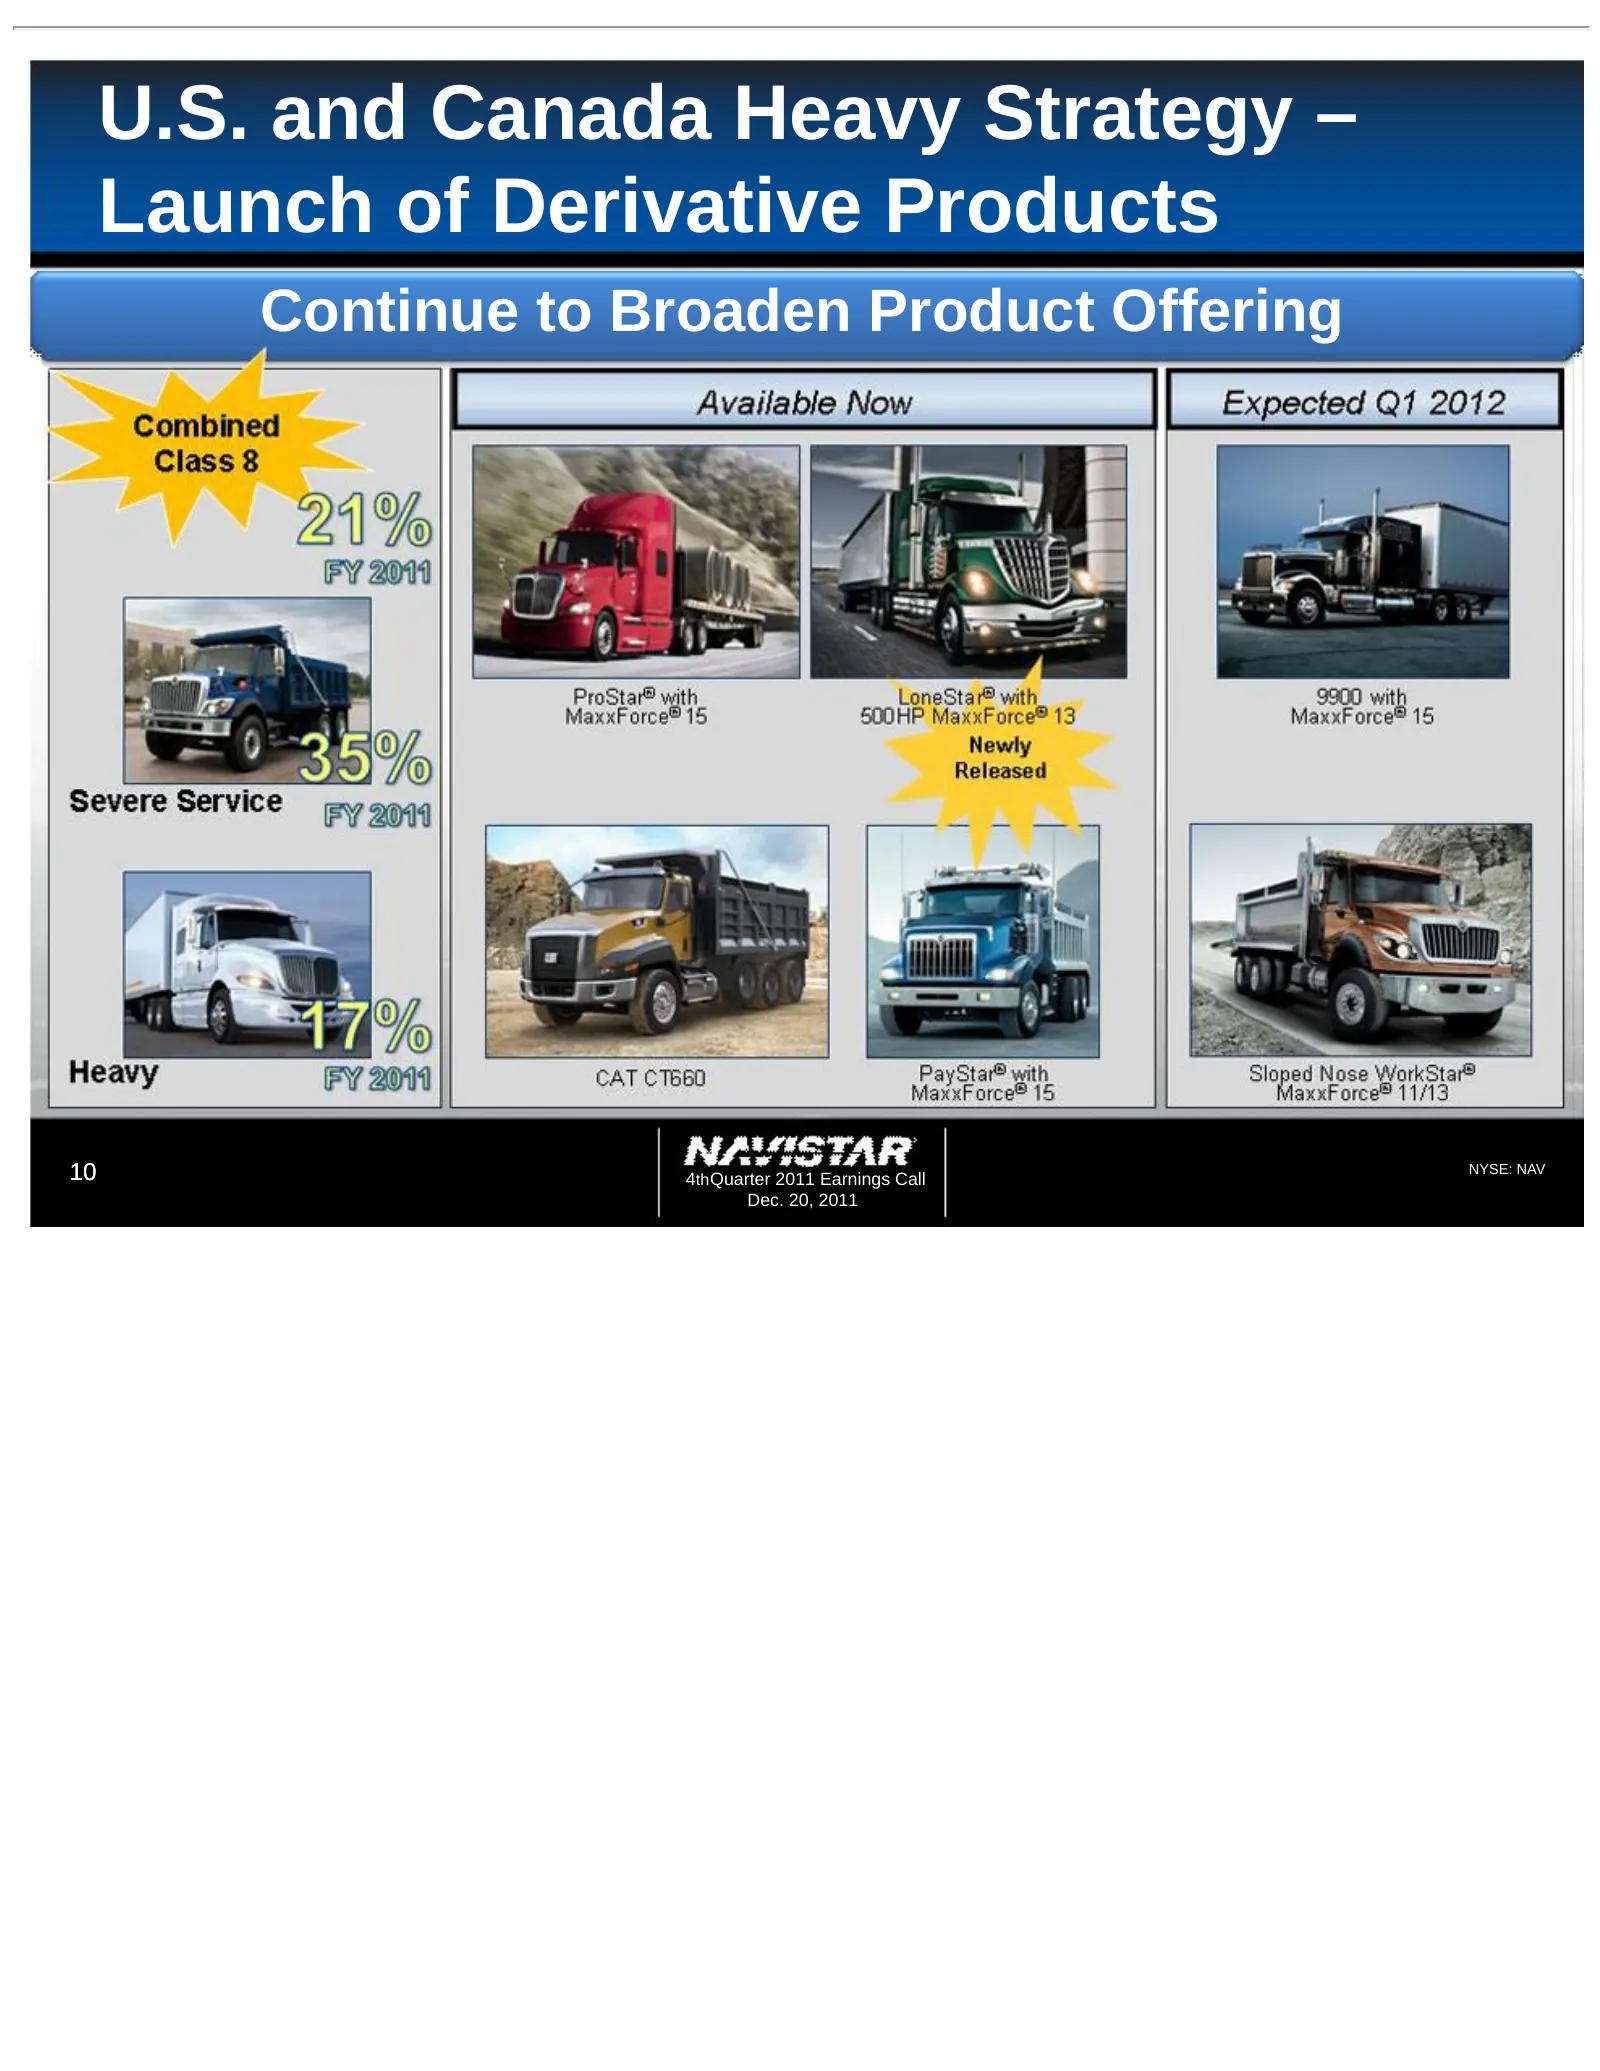
Slide 10: U.S. and Canada Heavy Strategy – Launch of Derivative Products
U.S. and Canada Heavy Strategy – Launch of Derivative Products Continue to Broaden Product Offering 10 4th Quarter 2011 Earnings Call NYSE: NAV Dec. 20, 2011
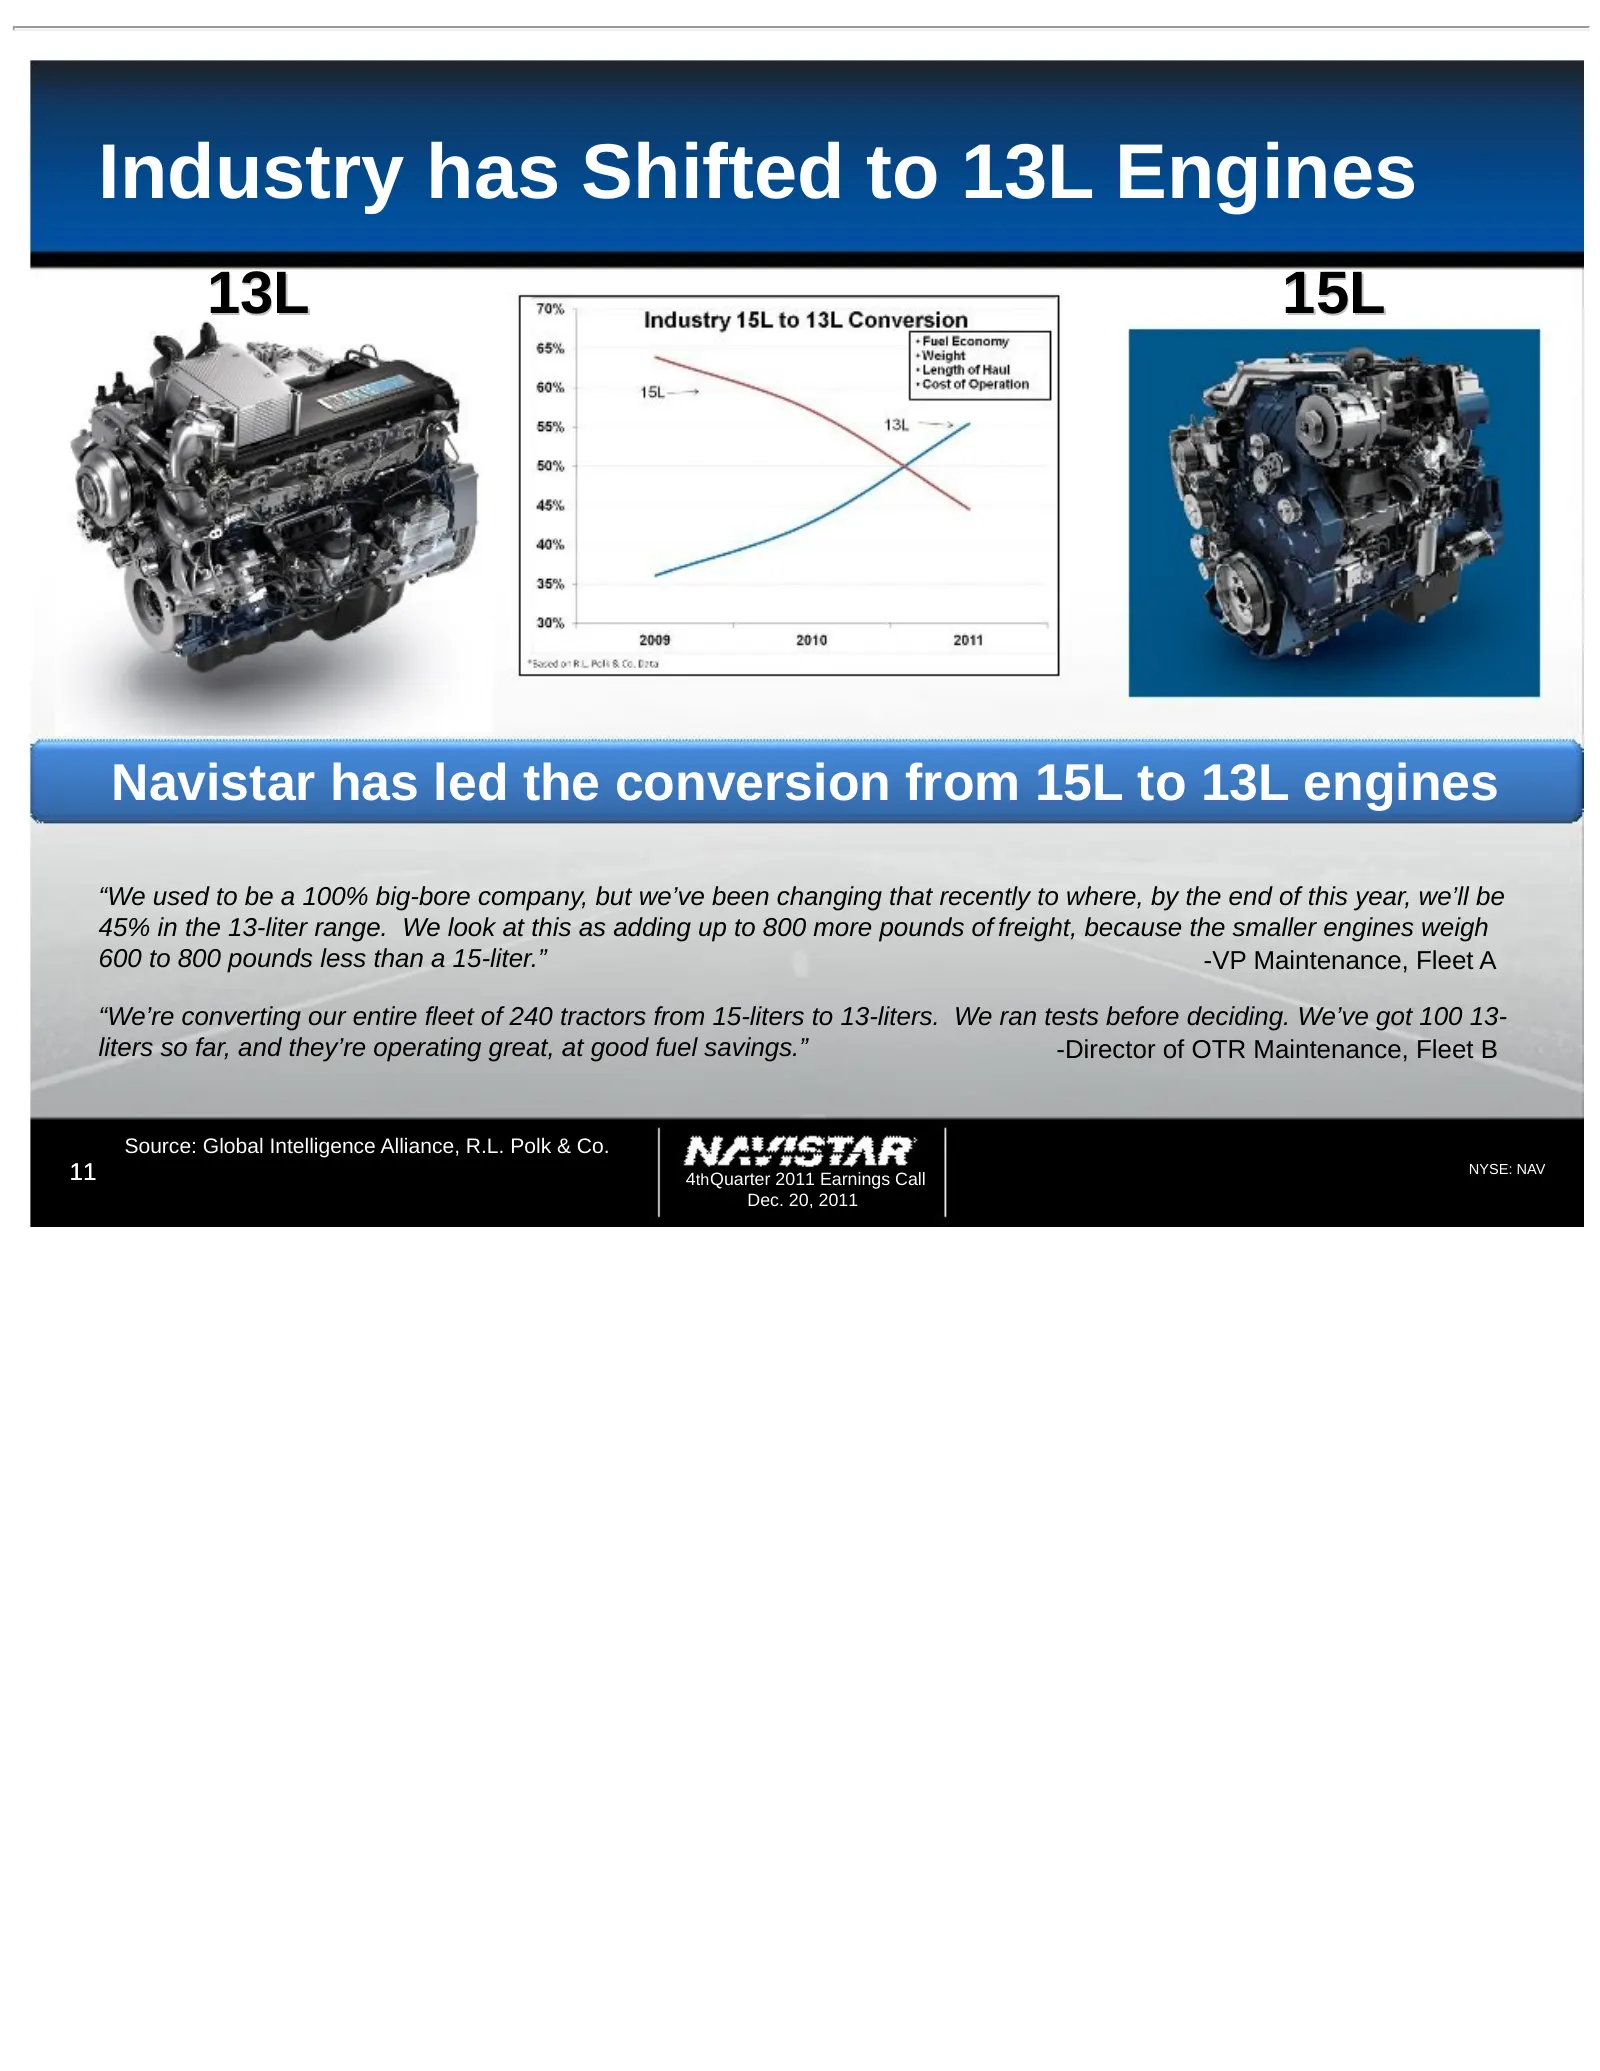
Slide 11: Industry has Shifted to 13L Engines
Industry has Shifted to 13L Engines 13L 15L Navistar has led the conversion from 15L to 13L engines “We used to be a 100% big-bore company, but we’ve been changing that recently to where, by the end of this year, we’ll be 45% in the 13-liter range. We look at this as adding up to 800 more pounds of
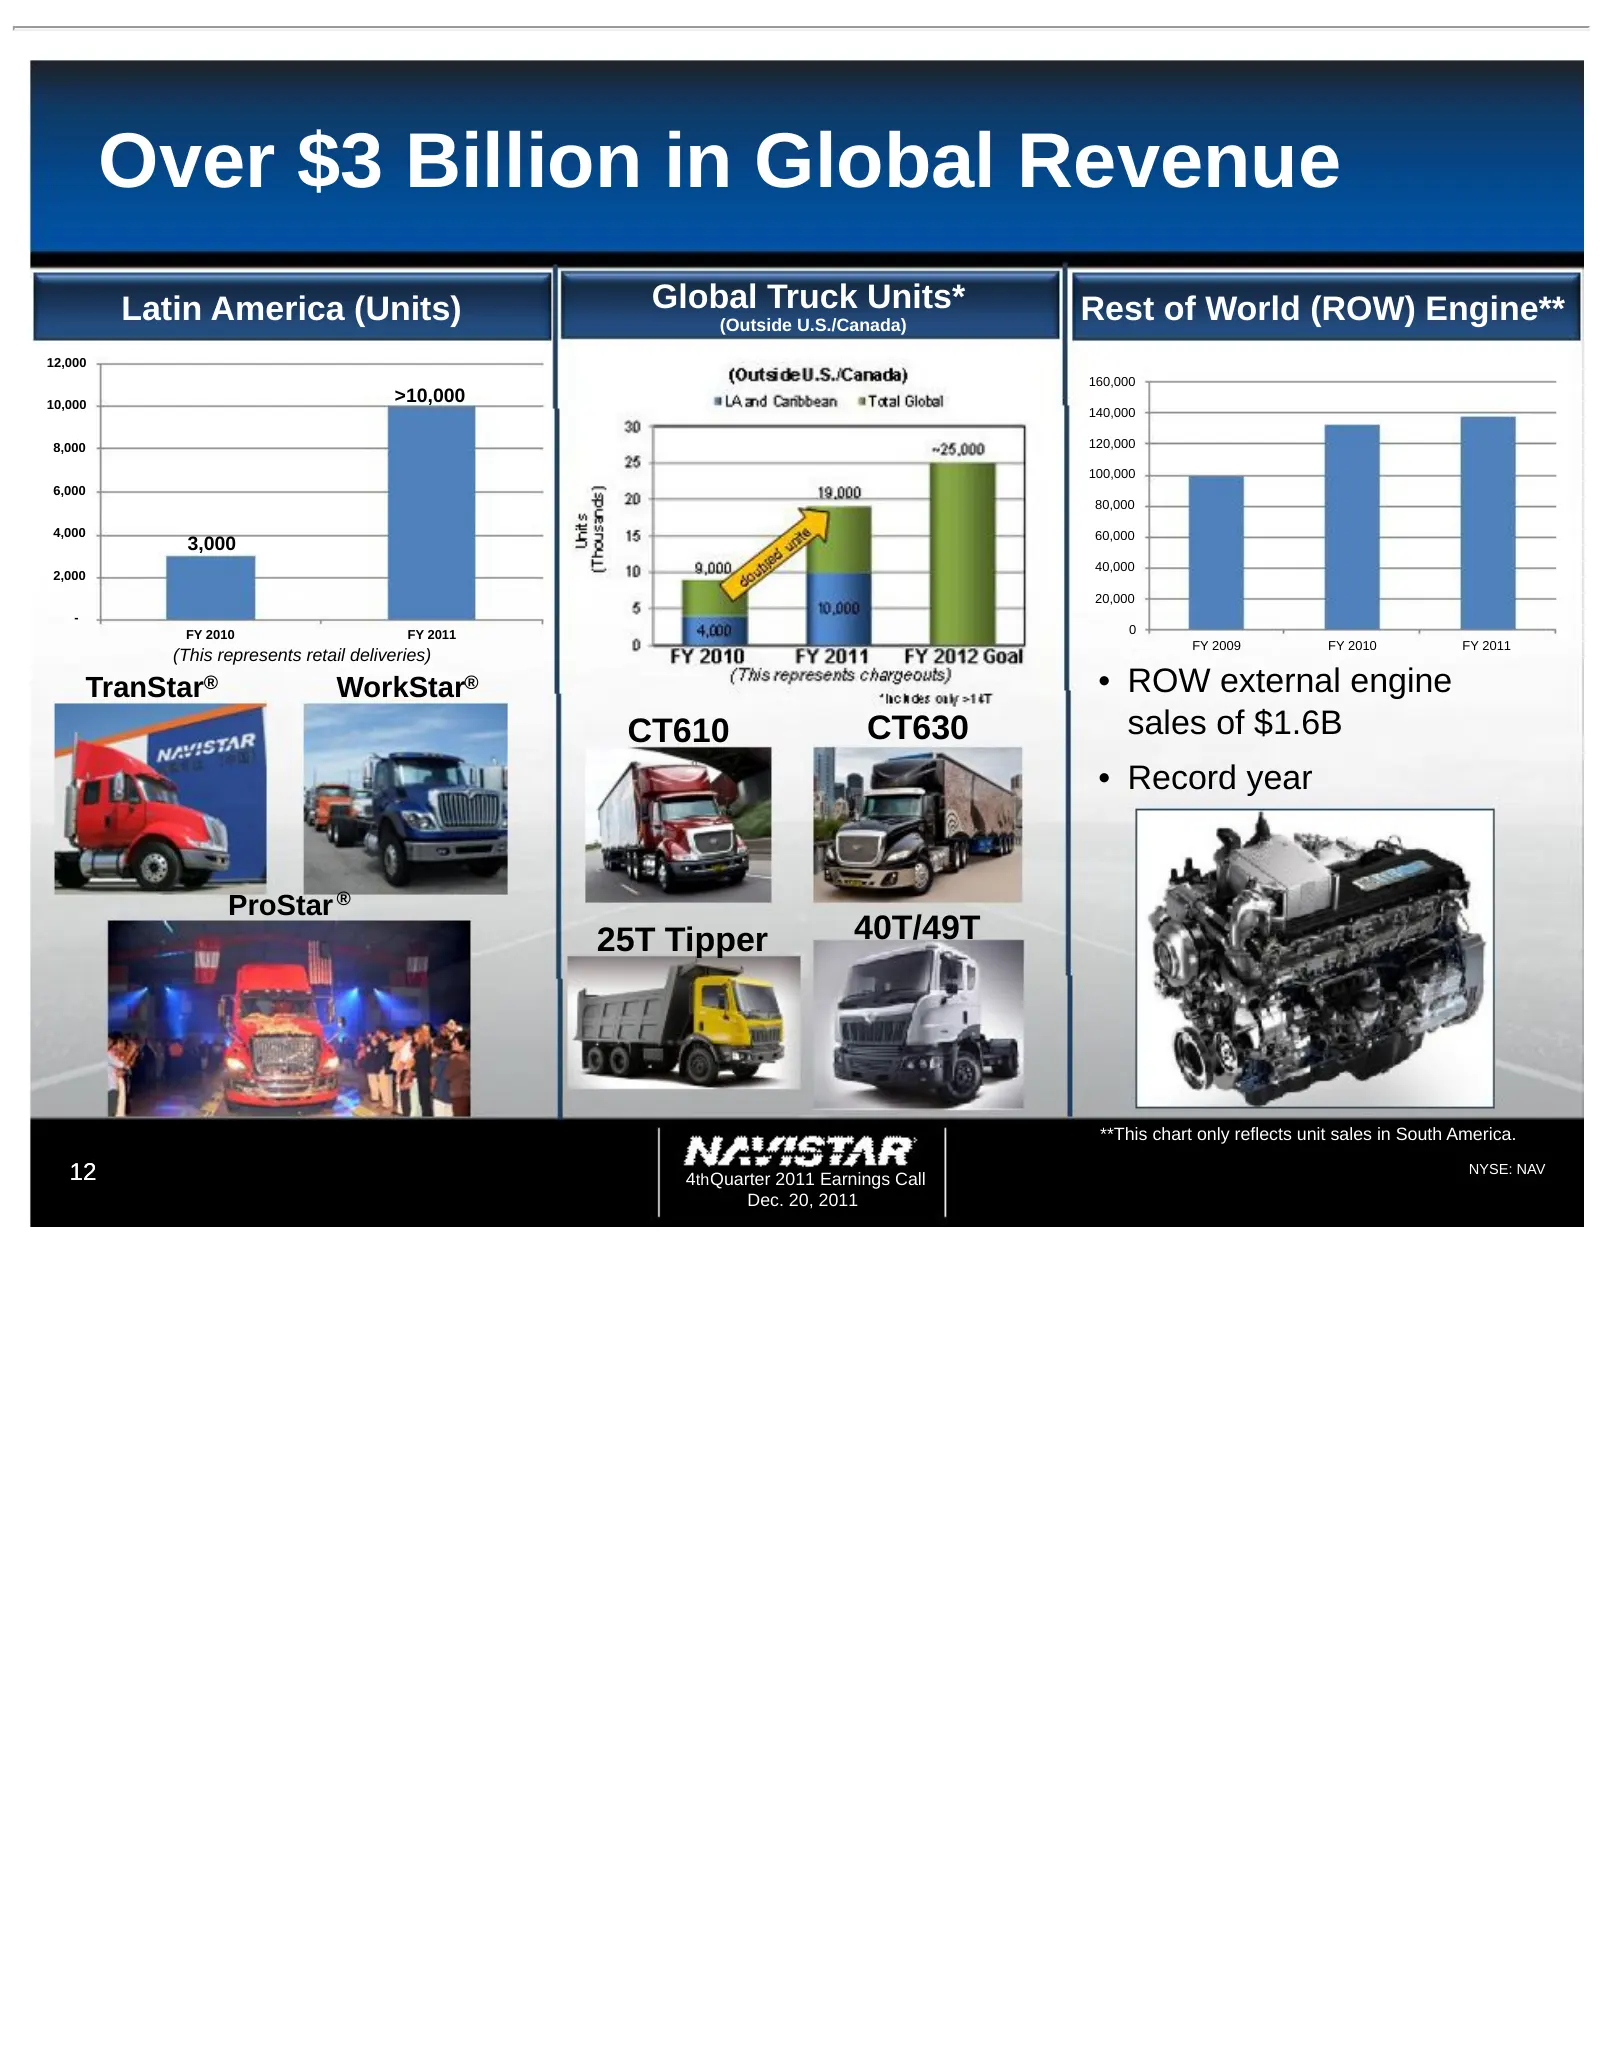
Slide 12: Over $3 Billion in Global Revenue
Over $3 Billion in Global Revenue Latin America (Units) Global Truck Units* Rest of World (ROW) Engine** (Outside U.S./Canada) 12,000 160,000 10,000 >10,000 140,000 8,000 120,000 100,000 6,000 80,000 4,000 60,000 3,000 40,000 2,000 20,000 - FY 2010 FY 2011 0 FY 2009 FY 2010 FY 2011 (This represents
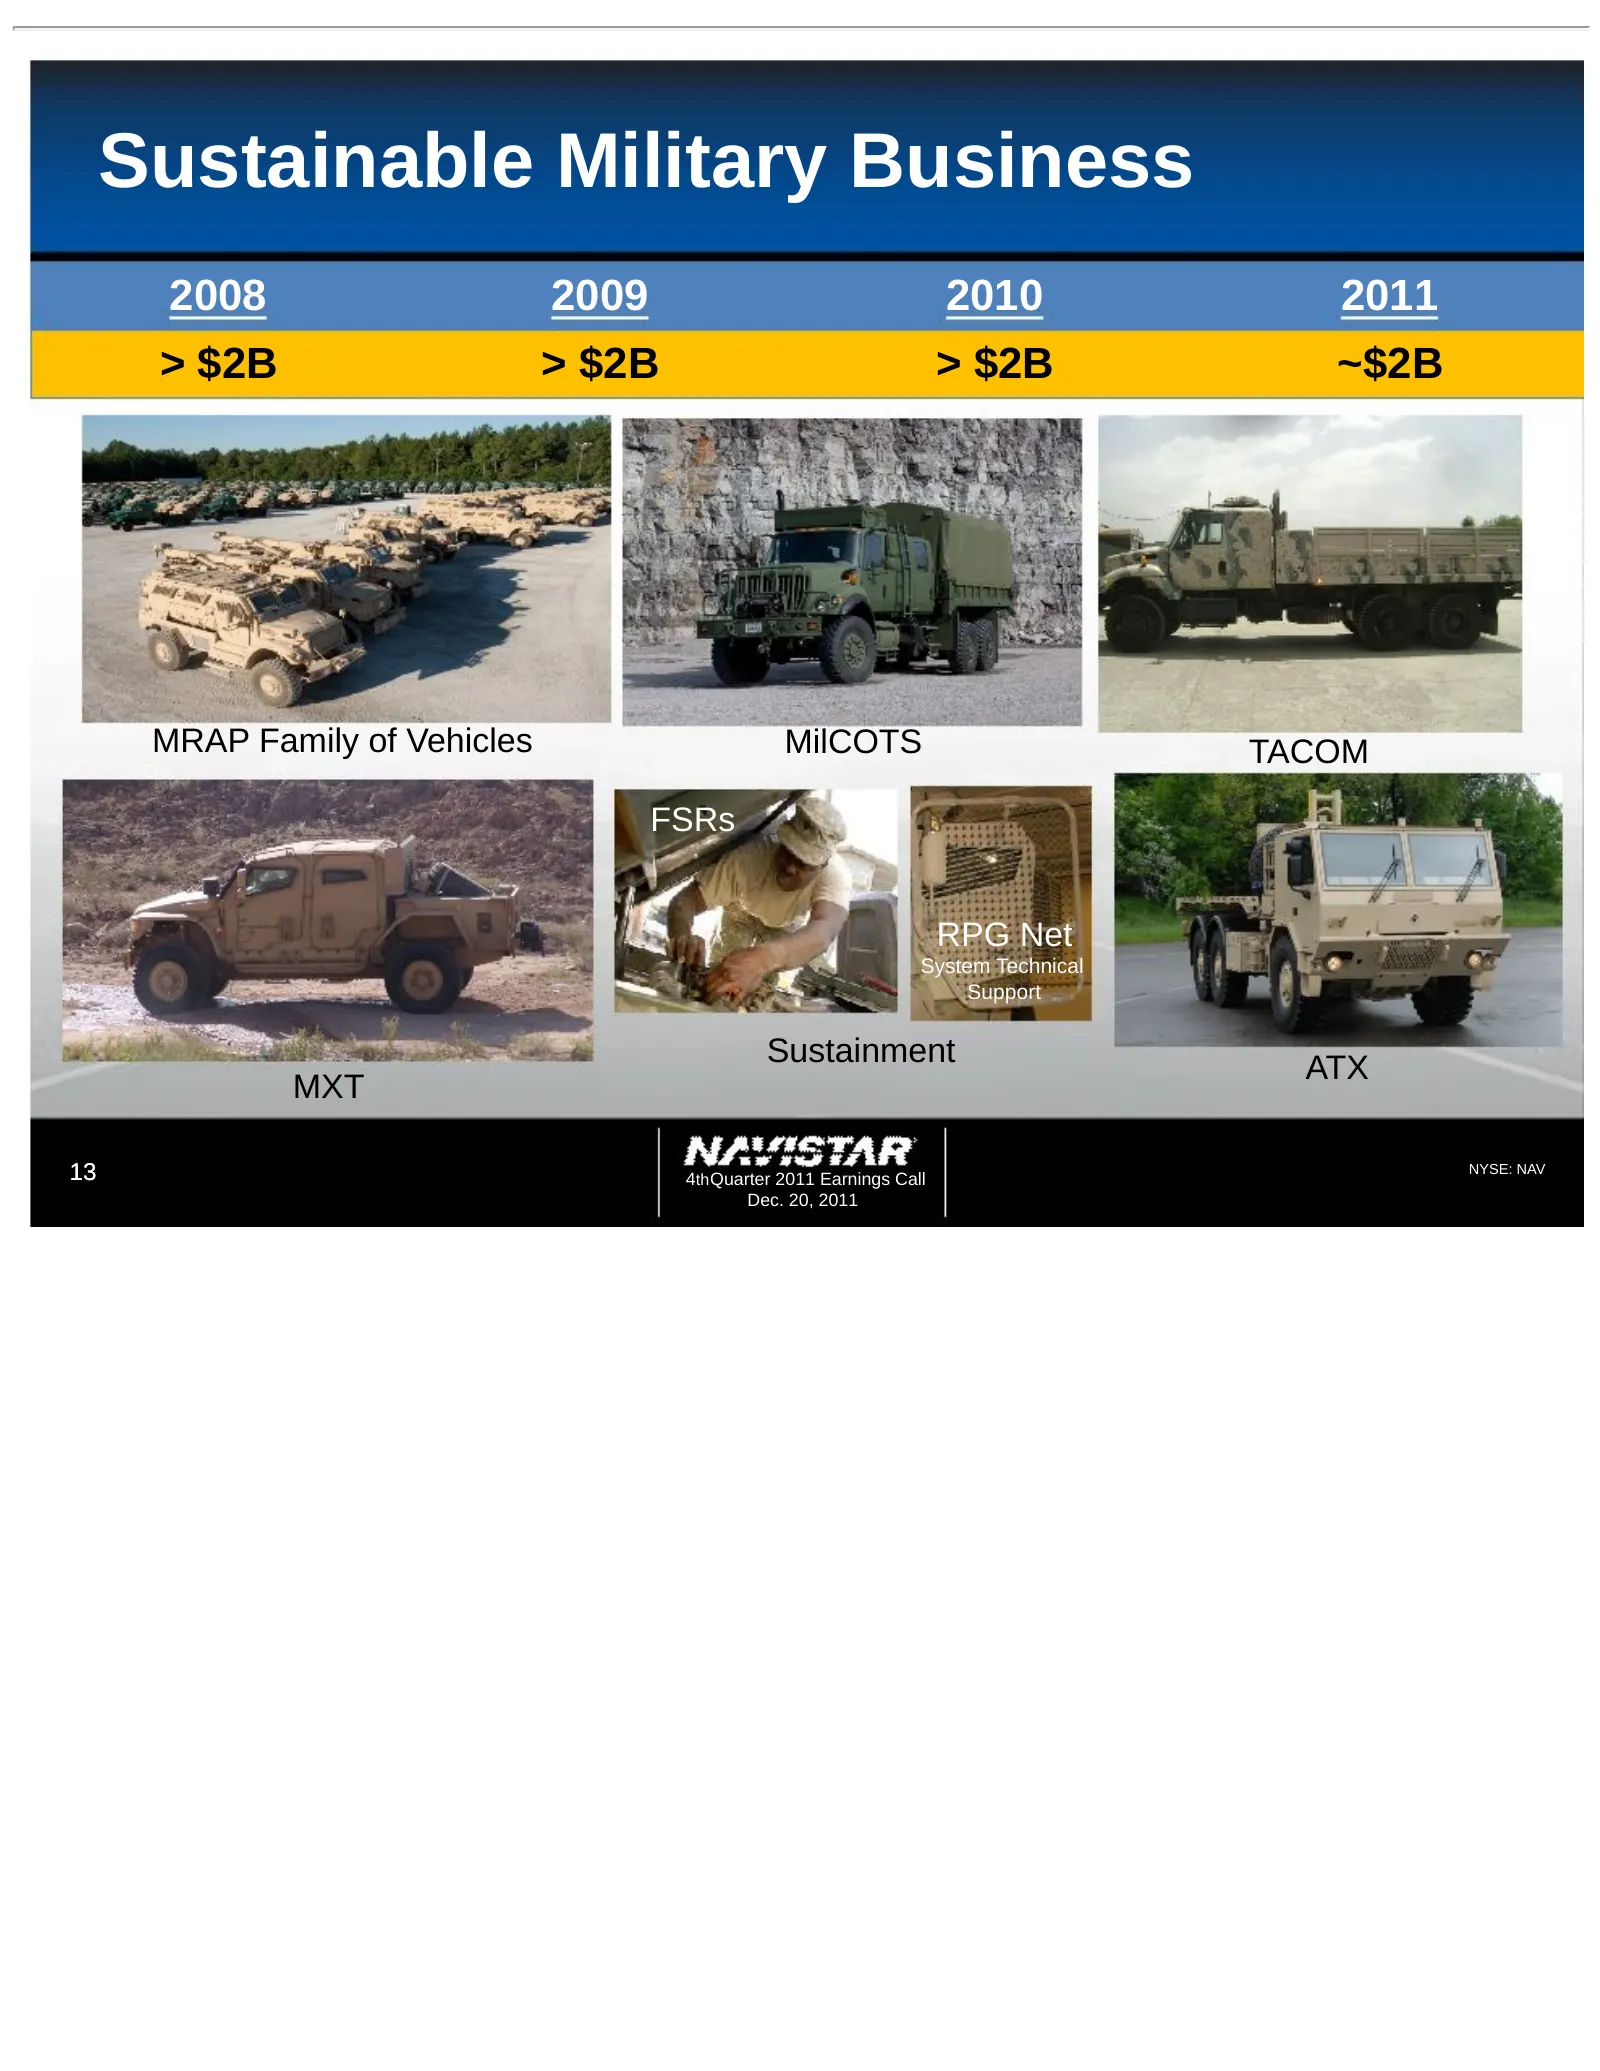
Slide 13: Sustainable Military Business
Sustainable Military Business 2008 2009 2010 2011 > $2B > $2B > $2B ~$2B MRAP Family of Vehicles MilCOTS TACOM FSRs RPG Net System Technical Support Sustainment ATX MXT 13 4th Quarter 2011 Earnings Call NYSE: NAV Dec. 20, 2011
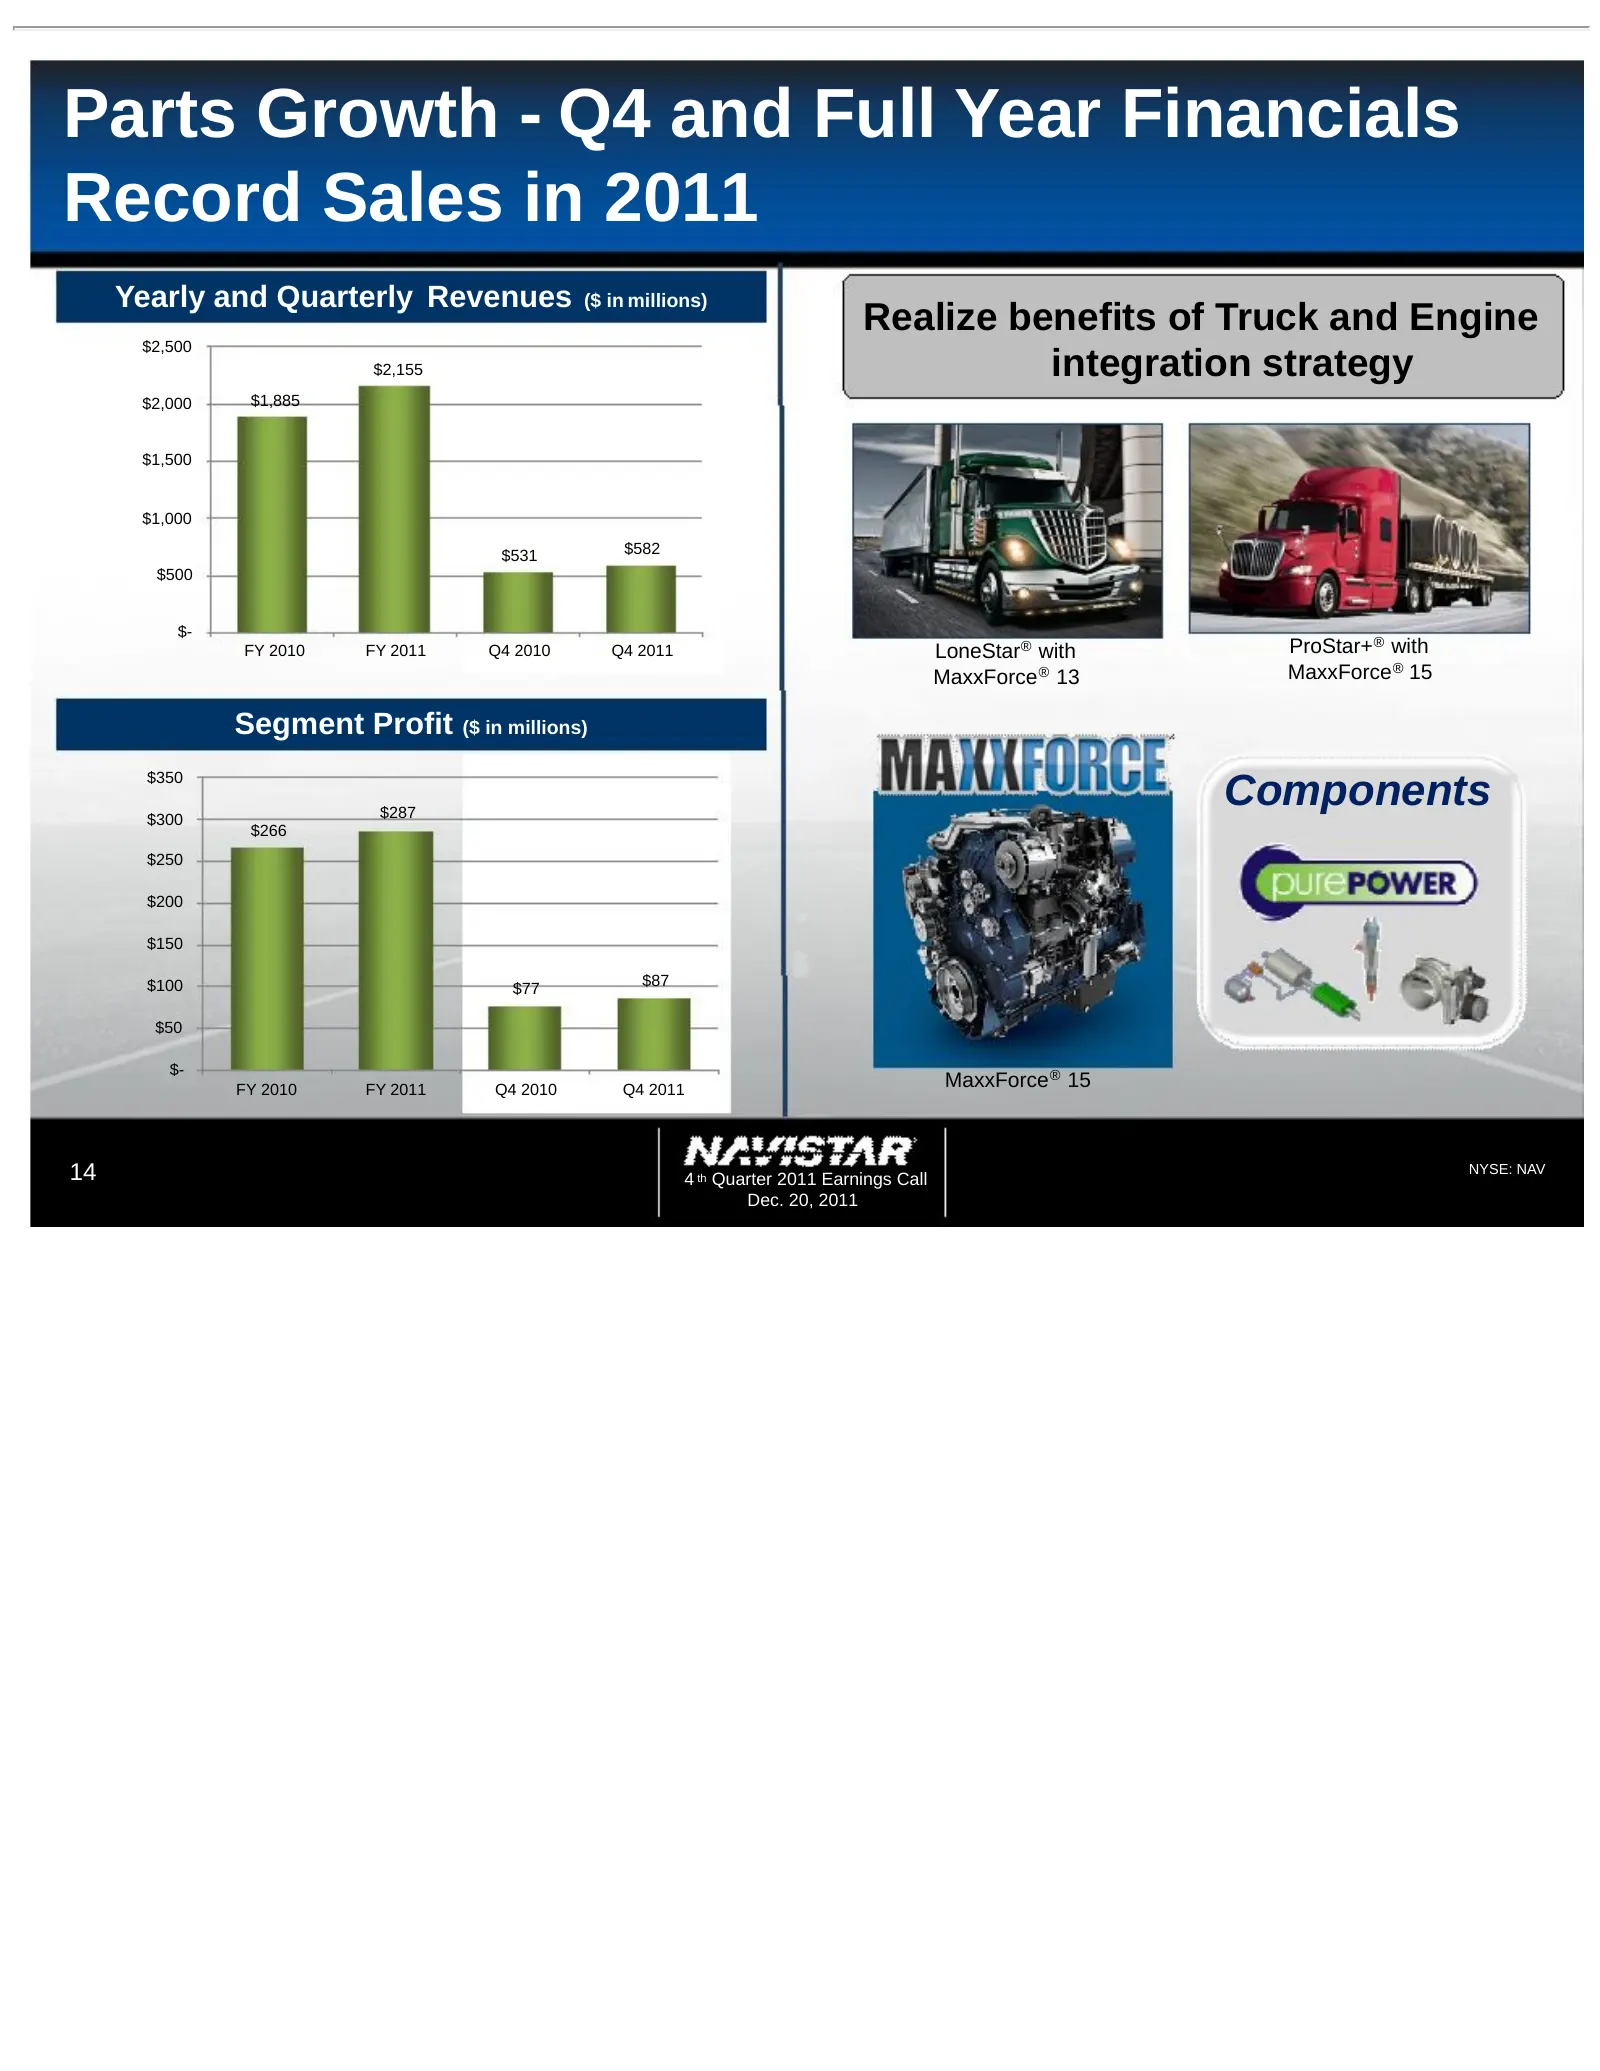
Slide 14: Parts Growth - Q4 and Full Year Financials
Parts Growth - Q4 and Full Year Financials Record Sales in 2011 Yearly and Quarterly Revenues ($ in millions) Realize benefits of Truck and Engine $2,500 $2,155 integration strategy $2,000 $1,885 $1,500 $1,000 $531 $582 $500 $- FY 2010 FY 2011 Q4 2010 Q4 2011 LoneStar® with ProStar+® with MaxxForce
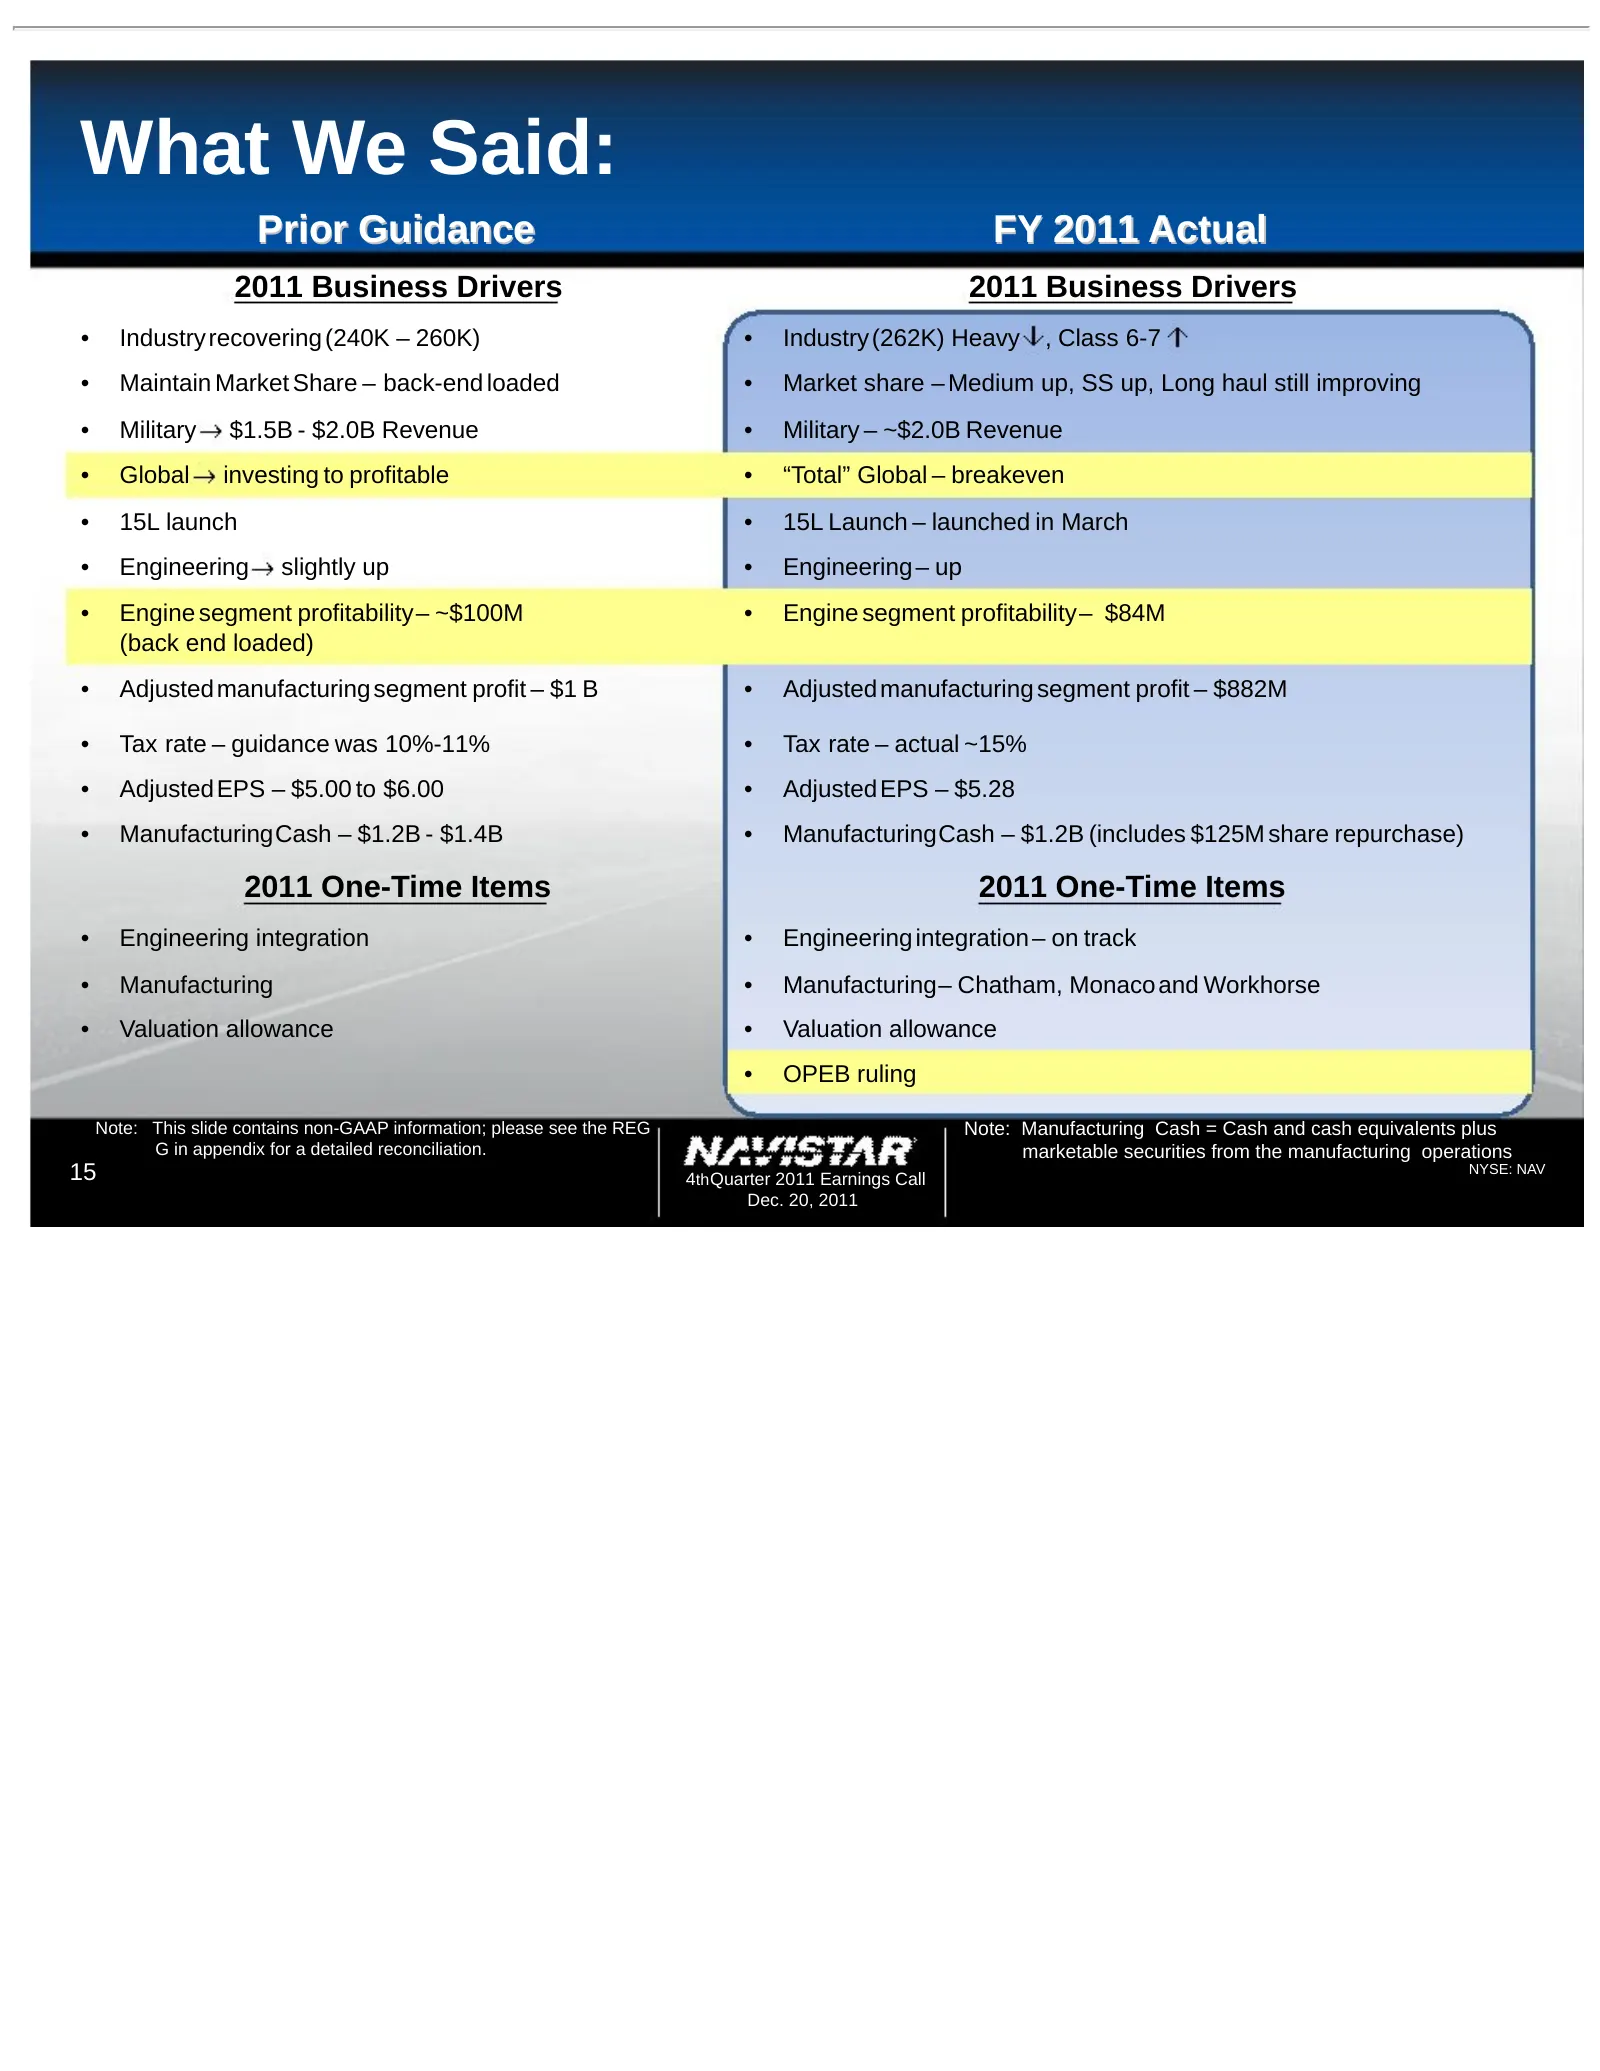
Slide 15: What We Said
What We Said: Prior Guidance FY 2011 Actual 2011 Business Drivers 2011 Business Drivers • Industry recovering (240K – 260K) • Industry (262K) Heavy , Class 6-7 • Maintain Market Share – back-end loaded • Market share – Medium up, SS up, Long haul still improving • Military $1.5B - $2.0B Revenue • Mi
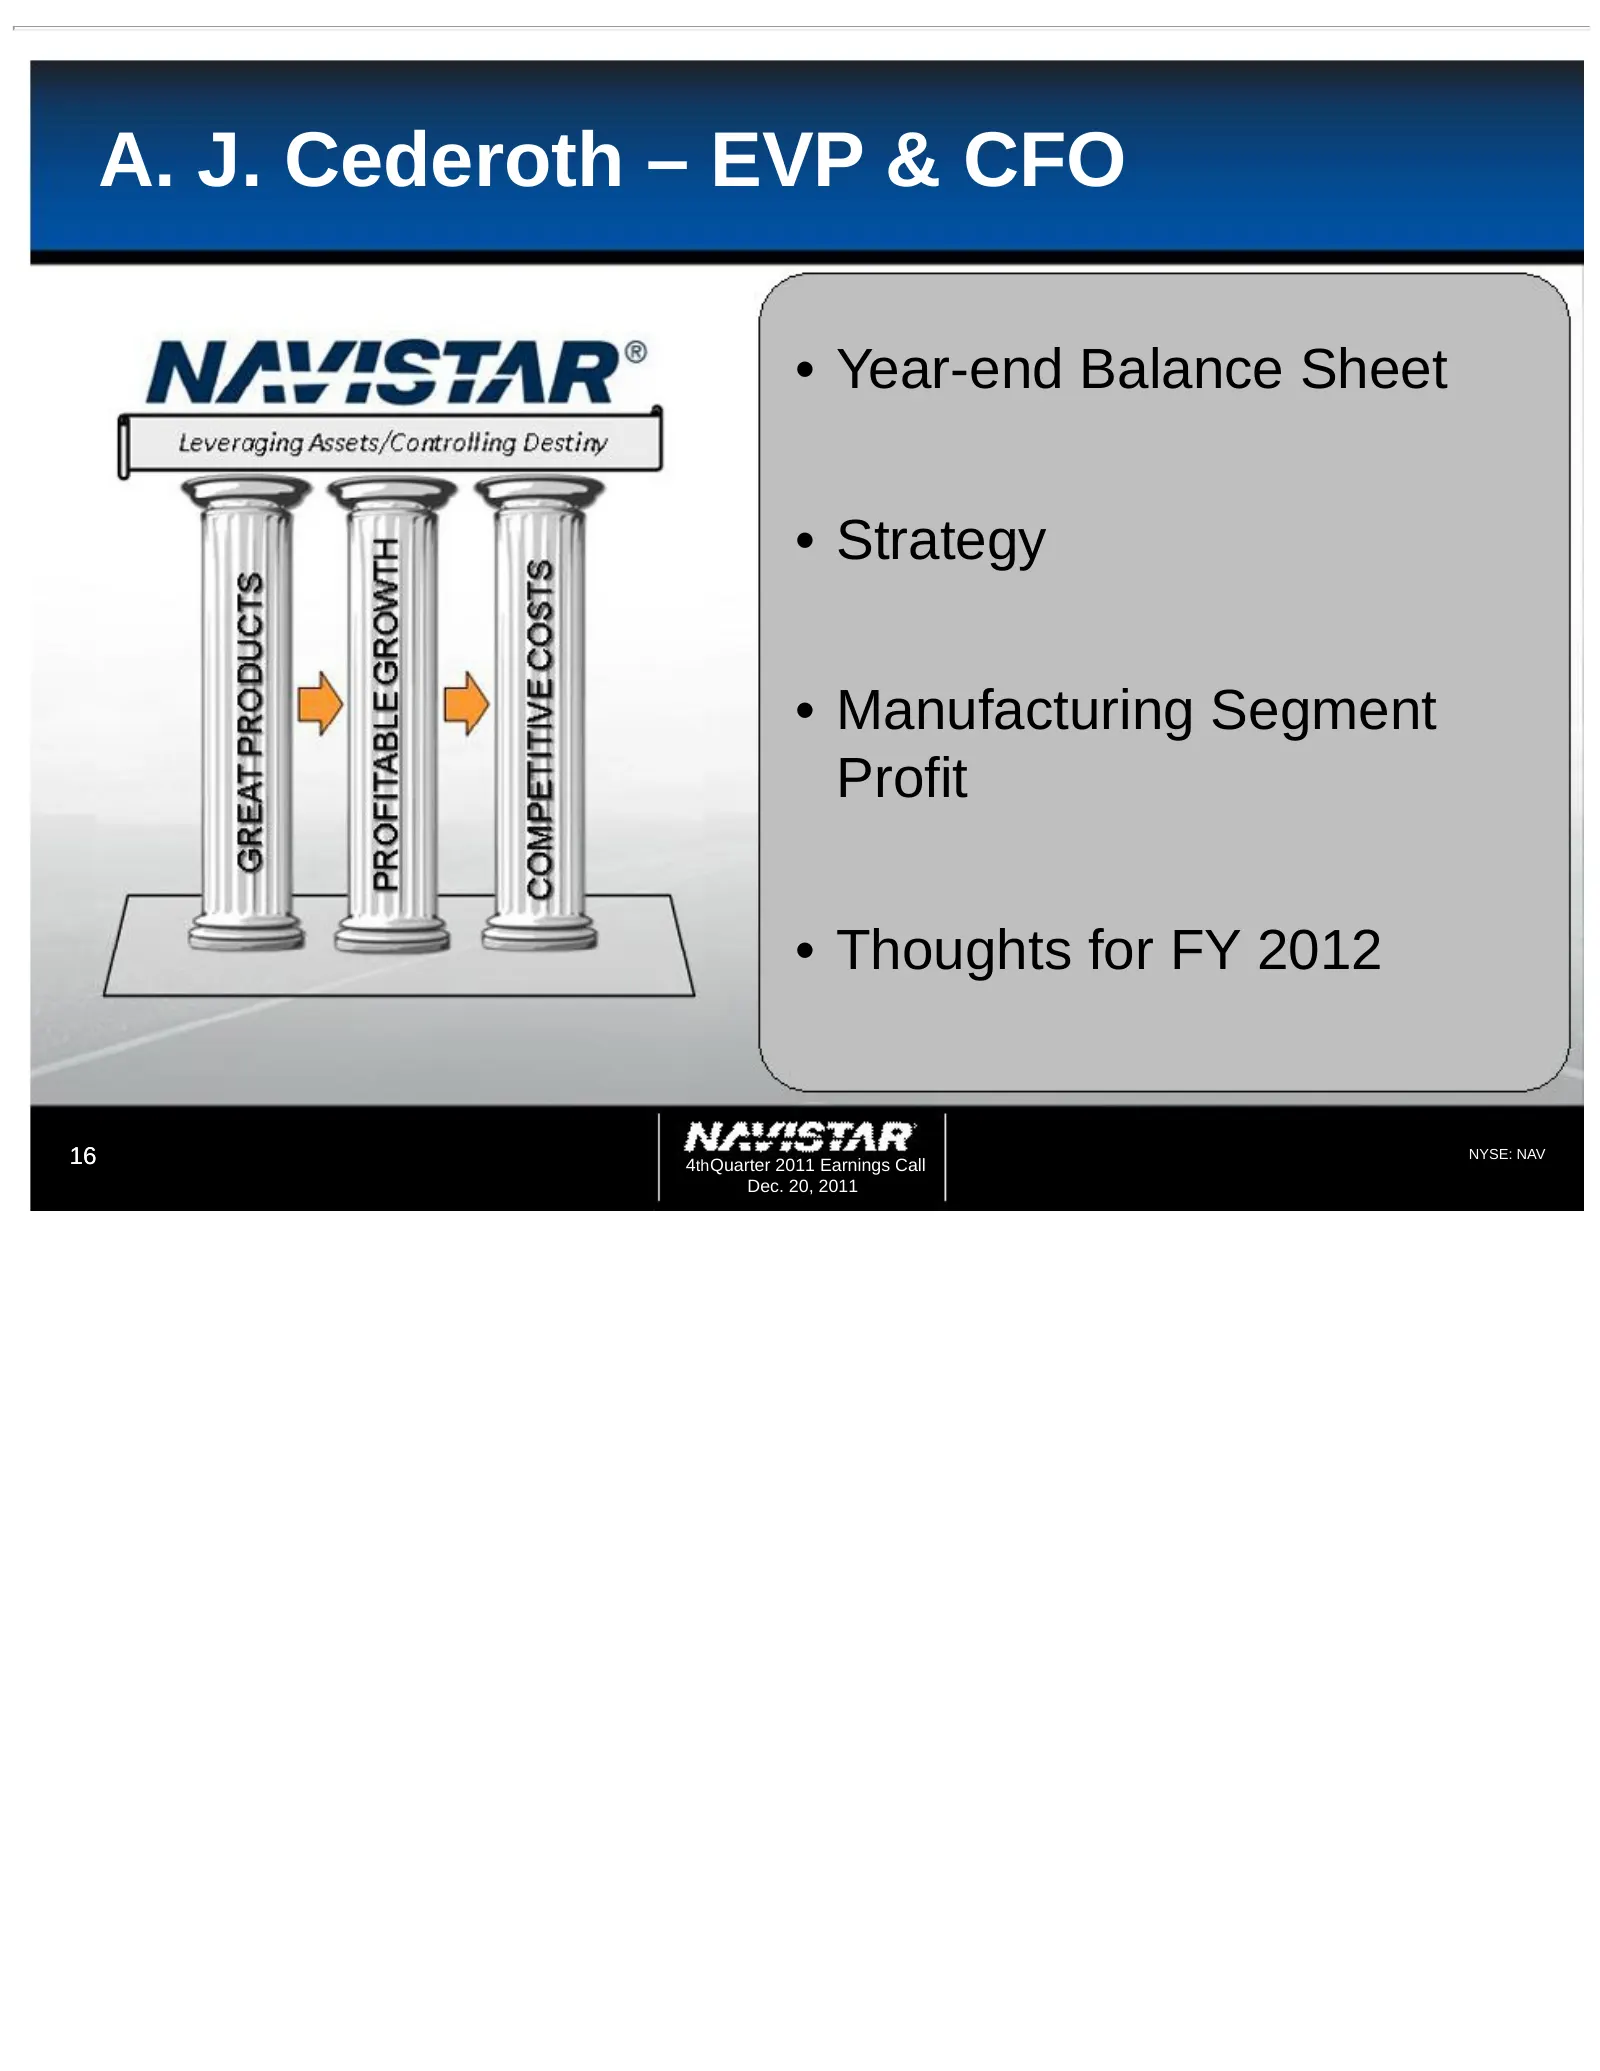
Slide 16: A. J. Cederoth – EVP & CFO
A. J. Cederoth – EVP & CFO • Year-end Balance Sheet • Strategy • Manufacturing Segment Profit • Thoughts for FY 2012 16 4th Quarter 2011 Earnings Call NYSE: NAV Dec. 20, 2011
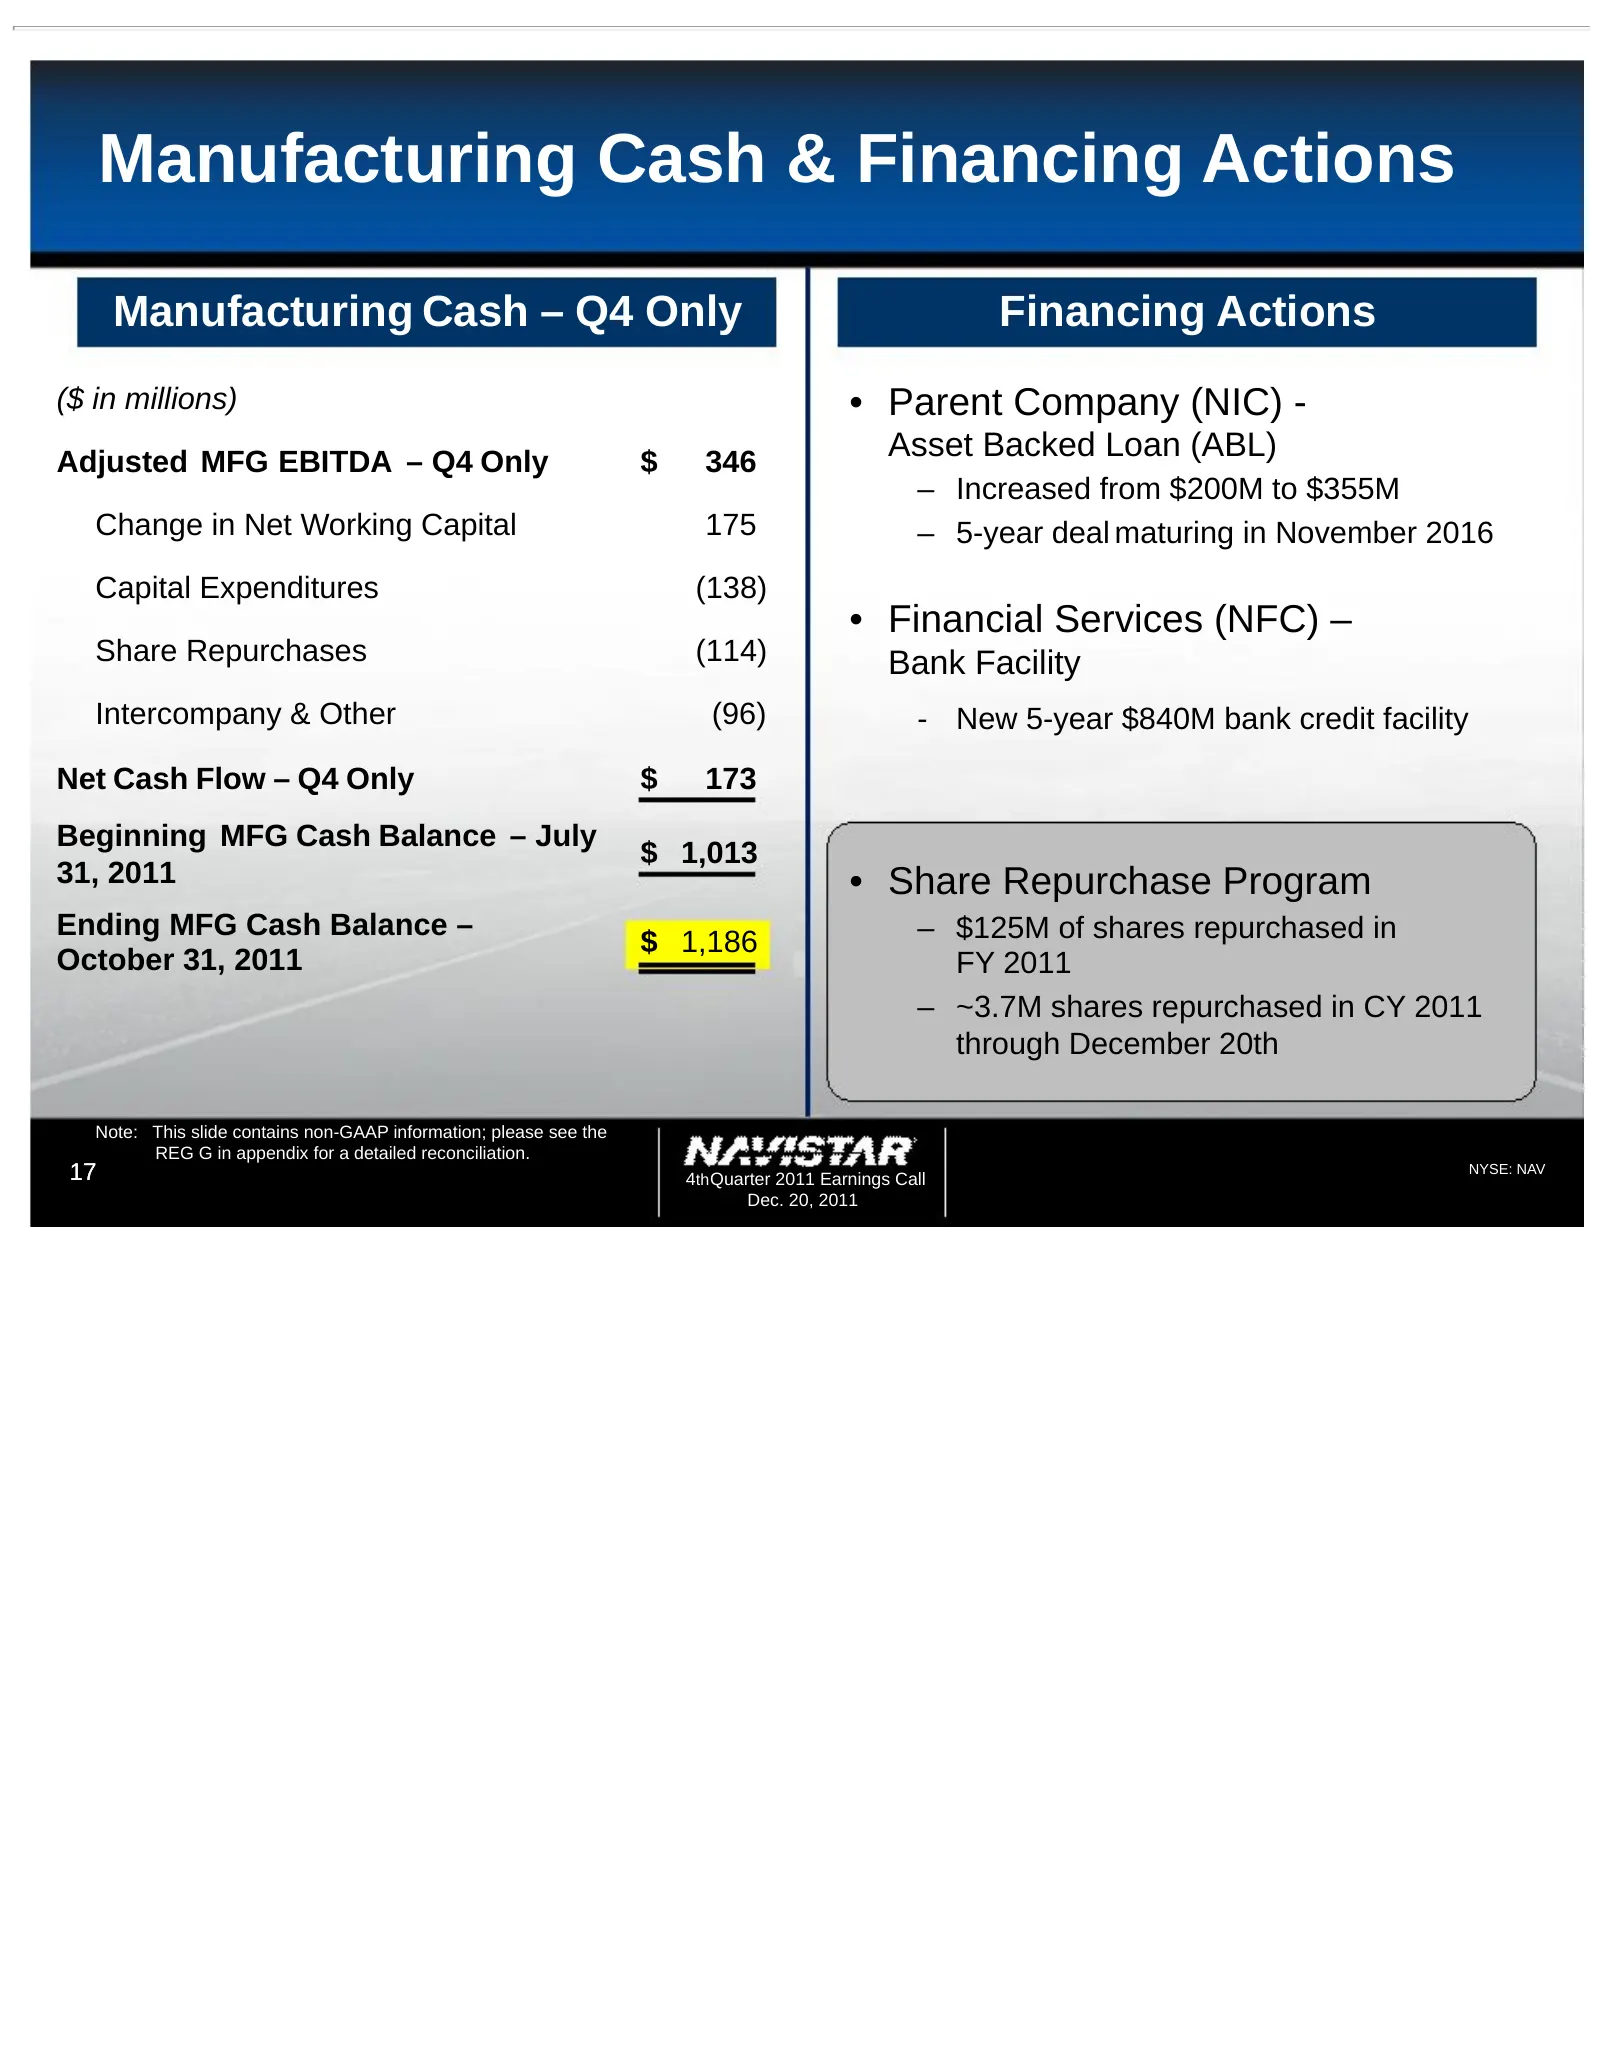
Slide 17: Manufacturing Cash & Financing Actions
Manufacturing Cash & Financing Actions Manufacturing Cash – Q4 Only Financing Actions ($ in millions) • Parent Company (NIC) - Adjusted MFG EBITDA – Q4 Only $ 346 Asset Backed Loan (ABL) – Increased from $200M to $355M Change in Net Working Capital 175 – 5-year deal maturing in November 2016 Capital
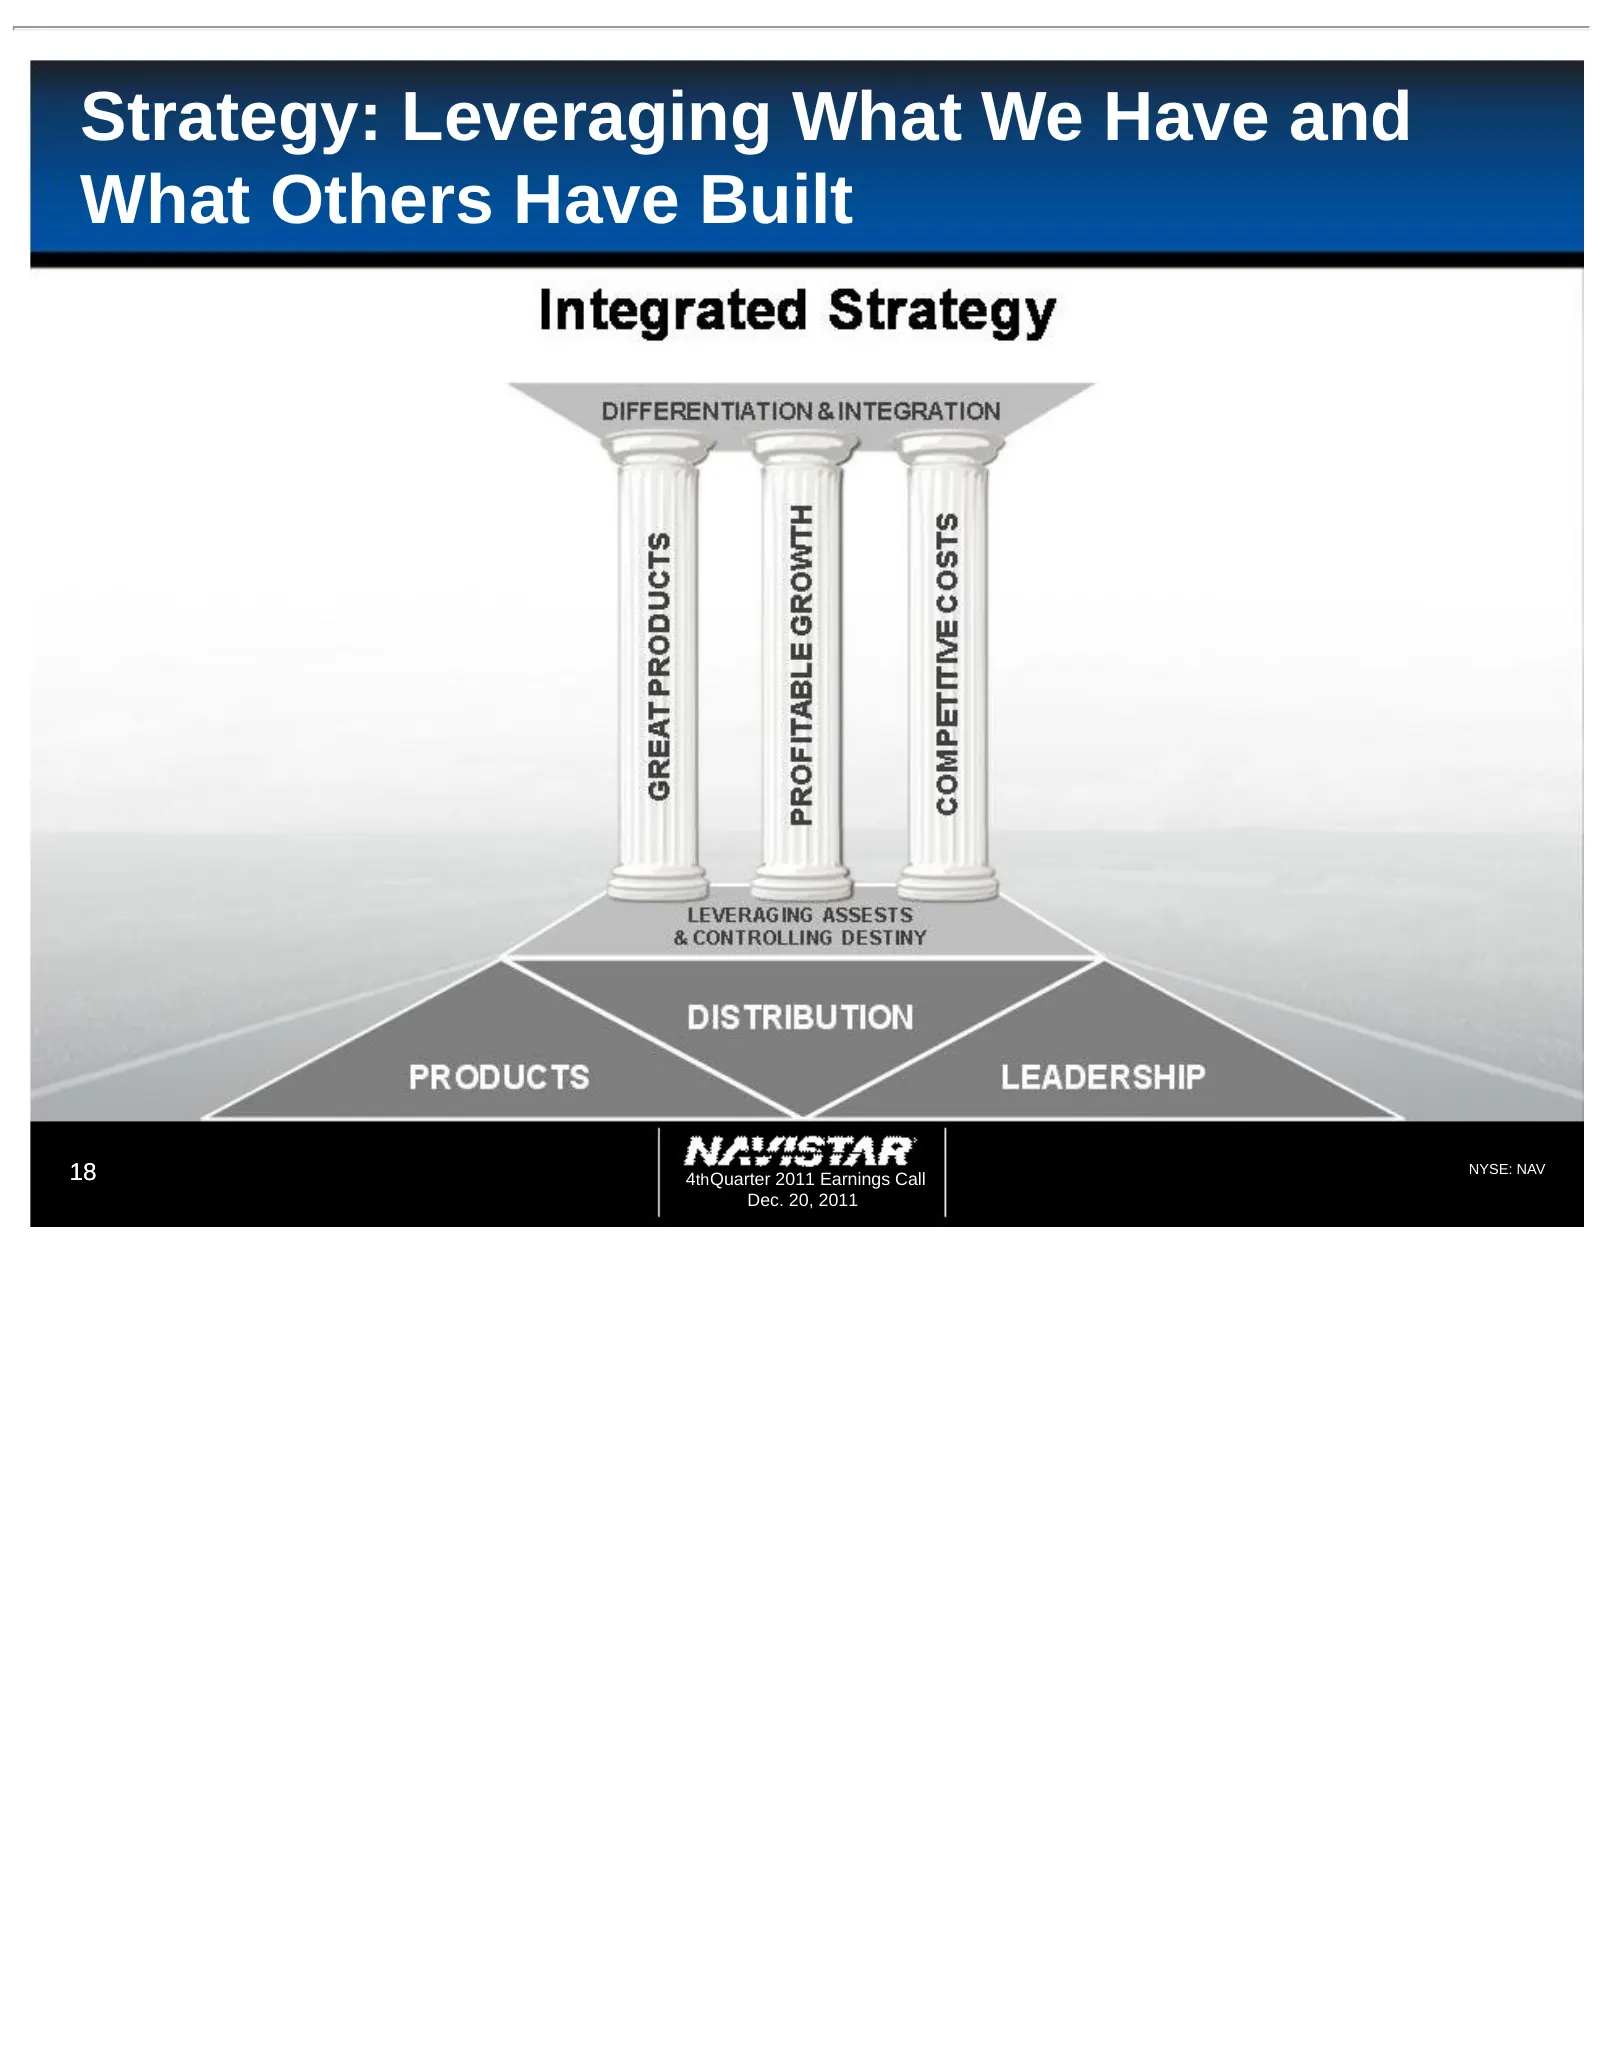
Slide 18: Strategy: Leveraging What We Have and What Others Have Built
Strategy: Leveraging What We Have and What Others Have Built 18 4th Quarter 2011 Earnings Call NYSE: NAV Dec. 20, 2011
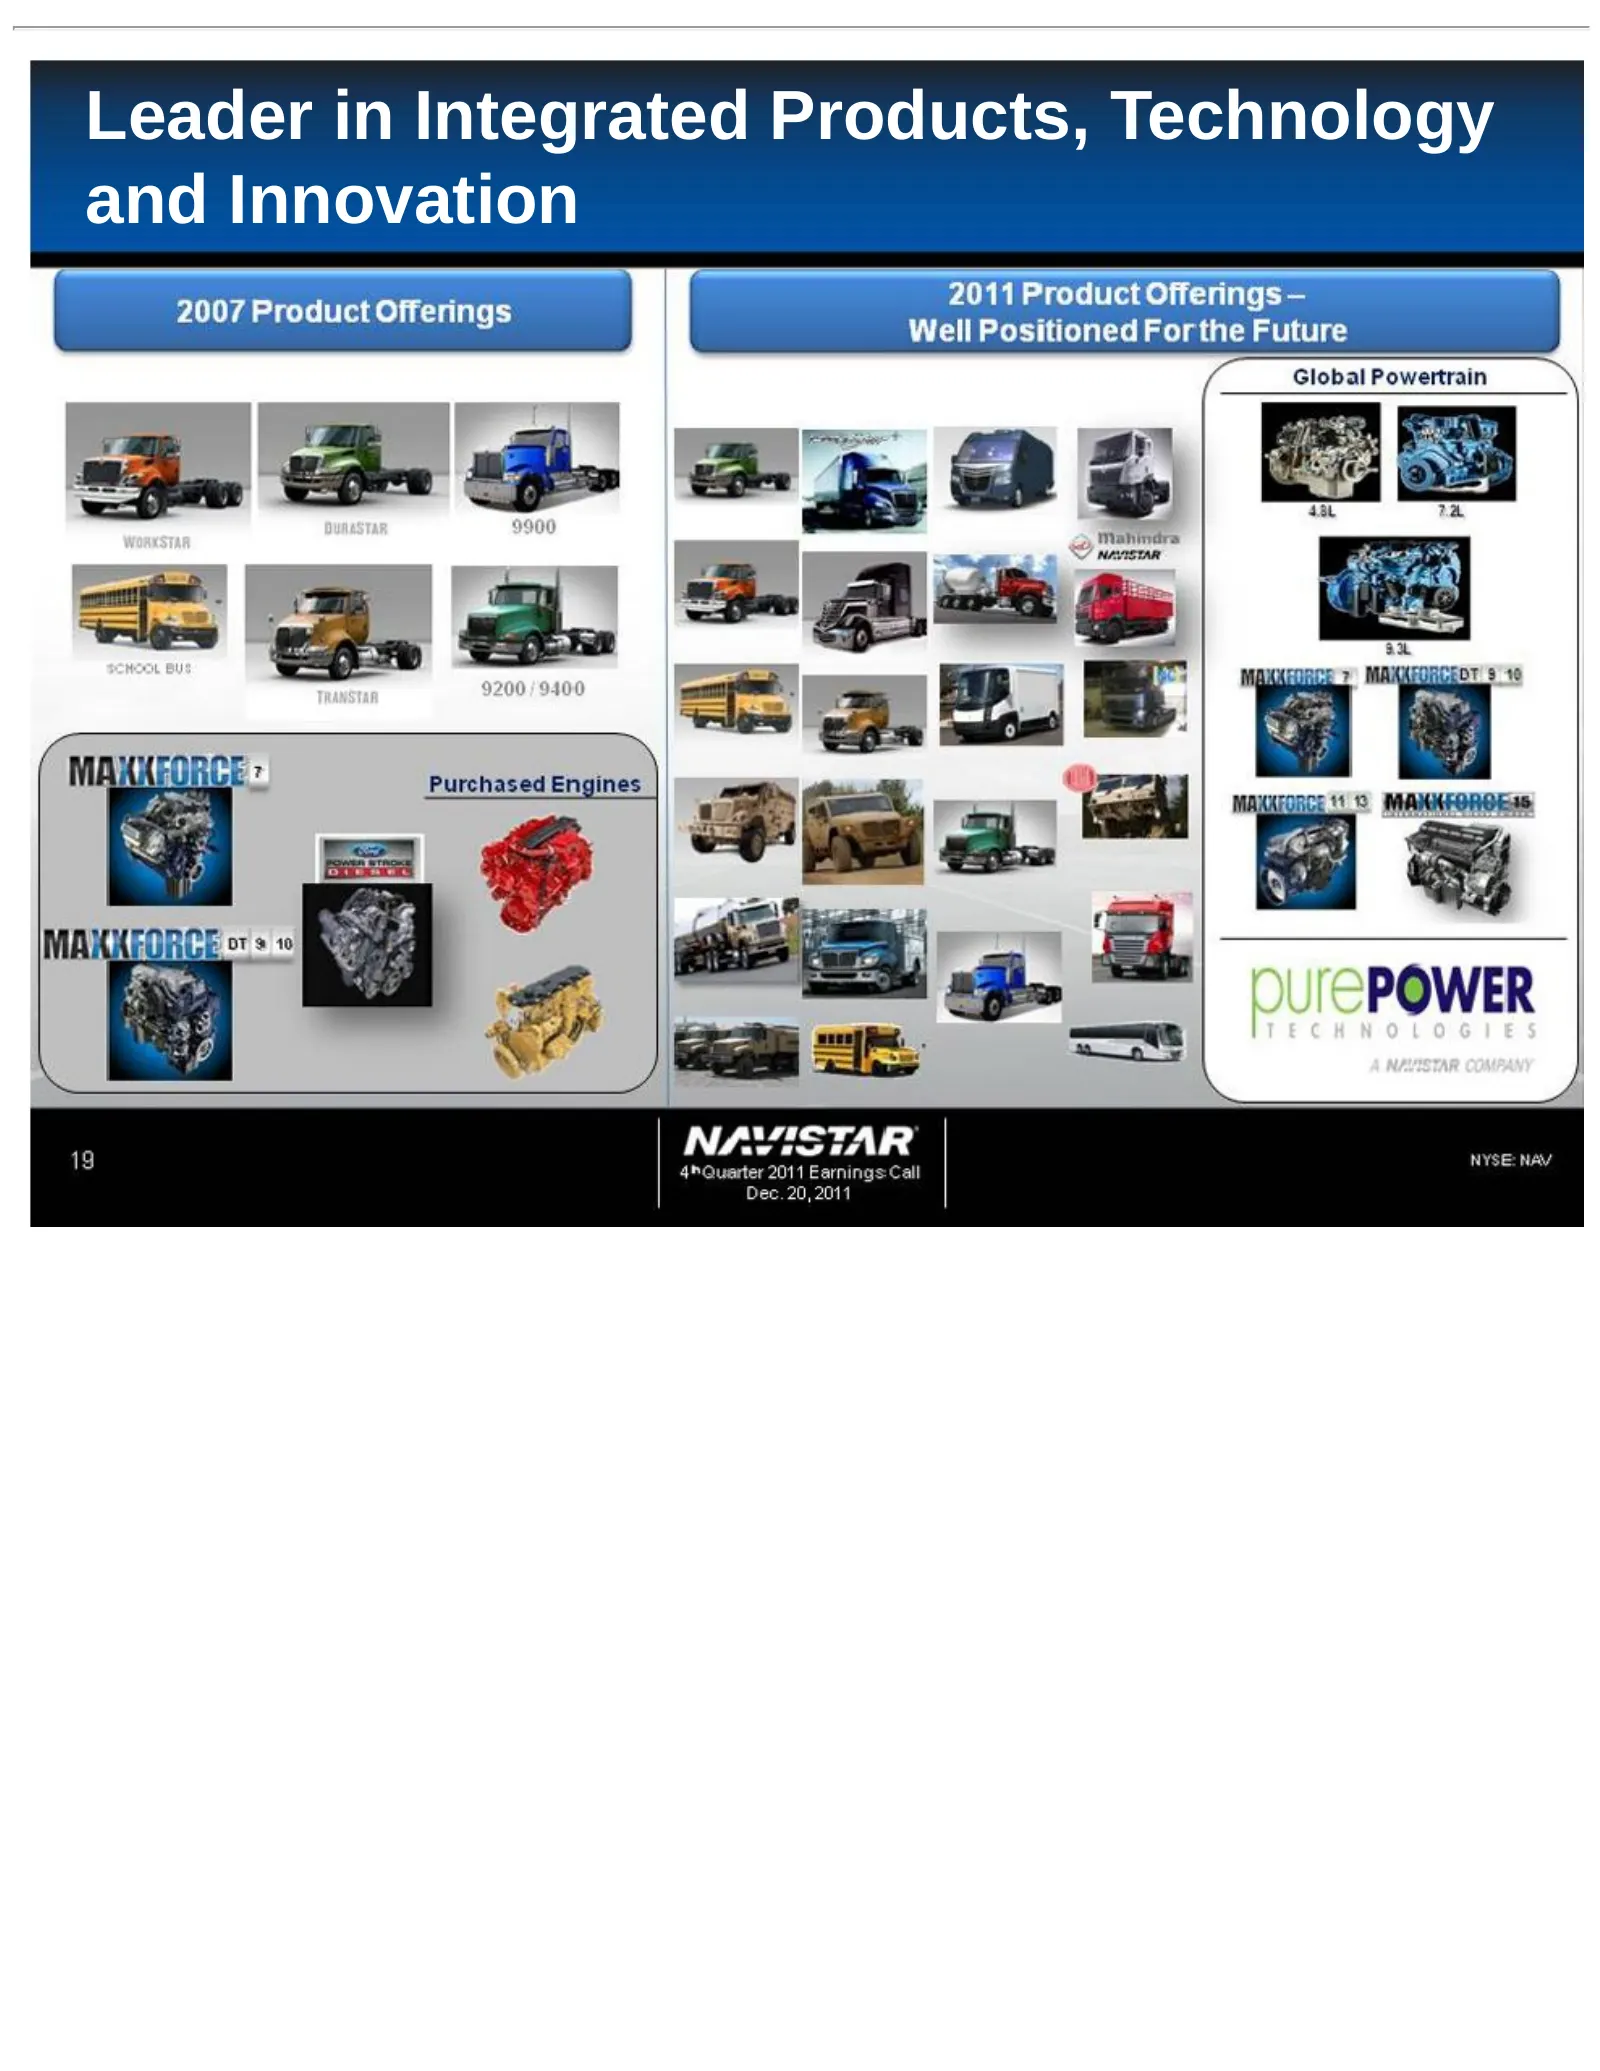
Slide 19: Leader in Integrated Products, Technology and Innovation
Leader in Integrated Products, Technology and Innovation
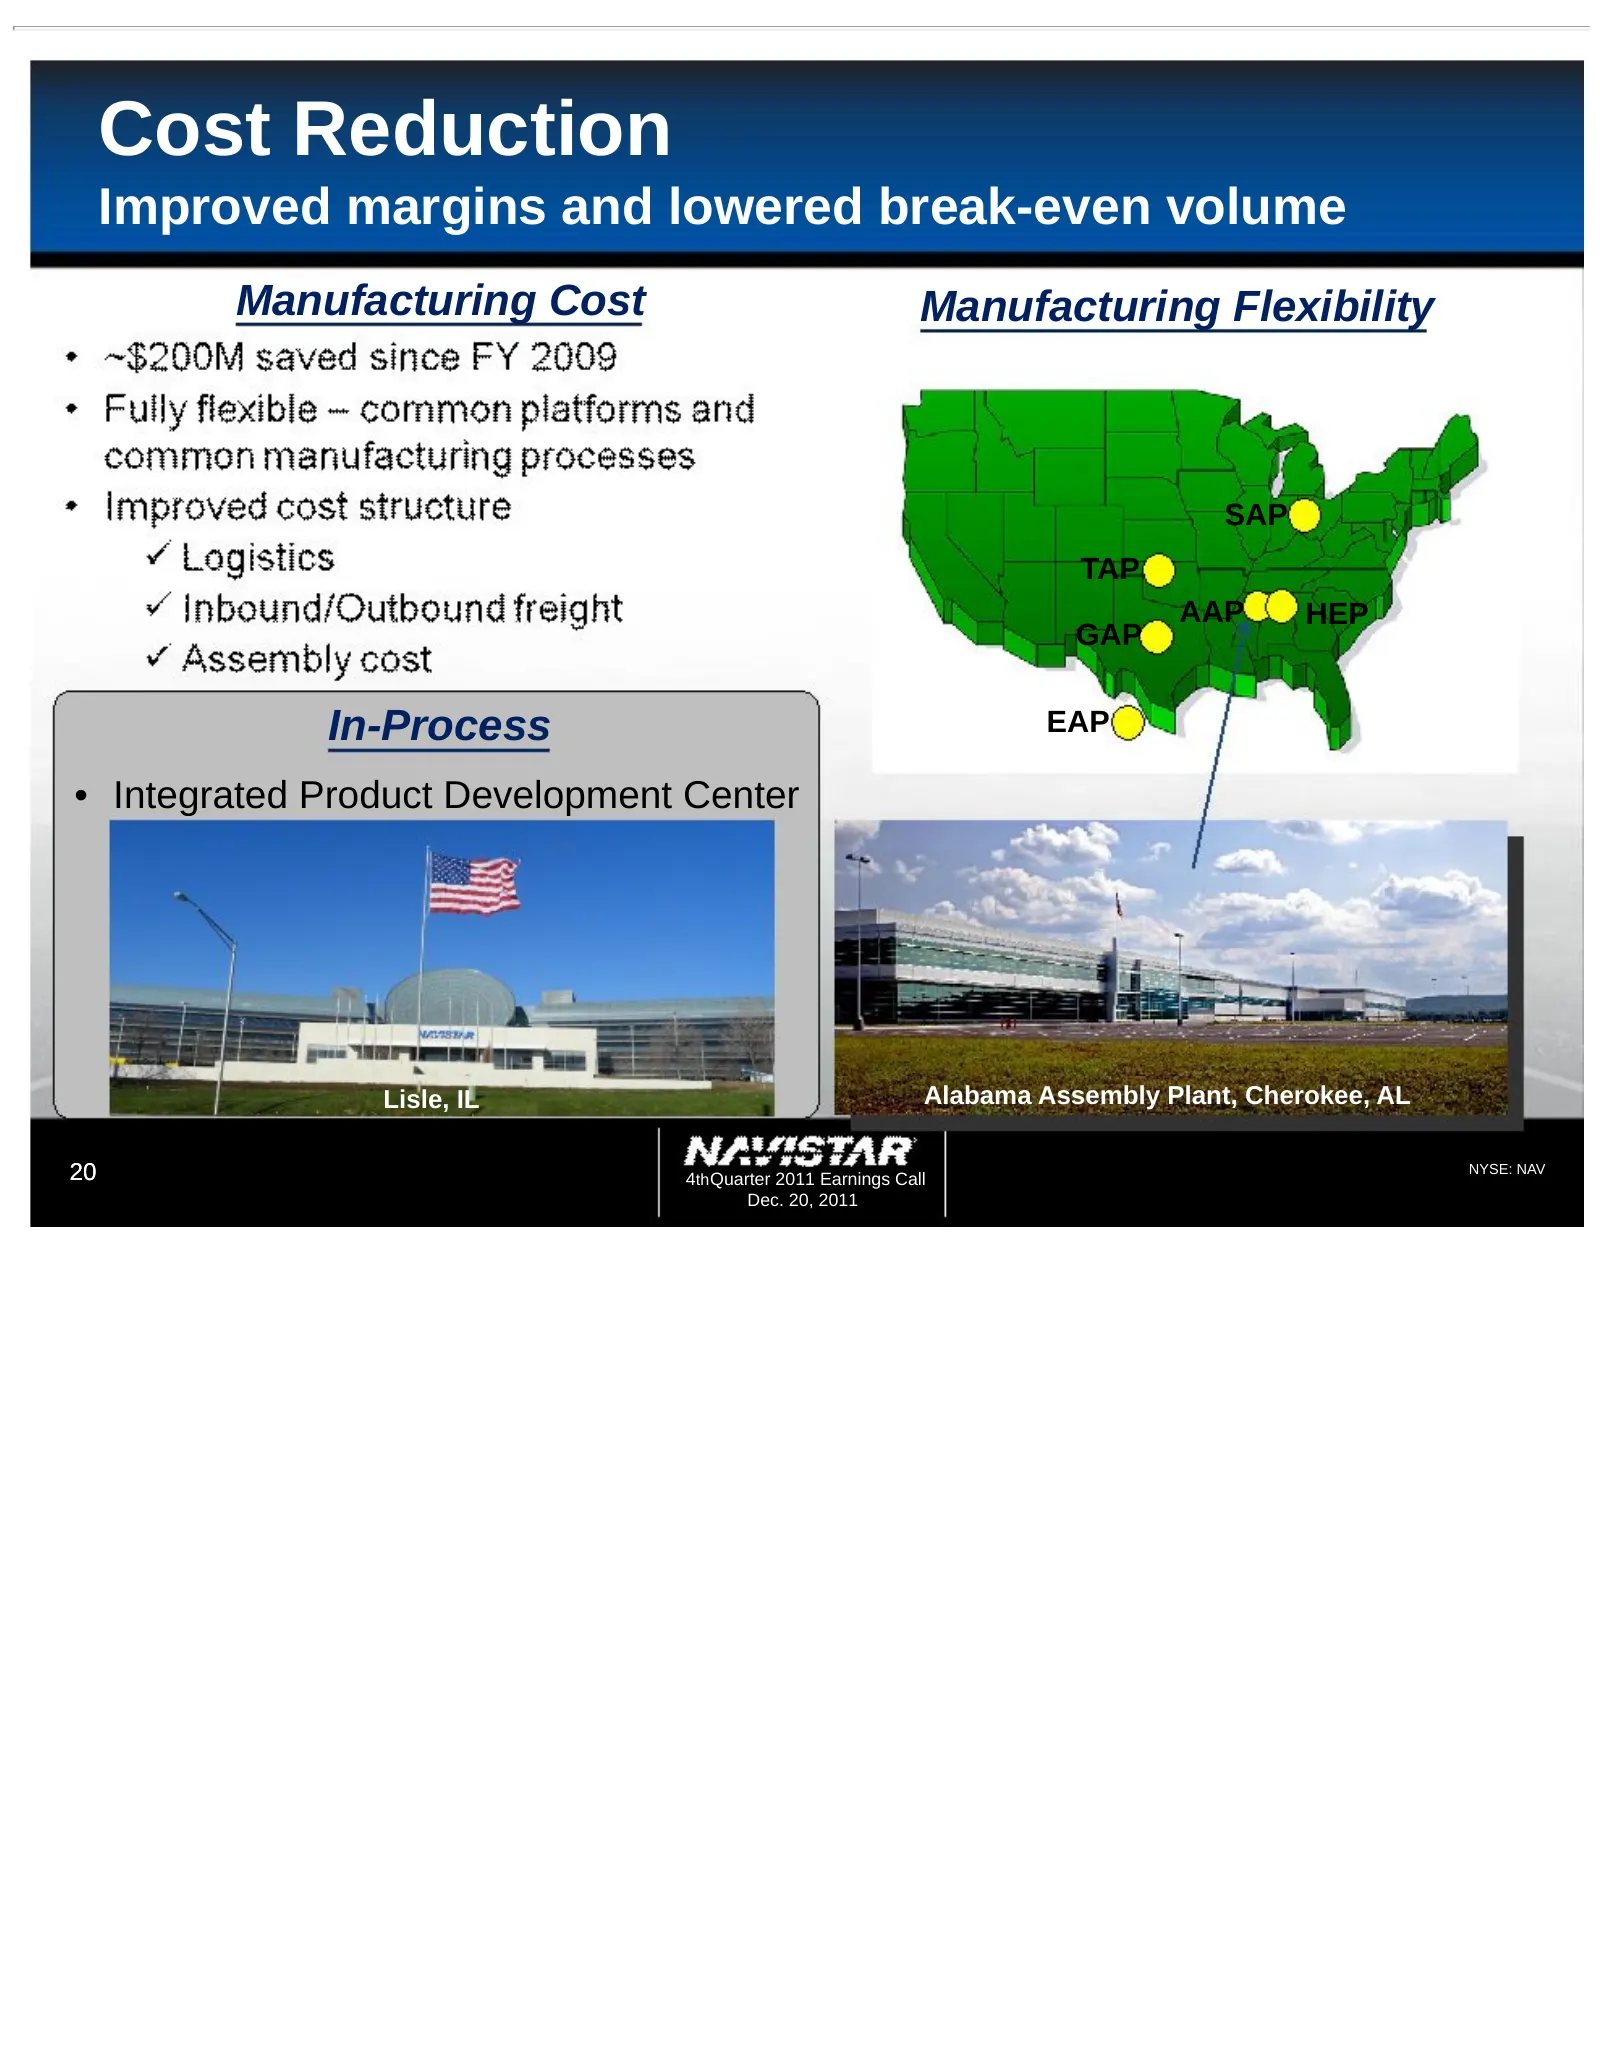
Slide 20: Cost Reduction
Cost Reduction Improved margins and lowered break-even volume Manufacturing Cost Manufacturing Flexibility SAP TAP AAP HEP GAP In-Process EAP • Integrated Product Development Center Lisle, IL Alabama Assembly Plant, Cherokee, AL 20 4th Quarter 2011 Earnings Call NYSE: NAV Dec. 20, 2011
Slide 21: Competitive Cost Structure
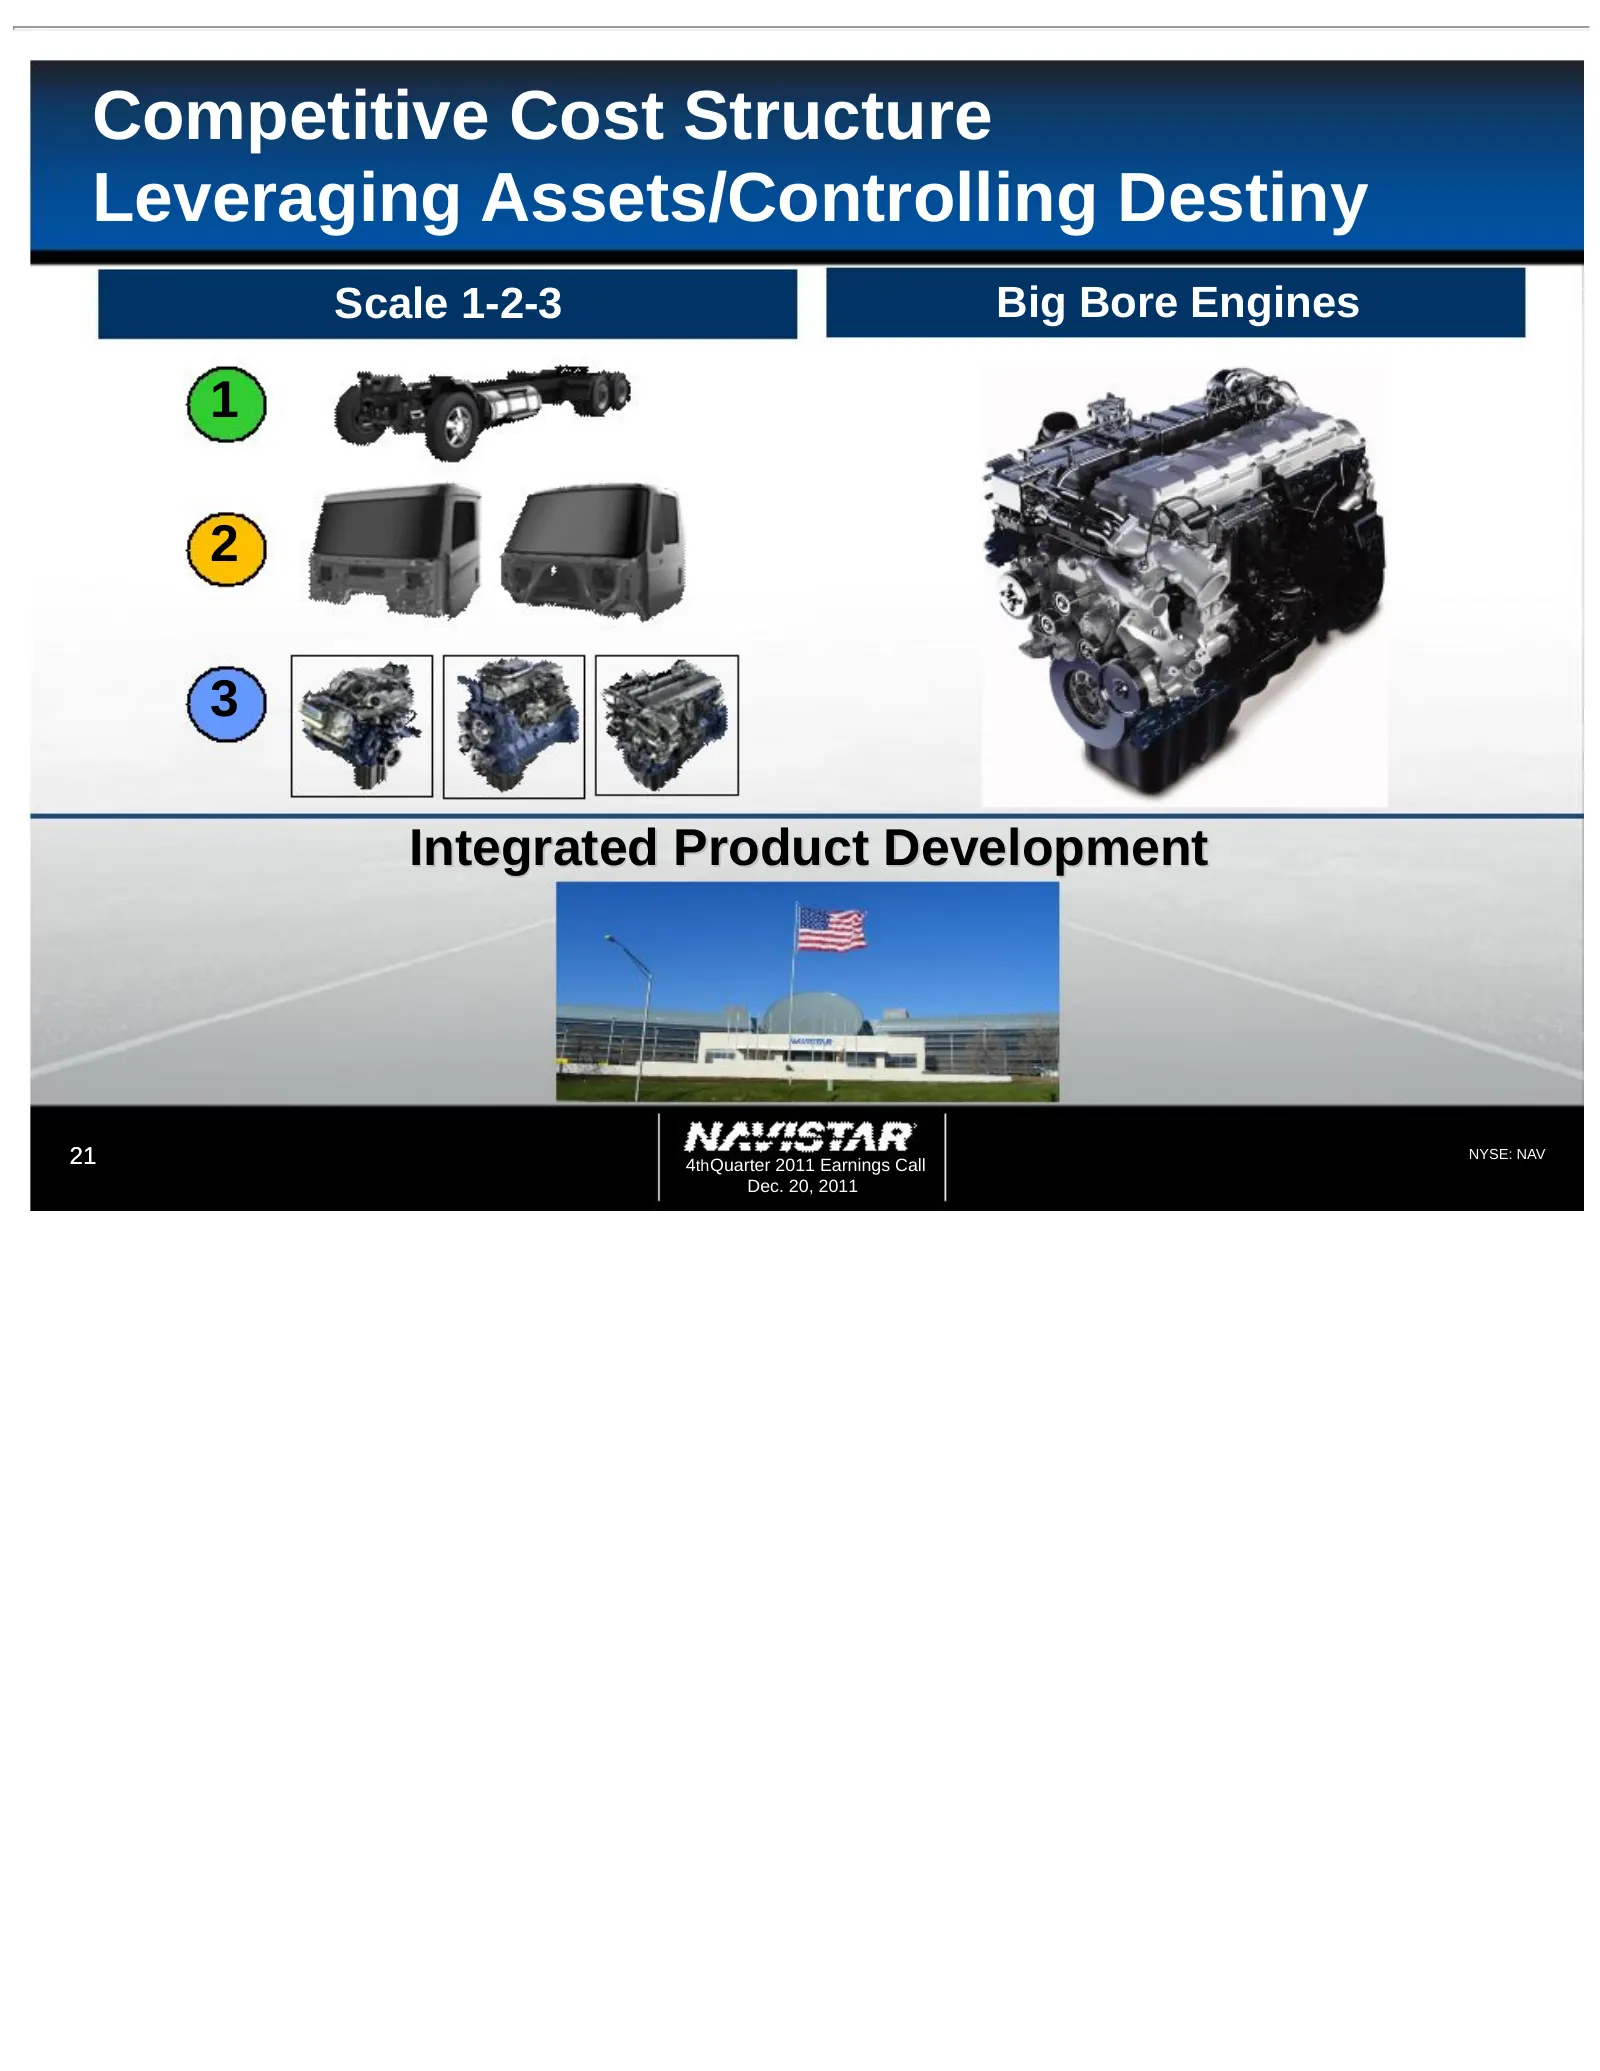
Competitive Cost Structure Leveraging Assets/Controlling Destiny Scale 1-2-3 Big Bore Engines 1 2 3 Integrated Product Development 21 4th Quarter 2011 Earnings Call 21 NYSE: NAV Dec. 20, 2011
Slide 22: Leveraging our Assets and Integration
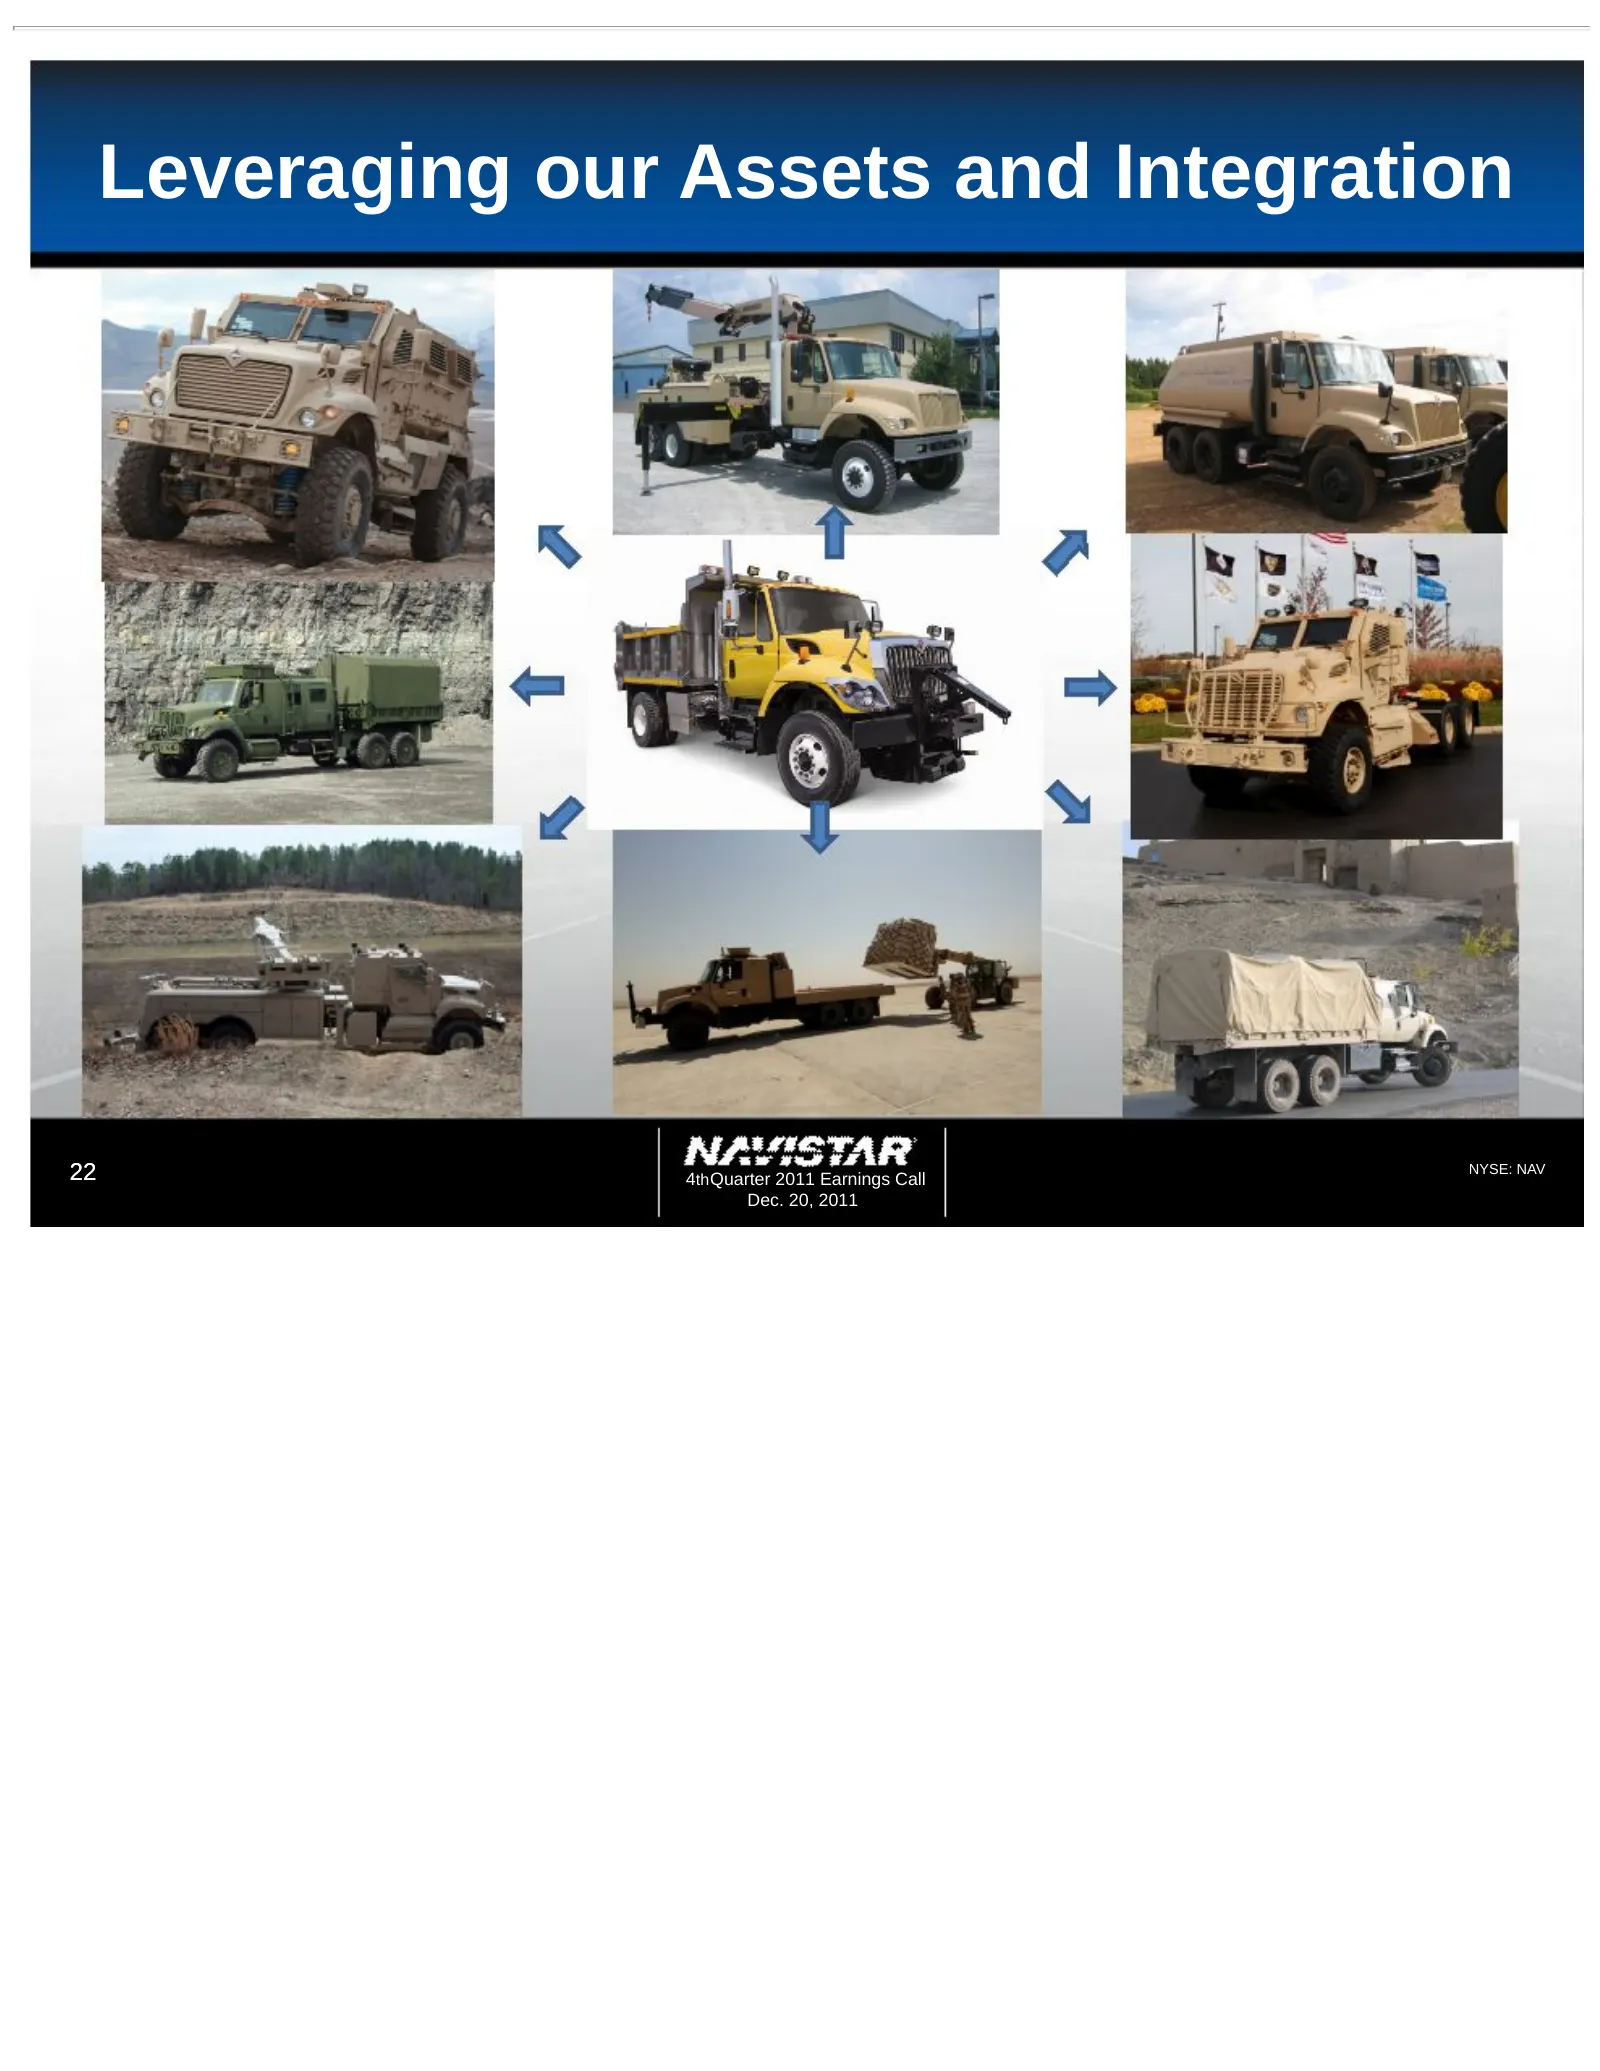
Leveraging our Assets and Integration 22 4th Quarter 2011 Earnings Call NYSE: NAV Dec. 20, 2011
Slide 23: Leveraging our Assets and Integration
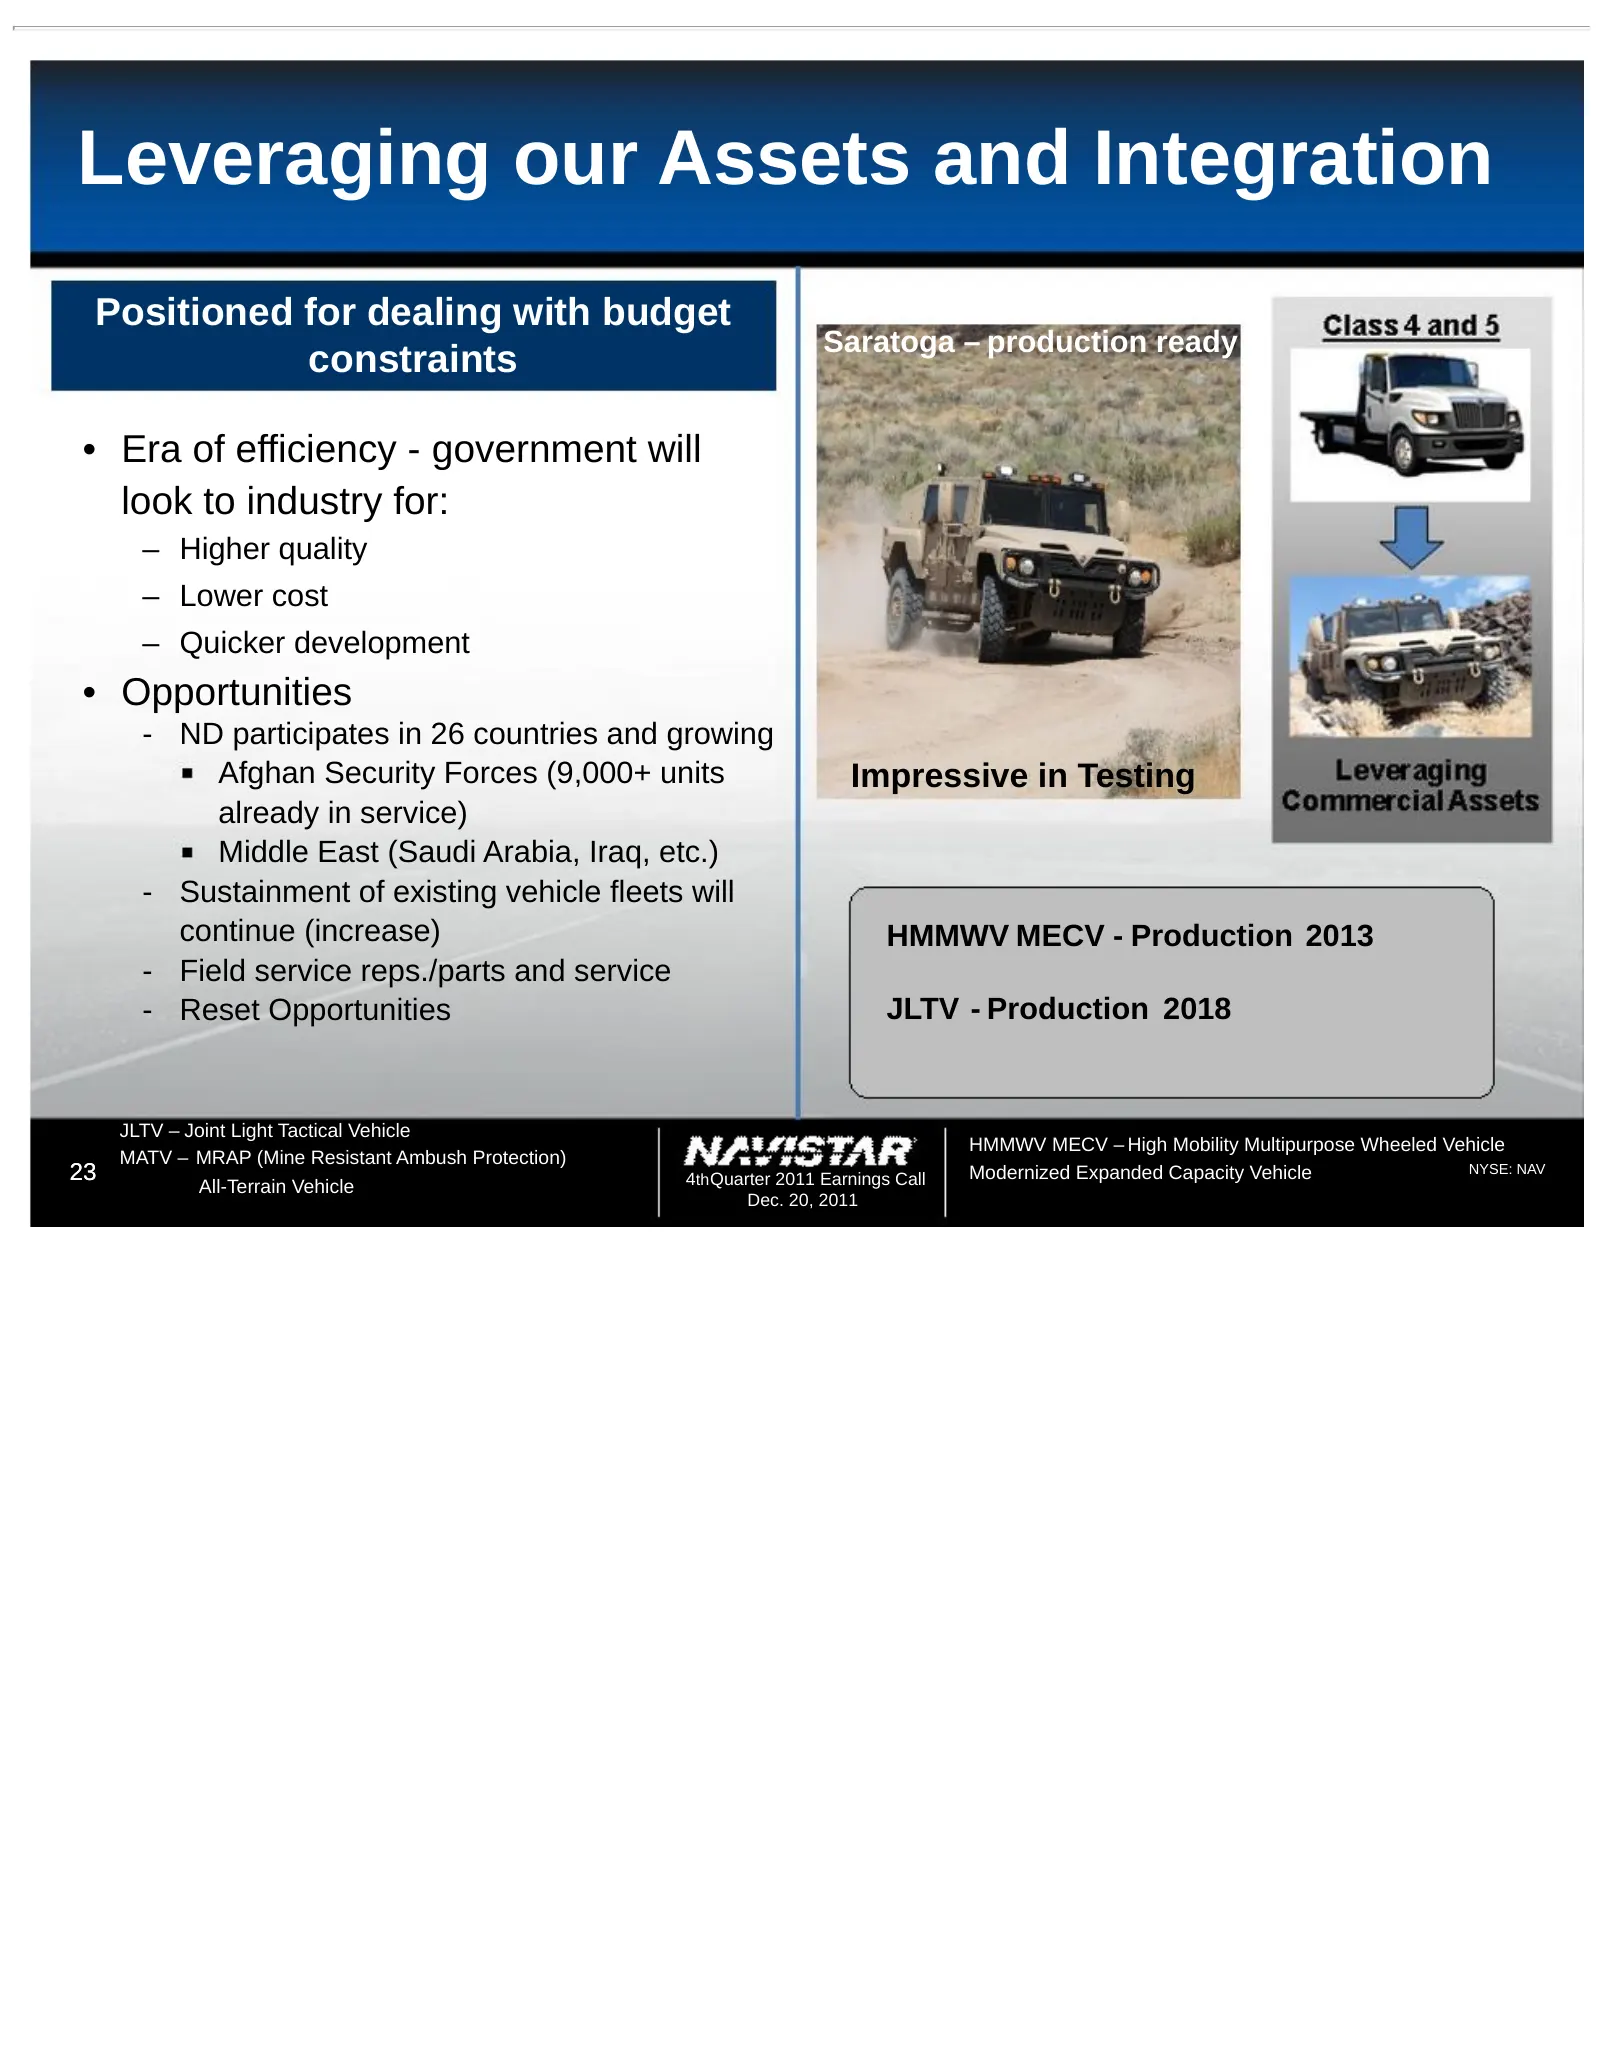
Leveraging our Assets and Integration Positioned for dealing with budget Saratoga – production ready constraints • Era of efficiency - government will look to industry for: – Higher quality – Lower cost – Quicker development • Opportunities - ND participates in 26 countries and growing Afghan Securi
Slide 24: Parts – Positioned for Continued Growth
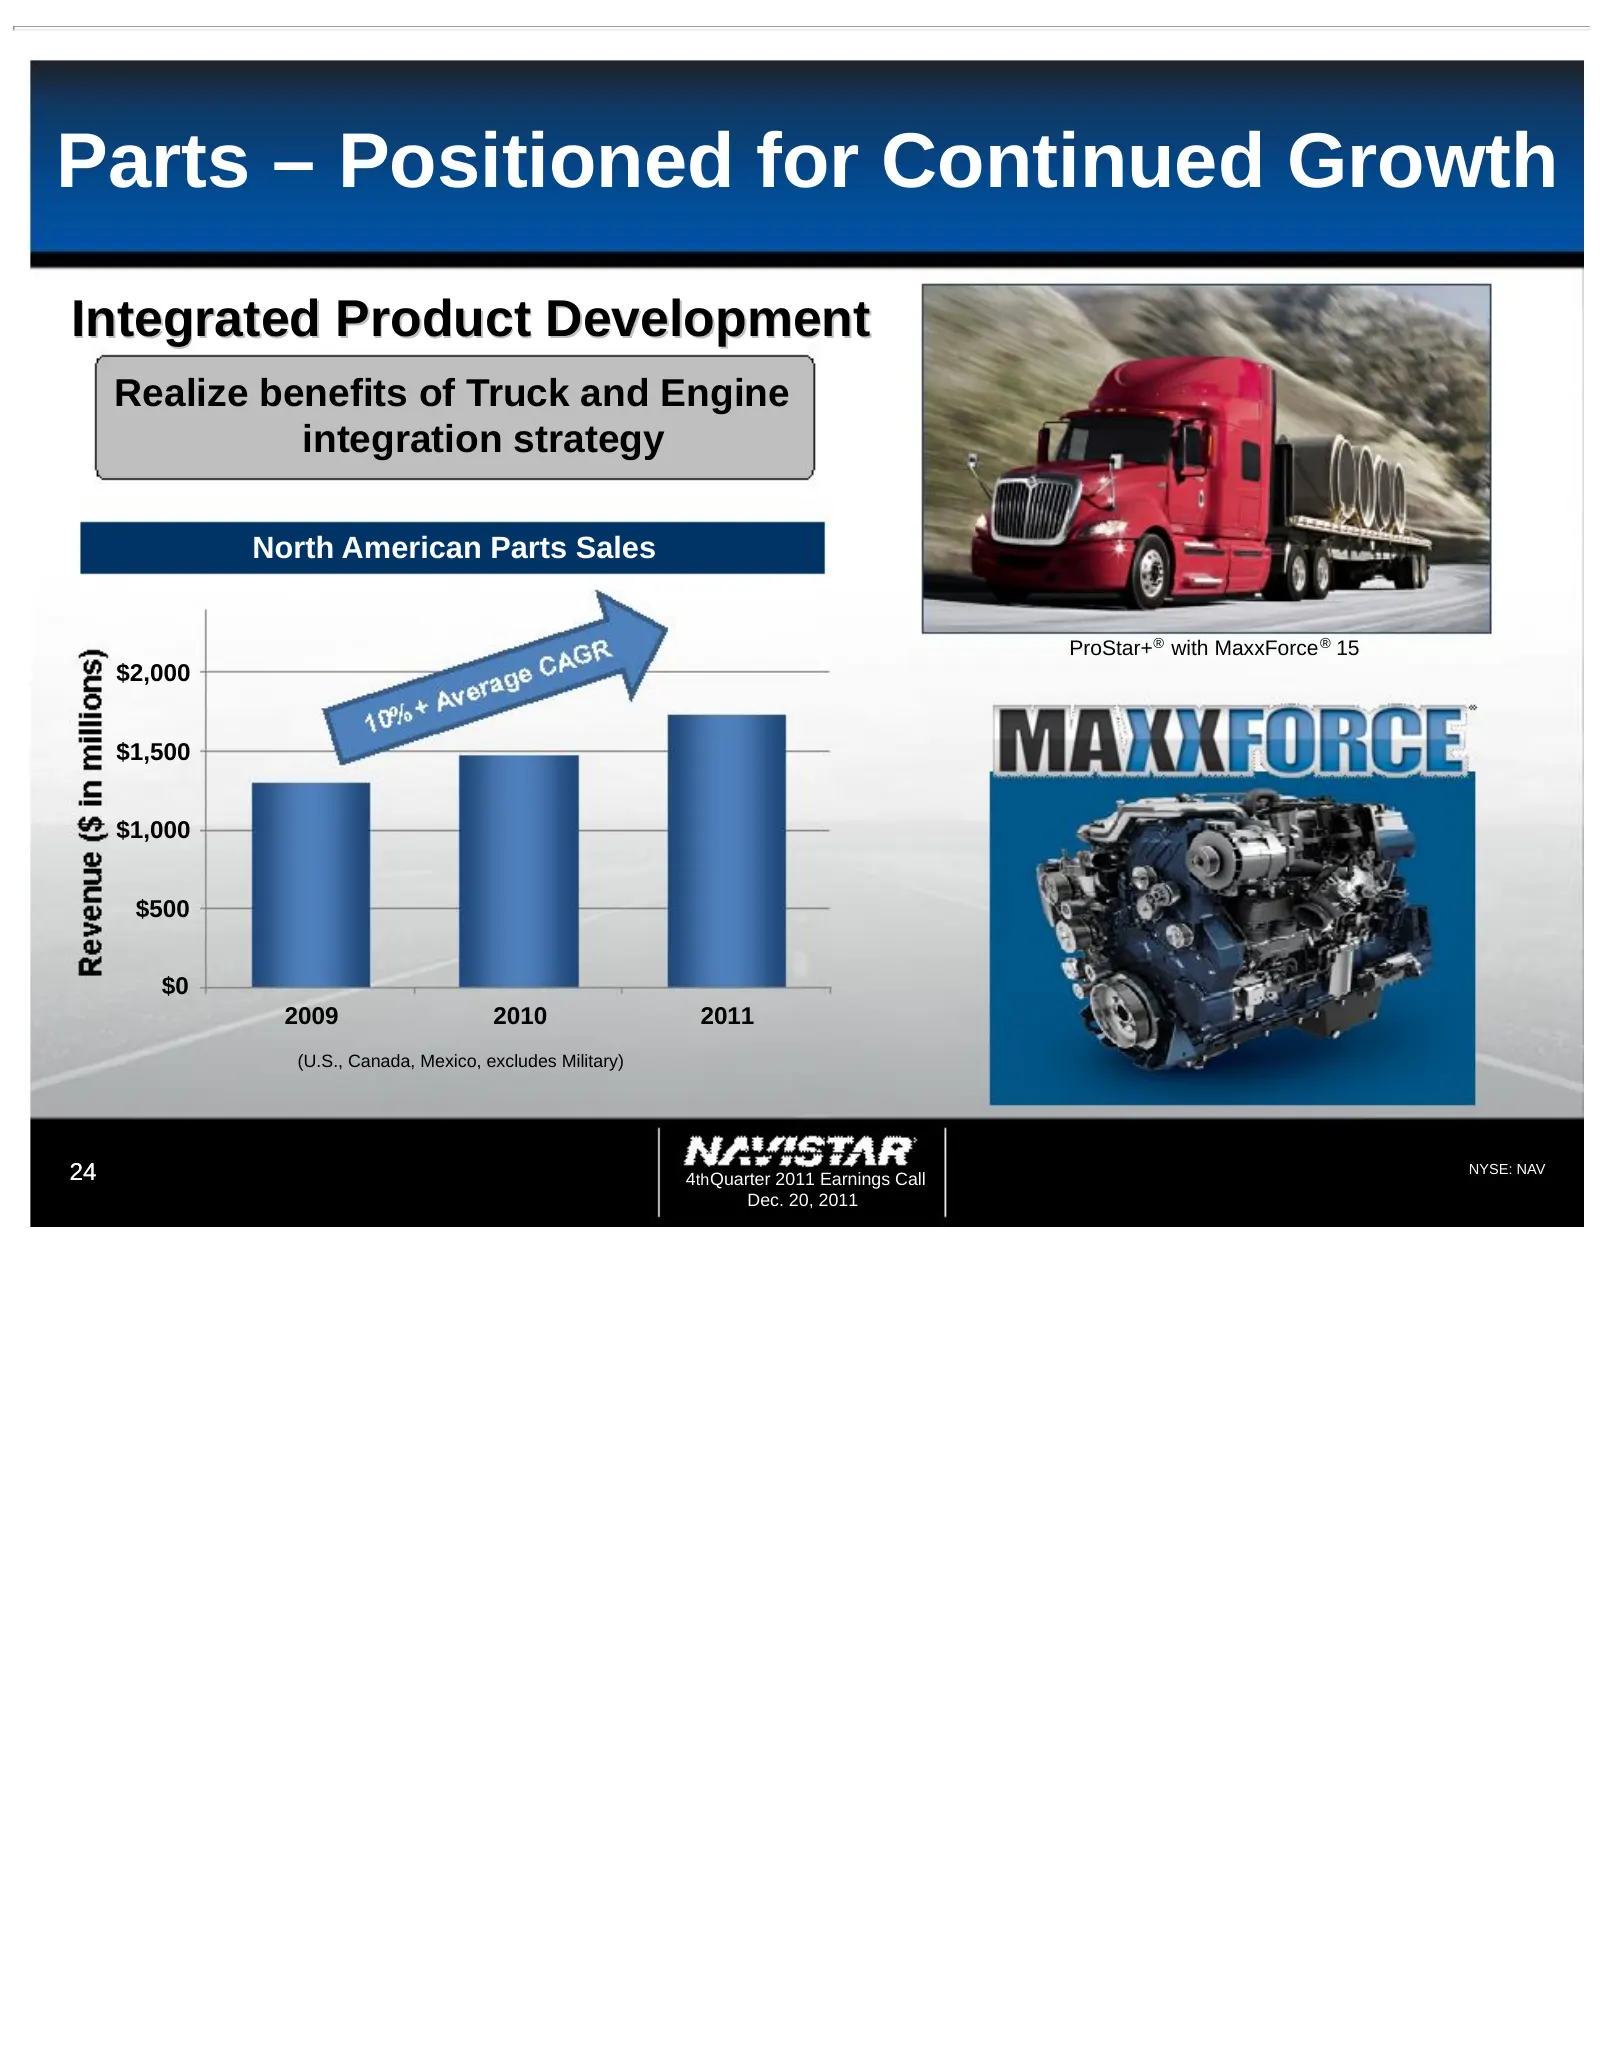
Parts – Positioned for Continued Growth Integrated Product Development Realize benefits of Truck and Engine integration strategy North American Parts Sales ProStar+® with MaxxForce ® 15 $2,000 $1,500 $1,000 $500 $0 2009 2010 2011 (U.S., Canada, Mexico, excludes Military) 24 4th Quarter 2011 Earnings
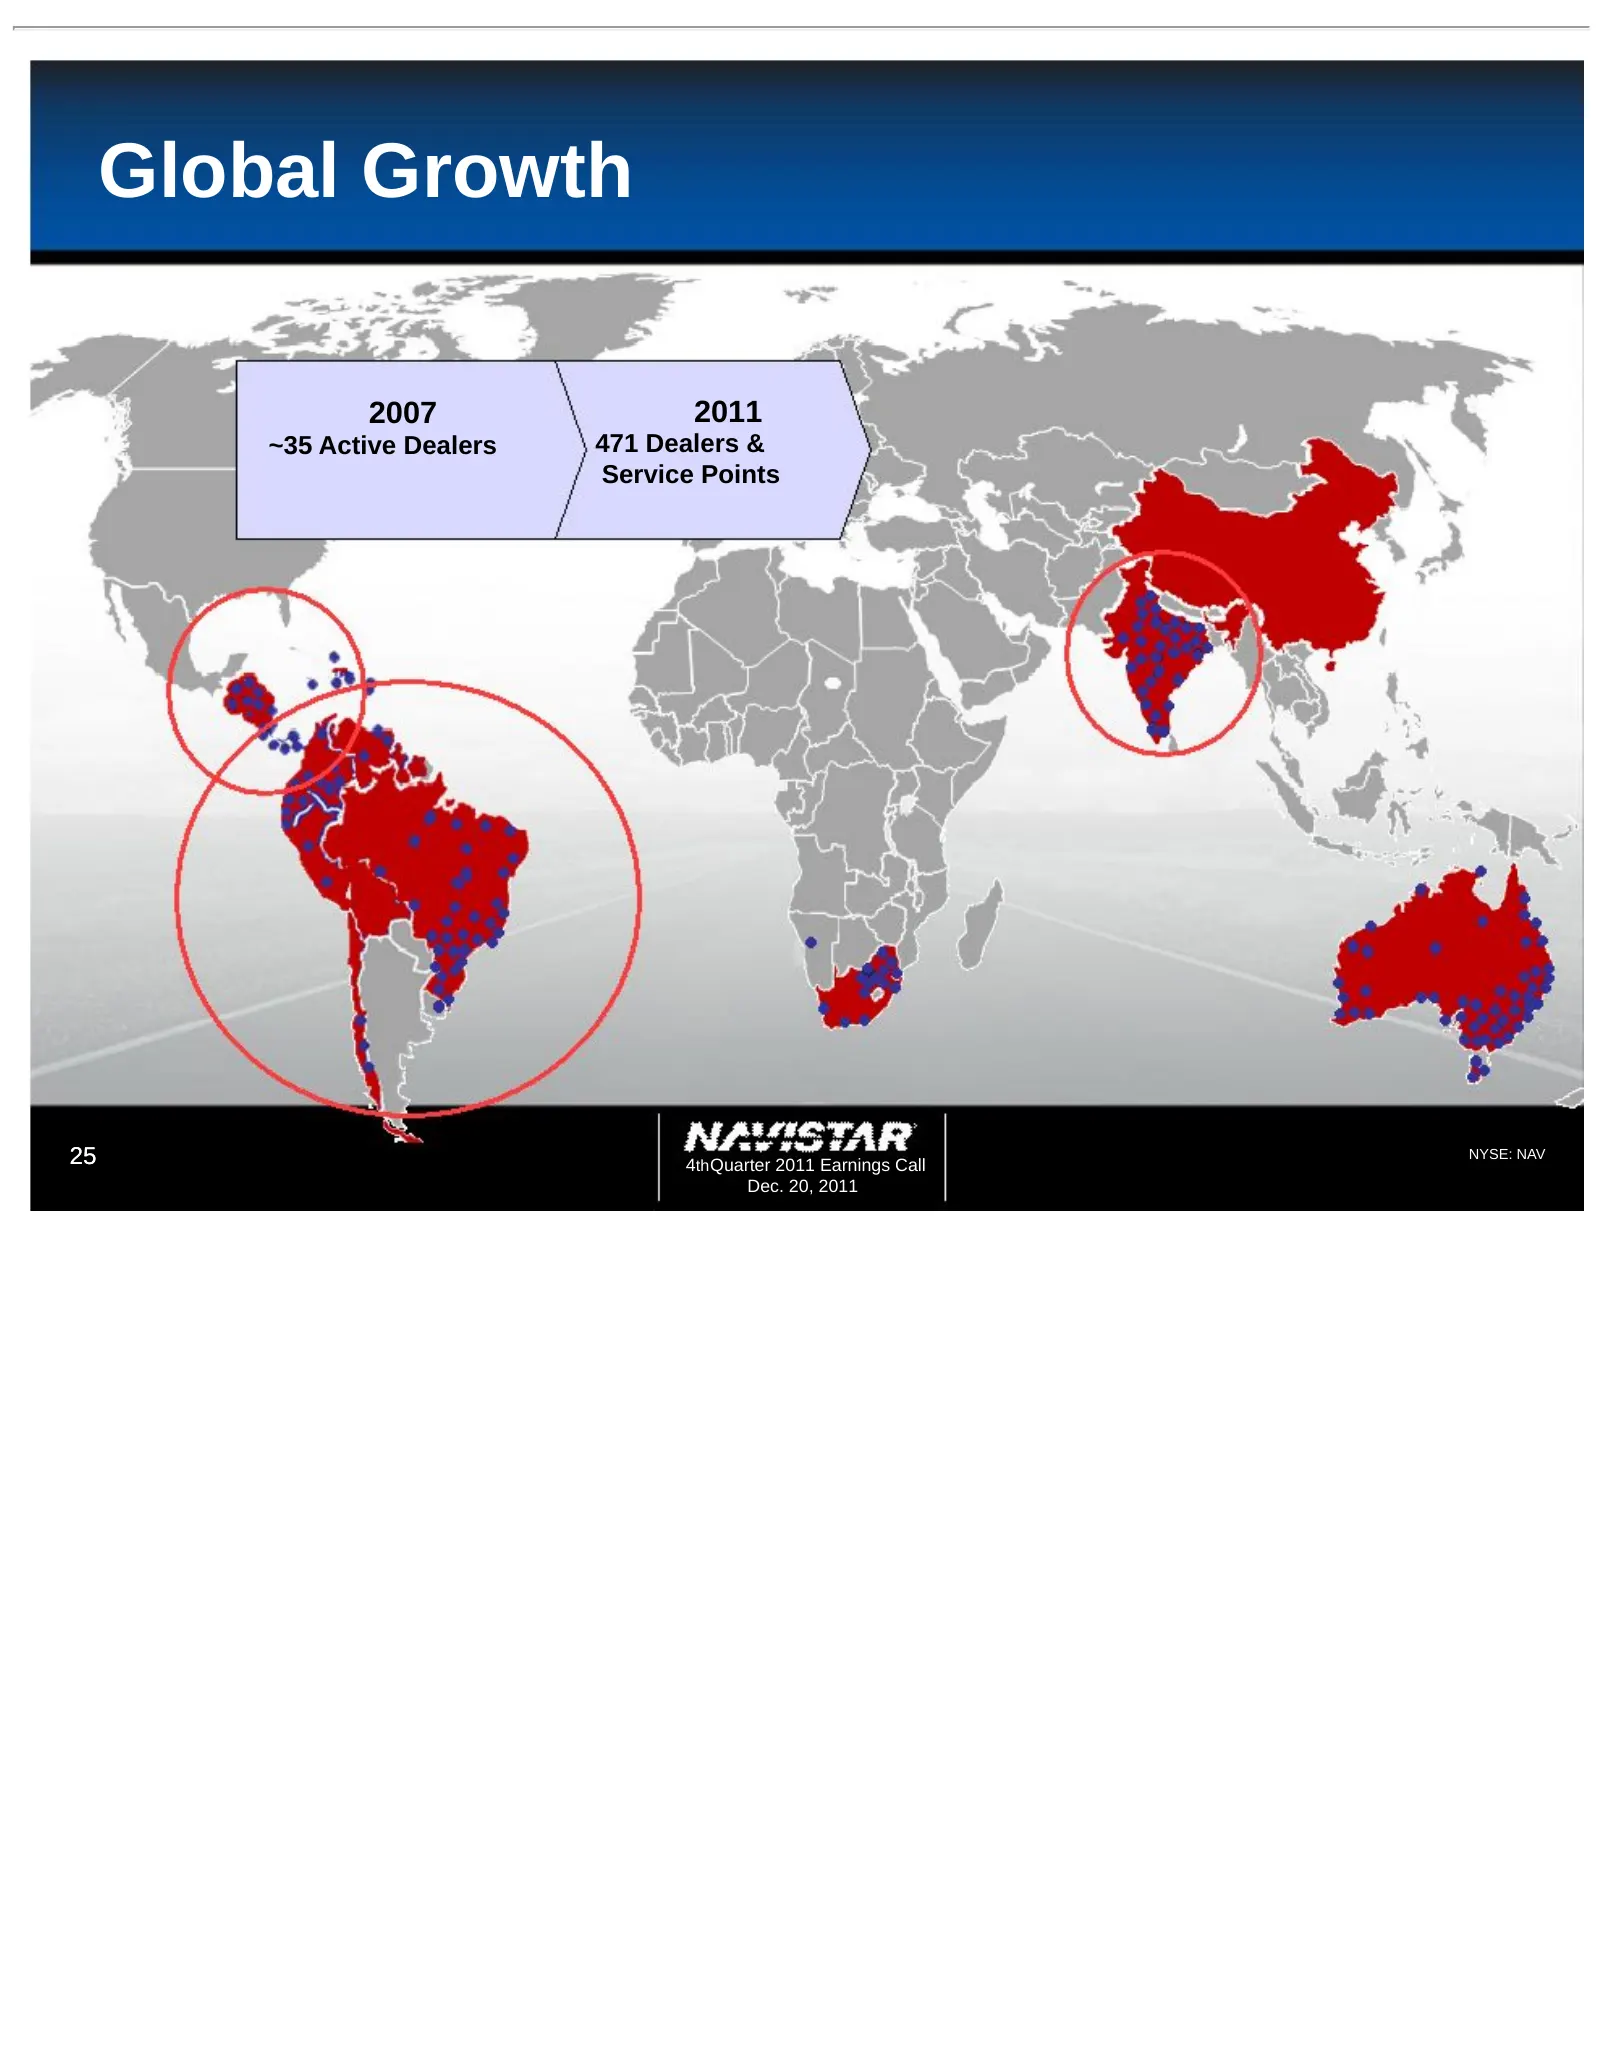
Slide 25: Global Growth
Global Growth 2007 2011 ~35 Active Dealers 471 Dealers & Service Points 25 4th Quarter 2011 Earnings Call NYSE: NAV Dec. 20, 2011
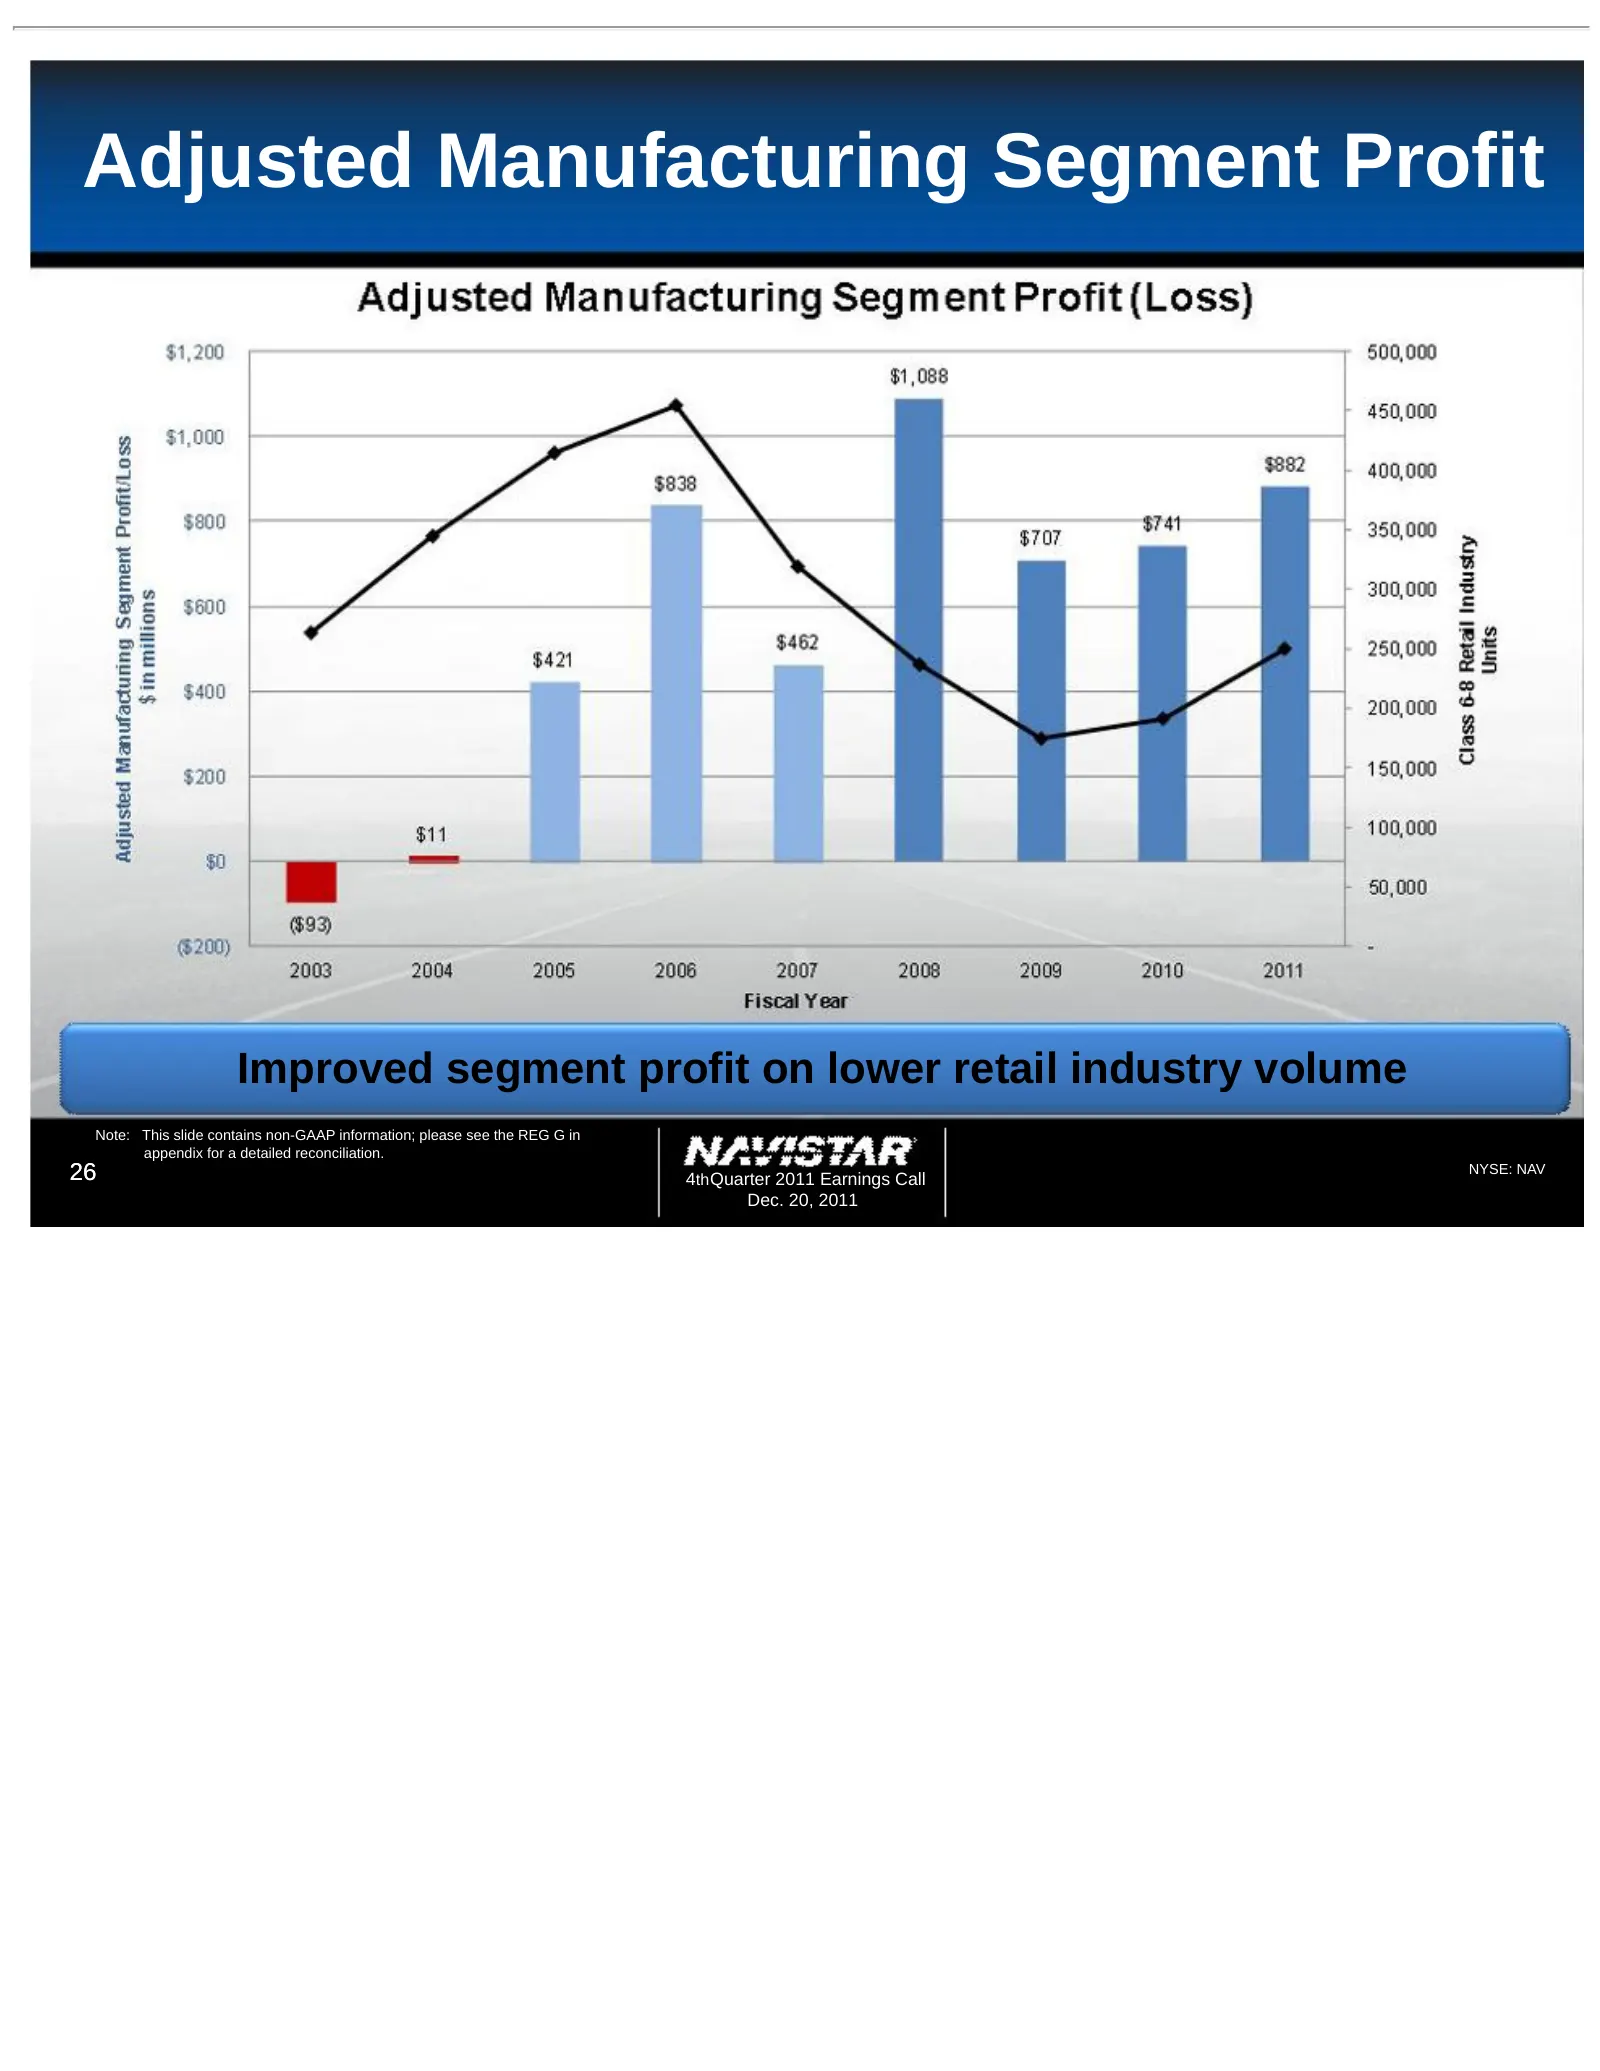
Slide 26: Adjusted Manufacturing Segment Profit
Adjusted Manufacturing Segment Profit Improved segment profit on lower retail industry volume Note: This slide contains non-GAAP information; please see the REG G in appendix for a detailed reconciliation. 26 4th Quarter 2011 Earnings Call NYSE: NAV Dec. 20, 2011
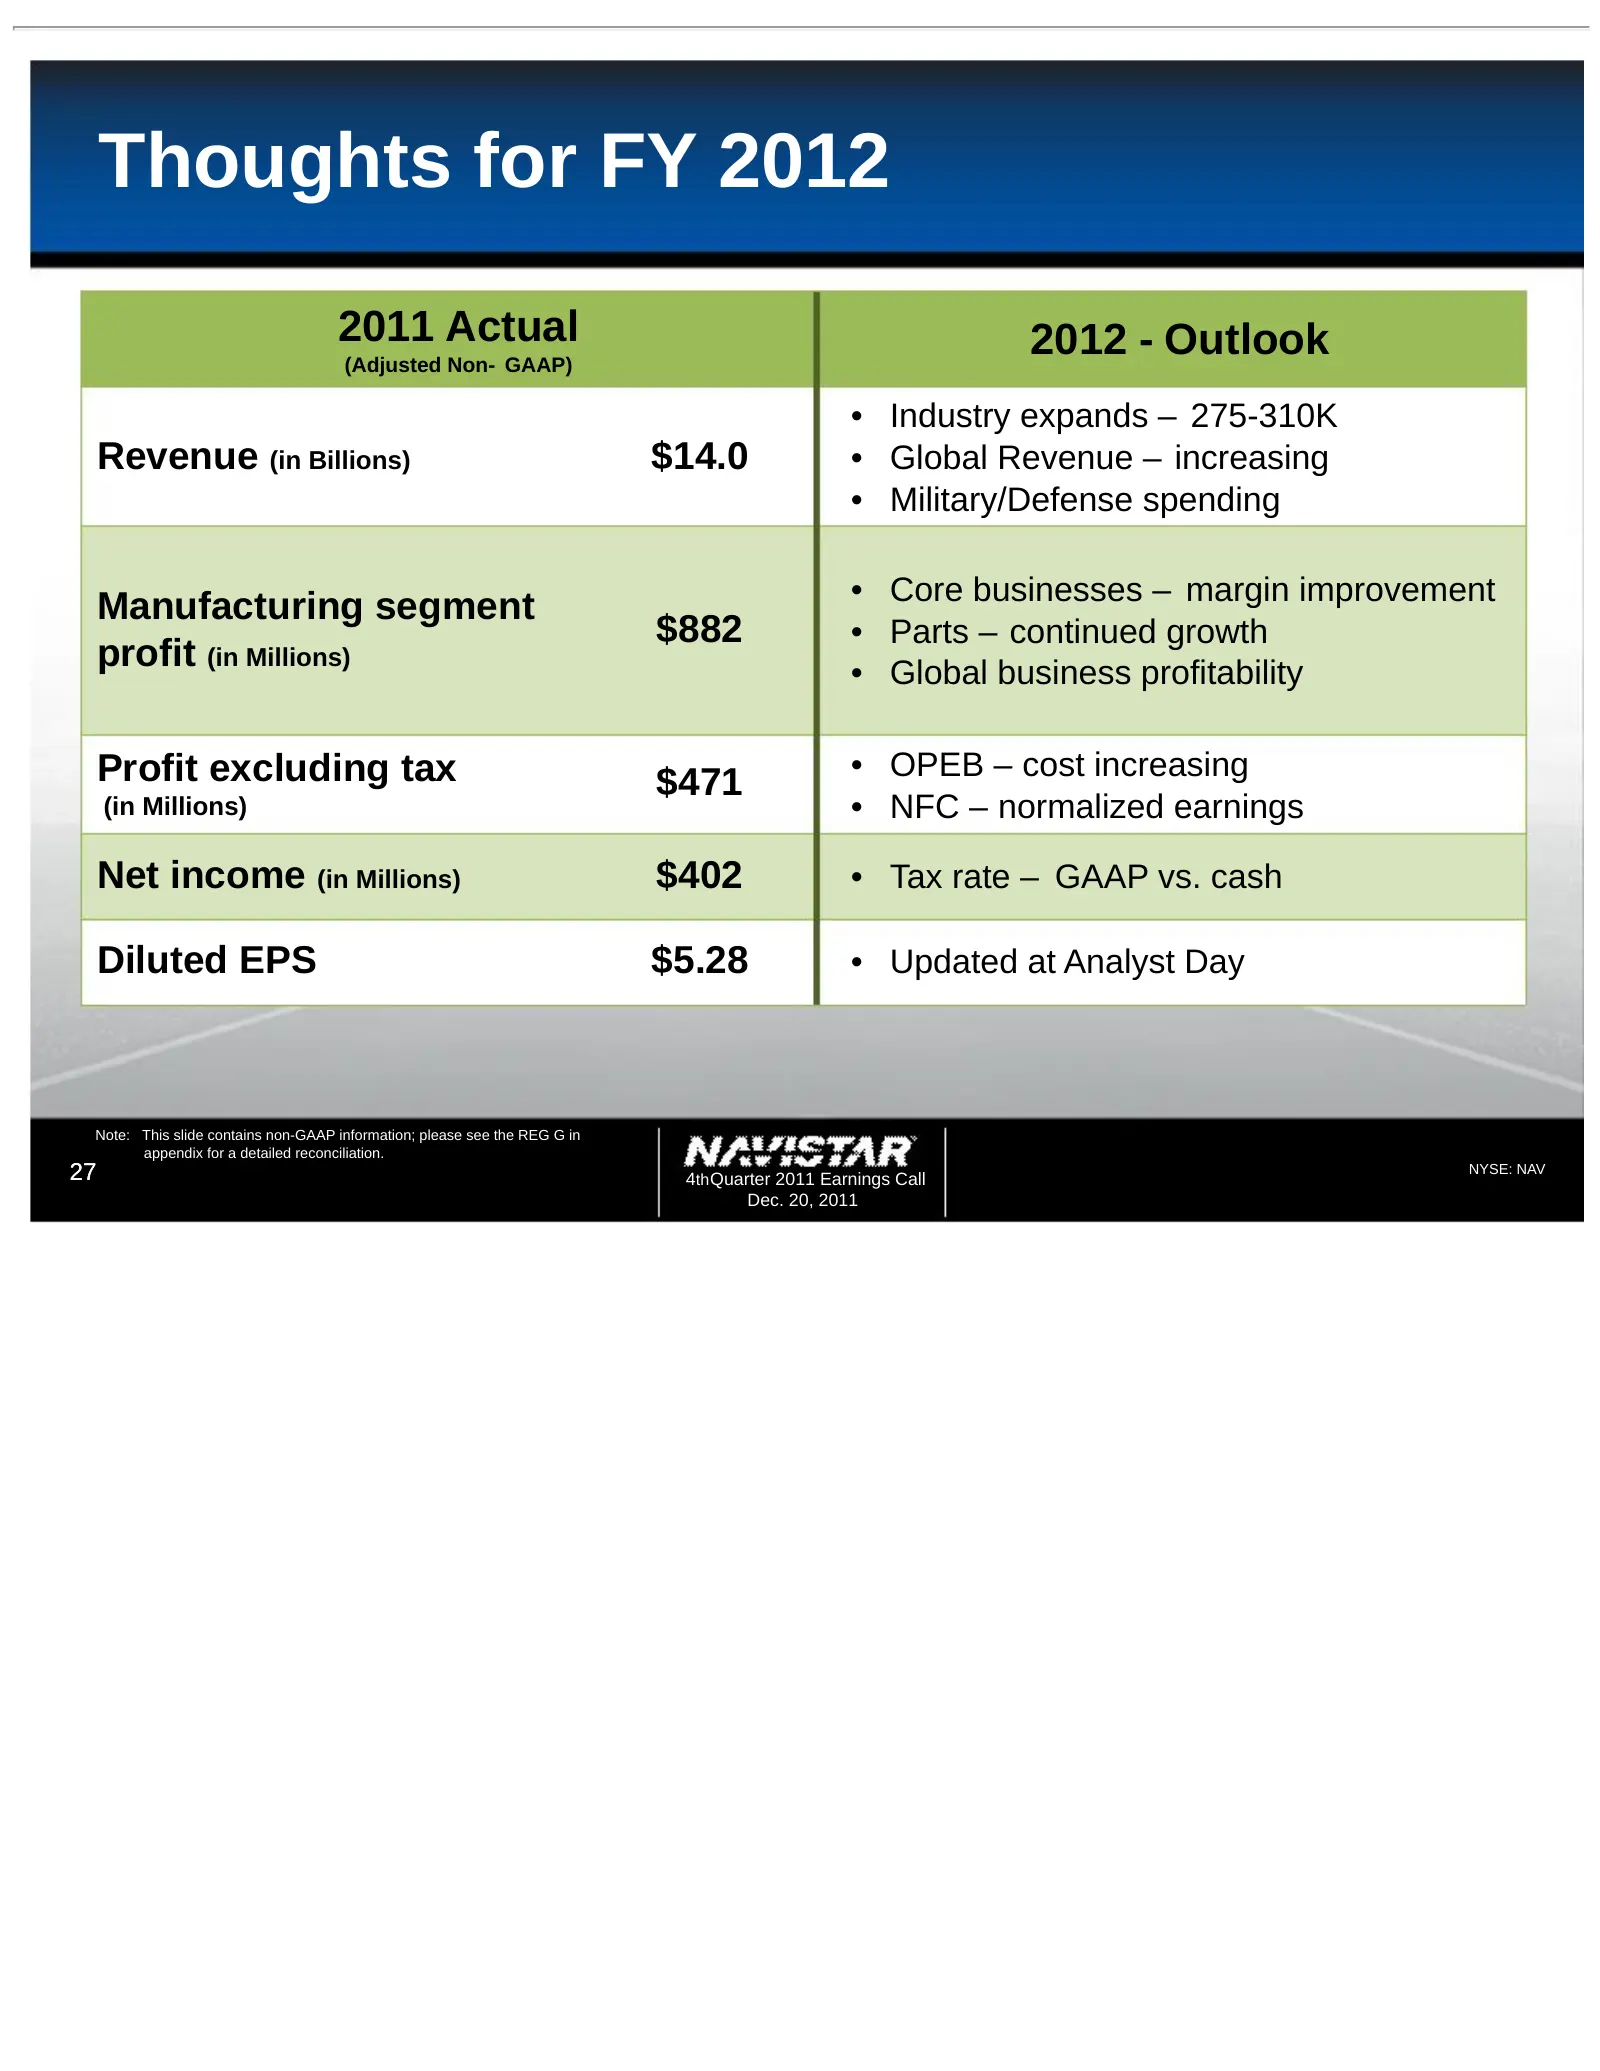
Slide 27: Thoughts for FY 2012
Thoughts for FY 2012 2011 Actual 2012 - Outlook (Adjusted Non- GAAP) • Industry expands – 275-310K Revenue (in Billions) $14.0 • Global Revenue – increasing • Military/Defense spending • Core businesses – margin improvement Manufacturing segment $882 • Parts – continued growth profit (in Millions) •
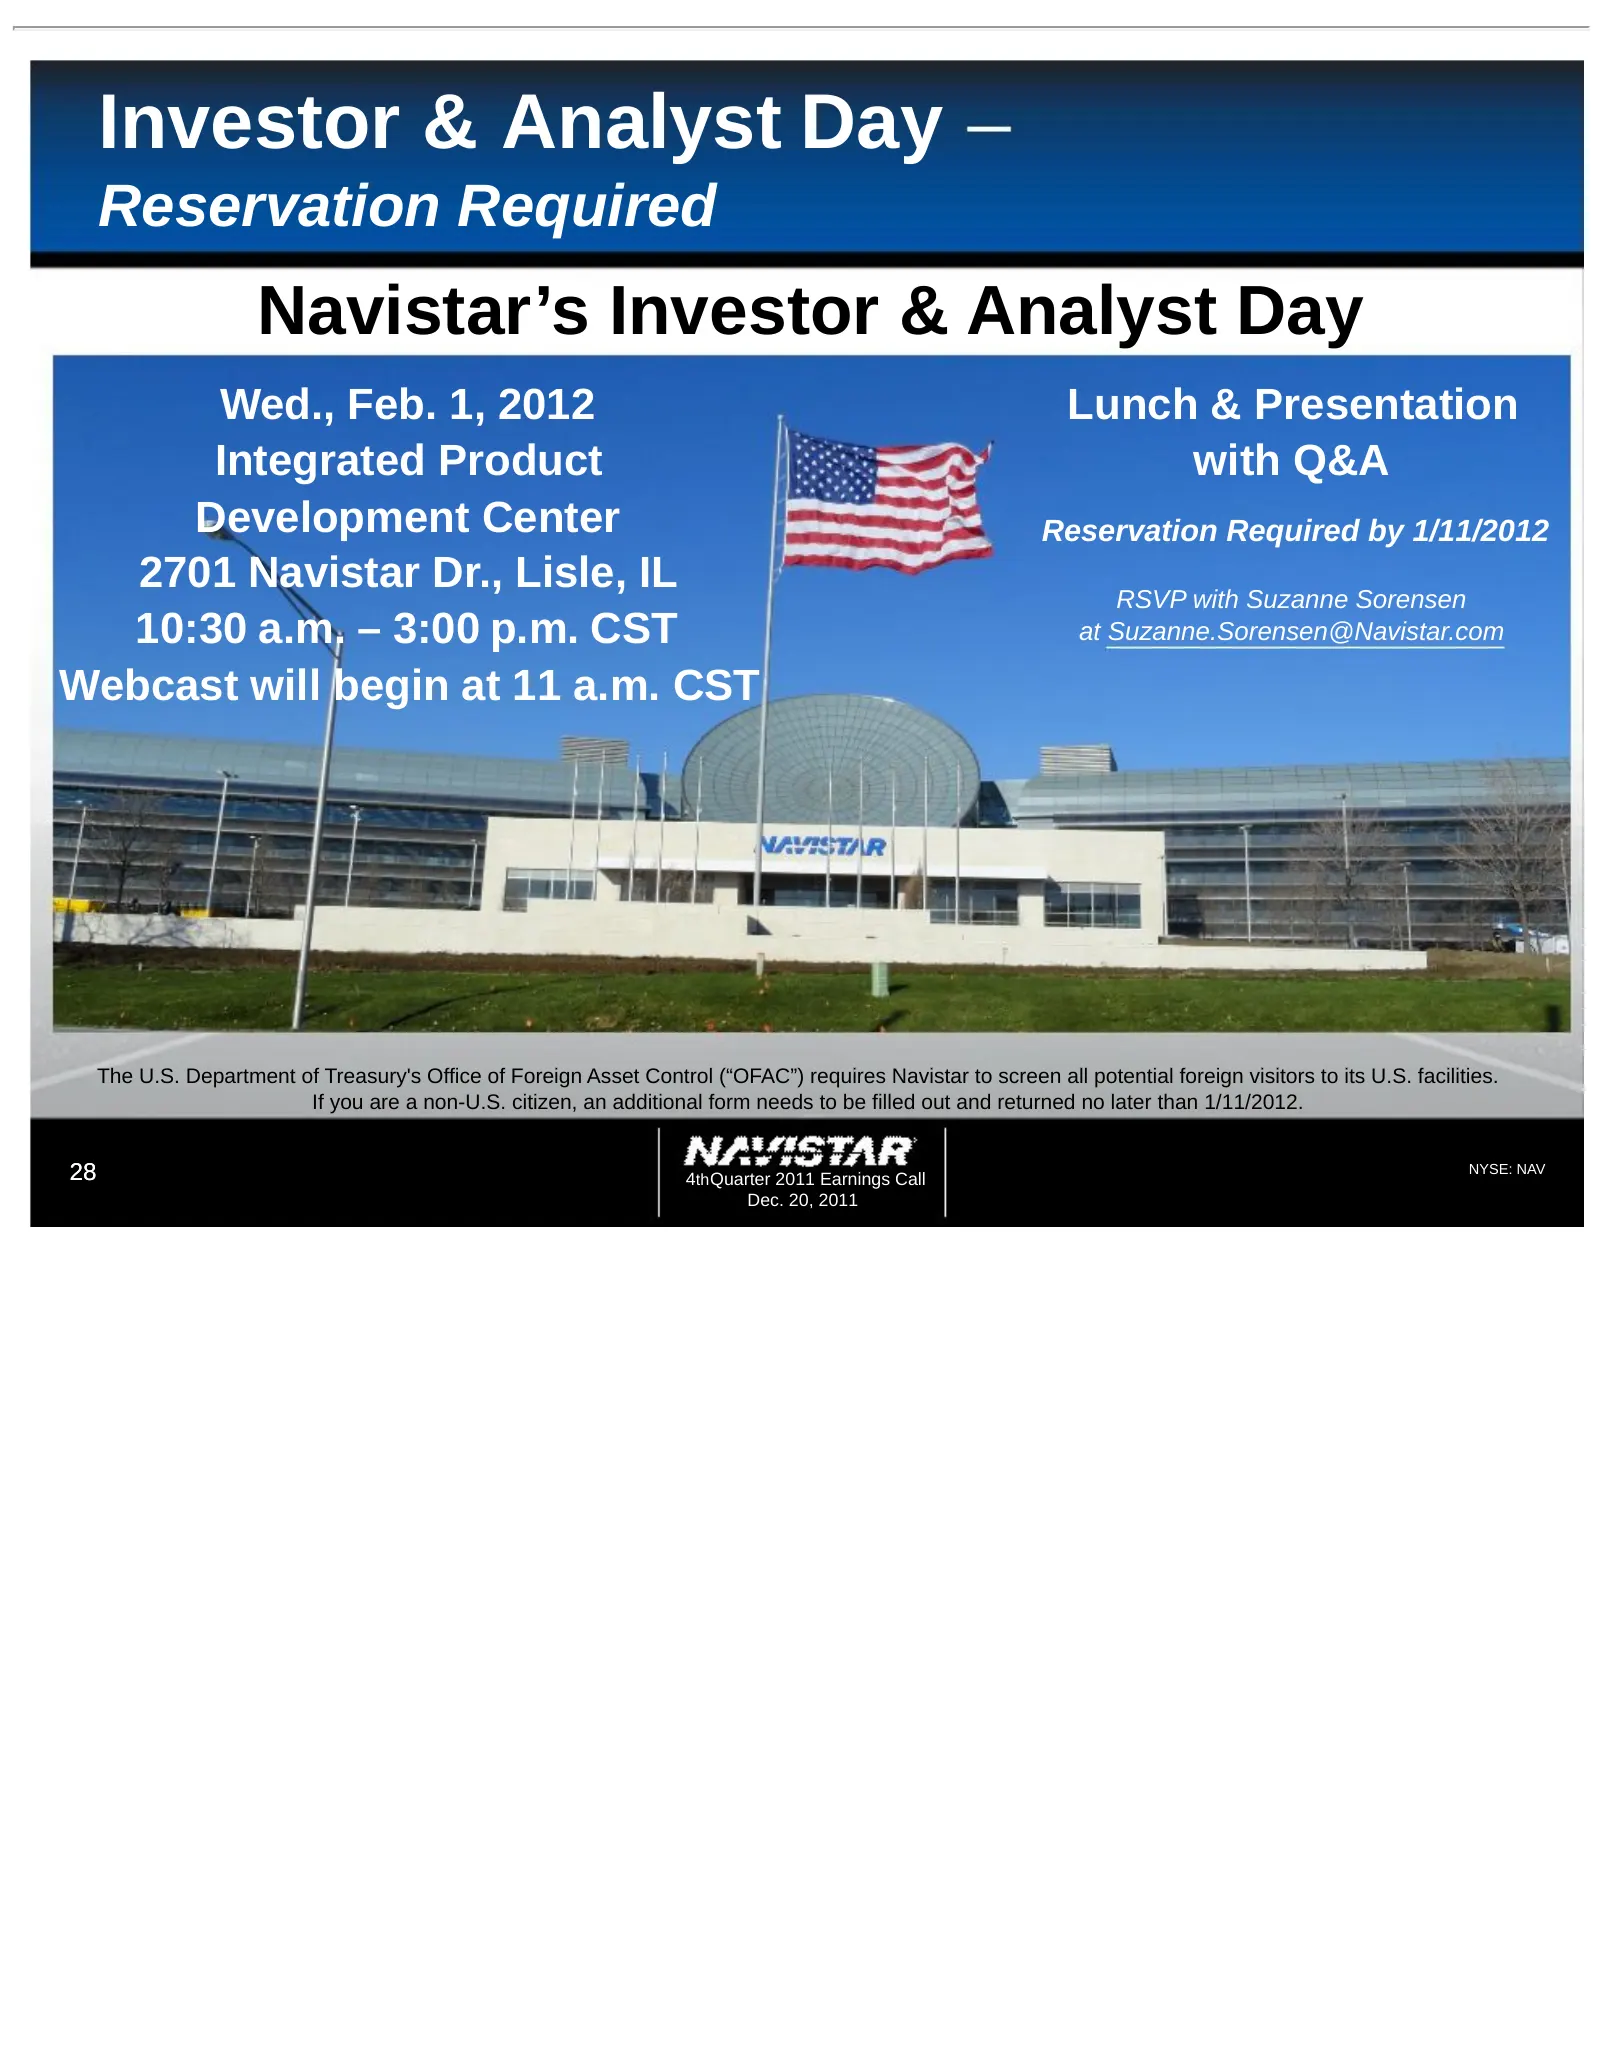
Slide 28: Investor & Analyst Day
Investor & Analyst Day Reservation Required Navistar’s Investor & Analyst Day Wed., Feb. 1, 2012 Lunch & Presentation Integrated Product with Q&A Development Center Reservation Required by 1/11/2012 2701 Navistar Dr., Lisle, IL RSVP with Suzanne Sorensen 10:30 a.m. – 3:00 p.m. CST at Suzanne.Sorense
Slide 29: Appendix
Appendix 29 4th Quarter 2011 Earnings Call NYSE: NAV Dec. 20, 2011
Slide 30: Market Share – U.S. & Canada School Bus and Class 6-8
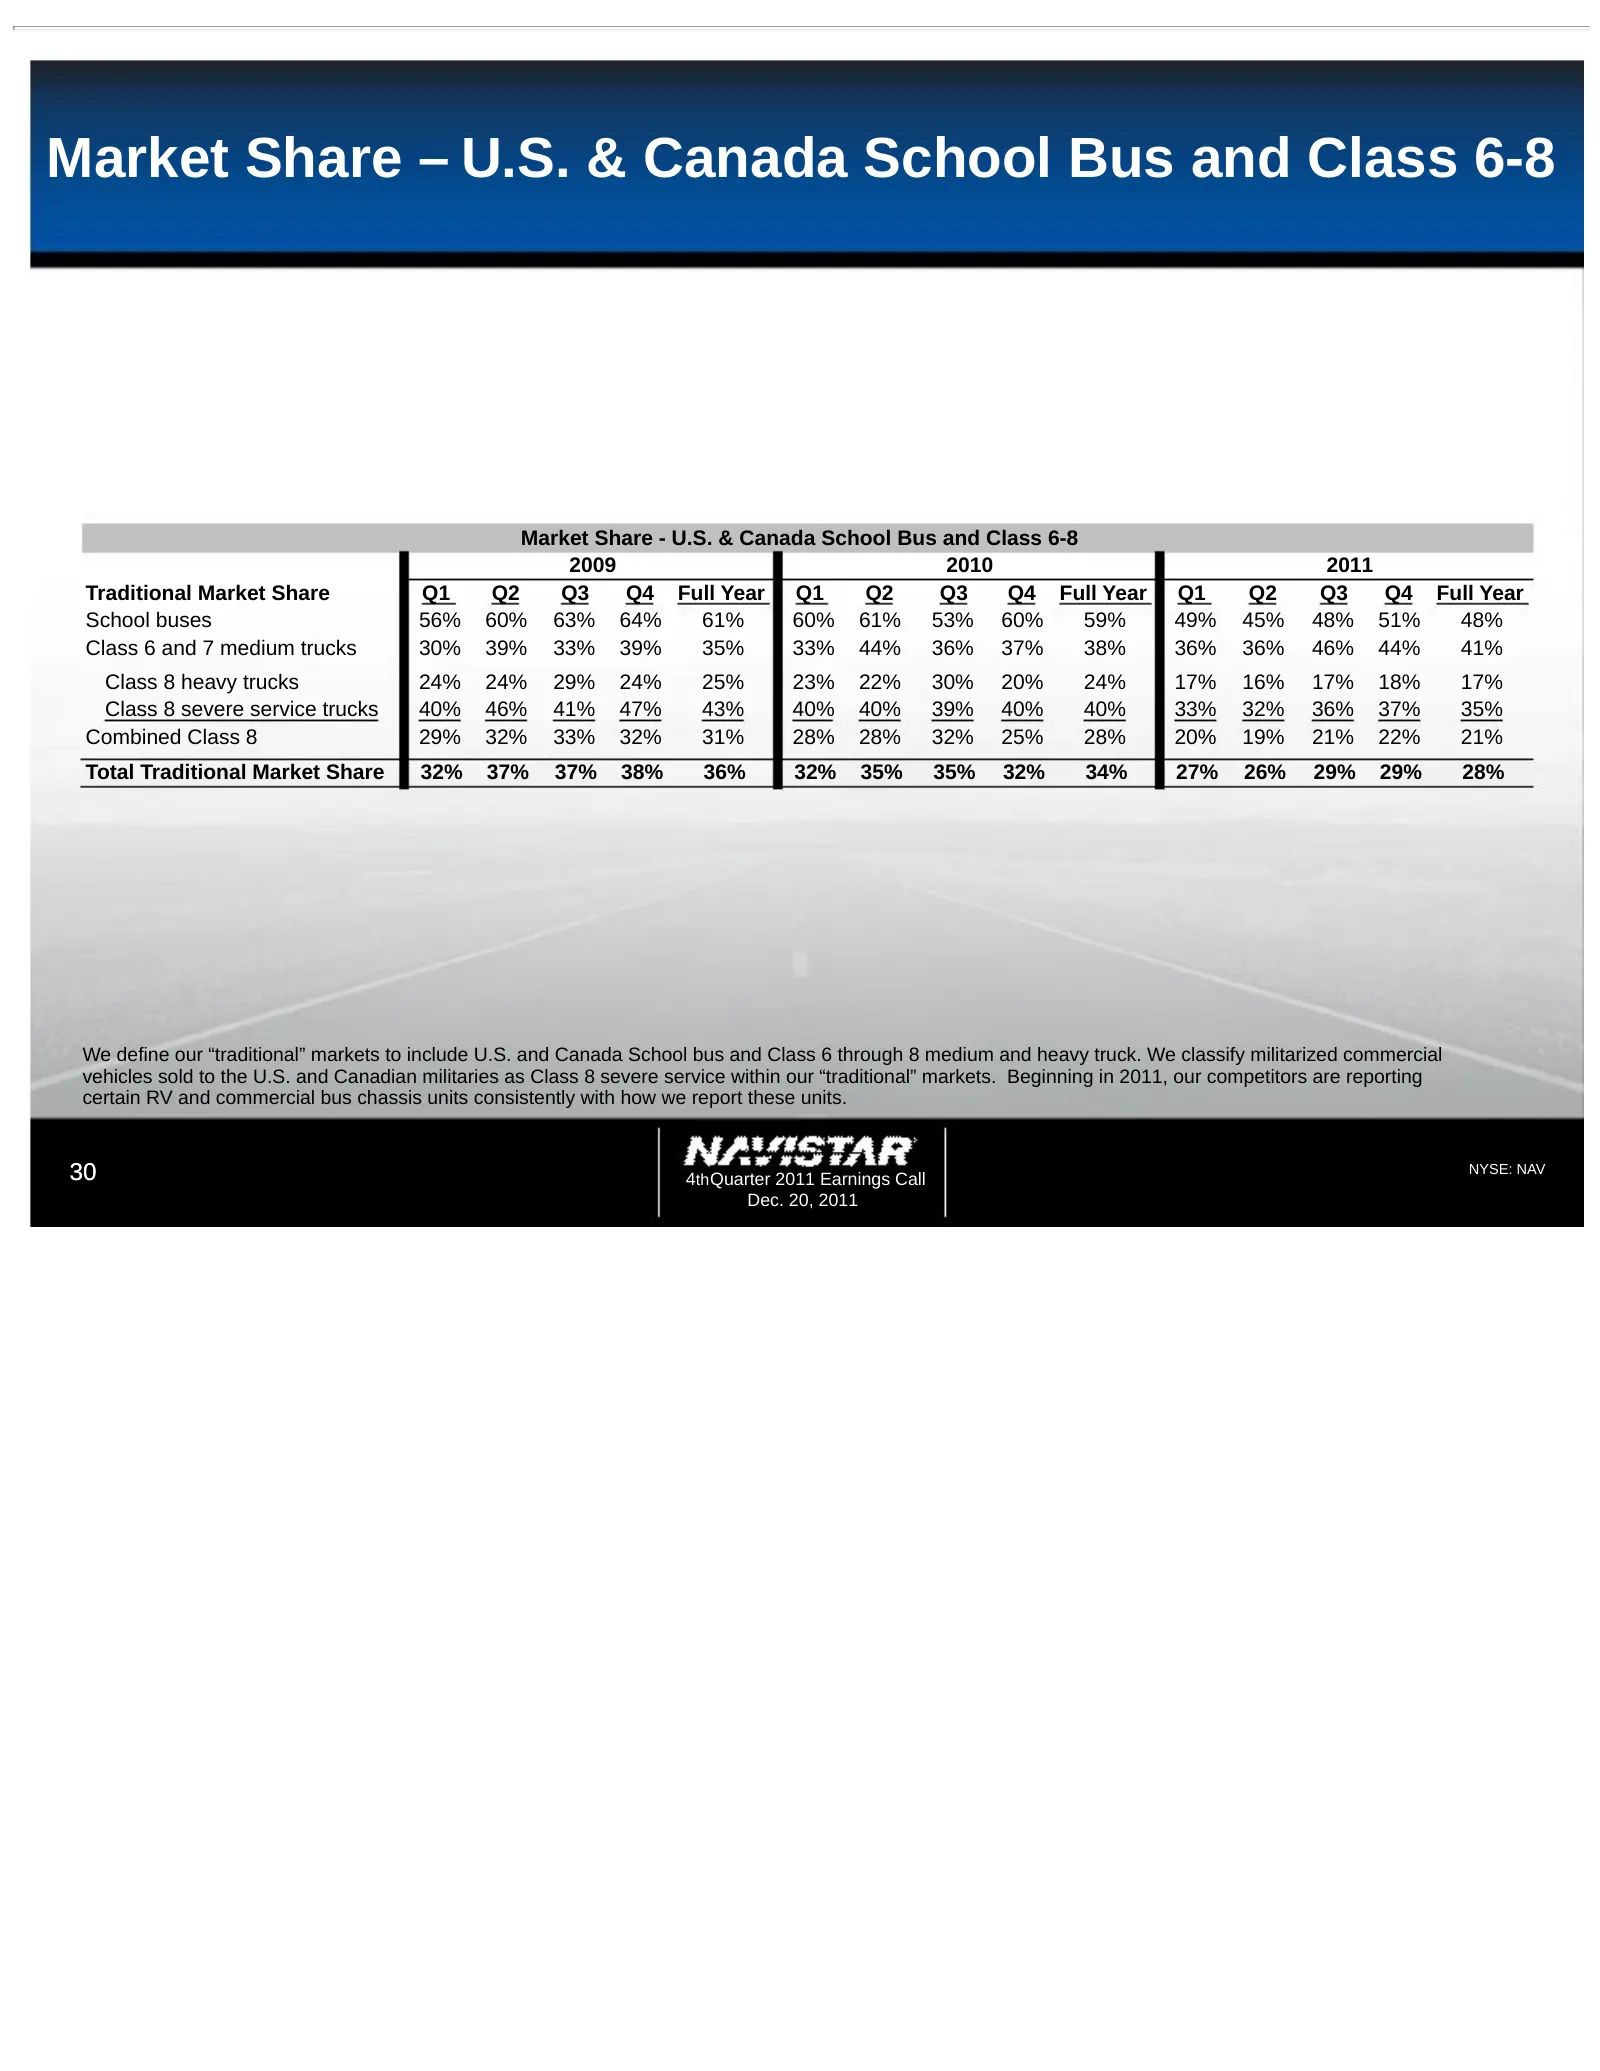
Market Share – U.S. & Canada School Bus and Class 6-8 Market Share - U.S. & Canada School Bus and Class 6-8 2009 2010 2011 Traditional Market Share Q1 Q2 Q3 Q4 Full Year Q1 Q2 Q3 Q4 Full Year Q1 Q2 Q3 Q4 Full Year School buses 56% 60% 63% 64% 61% 60% 61% 53% 60% 59% 49% 45% 48% 51% 48% Class 6 and 7
Slide 31: Worldwide Truck Chargeouts
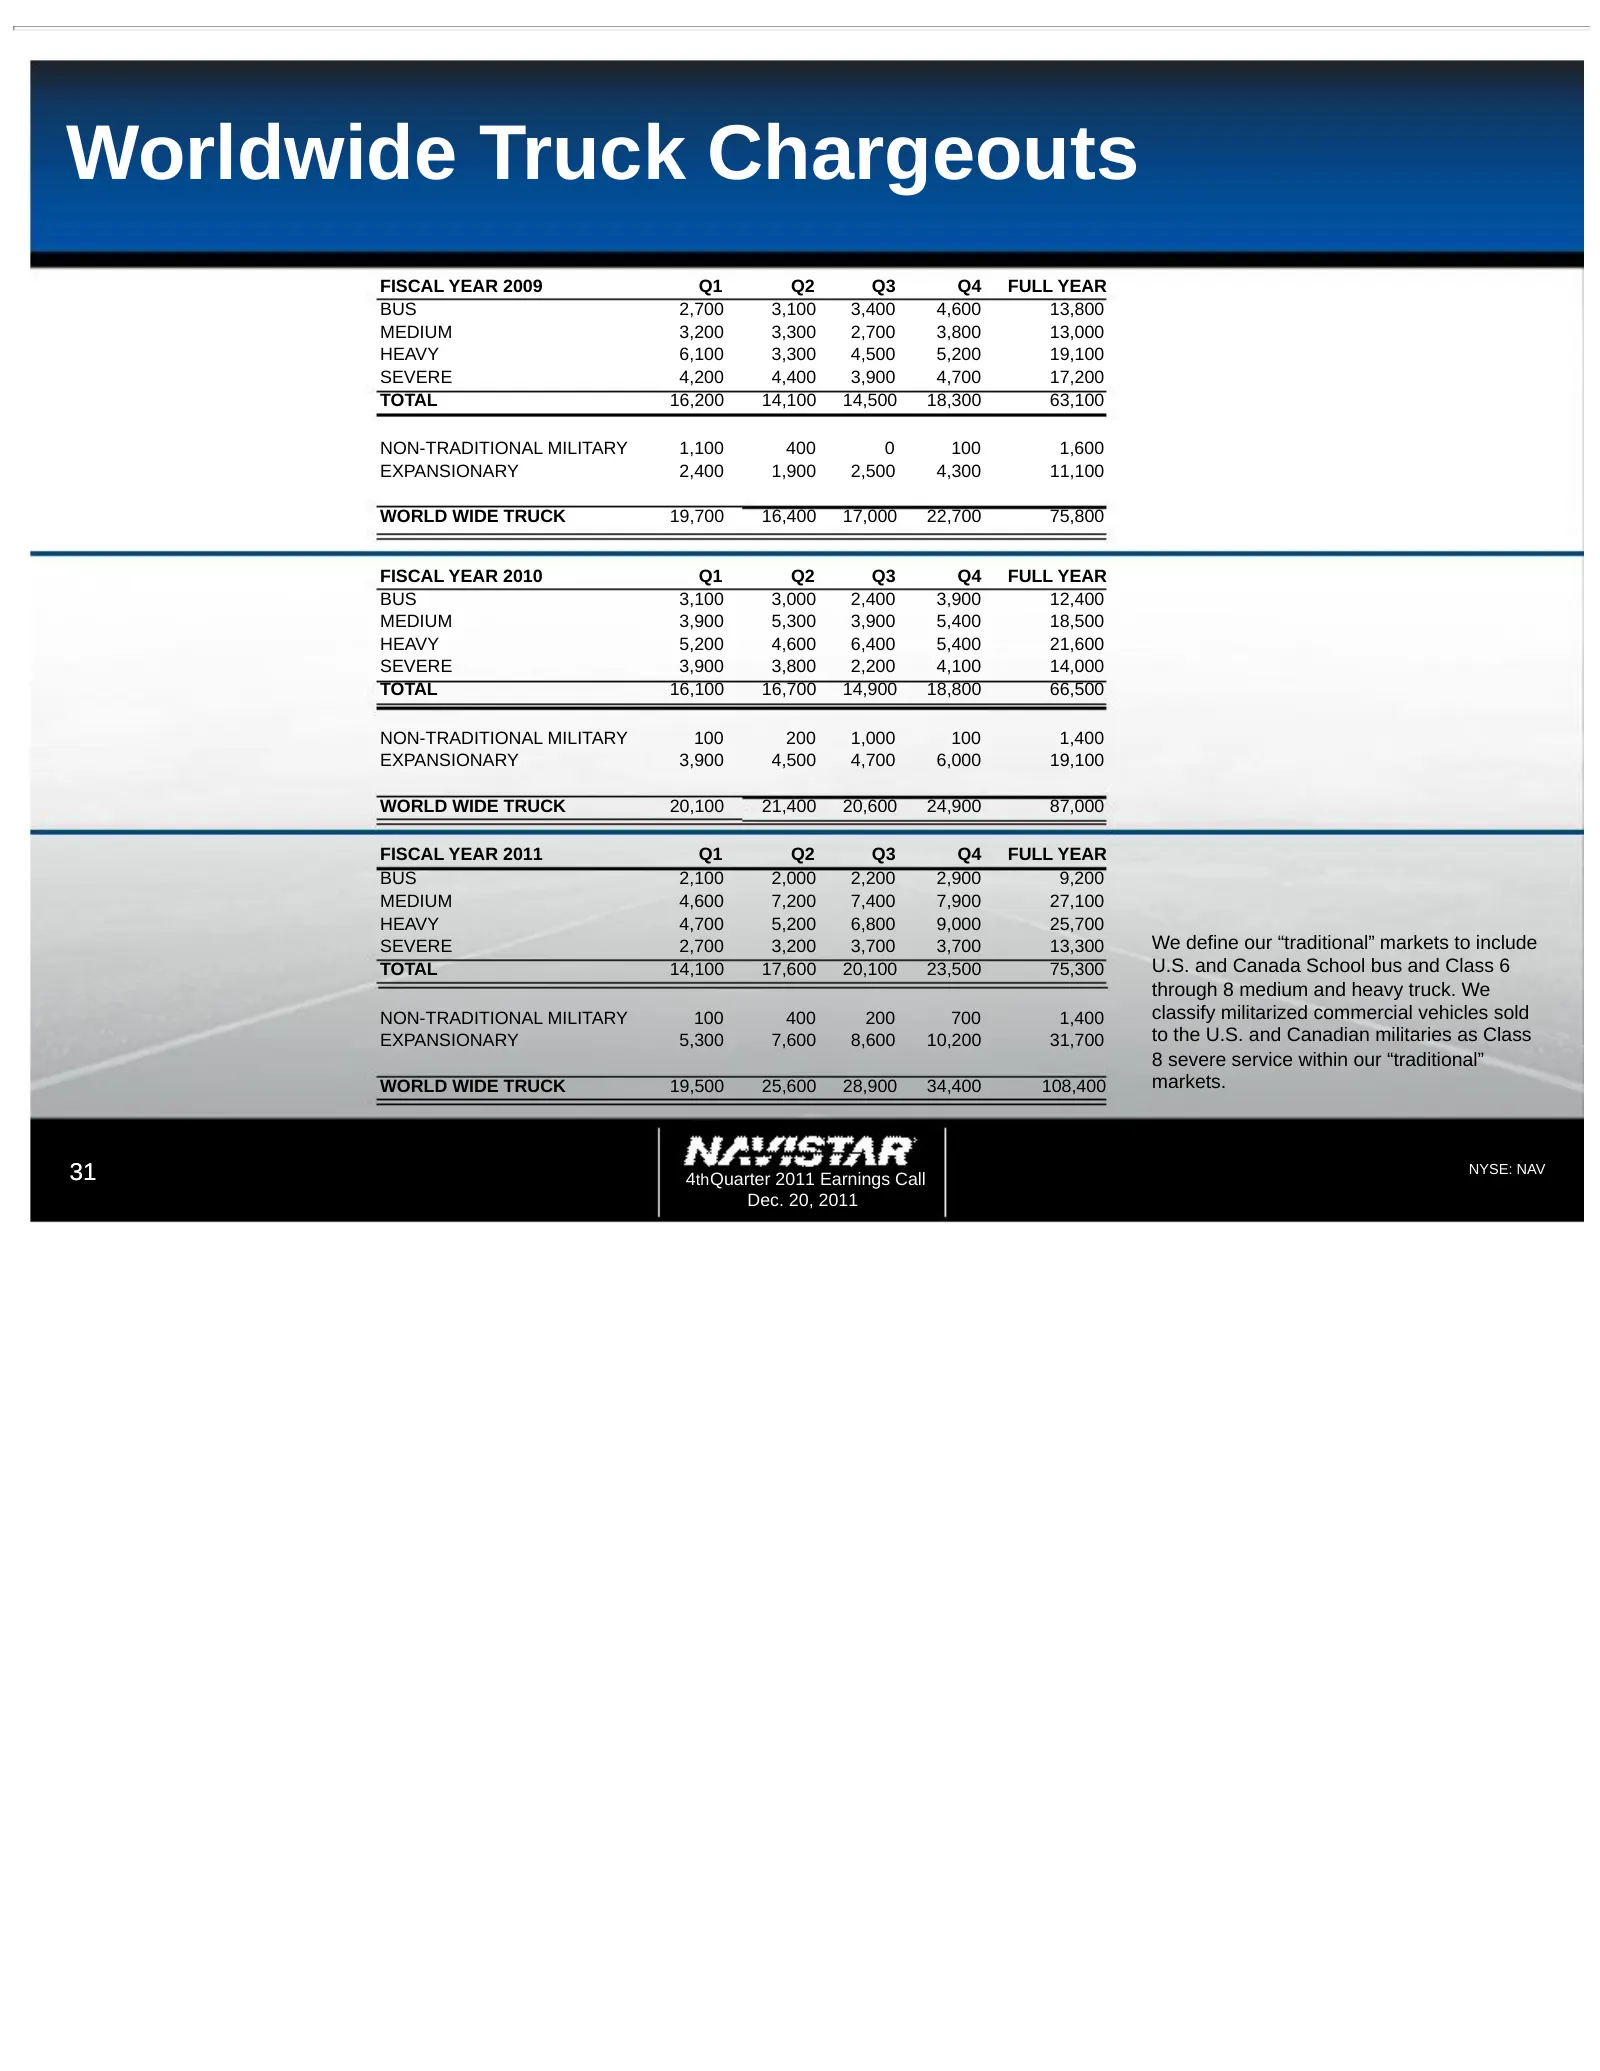
Worldwide Truck Chargeouts FISCAL YEAR 2009 Q1 Q2 Q3 Q4 FULL YEAR BUS 2,700 3,100 3,400 4,600 13,800 MEDIUM 3,200 3,300 2,700 3,800 13,000 HEAVY 6,100 3,300 4,500 5,200 19,100 SEVERE 4,200 4,400 3,900 4,700 17,200 TOTAL 16,200 14,100 14,500 18,300 63,100 NON-TRADITIONAL MILITARY 1,100 400 0 100 1,60
Slide 32: World Wide Engine Shipments
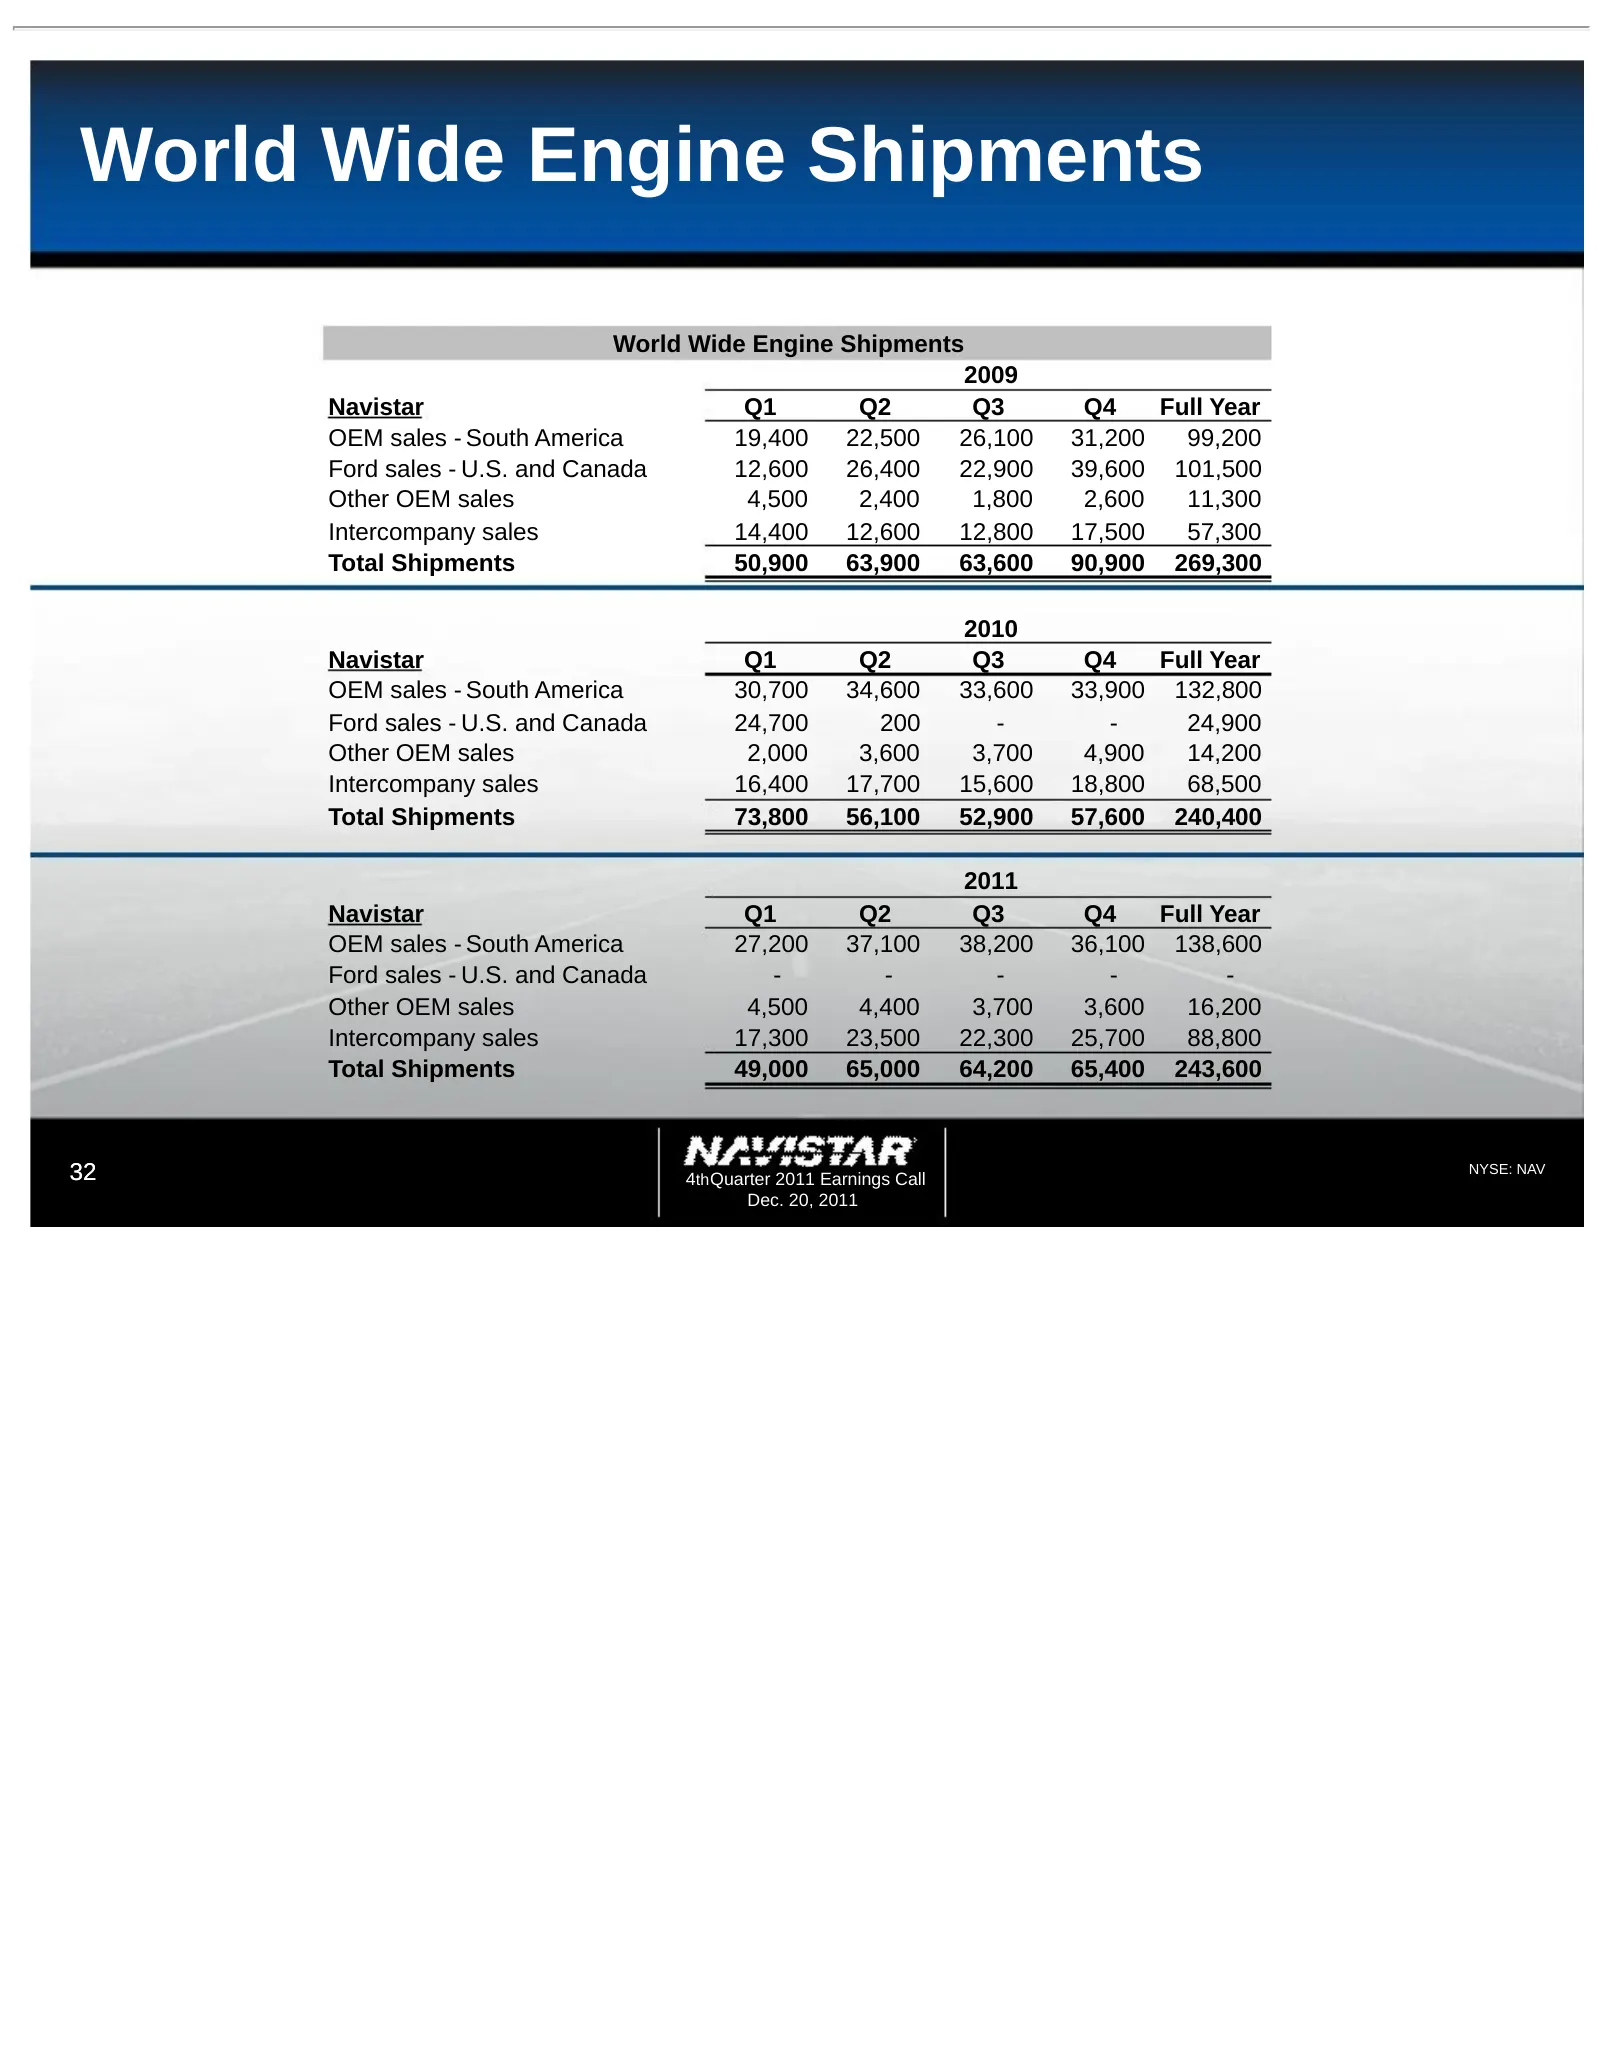
World Wide Engine Shipments World Wide Engine Shipments 2009 Navistar Q1 Q2 Q3 Q4 Full Year OEM sales - South America 19,400 22,500 26,100 31,200 99,200 Ford sales - U.S. and Canada 12,600 26,400 22,900 39,600 101,500 Other OEM sales 4,500 2,400 1,800 2,600 11,300 Intercompany sales 14,400 12,600 12
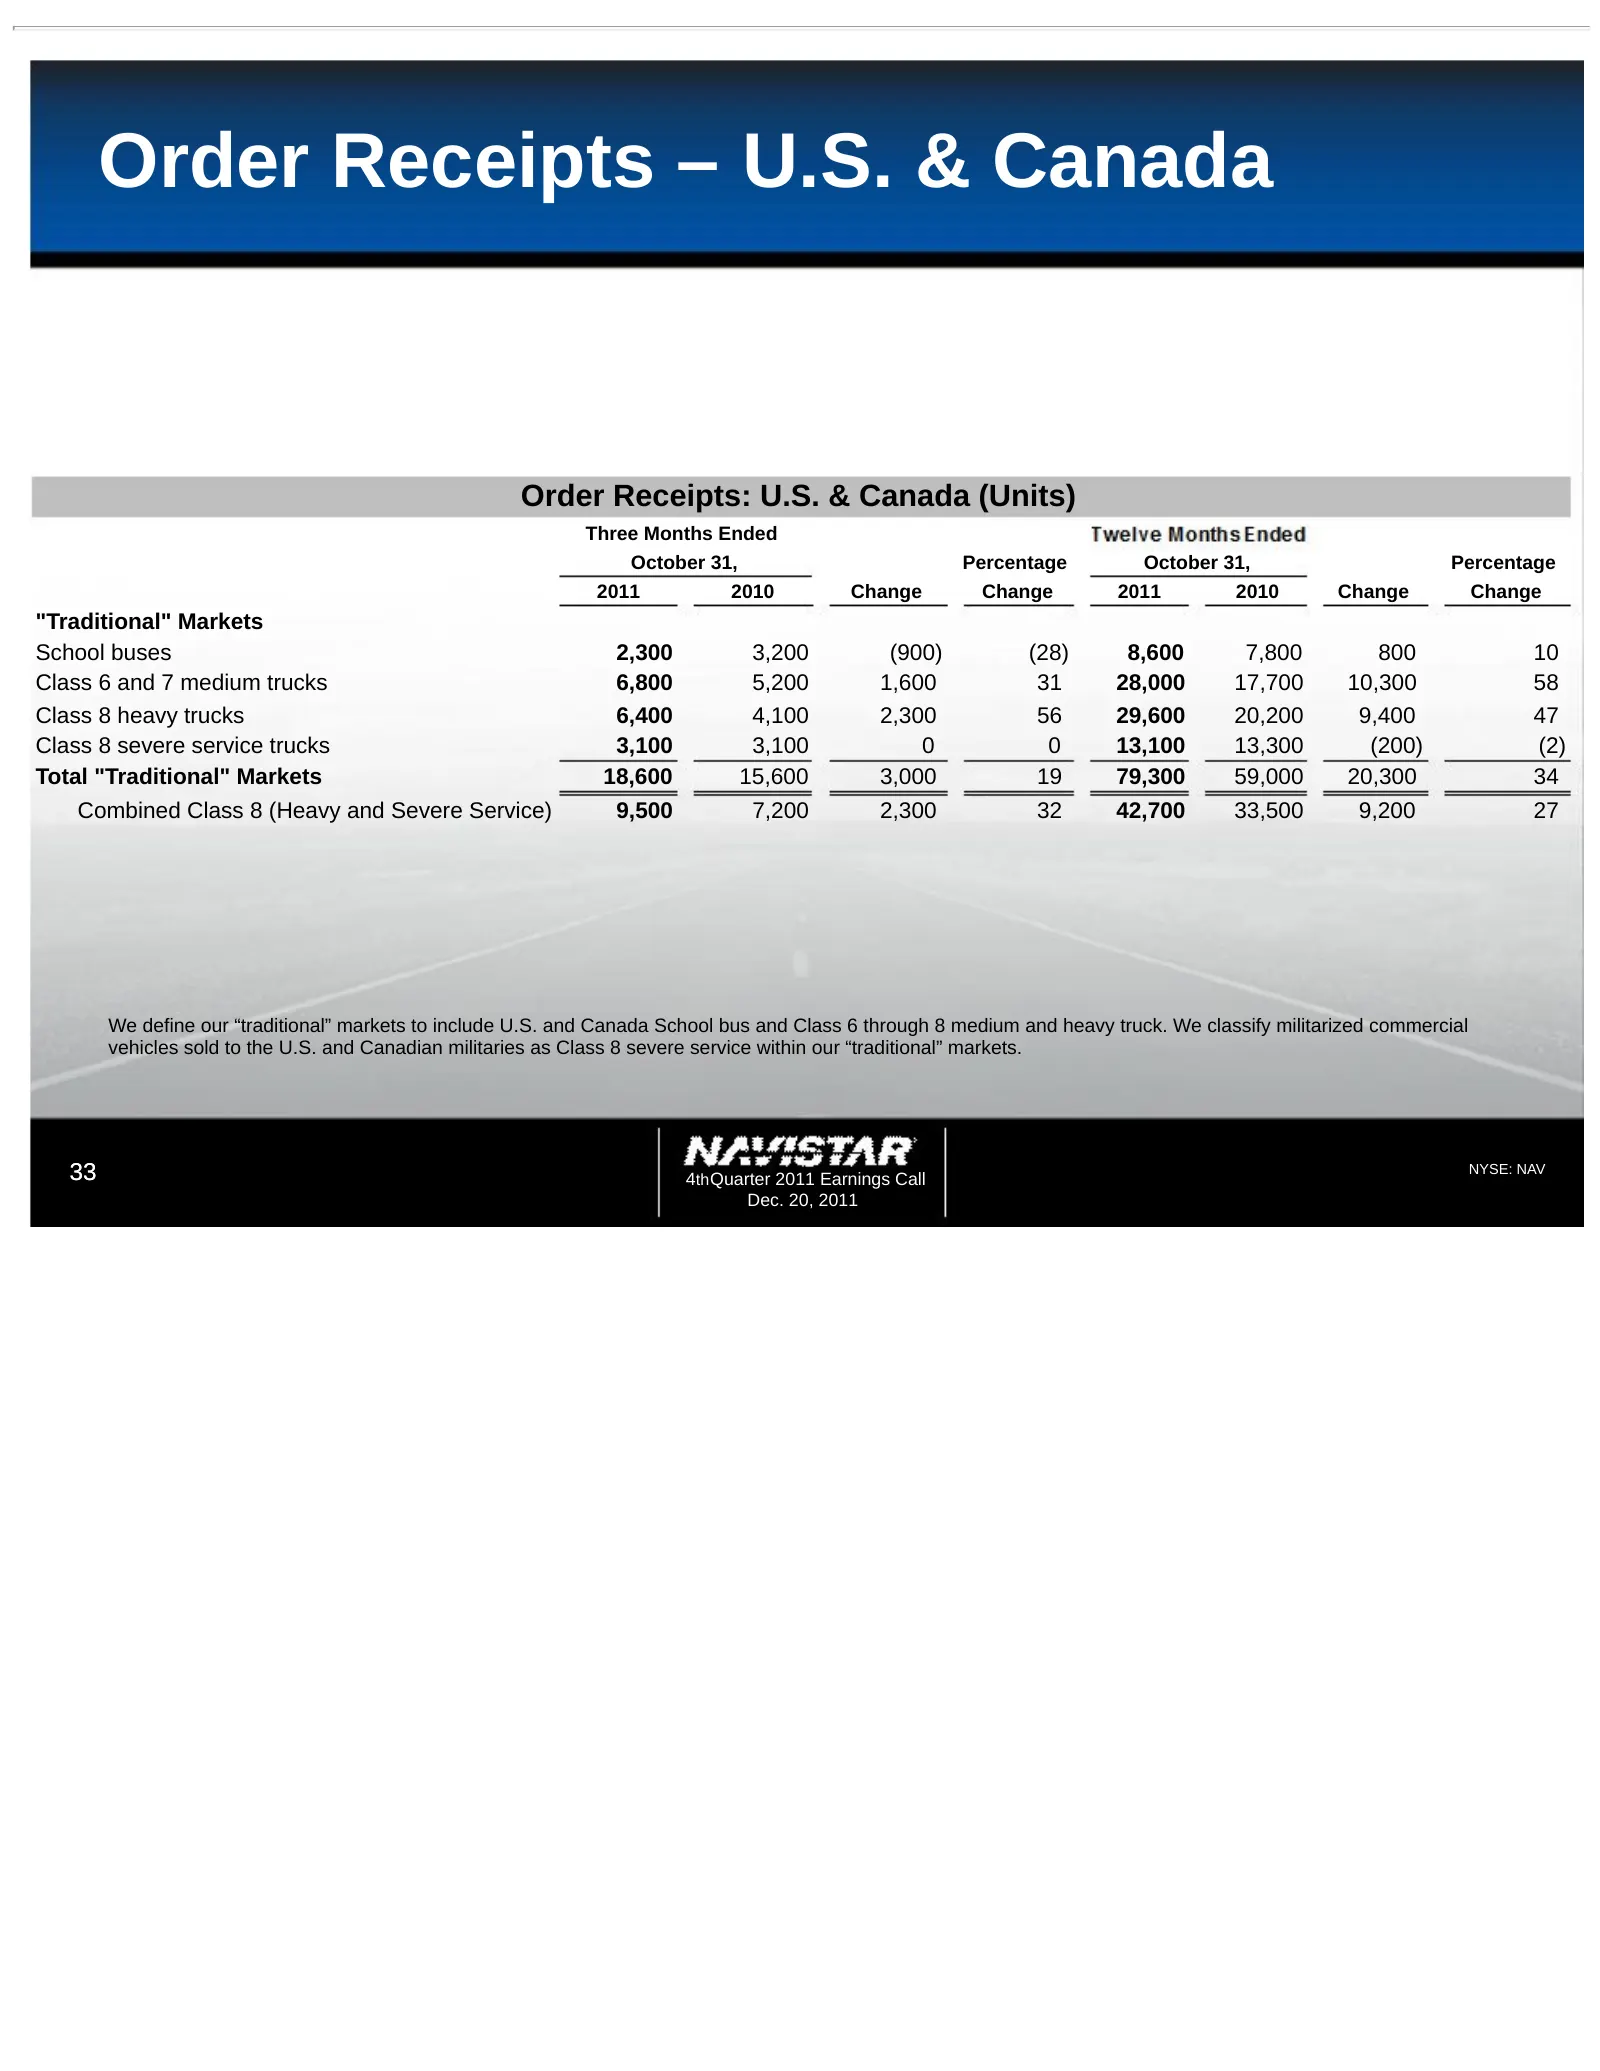
Slide 33: Order Receipts – U.S. & Canada
Order Receipts – U.S. & Canada Order Receipts: U.S. & Canada (Units) Three Months Ended October 31, Percentage October 31, Percentage 2011 2010 Change Change 2011 2010 Change Change "Traditional" Markets School buses 2,300 3,200 (900) (28) 8,600 7,800 800 10 Class 6 and 7 medium trucks 6,800 5,200 1
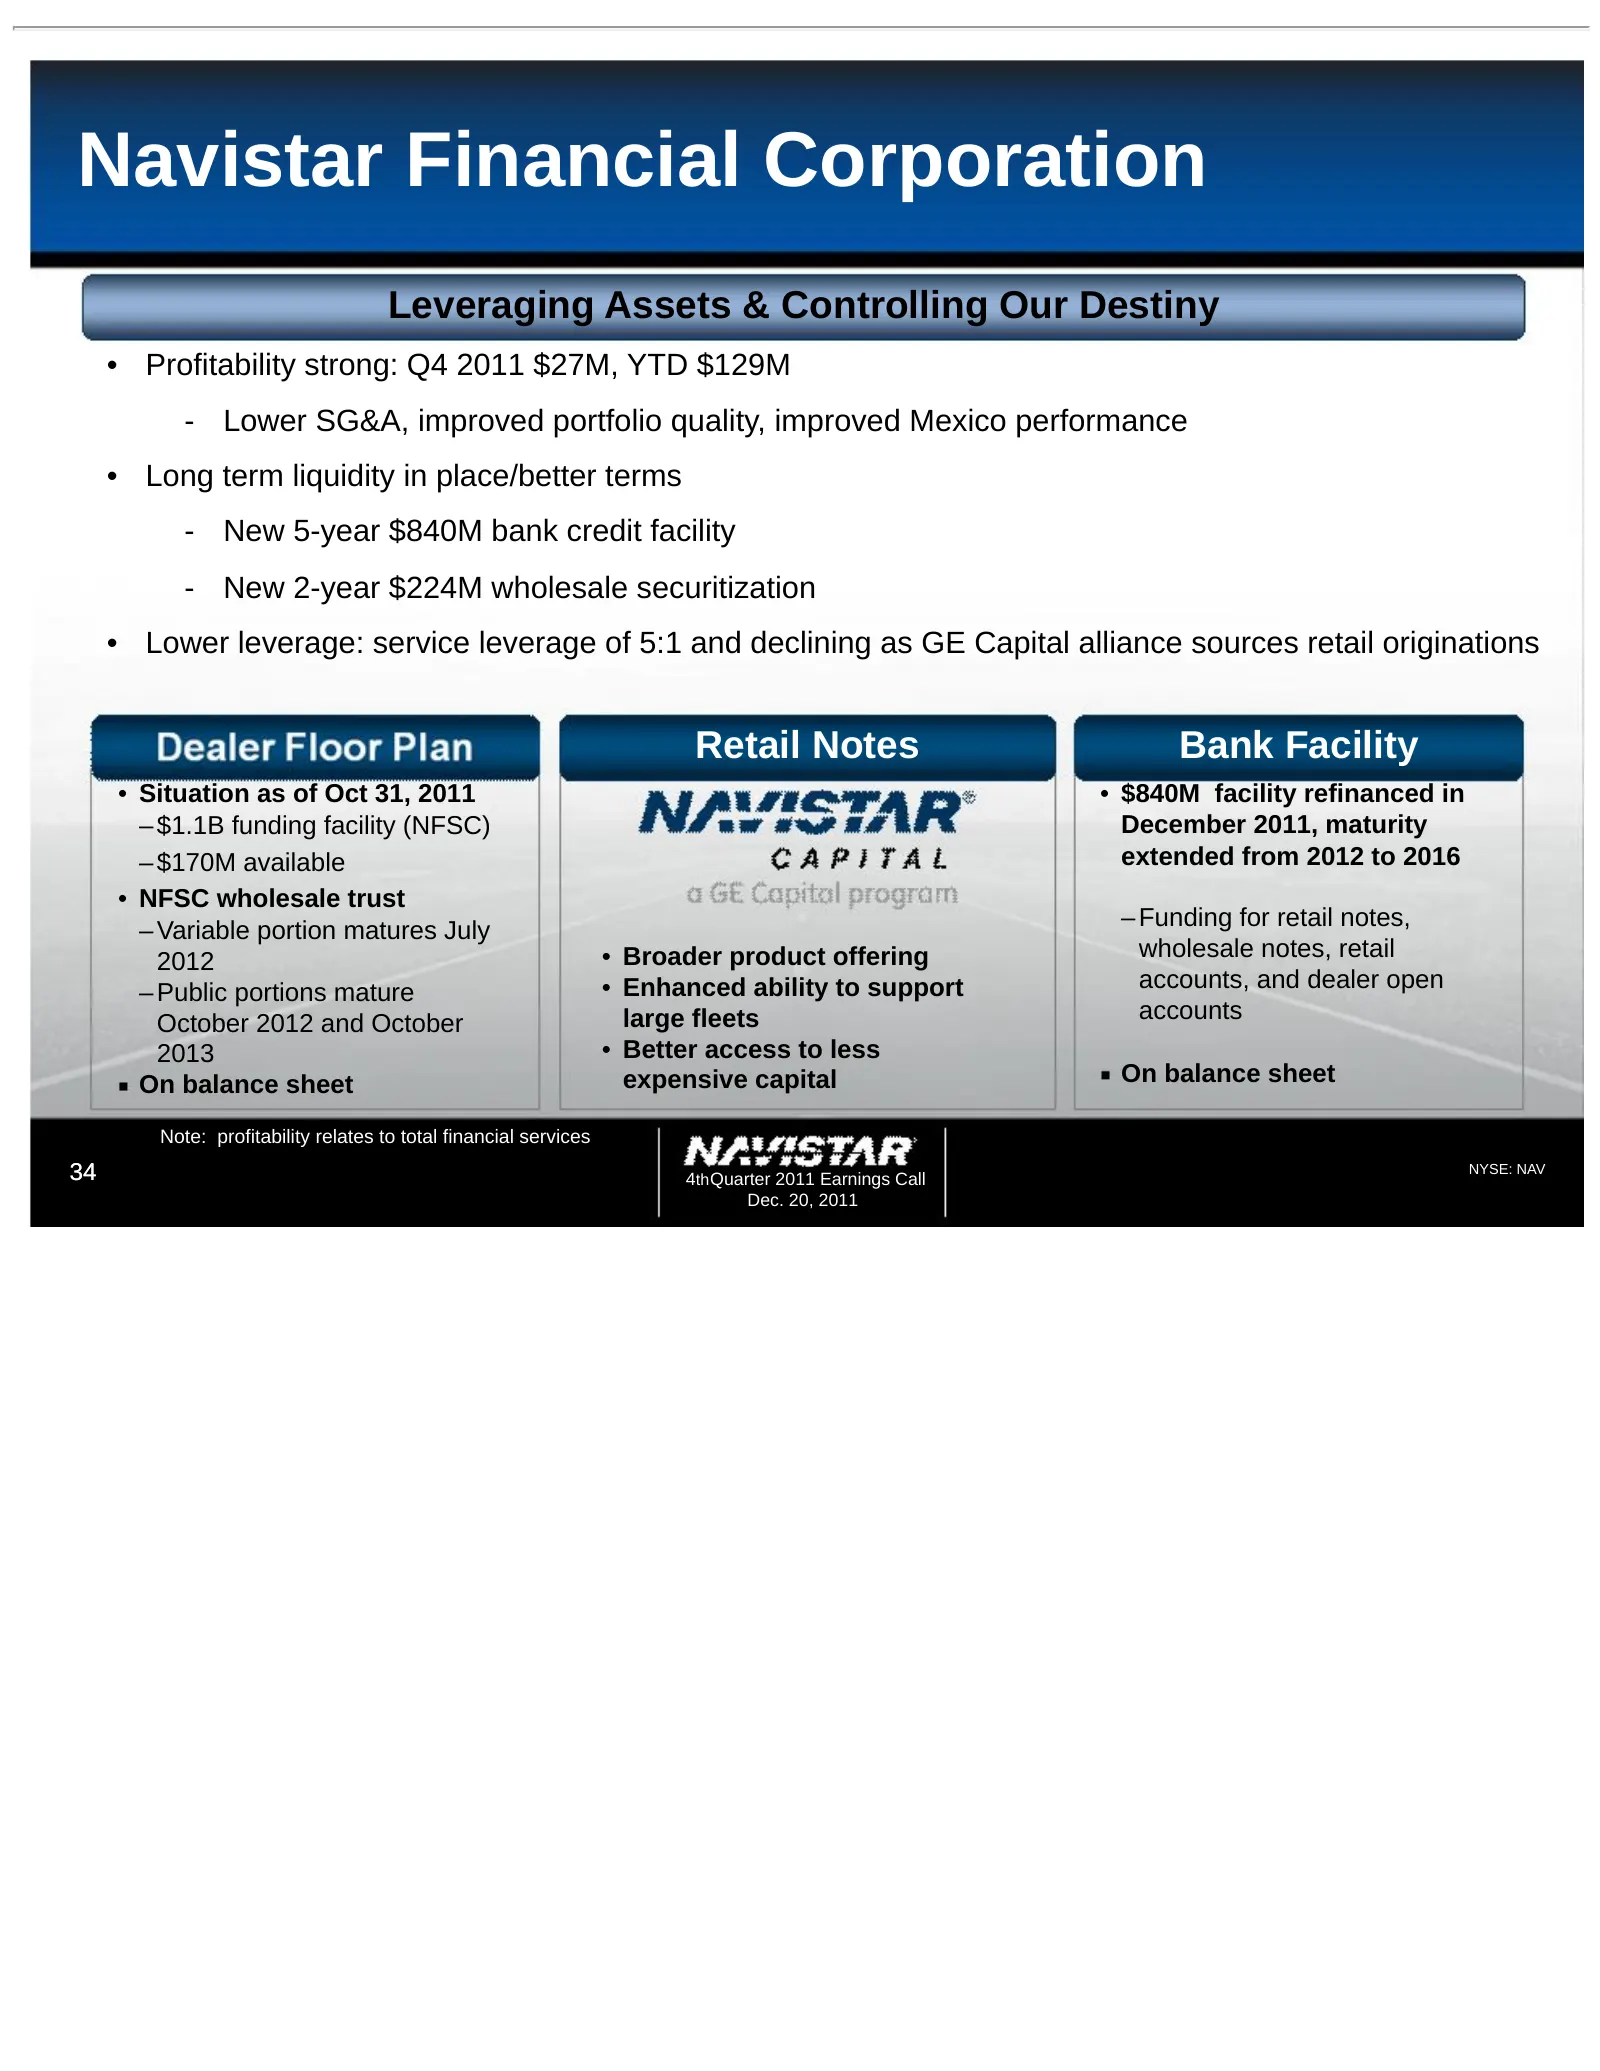
Slide 34: Navistar Financial Corporation
Navistar Financial Corporation Leveraging Assets & Controlling Our Destiny • Profitability strong: Q4 2011 $27M, YTD $129M - Lower SG&A, improved portfolio quality, improved Mexico performance • Long term liquidity in place/better terms - New 5-year $840M bank credit facility - New 2-year $224M whol
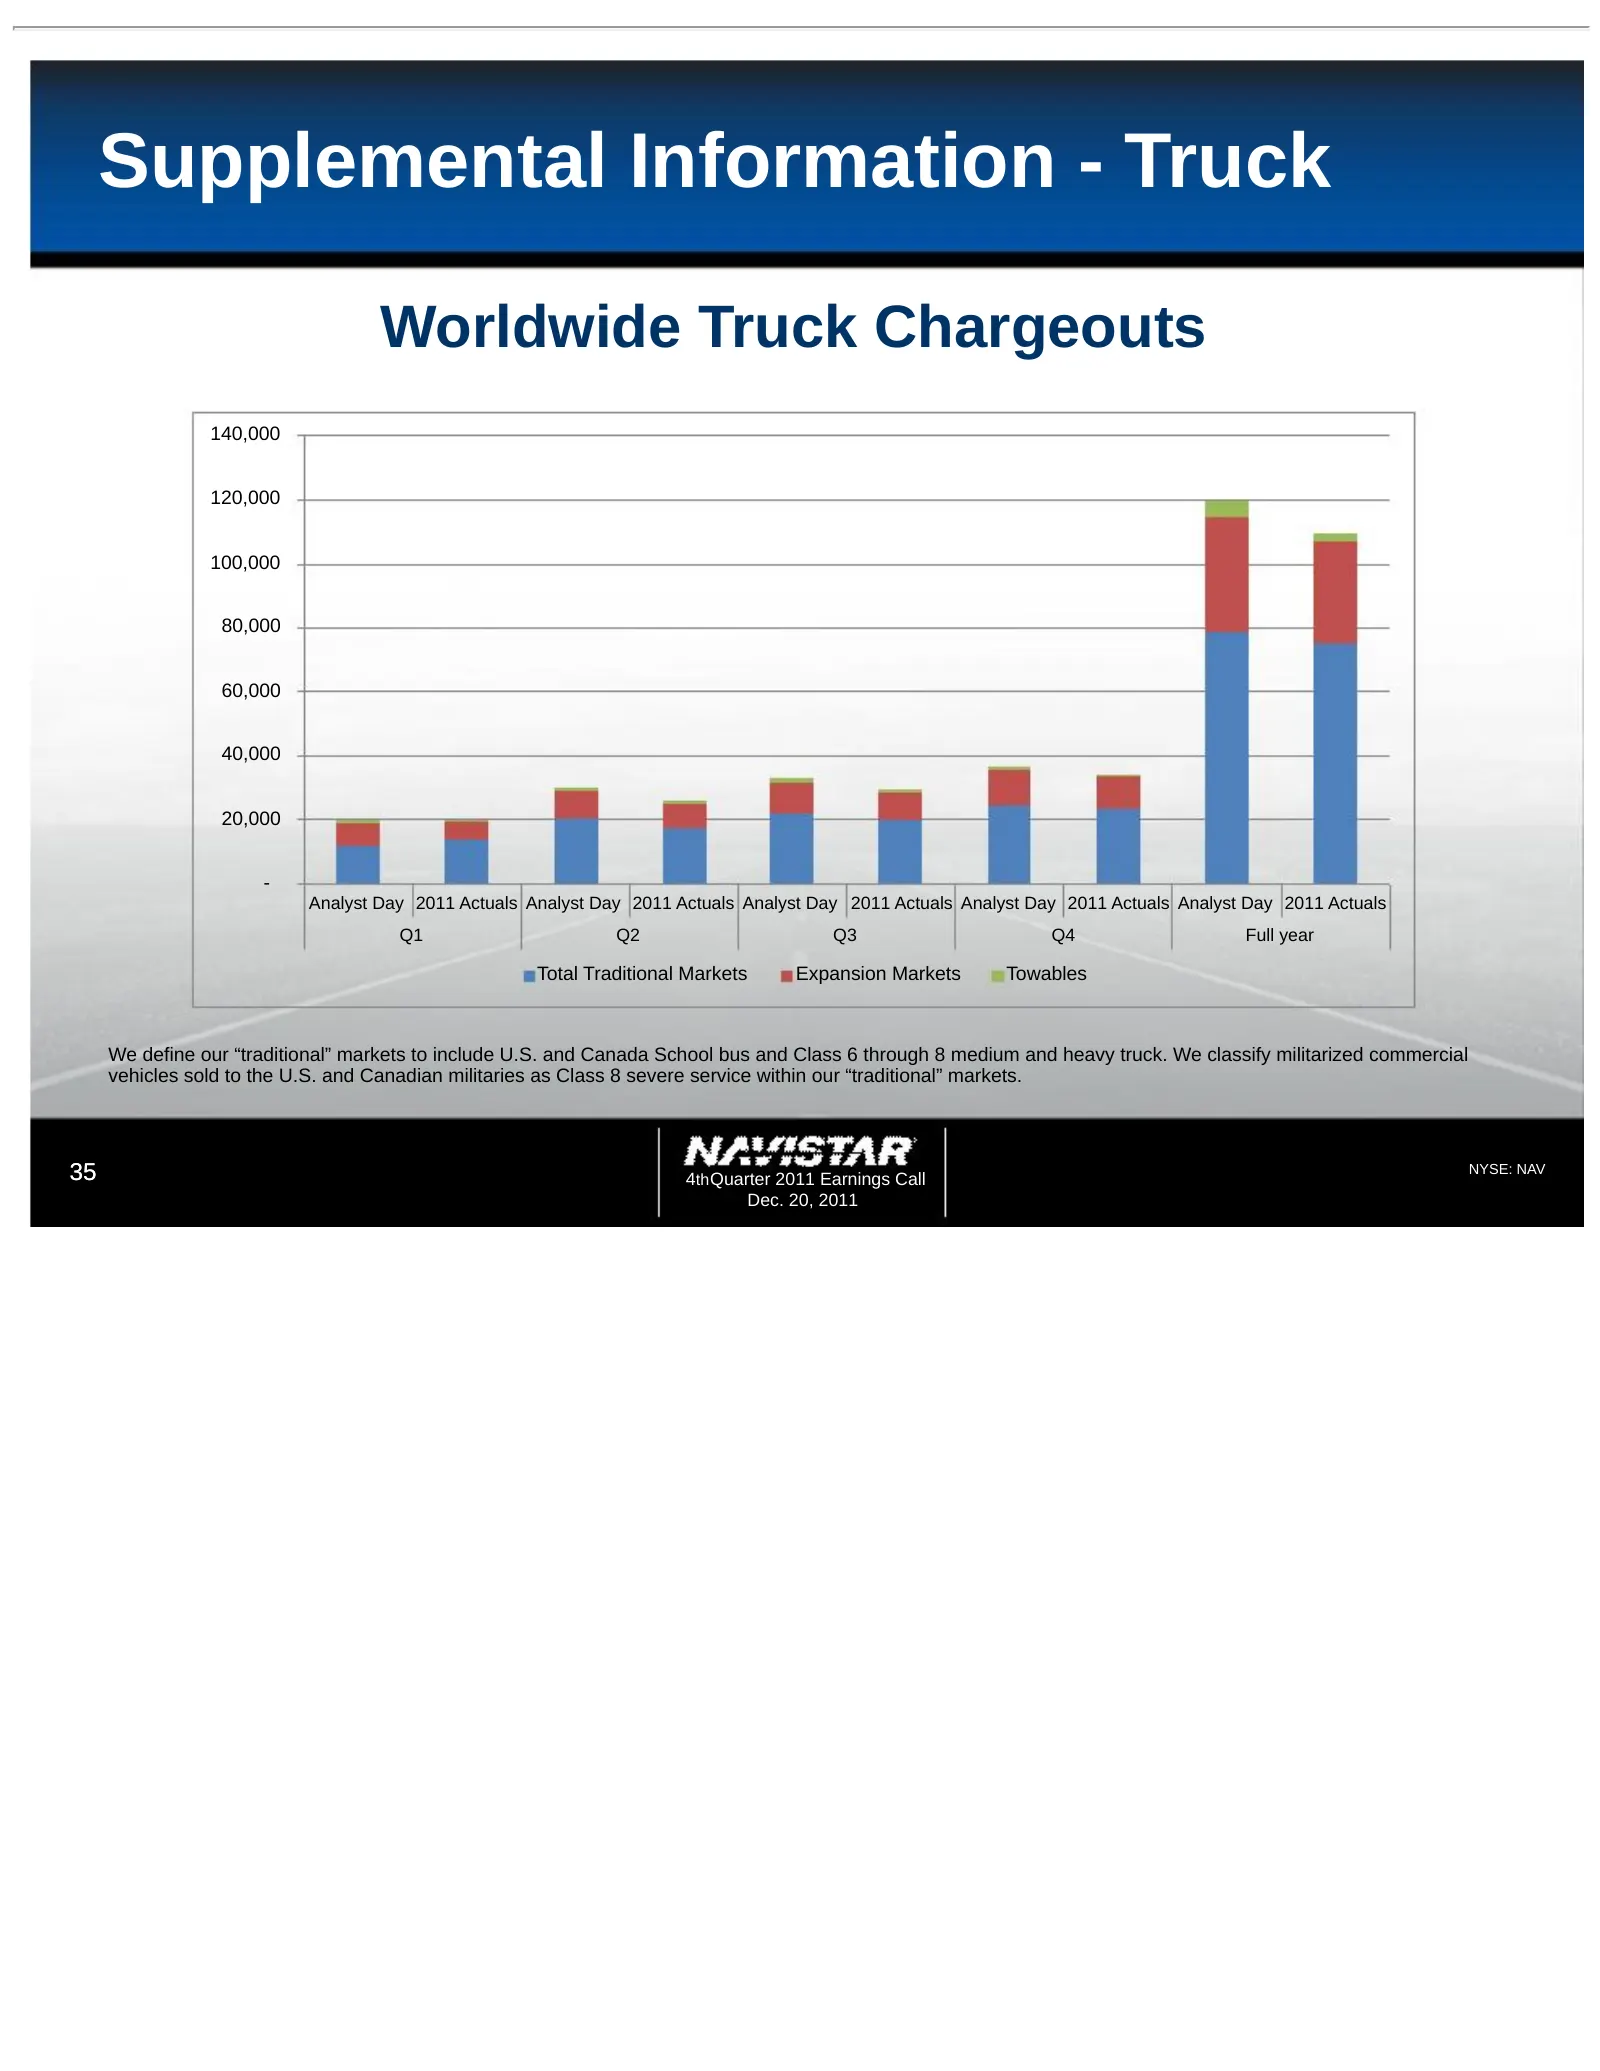
Slide 35: Supplemental Information - Truck
Supplemental Information - Truck Worldwide Truck Chargeouts 140,000 120,000 100,000 80,000 60,000 40,000 20,000 - Analyst Day 2011 Actuals Analyst Day 2011 Actuals Analyst Day 2011 Actuals Analyst Day 2011 Actuals Analyst Day 2011 Actuals Q1 Q2 Q3 Q4 Full year Total Traditional Markets Expansion Mar
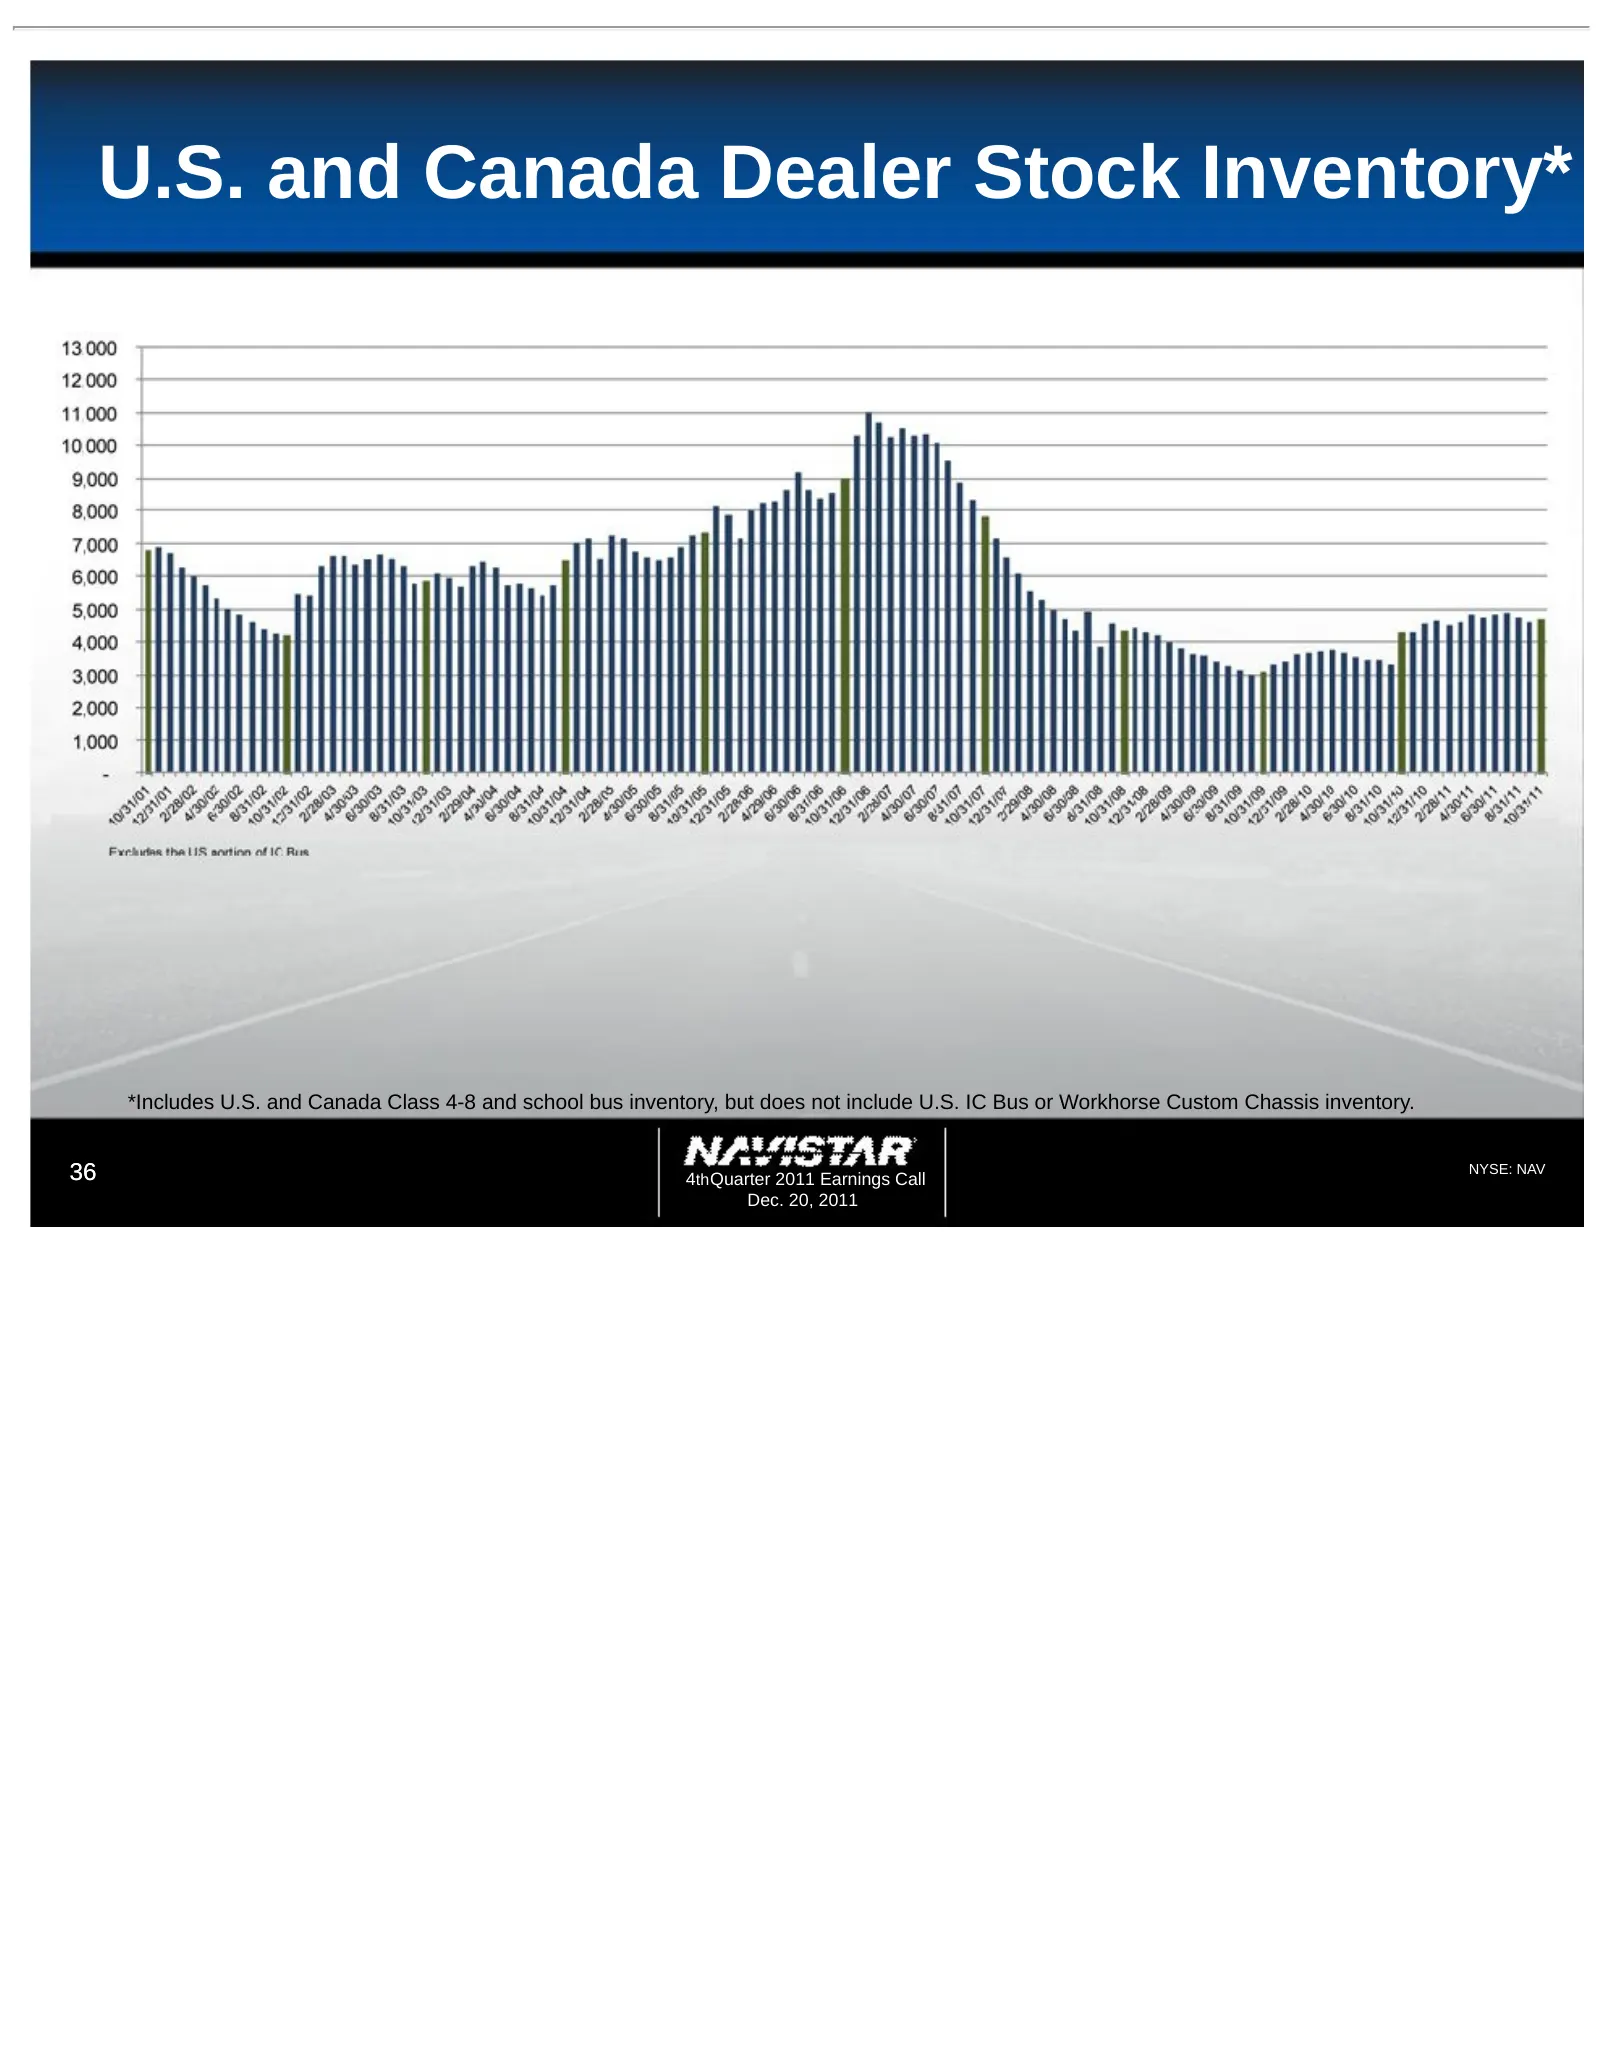
Slide 36: U.S. and Canada Dealer Stock Inventory
U.S. and Canada Dealer Stock Inventory* *Includes U.S. and Canada Class 4-8 and school bus inventory, but does not include U.S. IC Bus or Workhorse Custom Chassis inventory. 36 4th Quarter 2011 Earnings Call NYSE: NAV Dec. 20, 2011
Slide 37: Frequently Asked Questions
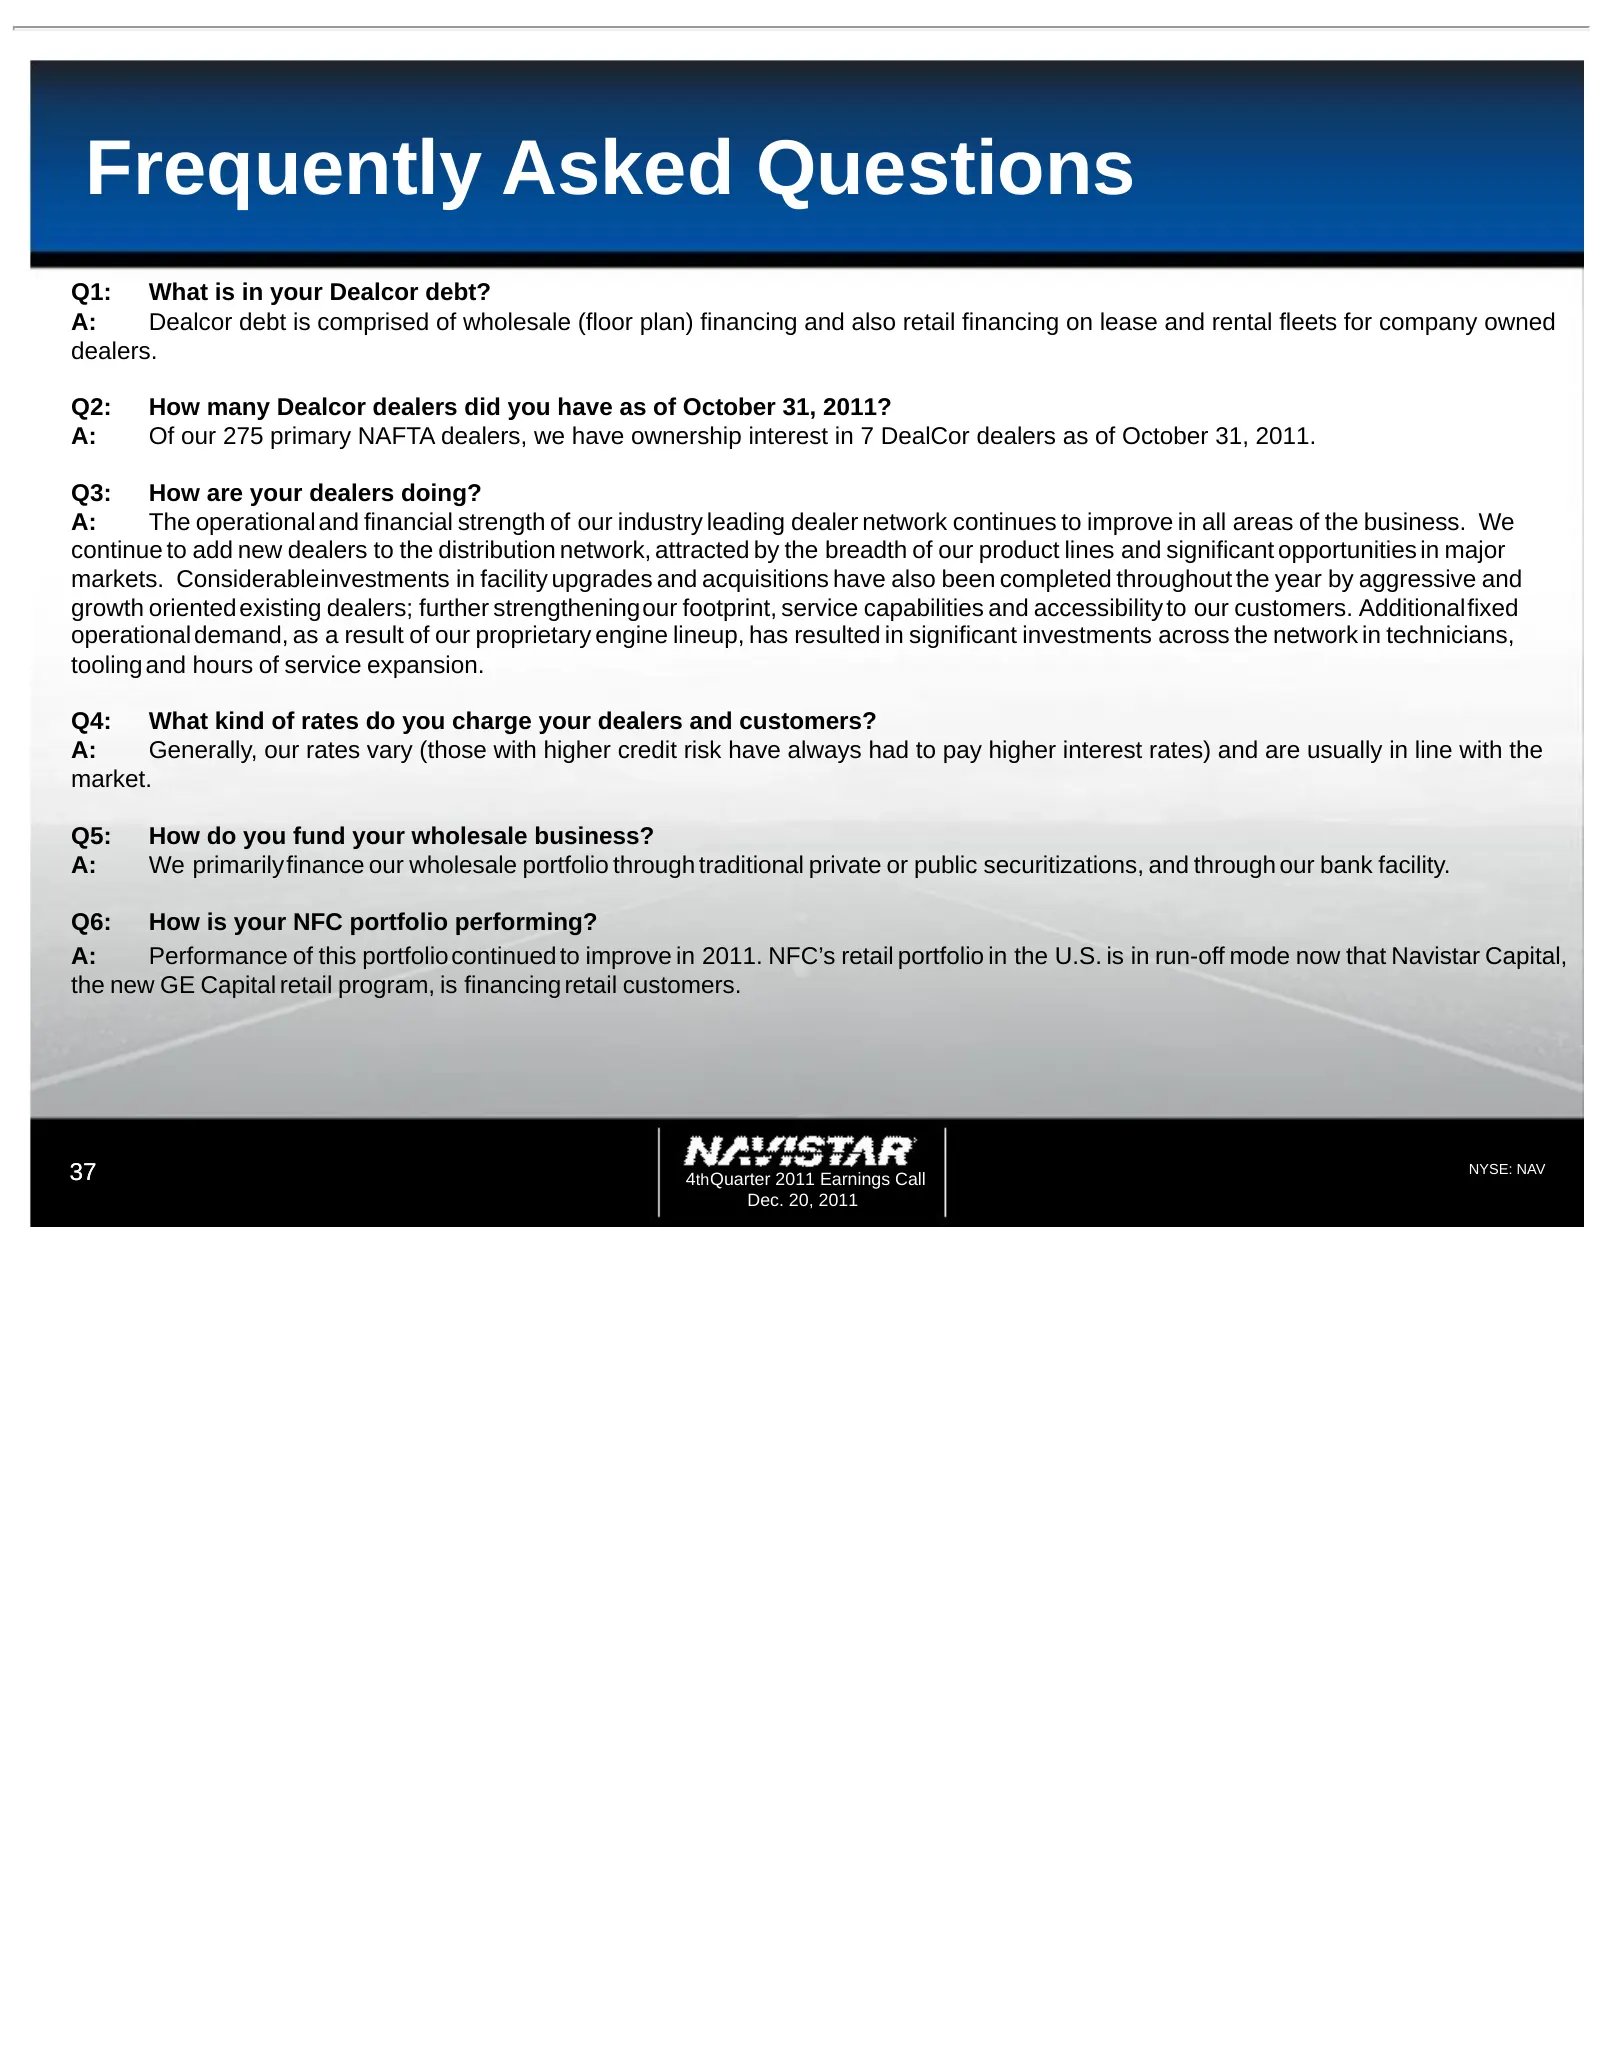
Frequently Asked Questions Q1: What is in your Dealcor debt? A: Dealcor debt is comprised of wholesale (floor plan) financing and also retail financing on lease and rental fleets for company owned dealers. Q2: How many Dealcor dealers did you have as of October 31, 2011? A: Of our 275 primary NAFTA
Slide 38: Frequently Asked Questions
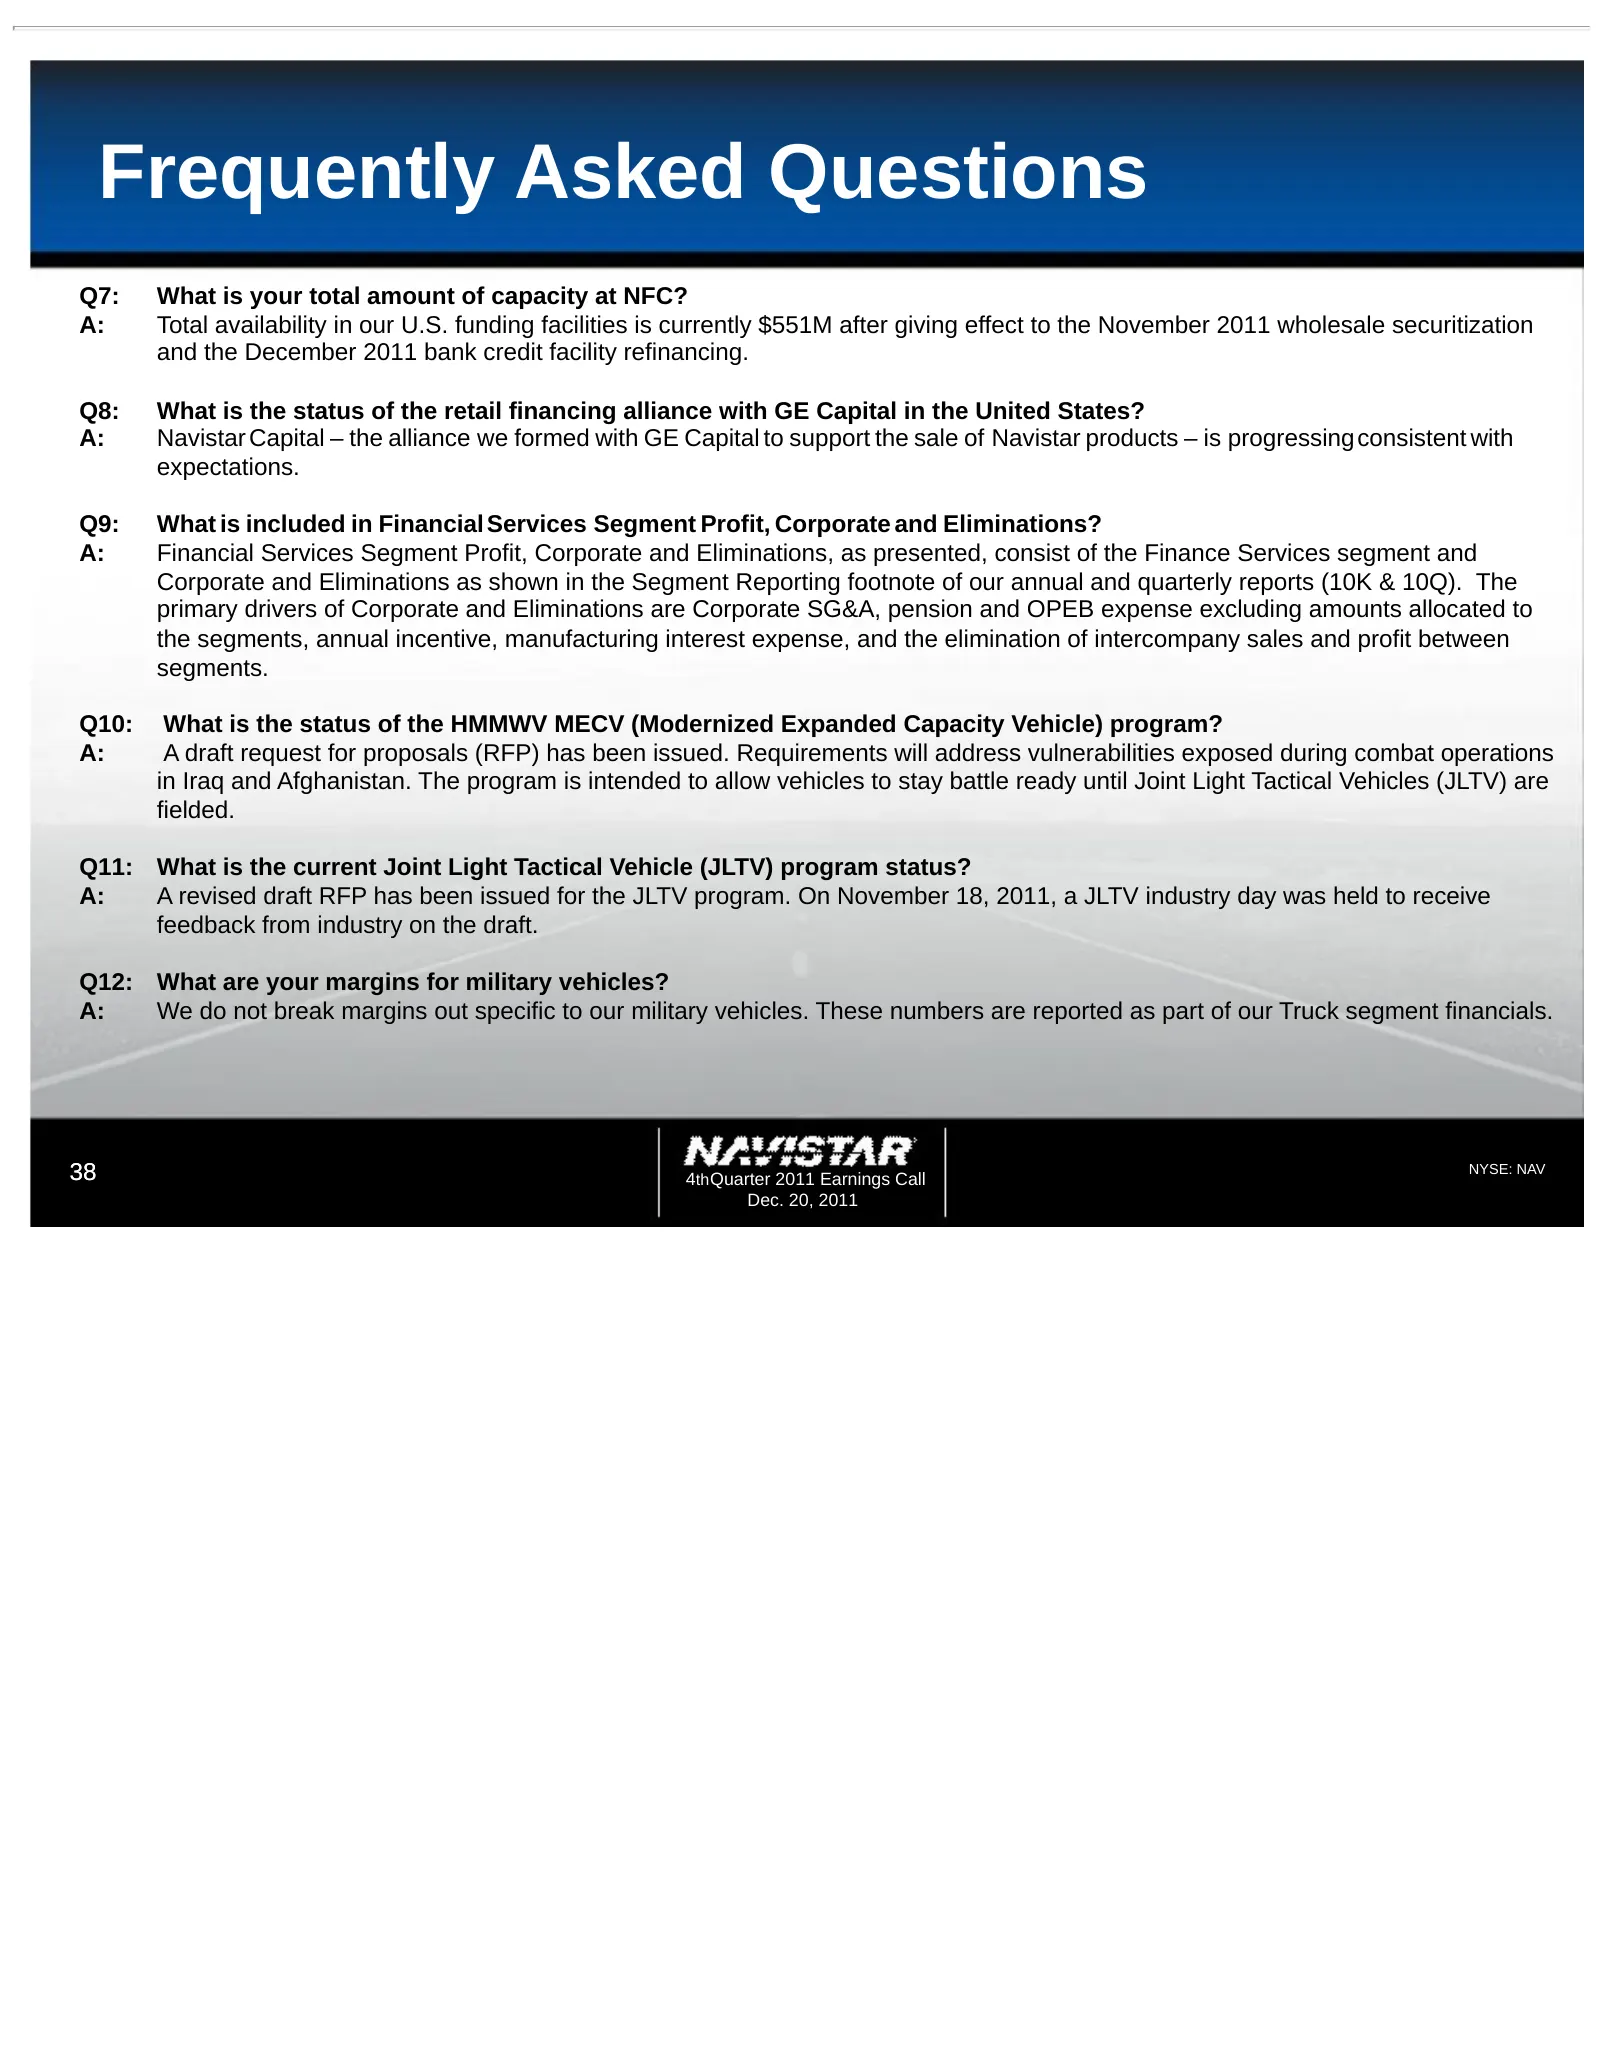
Frequently Asked Questions Q7: What is your total amount of capacity at NFC? A: Total availability in our U.S. funding facilities is currently $551M after giving effect to the November 2011 wholesale securitization and the December 2011 bank credit facility refinancing. Q8: What is the status of the
Slide 39: Frequently Asked Questions
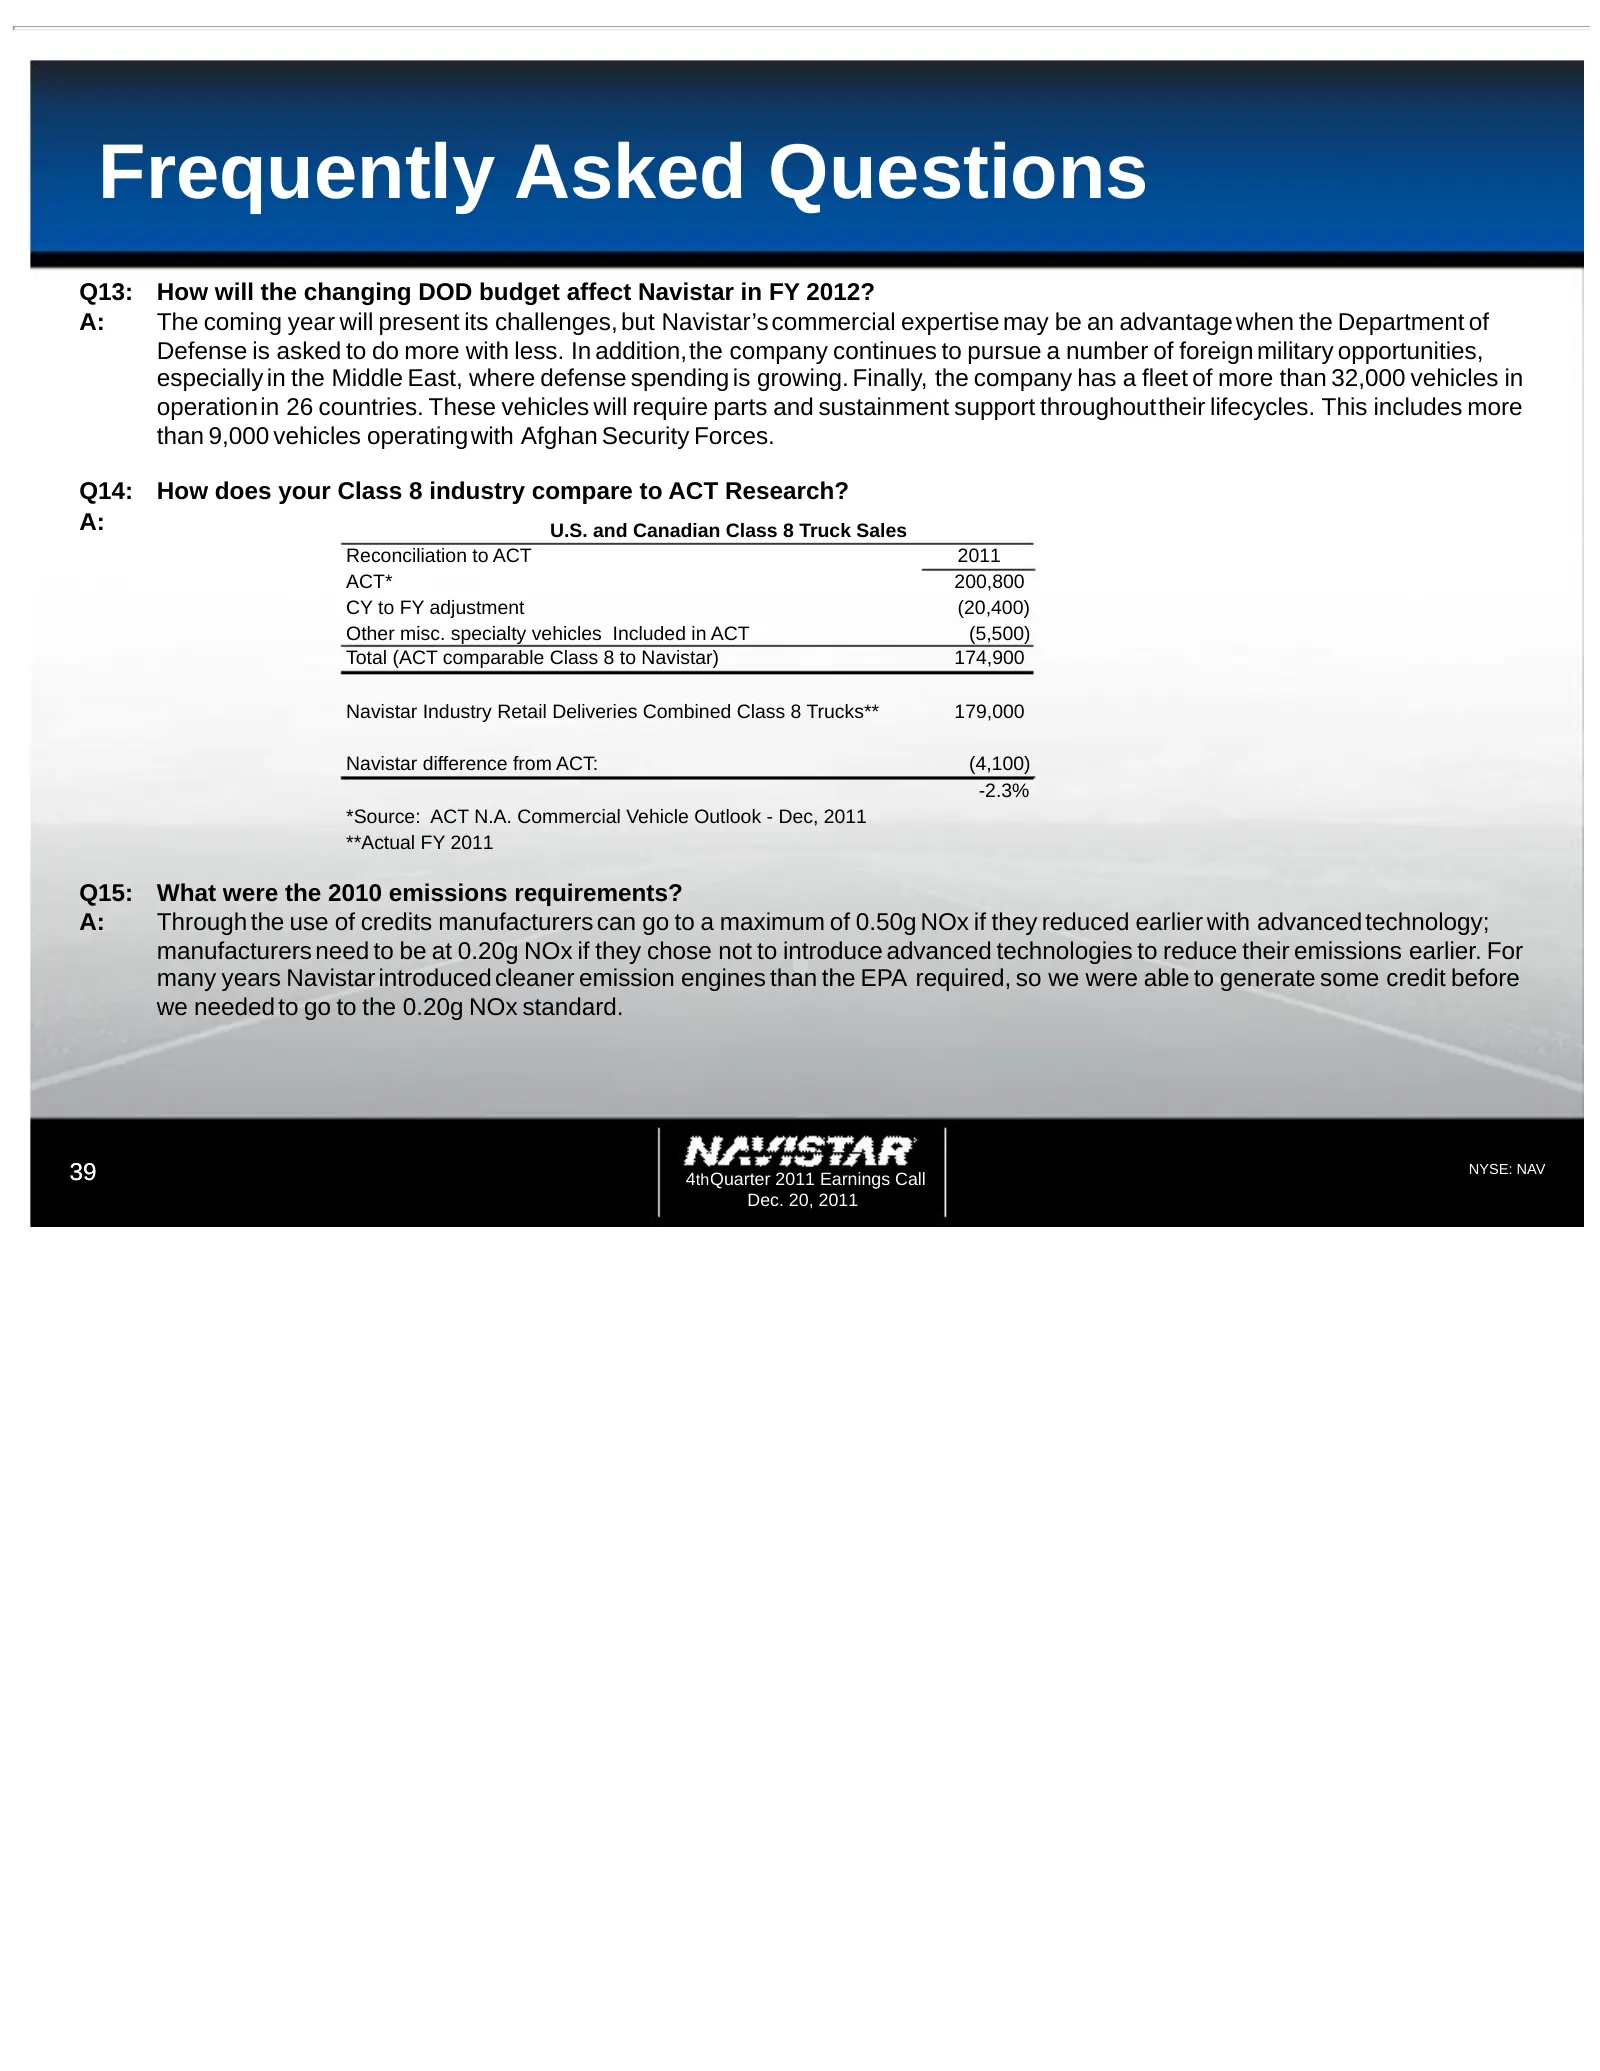
Frequently Asked Questions Q13: How will the changing DOD budget affect Navistar in FY 2012? A: The coming year will present its challenges, but Navistar’s commercial expertise may be an advantage when the Department of Defense is asked to do more with less. In addition,the company continues to purs
Slide 40: Frequently Asked Questions
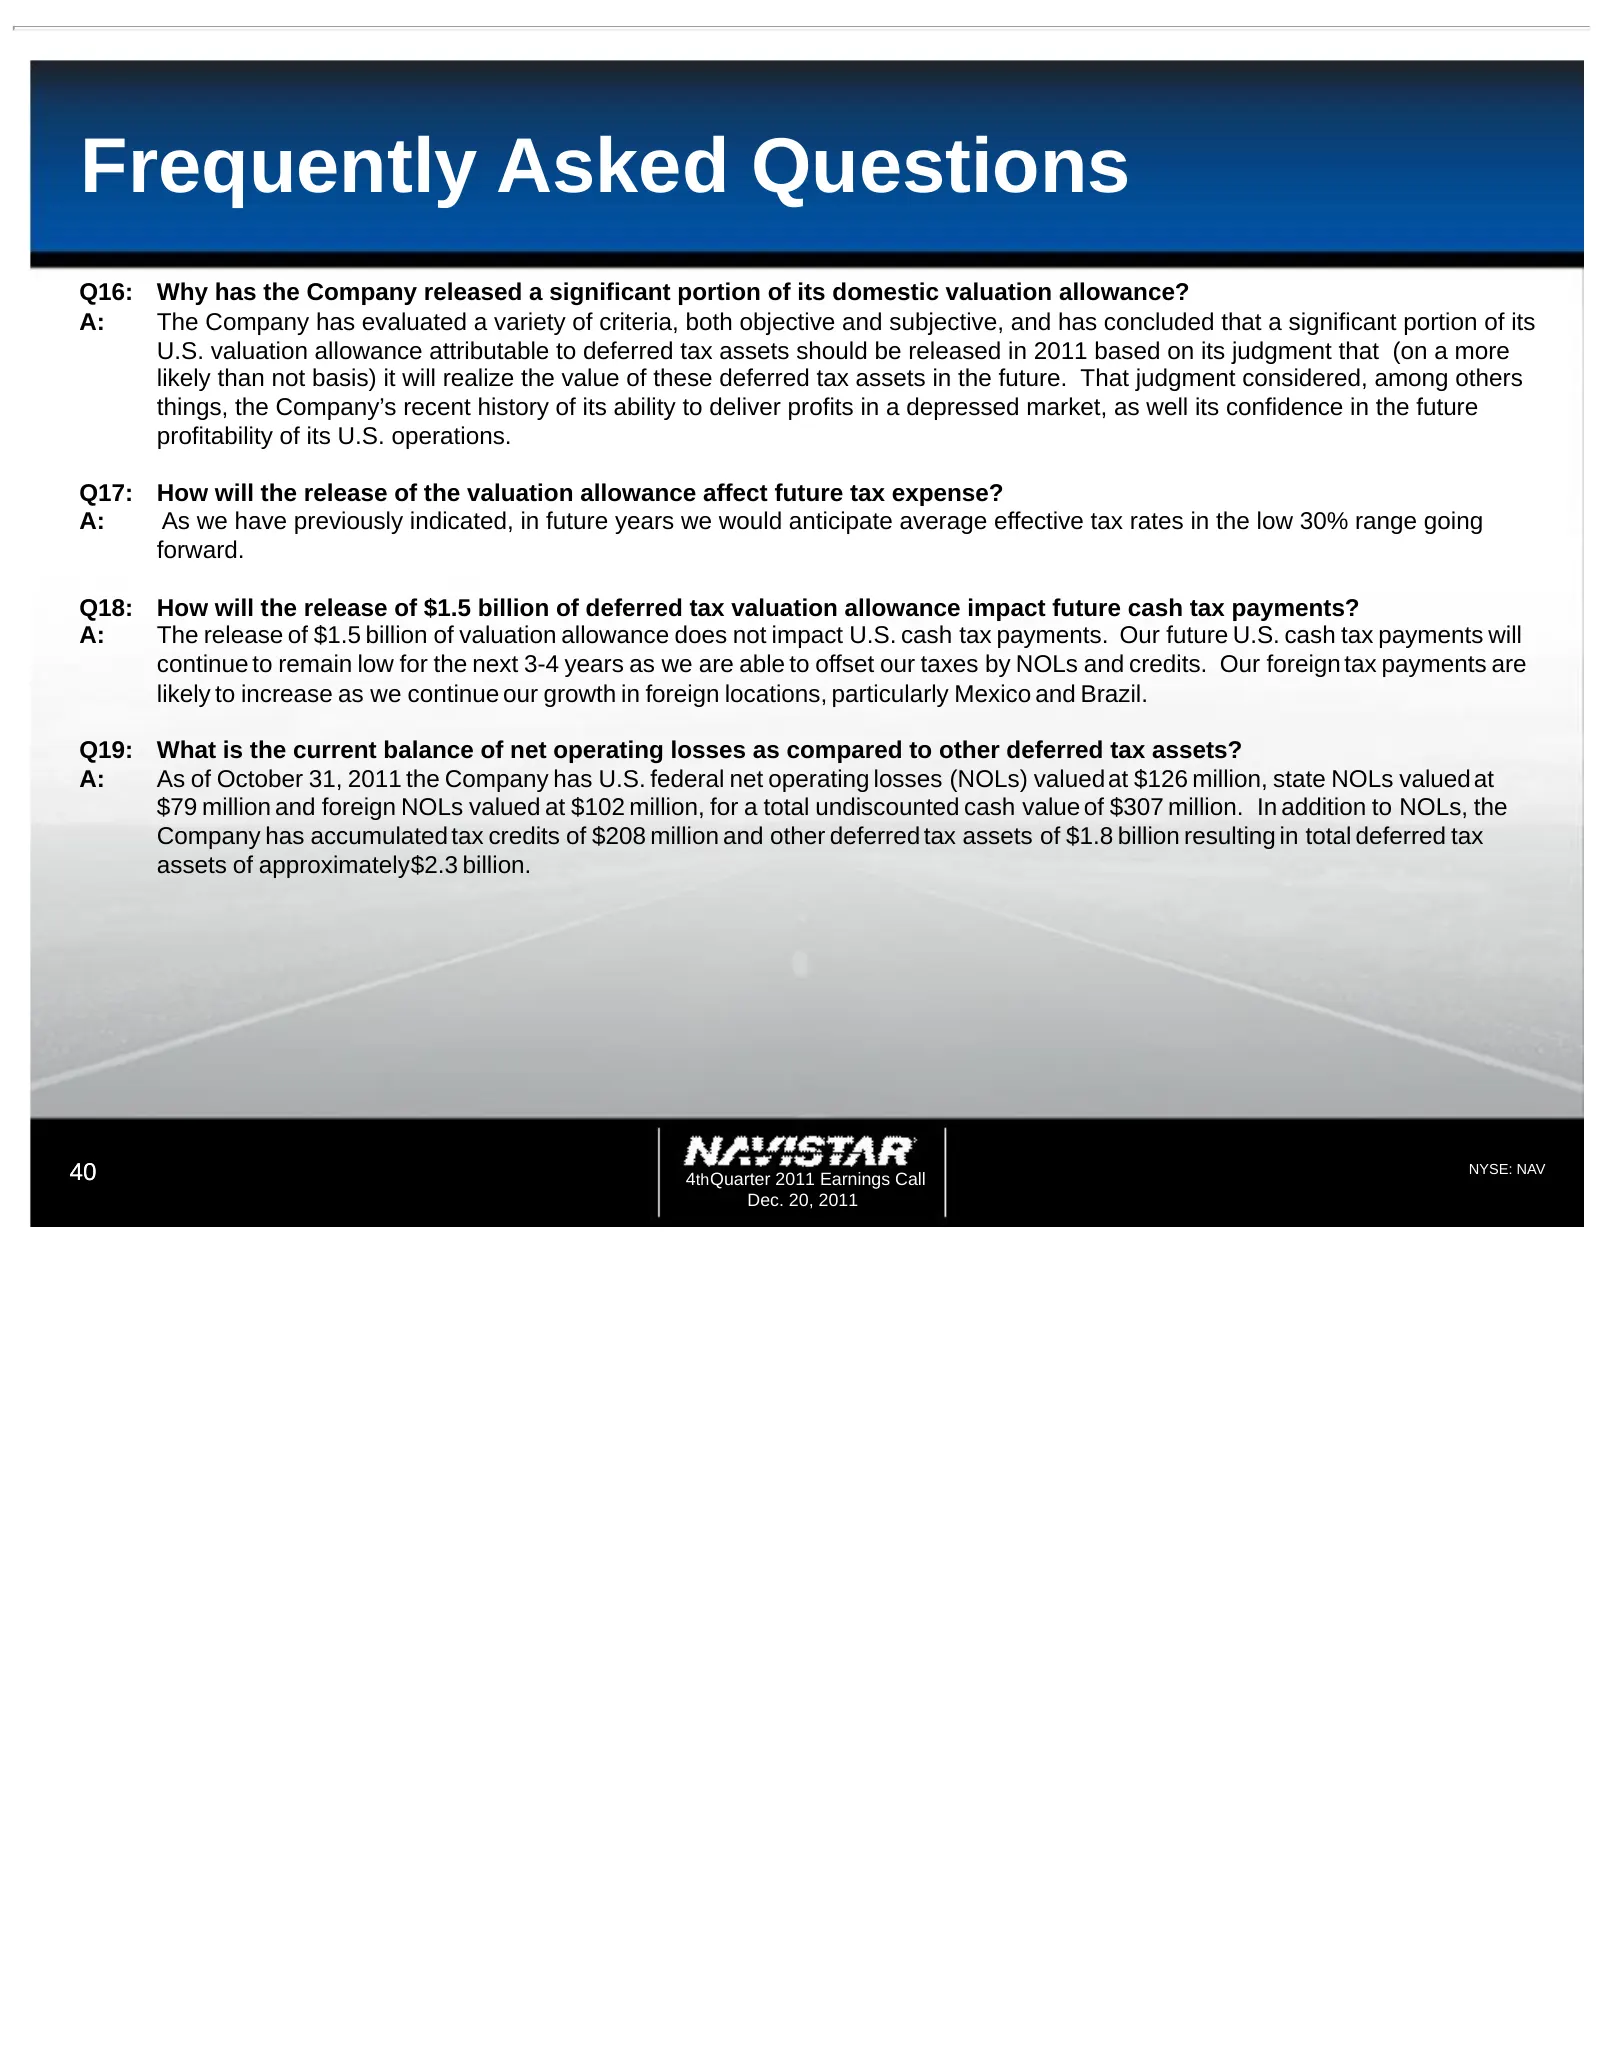
Frequently Asked Questions Q16: Why has the Company released a significant portion of its domestic valuation allowance? A: The Company has evaluated a variety of criteria, both objective and subjective, and has concluded that a significant portion of its U.S. valuation allowance attributable to defe
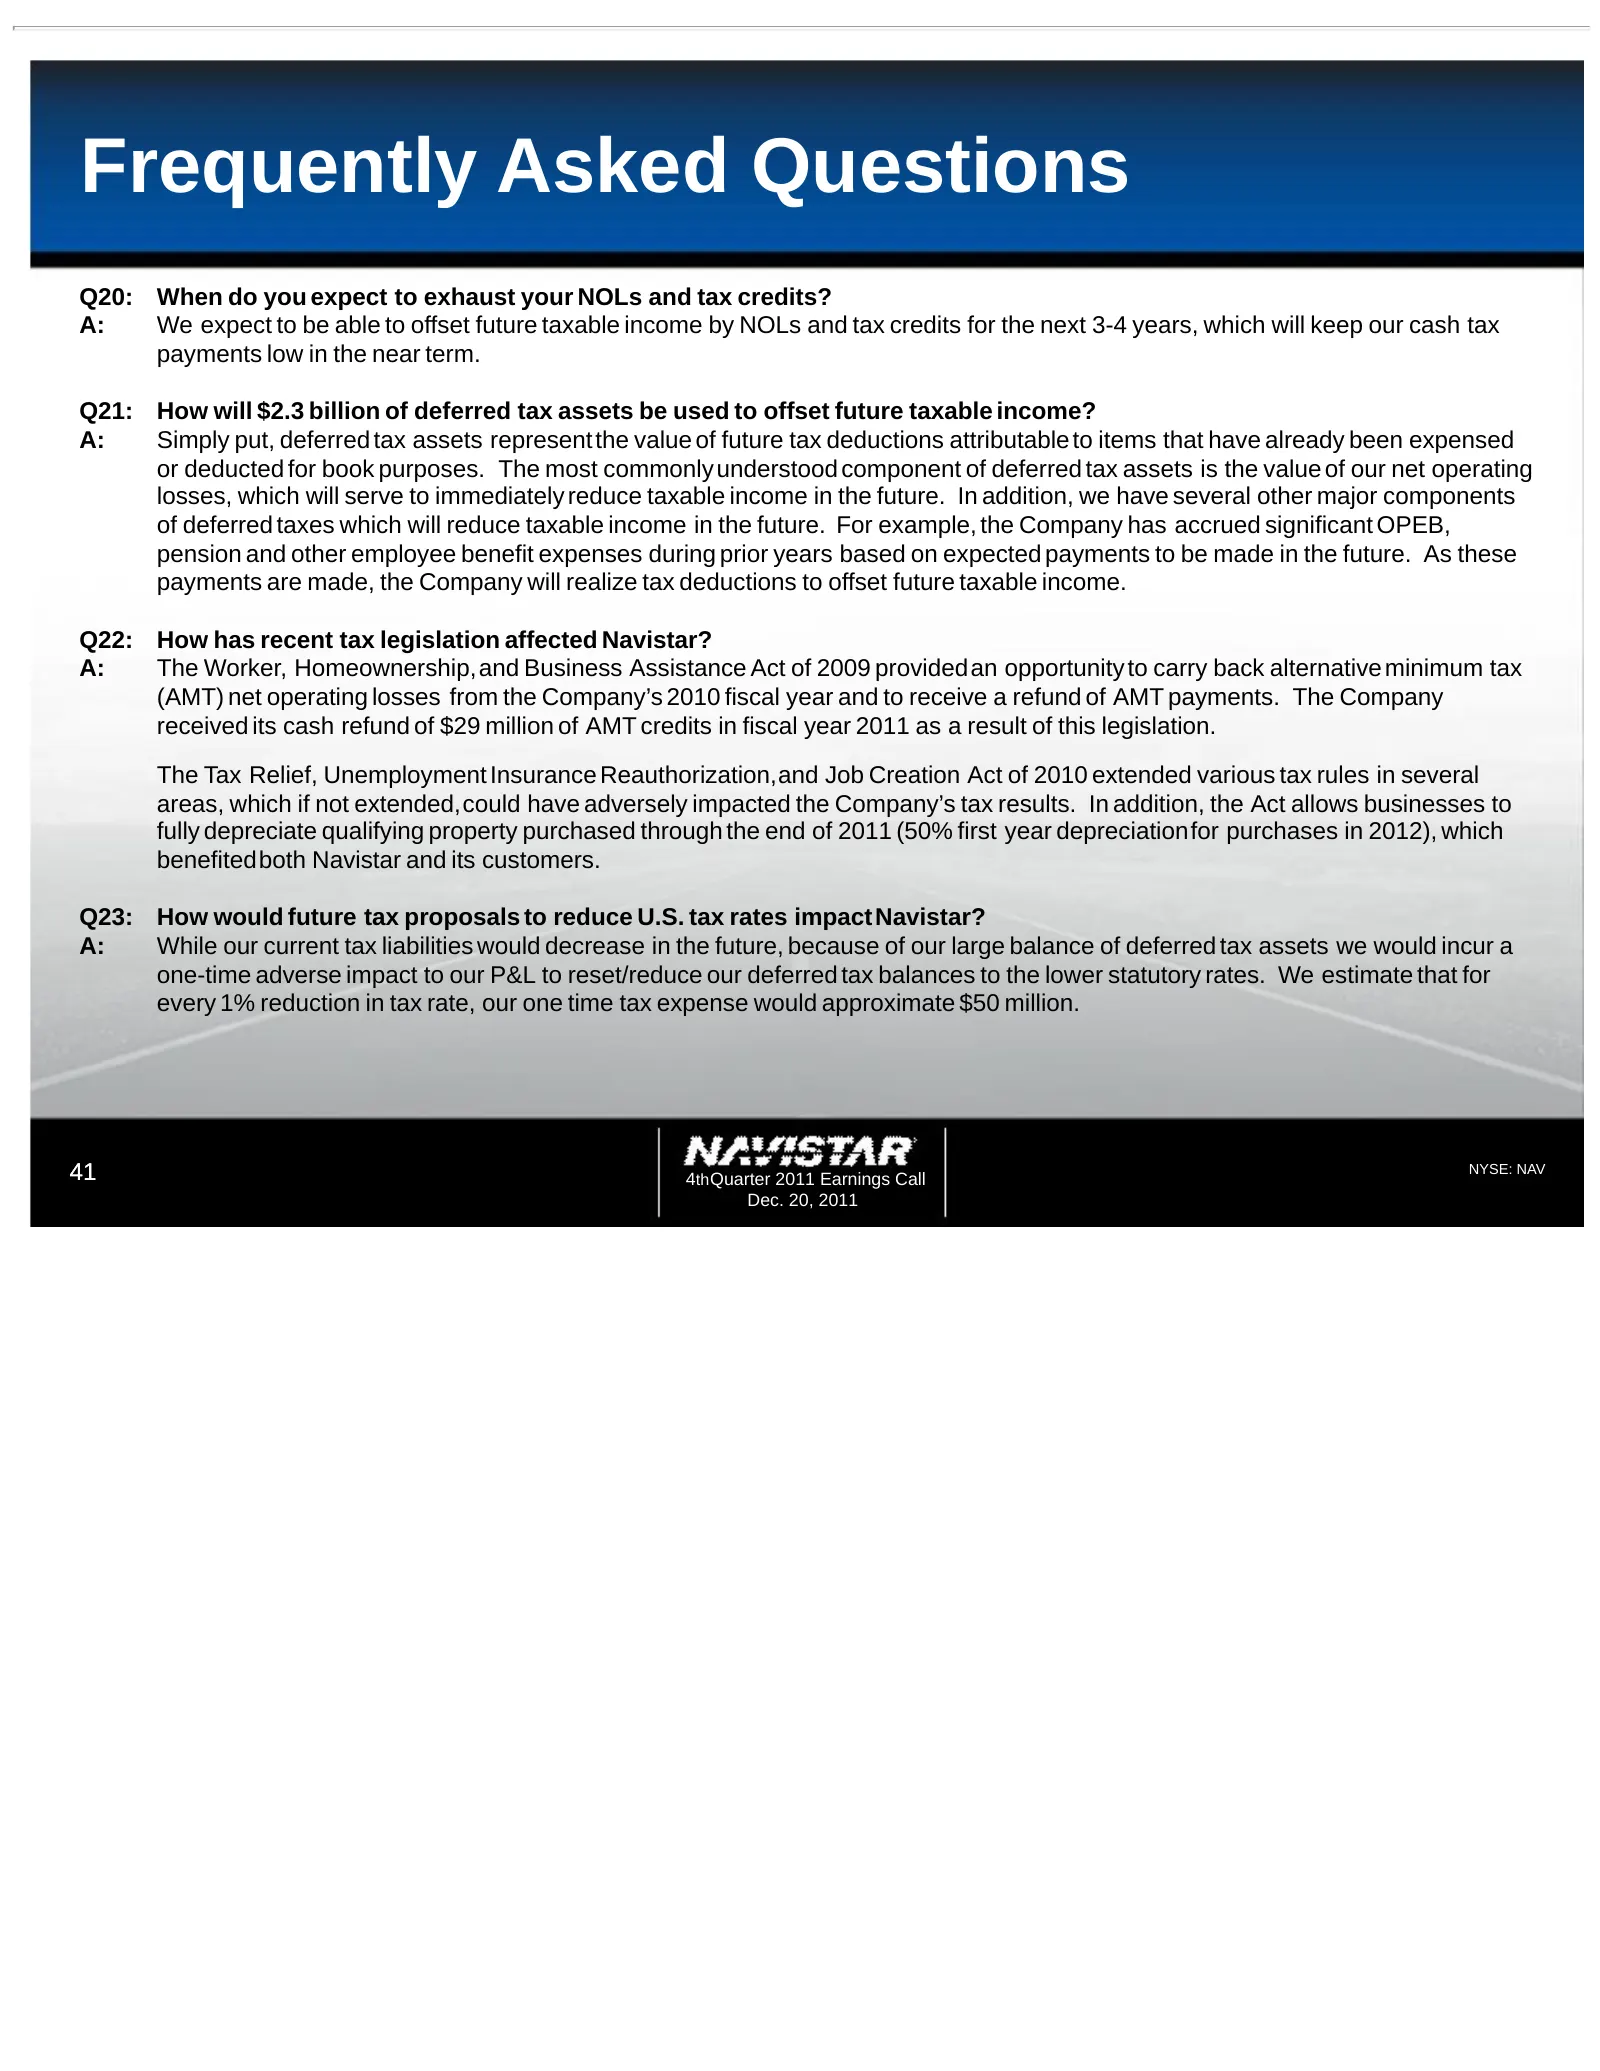
Slide 41: Frequently Asked Questions
Frequently Asked Questions Q20: When do you expect to exhaust your NOLs and tax credits? A: We expect to be able to offset future taxable income by NOLs and tax credits for the next 3-4 years, which will keep our cash tax payments low in the near term. Q21: How will $2.3 billion of deferred tax asse
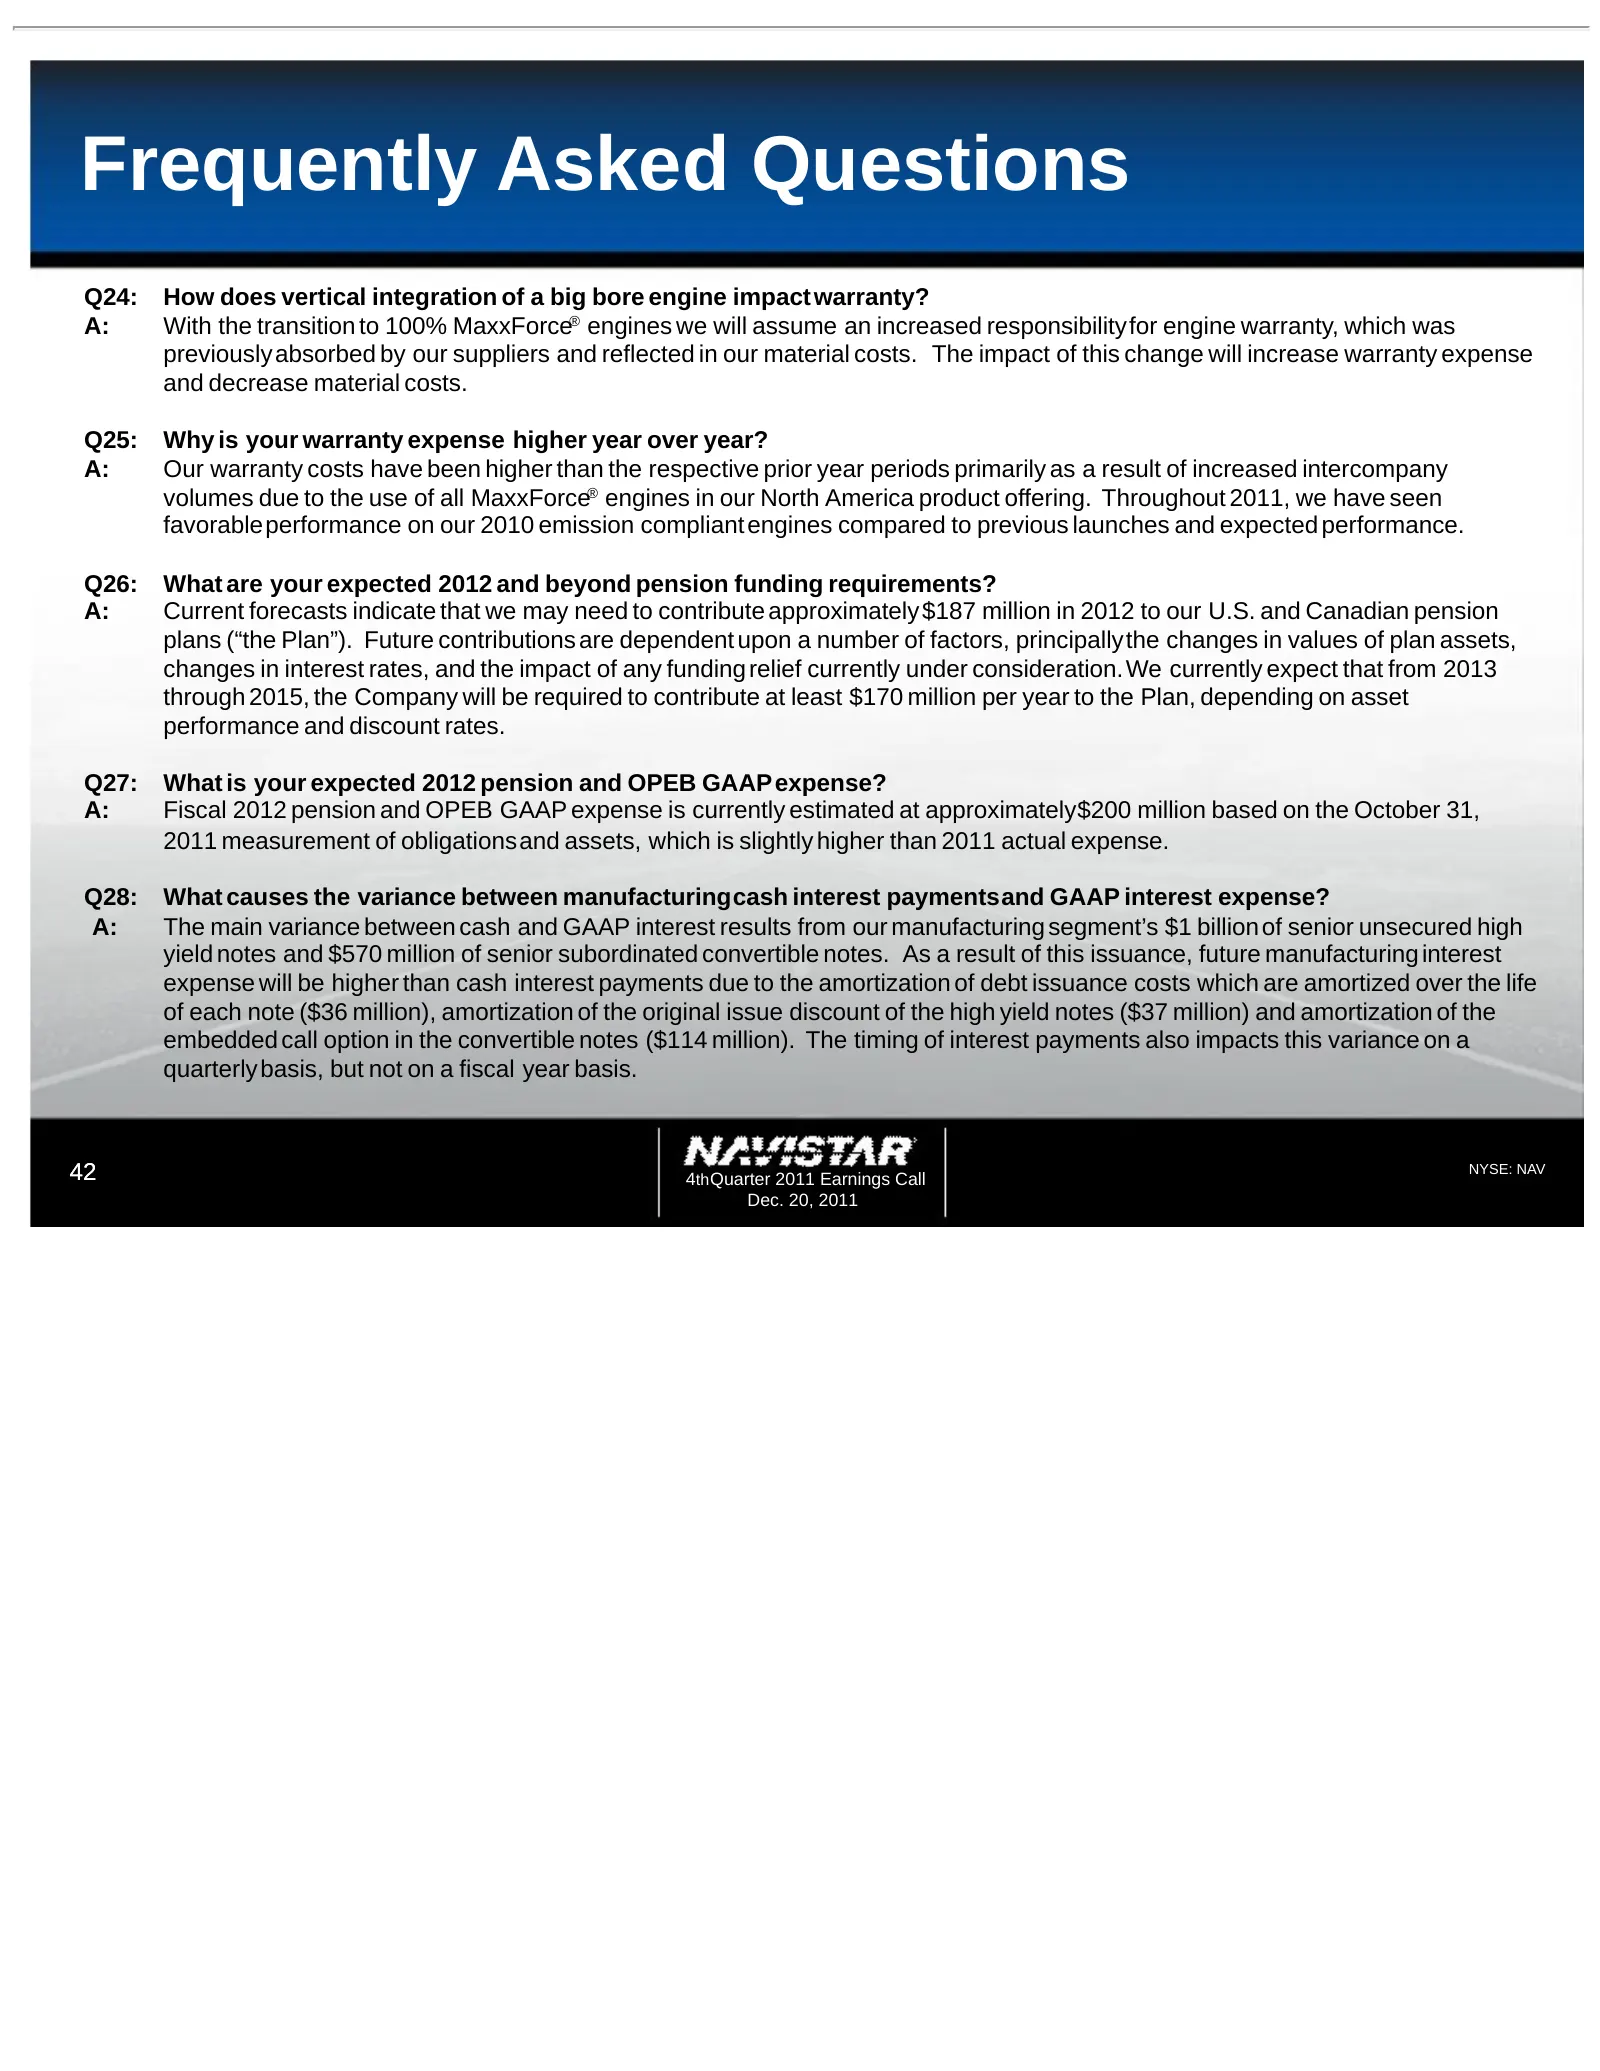
Slide 42: Frequently Asked Questions
Frequently Asked Questions Q24: How does vertical integration of a big bore engine impact warranty? A: With the transition to 100% MaxxForce® engines we will assume an increased responsibilityfor engine warranty, which was previouslyabsorbed by our suppliers and reflected in our material costs. The
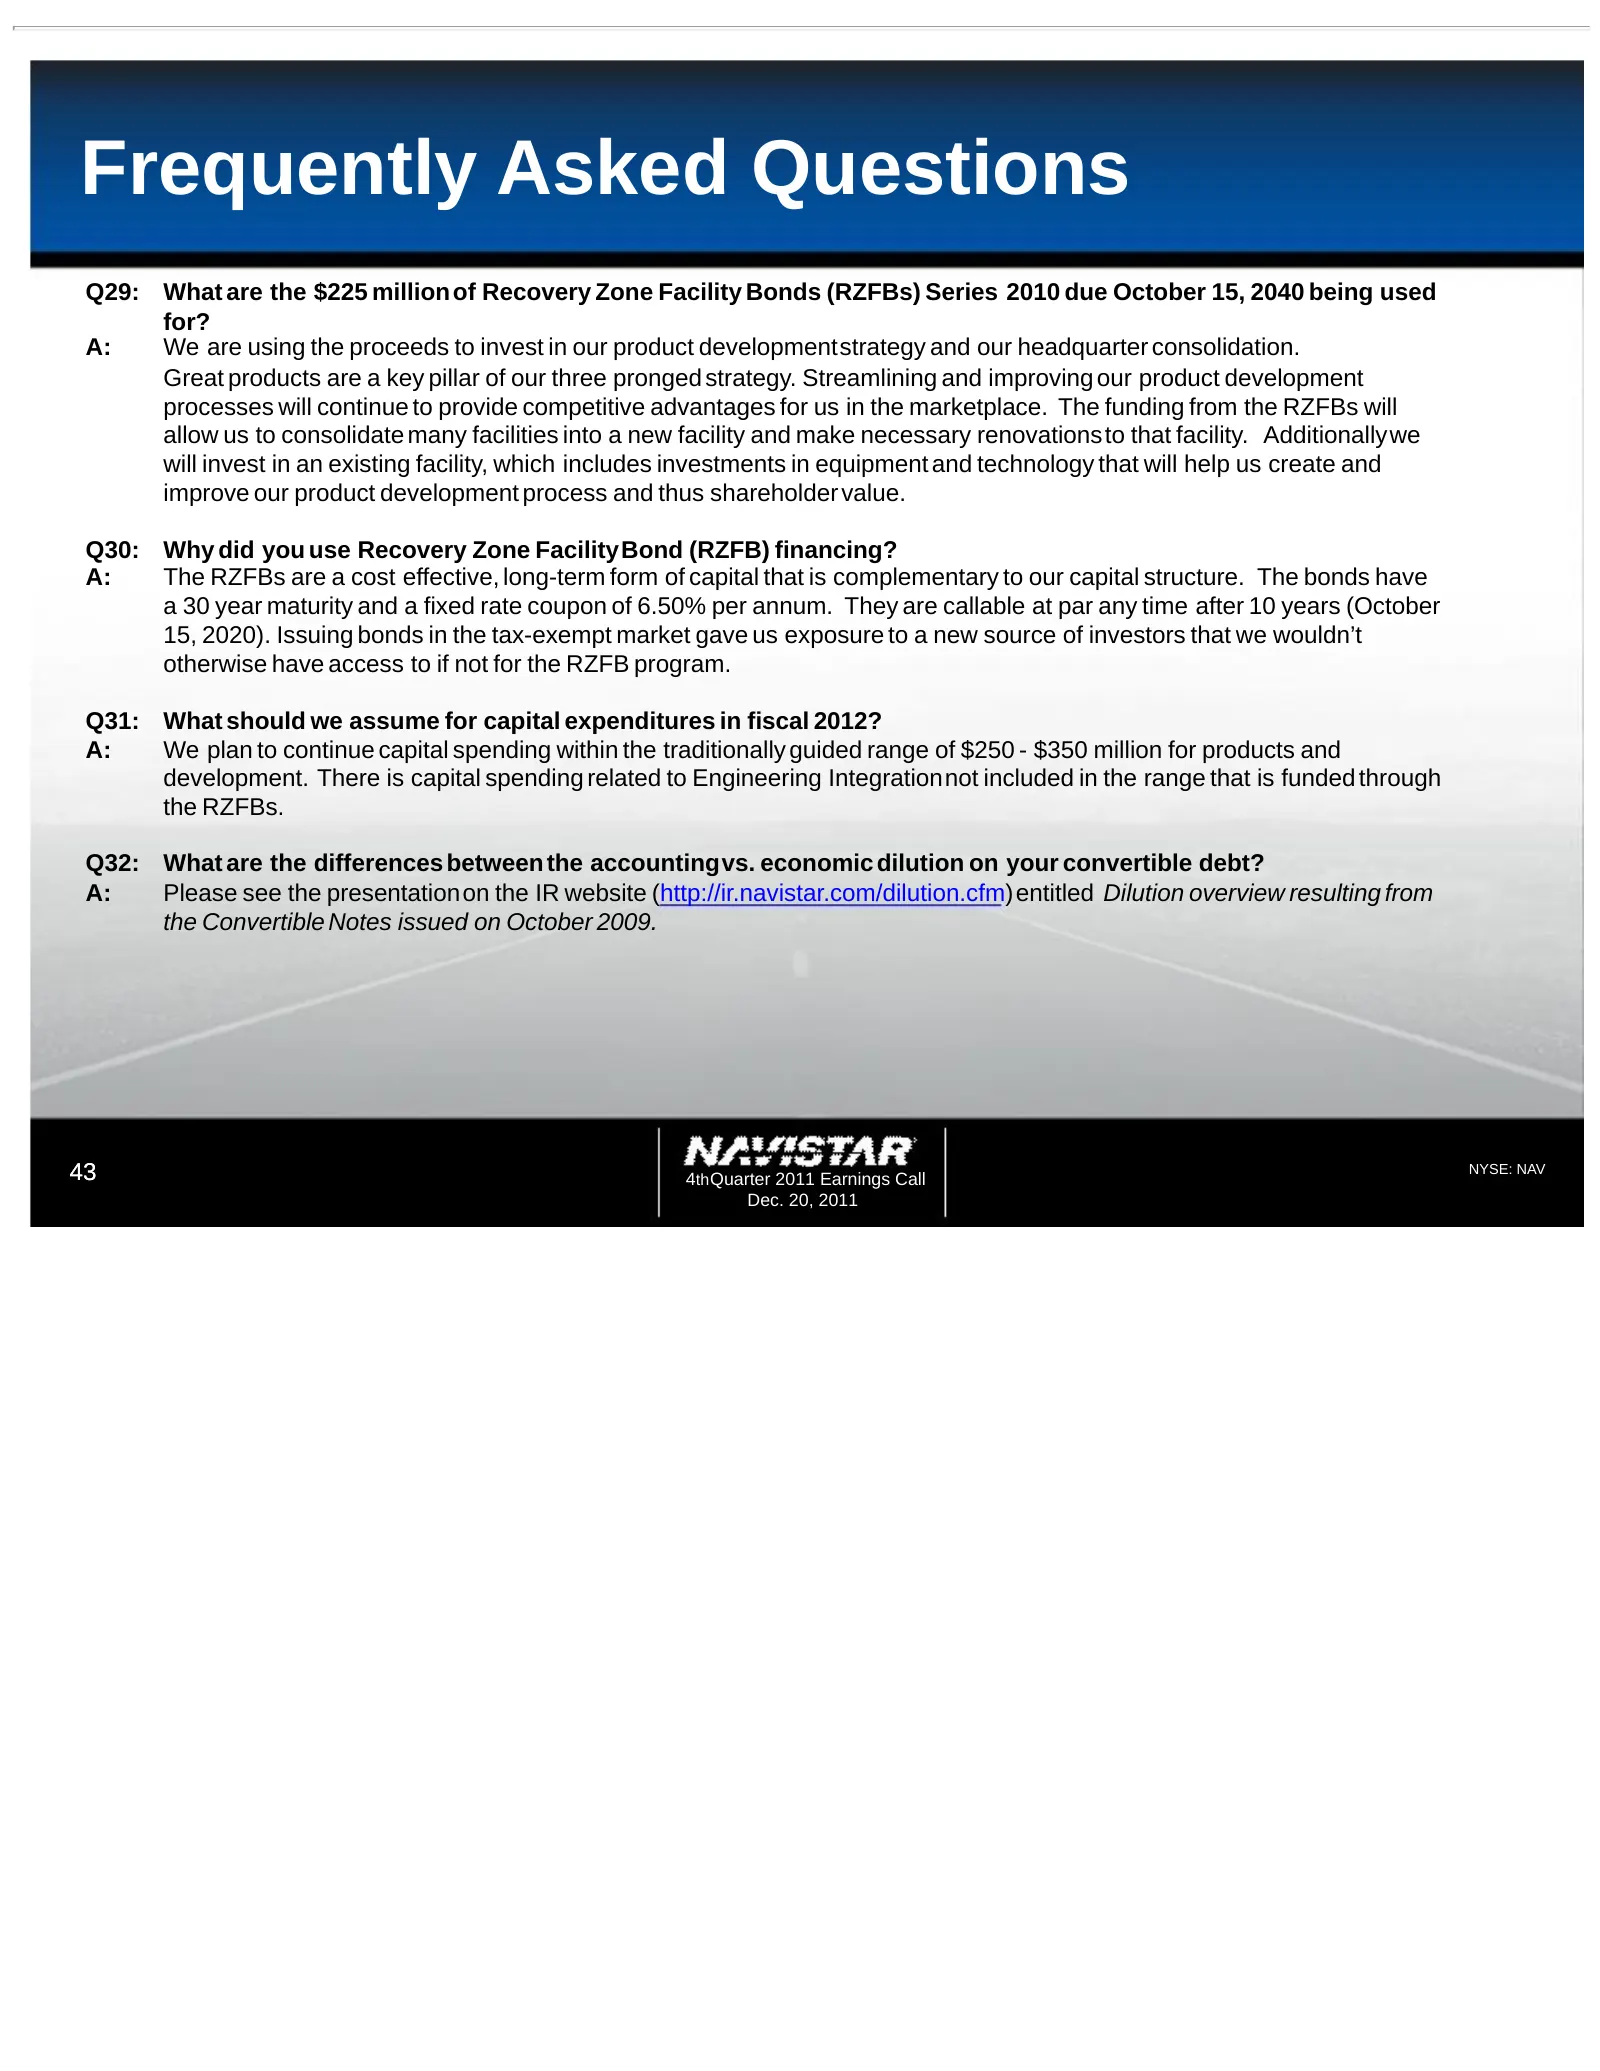
Slide 43: Frequently Asked Questions
Frequently Asked Questions Q29: What are the $225 million of Recovery Zone Facility Bonds (RZFBs) Series 2010 due October 15, 2040 being used for? A: We are using the proceeds to invest in our product developmentstrategy and our headquarter consolidation. Great products are a key pillar of our three
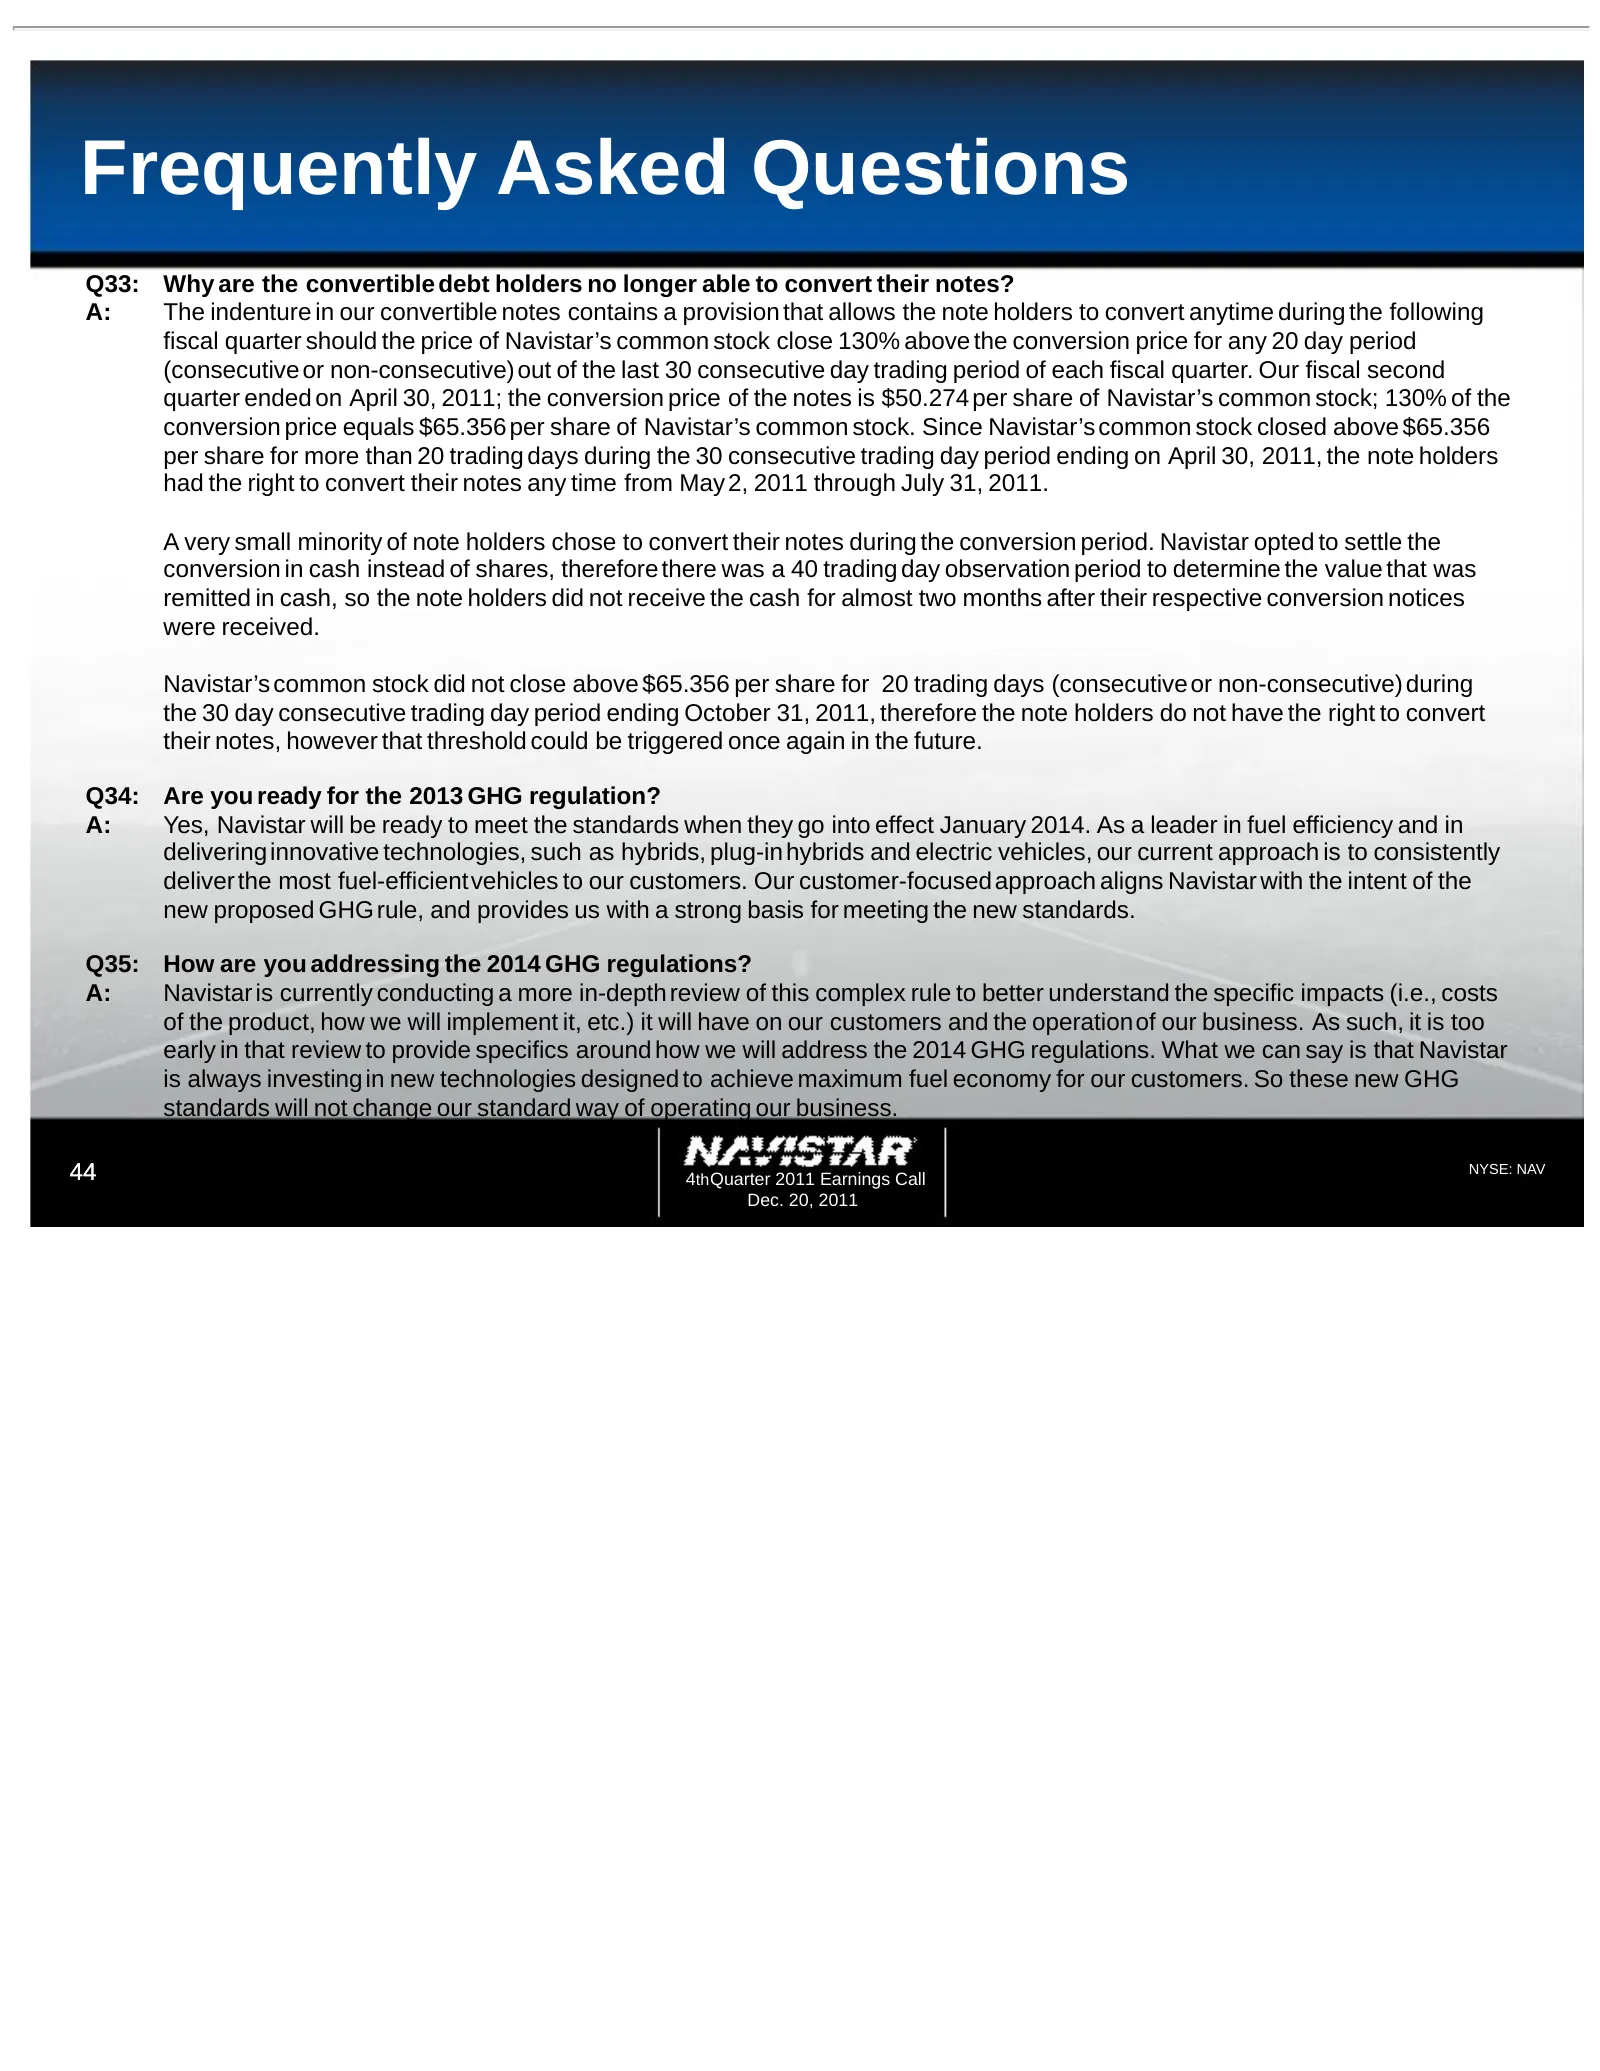
Slide 44: Frequently Asked Questions
Frequently Asked Questions Q33: Why are the convertible debt holders no longer able to convert their notes? A: The indenture in our convertible notes contains a provision that allows the note holders to convert anytime during the following fiscal quarter should the price of Navistar’s common stock c
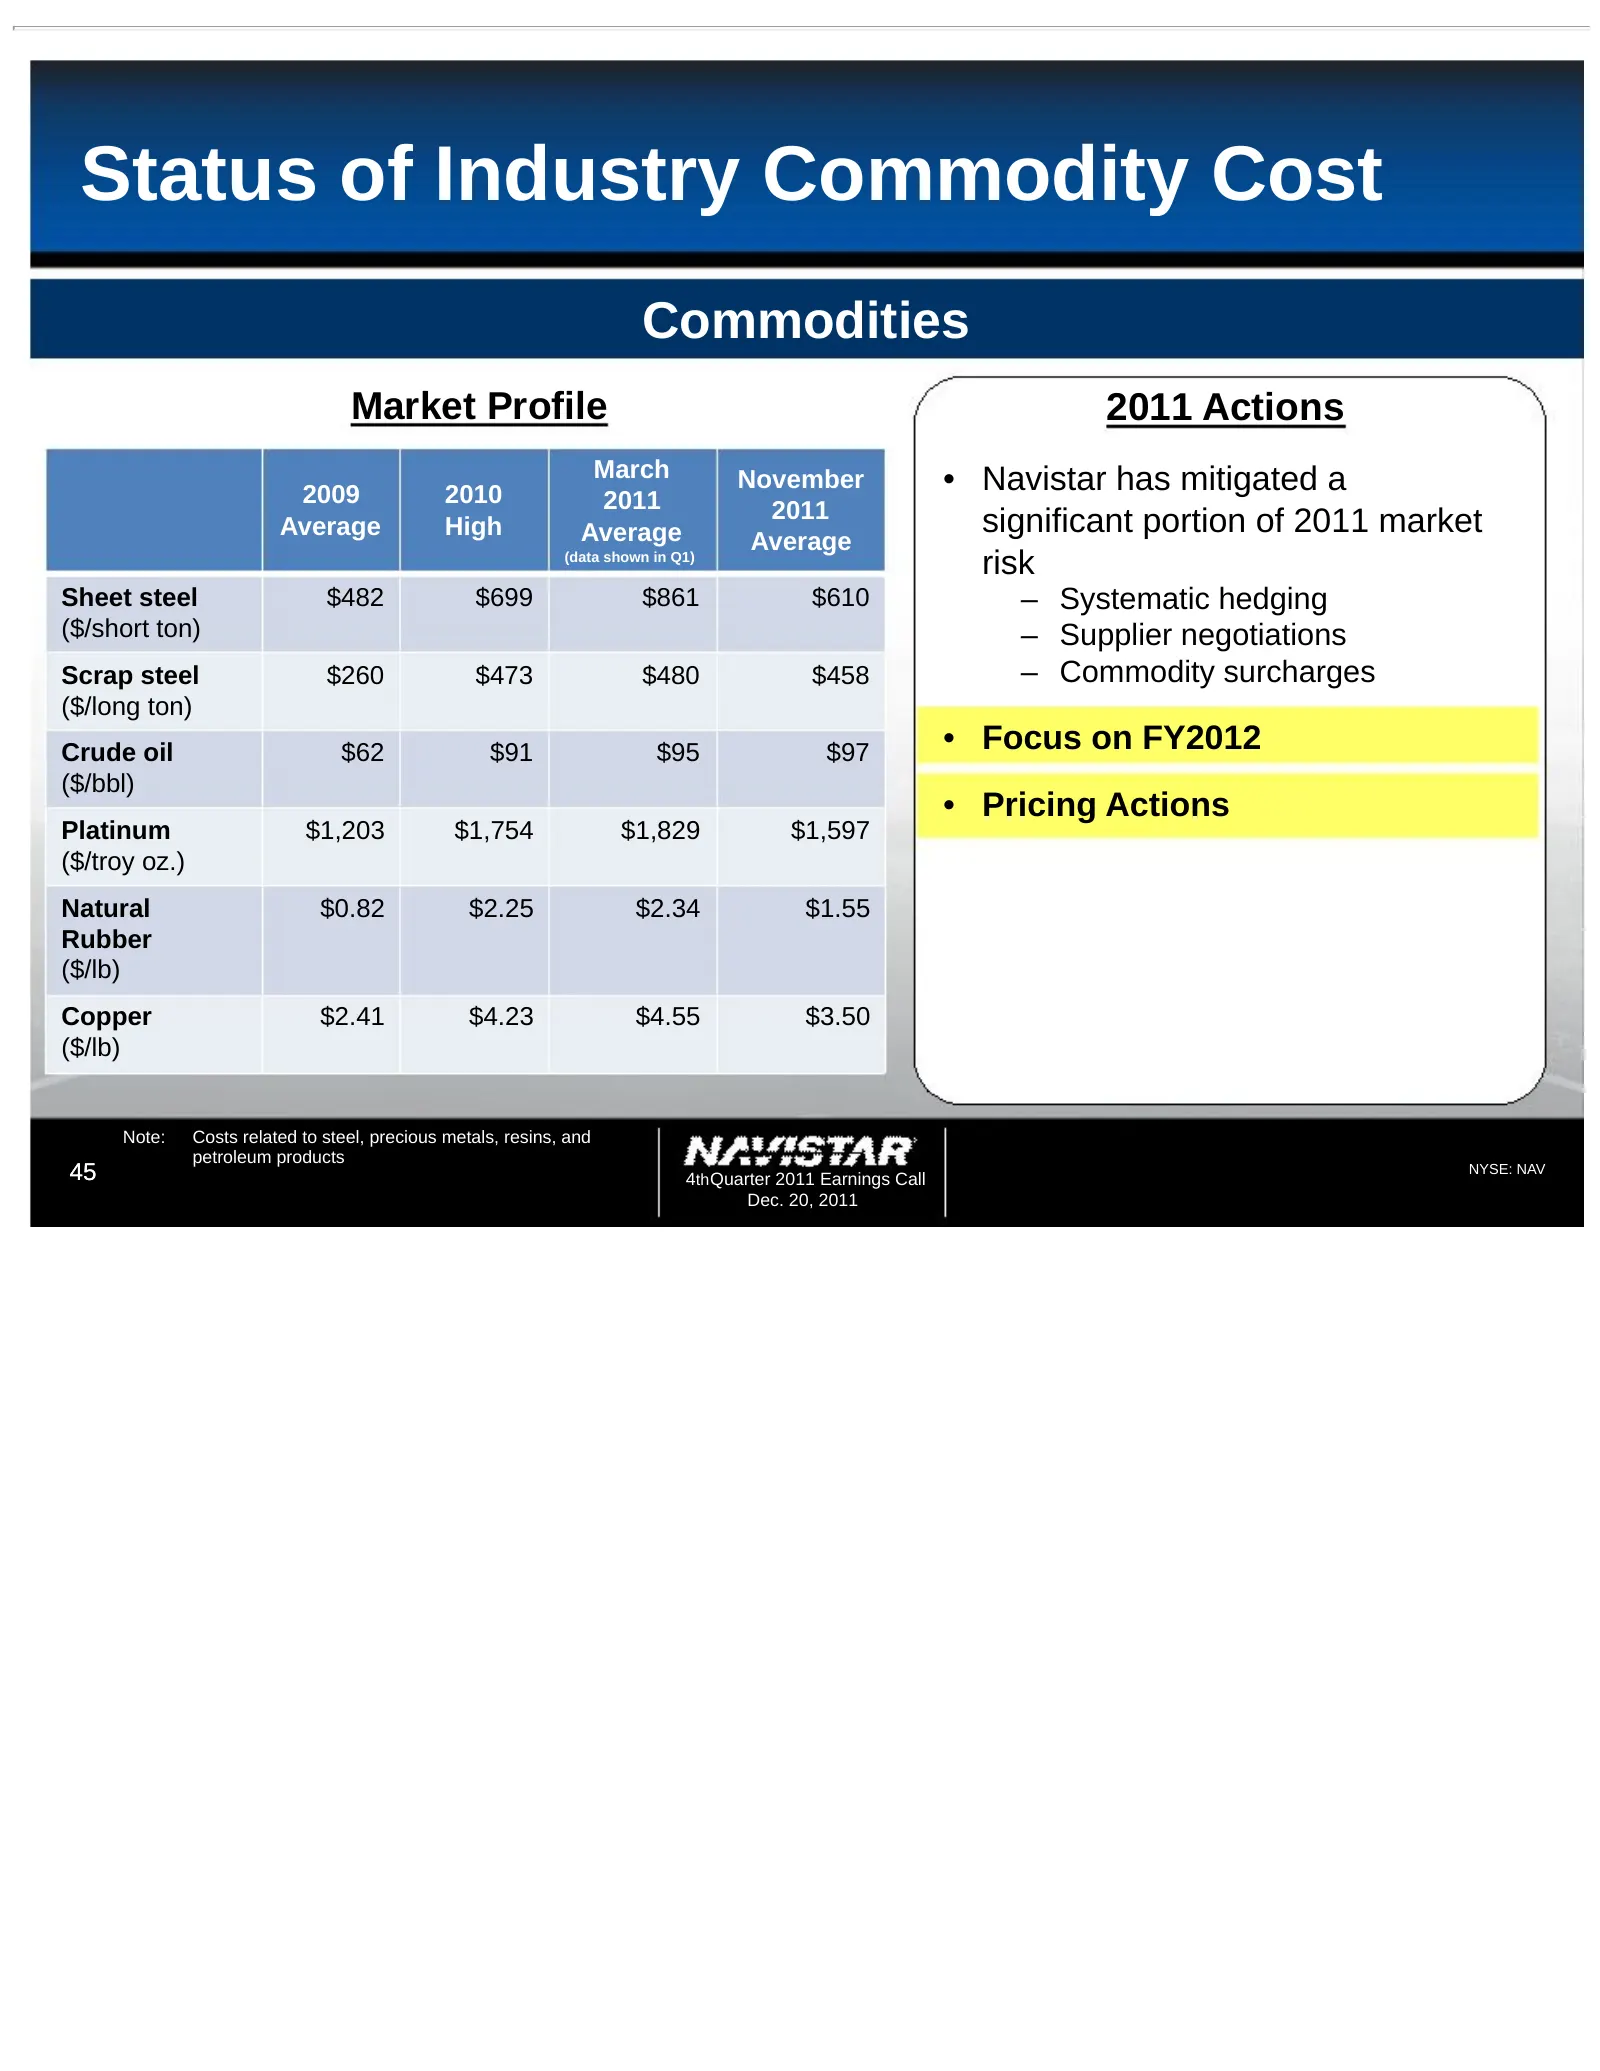
Slide 45: Status of Industry Commodity Cost
Status of Industry Commodity Cost Commodities Market Profile 2011 Actions March November • Navistar has mitigated a 2009 2010 2011 2011 Average High Average significant portion of 2011 market Average (data shown in Q1) risk Sheet steel $482 $699 $861 $610 – Systematic hedging ($/short ton) – Supplie
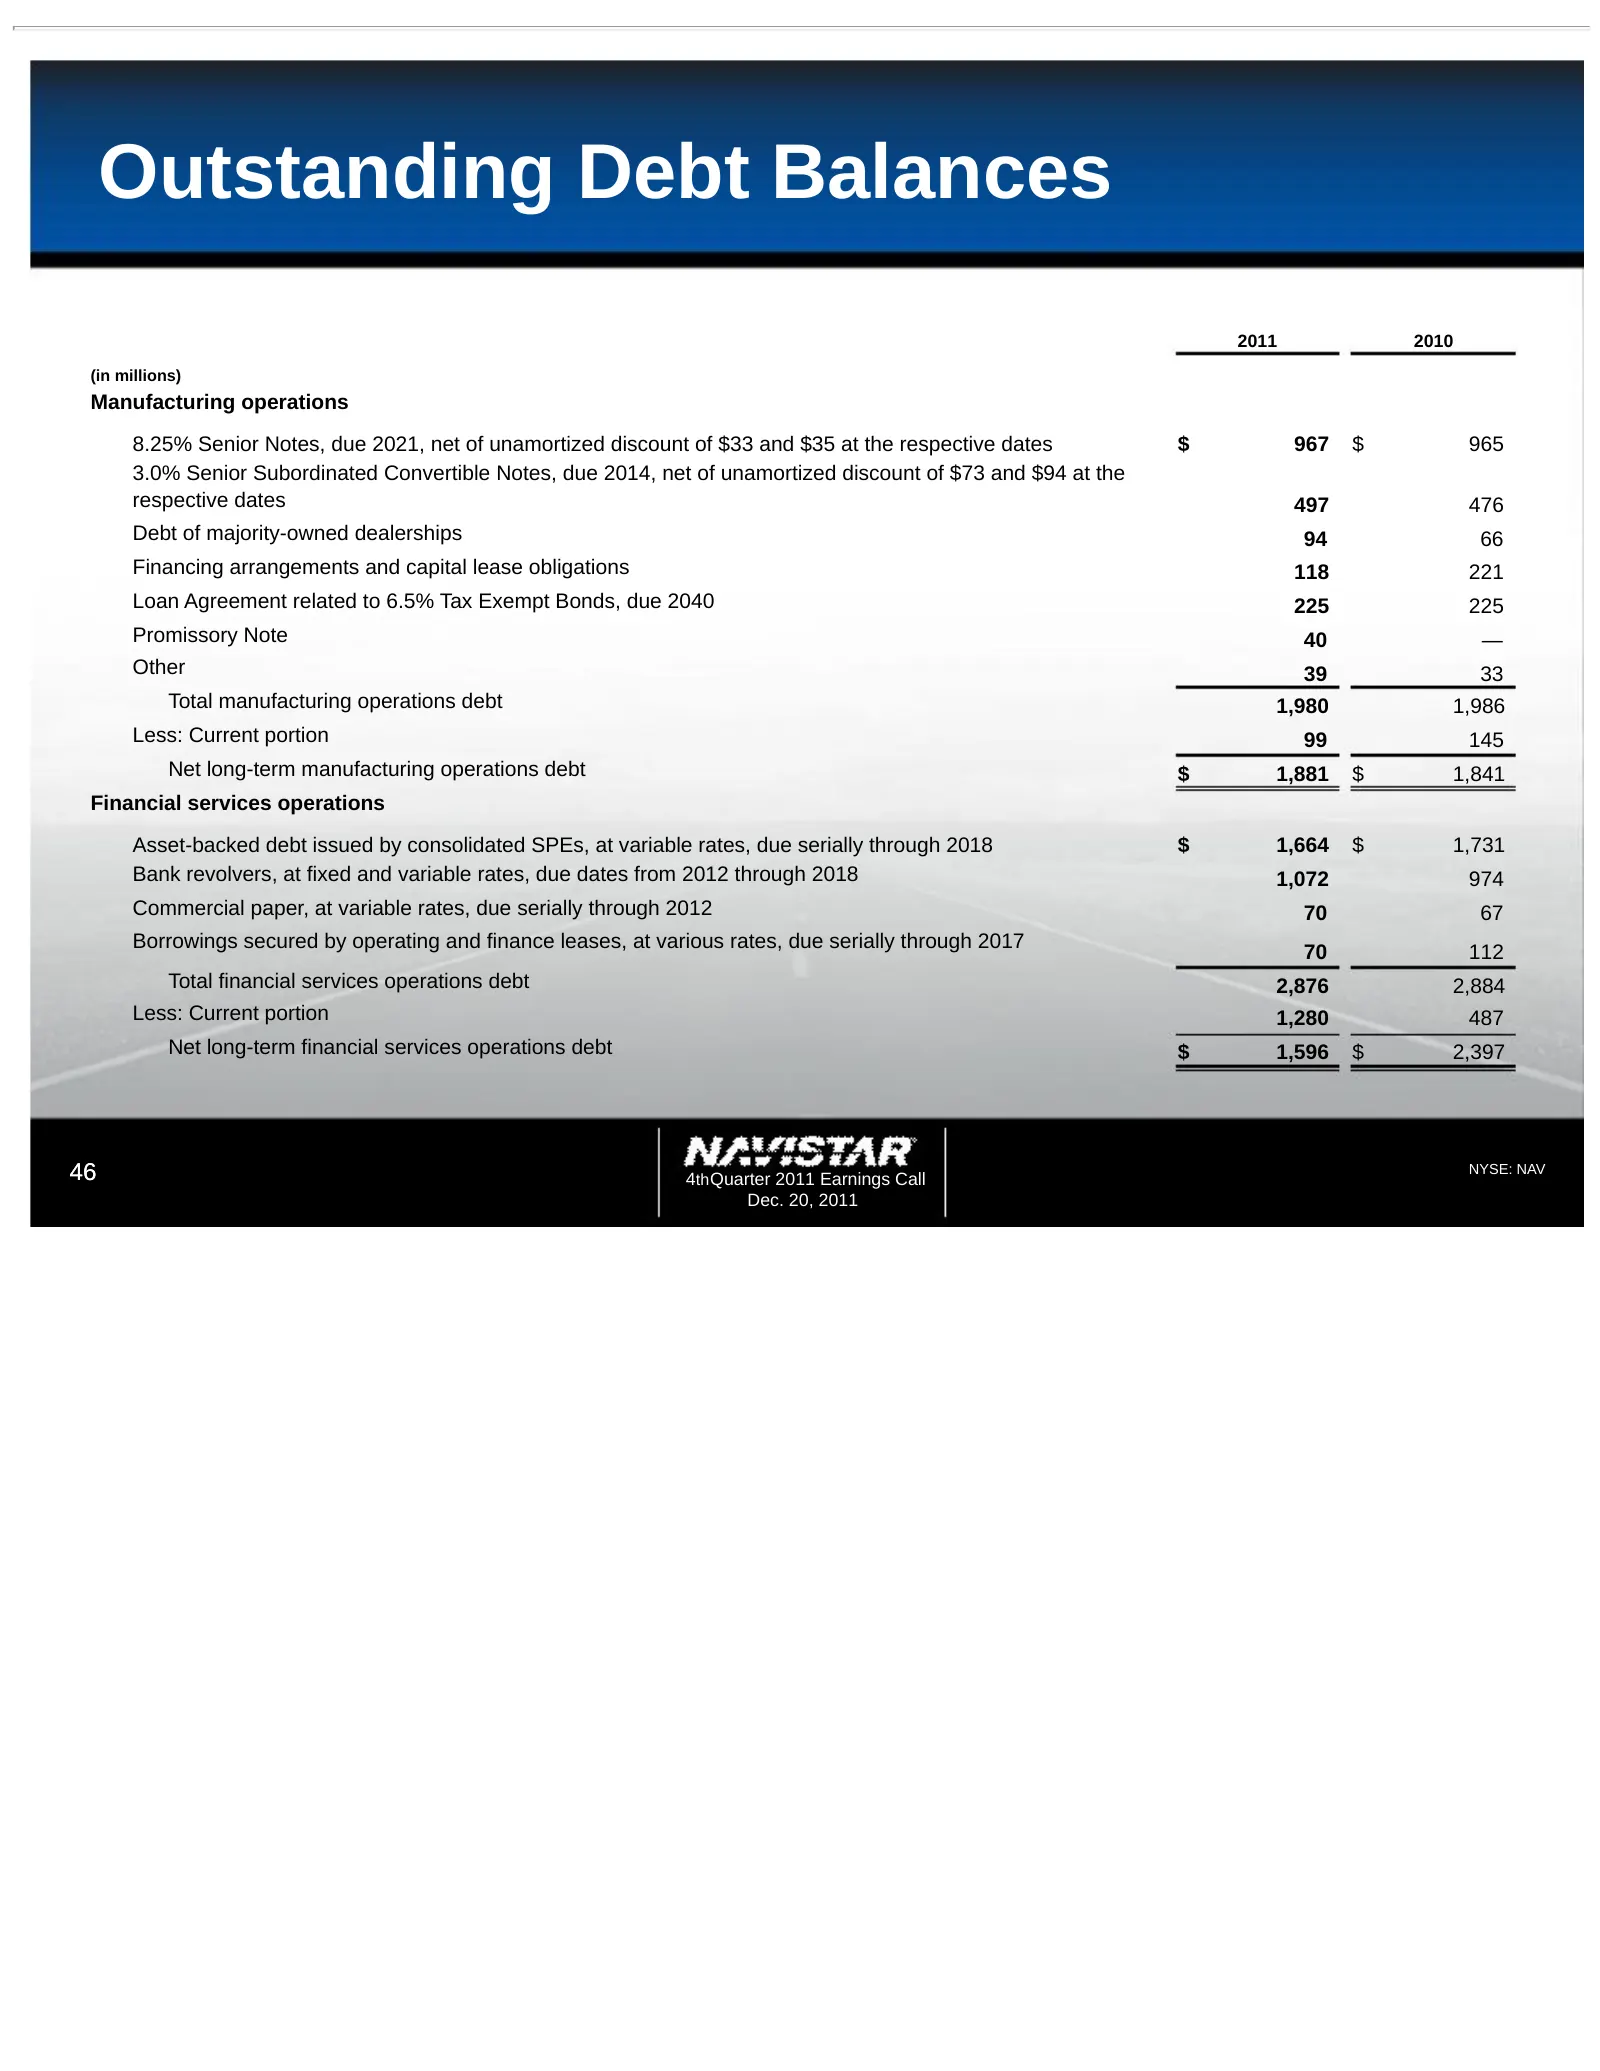
Slide 46: Outstanding Debt Balances
Outstanding Debt Balances 2011 2010 (in millions) Manufacturing operations 8.25% Senior Notes, due 2021, net of unamortized discount of $33 and $35 at the respective dates $ 967 $ 965 3.0% Senior Subordinated Convertible Notes, due 2014, net of unamortized discount of $73 and $94 at the respective d
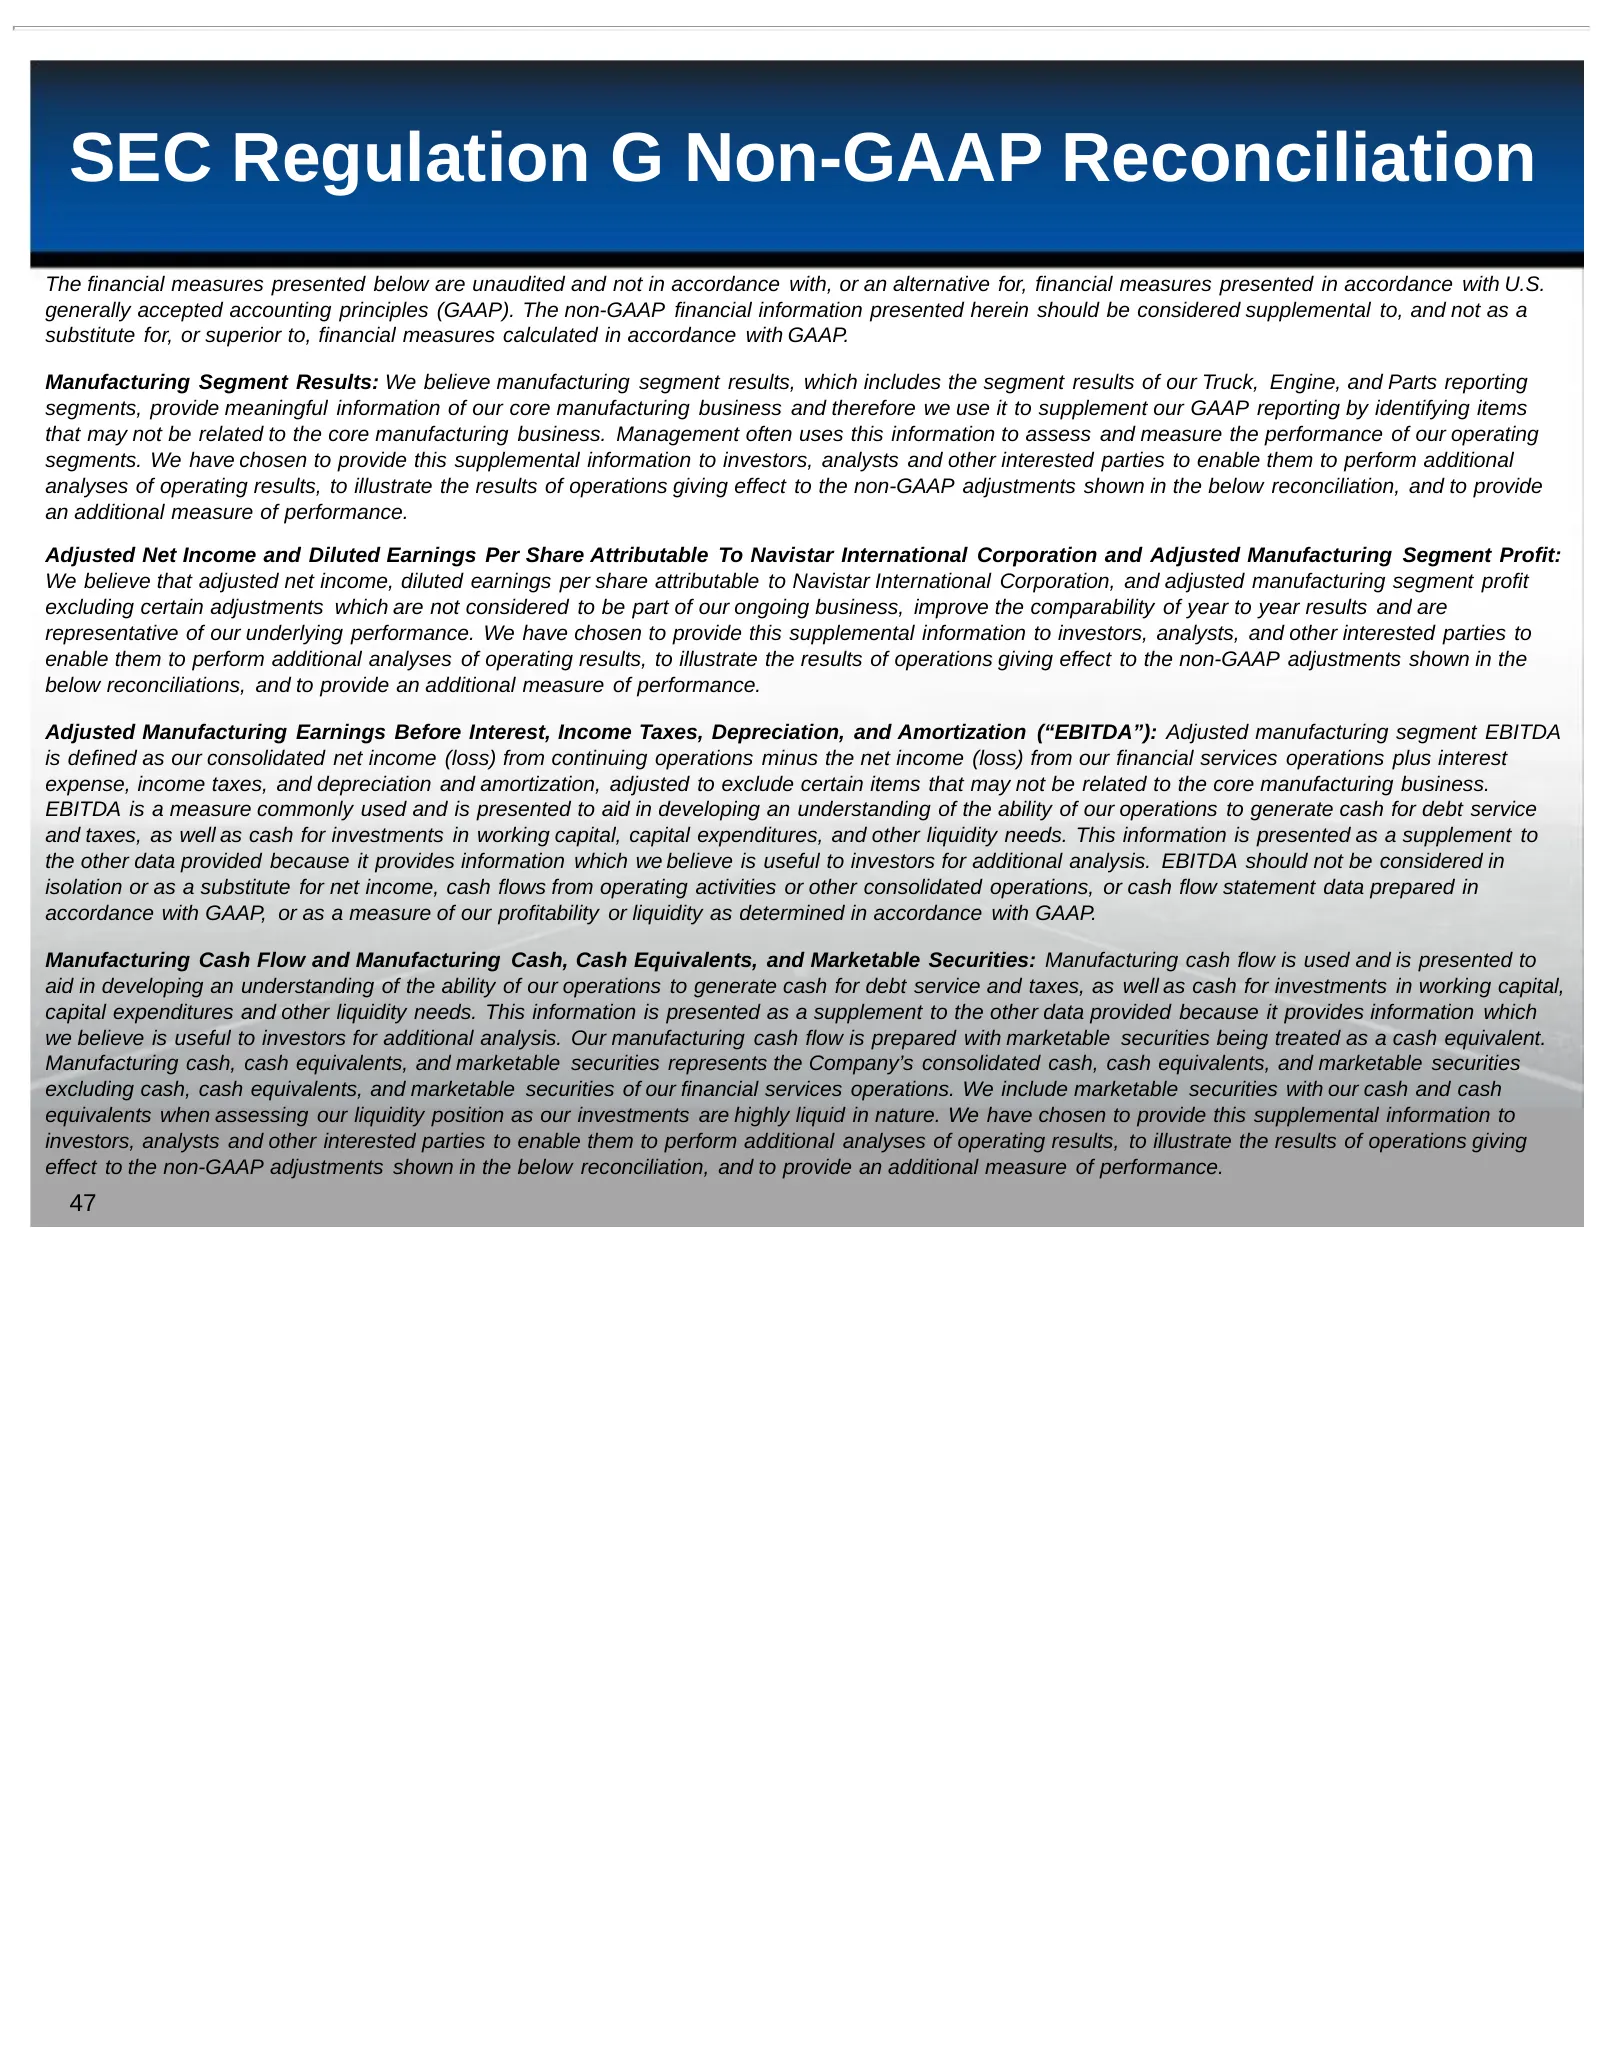
Slide 47: SEC Regulation G Non-GAAP Reconciliation
SEC Regulation G Non-GAAP Reconciliation The financial measures presented below are unaudited and not in accordance with, or an alternative for, financial measures presented in accordance with U.S. generally accepted accounting principles (GAAP). The non-GAAP financial information presented herein s
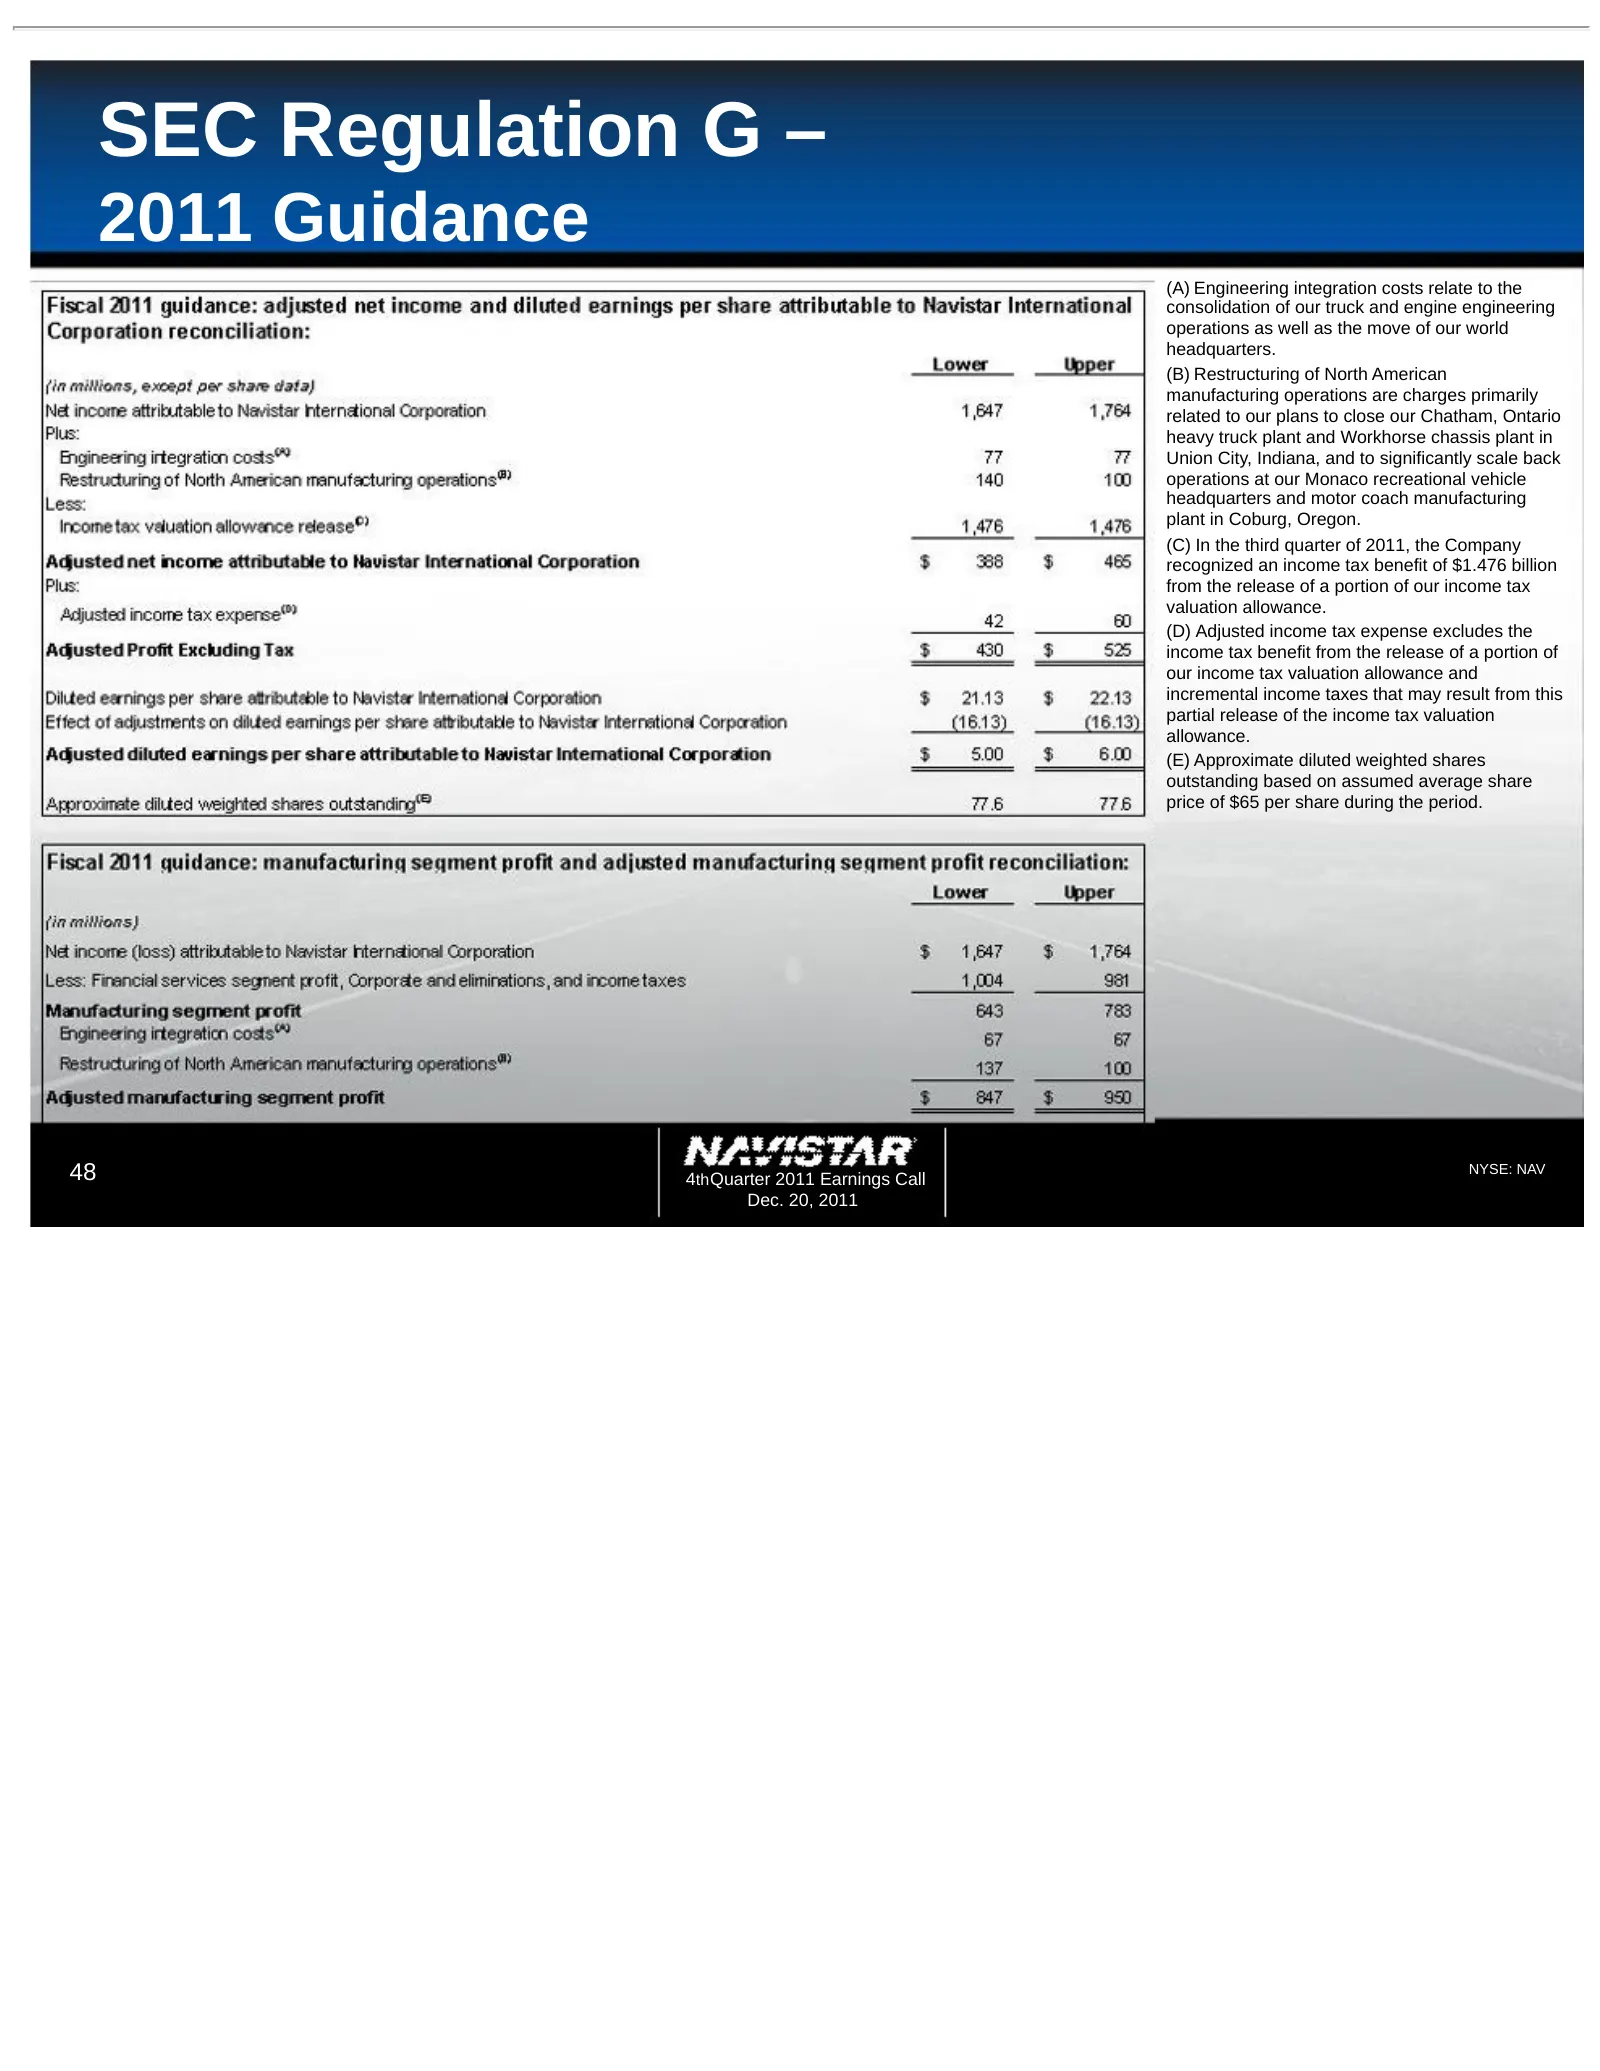
Slide 48: SEC Regulation G – 2011 Guidance
SEC Regulation G – 2011 Guidance (A) Engineering integration costs relate to the consolidation of our truck and engine engineering operations as well as the move of our world headquarters. (B) Restructuring of North American manufacturing operations are charges primarily related to our plans to clos
Slide 49: SEC Regulation G
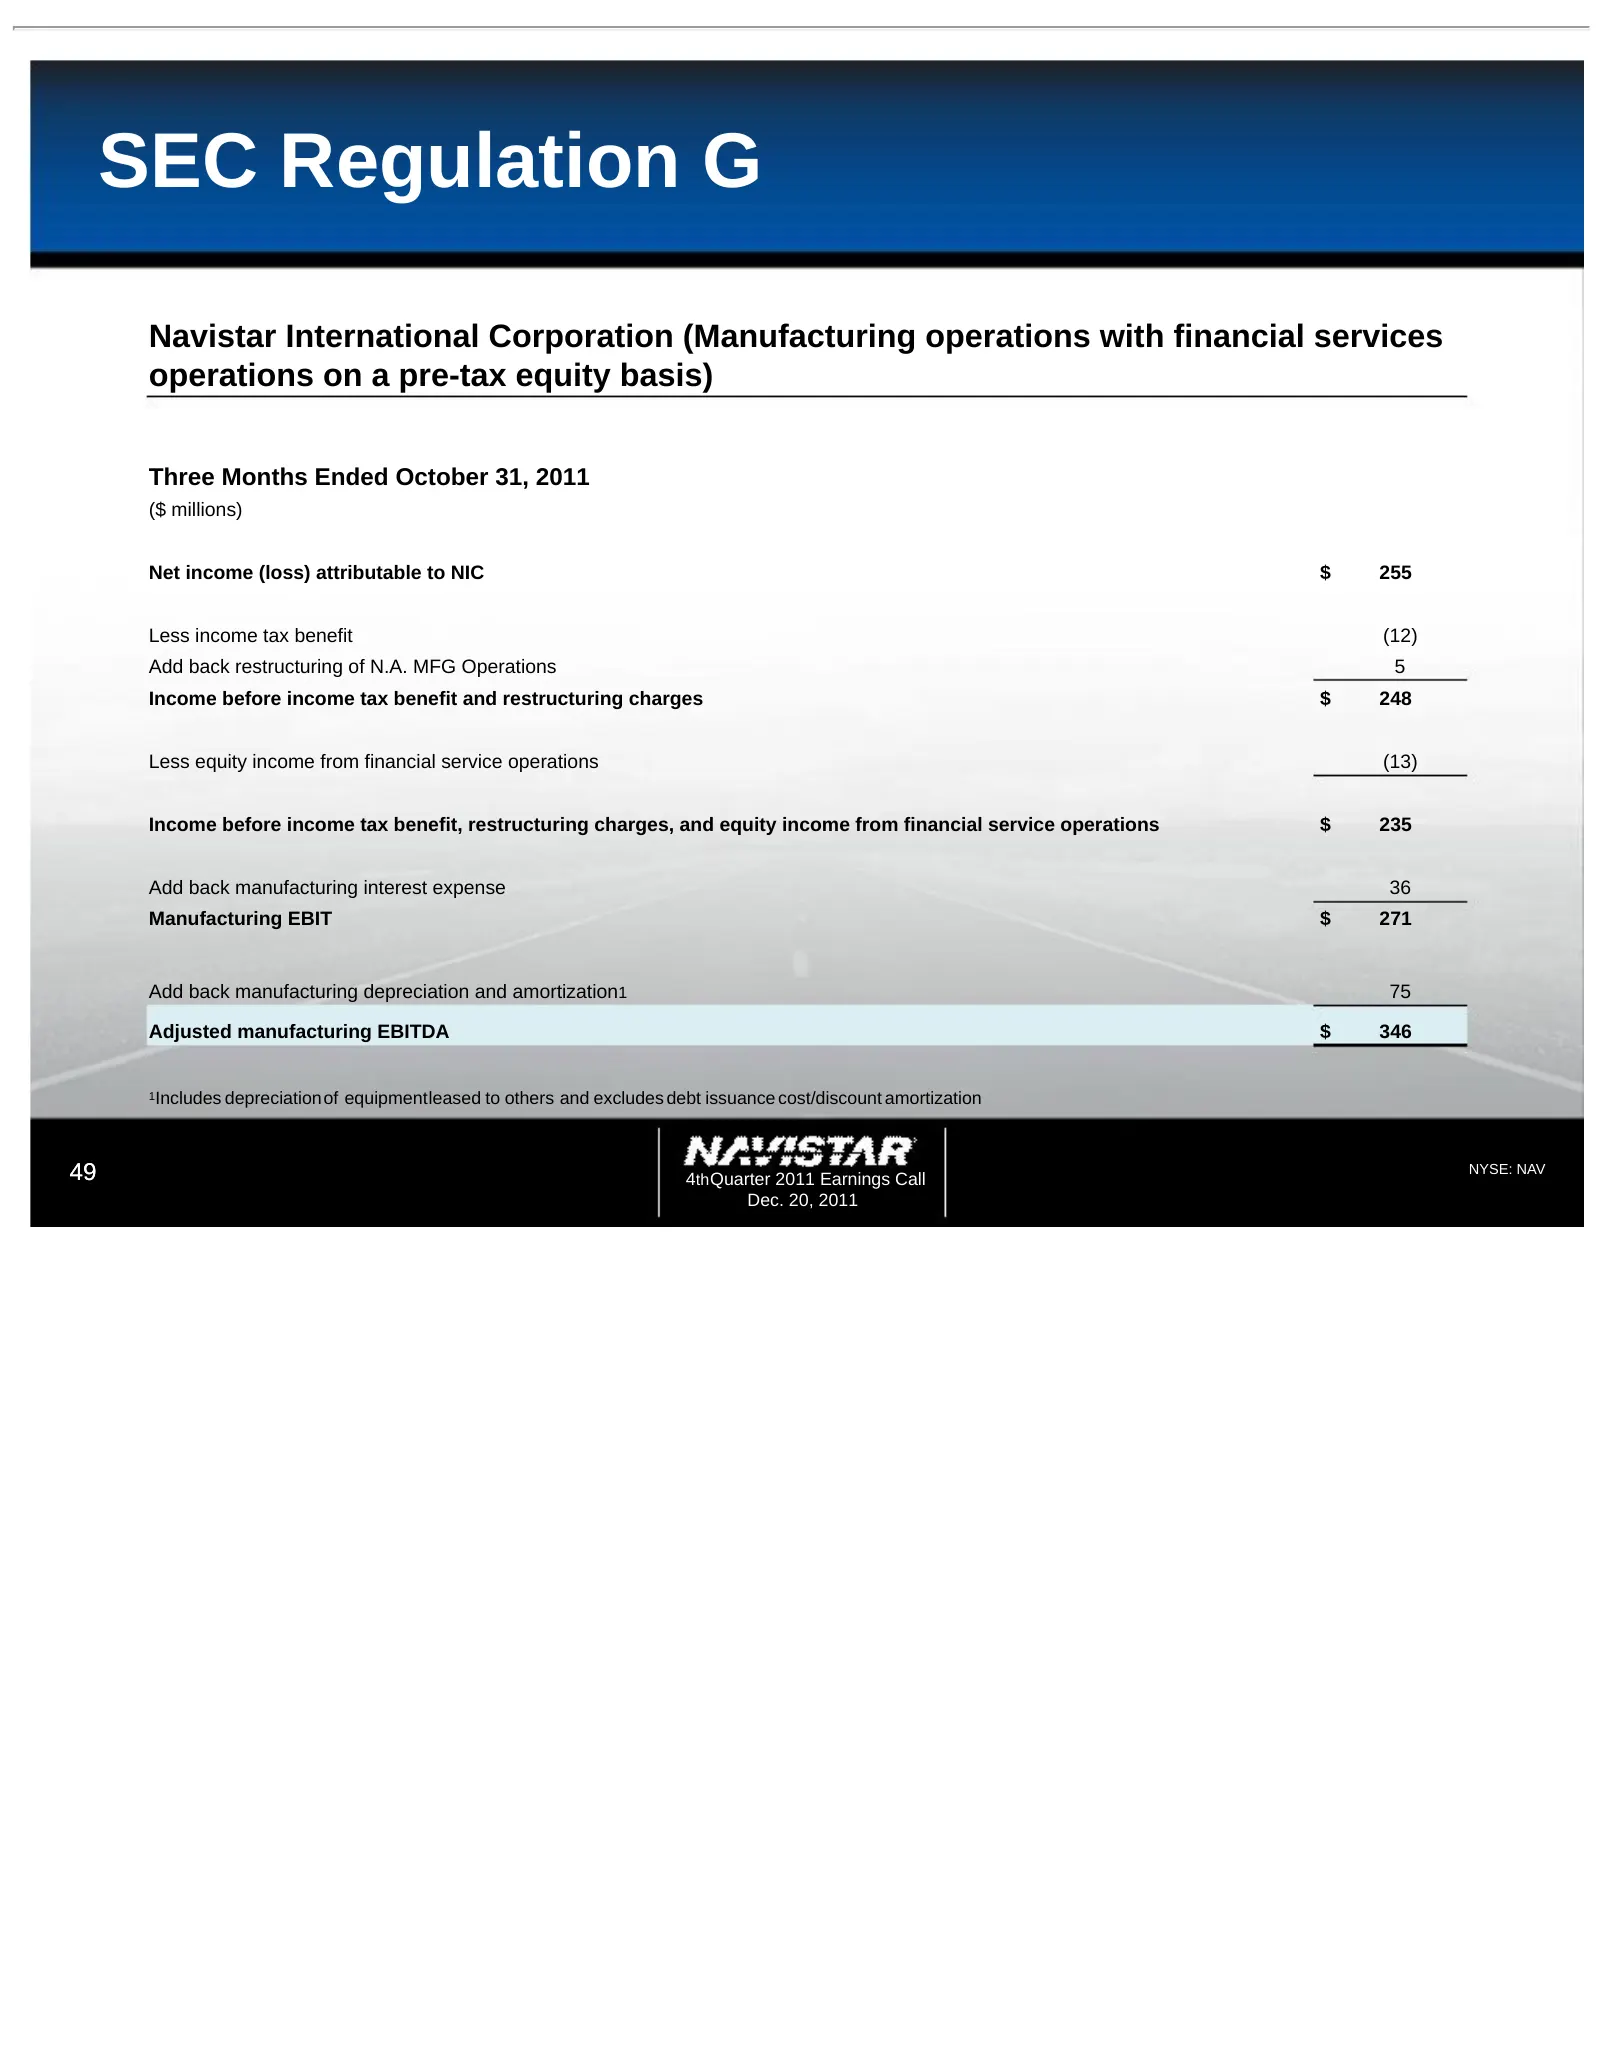
SEC Regulation G Navistar International Corporation (Manufacturing operations with financial services operations on a pre-tax equity basis) Three Months Ended October 31, 2011 ($ millions) Net income (loss) attributable to NIC $ 255 Less income tax benefit (12) Add back restructuring of N.A. MFG Ope
Slide 50: SEC Regulation G – Manufacturing Cash Fiscal Year Comparison
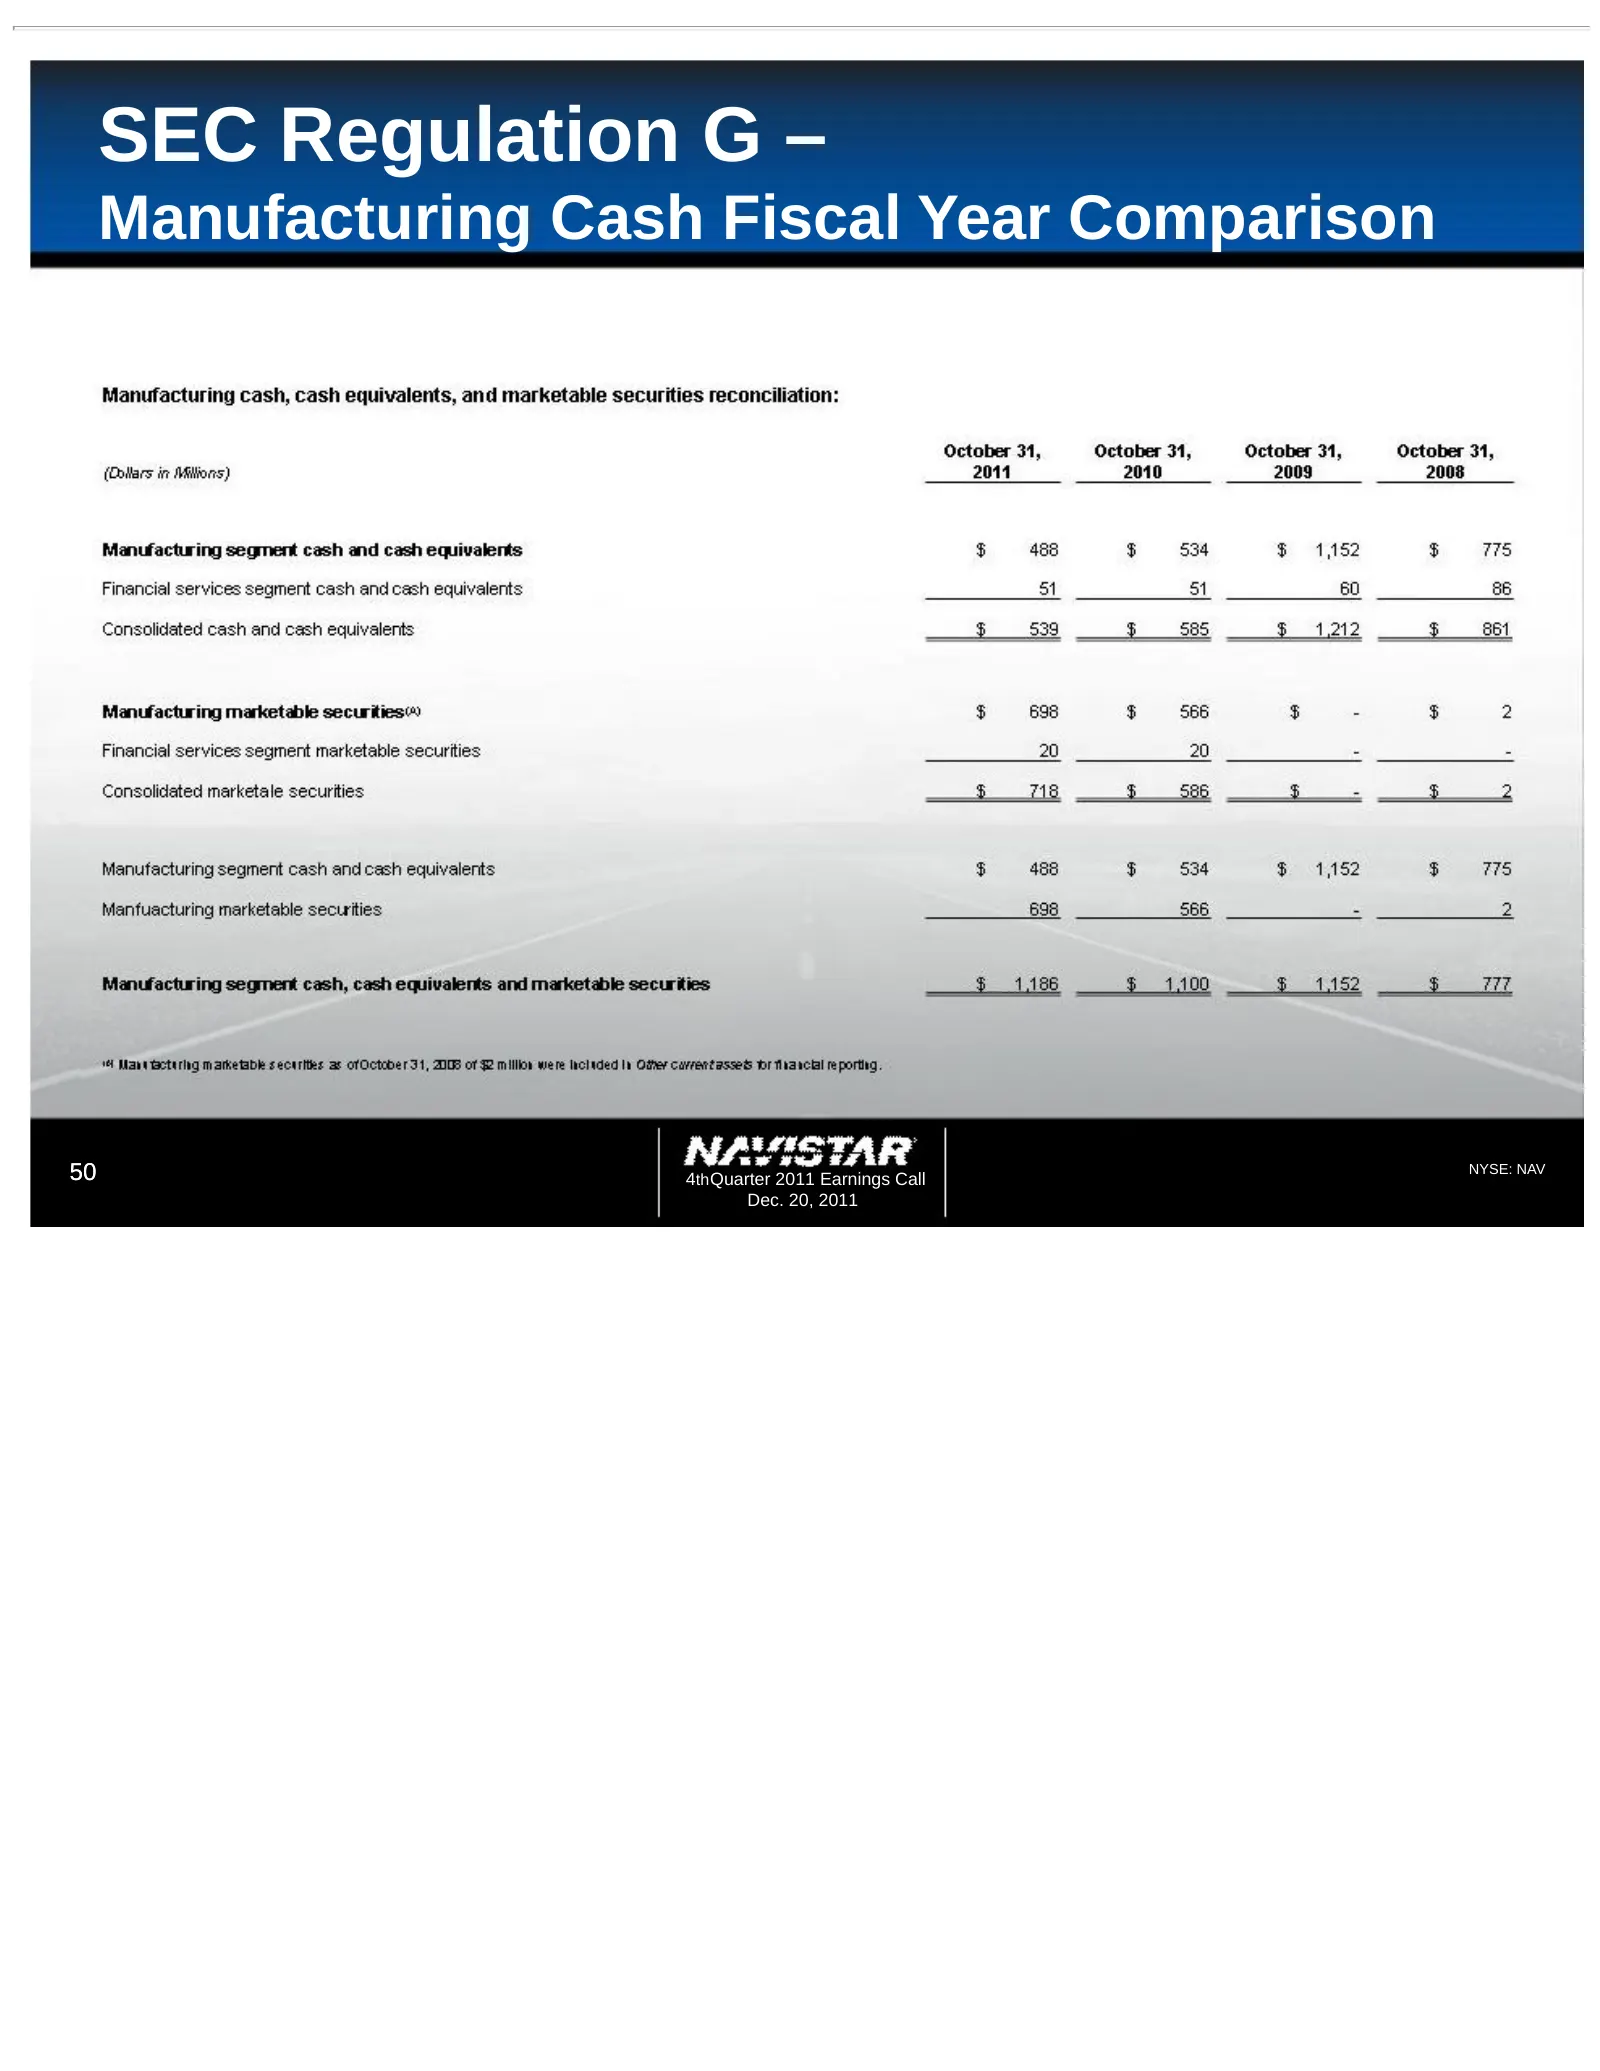
SEC Regulation G – Manufacturing Cash Fiscal Year Comparison 50 4th Quarter 2011 Earnings Call NYSE: NAV Dec. 20, 2011
Slide 51: SEC Regulation G – Manufacturing Cash 4th Quarter
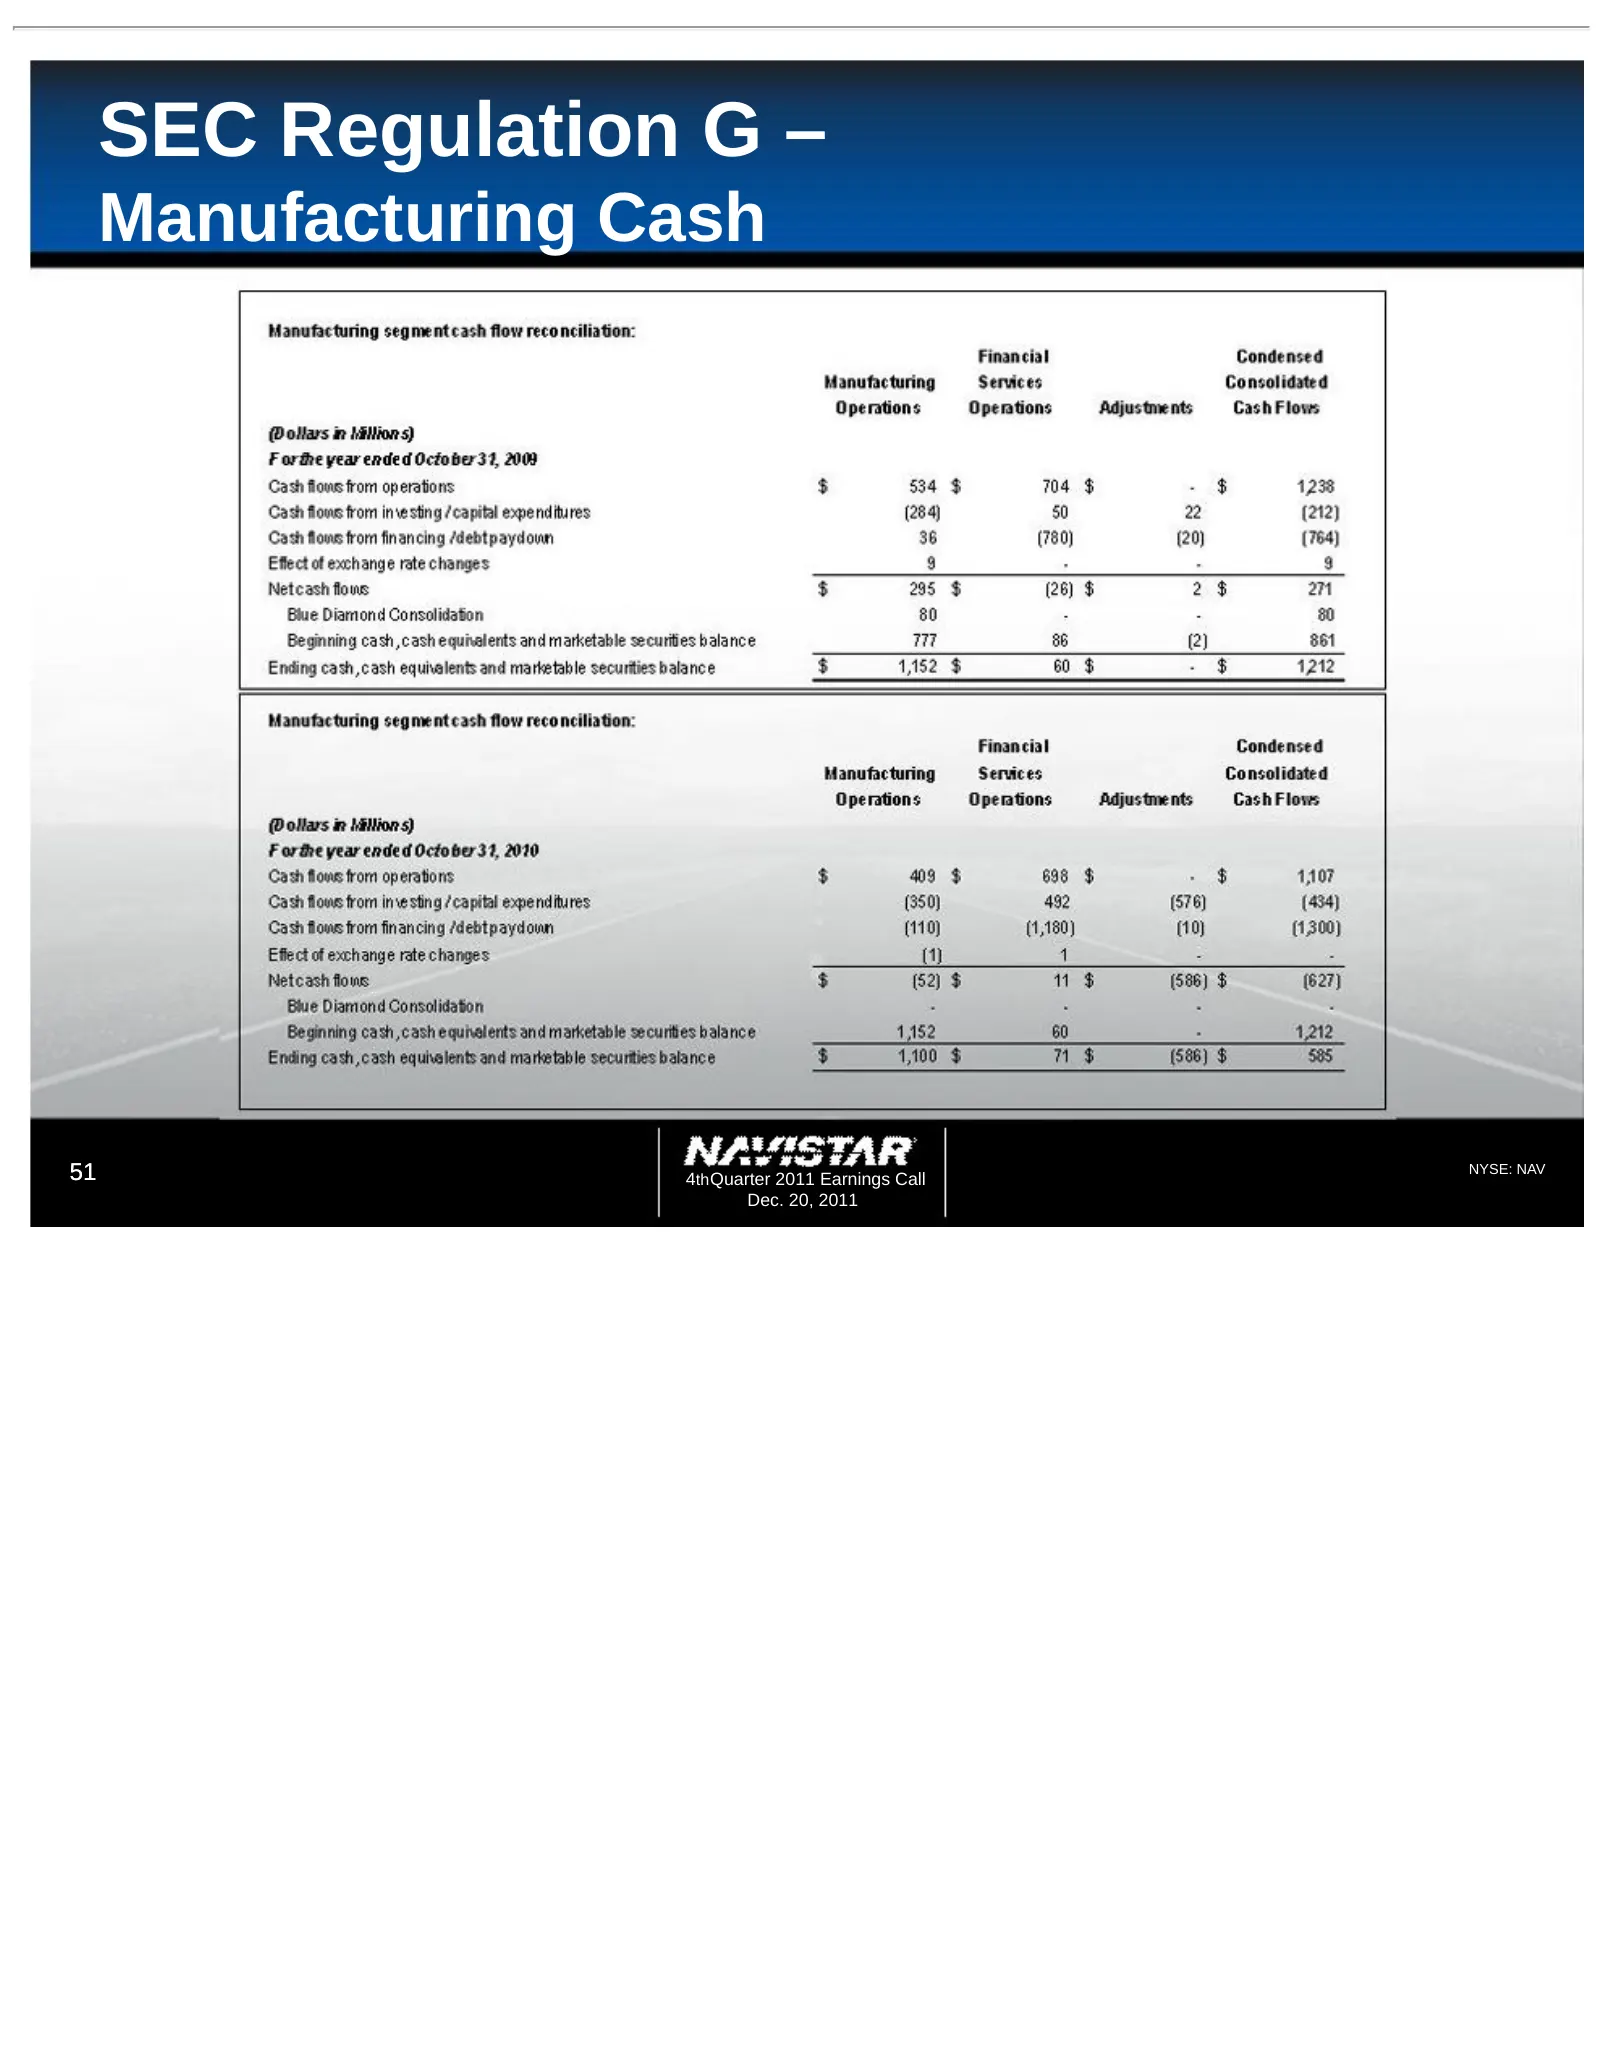
SEC Regulation G – Manufacturing Cash 51 4th Quarter 2011 Earnings Call NYSE: NAV Dec. 20, 2011
Slide 52: SEC Regulation G – Manufacturing Cash
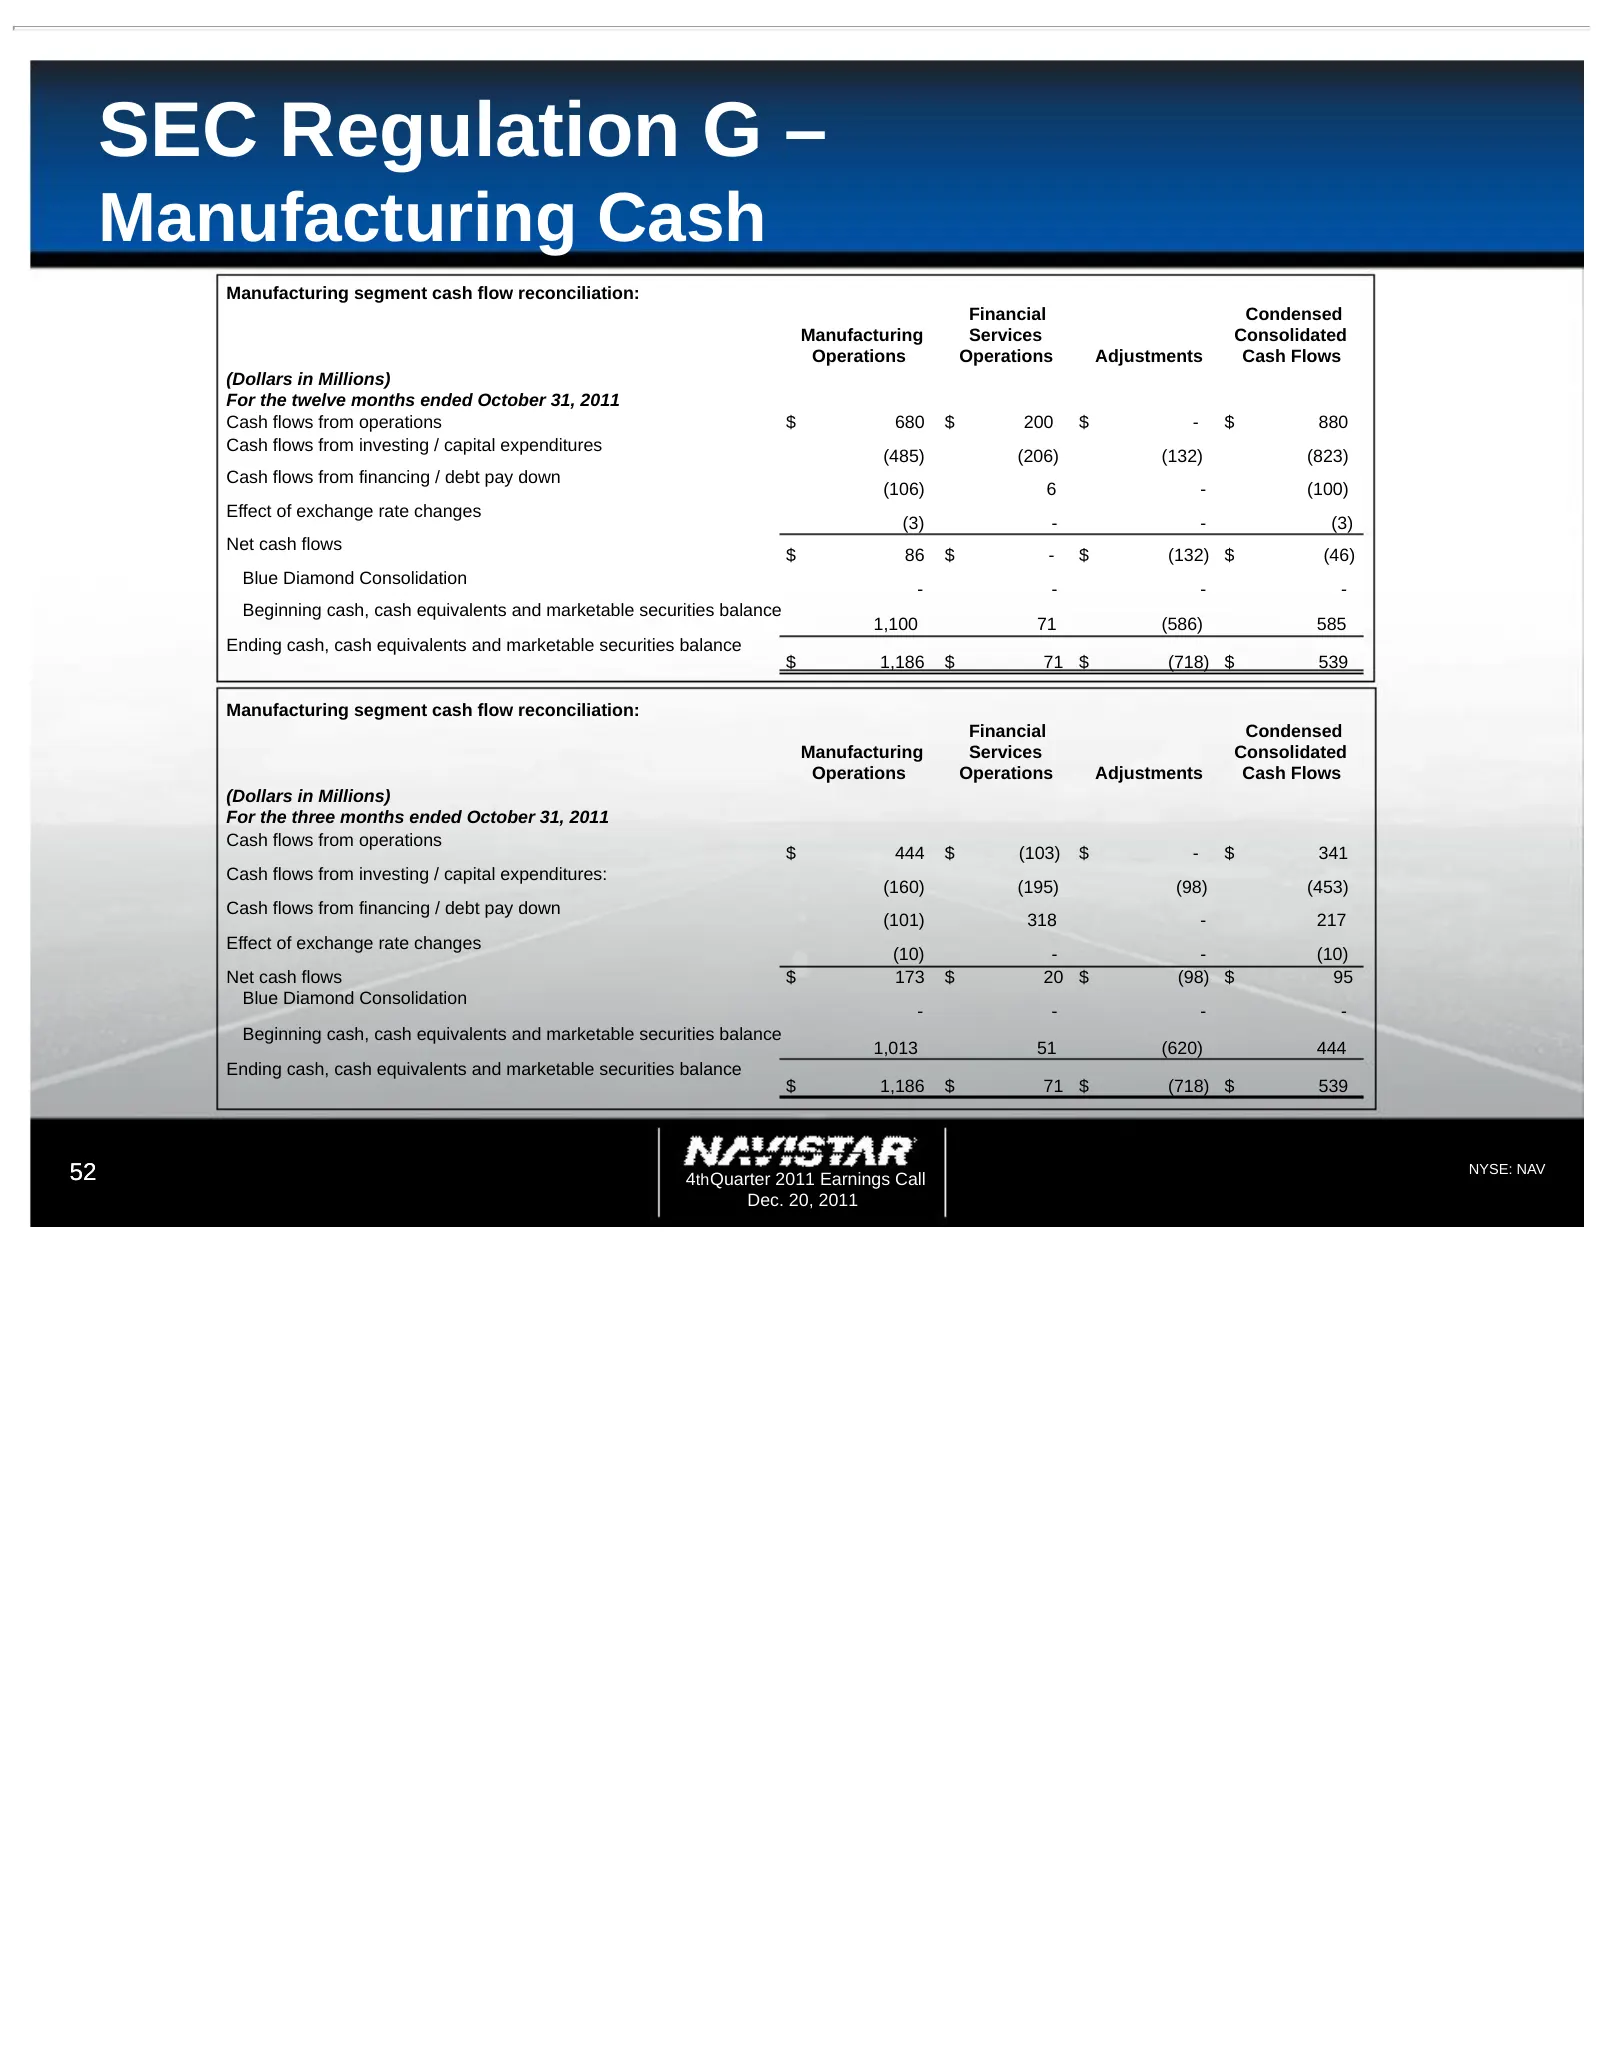
SEC Regulation G – Manufacturing Cash Manufacturing segment cash flow reconciliation: Financial Condensed Manufacturing Services Consolidated Operations Operations Adjustments Cash Flows (Dollars in Millions) For the twelve months ended October 31, 2011 Cash flows from operations $ 680 $ 200 $ - $ 8
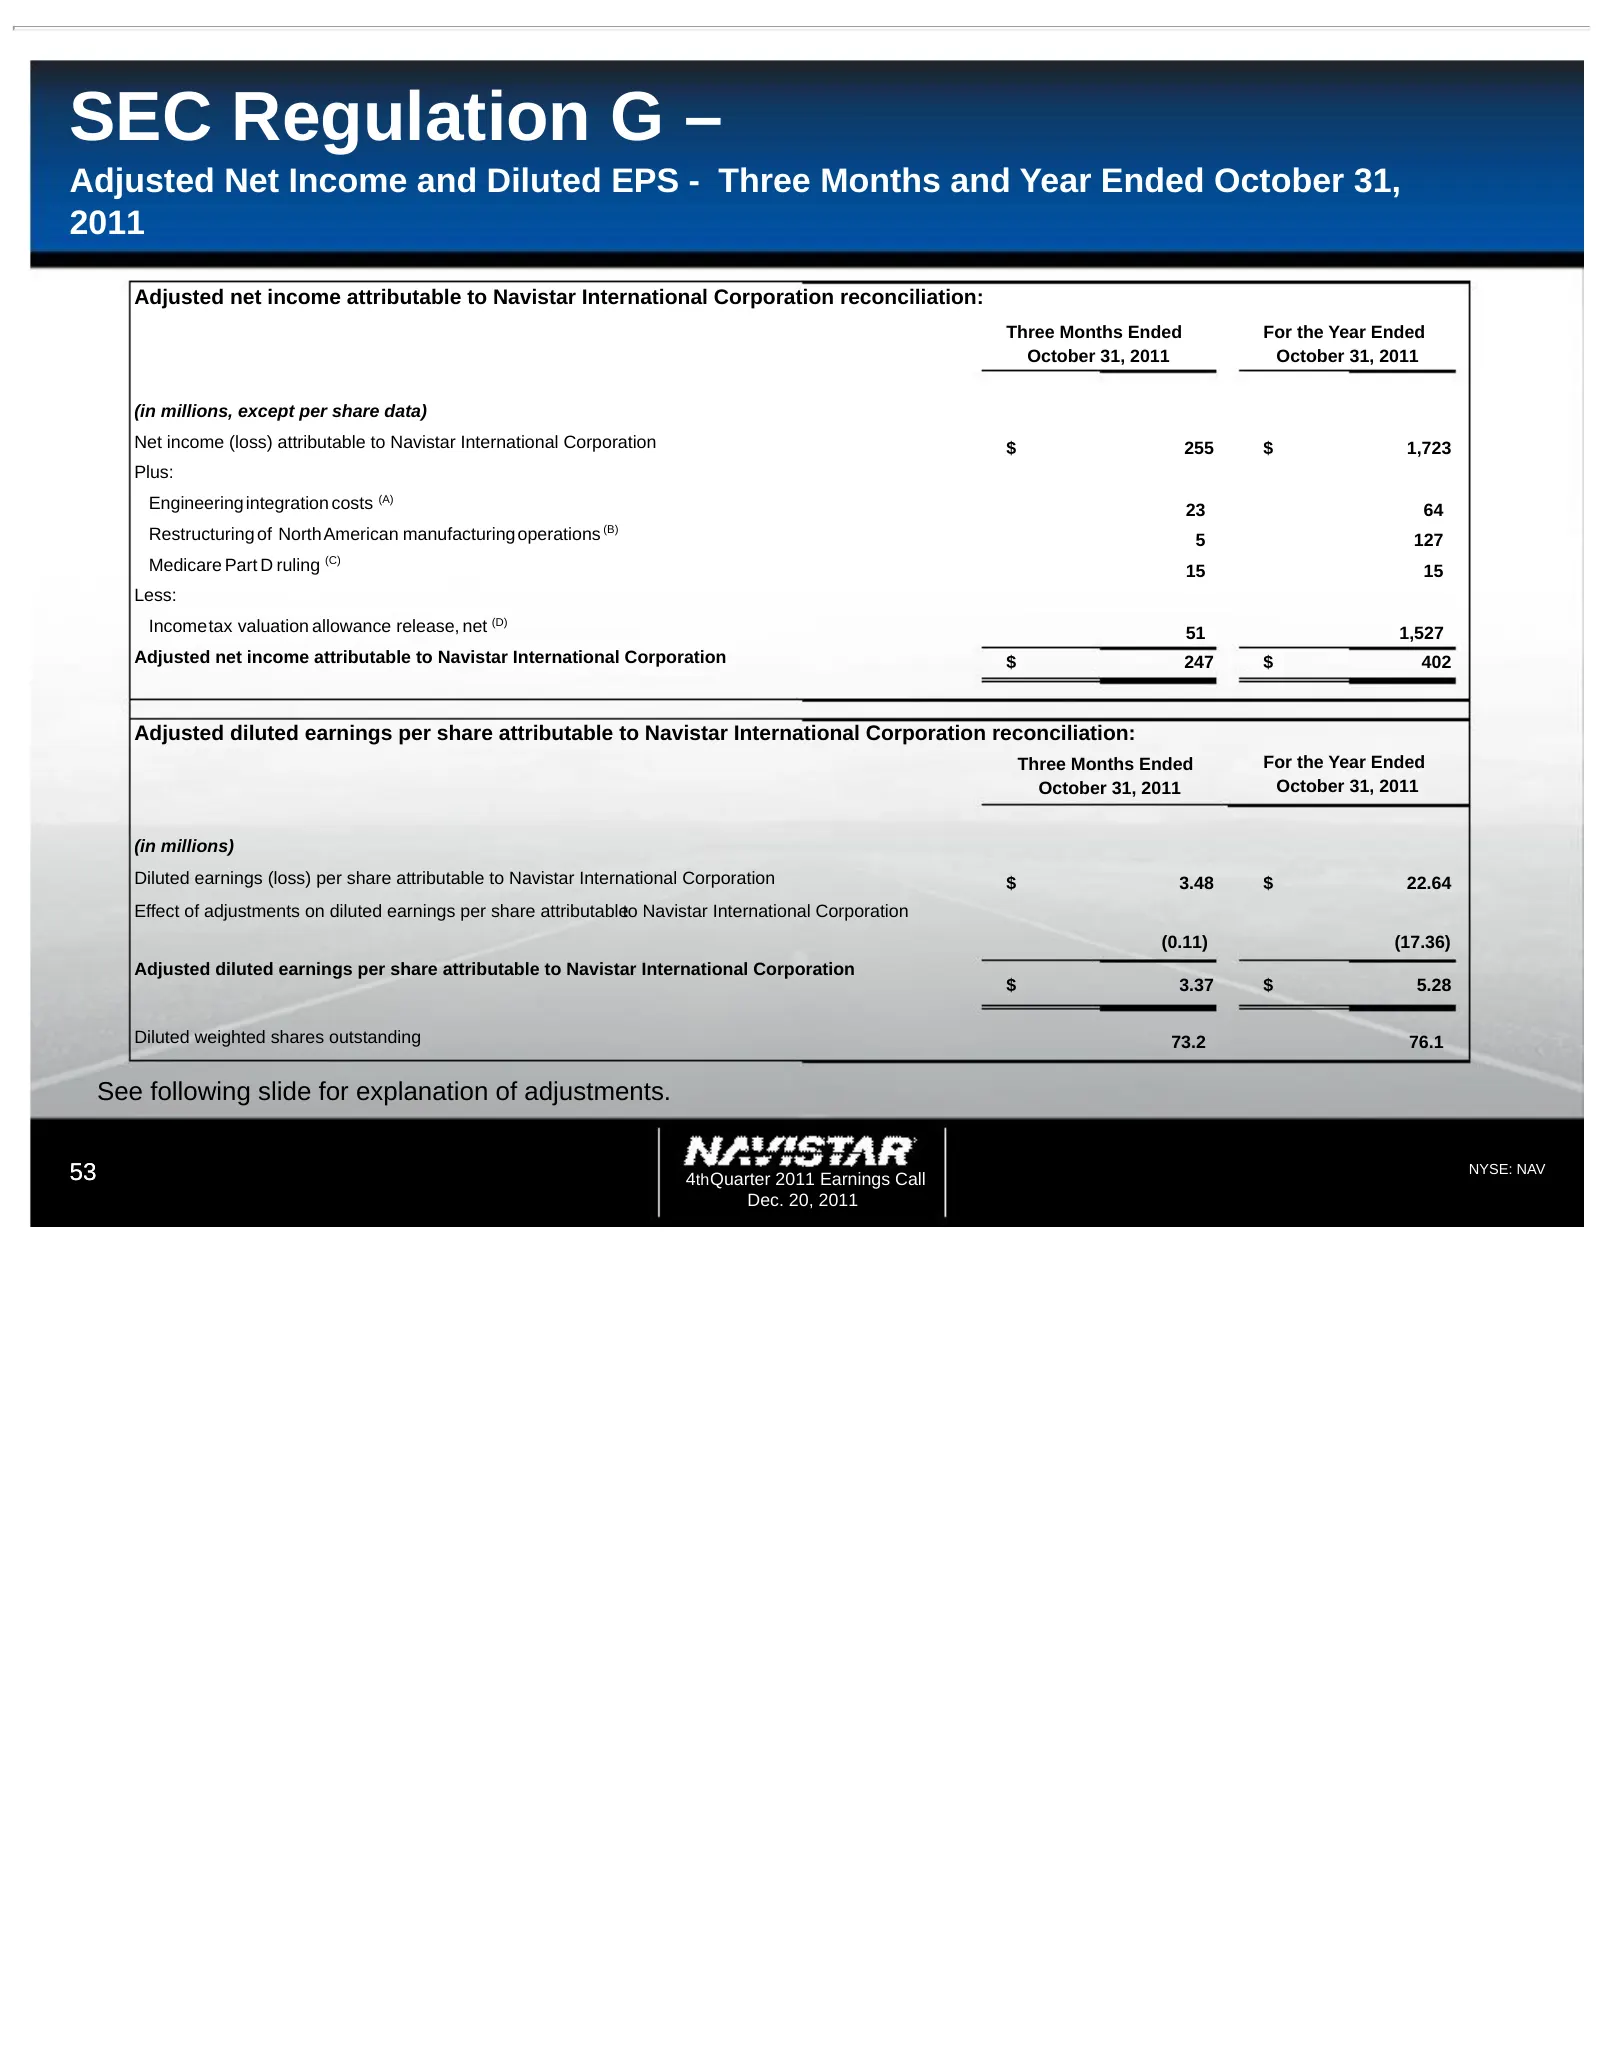
Slide 53: SEC Regulation G – Adjusted Net Income and Diluted EPS
SEC Regulation G – Adjusted Net Income and Diluted EPS - Three Months and Year Ended October 31, 2011 Adjusted net income attributable to Navistar International Corporation reconciliation: Three Months Ended For the Year Ended October 31, 2011 October 31, 2011 (in millions, except per share data) Ne
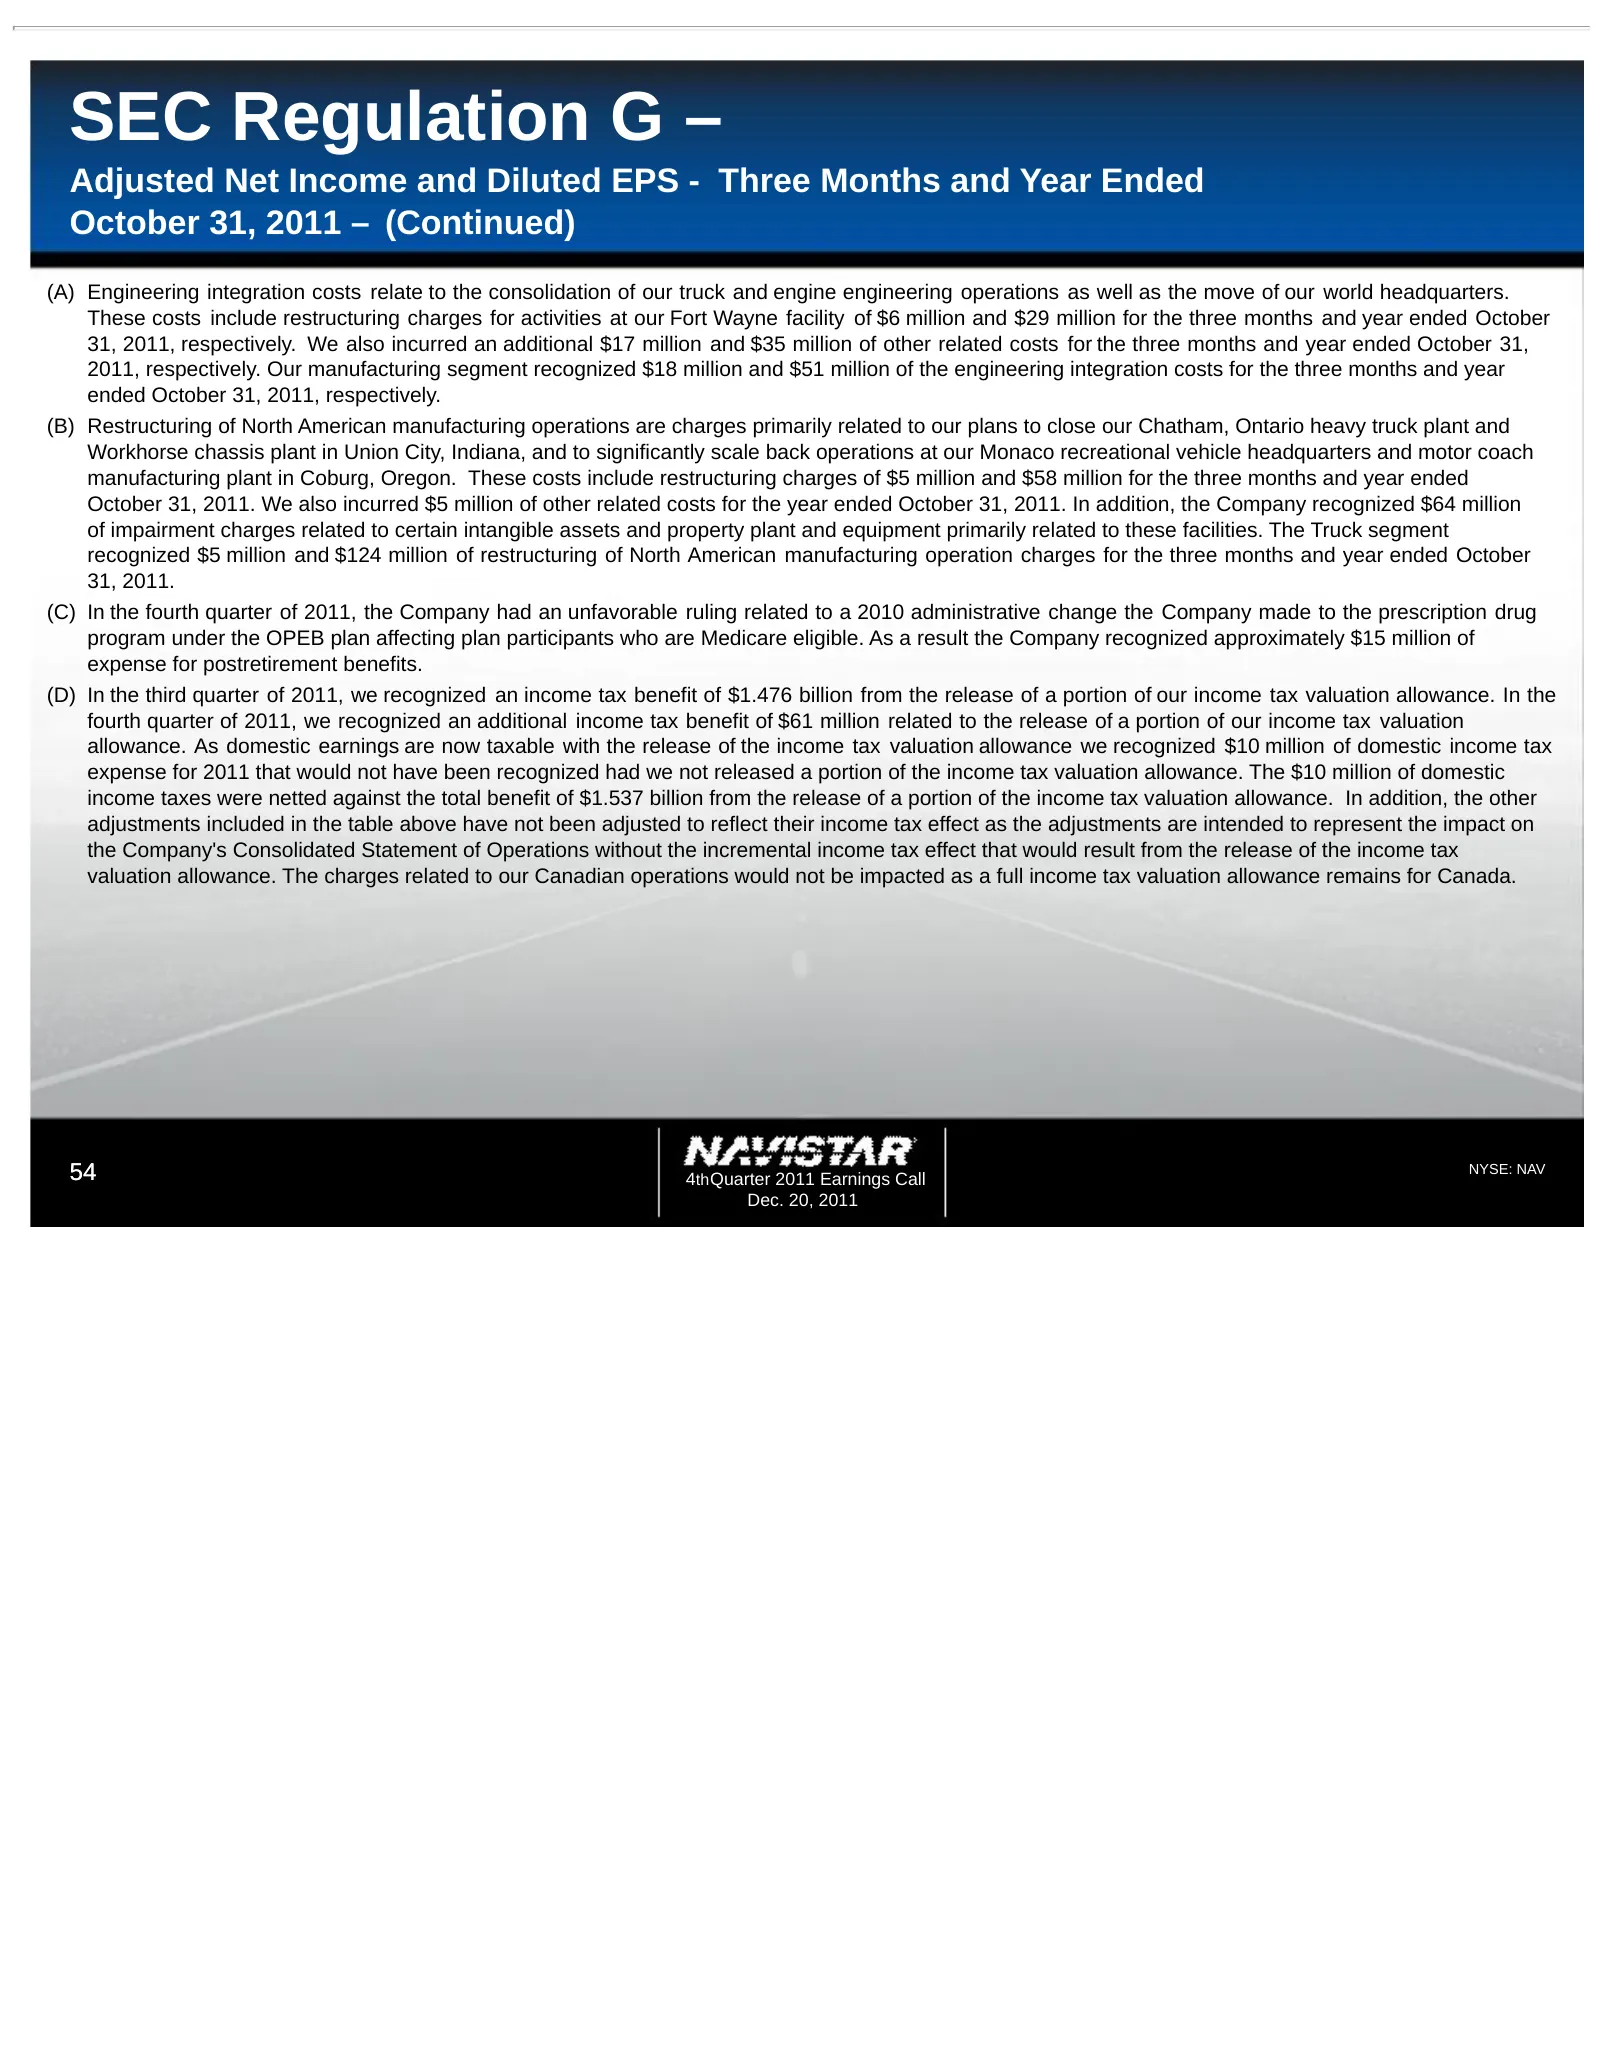
Slide 54: SEC Regulation G – Adjusted Net Income and Diluted EPS (Continued)
SEC Regulation G – Adjusted Net Income and Diluted EPS - Three Months and Year Ended October 31, 2011 – (Continued) (A) Engineering integration costs relate to the consolidation of our truck and engine engineering operations as well as the move of our world headquarters. These costs include restruct
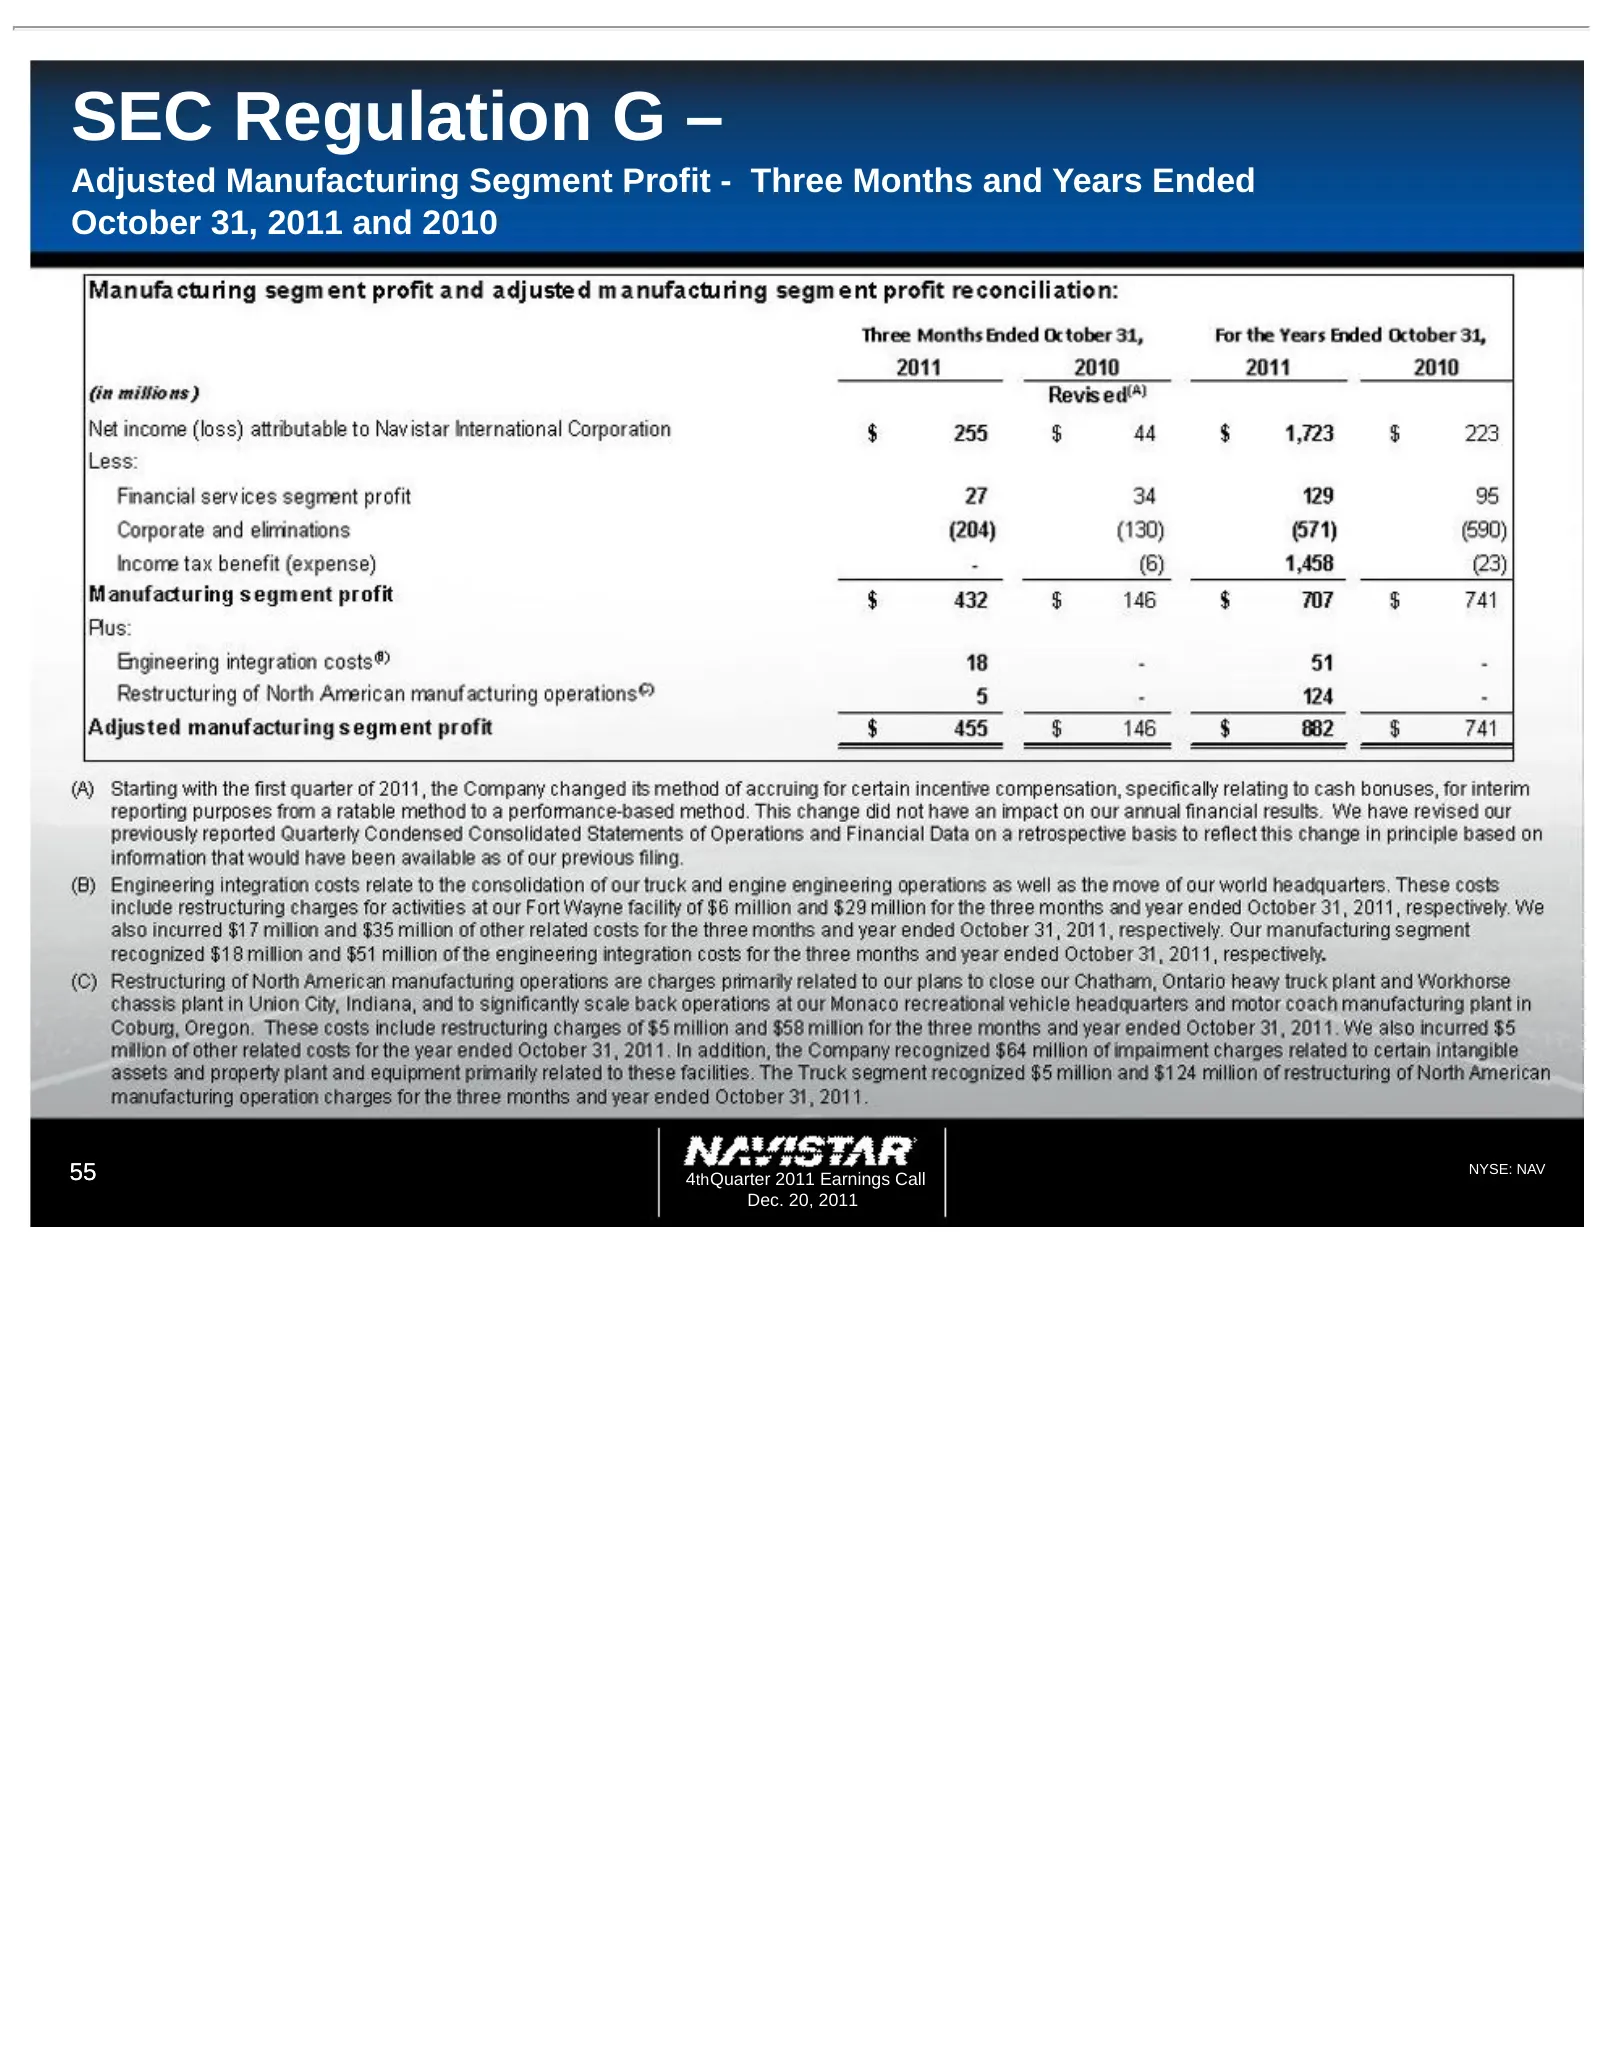
Slide 55: SEC Regulation G – Adjusted Manufacturing Segment Profit
SEC Regulation G – Adjusted Manufacturing Segment Profit - Three Months and Years Ended October 31, 2011 and 2010 55 4th Quarter 2011 Earnings Call NYSE: NAV Dec. 20, 2011
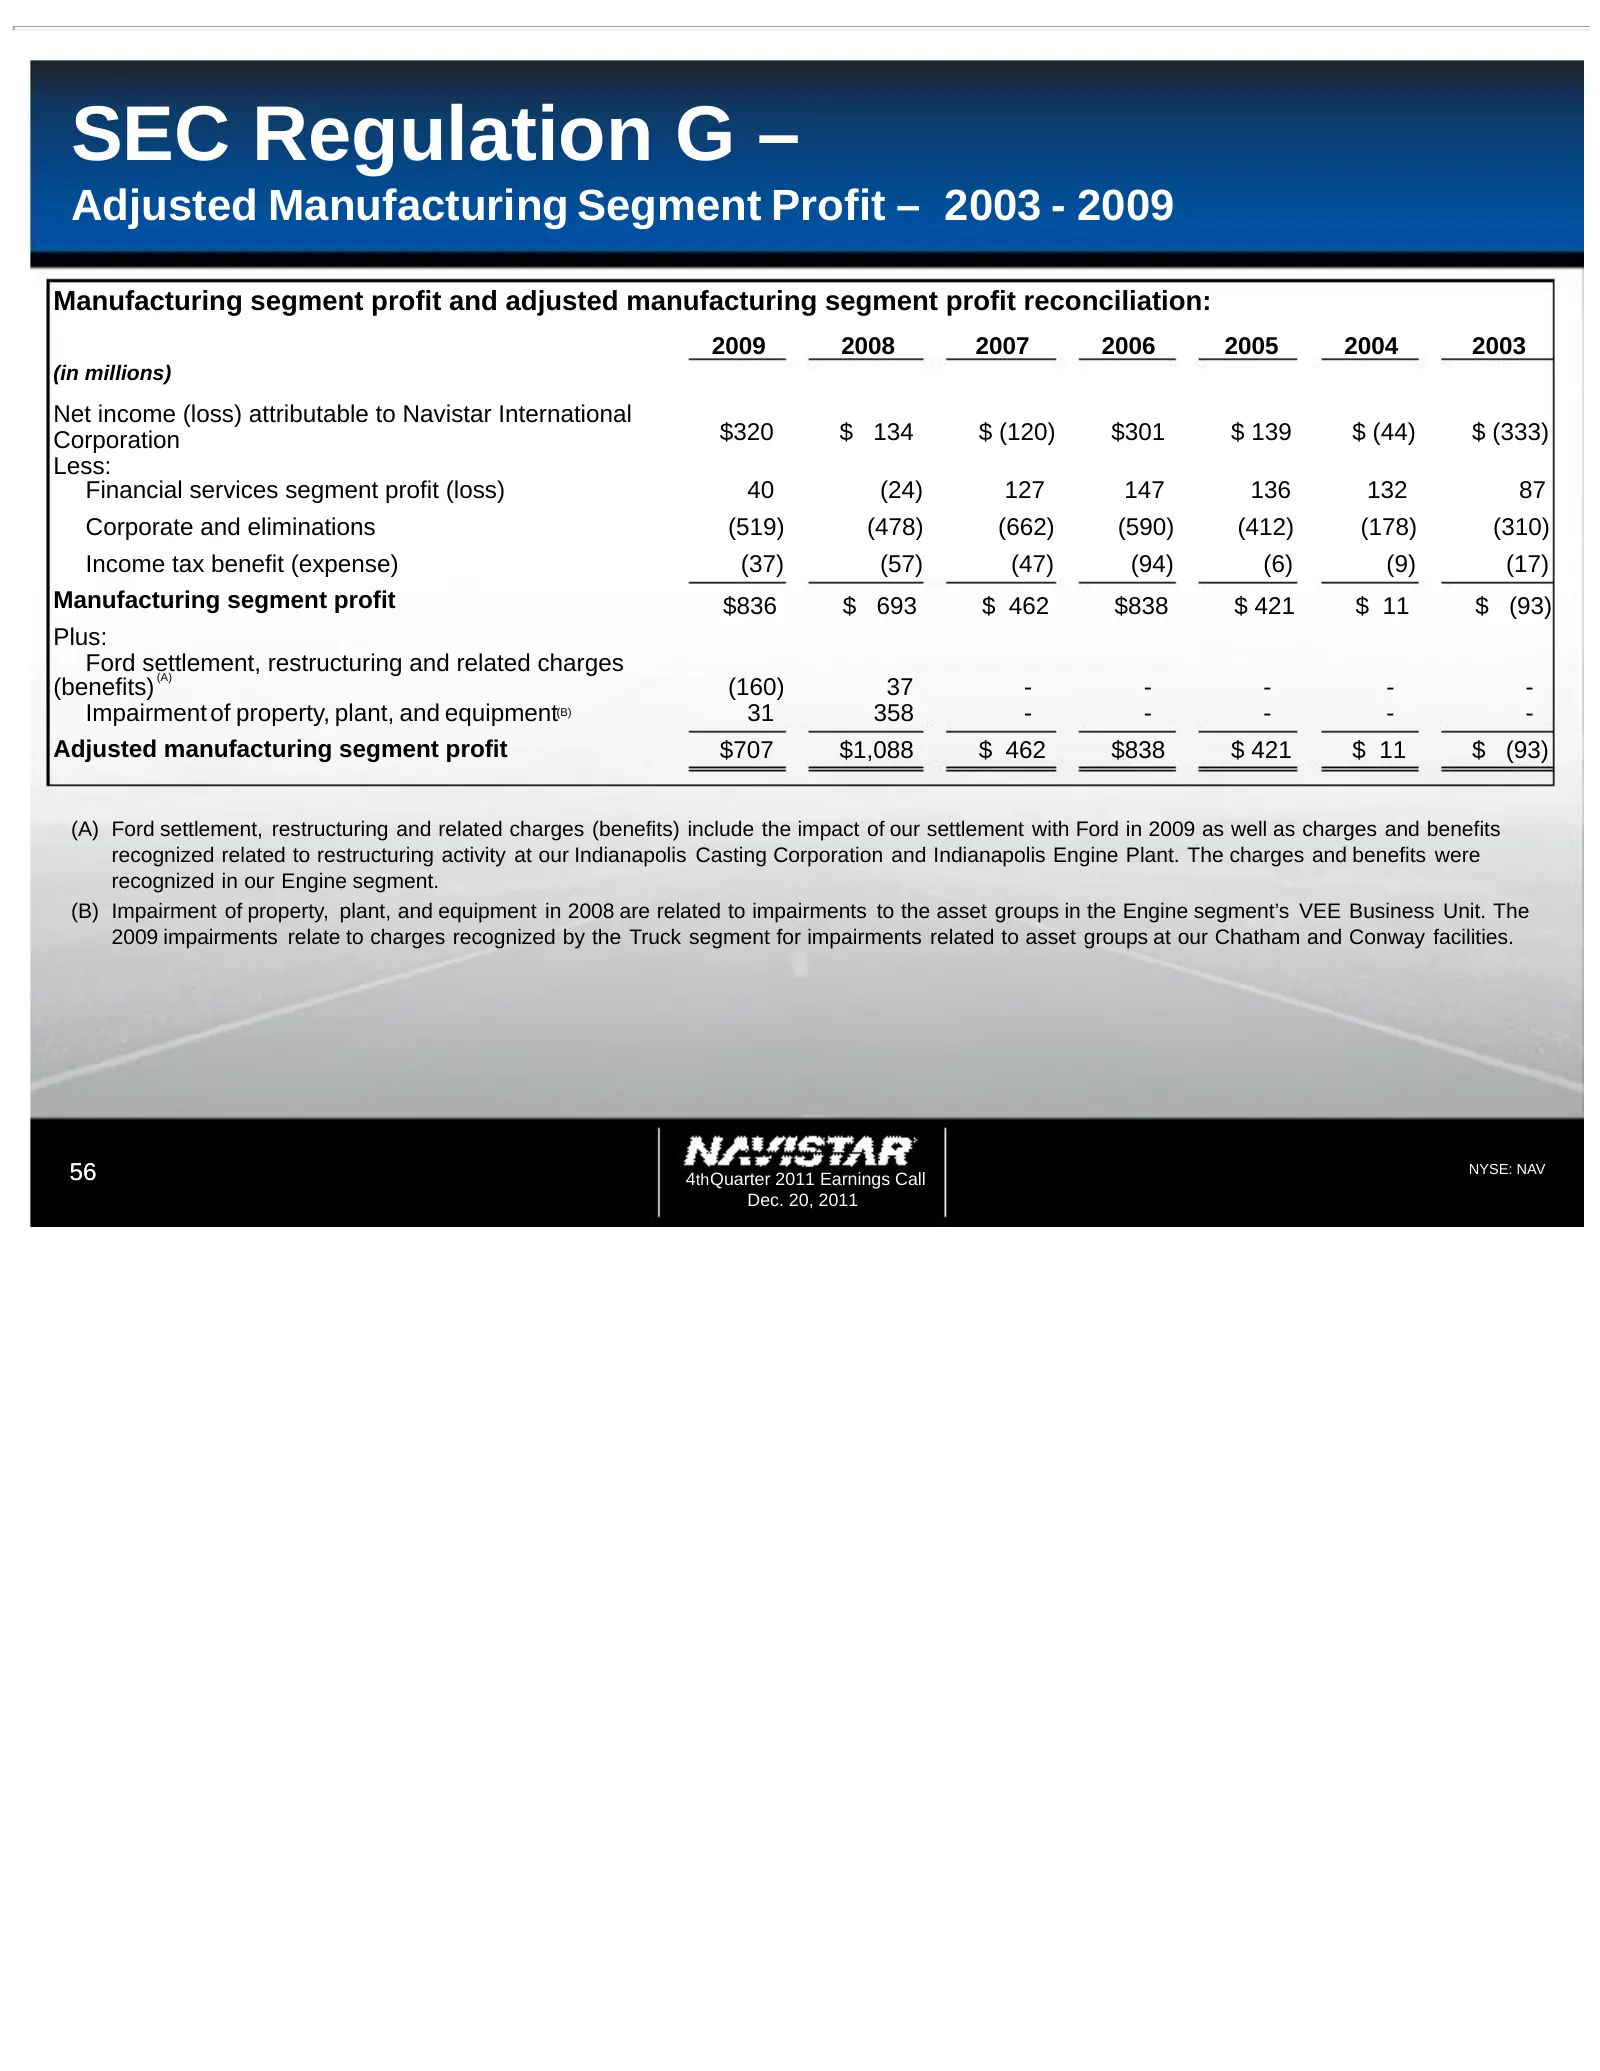
Slide 56: SEC Regulation G – Adjusted Manufacturing Segment Profit 2003-2009
SEC Regulation G – Adjusted Manufacturing Segment Profit – 2003 - 2009 Manufacturing segment profit and adjusted manufacturing segment profit reconciliation: 2009 2008 2007 2006 2005 2004 2003 (in millions) Net income (loss) attributable to Navistar International Corporation $320 $ 134 $ (120) $301
Slide 57: SEC Regulation G – Adjusted Net Income excluding income tax
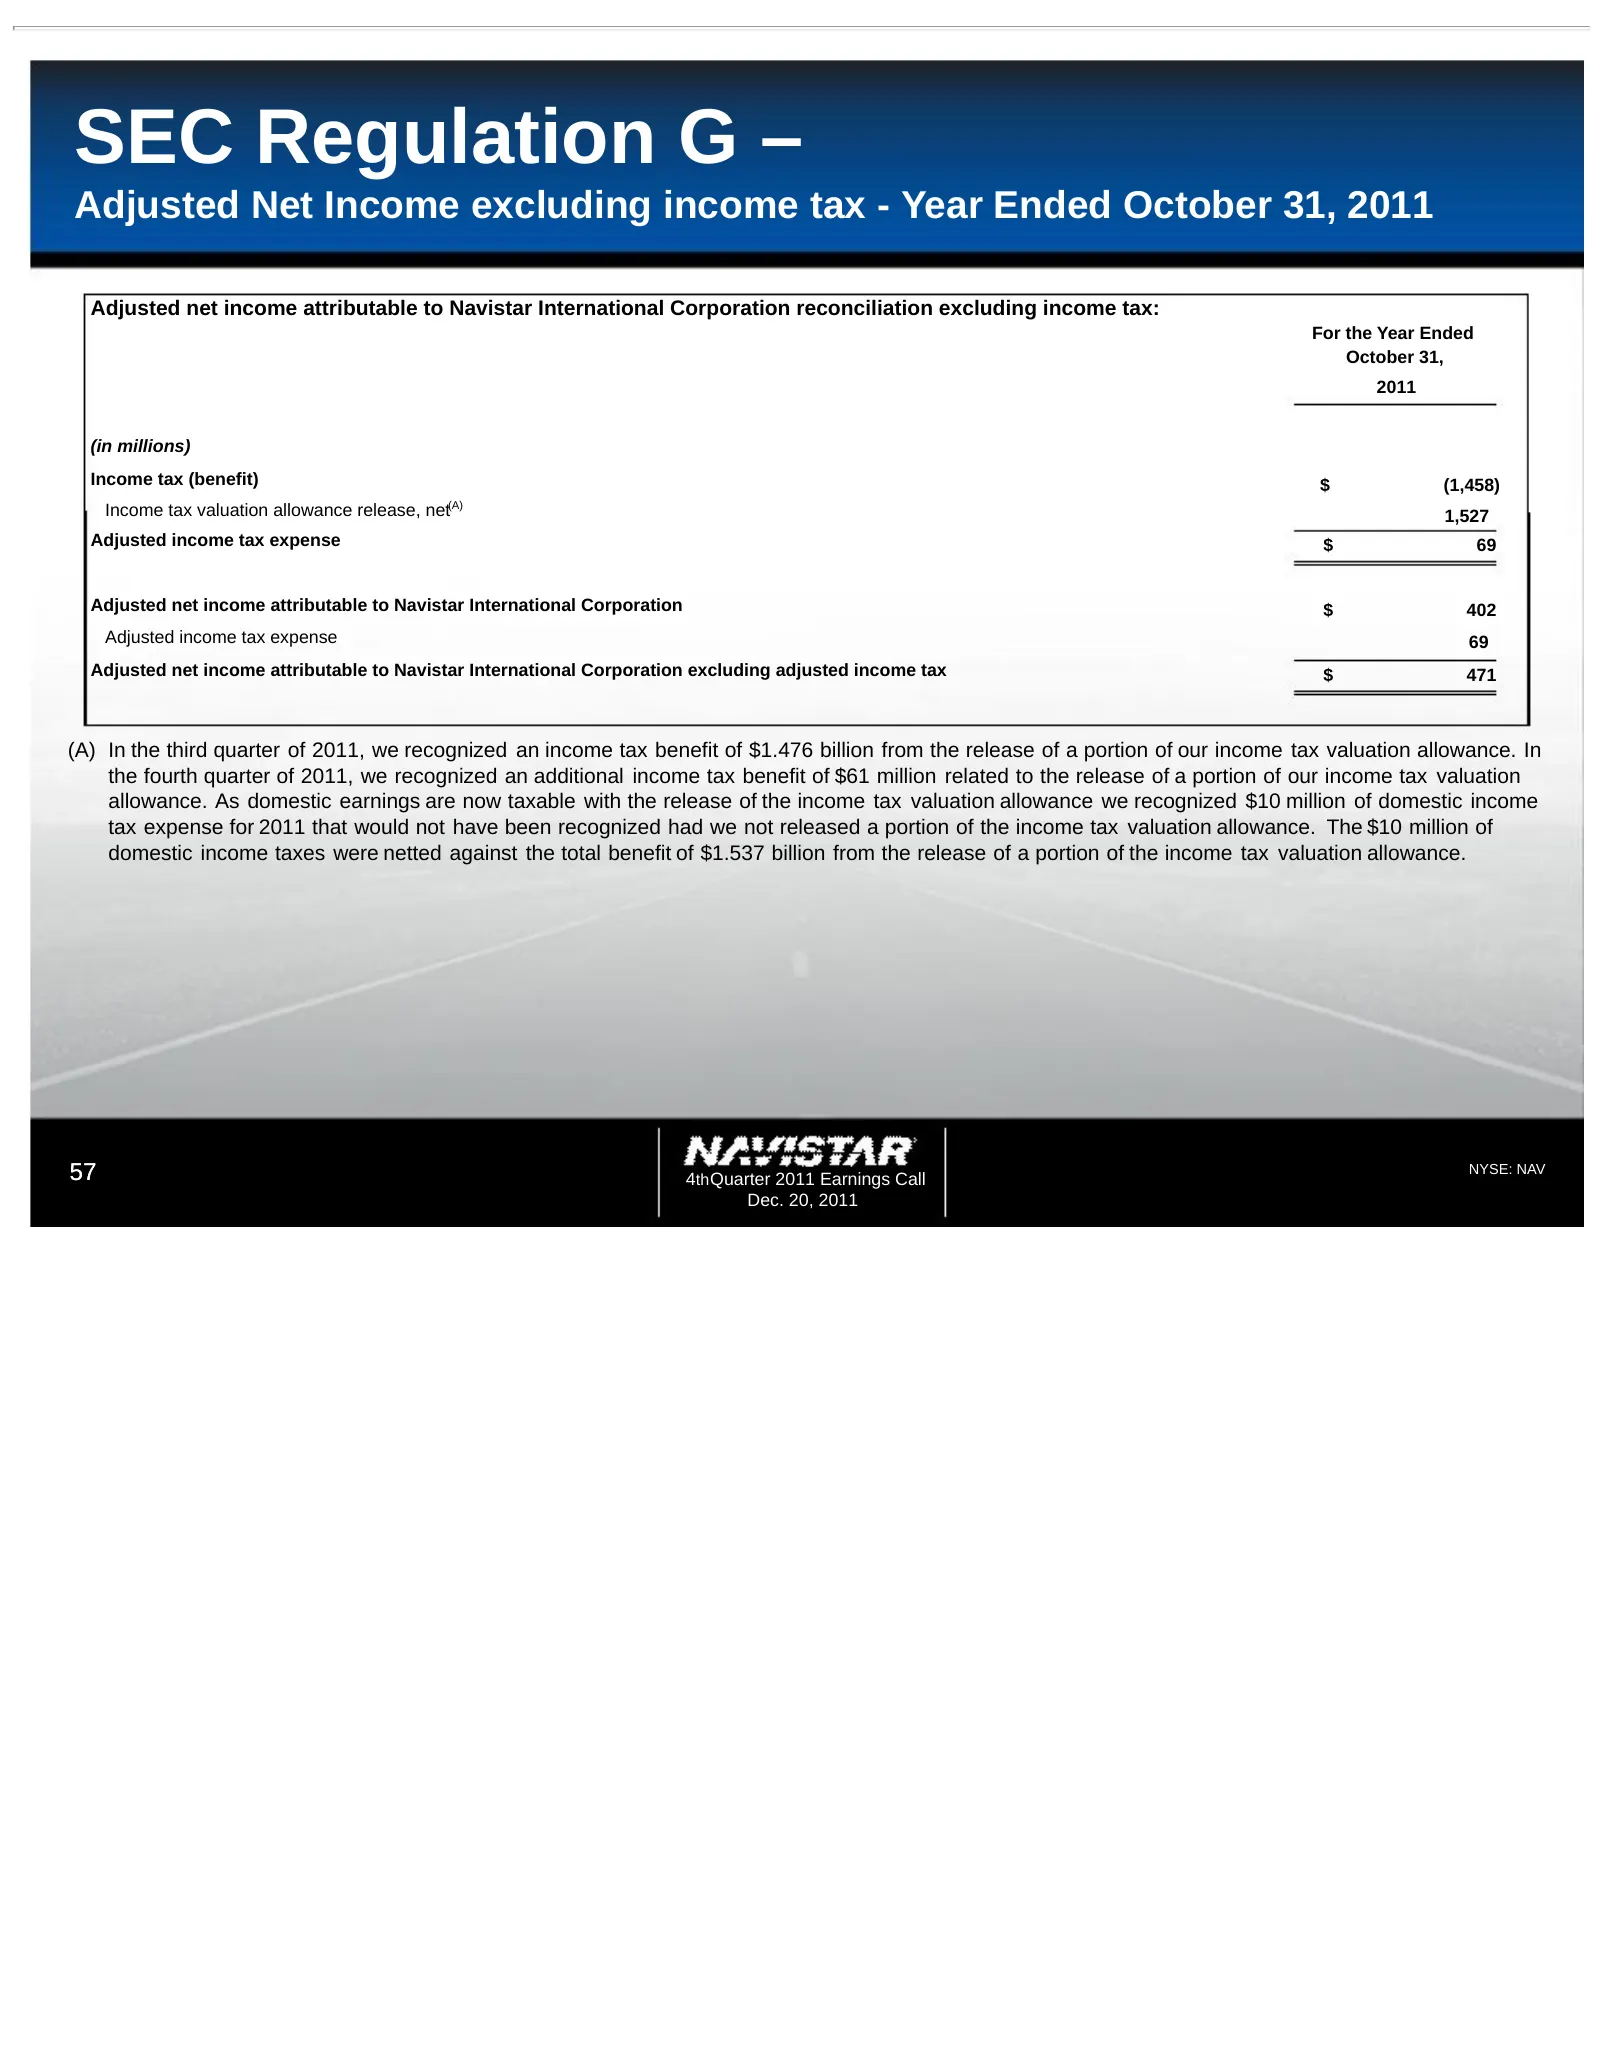
SEC Regulation G – Adjusted Net Income excluding income tax - Year Ended October 31, 2011 Adjusted net income attributable to Navistar International Corporation reconciliation excluding income tax: For the Year Ended October 31, 2011 (in millions) Income tax (benefit) $ (1,458) Income tax valuation
Source: SEC EDGAR · 8-K filed Dec 20, 2011
More decks from Navistar International Corporation
 Q2 2021 Earnings Presentation20 slides · Jun 8, 2021
 Q1 2021 Earnings Presentation20 slides · Mar 9, 2021
 Q4 2020 Earnings Presentation22 slides · Dec 17, 2020
 Q3 2020 Earnings Presentation21 slides · Sep 9, 2020
 Q2 2020 Earnings Presentation21 slides · Jun 4, 2020
 Q1 2020 Earnings Presentation21 slides · Mar 4, 2020