N-able, Inc. · NYSE:NABL
N-able — Investor Presentation (July 2012)
21 slides from N-able's investor presentation, July 2012
Slide 1: Proactive IT Solutions: More Reliable Networks Are Our Business
Program Name Logo Proactive IT Solutions More Reliable Networks Are Our Business Presenter Name email@company.com Tel: (800) 555-2398 Copyright © 2007 <Company Name>. All rights reserved. Copyright © 2005 Primetime, Inc. All rights reserved.
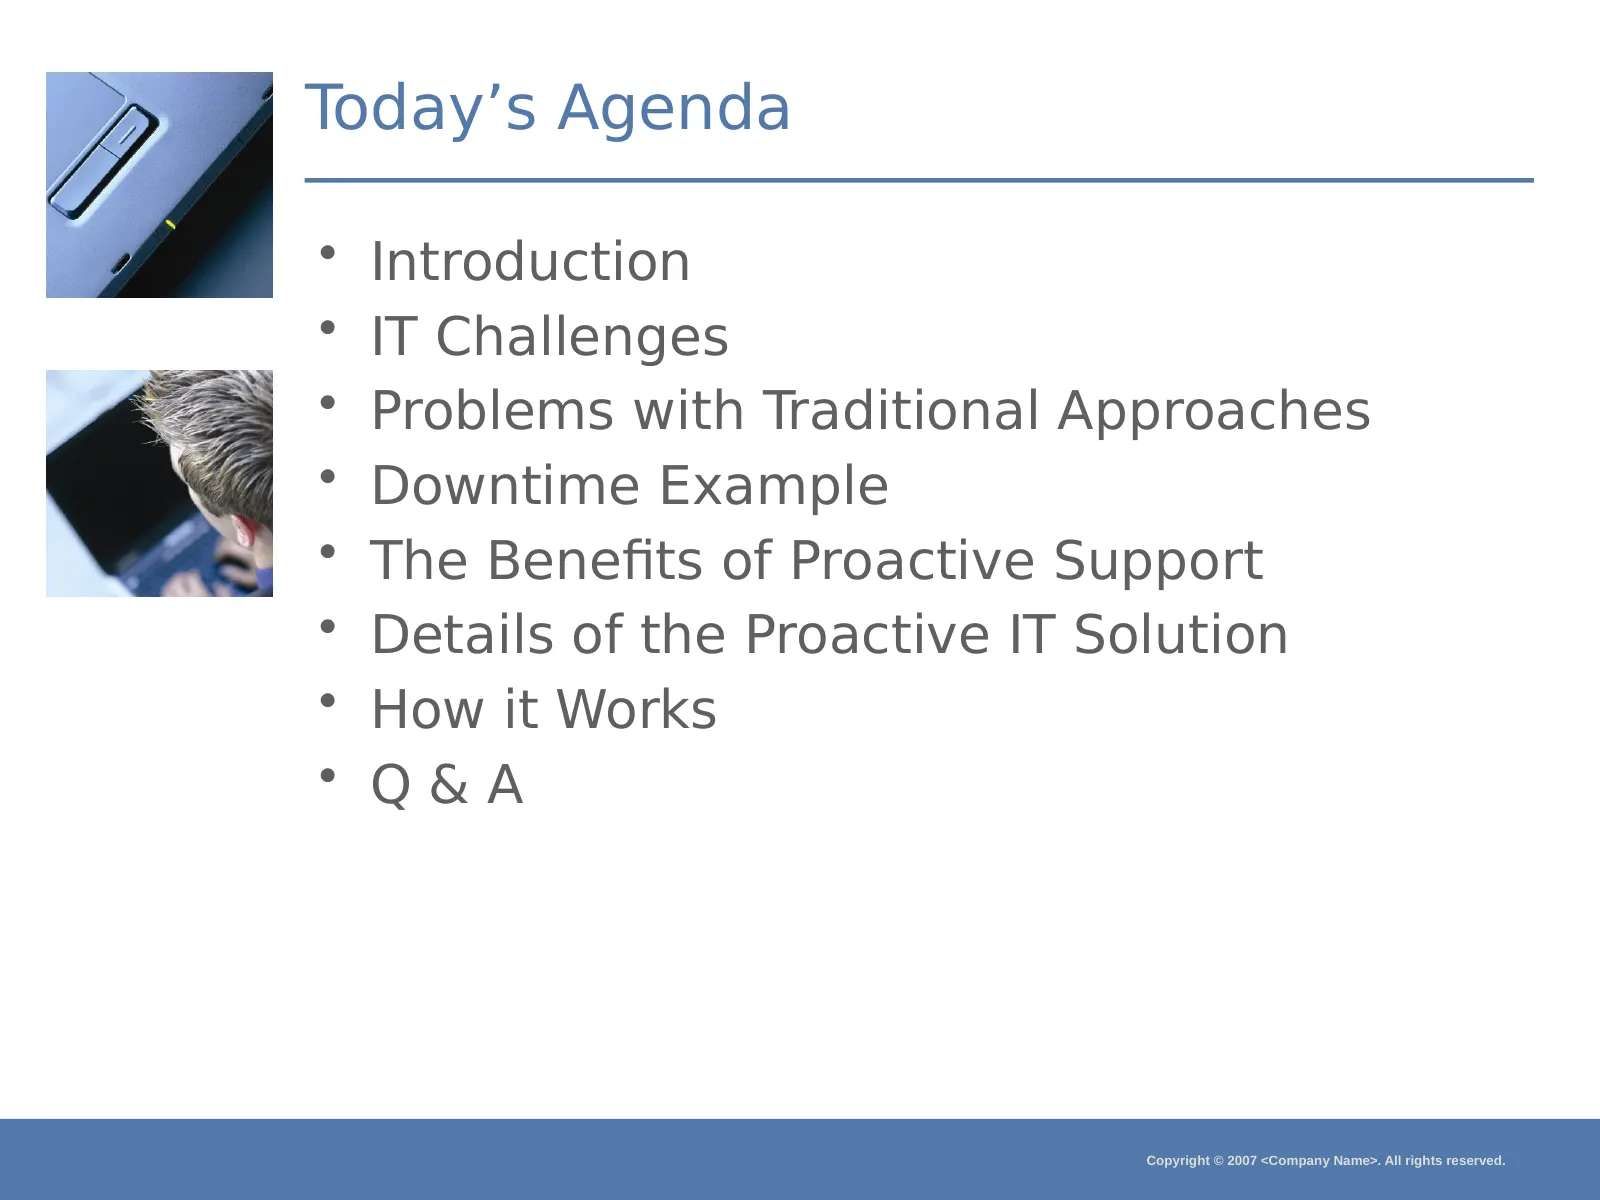
Slide 2: Today's Agenda
Today’s Agenda • Introduction • IT Challenges • Problems with Traditional Approaches • Downtime Example • The Benefits of Proactive Support • Details of the Proactive IT Solution • How it Works • Q&A Copyright © 2007 <Company Name>. All rights reserved.
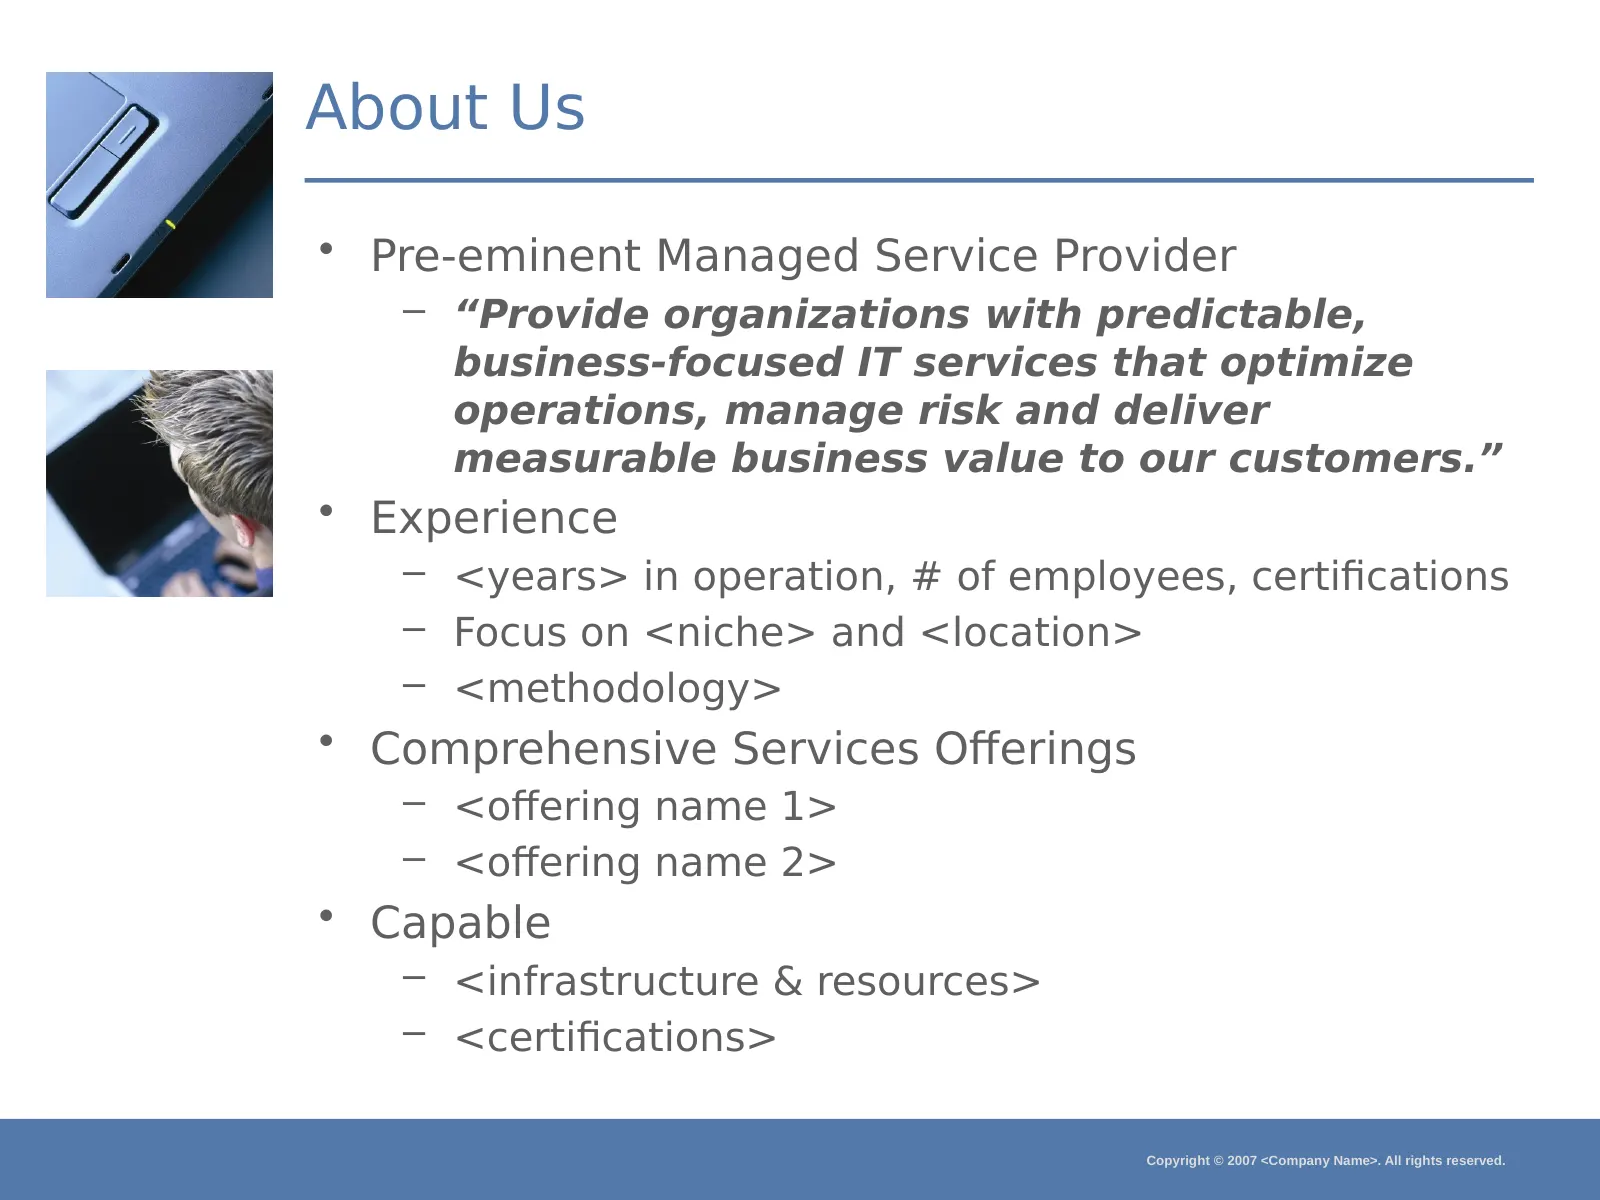
Slide 3: About Us
About Us • Pre-eminent Managed Service Provider – “Provide organizations with predictable, business-focused IT services that optimize operations, manage risk and deliver measurable business value to our customers.” • Experience – <years> in operation, # of employees, certifications – Focus on <niche
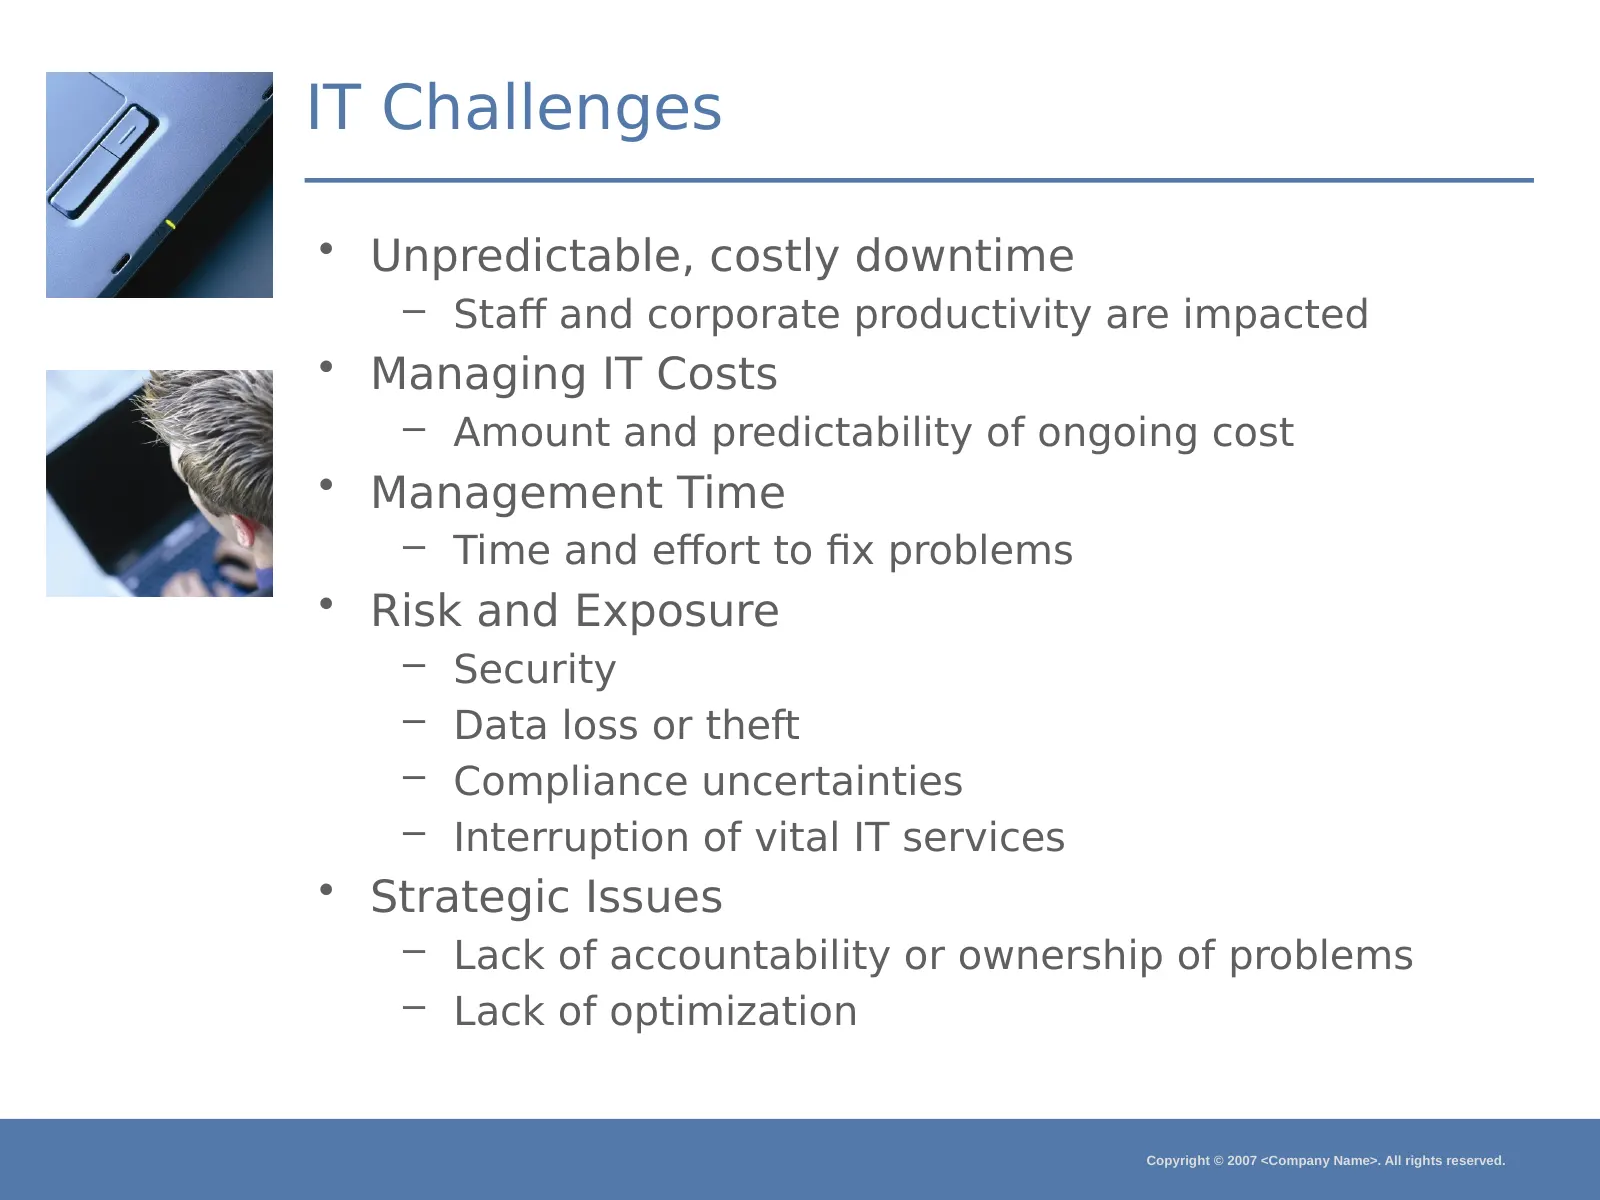
Slide 4: IT Challenges
IT Challenges • Unpredictable, costly downtime – Staff and corporate productivity are impacted • Managing IT Costs – Amount and predictability of ongoing cost • Management Time – Time and effort to fix problems • Risk and Exposure – Security – Data loss or theft – Compliance uncertainties – Interrup
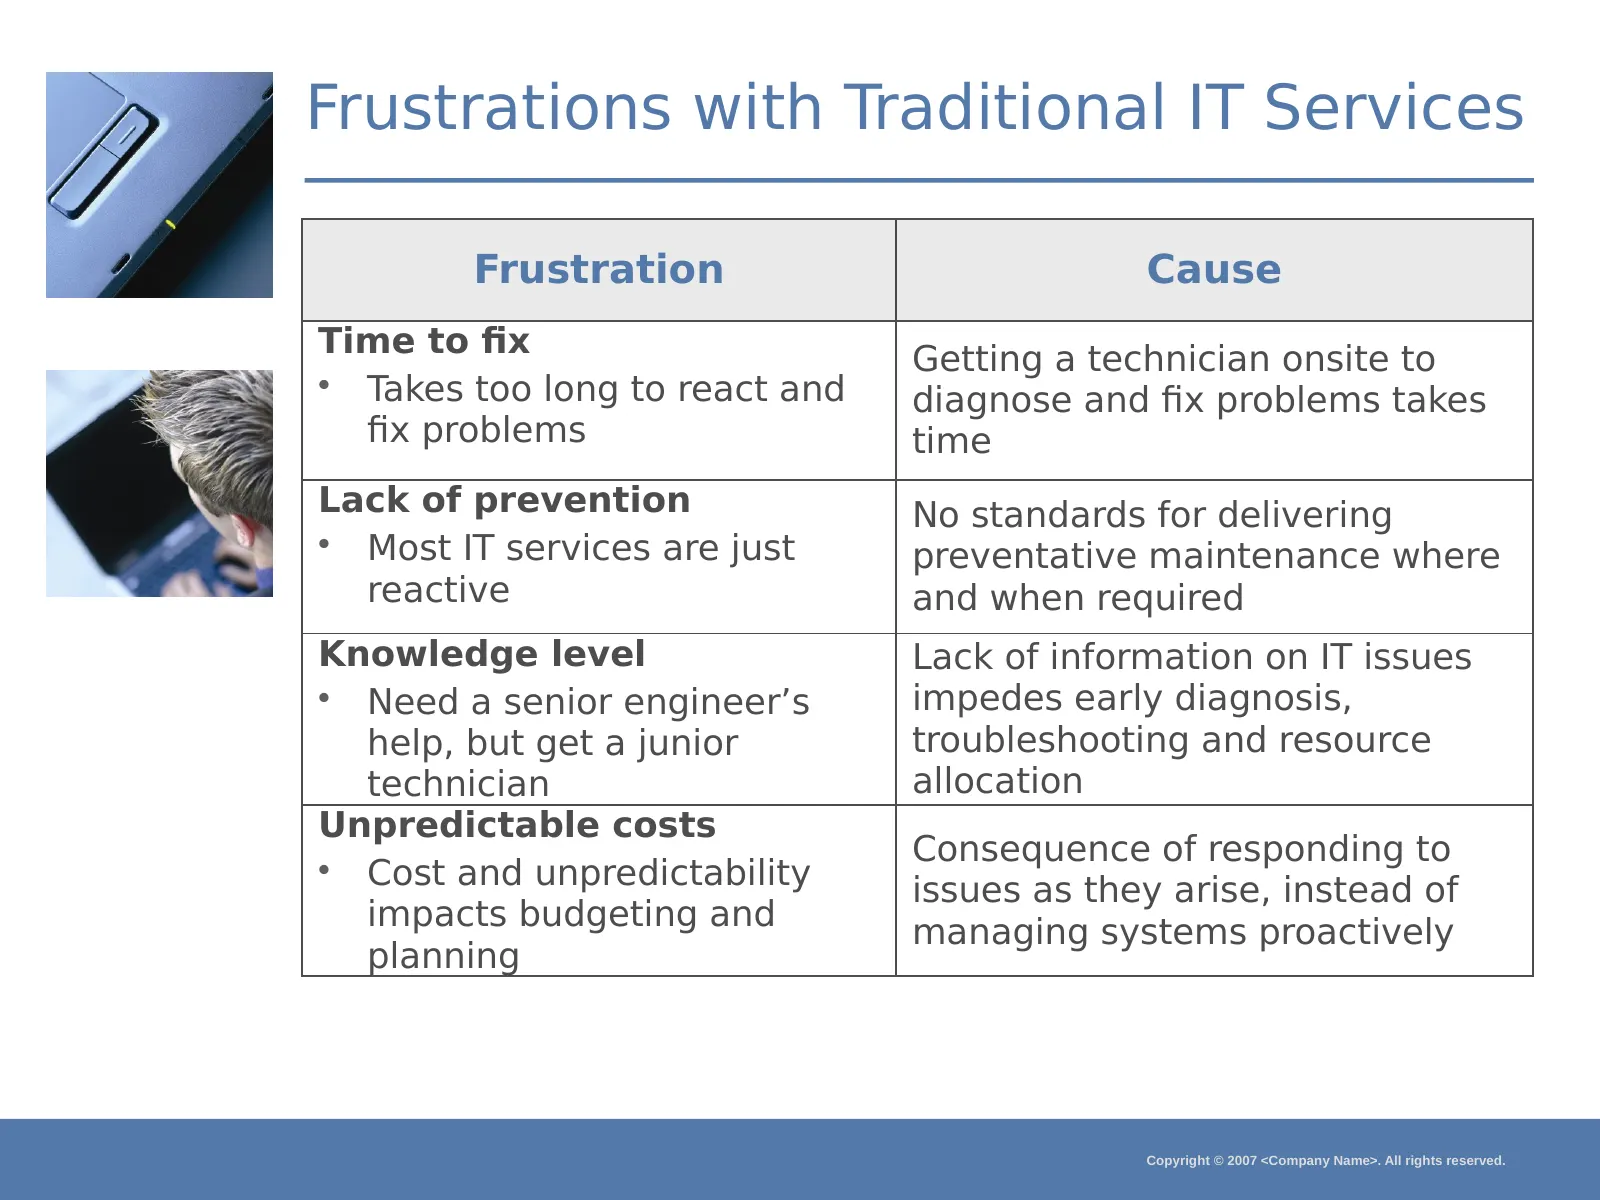
Slide 5: Frustrations with Traditional IT Services
Frustrations with Traditional IT Services Frustration Cause Time to fix Getting a technician onsite to • Takes too long to react and diagnose and fix problems takes fix problems time Lack of prevention No standards for delivering • Most IT services are just preventative maintenance where reactive an
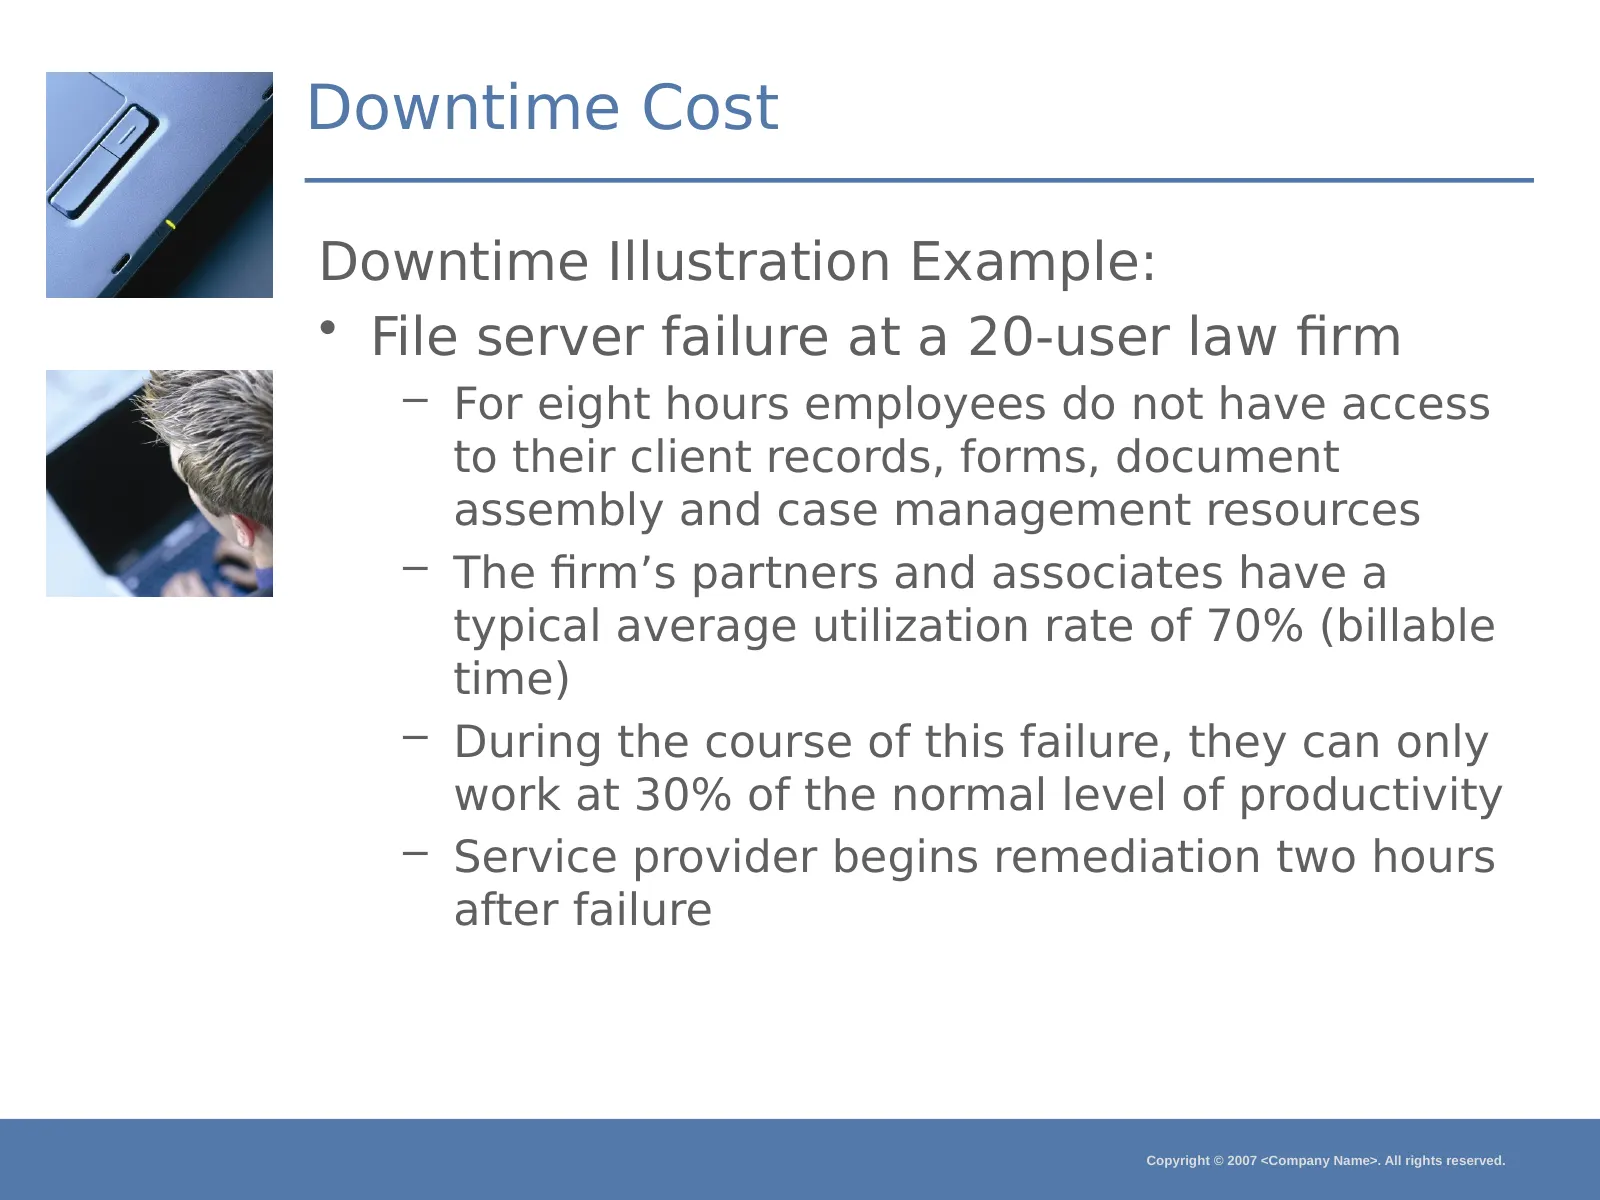
Slide 6: Downtime Cost
Downtime Cost Downtime Illustration Example: • File server failure at a 20-user law firm – For eight hours employees do not have access to their client records, forms, document assembly and case management resources – The firm’s partners and associates have a typical average utilization rate of 70%
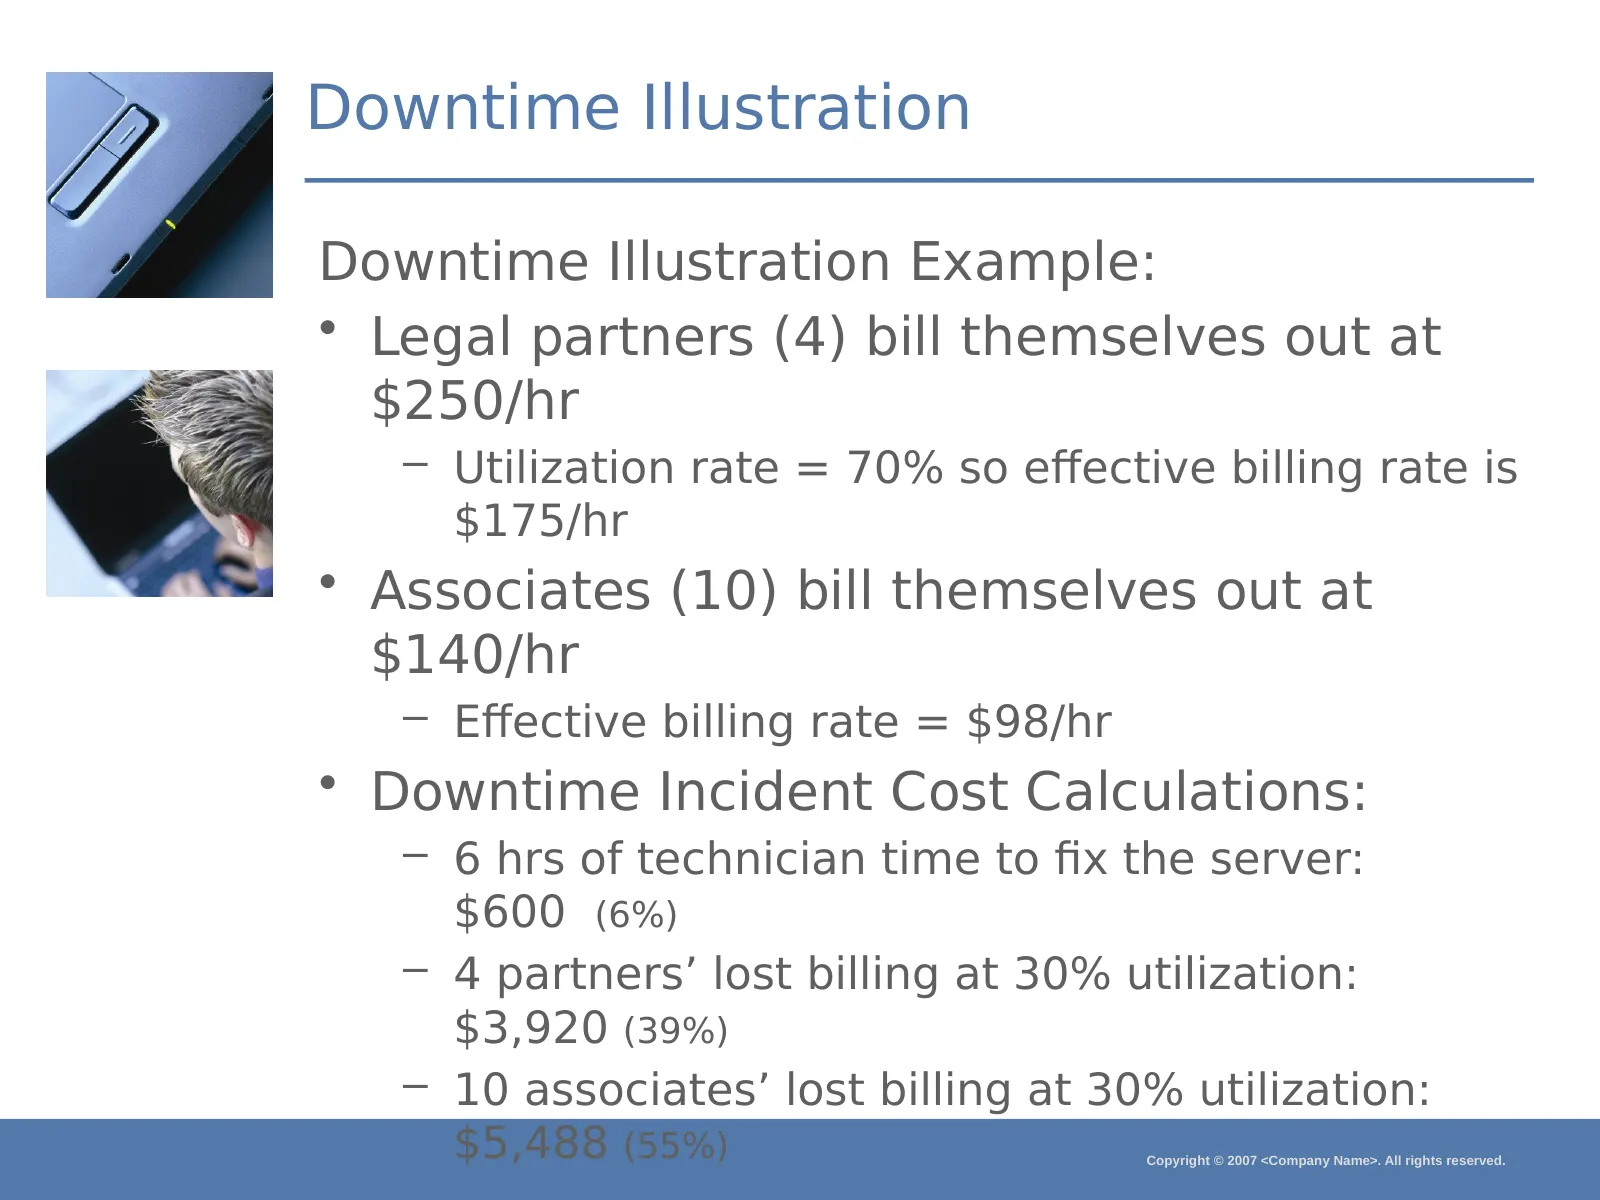
Slide 7: Downtime Illustration
Downtime Illustration Downtime Illustration Example: • Legal partners (4) bill themselves out at $250/hr – Utilization rate = 70% so effective billing rate is $175/hr • Associates (10) bill themselves out at $140/hr – Effective billing rate = $98/hr • Downtime Incident Cost Calculations: – 6 hrs of
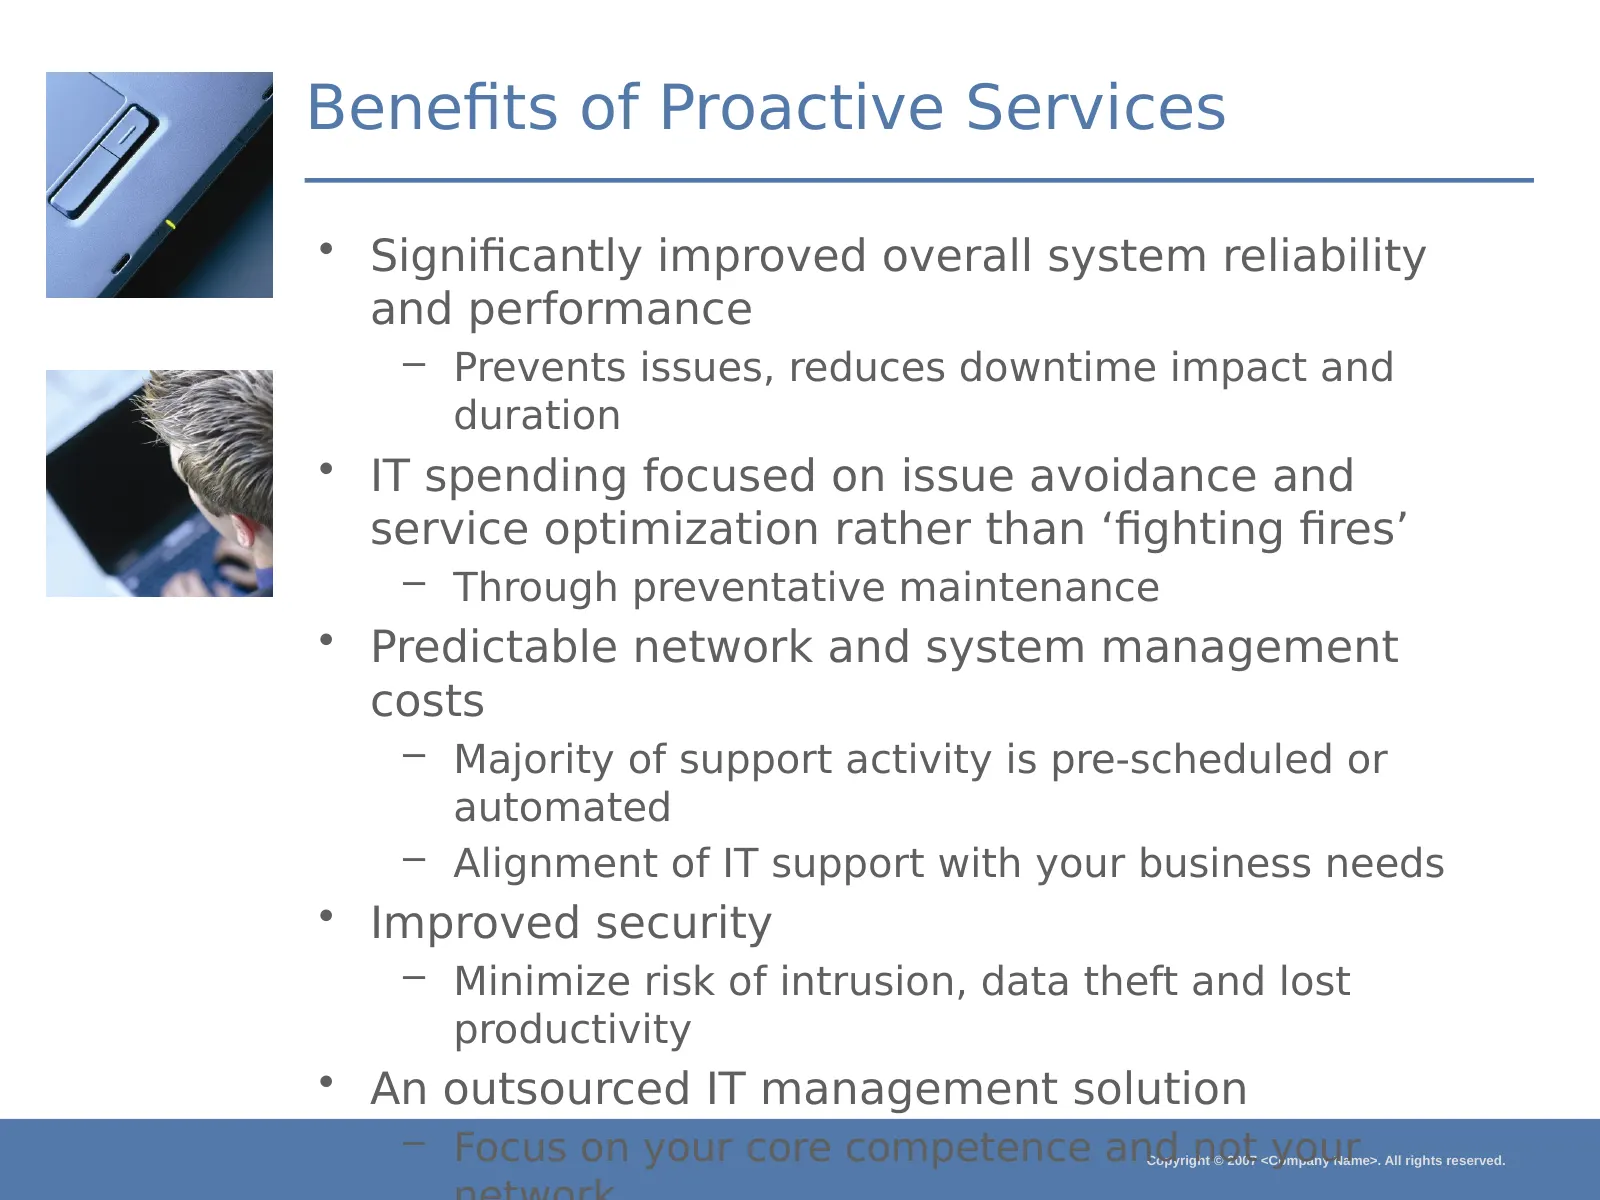
Slide 8: Benefits of Proactive Services
Benefits of Proactive Services • Significantly improved overall system reliability and performance – Prevents issues, reduces downtime impact and duration • IT spending focused on issue avoidance and service optimization rather than ‘fighting fires’ – Through preventative maintenance • Predictable n
Slide 9: Proactive Solution
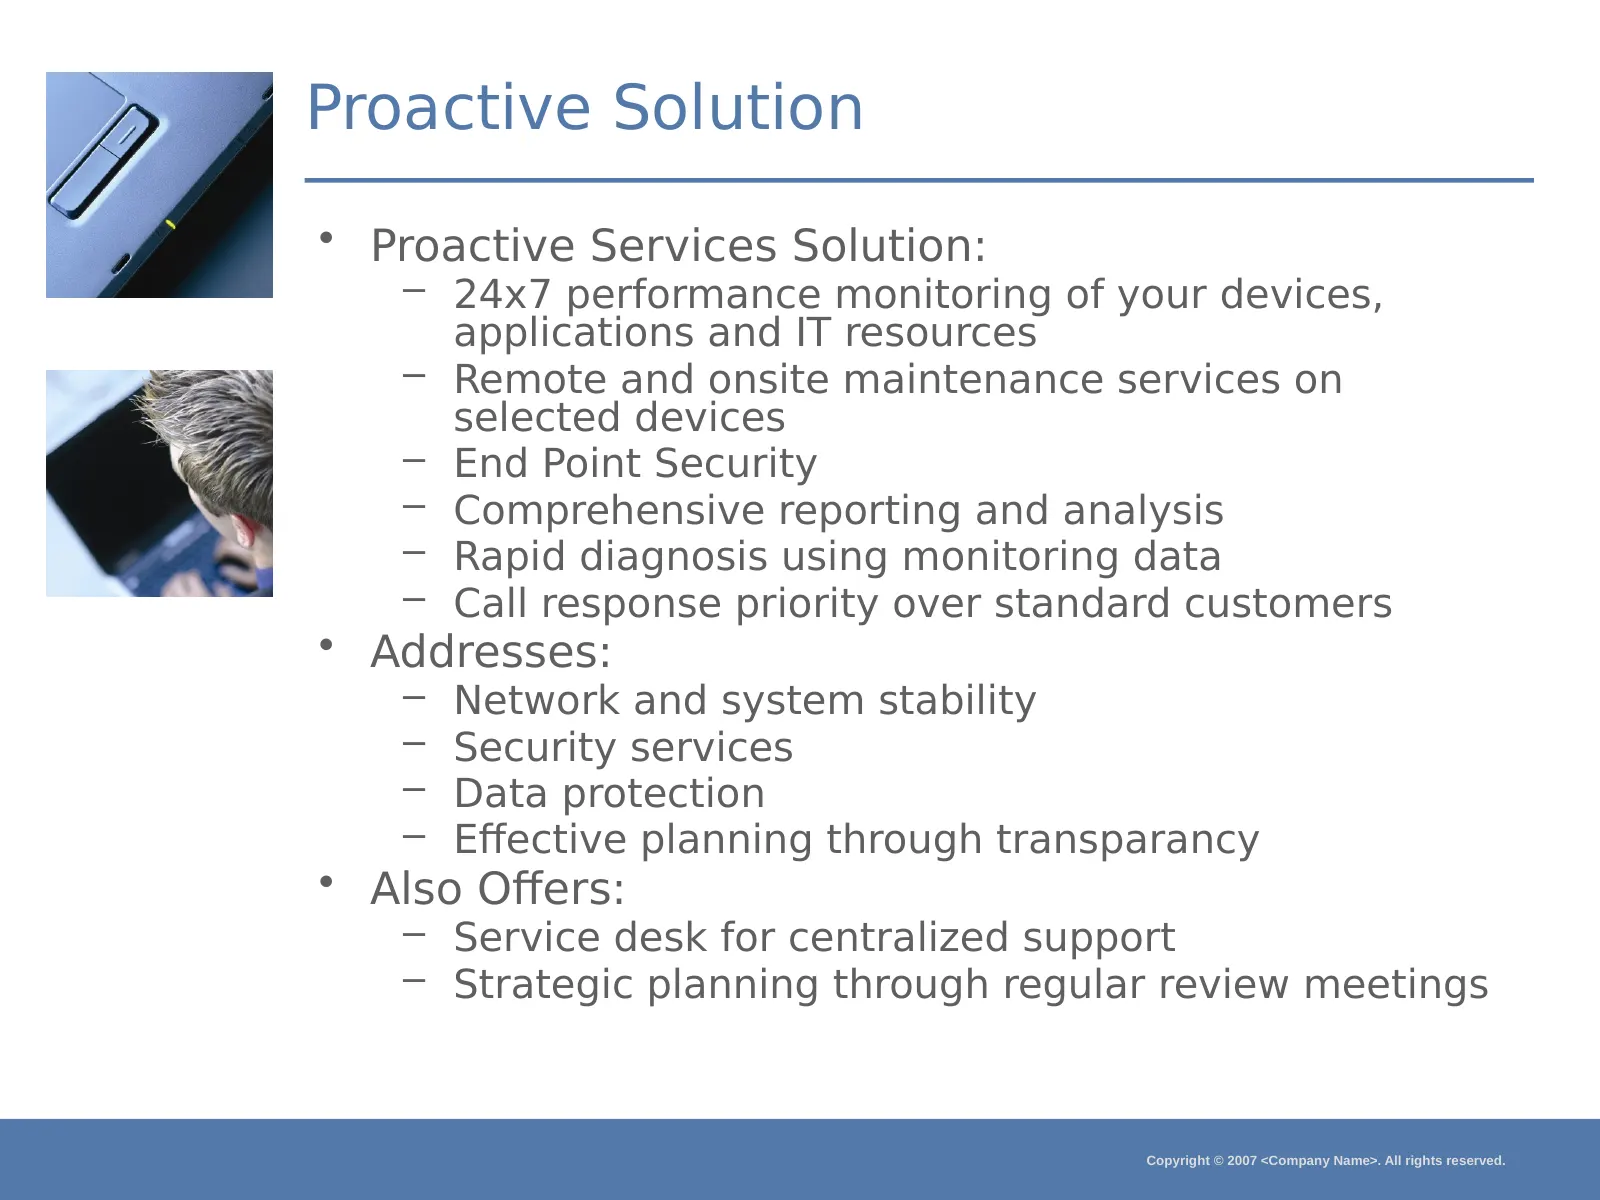
Proactive Solution • Proactive Services Solution: – 24x7 performance monitoring of your devices, applications and IT resources – Remote and onsite maintenance services on selected devices – End Point Security – Comprehensive reporting and analysis – Rapid diagnosis using monitoring data – Call respo
Slide 10: Proactive Solution Details – Core Elements
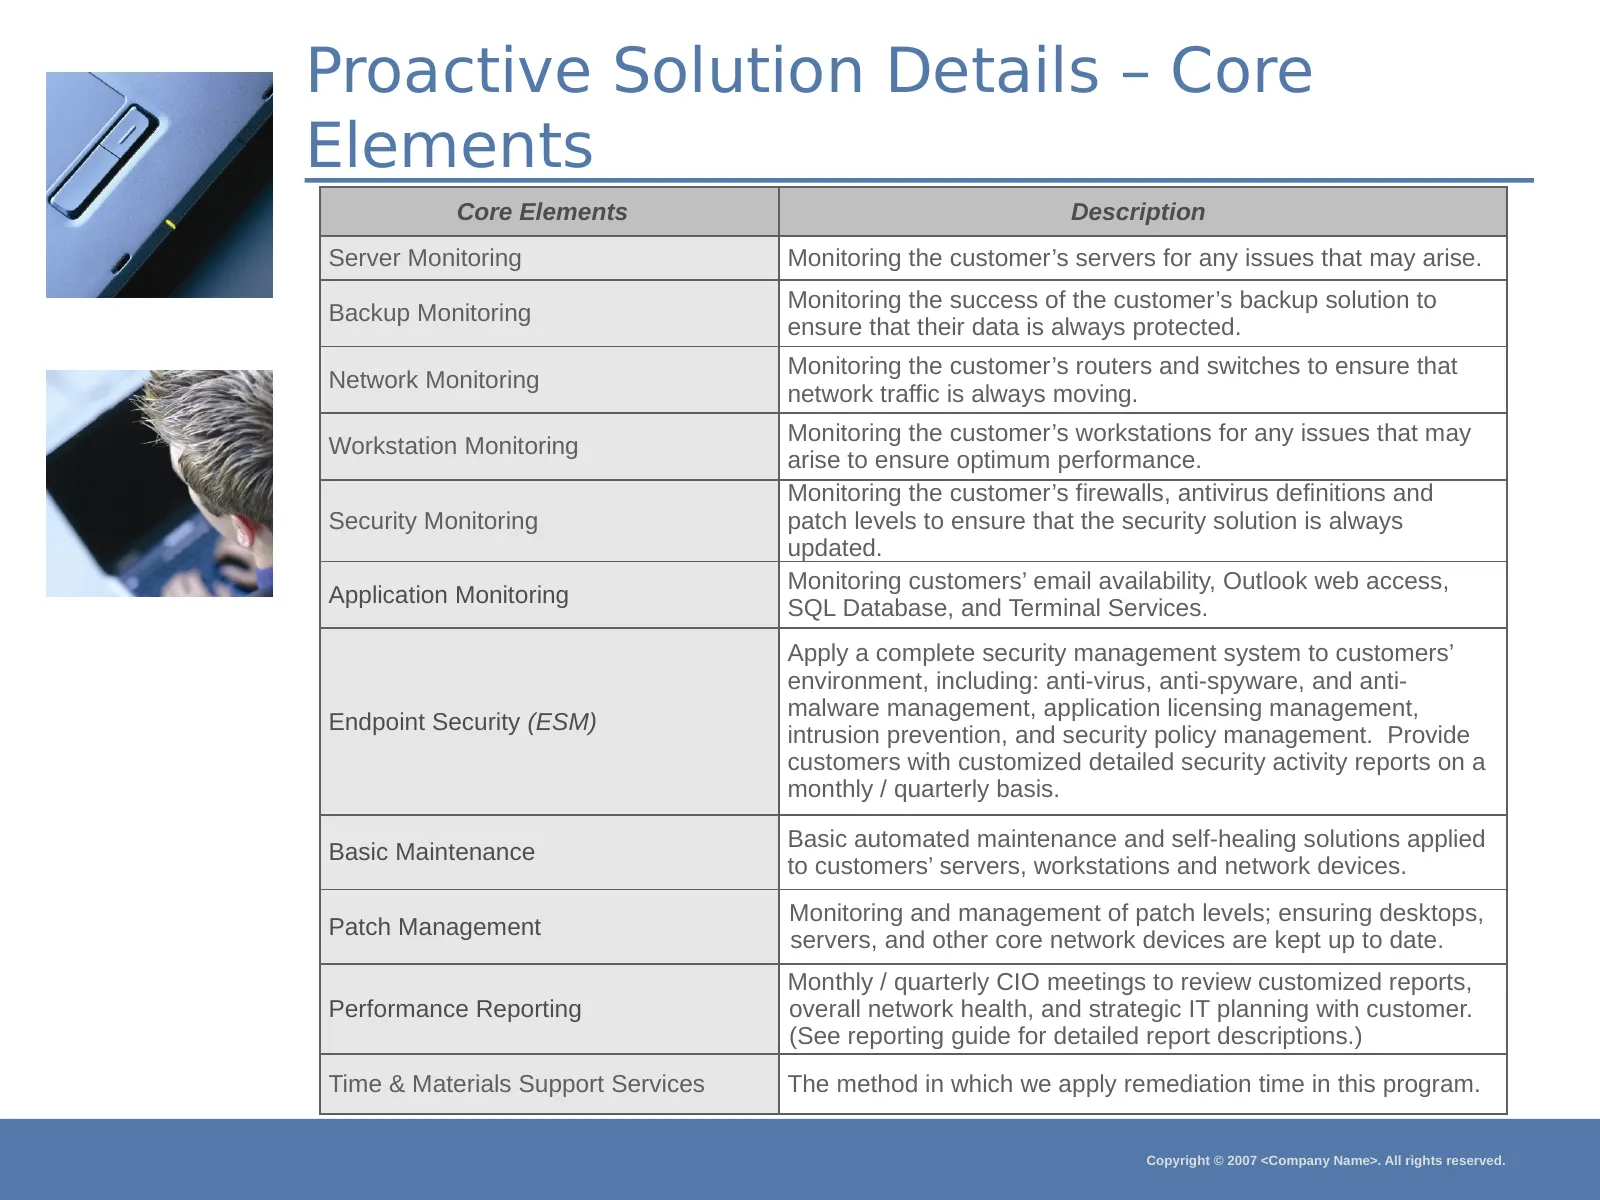
Proactive Solution Details – Core Elements Core Elements Description Server Monitoring Monitoring the customer’s servers for any issues that may arise. Monitoring the success of the customer’s backup solution to Backup Monitoring ensure that their data is always protected. Monitoring the customer’s
Slide 11: Proactive Solution Details – Optional Elements
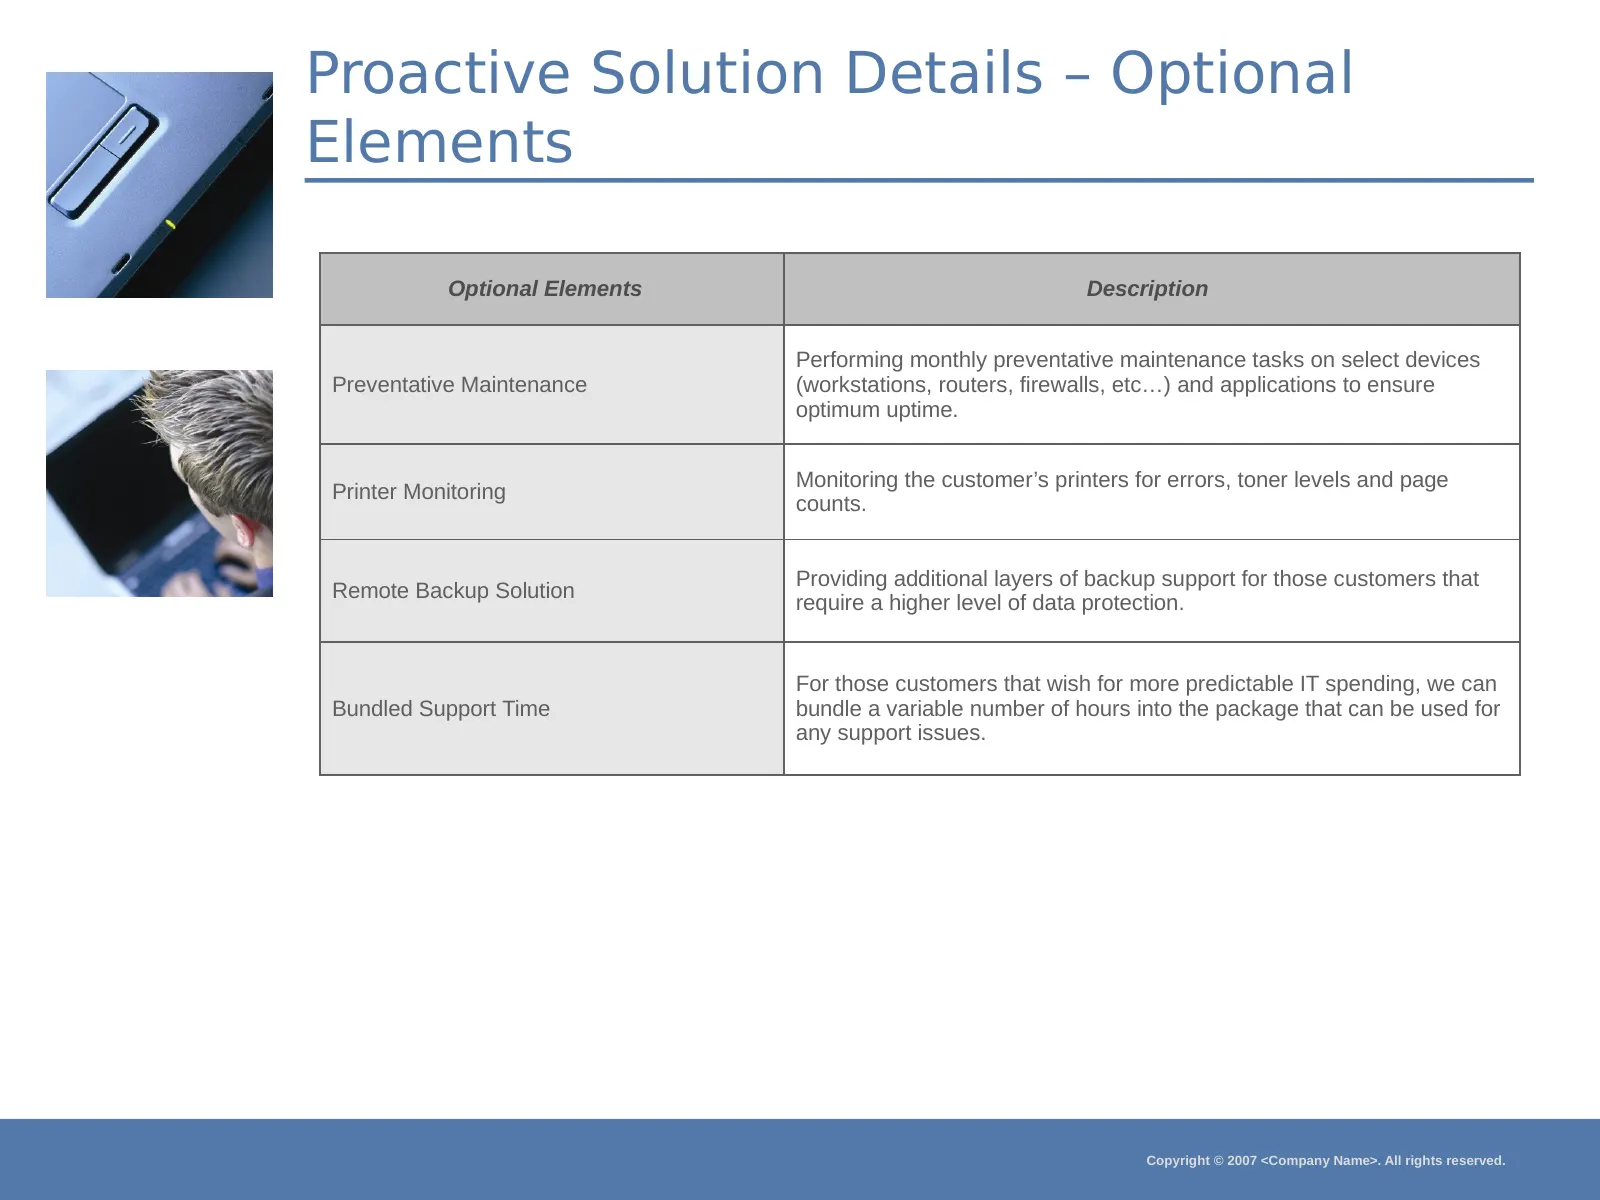
Proactive Solution Details – Optional Elements Optional Elements Description Performing monthly preventative maintenance tasks on select devices Preventative Maintenance (workstations, routers, firewalls, etc…) and applications to ensure optimum uptime. Monitoring the customer’s printers for errors,
Slide 12: Network Management Services
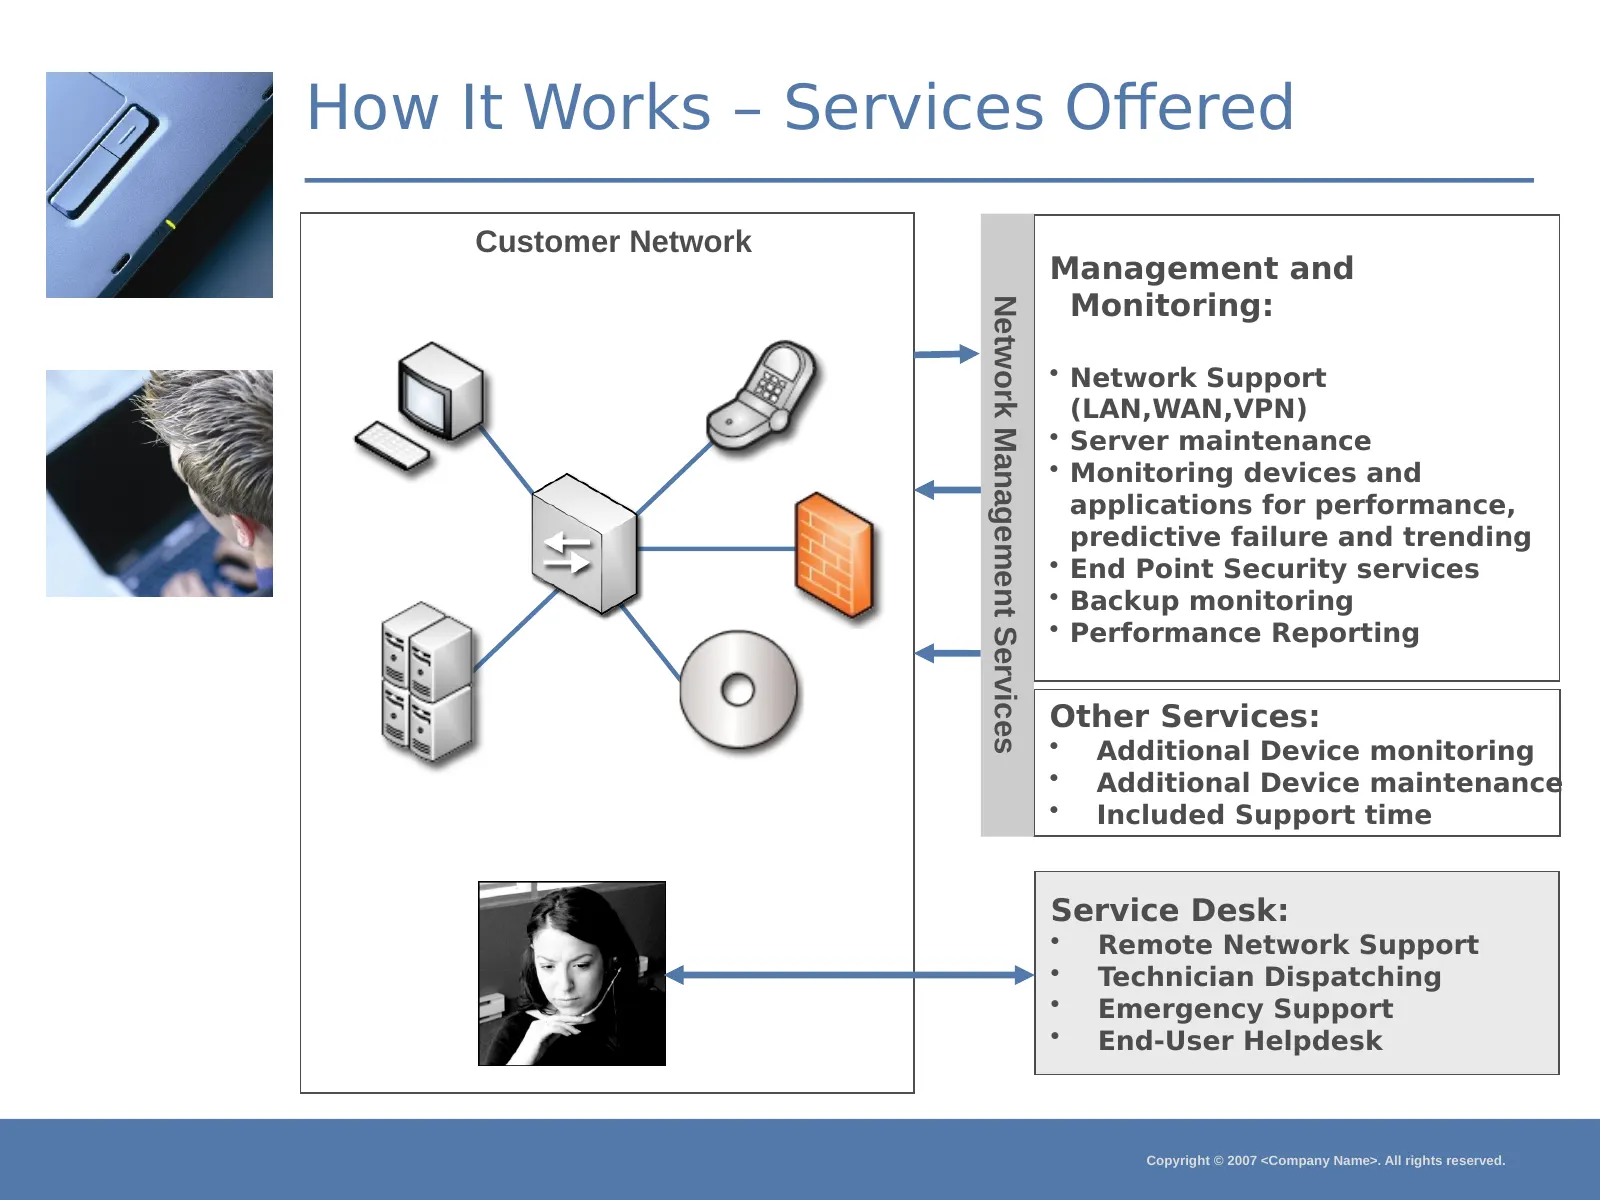
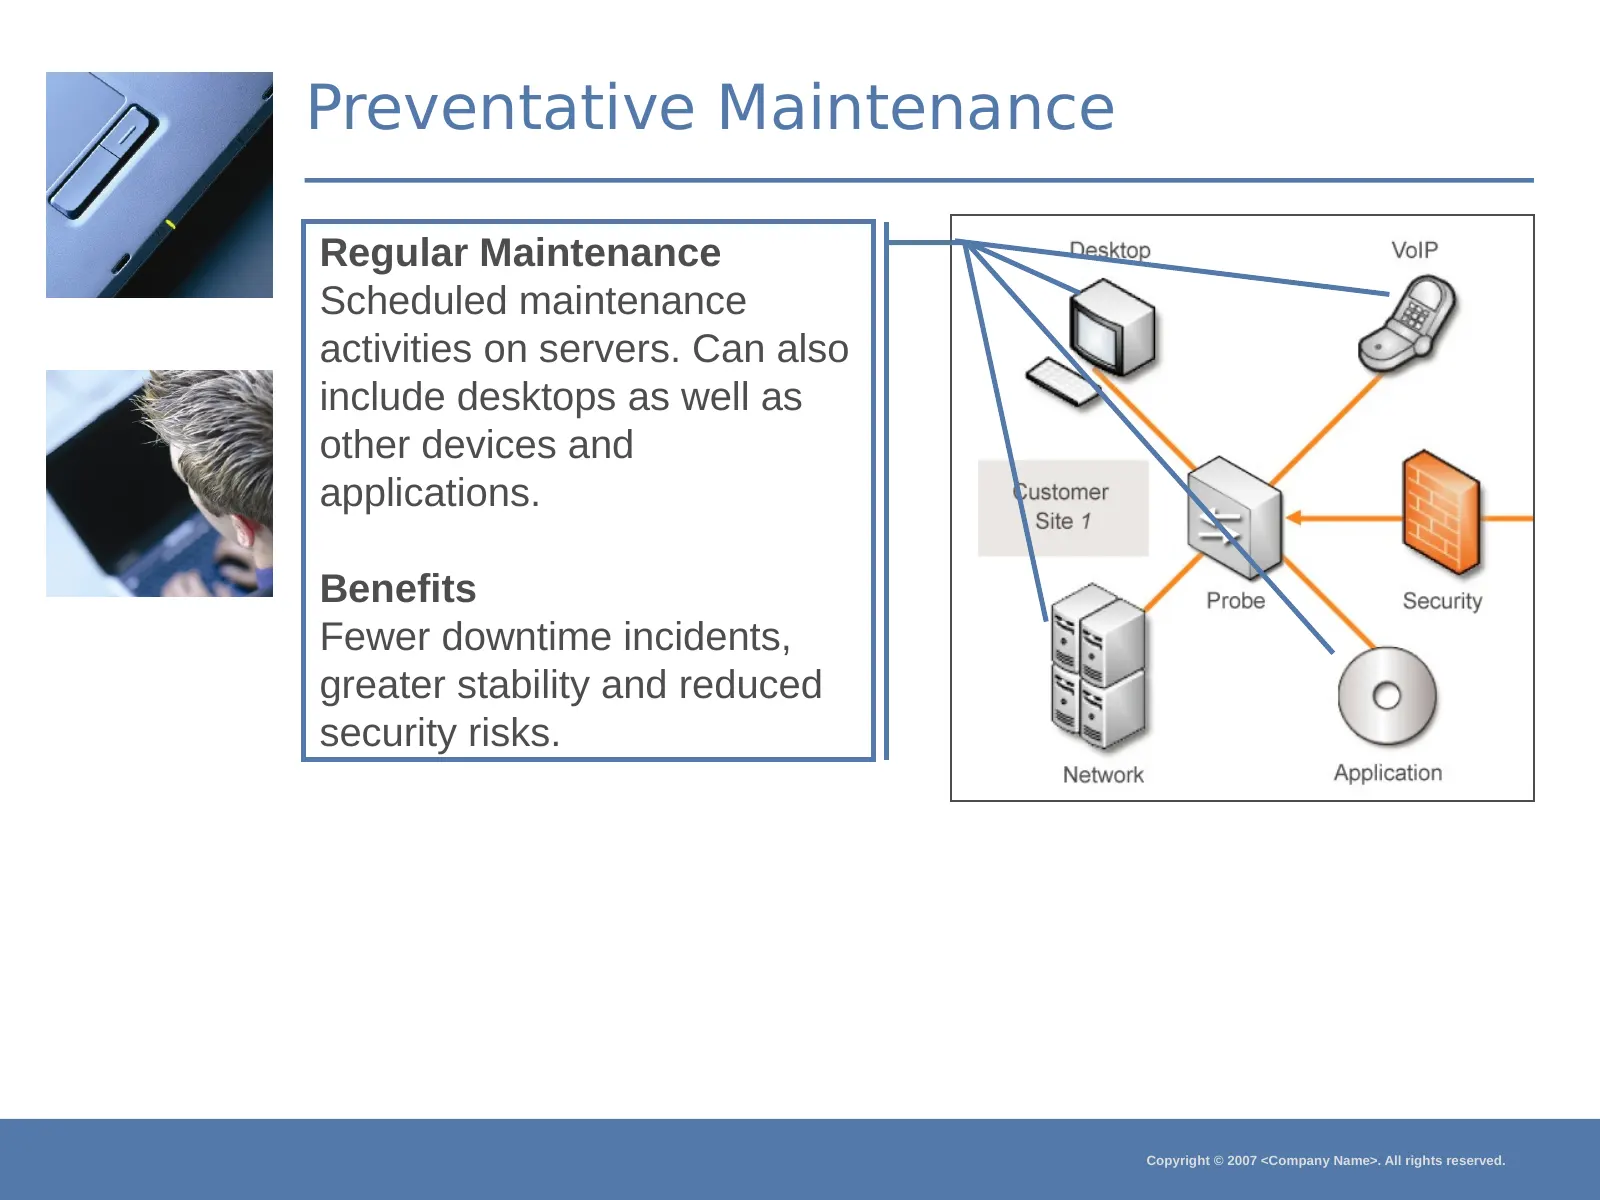
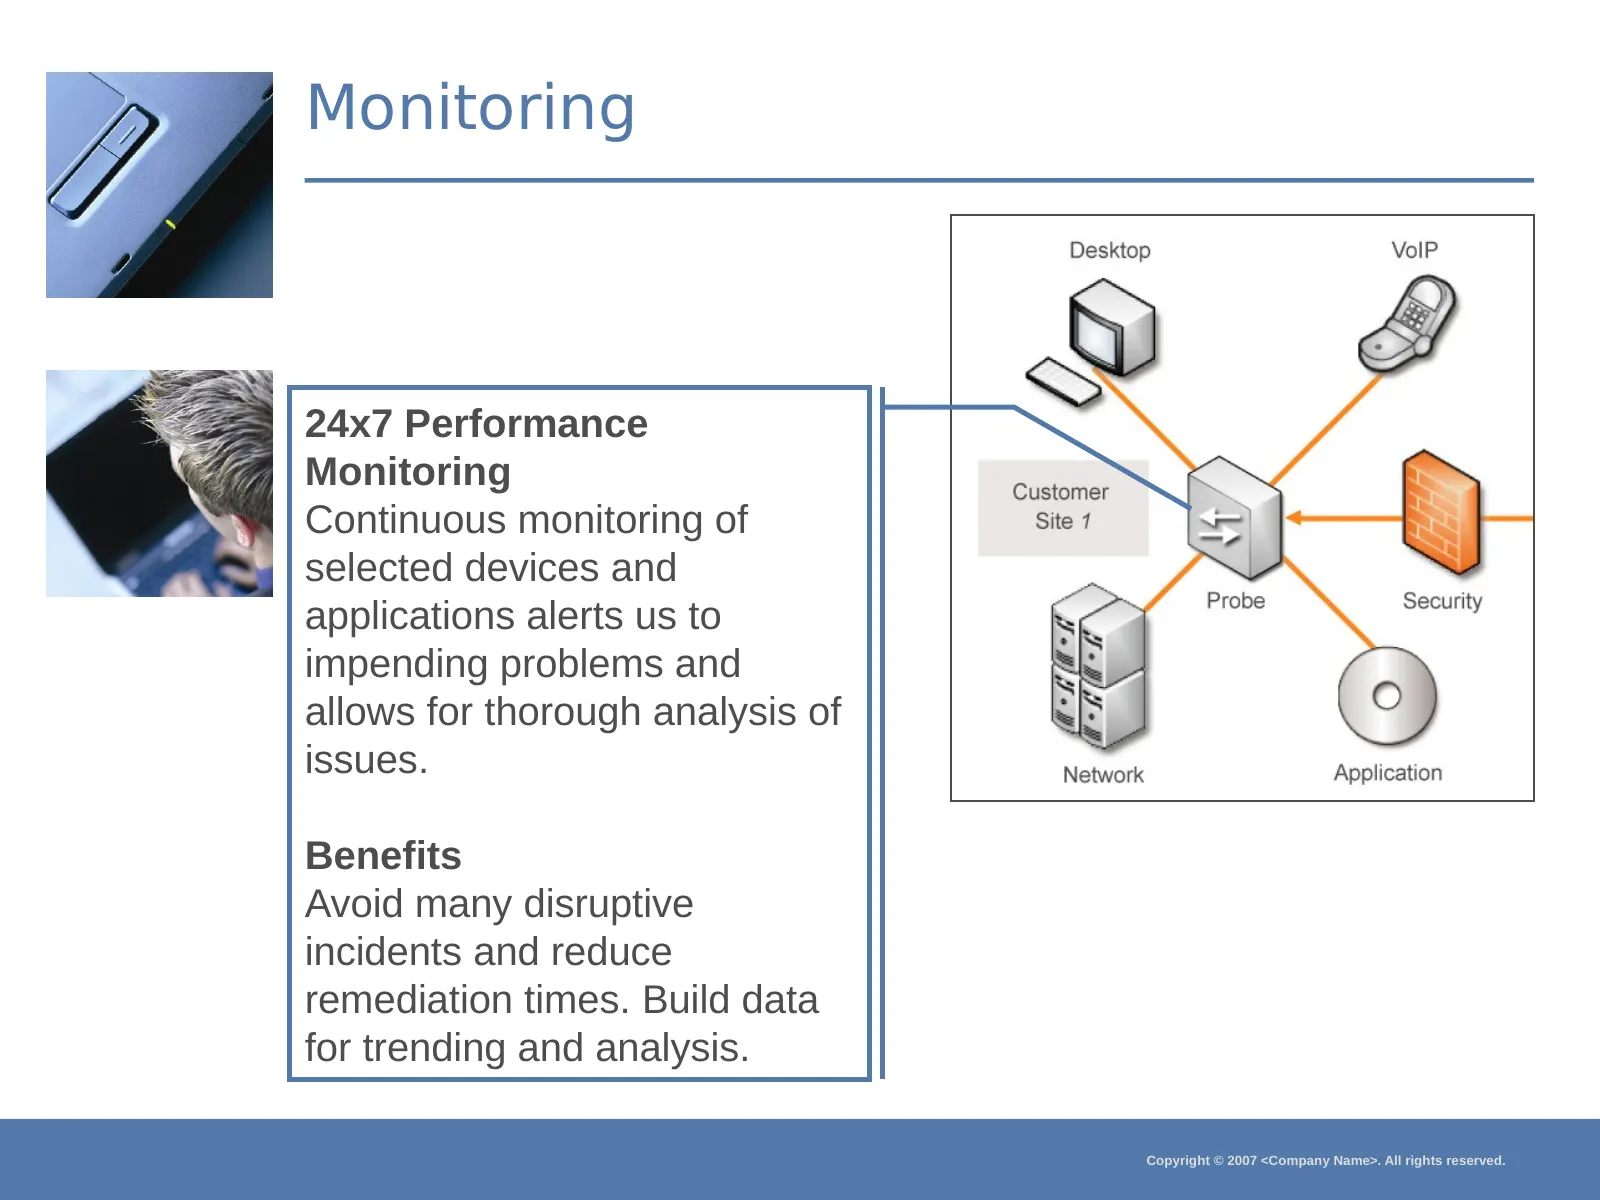
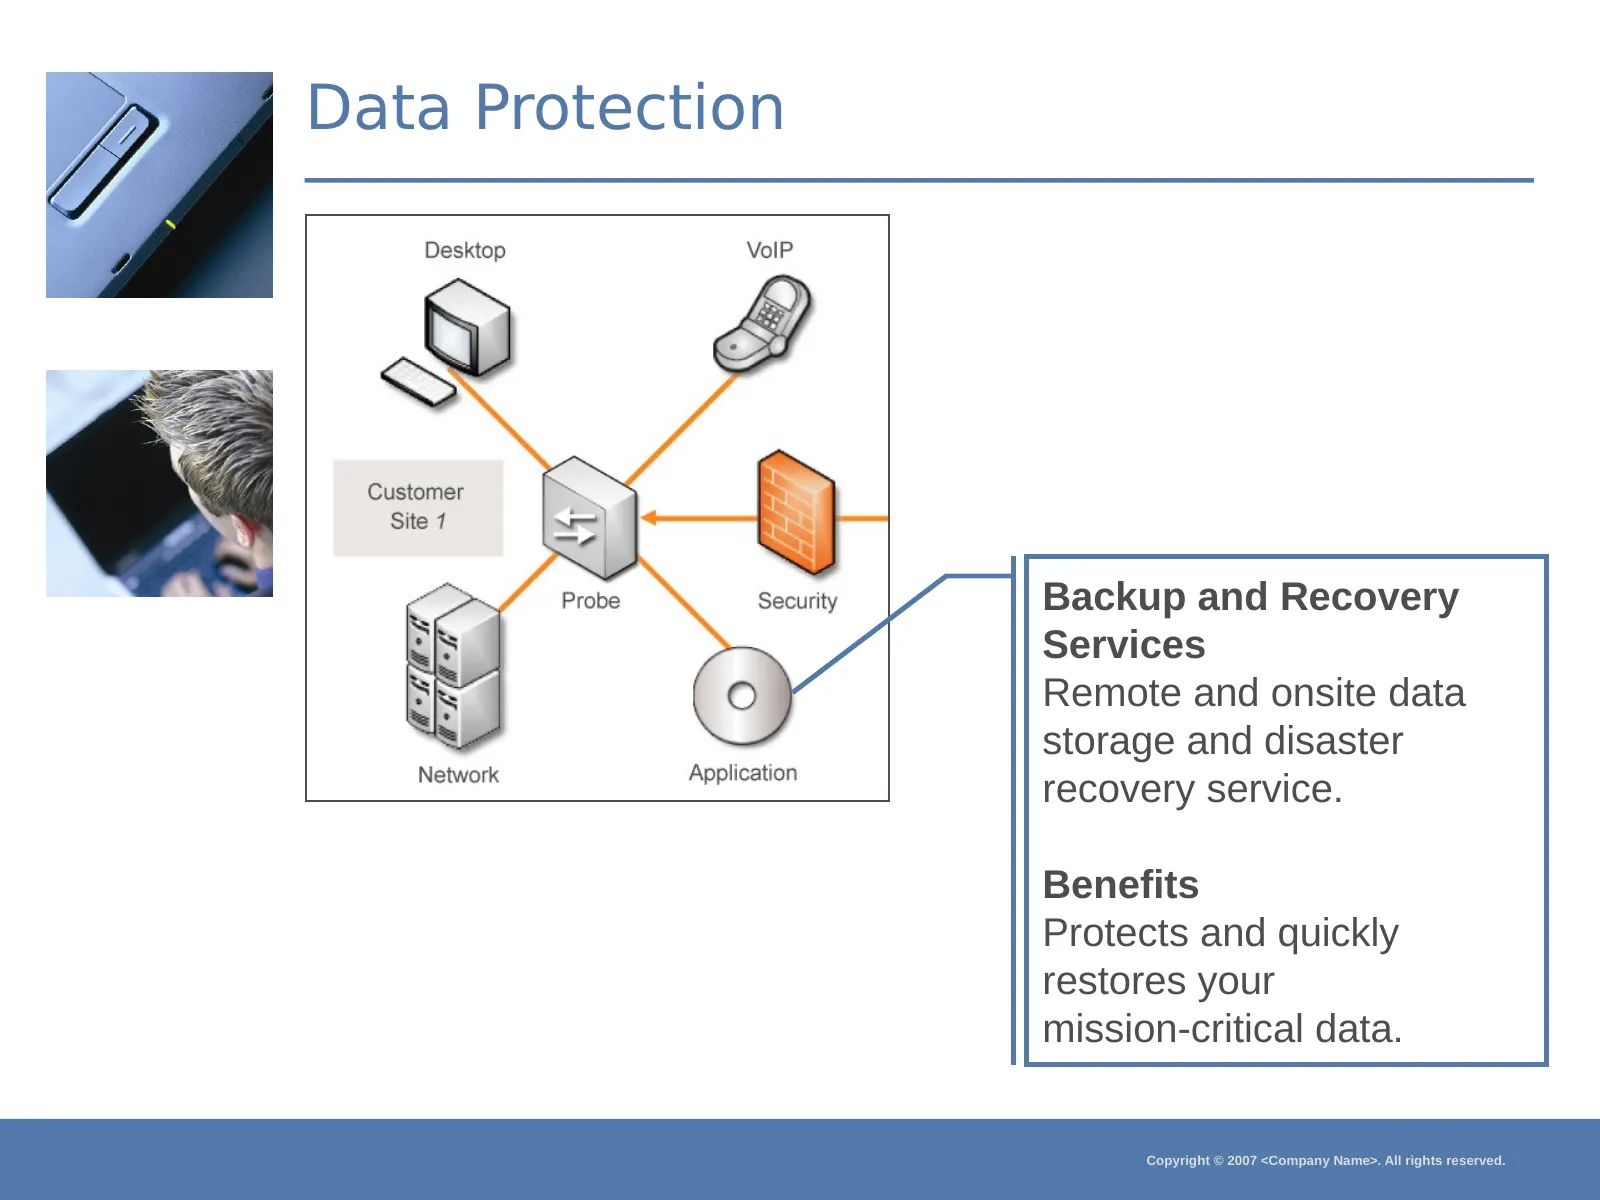
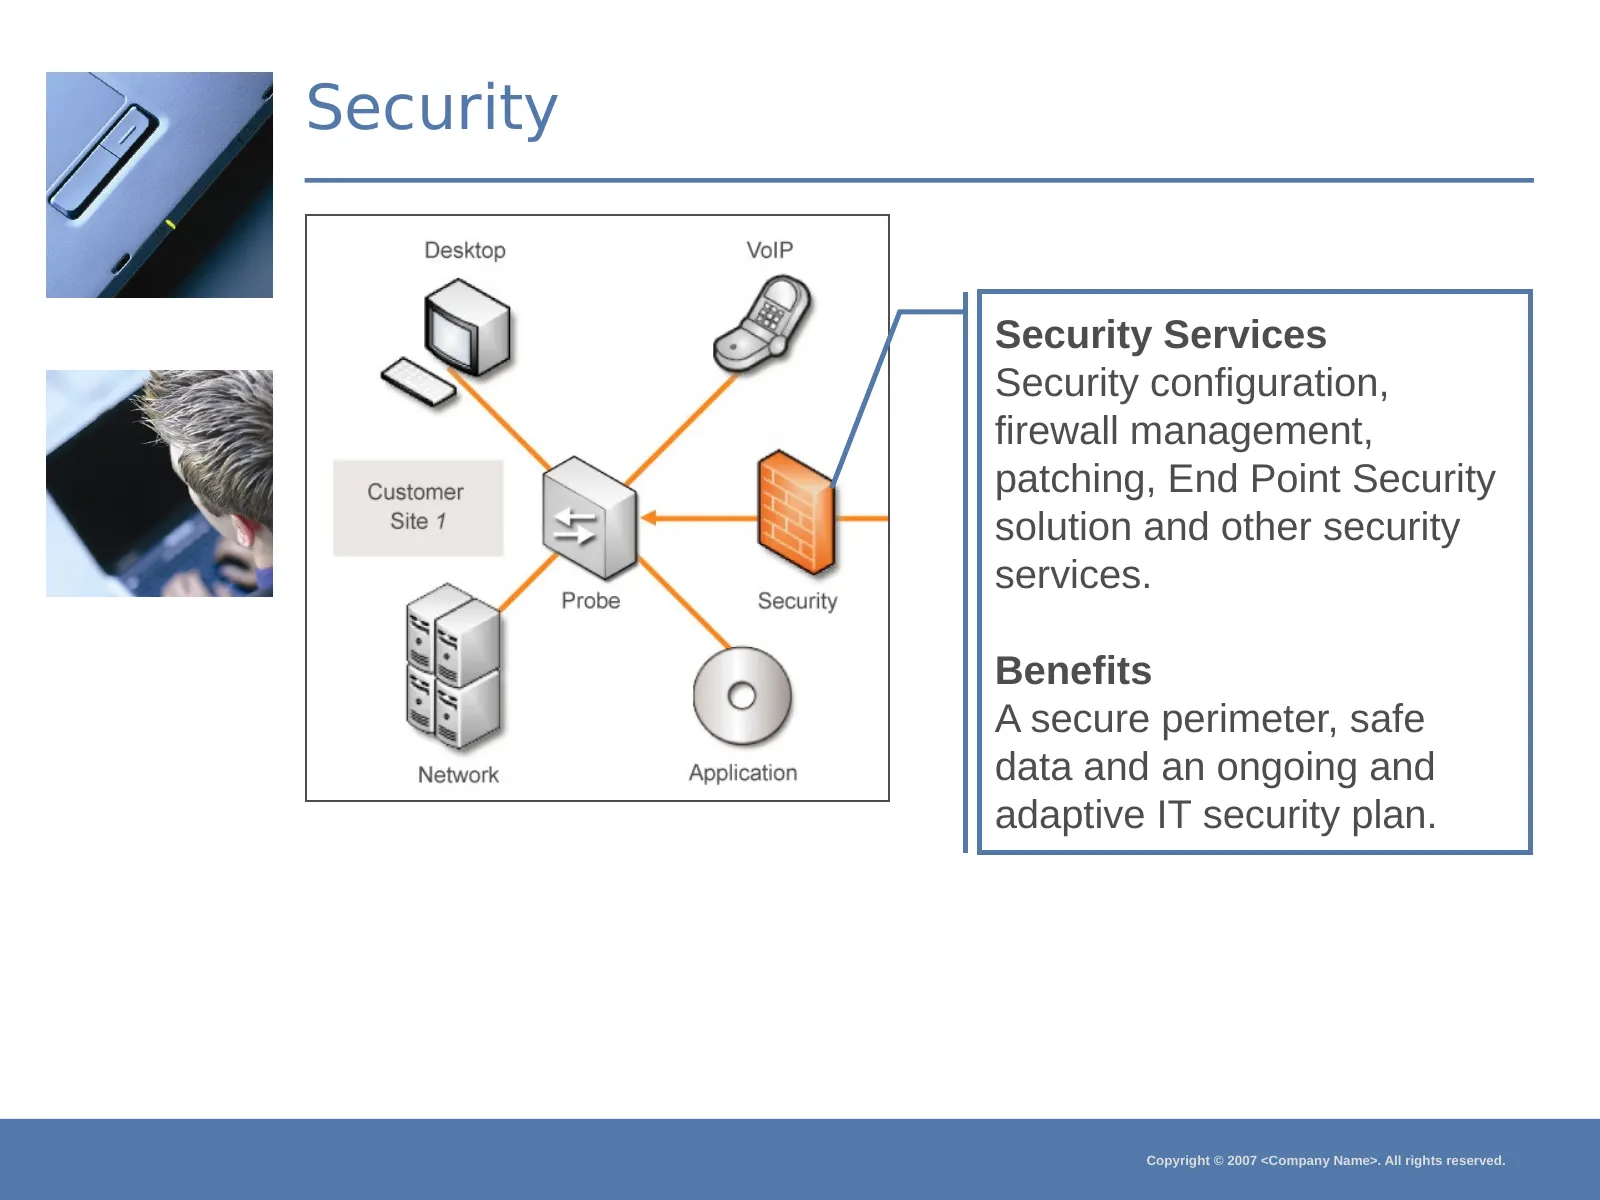
How It Works – Services Offered Customer Network Management and Monitoring: Network Management Services • Network Support (LAN,WAN,VPN) • Server maintenance • Monitoring devices and applications for performance, predictive failure and trending • End Point Security services • Backup monitoring • Perf
Slide 13: Preventative Maintenance
Preventative Maintenance Regular Maintenance Scheduled maintenance activities on servers. Can also include desktops as well as other devices and applications. Benefits Fewer downtime incidents, greater stability and reduced security risks. Copyright © 2007 <Company Name>. All rights reserved.
Slide 14: Monitoring
Monitoring 24x7 Performance Monitoring Continuous monitoring of selected devices and applications alerts us to impending problems and allows for thorough analysis of issues. Benefits Avoid many disruptive incidents and reduce remediation times. Build data for trending and analysis. Copyright © 2007
Slide 15: Data Protection
Data Protection Backup and Recovery Services Remote and onsite data storage and disaster recovery service. Benefits Protects and quickly restores your mission-critical data. Copyright © 2007 <Company Name>. All rights reserved.
Slide 16: Security
Security Security Services Security configuration, firewall management, patching, End Point Security solution and other security services. Benefits A secure perimeter, safe data and an ongoing and adaptive IT security plan. Copyright © 2007 <Company Name>. All rights reserved.
Slide 17: Optional Desktop Management
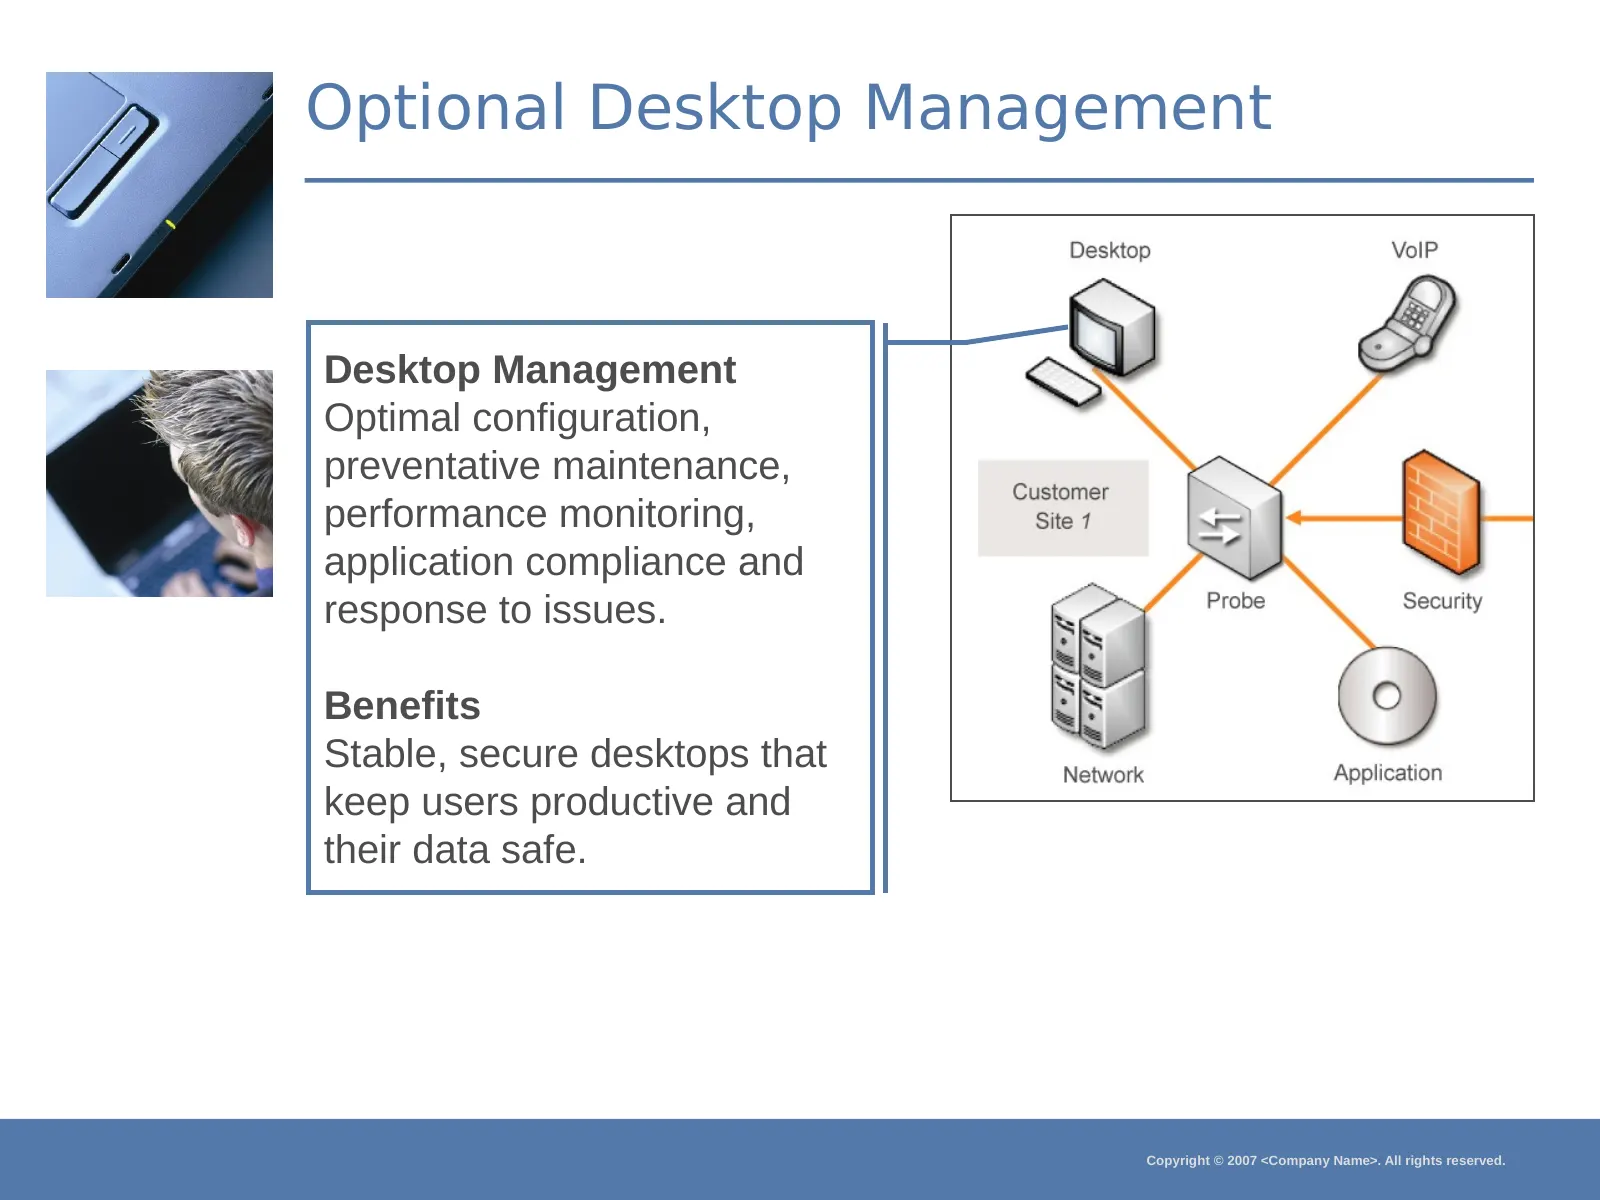
Optional Desktop Management Desktop Management Optimal configuration, preventative maintenance, performance monitoring, application compliance and response to issues. Benefits Stable, secure desktops that keep users productive and their data safe. Copyright © 2007 <Company Name>. All rights reserved
Slide 18: Outsourced CIO and Reporting
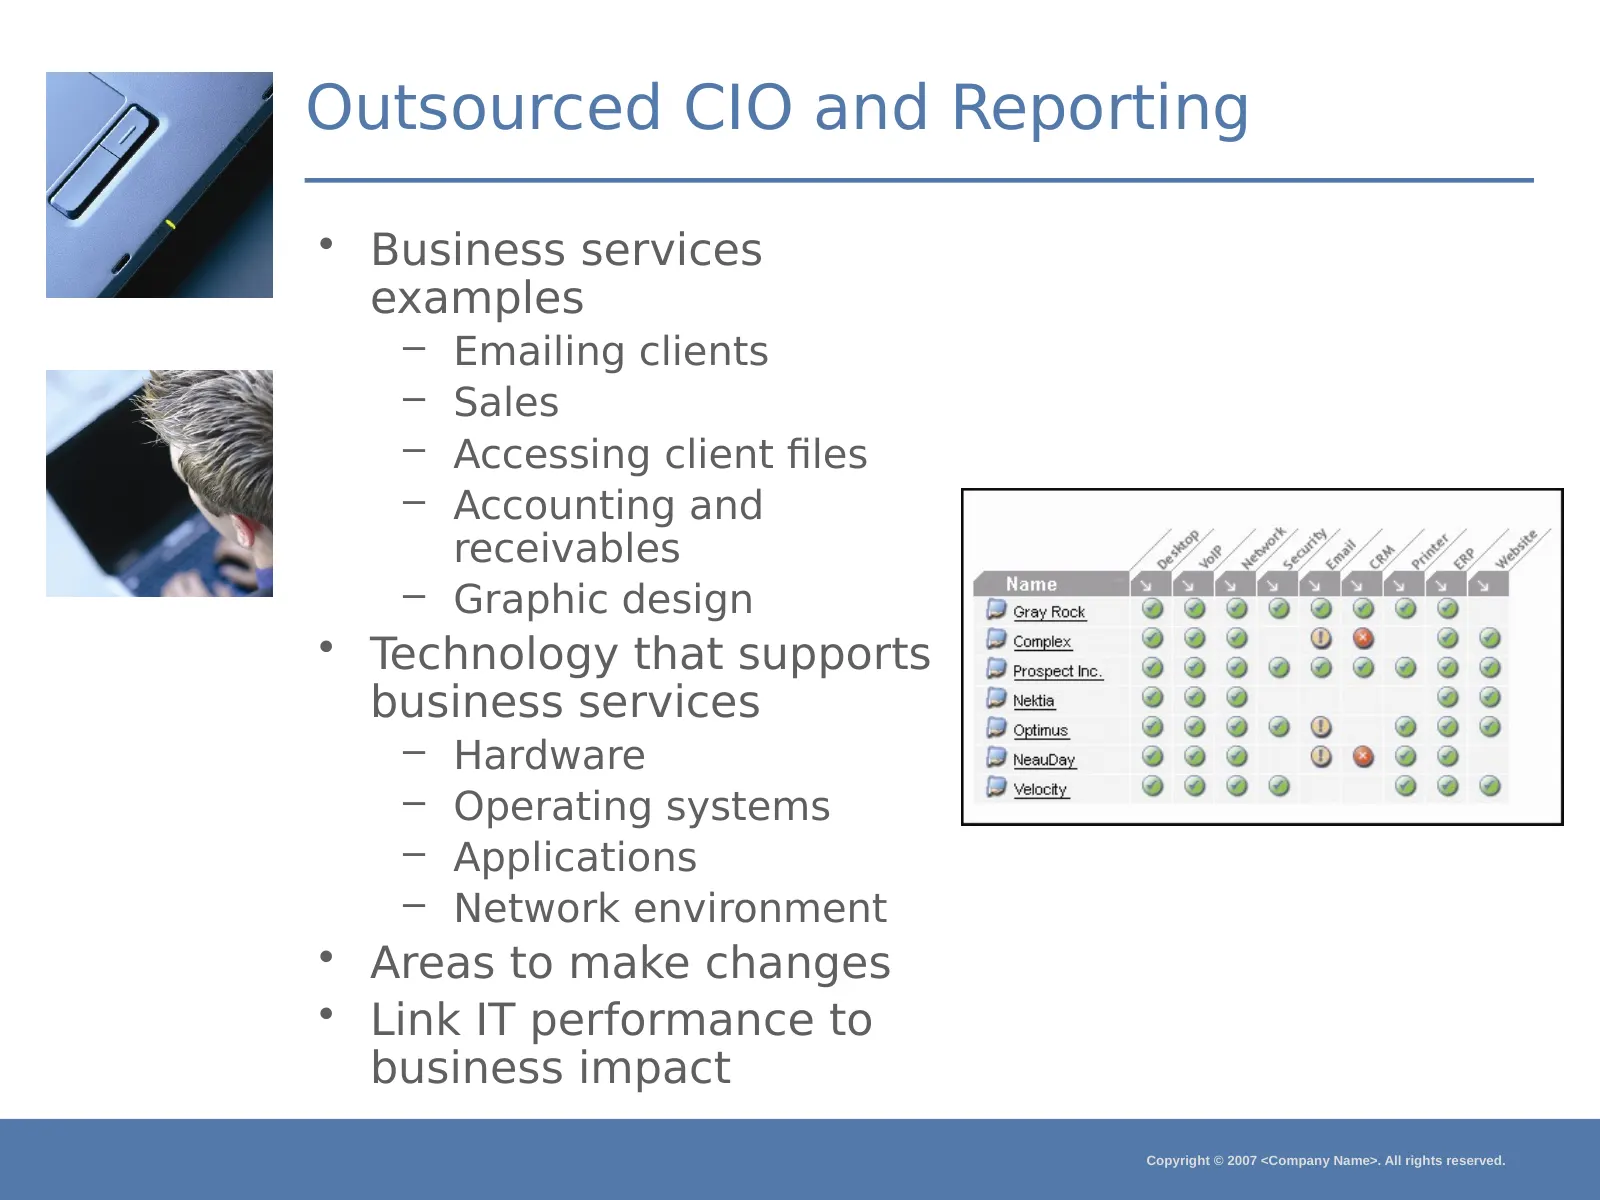
Outsourced CIO and Reporting • Business services examples – Emailing clients – Sales – Accessing client files – Accounting and receivables – Graphic design • Technology that supports business services – Hardware – Operating systems – Applications – Network environment • Areas to make changes • Link
Slide 19: Can you afford not to?
Can you afford not to? • Increase – System uptime and performance – Staff productivity – Cost predictability – Alignment of IT to business needs – Transparency into IT performance • Reduce – Security and compliance exposure – Risk of catastrophic data loss – Emergency IT issues – Downtime and lost p
Slide 20: Next Steps
Next Steps • Technology and business IT assessment • Solution proposal Copyright © 2007 <Company Name>. All rights reserved.
Slide 21: Thank you
Program Name Logo Thank you Copyright © 2007 <Company Name>. All rights reserved.
Source: Internet Archive copy of secure.n-able.com
More decks from N-able, Inc.
 Q3 2026 Earnings Presentation32 slides · Nov 5, 2026
 Q2 2026 Earnings Presentation32 slides · Aug 10, 2026
 Q1 2026 Earnings Presentation32 slides · May 7, 2026
 Q4 2025 Earnings Presentation34 slides · Feb 19, 2026
 Q2 2025 Earnings Presentation34 slides · Aug 7, 2025
 Investor Day (March 2025)84 slides · Mar 13, 2025