N-able, Inc. · NYSE:NABL
N-able — Q3 2026 Earnings Presentation
32 slides from N-able's earnings presentation, Nov 5, 2026

Slide 1: Investor Presentation
Investor Presentation November 2026 1 © 2026 N-able Solutions ULC and N-able Technologies Ltd. All rights reserved.
Slide 2: Disclaimers
Disclaimers General This presentation and the accompanying oral presentation do not constitute an offer or invitation for the sale or purchase of securities and has been prepared solely for informational purposes. The information contained in this presentation (the “Presentation”) has been prepared
Slide 3: Disclaimers continued
Disclaimers continued Forward-Looking Statements This presentation contains “forward-looking” statements, which are subject to the safe harbor provisions of the Private Securities Litigation Reform Act of 1995, including statements regarding our financial outlook for the fourth quarter and full-year
Slide 4: Protecting Businesses from Evolving Cyberthreats
Protecting Businesses from Evolving Cyberthreats 4 © 2026 N-able Solutions ULC and N-able Technologies Ltd. All rights reserved.
Slide 5: N-able at a Glance
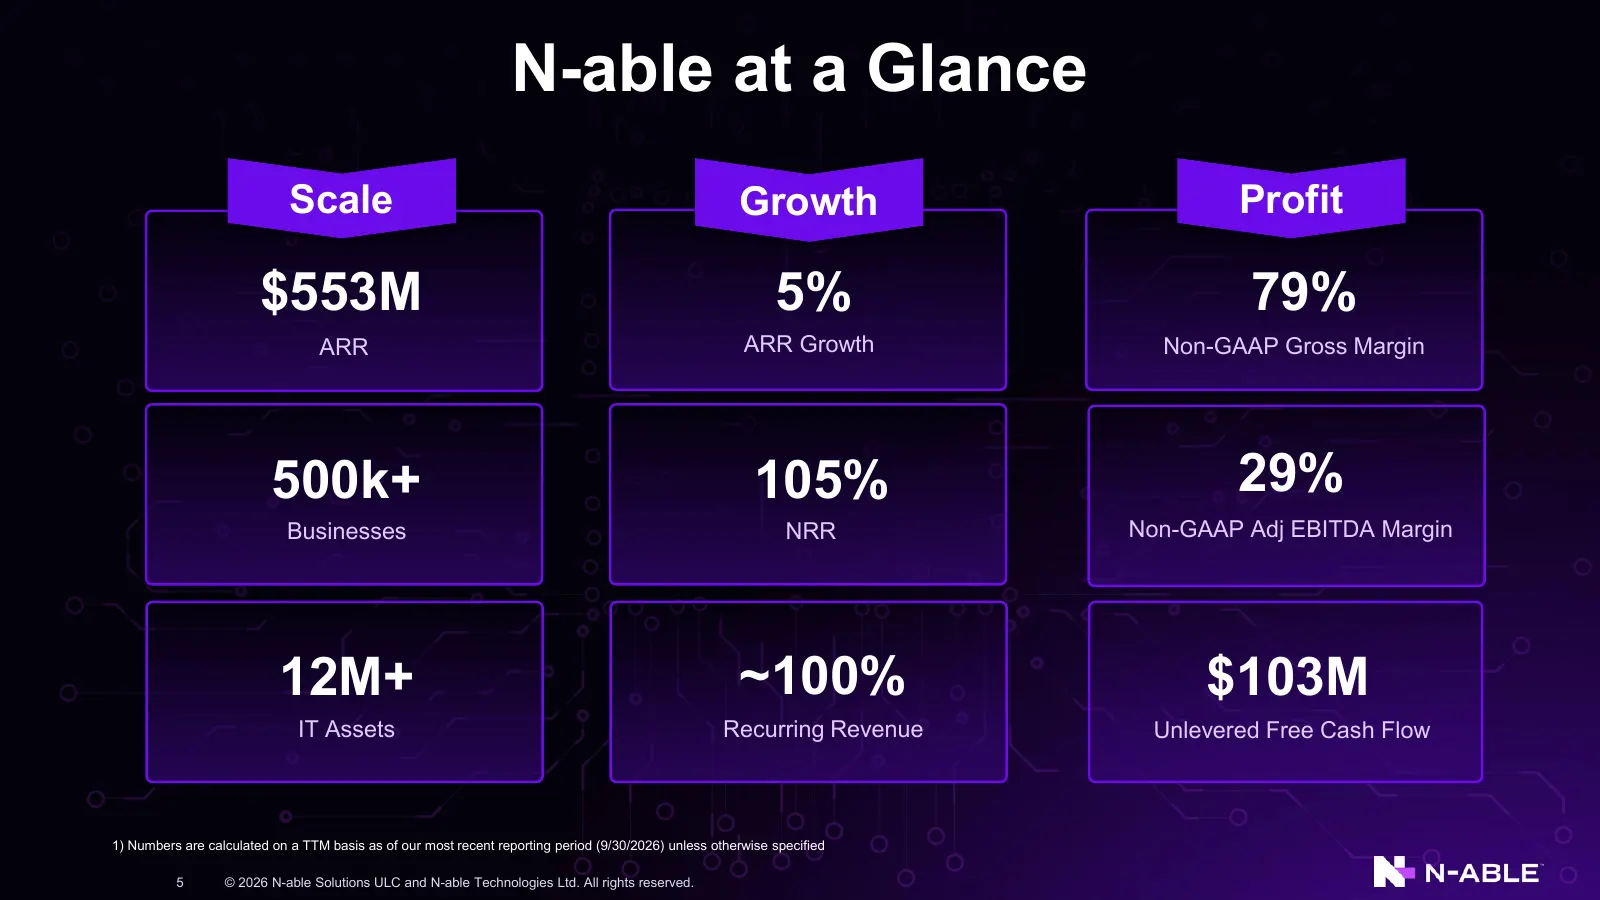
N-able at a Glance Scale Growth Profit $553M 5% 79% ARR ARR Growth Non-GAAP Gross Margin 500k+ 105% 29% Businesses NRR Non-GAAP Adj EBITDA Margin 12M+ ~100% $103M IT Assets Recurring Revenue Unlevered Free Cash Flow 1) Numbers are calculated on a TTM basis as of our most recent reporting period (9/3
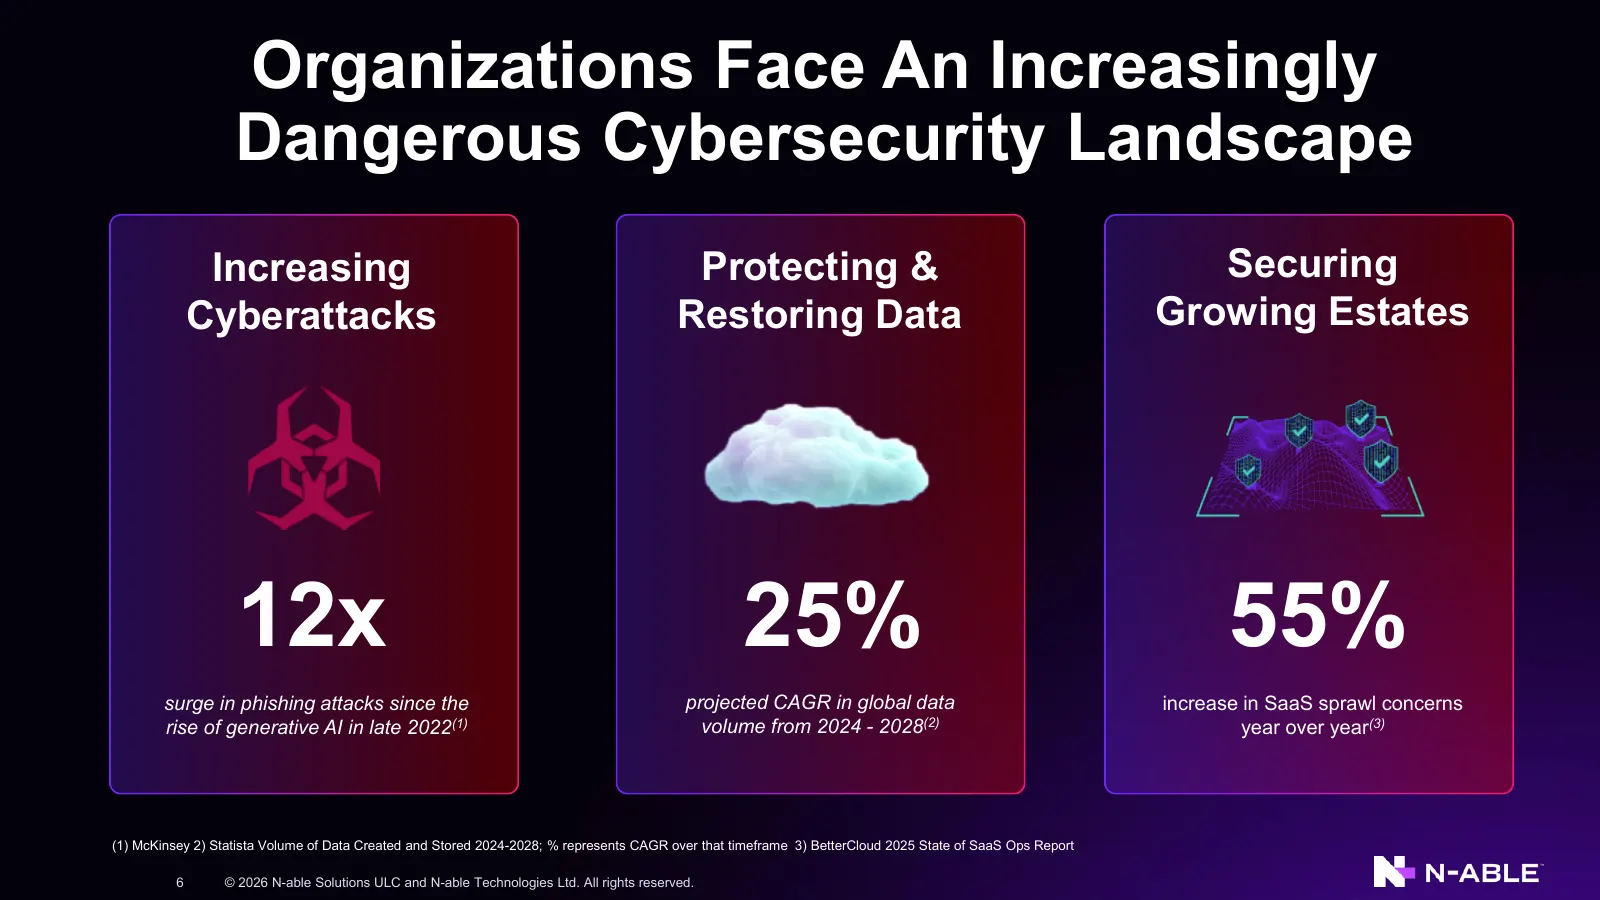
Slide 6: Organizations Face An Increasingly Dangerous Cybersecurity Landscape
Organizations Face An Increasingly Dangerous Cybersecurity Landscape Increasing Protecting & Securing Cyberattacks Restoring Data Growing Estates 12x 25% 55% surge in phishing attacks since the projected CAGR in global data increase in SaaS sprawl concerns rise of generative AI in late 2022(1) volum
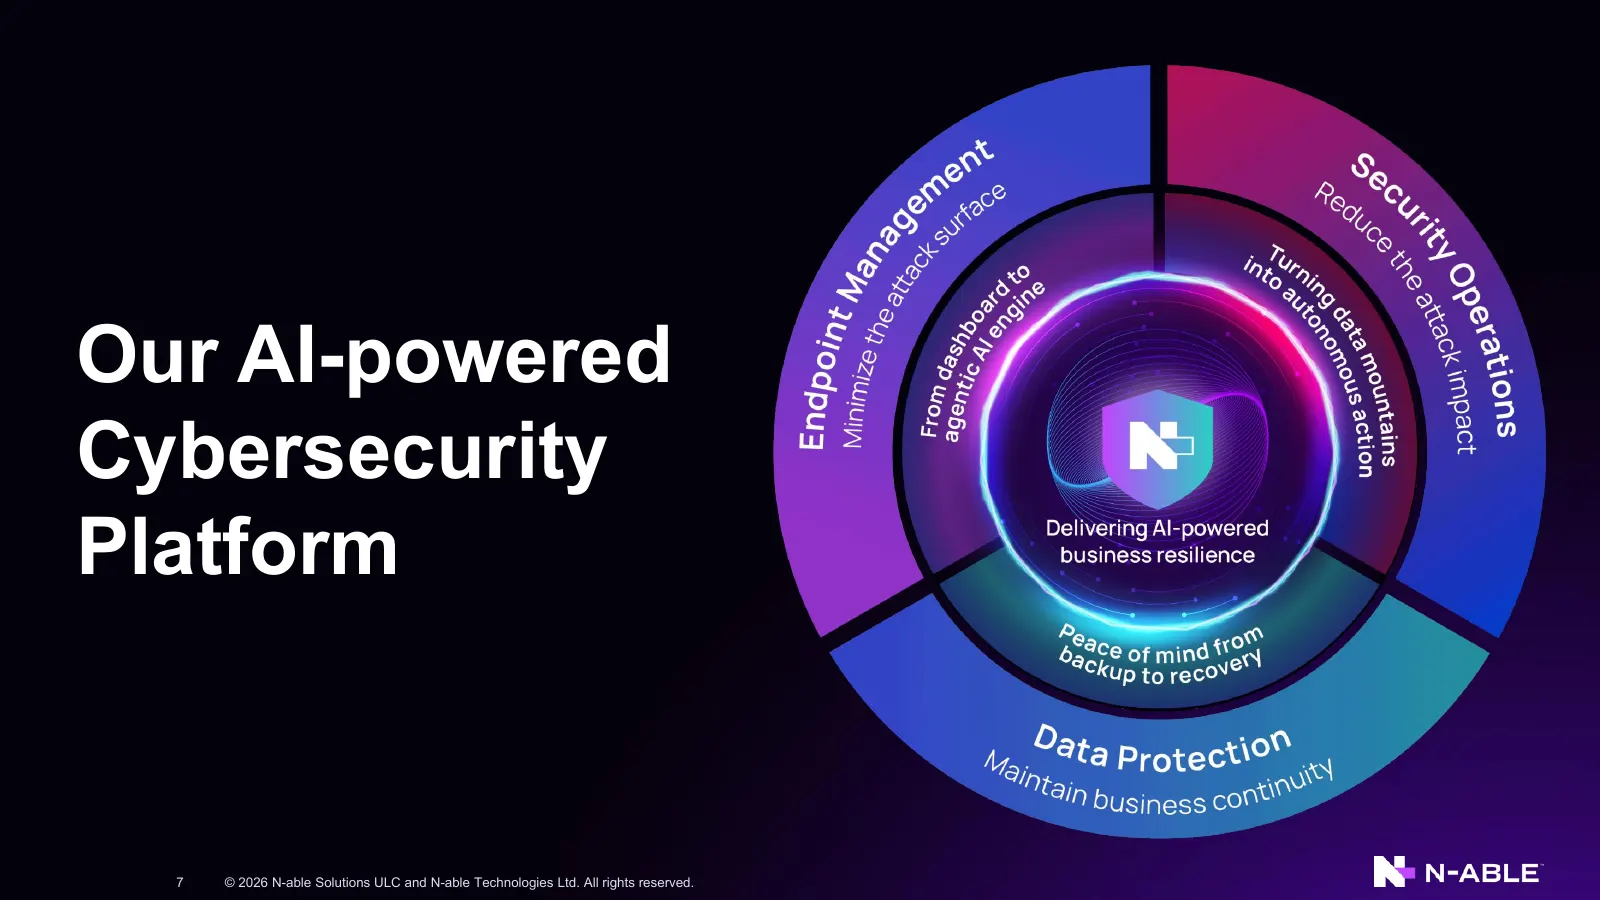
Slide 7: Our AI-powered Cybersecurity Platform
Our AI-powered Cybersecurity Platform 7 © 2026 N-able Solutions ULC and N-able Technologies Ltd. All rights reserved.
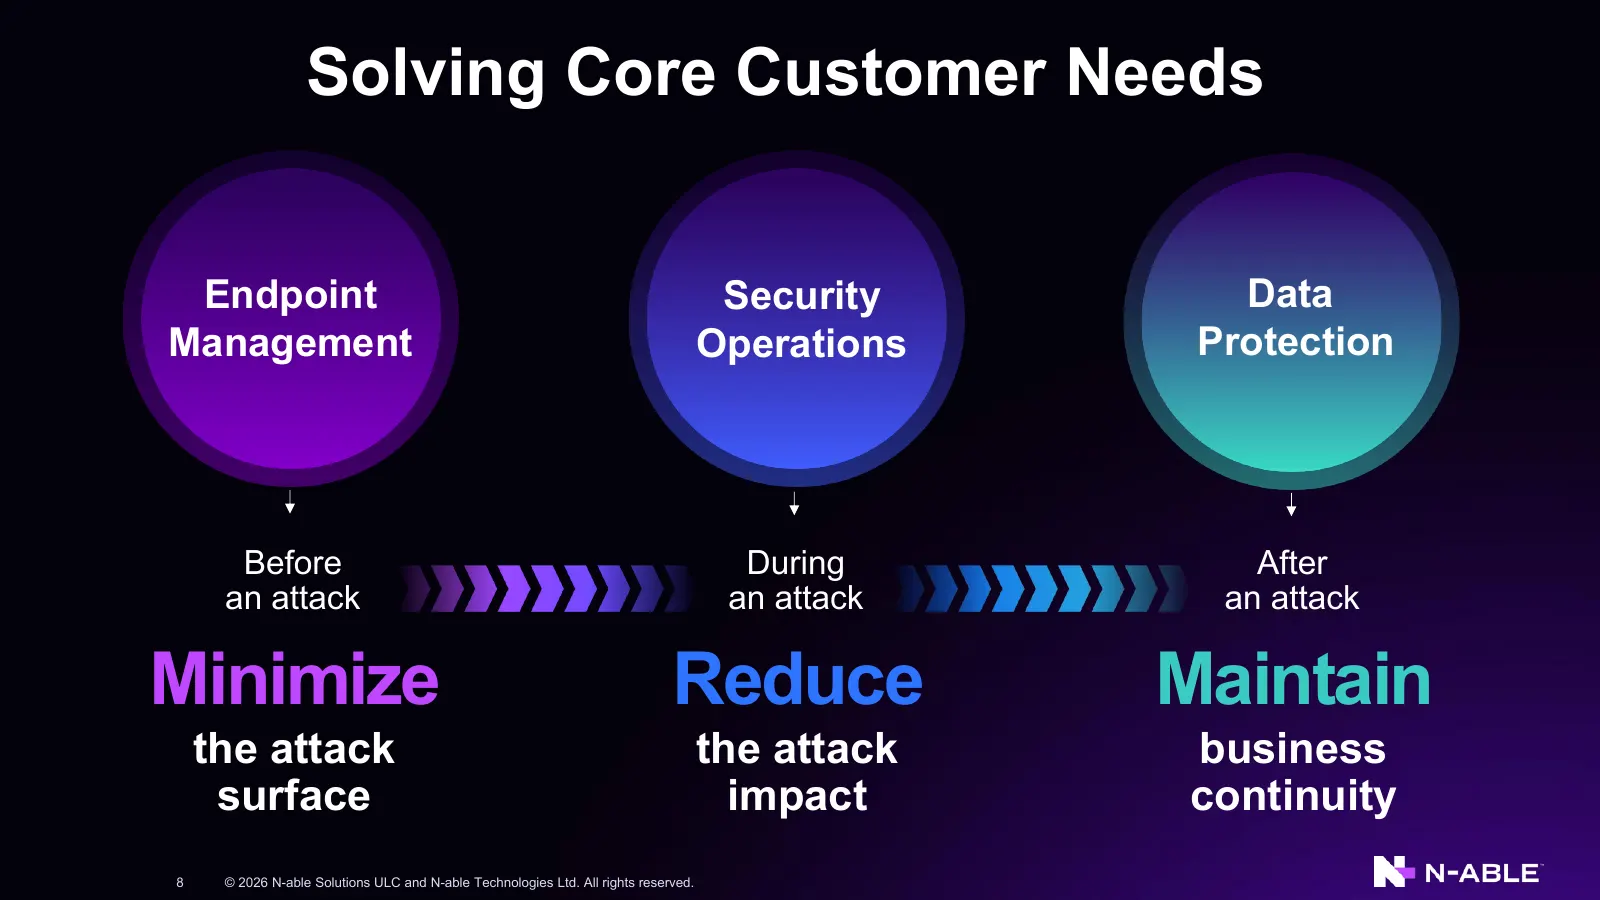
Slide 8: Solving Core Customer Needs
Solving Core Customer Needs Endpoint Security Data Management Operations Protection Before During After an attack an attack an attack Minimize Reduce Maintain the attack the attack business surface impact continuity 8 © 2026 N-able Solutions ULC and N-able Technologies Ltd. All rights reserved.
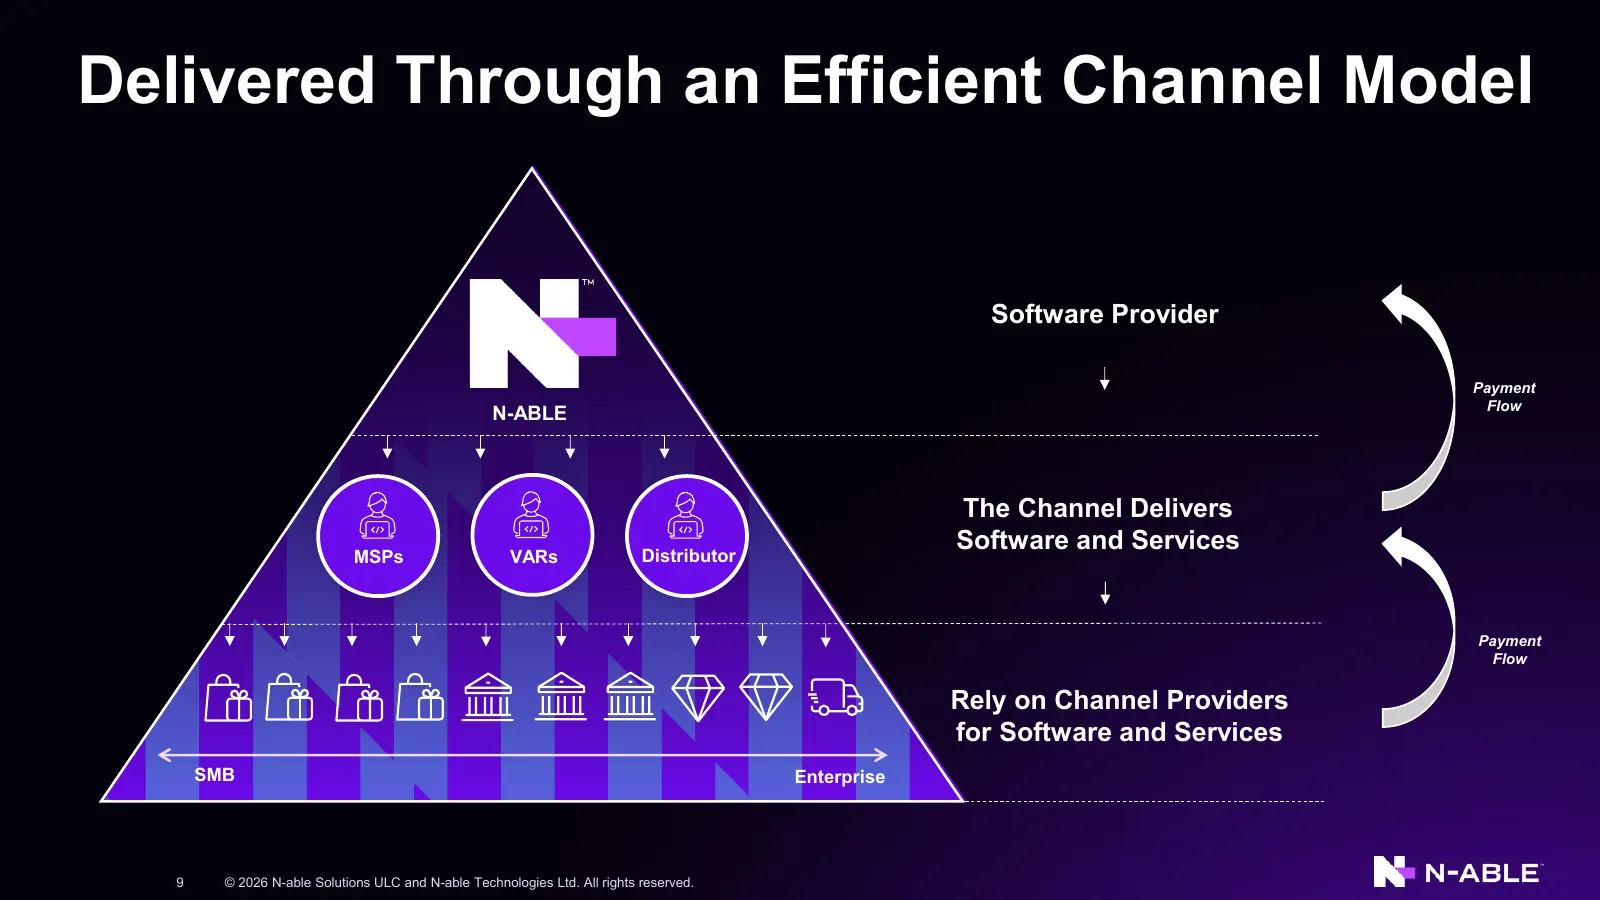
Slide 9: Delivered Through an Efficient Channel Model
Delivered Through an Efficient Channel Model Software Provider Payment Flow N-ABLE The Channel Delivers Software and Services MSPs VARs Distributor Payment Flow Rely on Channel Providers for Software and Services SMB Enterprise 9 © 2026 N-able Solutions ULC and N-able Technologies Ltd. All rights re
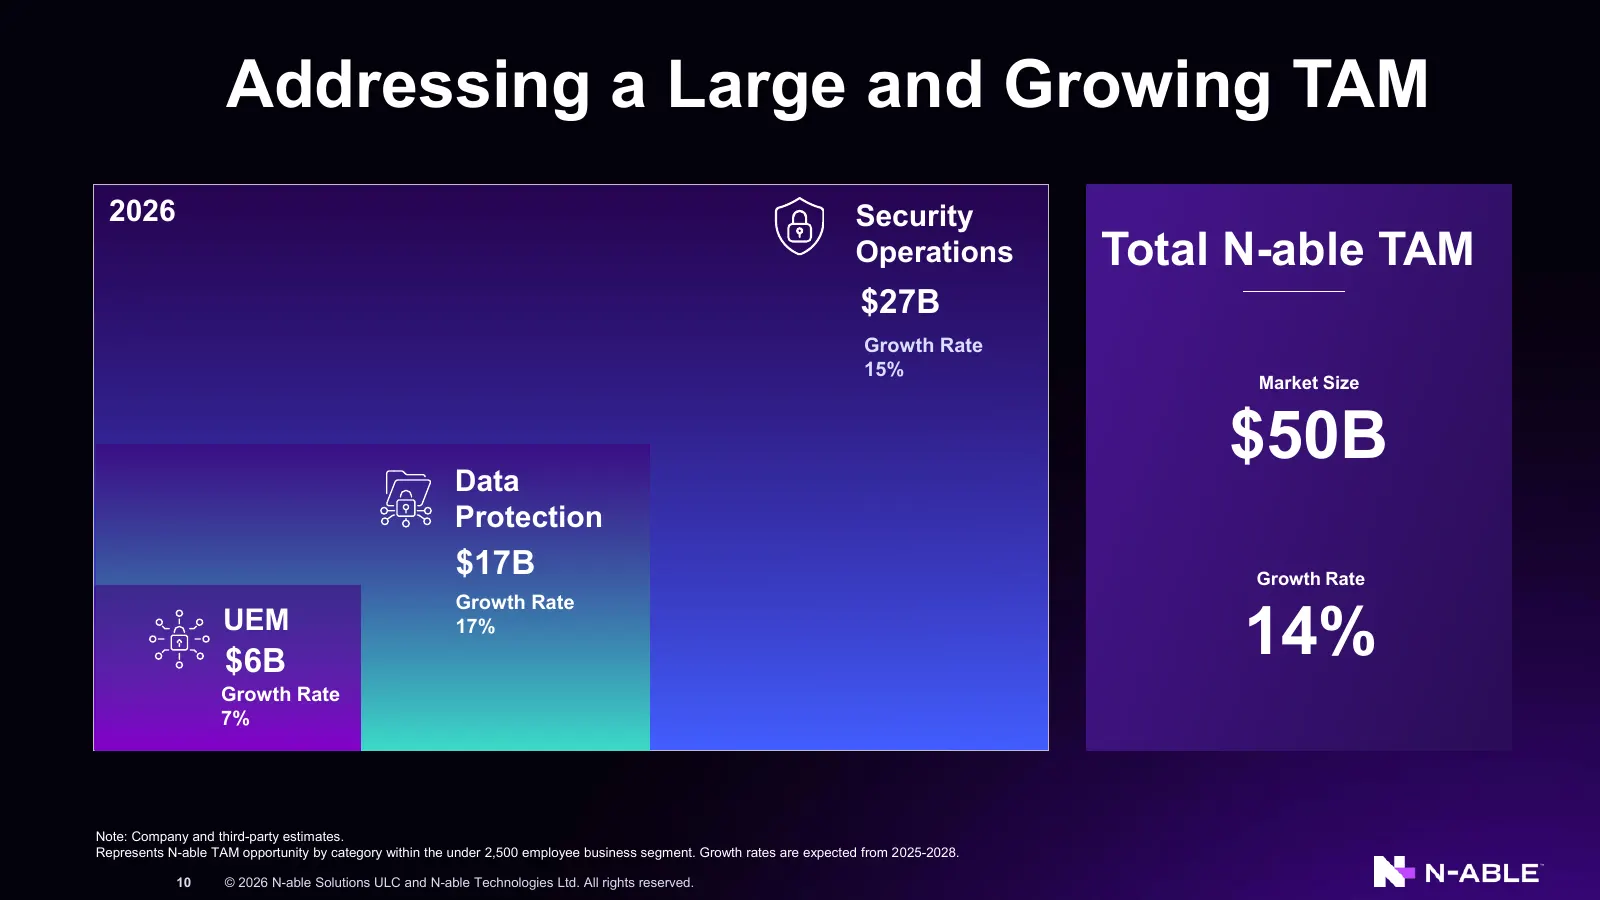
Slide 10: Addressing a Large and Growing TAM
Addressing a Large and Growing TAM 2026 Security Operations Total N-able TAM $27B Growth Rate 15% Market Size Data $50B Protection $17B Growth Rate Growth Rate UEM $6B 17% 14% Growth Rate 7% Note: Company and third-party estimates. Represents N-able TAM opportunity by category within the under 2,500
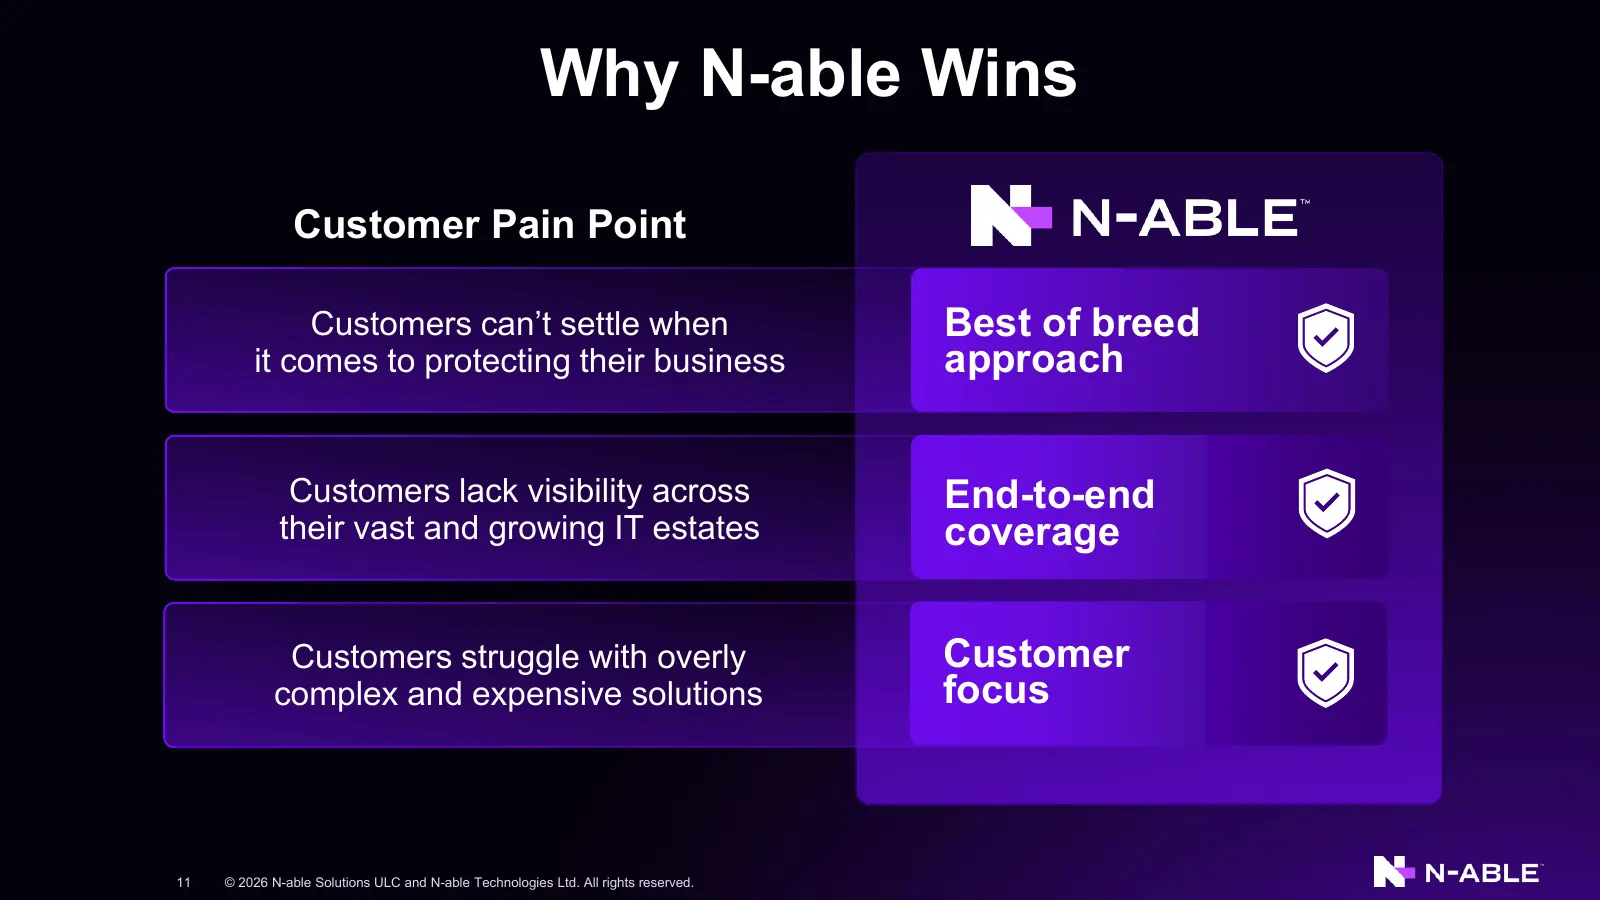
Slide 11: Why N-able Wins
Why N-able Wins Customer Pain Point Customers can’t settle when Best of breed it comes to protecting their business approach Customers lack visibility across End-to-end their vast and growing IT estates coverage Customers struggle with overly Customer complex and expensive solutions focus 11 © 2026

Slide 12: Product Pillars
Product Pillars 12 © 2026 N-able Solutions ULC and N-able Technologies Ltd. All rights reserved.
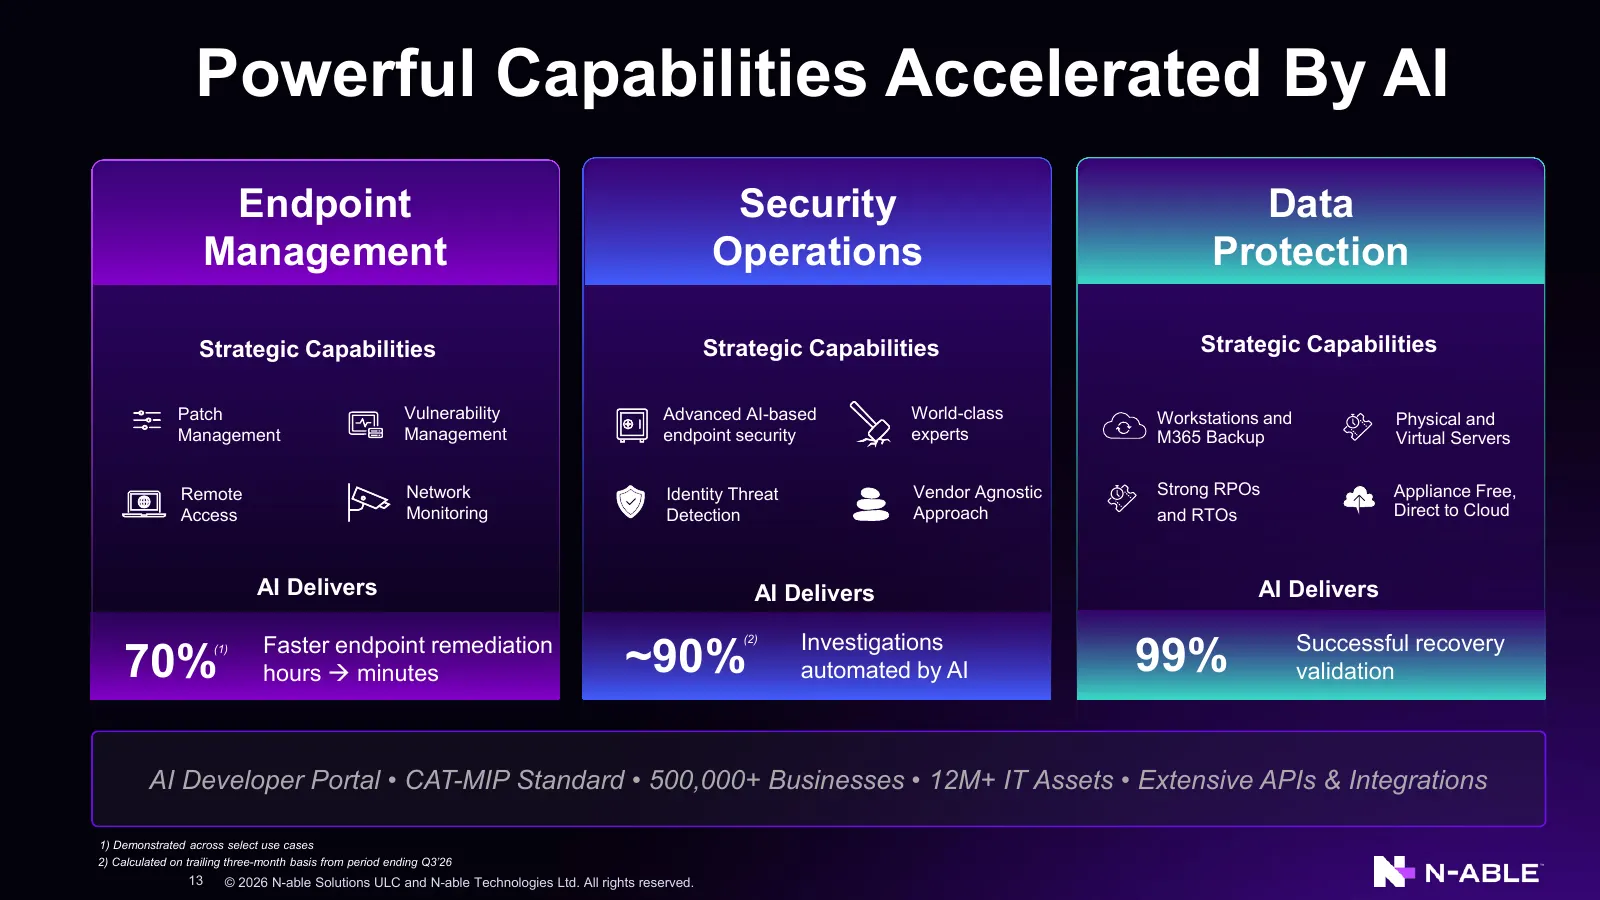
Slide 13: Powerful Capabilities Accelerated By AI
Powerful Capabilities Accelerated By AI Endpoint Security Data Management Operations Protection Strategic Capabilities Strategic Capabilities Strategic Capabilities Patch Vulnerability Advanced AI-based World-class Workstations and Physical and Management Management endpoint security experts M365 Ba
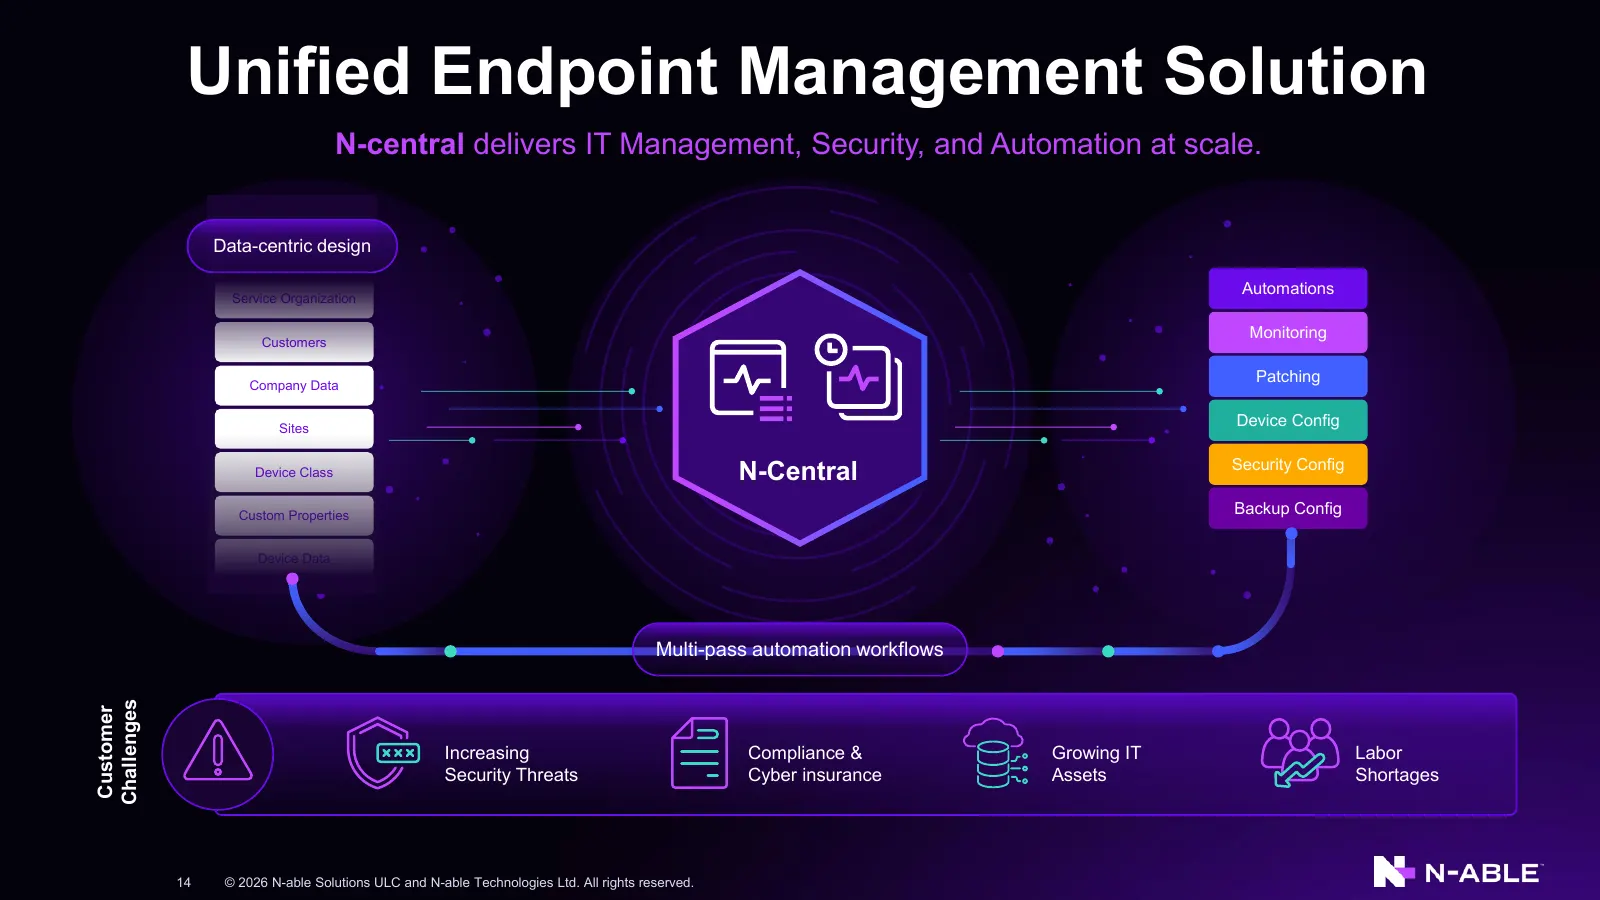
Slide 14: Unified Endpoint Management Solution
Unified Endpoint Management Solution N-central delivers IT Management, Security, and Automation at scale. Data-centric design Automations Service Organization Monitoring Customers Company Data Patching Sites Device Config Security Config Device Class N-Central Custom Properties Backup Config Device
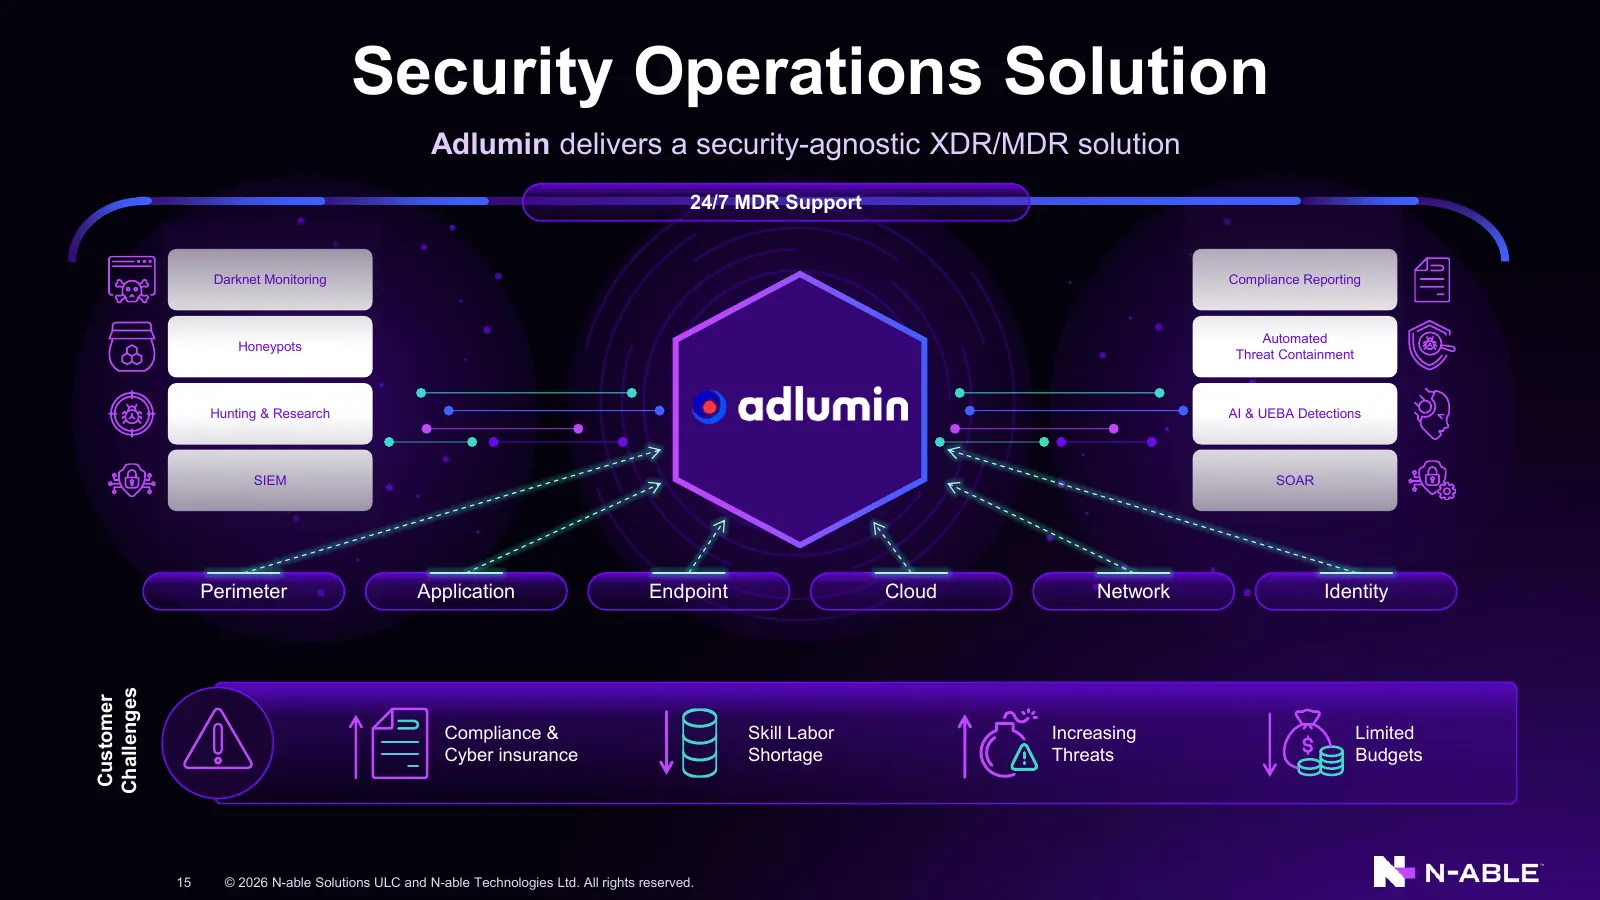
Slide 15: Security Operations Solution
Security Operations Solution Adlumin delivers a security-agnostic XDR/MDR solution 24/7 MDR Support Darknet Monitoring Compliance Reporting Automated Honeypots Threat Containment Hunting & Research AI & UEBA Detections SIEM SOAR Perimeter Application Endpoint Cloud Network Identity Challenges Custom
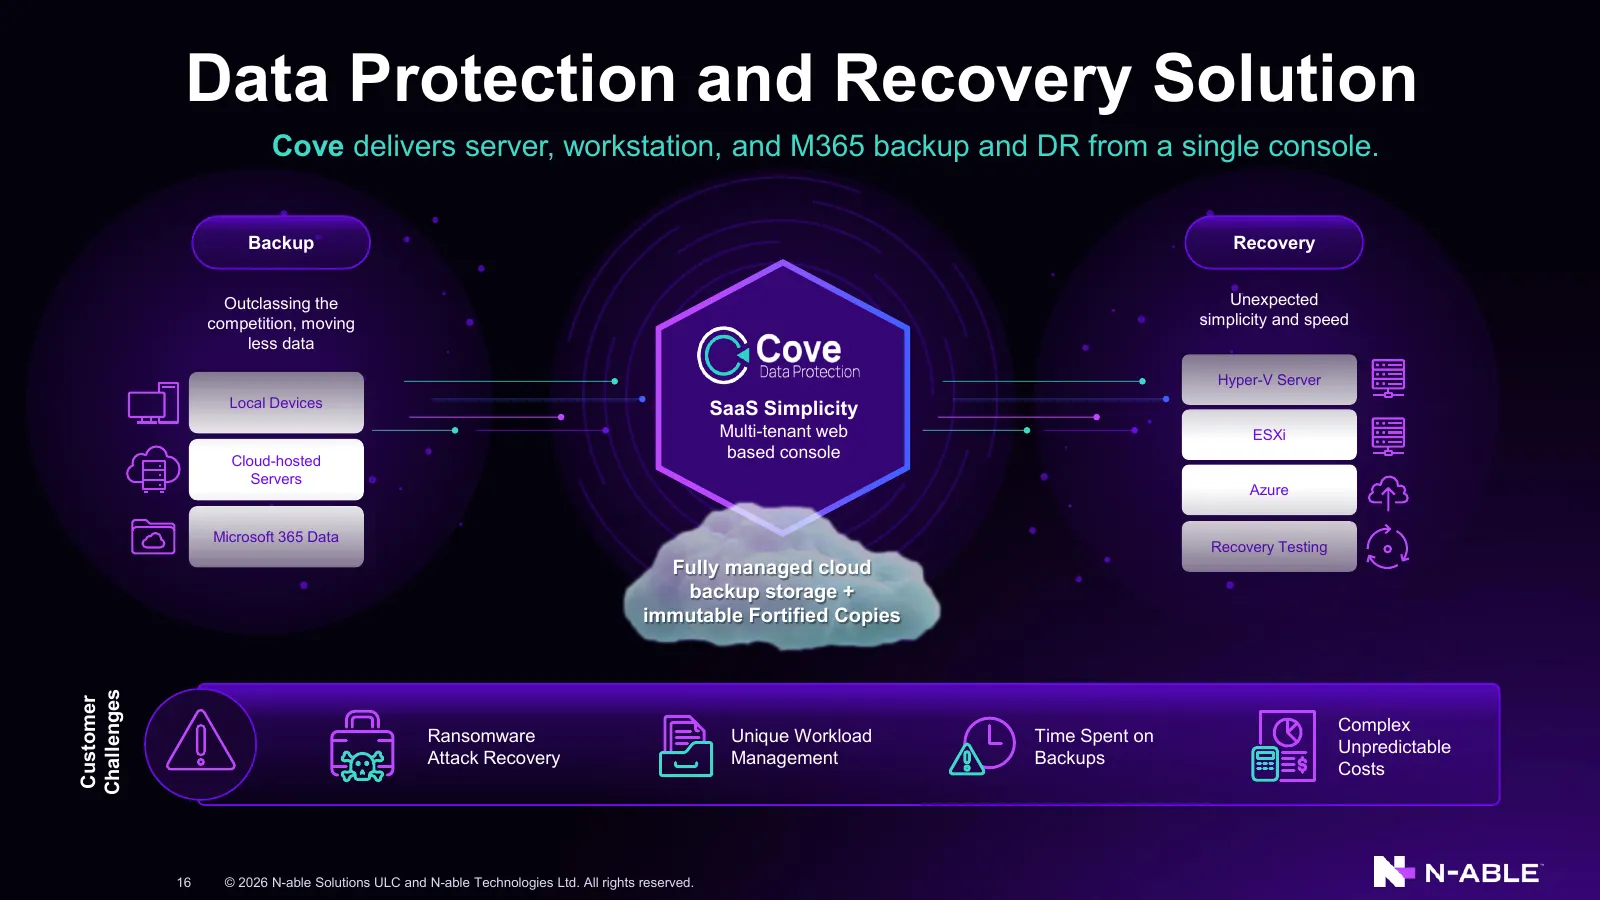
Slide 16: Data Protection and Recovery Solution
Data Protection and Recovery Solution Cove delivers server, workstation, and M365 backup and DR from a single console. Backup Recovery Outclassing the Unexpected competition, moving simplicity and speed less data Hyper-V Server Local Devices SaaS Simplicity Multi-tenant web ESXi Cloud-hosted based c
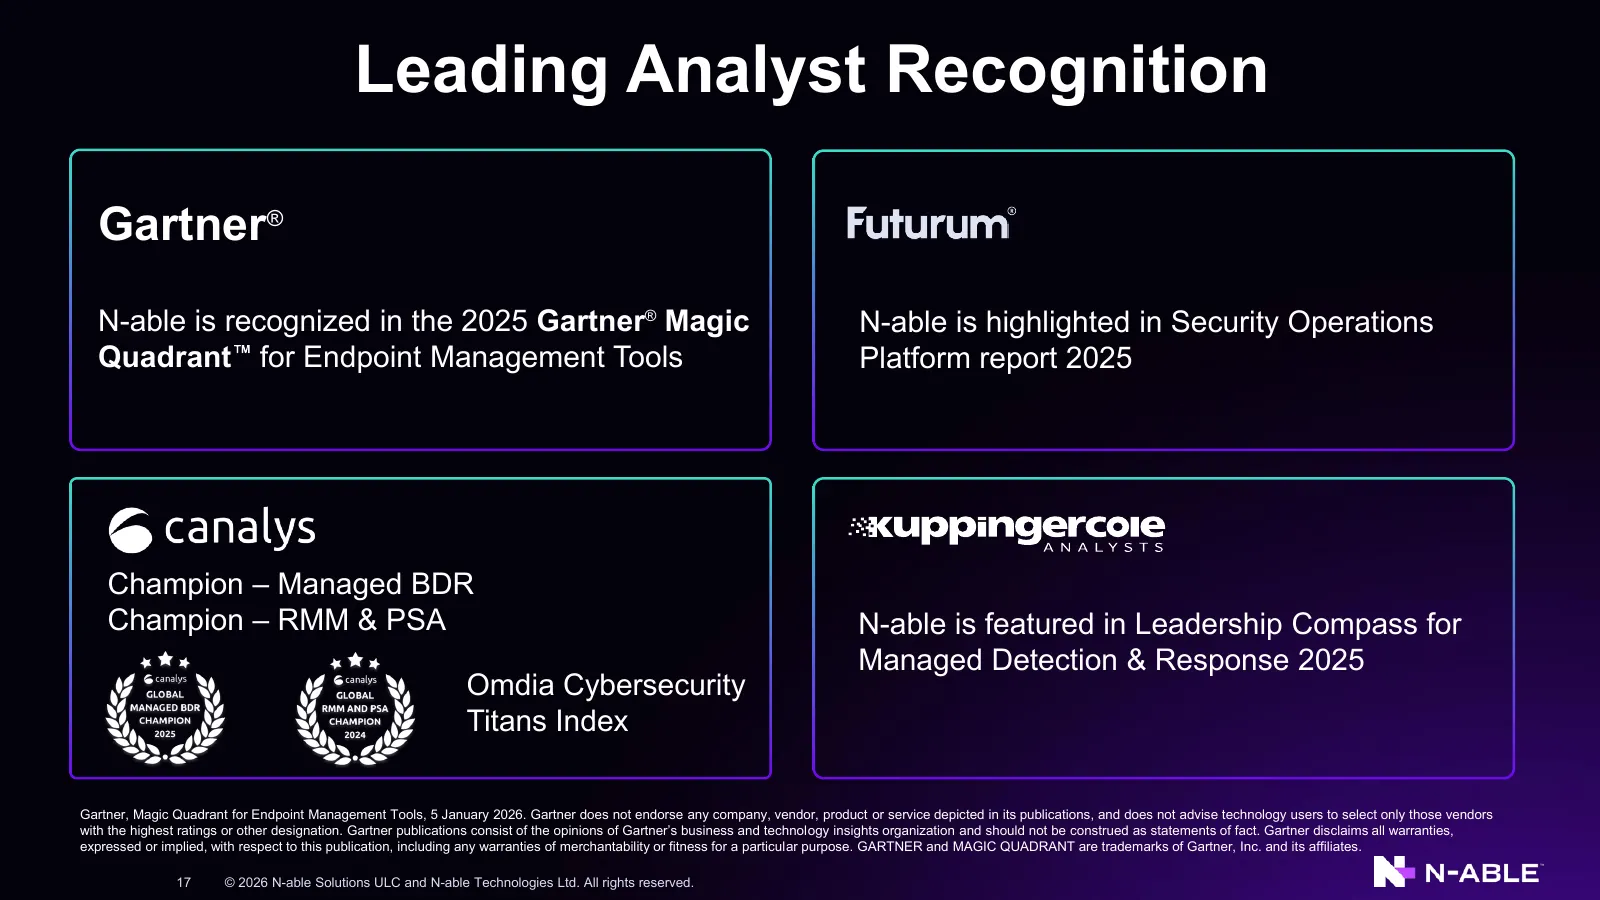
Slide 17: Leading Analyst Recognition
Leading Analyst Recognition Gartner® N-able is recognized in the 2025 Gartner® Magic N-able is highlighted in Security Operations Quadrant for Endpoint Management Tools Platform report 2025 Champion – Managed BDR Champion – RMM & PSA N-able is featured in Leadership Compass for Managed Detection & R
Slide 18: Financial Overview
Financial Overview 18 © 2026 N-able Solutions ULC and N-able Technologies Ltd. All rights reserved.
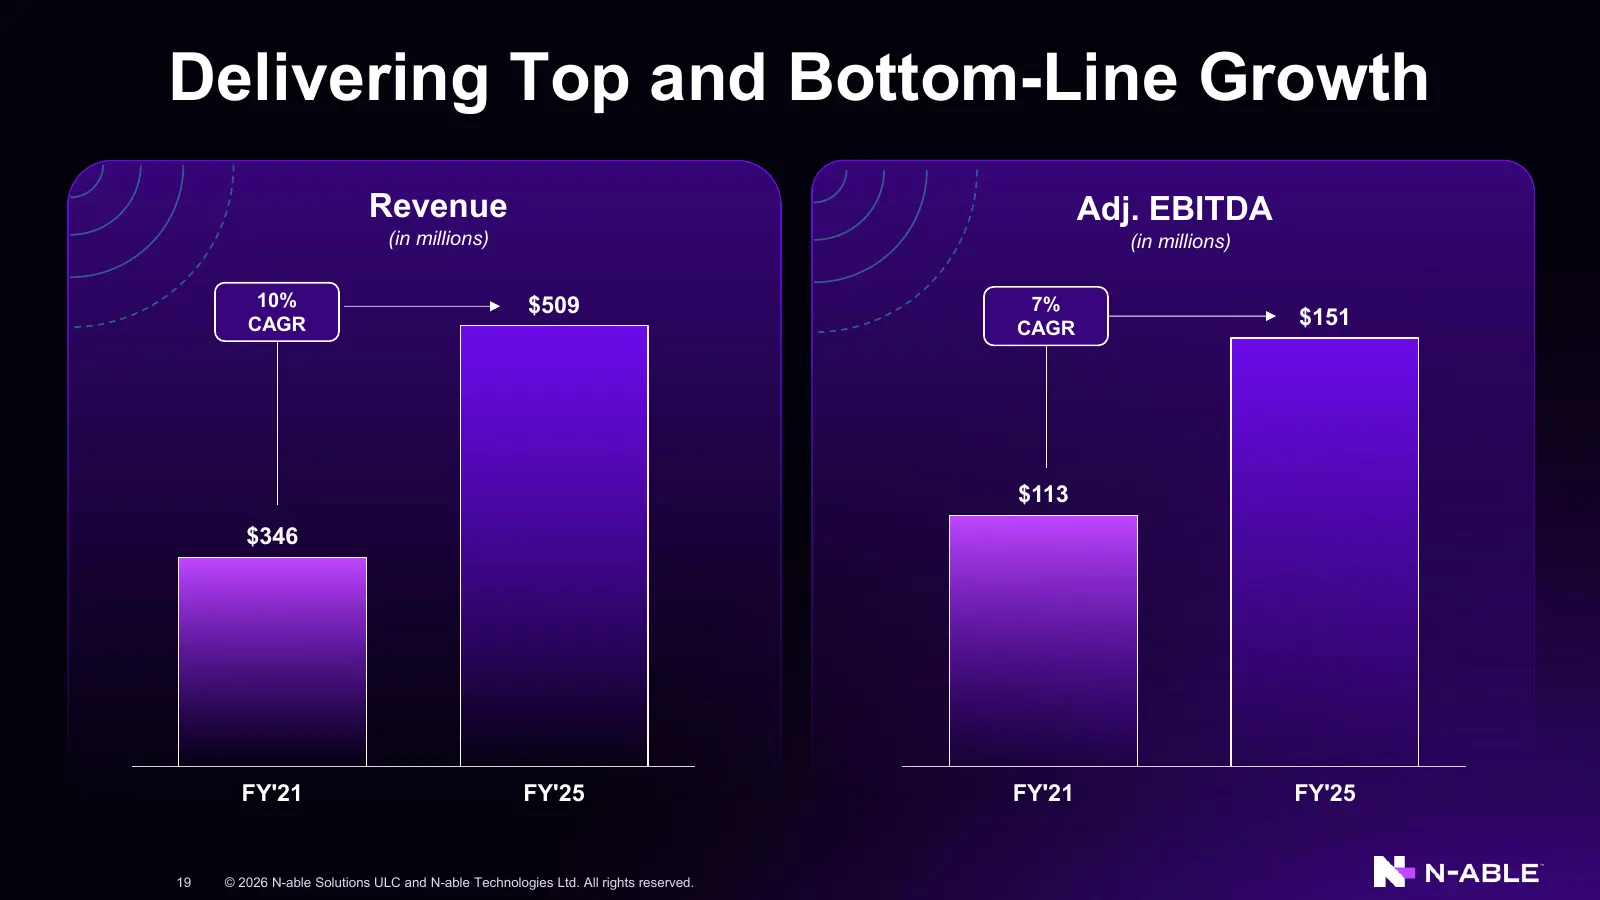
Slide 19: Delivering Top and Bottom-Line Growth
Delivering Top and Bottom-Line Growth Revenue Adj. EBITDA (in millions) (in millions) 10% $509 7% CAGR CAGR $151 $113 $346 FY'21 FY'25 FY'21 FY'25 19 © 2026 N-able Solutions ULC and N-able Technologies Ltd. All rights reserved.
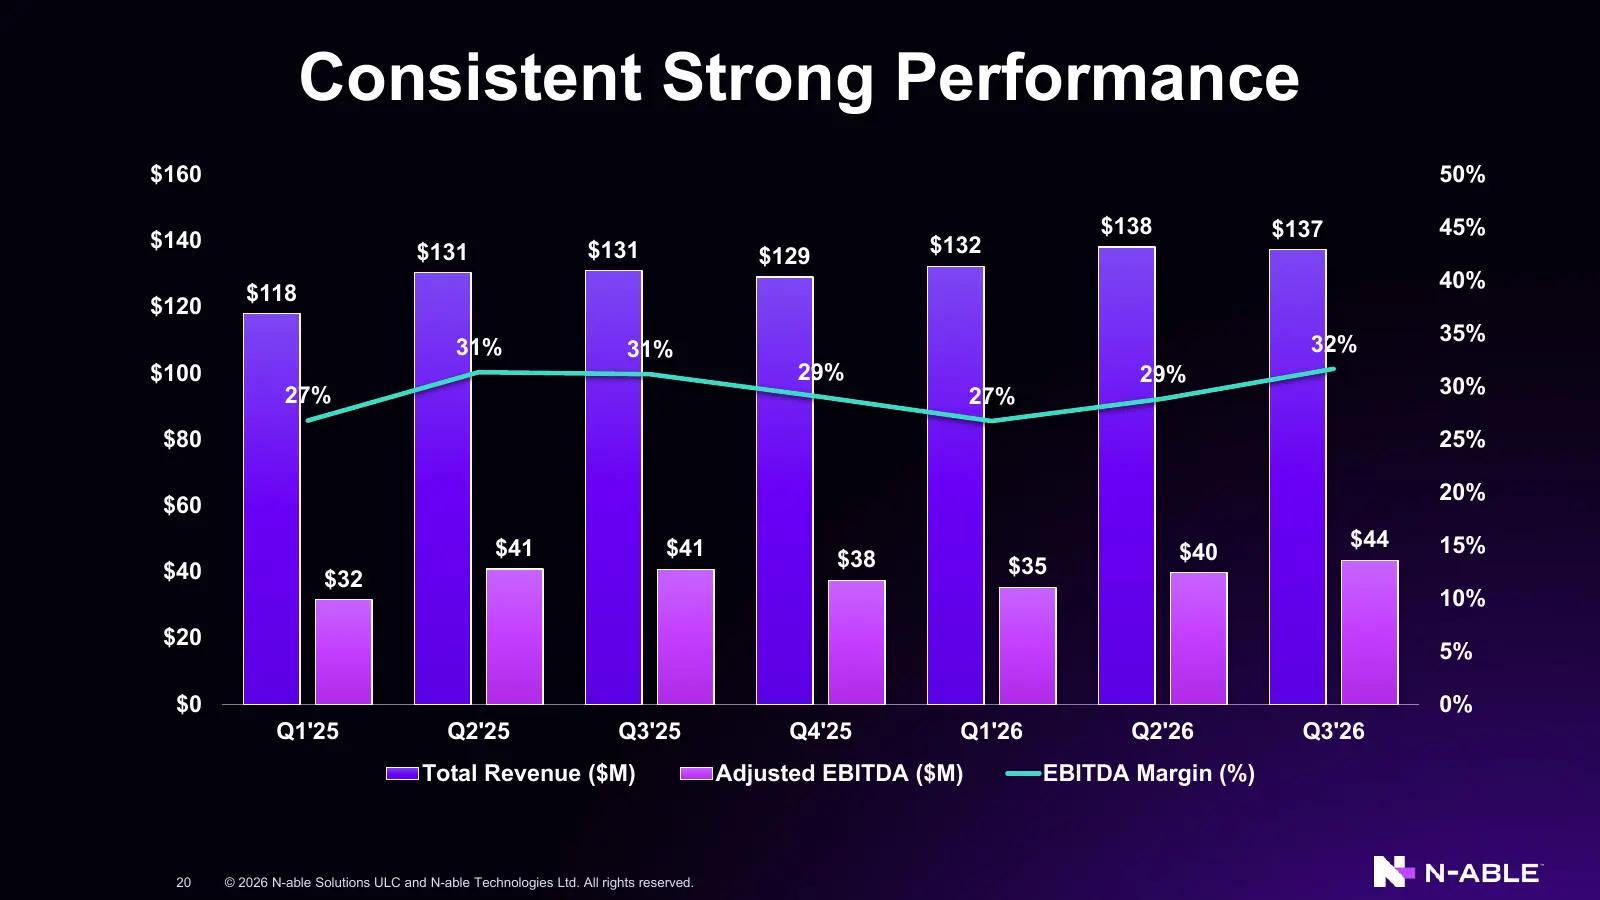
Slide 20: Consistent Strong Performance
Consistent Strong Performance $160 50% $138 $137 45% $140 $131 $131 $132 $129 40% $118 $120 32% 35% 31% 31% $100 29% 29% 27% 27% 30% $80 25% 20% $60 $41 $41 $44 15% $38 $40 $40 $35 $32 10% $20 5% $0 0% Q1'25 Q2'25 Q3'25 Q4'25 Q1'26 Q2'26 Q3'26 Total Revenue ($M) Adjusted EBITDA ($M) EBITDA Margin (%
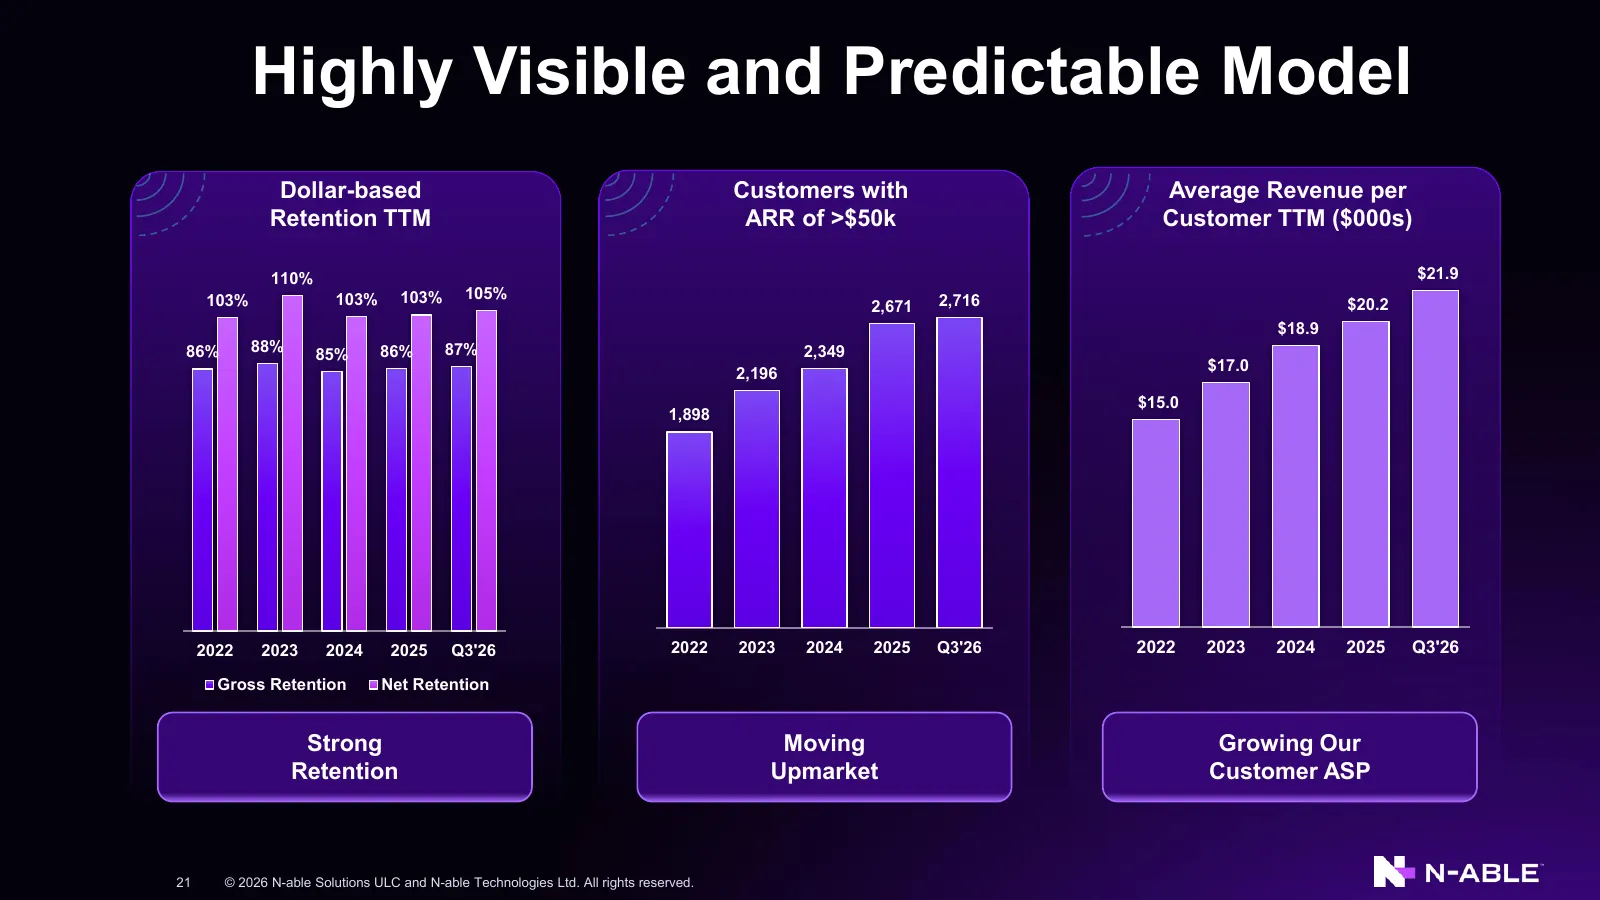
Slide 21: Highly Visible and Predictable Model
Highly Visible and Predictable Model Dollar-based Customers with Average Revenue per Retention TTM ARR of >$50k Customer TTM ($000s) 110% $21.9 103% 103% 103% 105% 2,716 2,671 $20.2 $18.9 86% 88% 85% 86% 87% 2,349 2,196 $17.0 $15.0 1,898 2022 2023 2024 2025 Q3'26 2022 2023 2024 2025 Q3'26 2022 2023
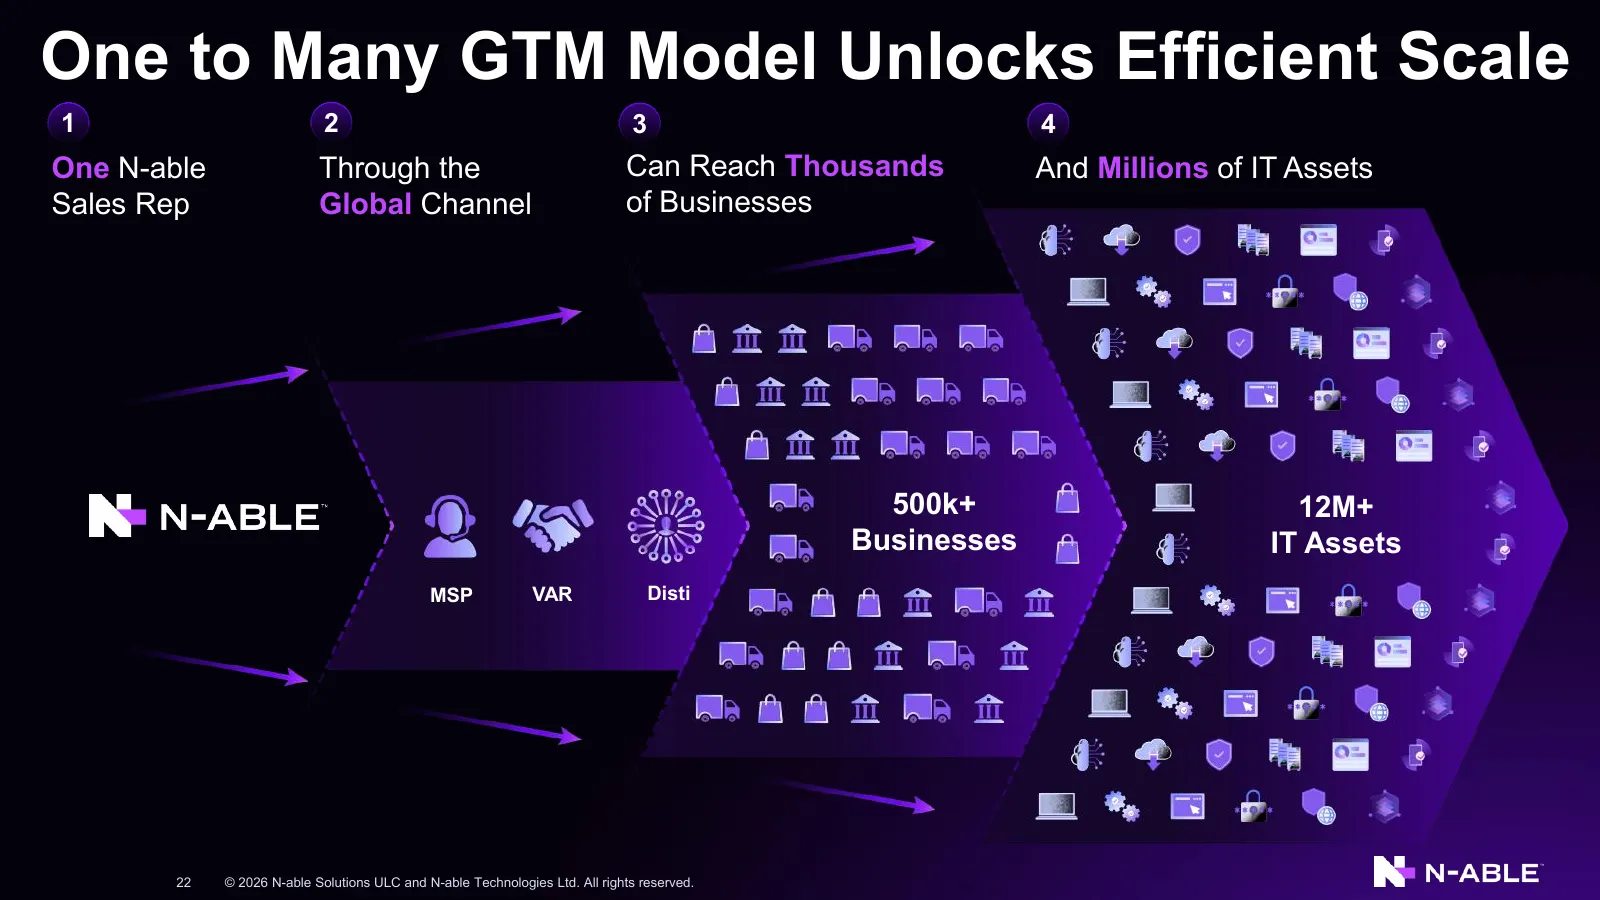
Slide 22: One to Many GTM Model Unlocks Efficient Scale
One to Many GTM Model Unlocks Efficient Scale 1 2 3 4 One N-able Through the Can Reach Thousands And Millions of IT Assets Sales Rep Global Channel of Businesses 500k+ 12M+ Businesses IT Assets MSP VAR Disti 22 © 2026 N-able Solutions ULC and N-able Technologies Ltd. All rights reserved.
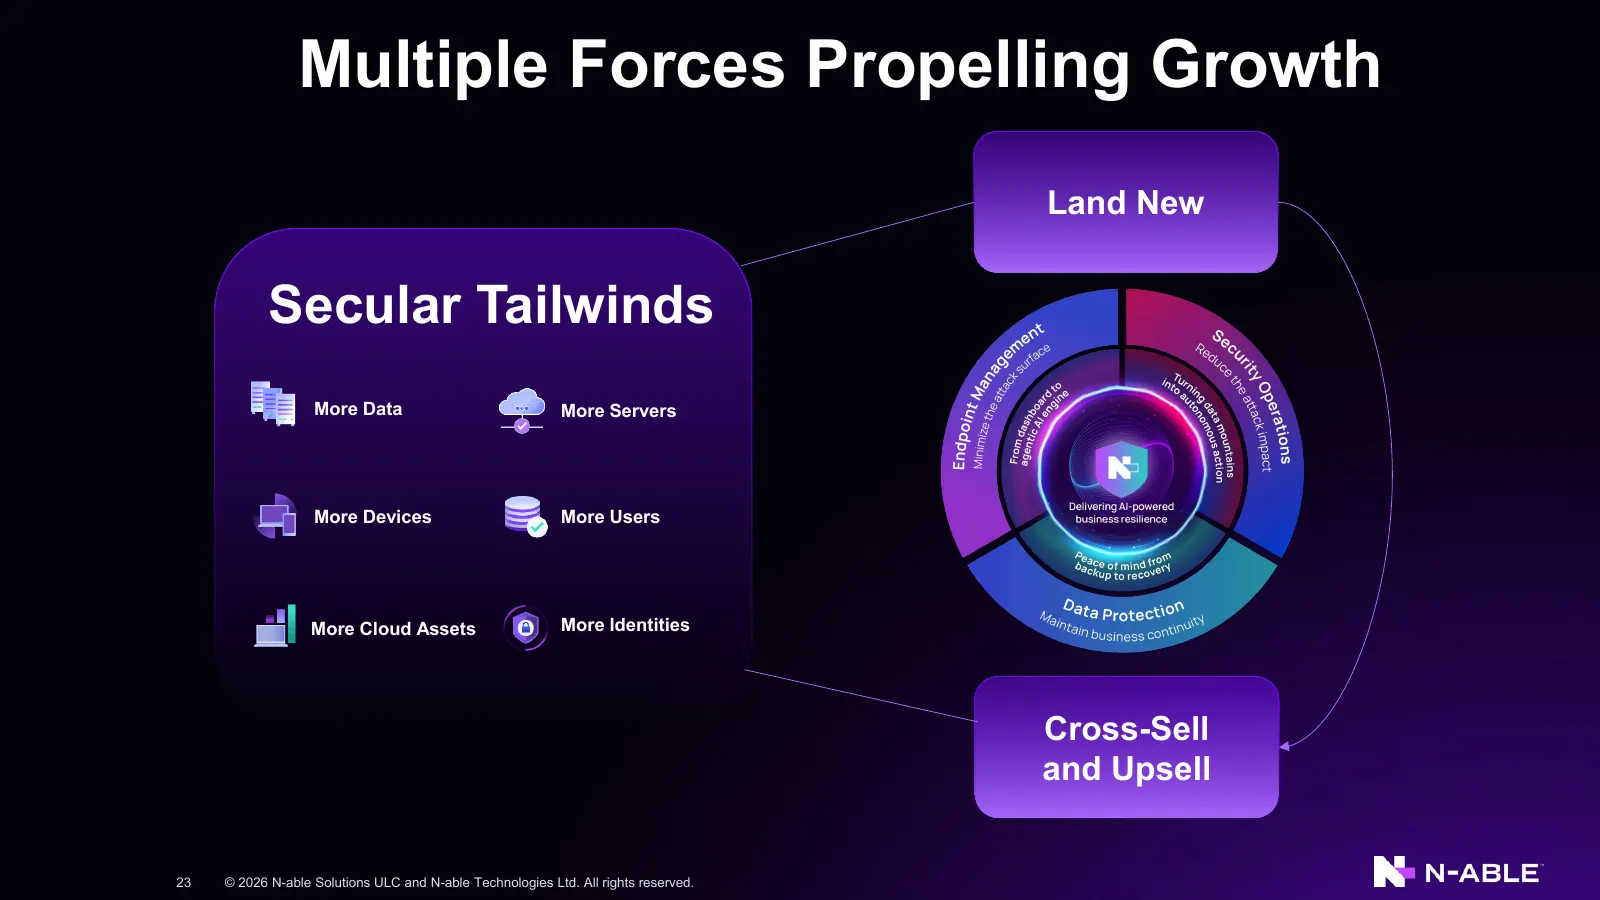
Slide 23: Multiple Forces Propelling Growth
Multiple Forces Propelling Growth Land New Secular Tailwinds More Data More Servers More Devices More Users More Cloud Assets More Identities Cross-Sell and Upsell 23 © 2026 N-able Solutions ULC and N-able Technologies Ltd. All rights reserved.
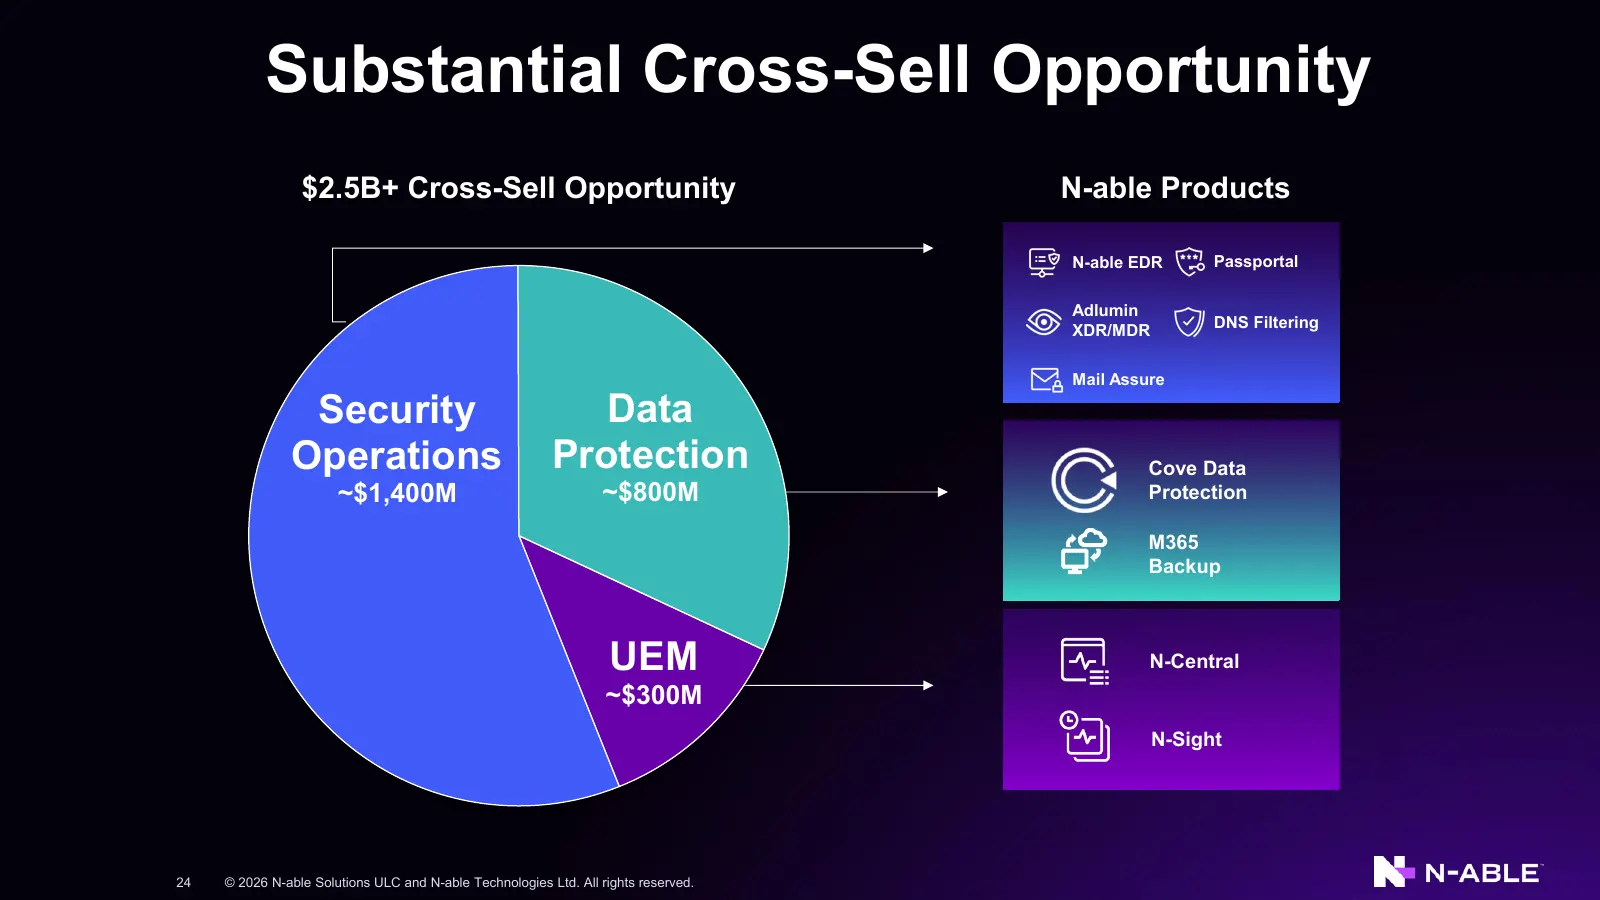
Slide 24: Substantial Cross-Sell Opportunity
Substantial Cross-Sell Opportunity $2.5B+ Cross-Sell Opportunity N-able Products N-able EDR Passportal Adlumin DNS Filtering XDR/MDR Mail Assure Security Data Operations Protection Cove Data ~$1,400M ~$800M Protection M365 Backup UEM N-Central ~$300M N-Sight 24 © 2026 N-able Solutions ULC and N-able
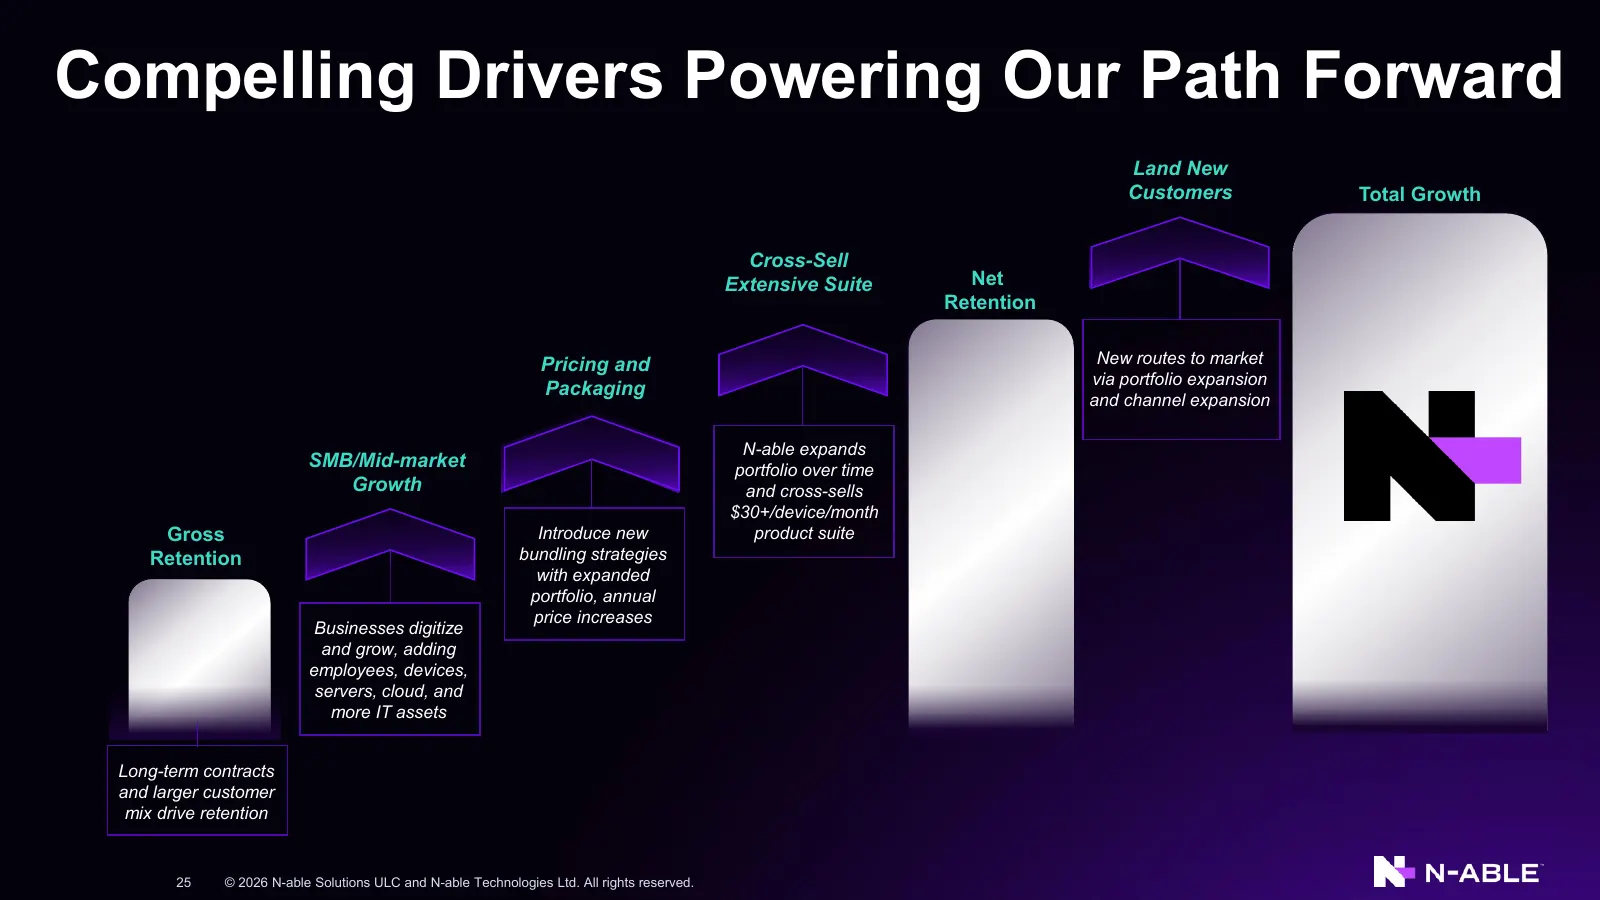
Slide 25: Compelling Drivers Powering Our Path Forward
Compelling Drivers Powering Our Path Forward Land New Customers Total Growth Cross-Sell Extensive Suite Net Retention Pricing and New routes to market via portfolio expansion Packaging and channel expansion N-able expands SMB/Mid-market portfolio over time Growth and cross-sells $30+/device/month Gr
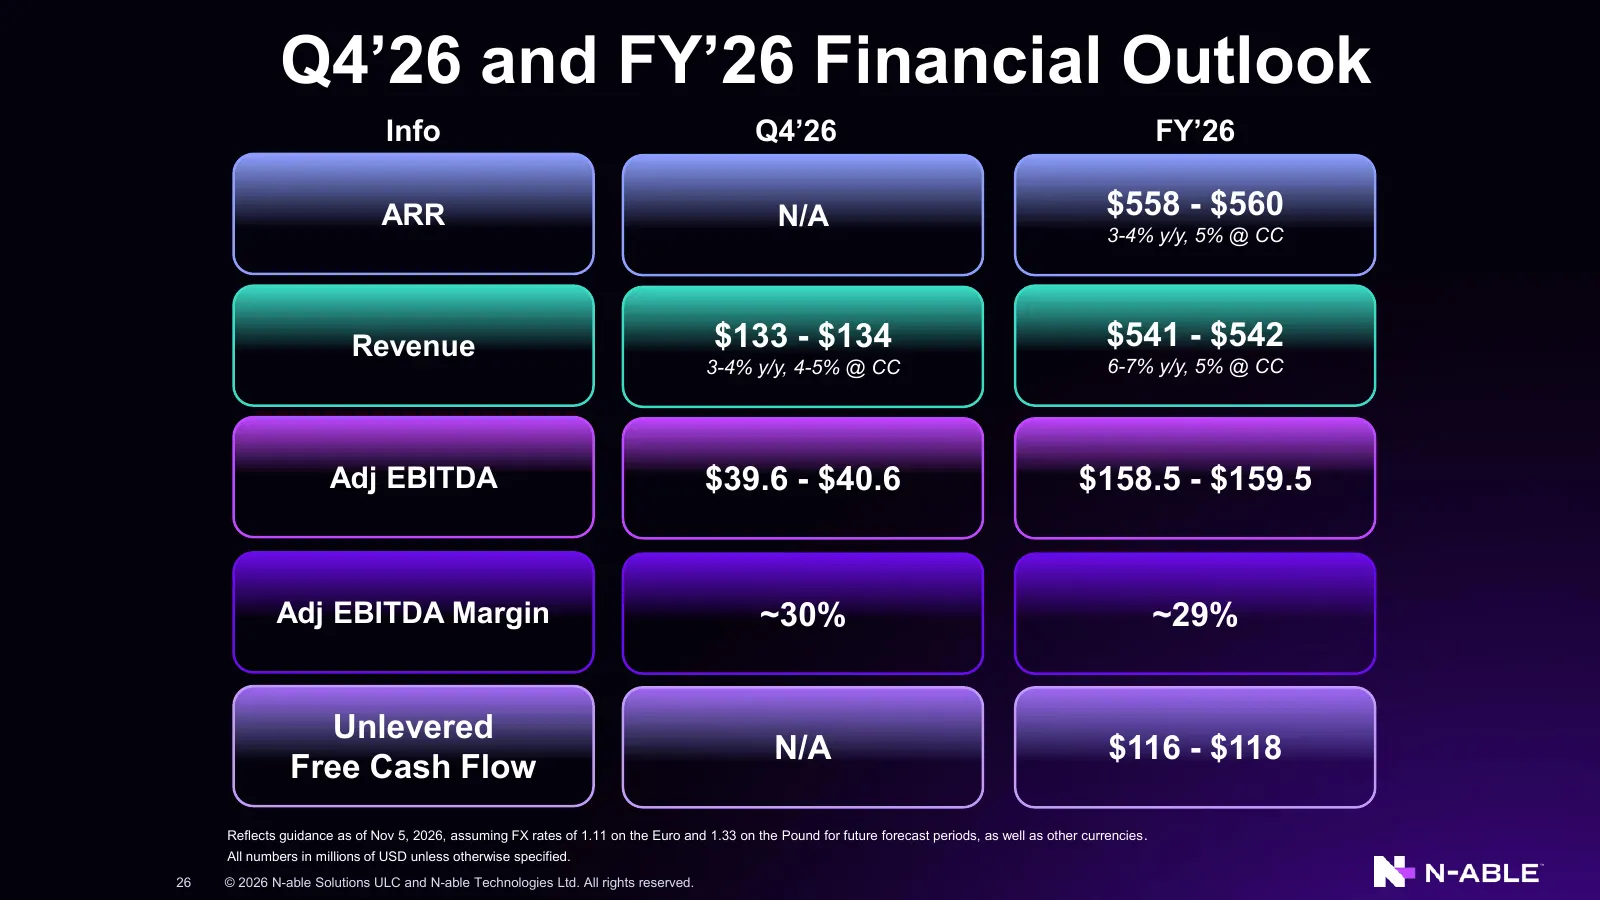
Slide 26: Q4'26 and FY'26 Financial Outlook
Q4’26 and FY’26 Financial Outlook Info Q4’26 FY’26 ARR N/A $558 - $560 3-4% y/y, 5% @ CC Revenue $133 - $134 $541 - $542 3-4% y/y, 4-5% @ CC 6-7% y/y, 5% @ CC Adj EBITDA $39.6 - $40.6 $158.5 - $159.5 Adj EBITDA Margin ~30% ~29% Unlevered N/A $116 - $118 Free Cash Flow Reflects guidance as of Nov 5,
Slide 27: Why N-able?
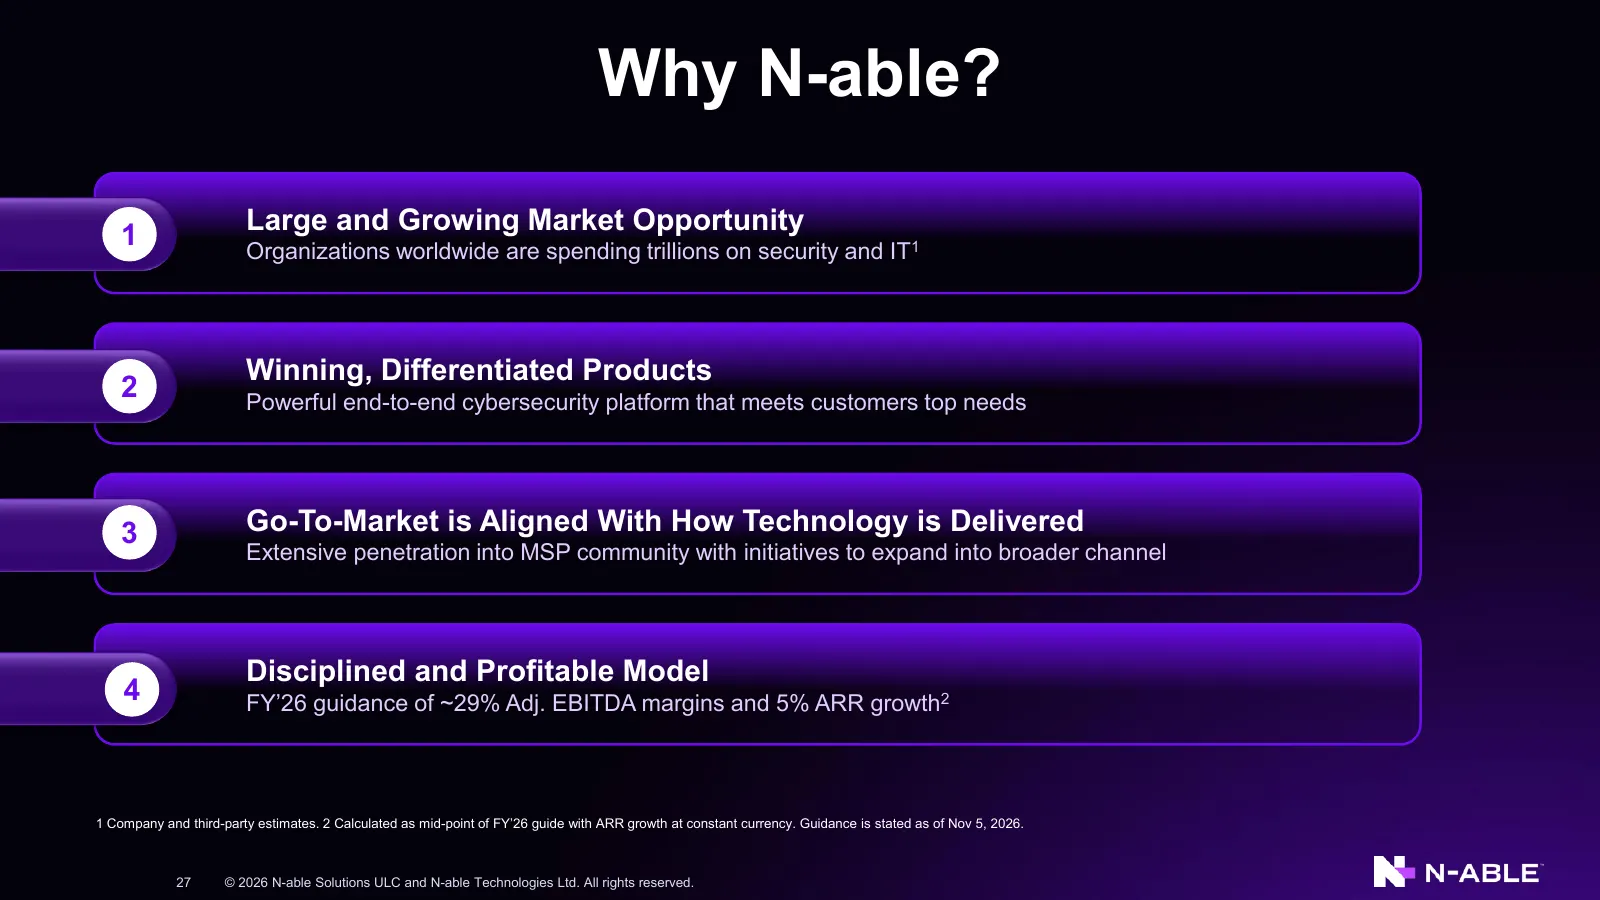
Why N-able? Large and Growing Market Opportunity 1 Organizations worldwide are spending trillions on security and IT1 Winning, Differentiated Products 2 Powerful end-to-end cybersecurity platform that meets customers top needs 3 Go-To-Market is Aligned With How Technology is Delivered Extensive pene
Slide 28: Supplemental Financials
Supplemental Financials 28 © 2026 N-able Solutions ULC and N-able Technologies Ltd. All rights reserved.
Slide 29: Definitions of Non-GAAP and Other Financial Measures
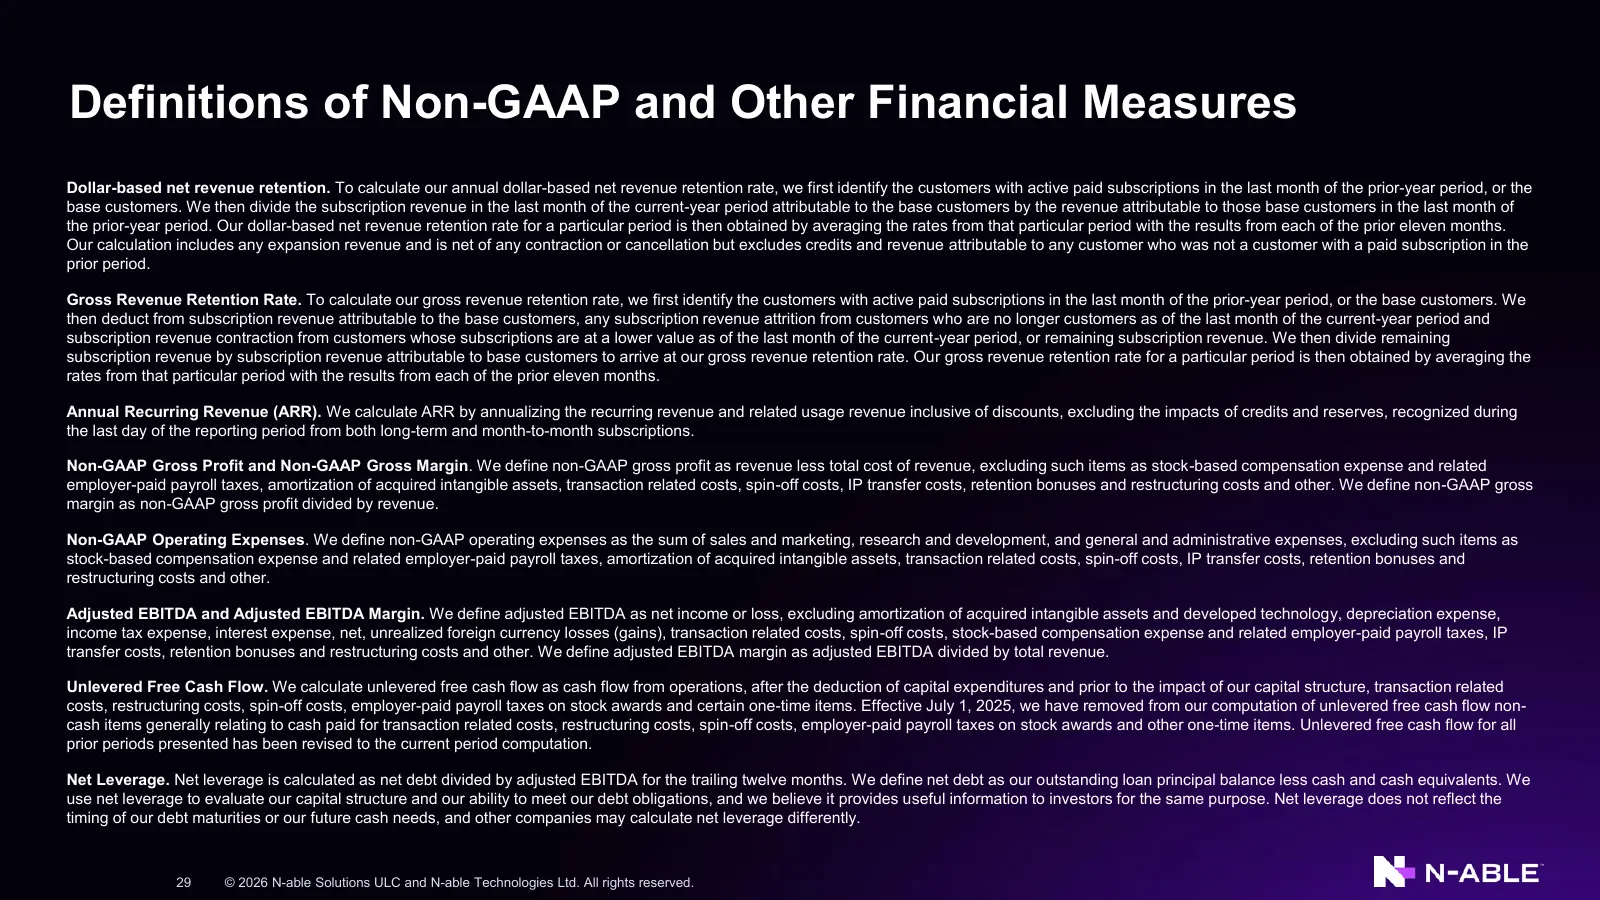
Definitions of Non-GAAP and Other Financial Measures Dollar-based net revenue retention. To calculate our annual dollar-based net revenue retention rate, we first identify the customers with active paid subscriptions in the last month of the prior-year period, or the base customers. We then divide t
Slide 30: Non-GAAP Reconciliations
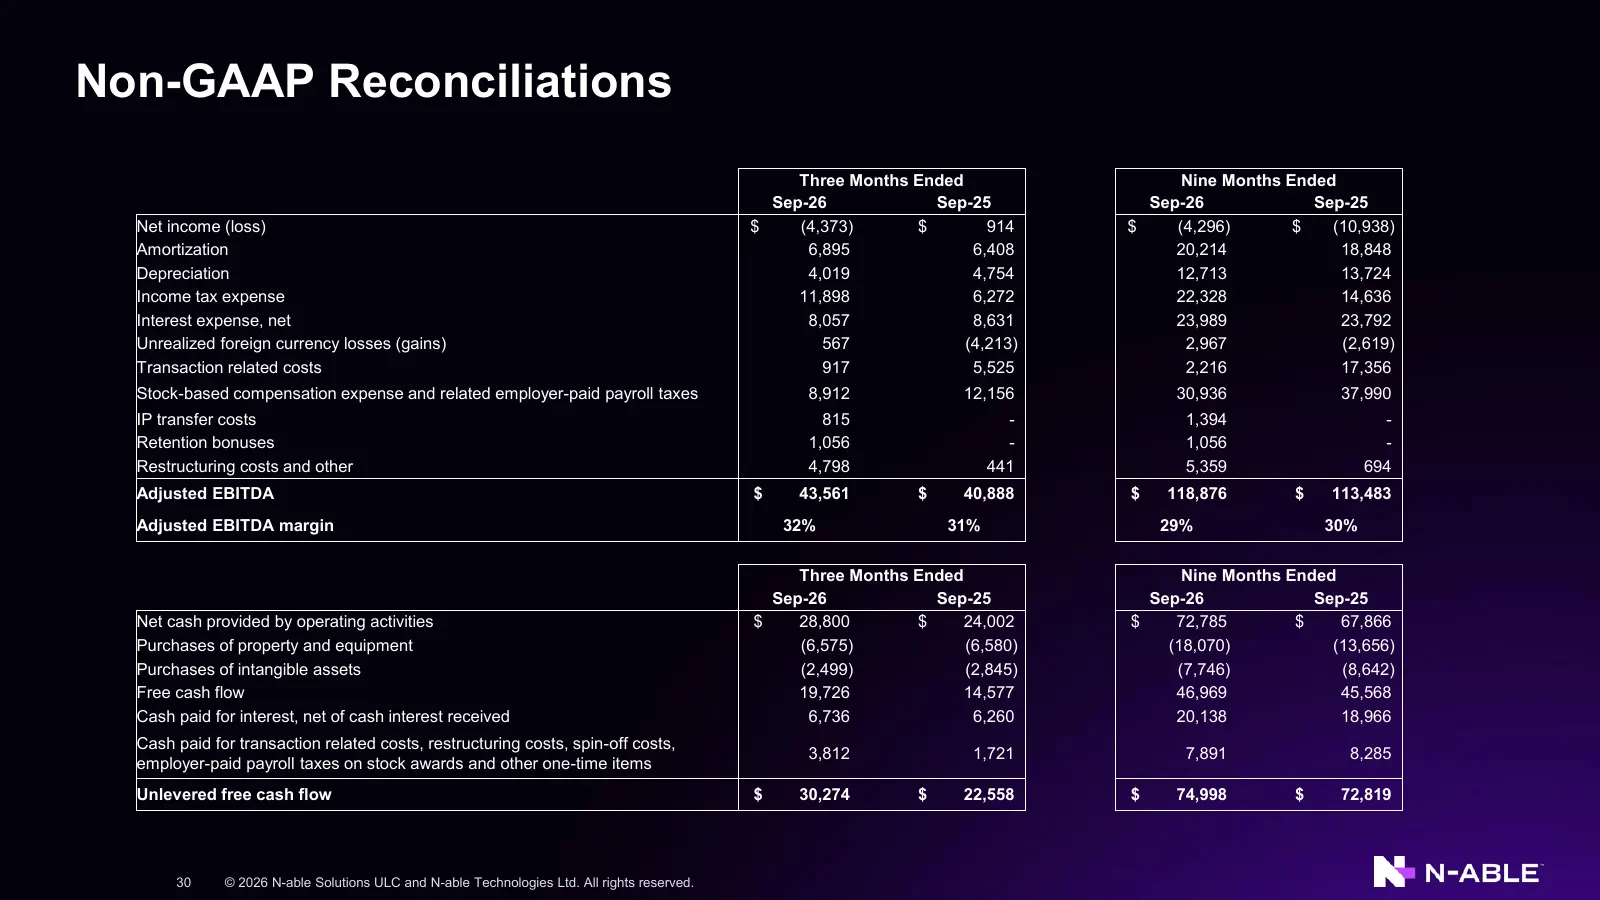
Non-GAAP Reconciliations Three Months Ended Nine Months Ended Sep-26 Sep-25 Sep-26 Sep-25 Net income (loss) $ (4,373) $ 914 $ (4,296) $ (10,938) Amortization 6,895 6,408 20,214 18,848 Depreciation 4,019 4,754 12,713 13,724 Income tax expense 11,898 6,272 22,328 14,636 Interest expense, net 8,057 8,6
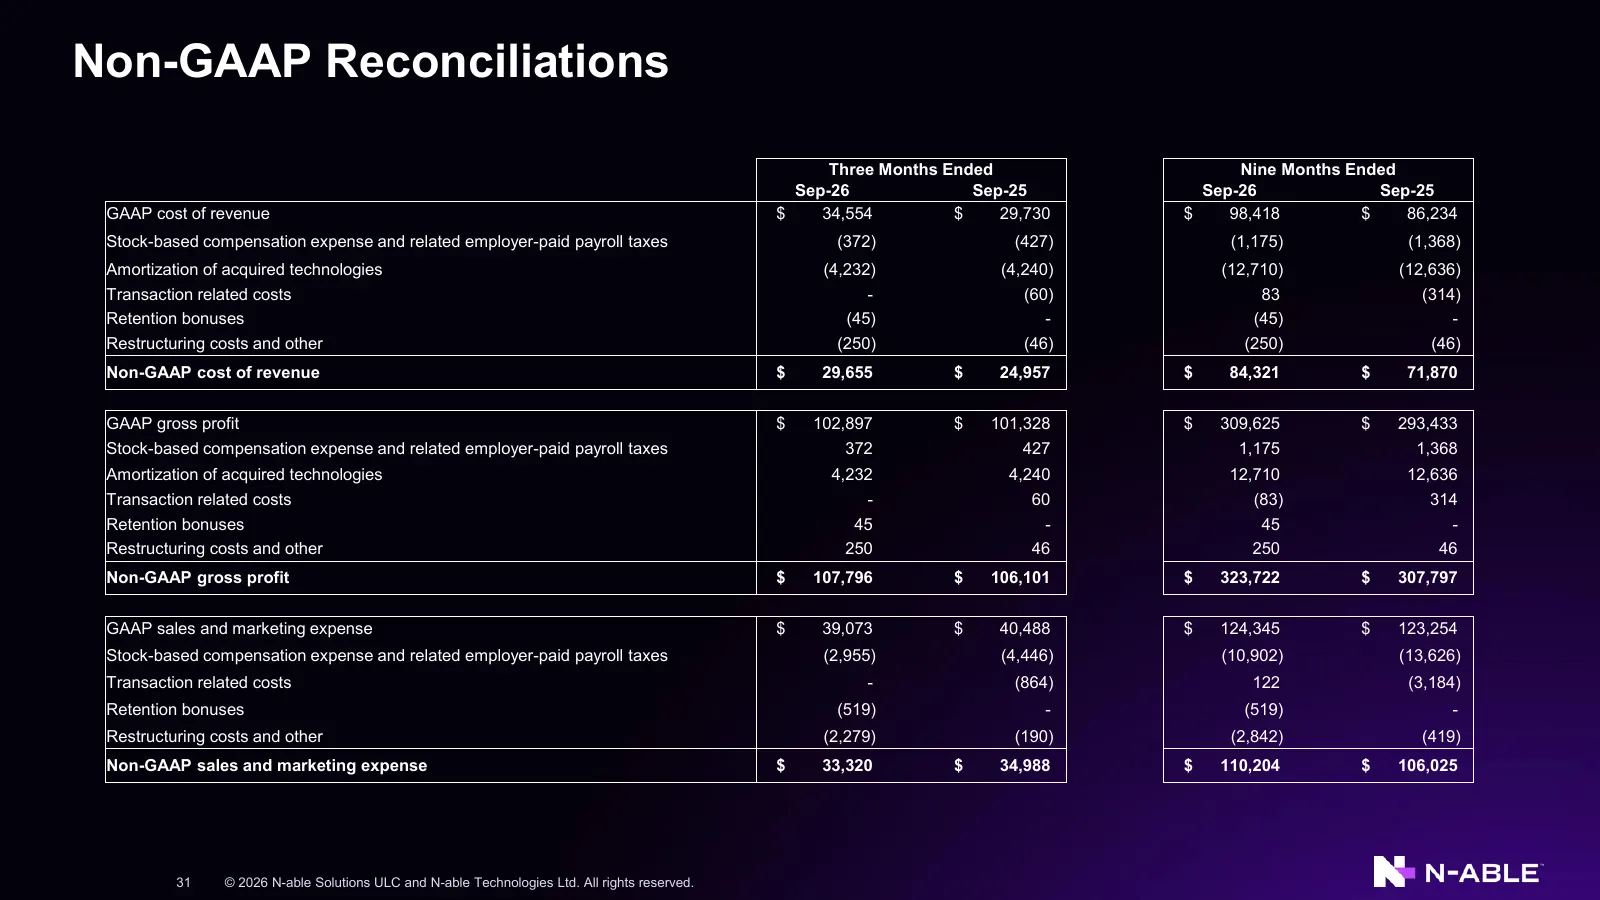
Slide 31: Non-GAAP Reconciliations
Non-GAAP Reconciliations Three Months Ended Nine Months Ended Sep-26 Sep-25 Sep-26 Sep-25 GAAP cost of revenue $ 34,554 $ 29,730 $ 98,418 $ 86,234 Stock-based compensation expense and related employer-paid payroll taxes (372) (427) (1,175) (1,368) Amortization of acquired technologies (4,232) (4,240
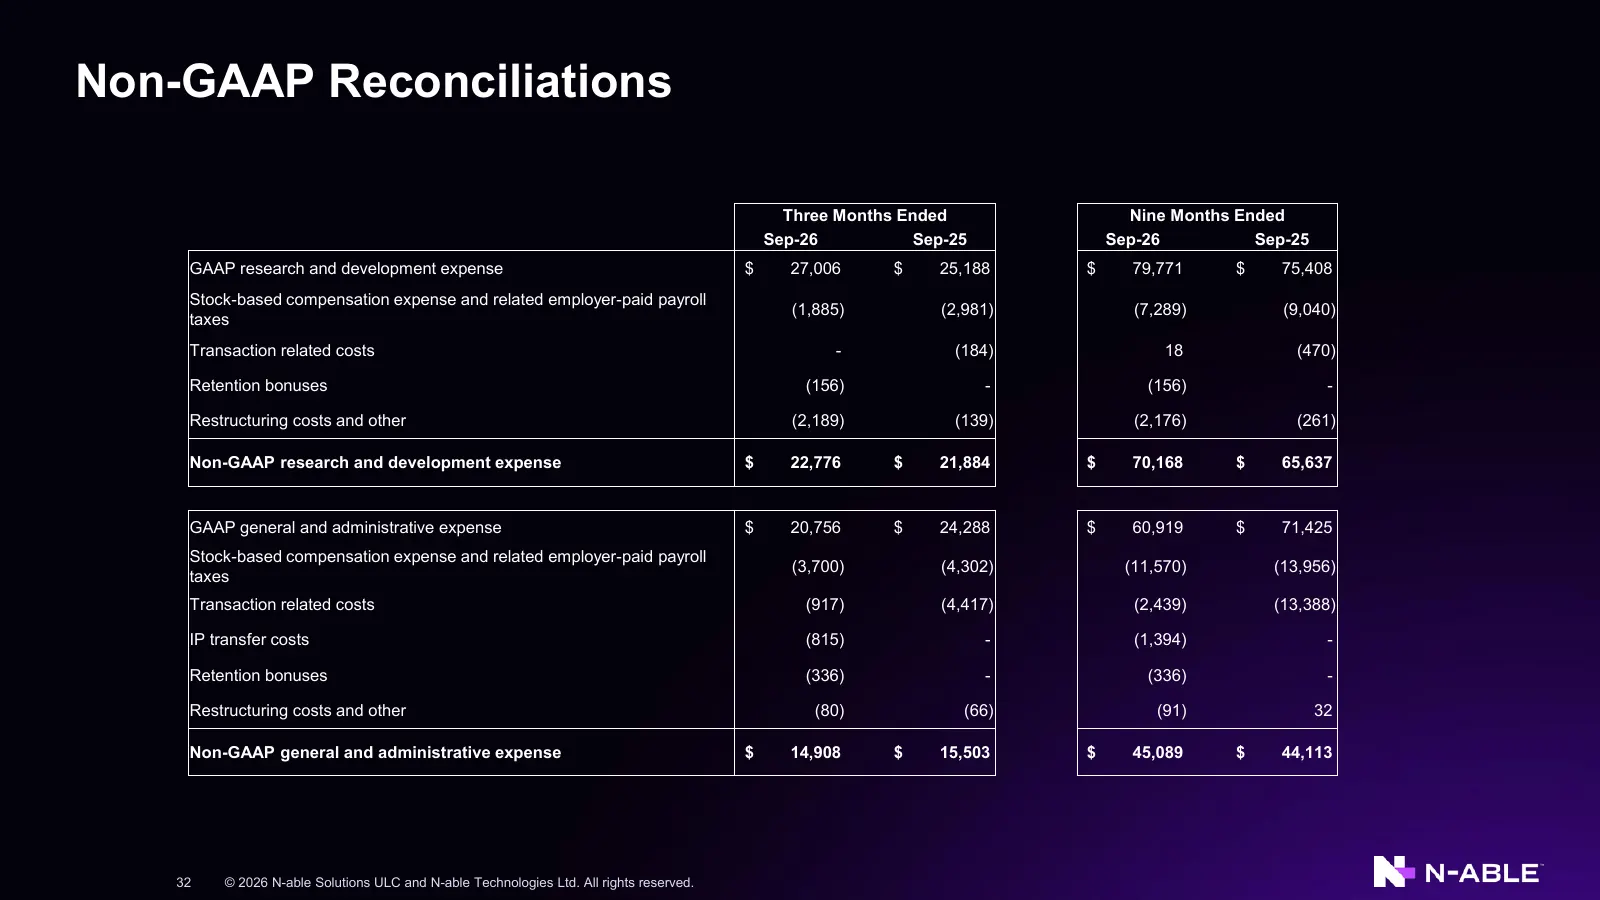
Slide 32: Non-GAAP Reconciliations
Non-GAAP Reconciliations Three Months Ended Nine Months Ended Sep-26 Sep-25 Sep-26 Sep-25 GAAP research and development expense $ 27,006 $ 25,188 $ 79,771 $ 75,408 Stock-based compensation expense and related employer-paid payroll (1,885) (2,981) (7,289) (9,040) taxes Transaction related costs - (18
Source: 6ix earnings call
More decks from N-able, Inc.
 Q2 2026 Earnings Presentation32 slides · Aug 10, 2026
 Q1 2026 Earnings Presentation32 slides · May 7, 2026
 Q4 2025 Earnings Presentation34 slides · Feb 19, 2026
 Q2 2025 Earnings Presentation34 slides · Aug 7, 2025
 Investor Day (March 2025)84 slides · Mar 13, 2025
 Merger or Acquisition (November 2024)9 slides · Nov 20, 2024