Vodacom Group Limited · JSE:VOD
Vodacom — FY2011 Earnings Presentation
34 slides from Vodacom's earnings presentation, Mar 31, 2011
Slide 1: Annual results presentation
Annual results presentation 31 March 2011

Slide 2: Our purpose: why we exist
OUR PURPOs, WHY we exist Connecting YOU Creating possibilities Changing lives

Slide 3: Where we are going: make every customer smile
geet tt tee,, To make every customer smile WHERE we are going Connecting YOU Creating possibilities Changing lives
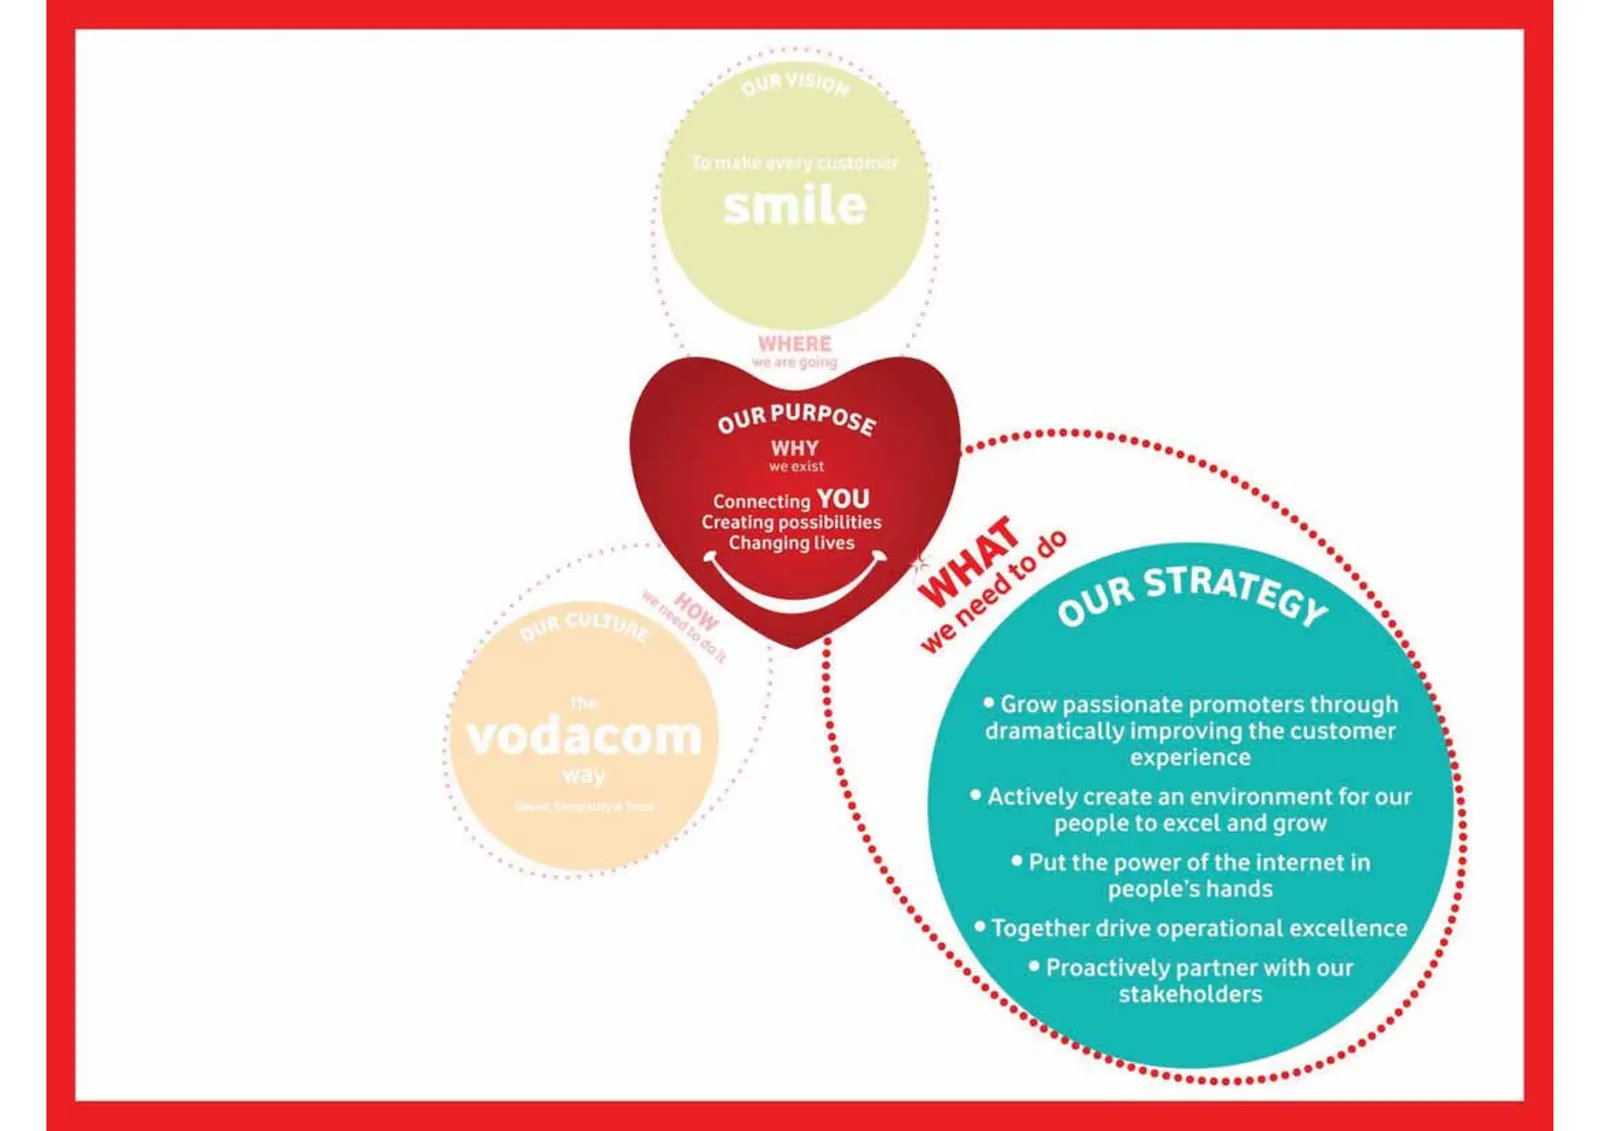
Slide 4: Our purpose: why we exist and strategic priorities
oURPURPOs, WHY ° e ®e, we exist e, %e ° Connecting YOU Creating possibilities Changing lives ® Grow passionate promoters through dramatically improving the customer experience ® Actively create an environment for our people to excel and grow ® Put the power of the internet in people’s hands © Togeth
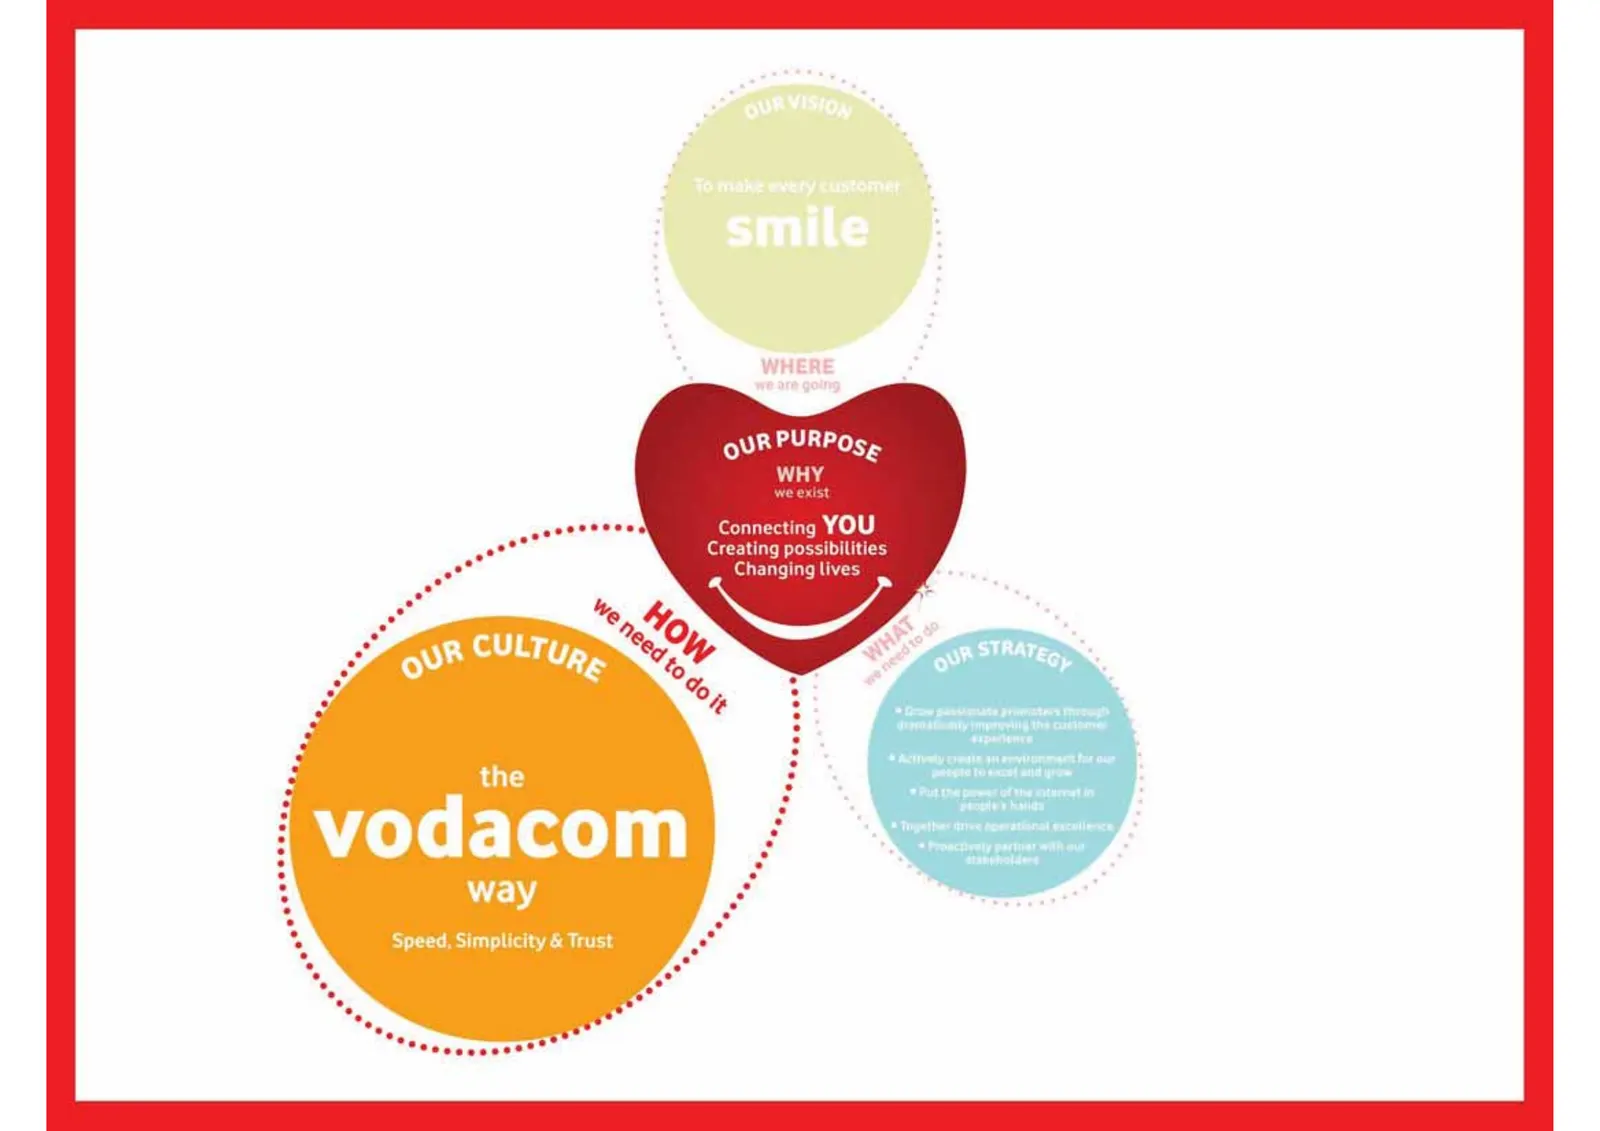
Slide 5: Our purpose: why we exist
oUR PURPOs, WHY xist Connecting YOu Creating possibilities Changing lives

Slide 6: To make every customer smile
To make every customer smile eeetece er: . Seen Seeeeeee® WHERE we are going ouR PURPOs, WHY we exist Connecting YOU Creating possibilities Changing lives * Grow passionate promoters through dramatically improving the customer nce the * Actively create an ronment for our people to excel and grow wa
Slide 7: Delivery on strategy
Delivery on strategy 7 Annual results: Vodacom Group Limited 31 March 2011
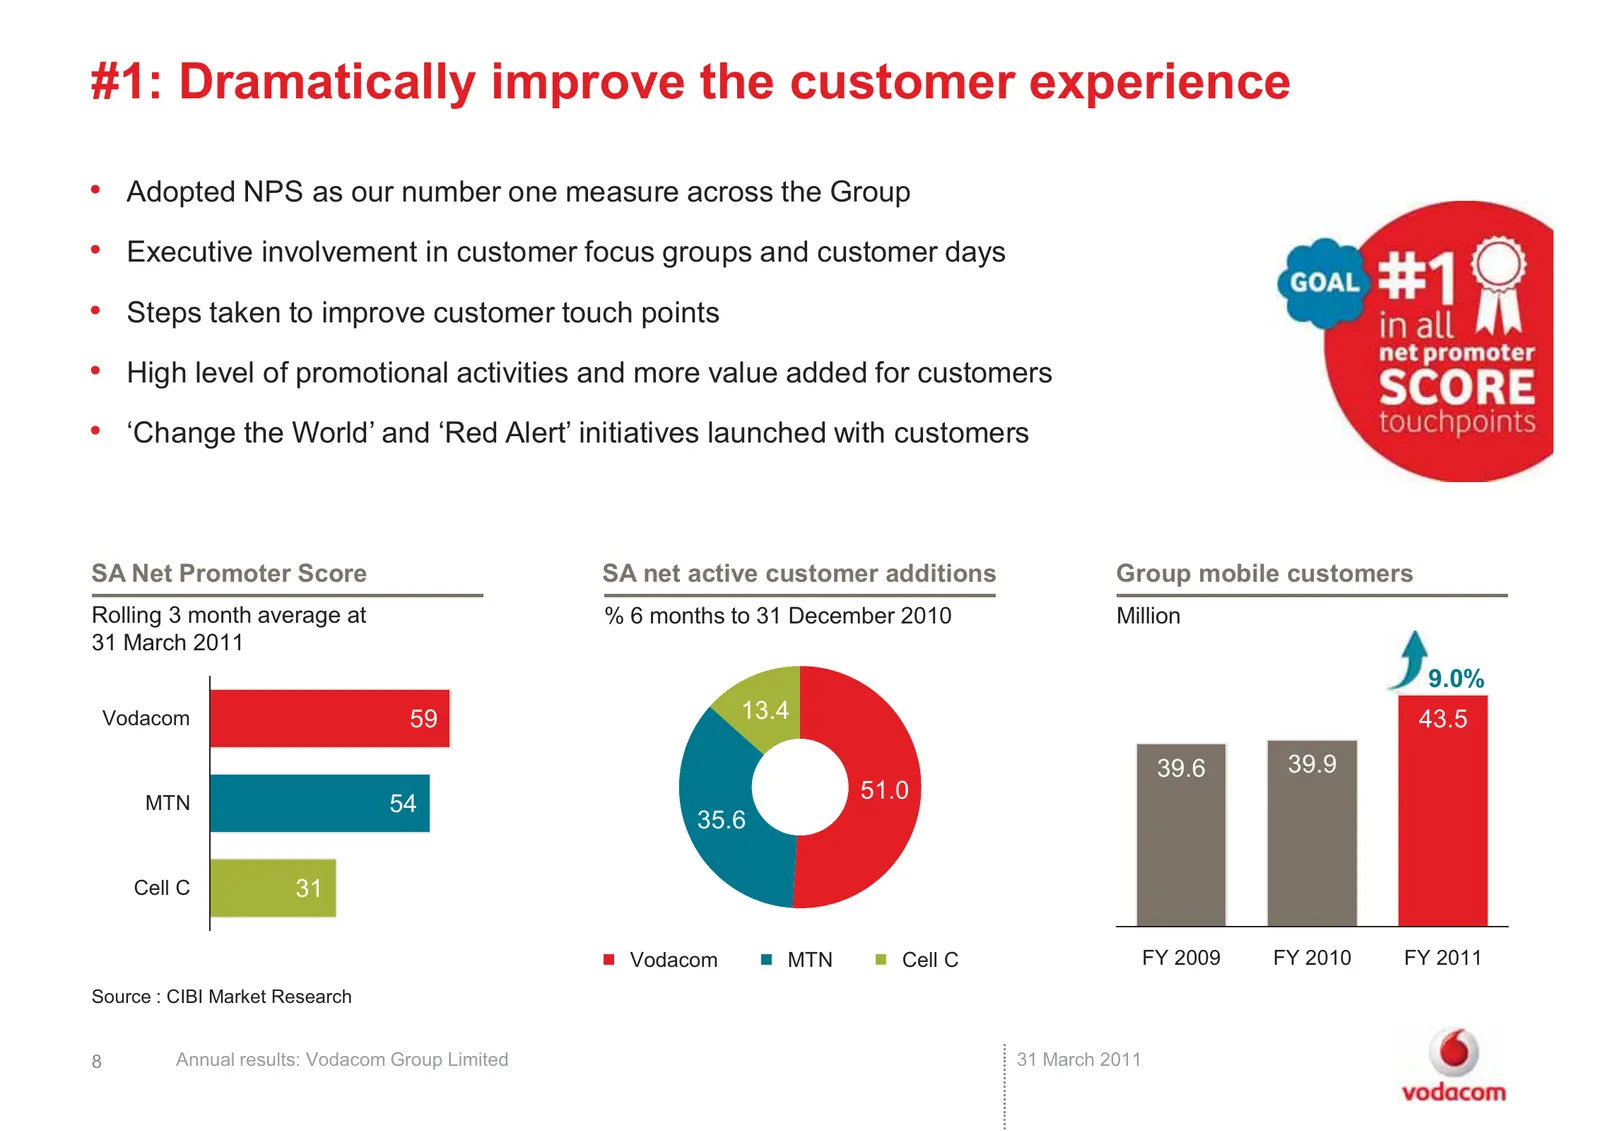
Slide 8: #1: Dramatically improve the customer experience
#1: Dramatically improve the customer experience • Adopted NPS as our number one measure across the Group • Executive involvement in customer focus groups and customer days • Steps taken to improve customer touch points • High level of promotional activities and more value added for customers • ‘Cha
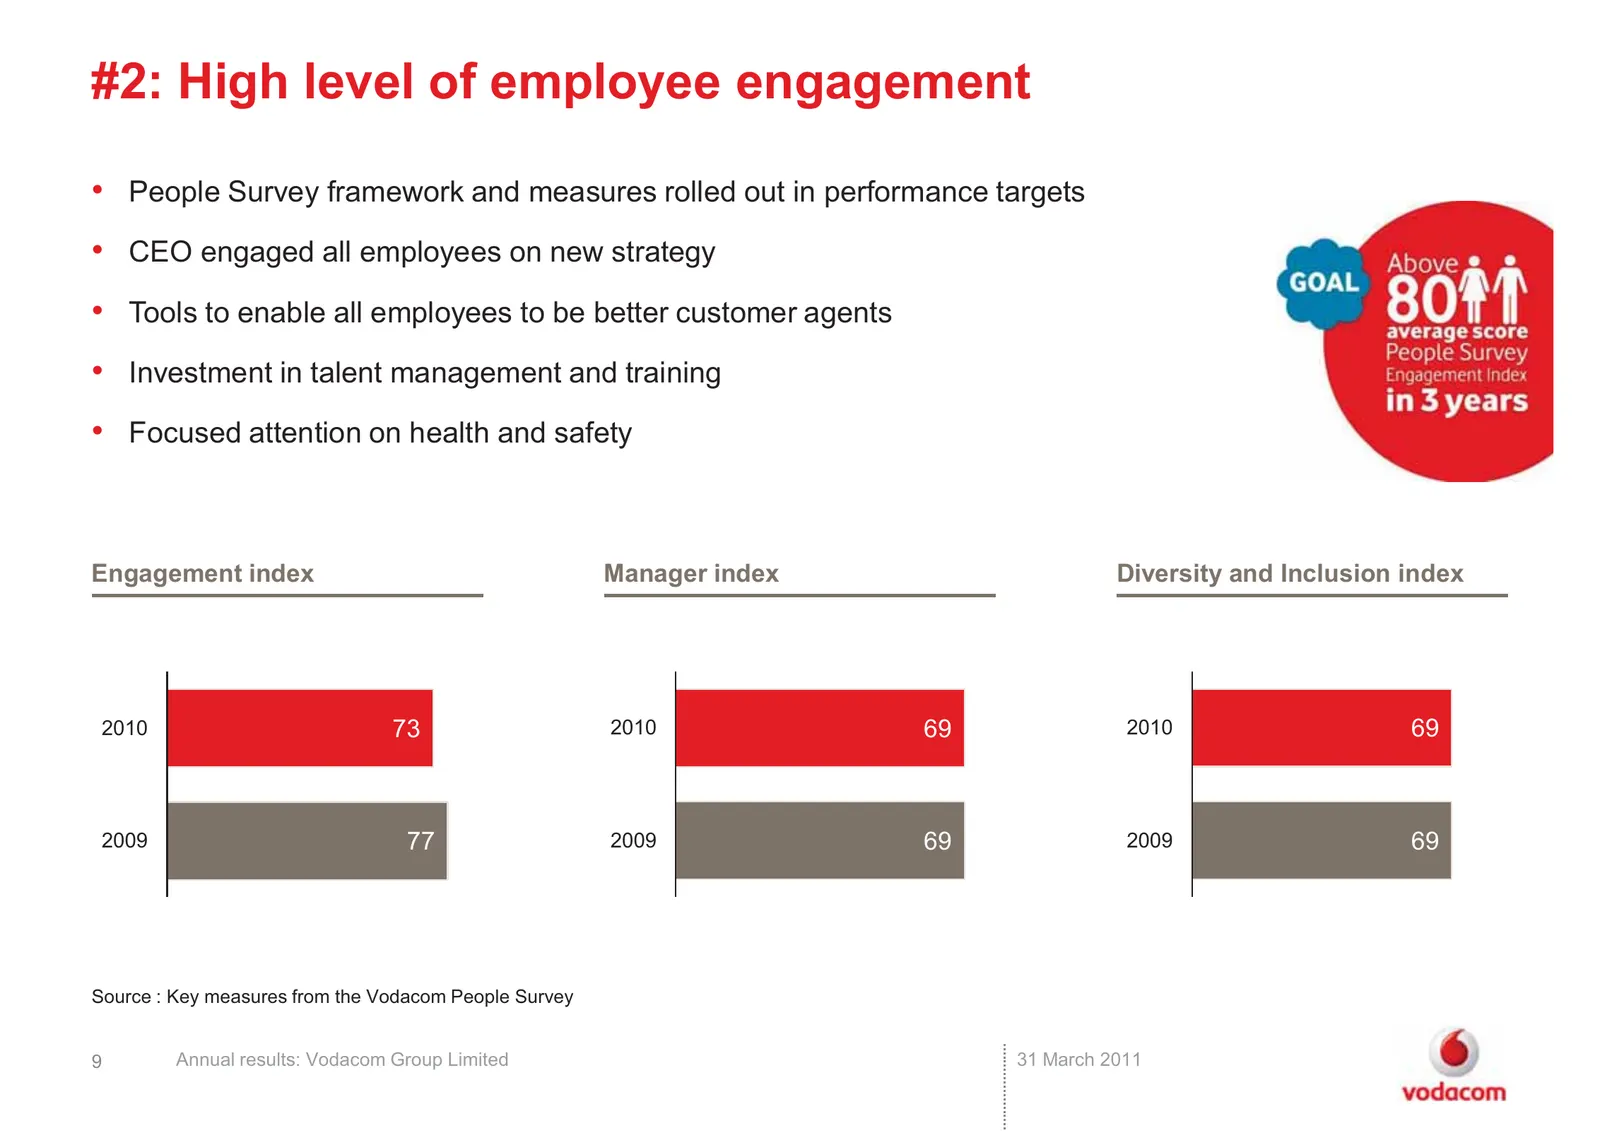
Slide 9: #2: High level of employee engagement
#2: High level of employee engagement • People Survey framework and measures rolled out in performance targets • CEO engaged all employees on new strategy • Tools to enable all employees to be better customer agents • Investment in talent management and training • Focused attention on health and saf
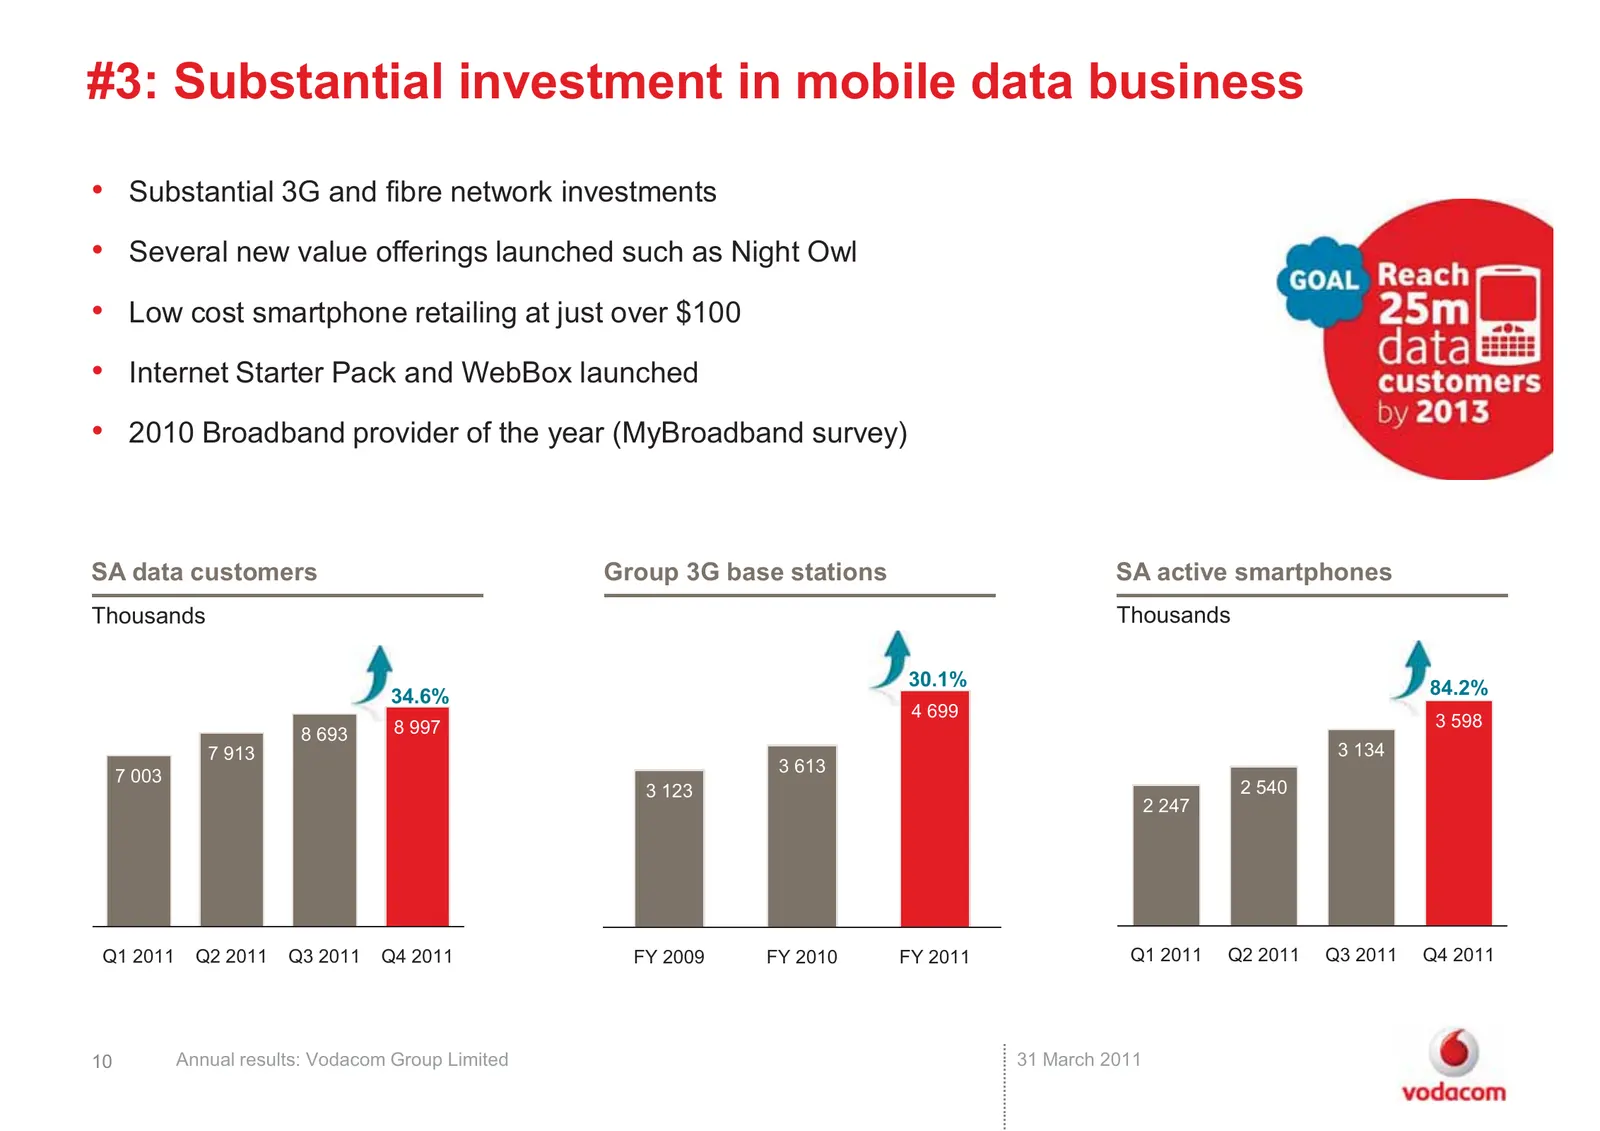
Slide 10: #3: Substantial investment in mobile data business
#3: Substantial investment in mobile data business • Substantial 3G and fibre network investments • Several new value offerings launched such as Night Owl • Low cost smartphone retailing at just over $100 • Internet Starter Pack and WebBox launched • 2010 Broadband provider of the year (MyBroadband
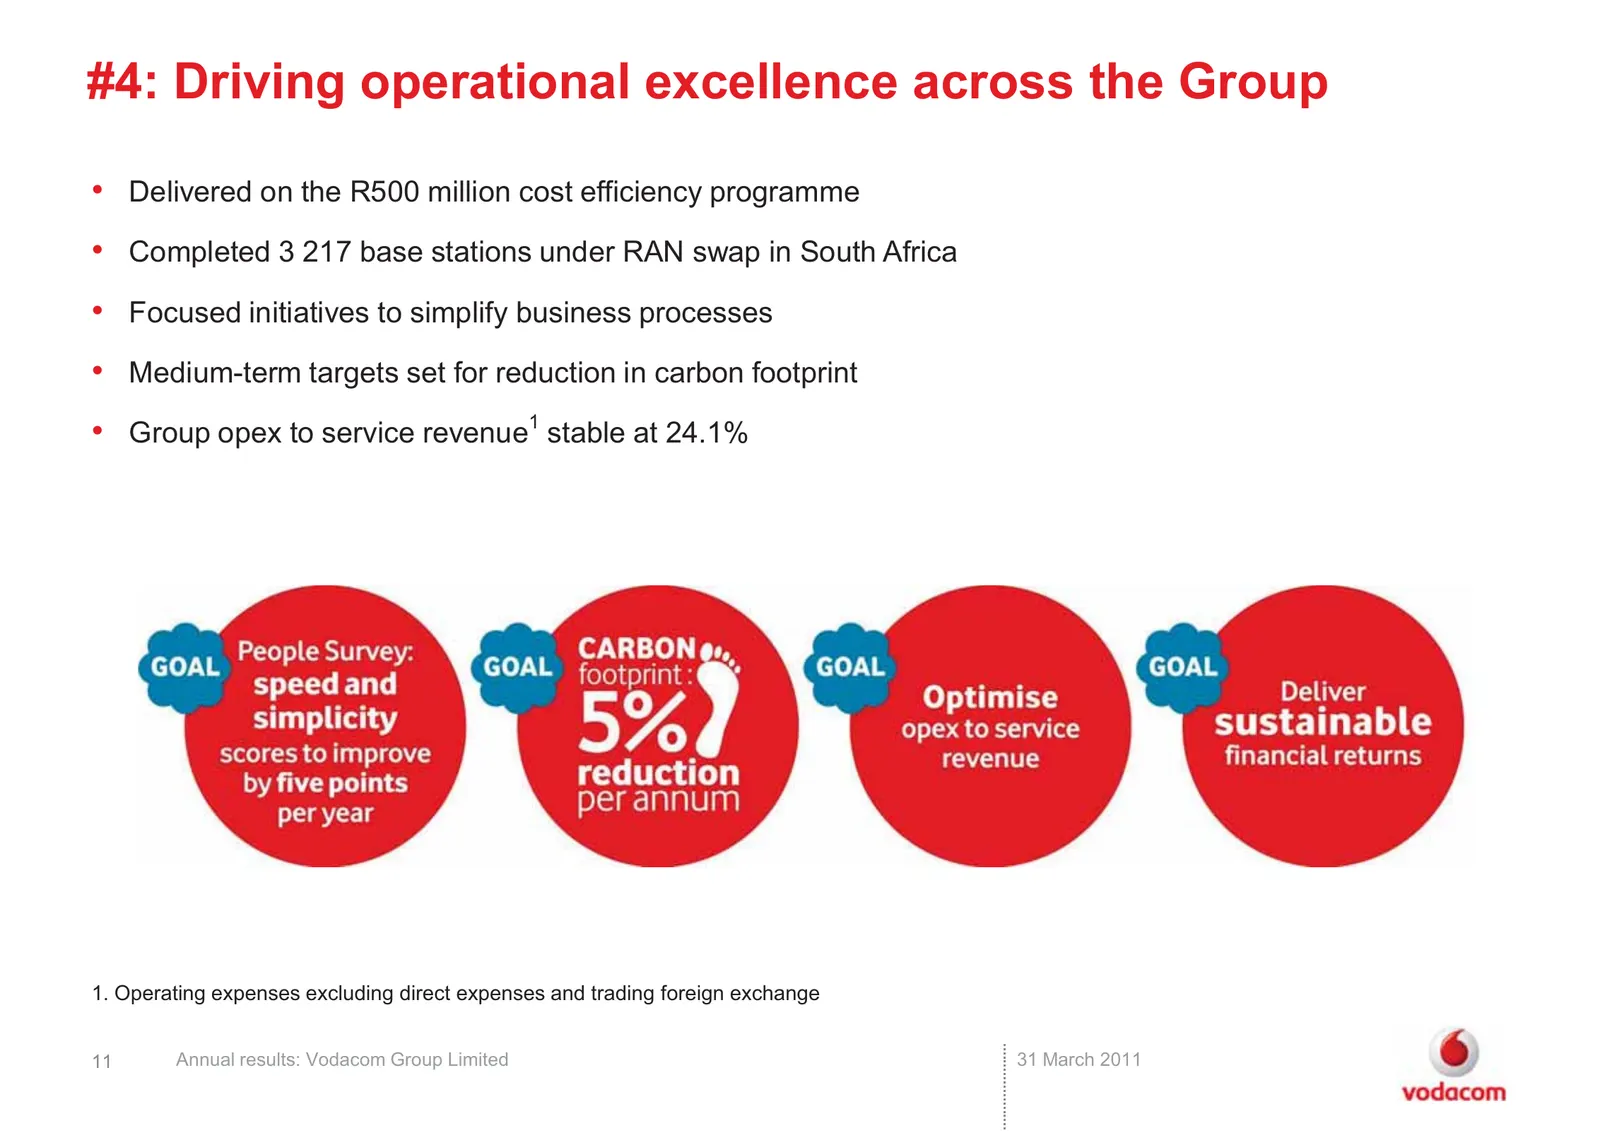
Slide 11: #4: Driving operational excellence across the Group
#4: Driving operational excellence across the Group • Delivered on the R500 million cost efficiency programme • Completed 3 217 base stations under RAN swap in South Africa • Focused initiatives to simplify business processes • Medium-term targets set for reduction in carbon footprint • Group opex t
Slide 12: #5: Cementing partnerships for long-term value creation
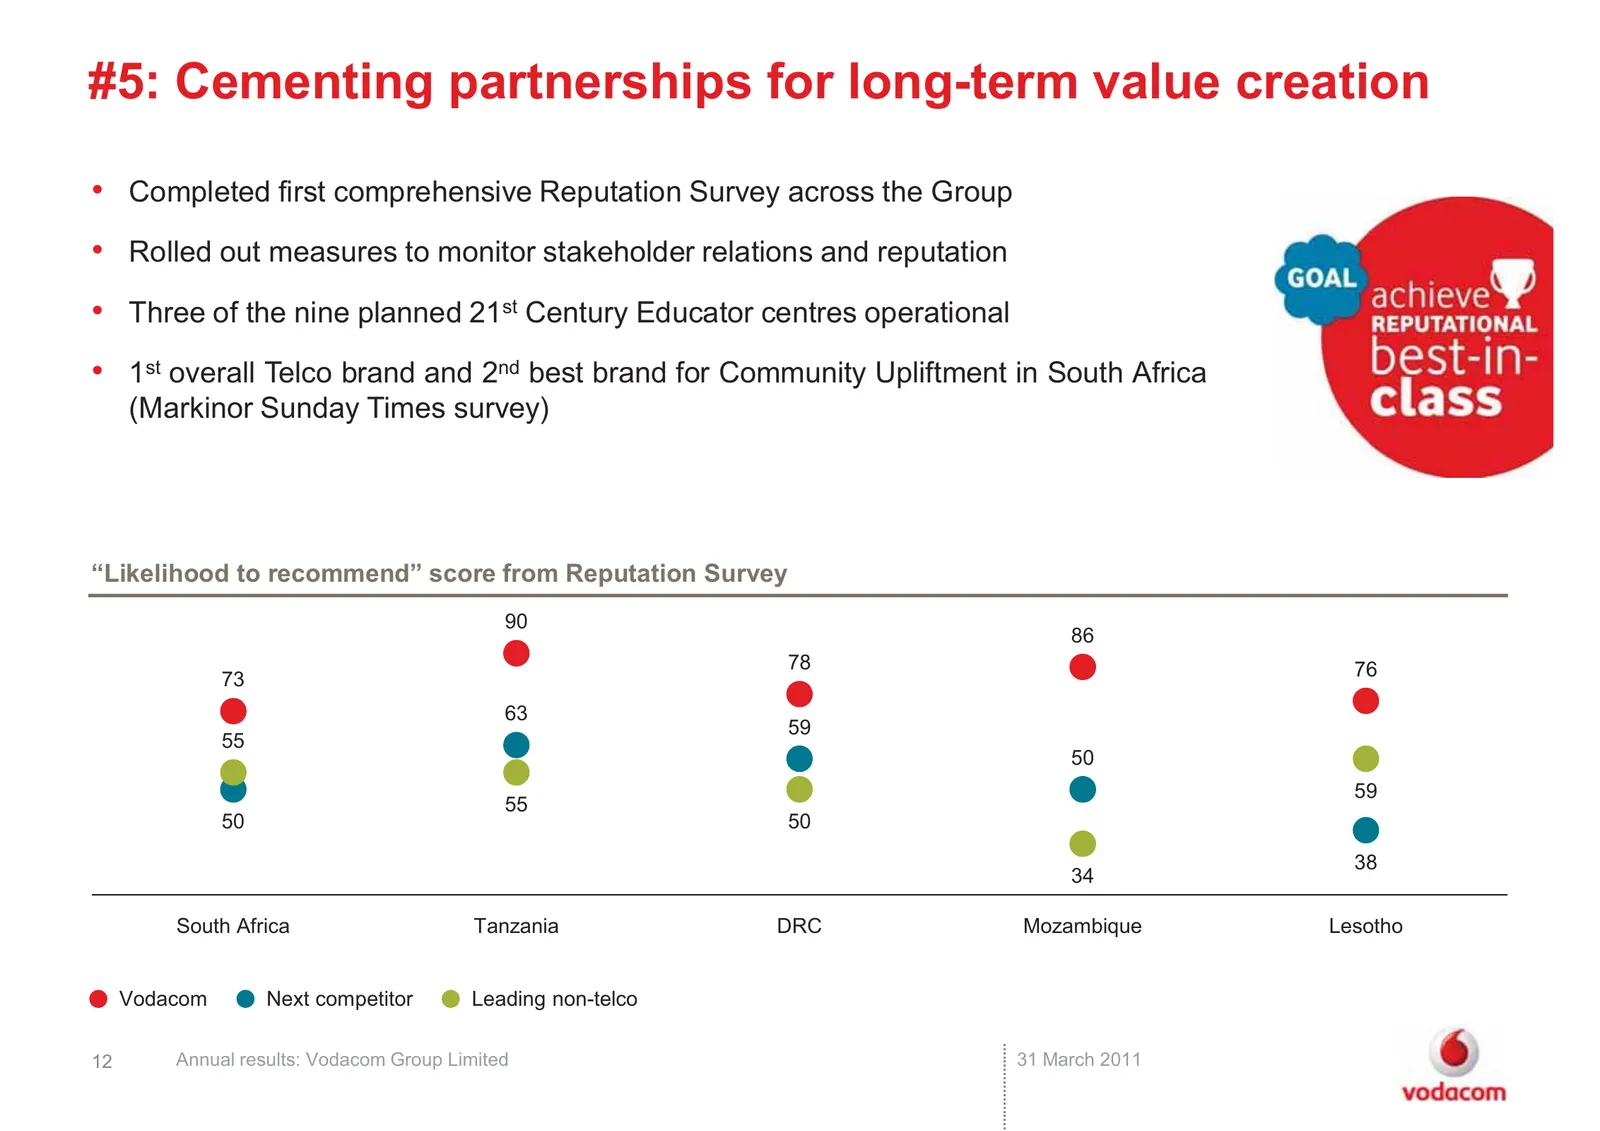
#5: Cementing partnerships for long-term value creation • Completed first comprehensive Reputation Survey across the Group • Rolled out measures to monitor stakeholder relations and reputation • Three of the nine planned 21st Century Educator centres operational • 1st overall Telco brand and 2nd bes

Slide 13: Highlights
Highlights 13 Annual results: Vodacom Group Limited 31 March 2011
Slide 14: Highlights for the 2011 year
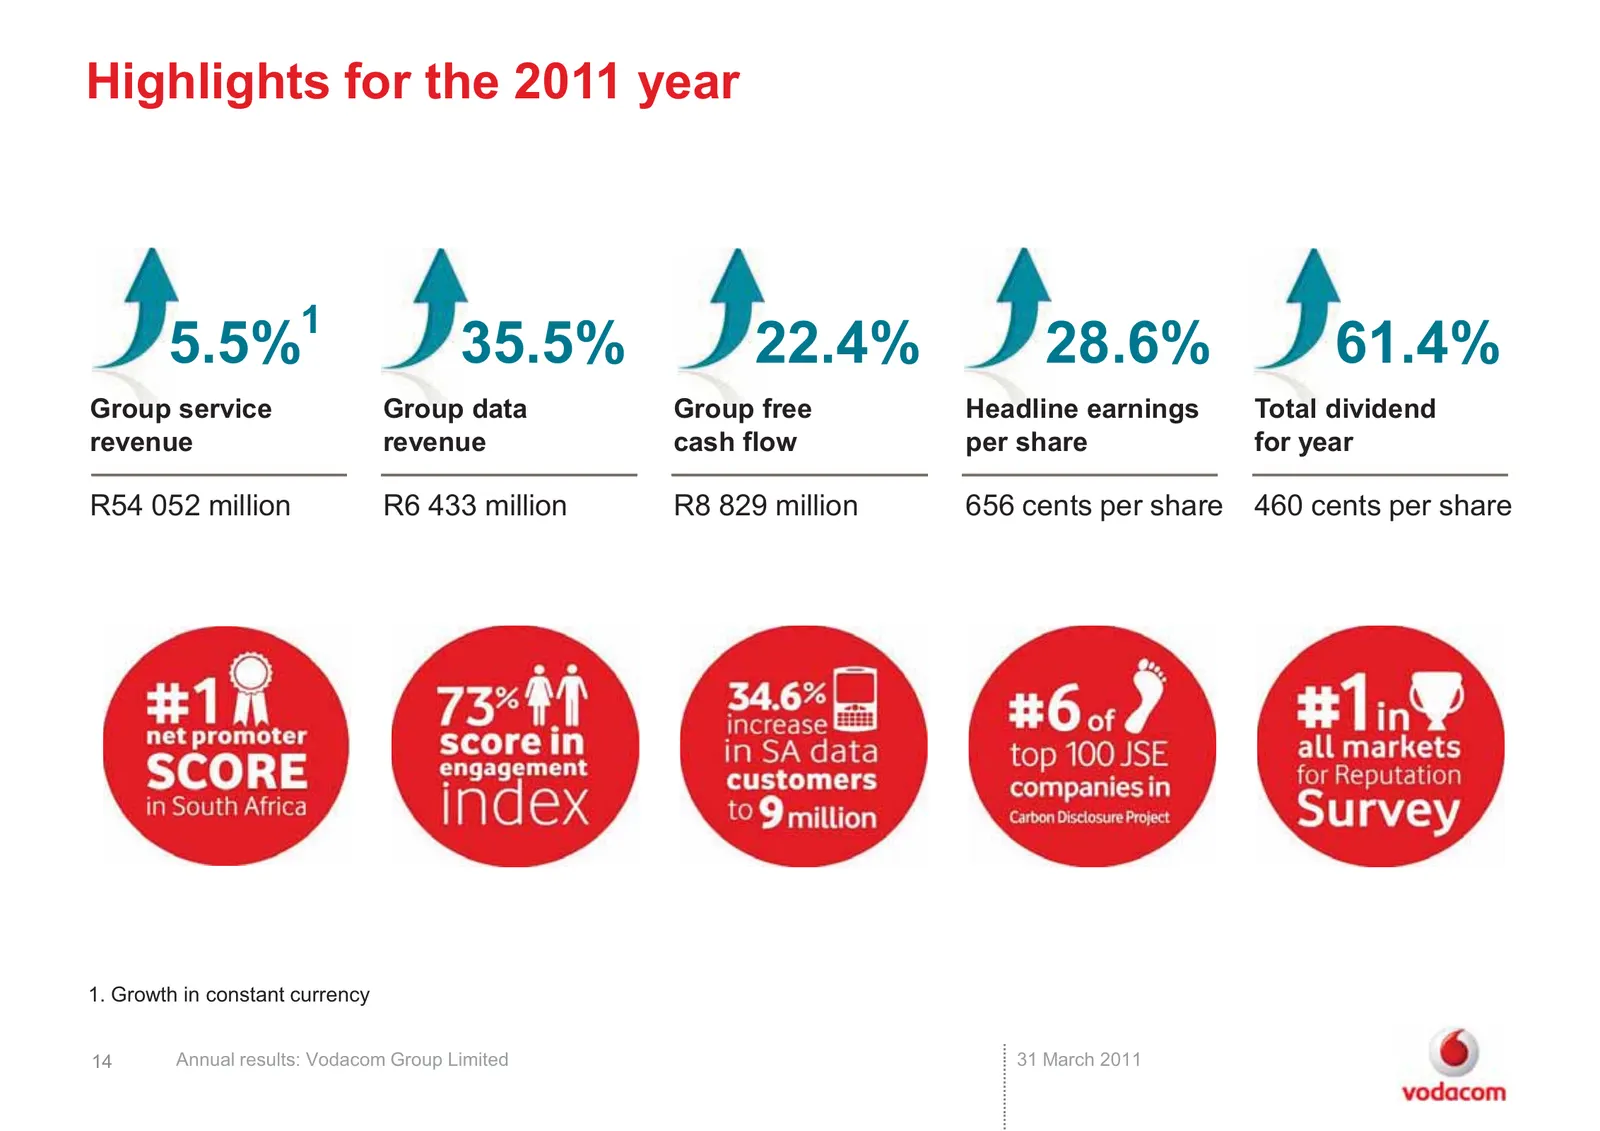
Highlights for the 2011 year 1 5.5% 35.5% 22.4% 28.6% 61.4% Group service Group data Group free Headline earnings Total dividend revenue revenue cash flow per share for year R54 052 million R6 433 million R8 829 million 656 cents per share 460 cents per share 1. Growth in constant currency 14 Annual
Slide 15: Financial review
Financial review 15 Annual results: Vodacom Group Limited 31 March 2011
Slide 16: Group income statement
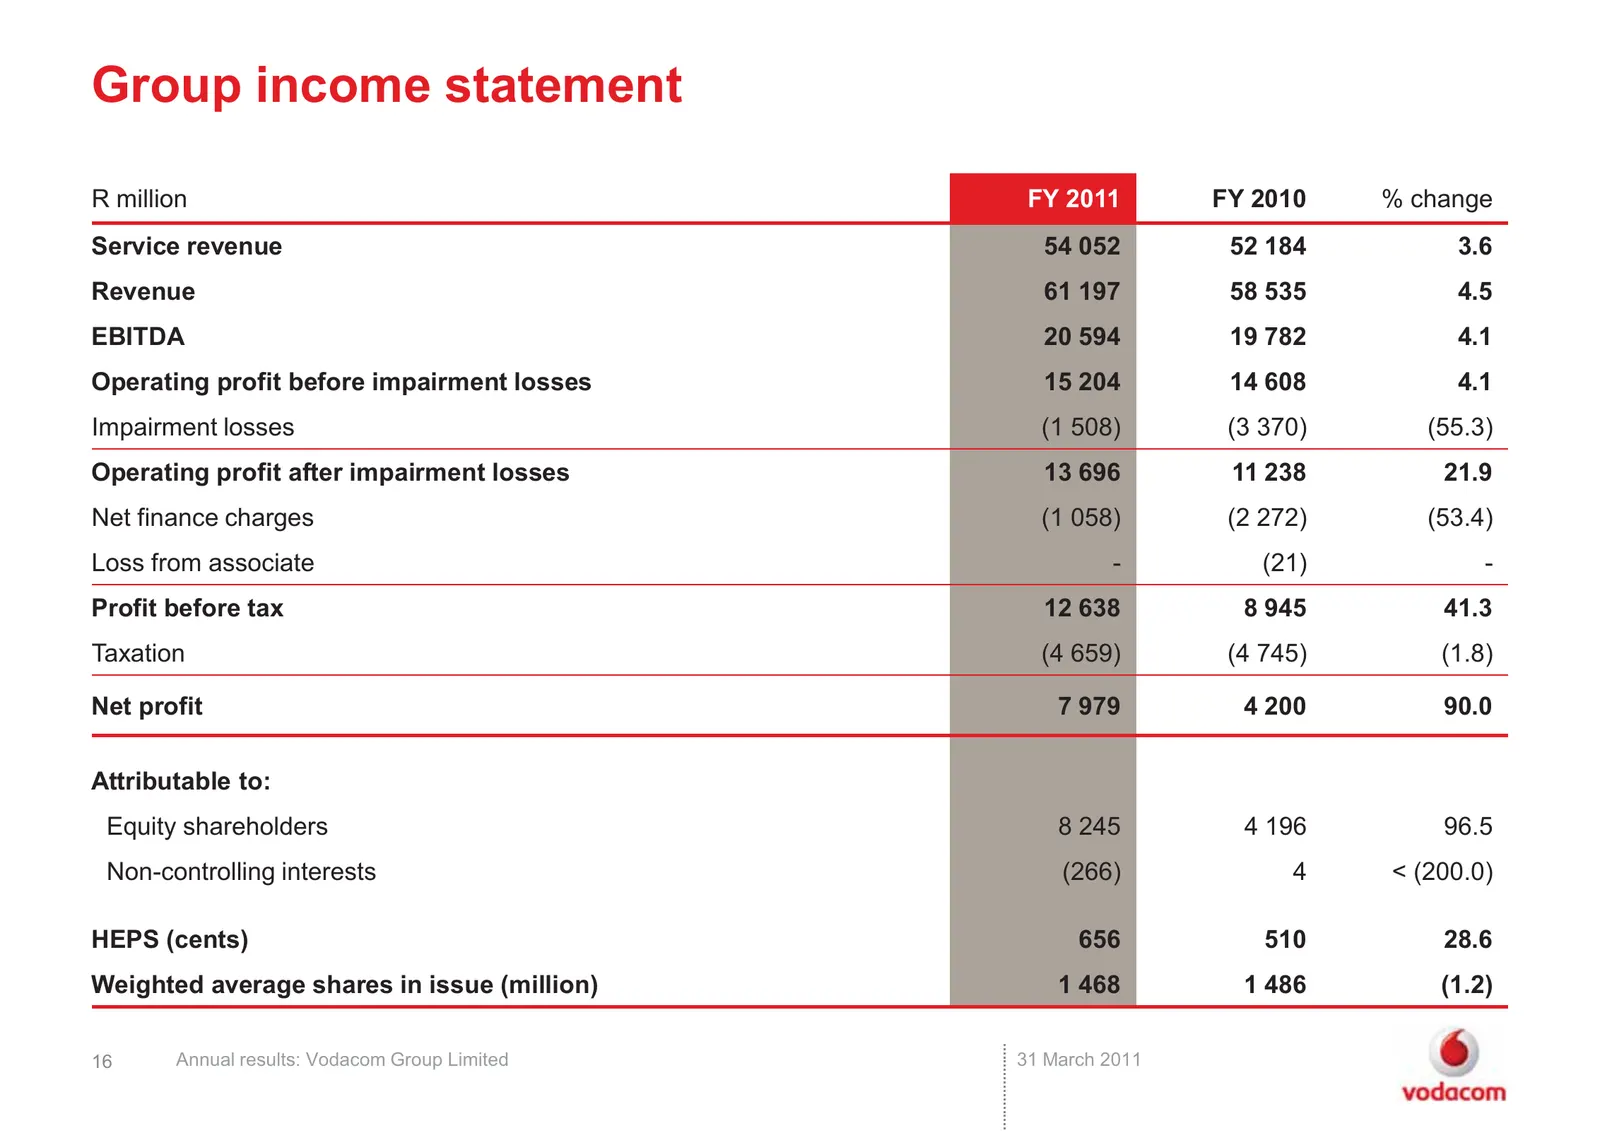
Group income statement R million FY 2011 FY 2010 % change Service revenue 54 052 52 184 3.6 Revenue 61 197 58 535 4.5 EBITDA 20 594 19 782 4.1 Operating profit before impairment losses 15 204 14 608 4.1 Impairment losses (1 508) (3 370) (55.3) Operating profit after impairment losses 13 696 11 238 2
Slide 17: Solid service revenue growth
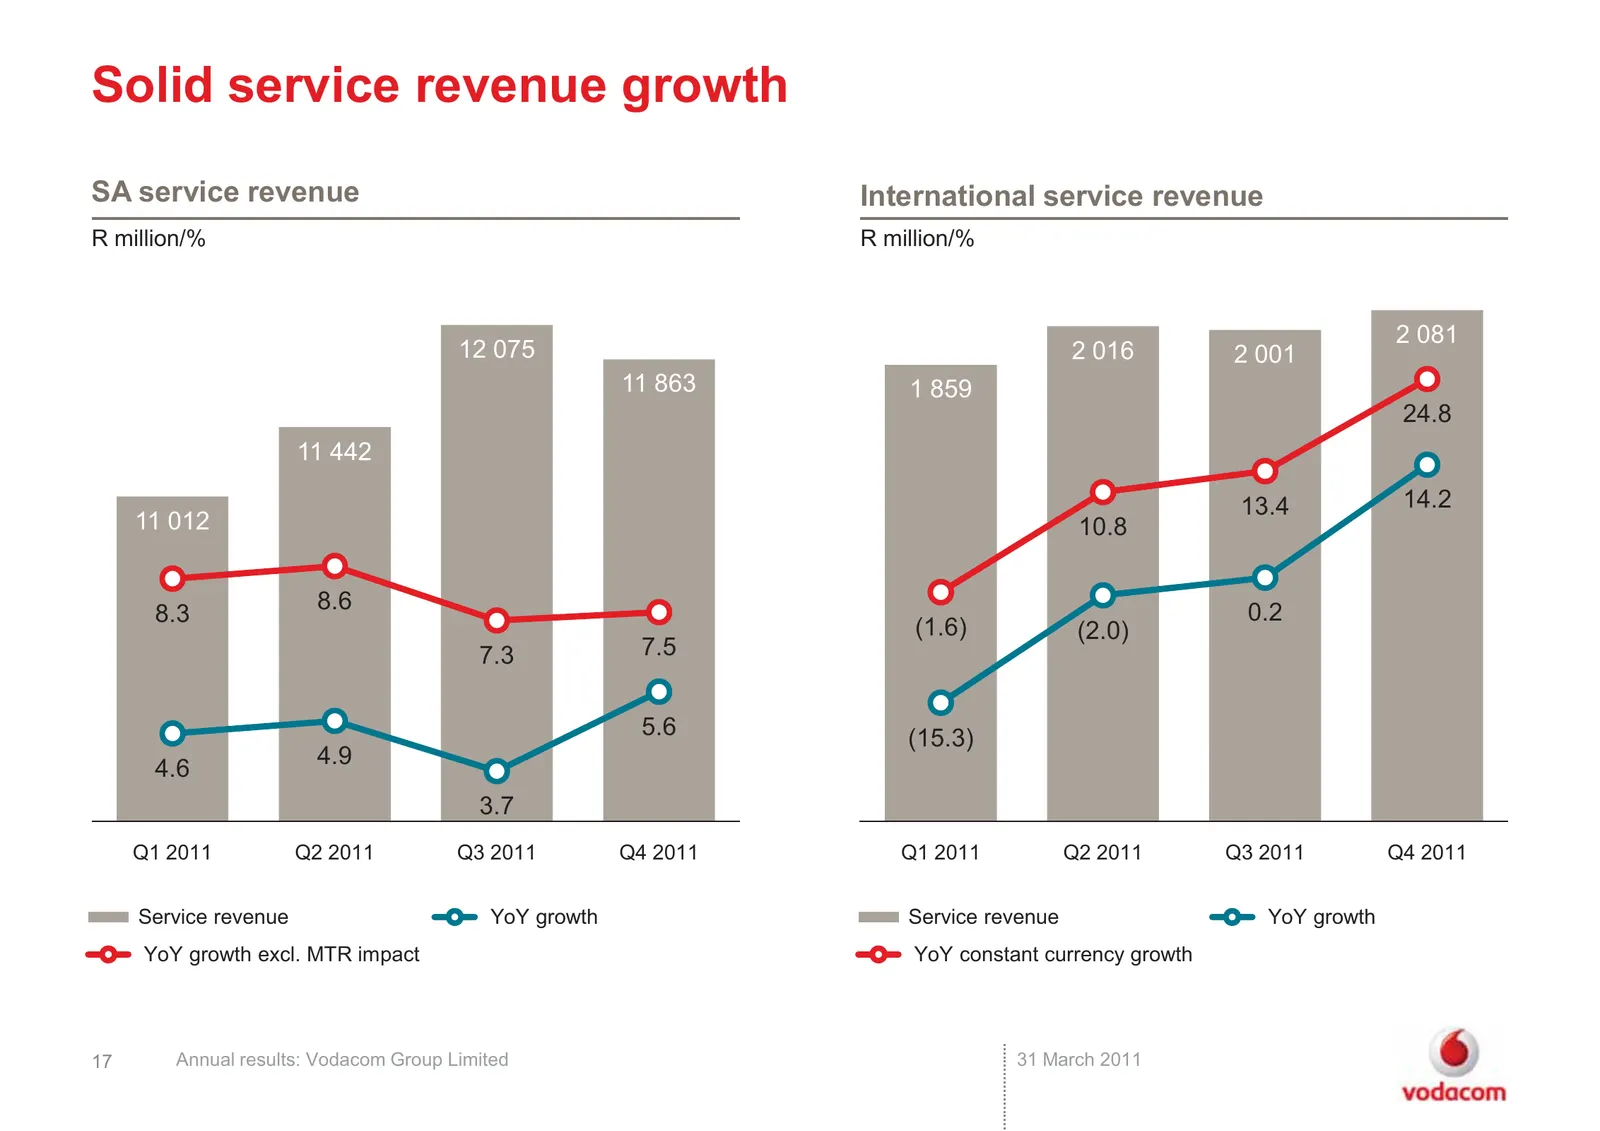
Solid service revenue growth SA service revenue International service revenue R million/% R million/% 2 081 12 075 2 016 2 001 11 863 1 859 24.8 11 442 13.4 14.2 11 012 10.8 8.6 0.2 8.3 (1.6) (2.0) 7.3 7.5 5.6 (15.3) 4.9 4.6 3.7 Q1 2011 Q2 2011 Q3 2011 Q4 2011 Q1 2011 Q2 2011 Q3 2011 Q4 2011 Service
Slide 18: Strong growth in mobile data and voice usage
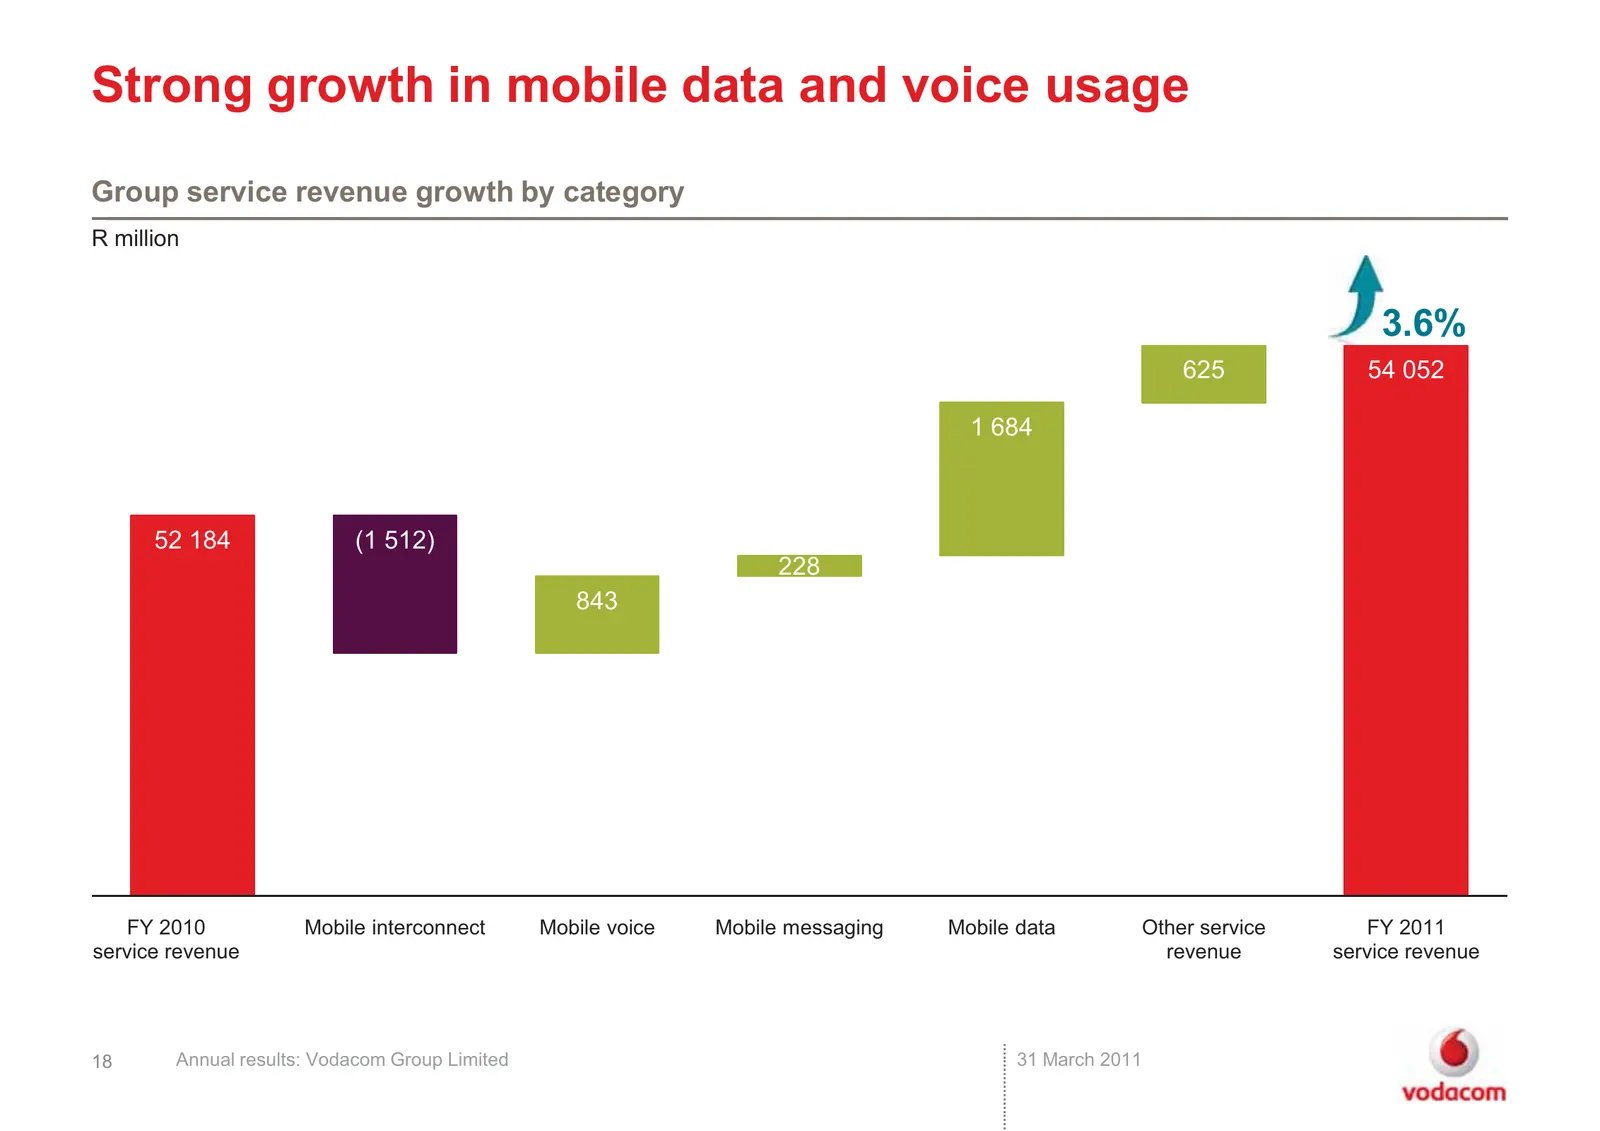
Strong growth in mobile data and voice usage Group service revenue growth by category R million 3.6% 625 54 052 1 684 52 184 (1 512) 228 843 FY 2010 Mobile interconnect Mobile voice Mobile messaging Mobile data Other service FY 2011 service revenue revenue service revenue 18 Annual results: Vodacom
Slide 19: Group operating expenses well contained
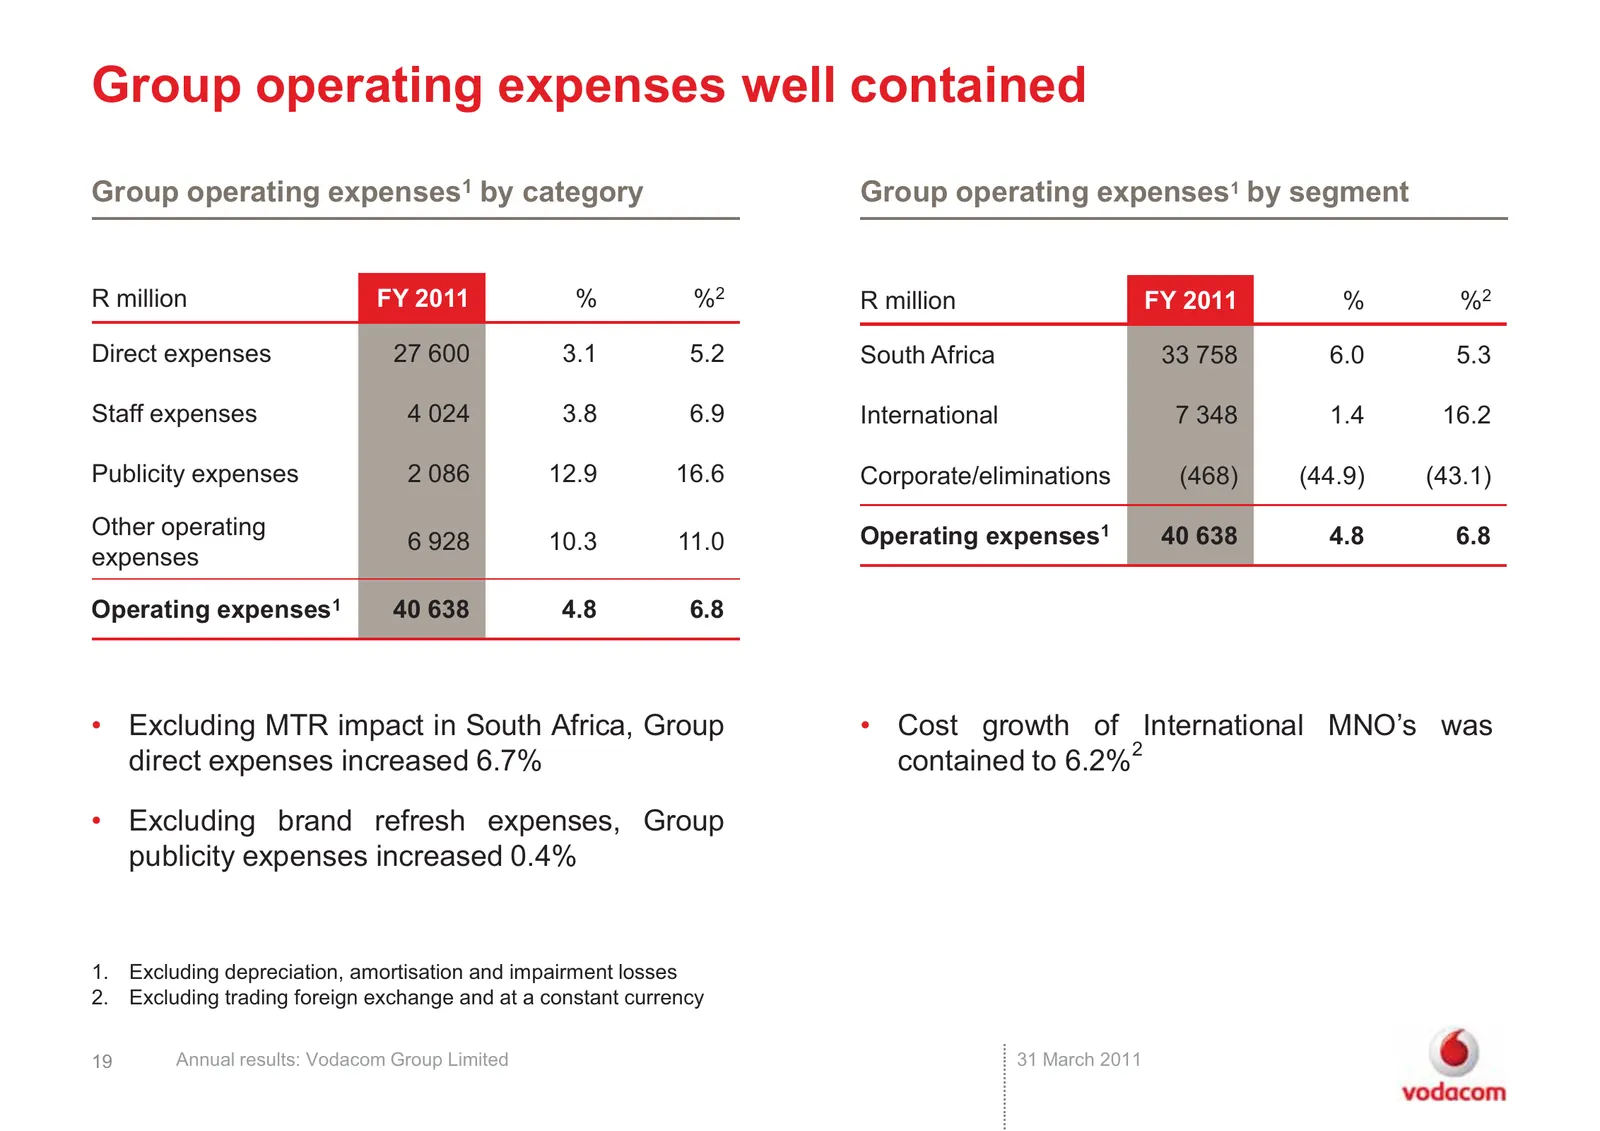
Group operating expenses well contained Group operating expenses1 by category Group operating expenses1 by segment R million FY 2011 % %2 R million FY 2011 % %2 Direct expenses 27 600 3.1 5.2 South Africa 33 758 6.0 5.3 Staff expenses 4 024 3.8 6.9 International 7 348 1.4 16.2 Publicity expenses 2 0
Slide 20: Delivered cost efficiency programme
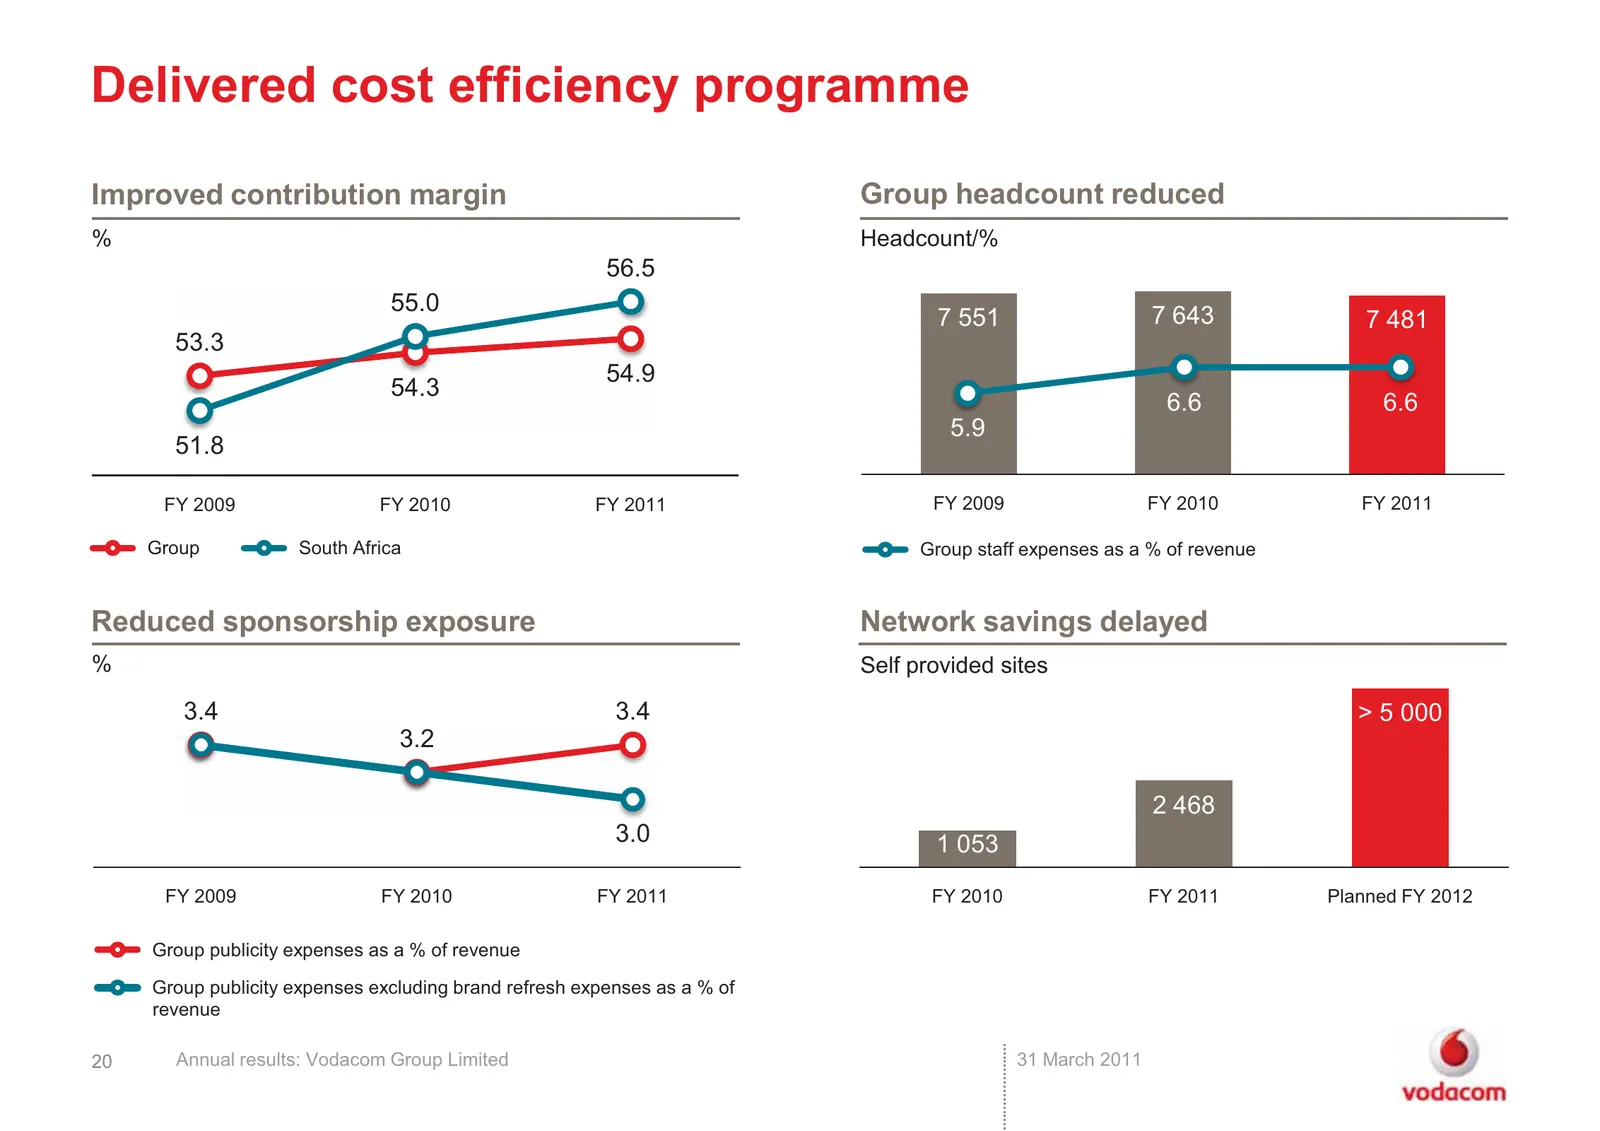
Delivered cost efficiency programme Improved contribution margin Group headcount reduced % Headcount/% 56.5 55.0 7 551 7 643 7 481 53.3 54.9 54.3 6.6 6.6 5.9 51.8 FY 2009 FY 2010 FY 2011 FY 2009 FY 2010 FY 2011 Group South Africa Group staff expenses as a % of revenue Reduced sponsorship exposure Ne
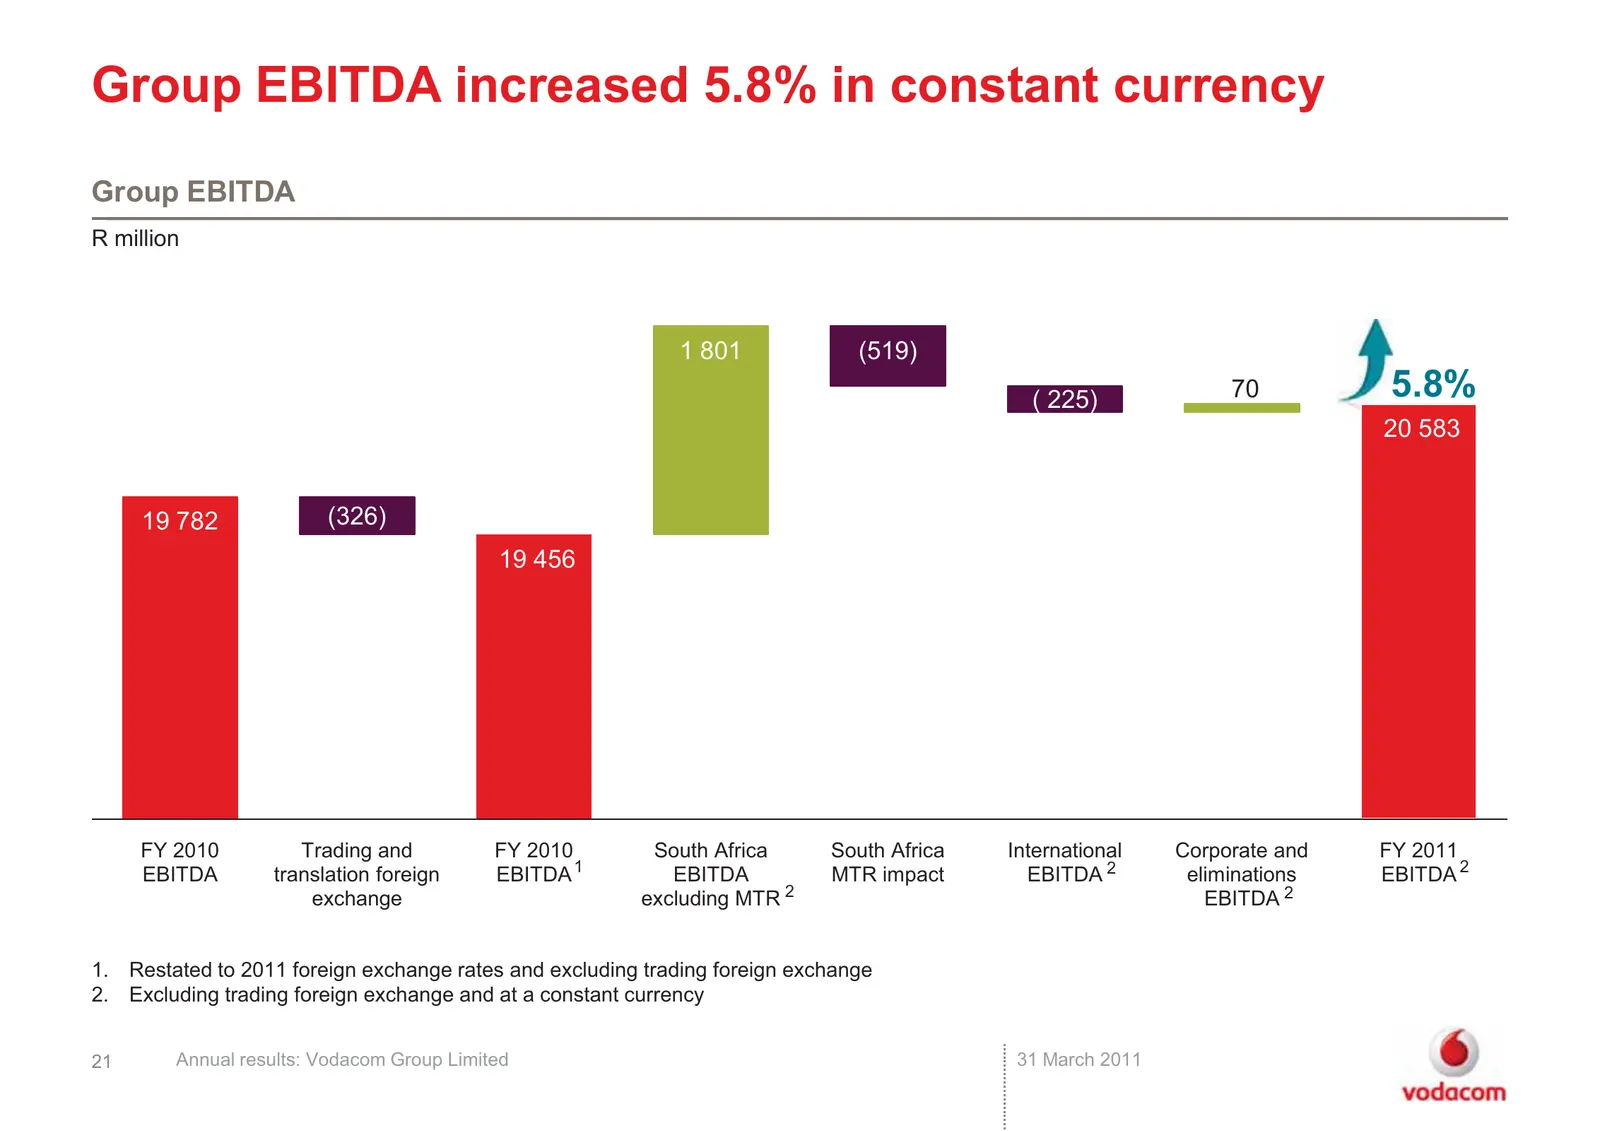
Slide 21: Group EBITDA increased 5.8% in constant currency
Group EBITDA increased 5.8% in constant currency Group EBITDA R million 1 801 (519) ( 225) 70 5.8% 20 513 20 594 20 583 19 782 (326) 19 456 FY 2010 Trading and FY 2010 South Africa South Africa International Corporate and FY 2011 EBITDA translation foreign EBITDA 1 EBITDA MTR impact EBITDA 2 elimina
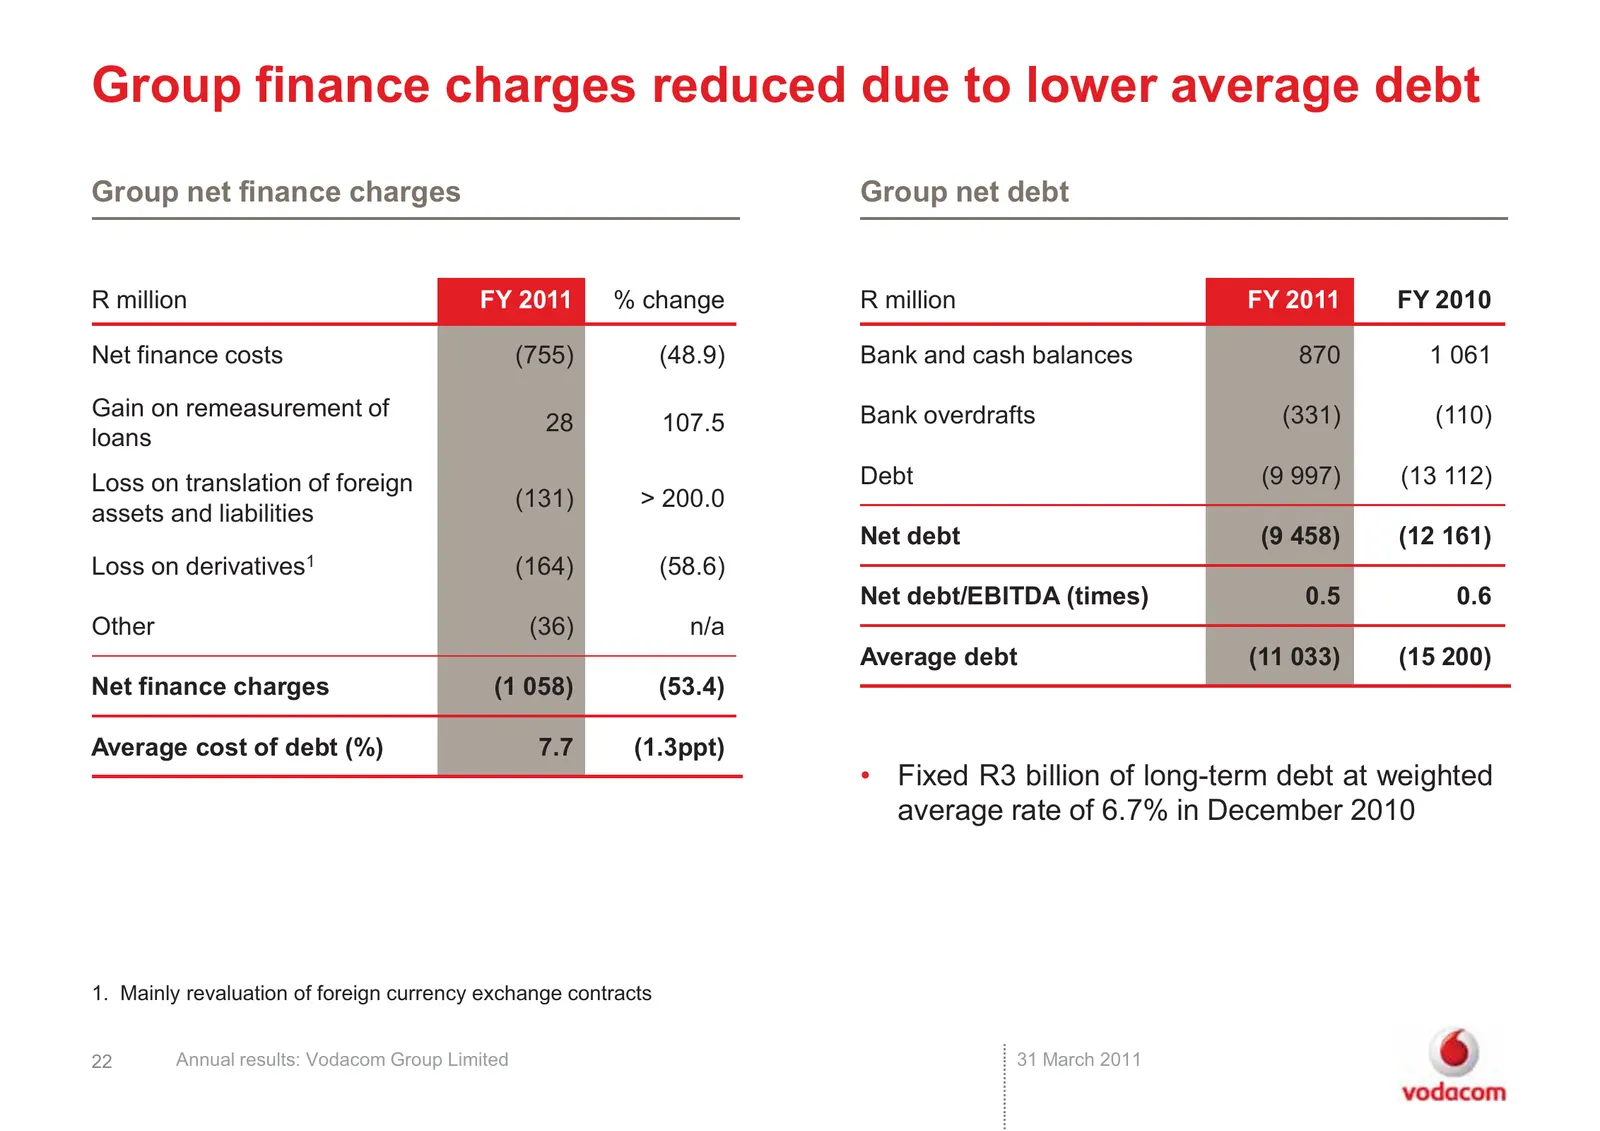
Slide 22: Group finance charges reduced due to lower average debt
Group finance charges reduced due to lower average debt Group net finance charges Group net debt R million FY 2011 % change R million FY 2011 FY 2010 Net finance costs (755) (48.9) Bank and cash balances 870 1 061 Gain on remeasurement of Bank overdrafts (331) (110) 28 107.5 loans Loss on translatio
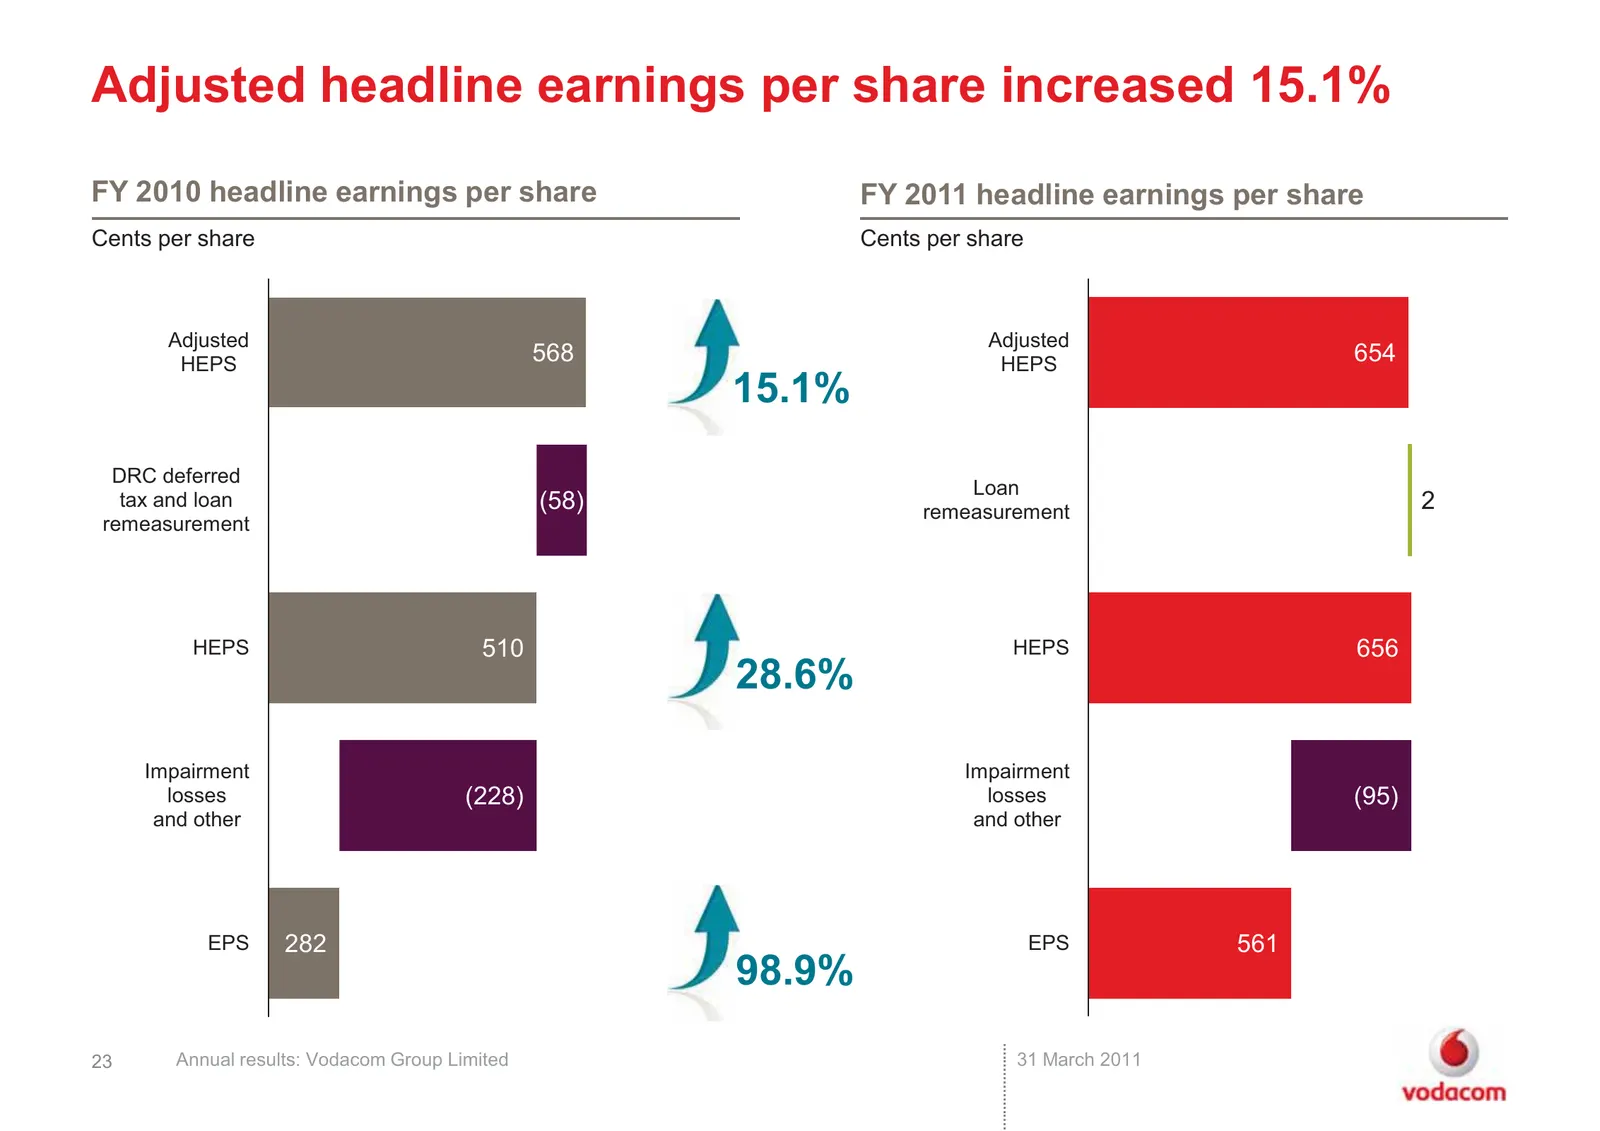
Slide 23: Adjusted headline earnings per share increased 15.1%
Adjusted headline earnings per share increased 15.1% FY 2010 headline earnings per share FY 2011 headline earnings per share Cents per share Cents per share Adjusted Adjusted HEPS 568 HEPS 654 15.1% DRC deferred Loan tax and loan (58) remeasurement 2 remeasurement HEPS 510 HEPS 656 28.6% Impairment
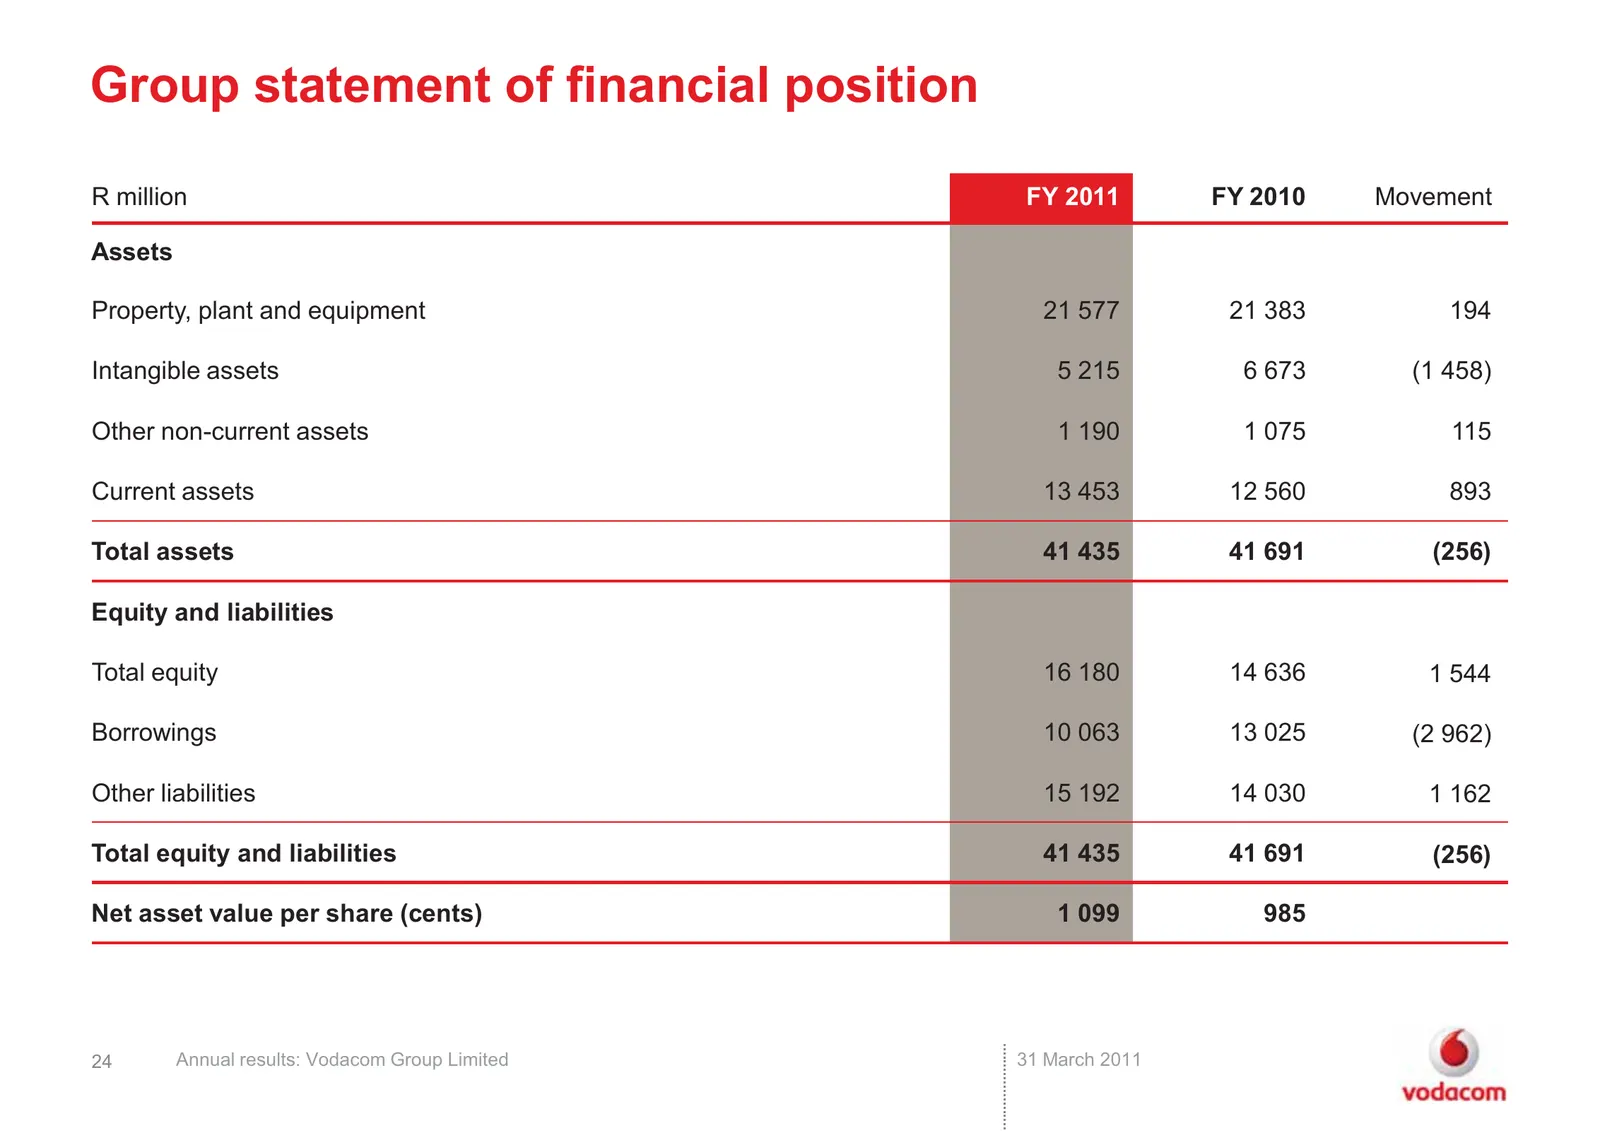
Slide 24: Group statement of financial position
Group statement of financial position R million FY 2011 FY 2010 Movement Assets Property, plant and equipment 21 577 21 383 194 Intangible assets 5 215 6 673 (1 458) Other non-current assets 1 190 1 075 115 Current assets 13 453 12 560 893 Total assets 41 435 41 691 (256) Equity and liabilities Tota
Slide 25: Movement in PPE and intangible assets
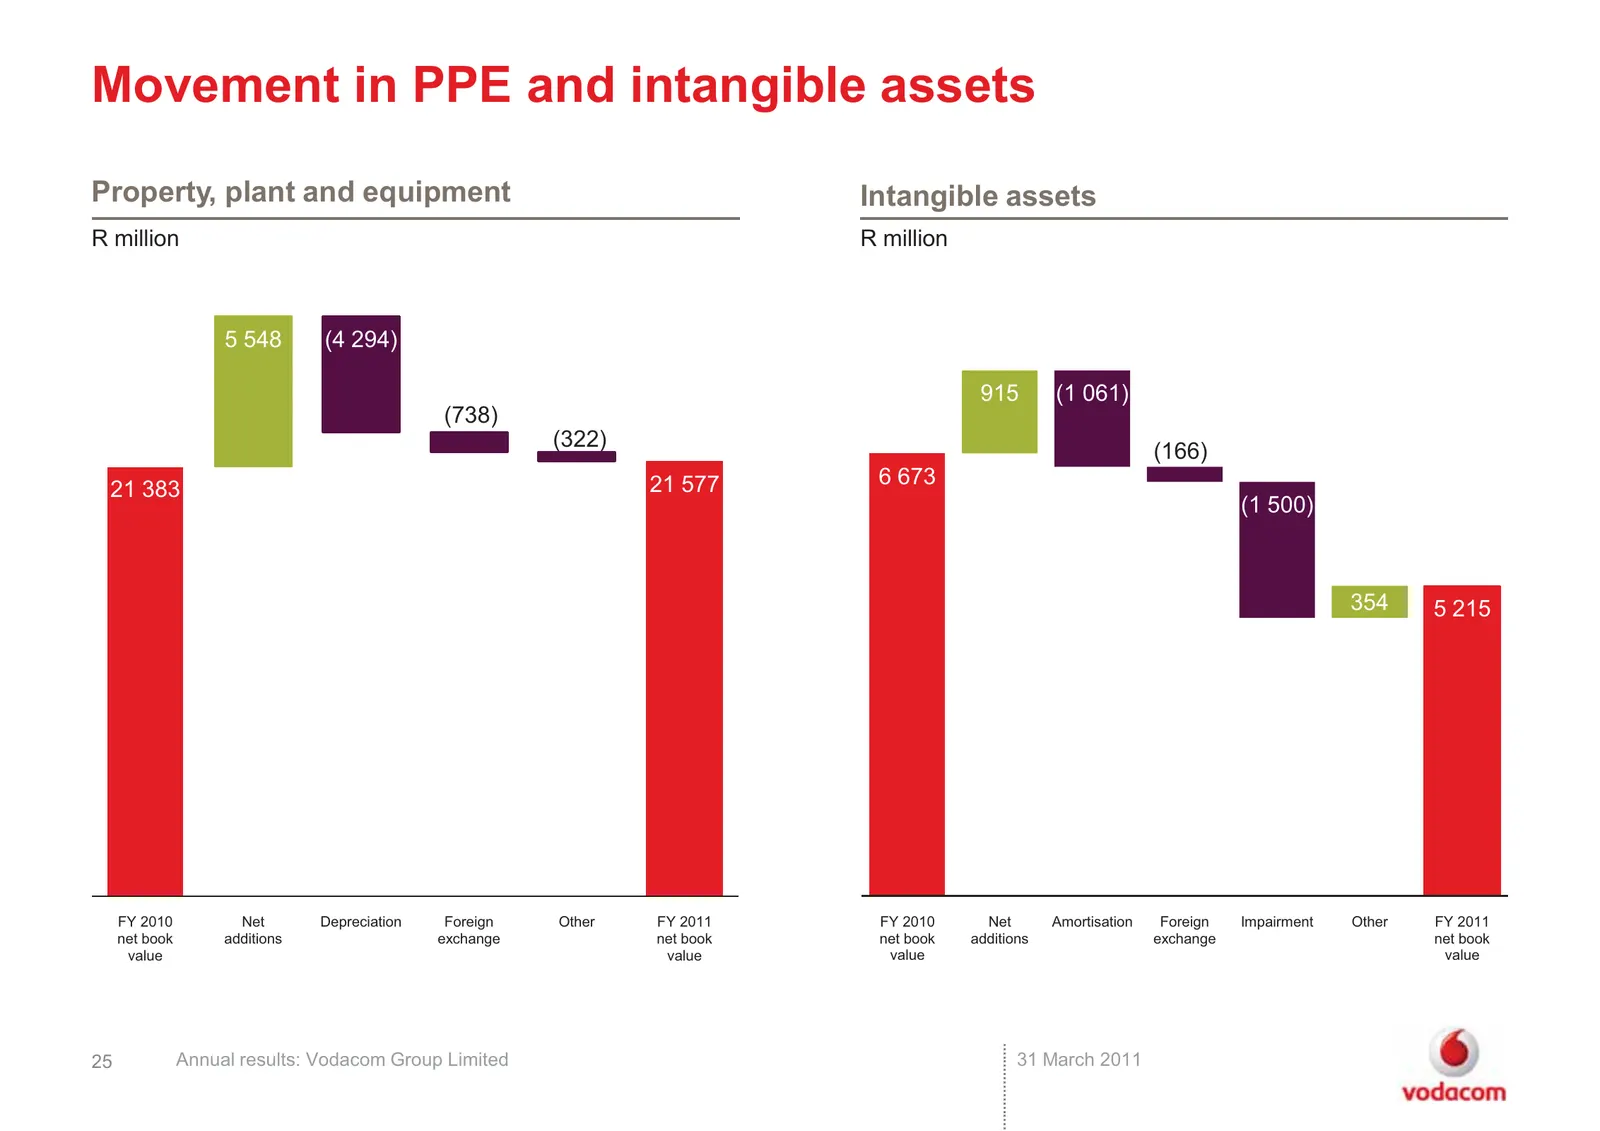
Movement in PPE and intangible assets Property, plant and equipment Intangible assets R million R million 5 548 (4 294) 915 (1 061) (738) (322) (166) 21 577 6 673 21 383 (1 500) 354 5 215 FY 2010 Net Depreciation Foreign Other FY 2011 FY 2010 Net Amortisation Foreign Impairment Other FY 2011 net boo
Slide 26: Capex investment focused on data networks
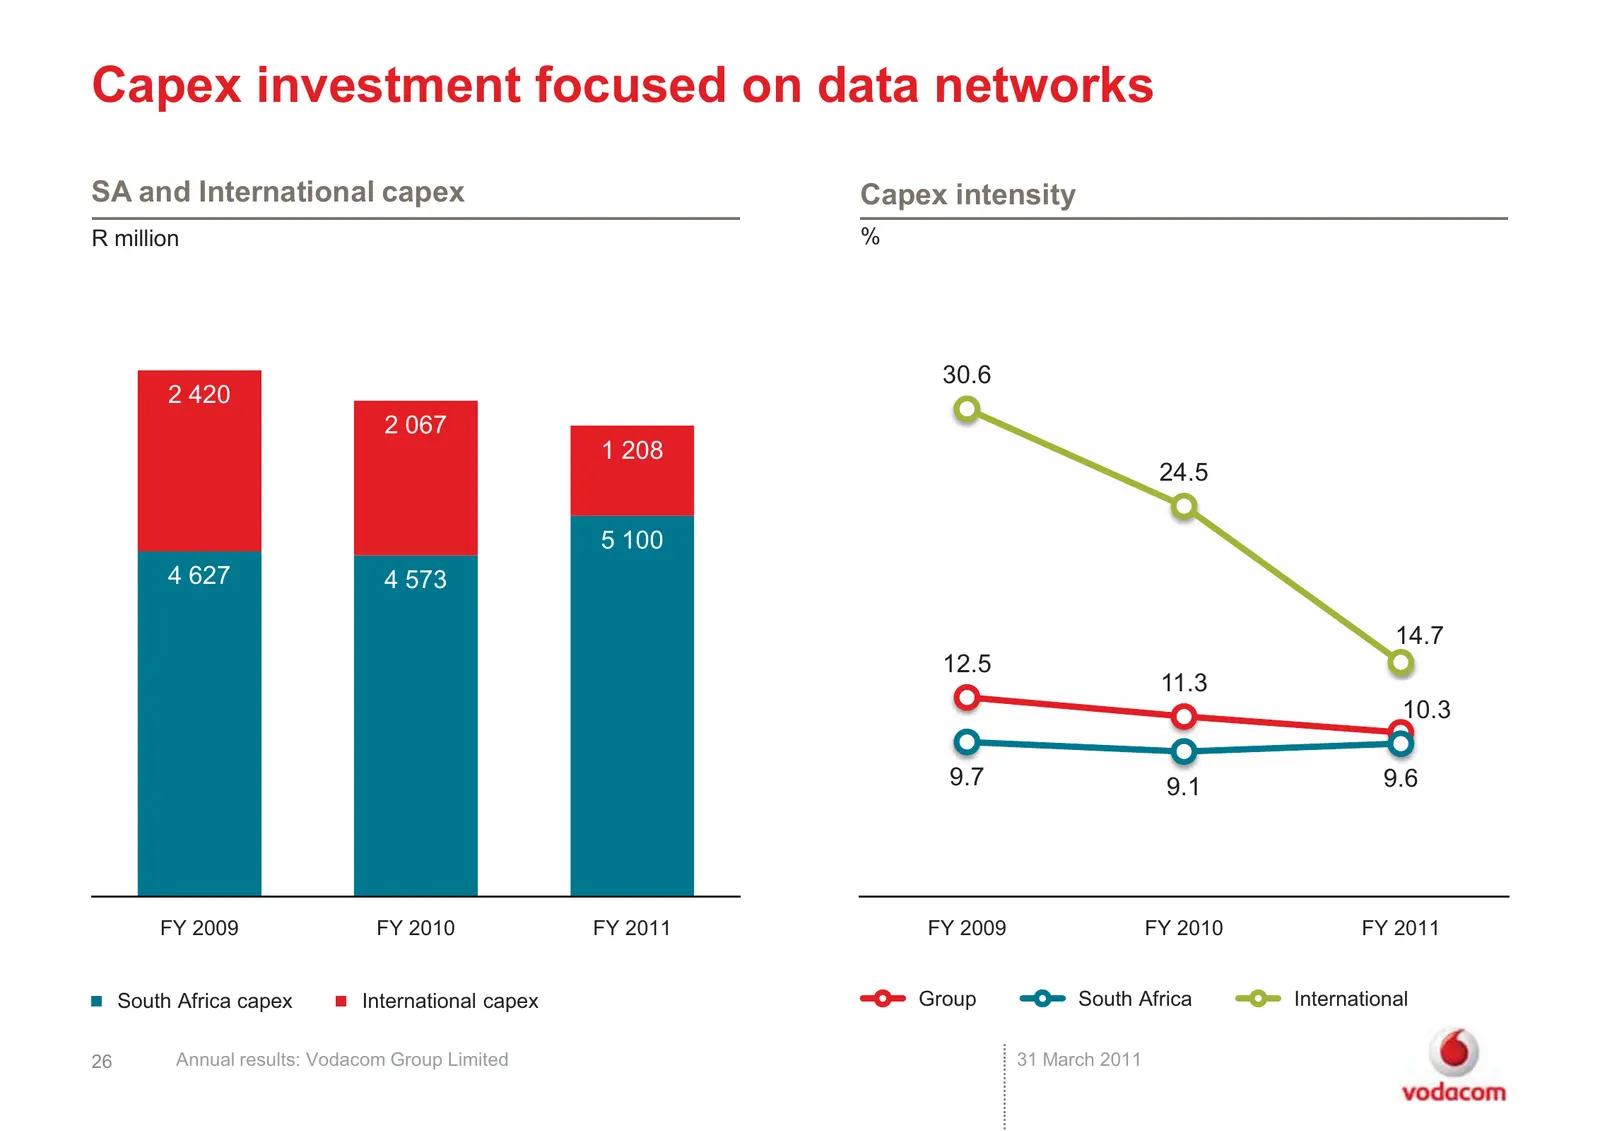
Capex investment focused on data networks SA and International capex Capex intensity R million % 30.6 2 420 2 067 1 208 24.5 5 100 4 627 4 573 14.7 12.5 11.3 10.3 9.7 9.1 9.6 FY 2009 FY 2010 FY 2011 FY 2009 FY 2010 FY 2011 South Africa capex International capex Group South Africa International 26 An
Slide 27: Group free cash flow increased 22.4%
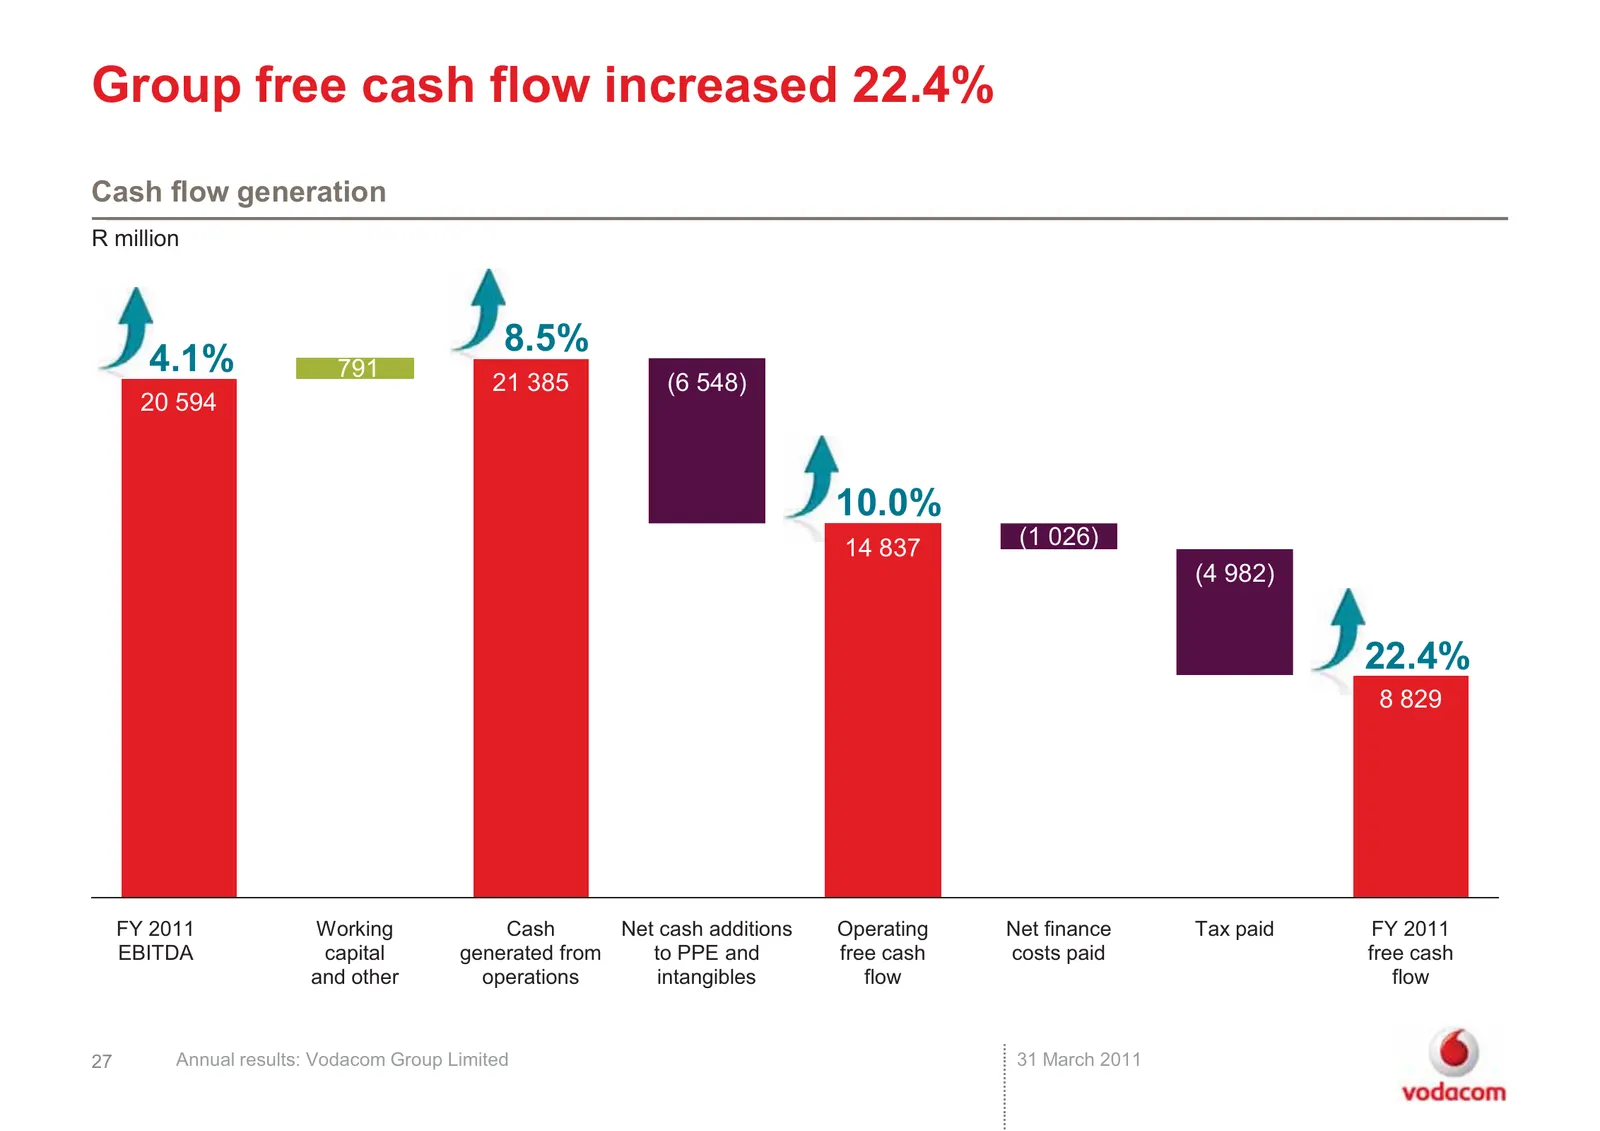
Group free cash flow increased 22.4% Cash flow generation R million 8.5% 4.1% 791 21 385 (6 548) 20 594 10.0% 14 837 (1 026) (4 982) 22.4% 8 829 FY 2011 Working Cash Net cash additions Operating Net finance Tax paid FY 2011 EBITDA capital generated from to PPE and free cash costs paid free cash and
Slide 28: Improving shareholder returns
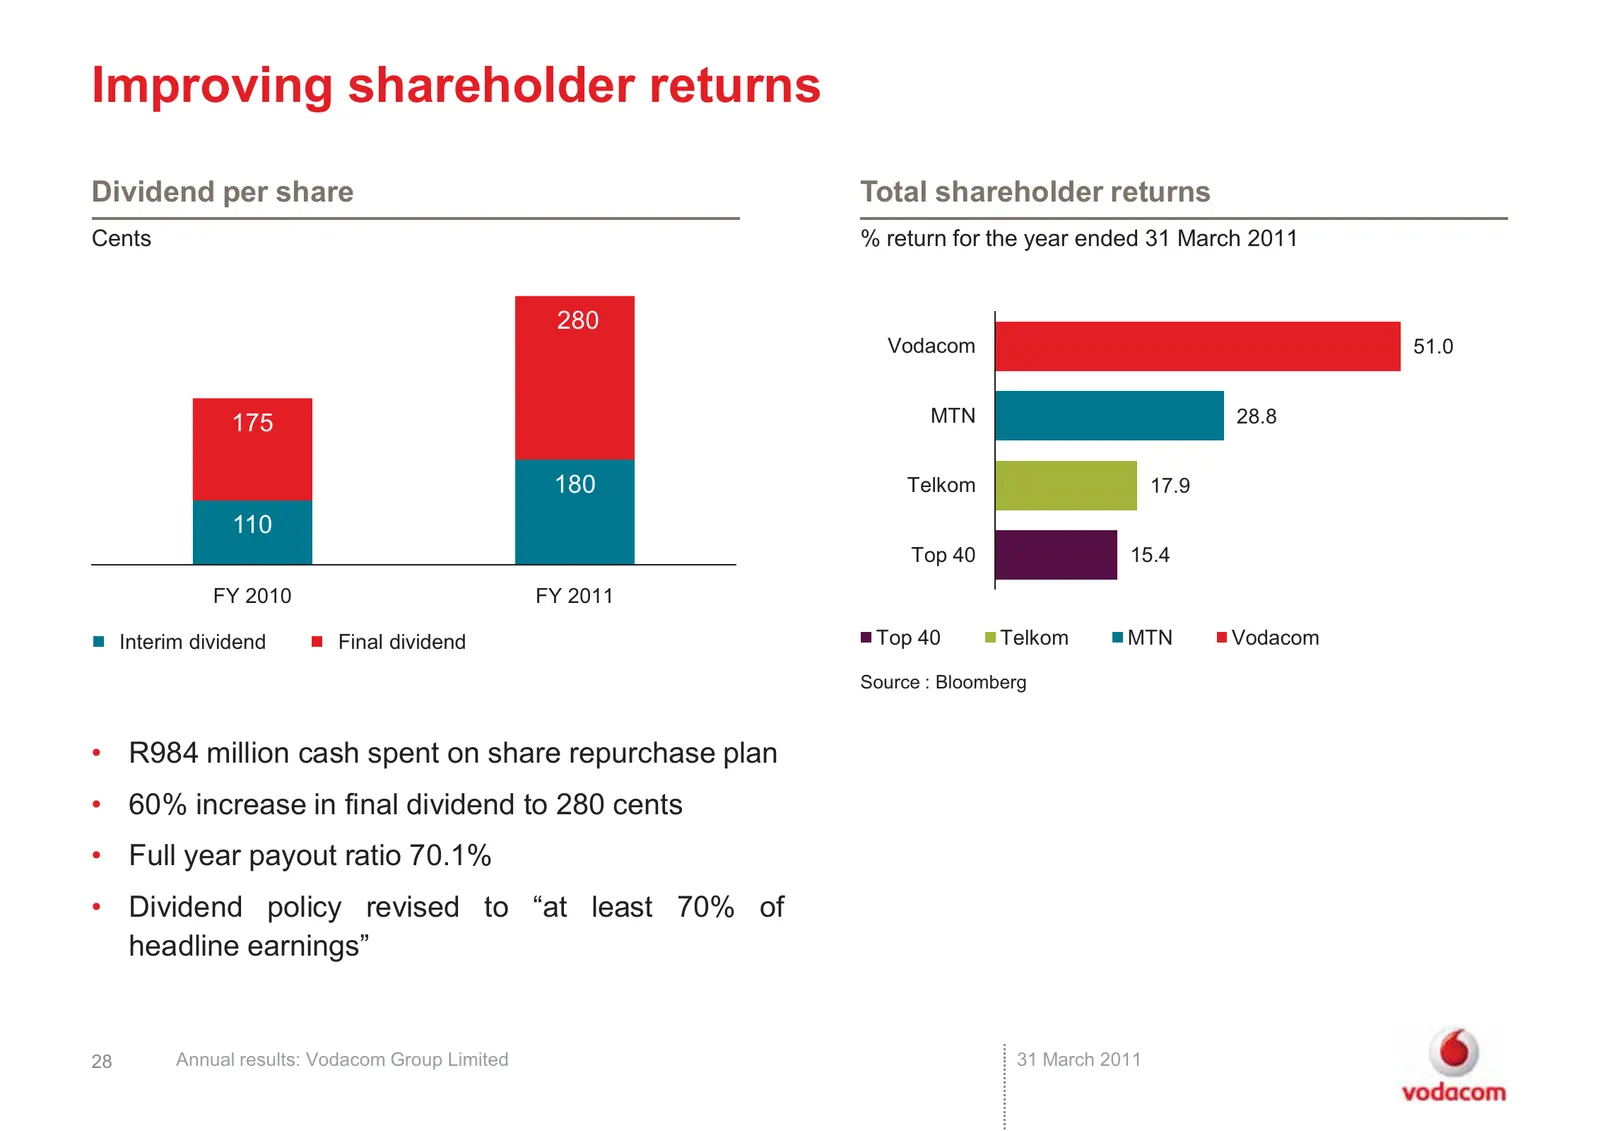
Improving shareholder returns Dividend per share Total shareholder returns Cents % return for the year ended 31 March 2011 280 Vodacom 51.0 175 MTN 28.8 180 Telkom 17.9 110 Top 40 15.4 FY 2010 FY 2011 Interim dividend Final dividend Top 40 Telkom MTN Vodacom Source : Bloomberg • R984 million cash sp
Slide 29: Group medium-term targets remain unchanged
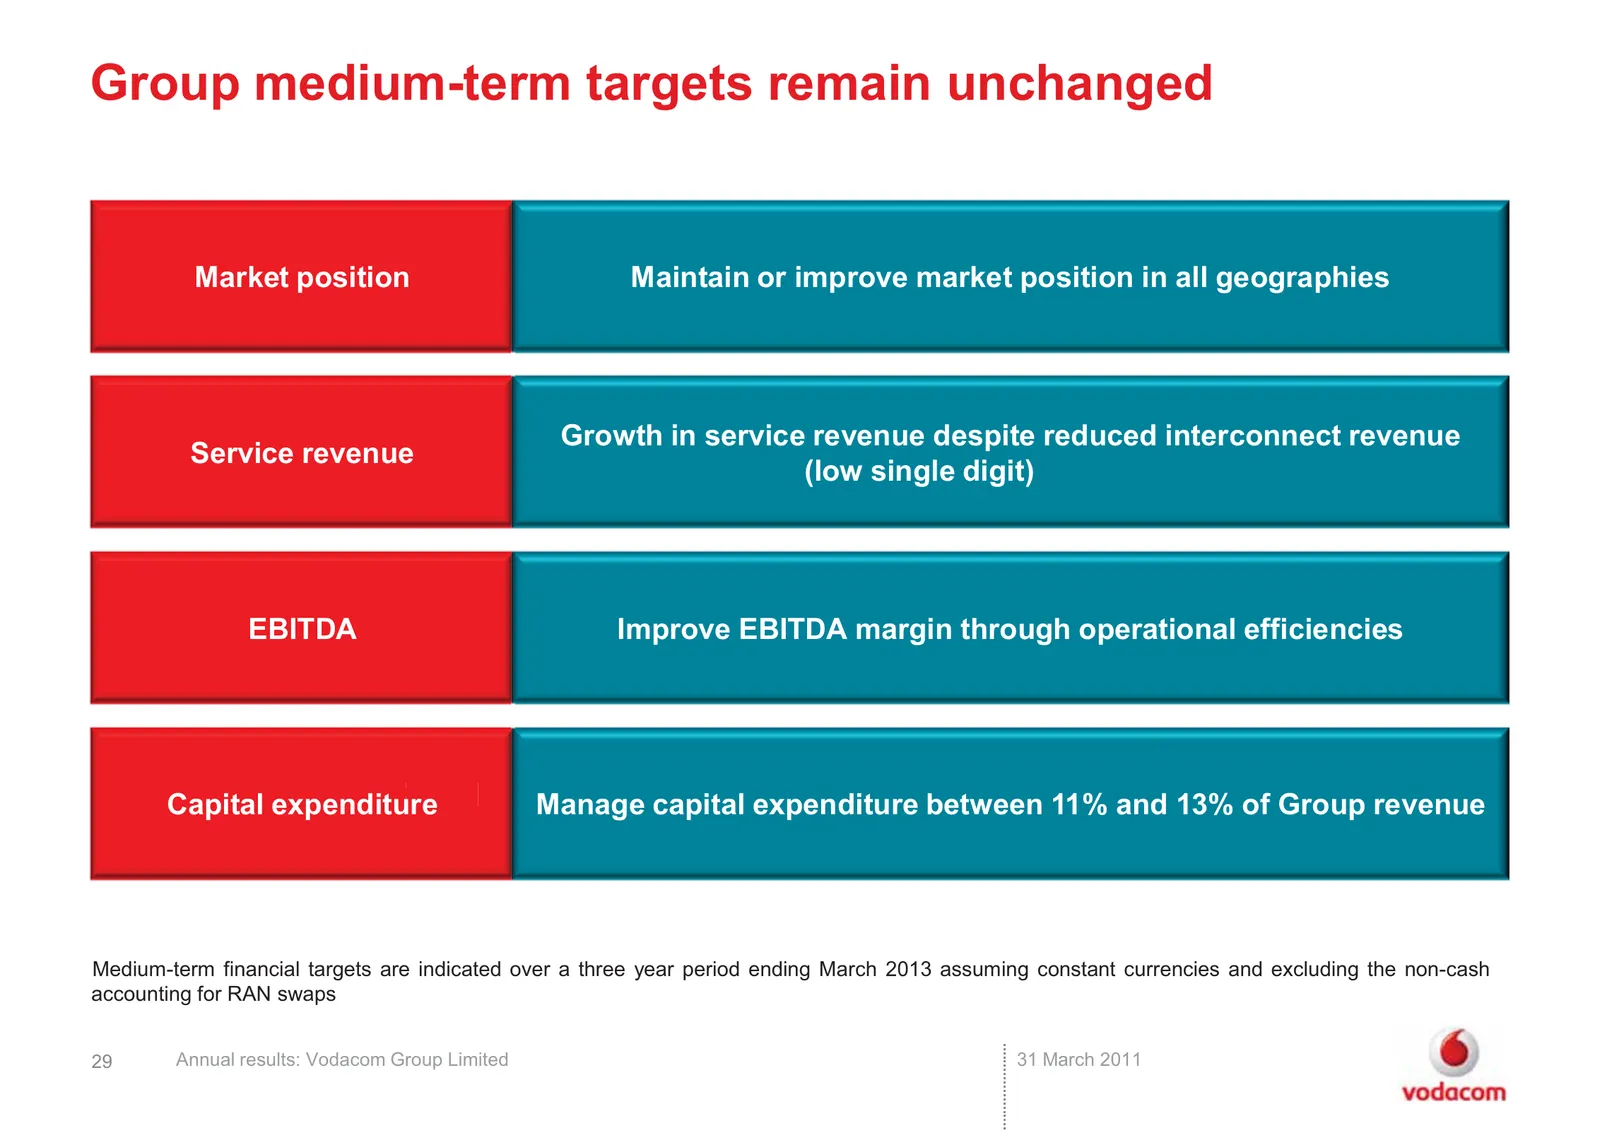
Group medium-term targets remain unchanged Market position Maintain or improve market position in all geographies Growth in service revenue despite reduced interconnect revenue Service revenue (low single digit) EBITDA Improve EBITDA margin through operational efficiencies Capex Capital expenditure
Slide 30: In summary
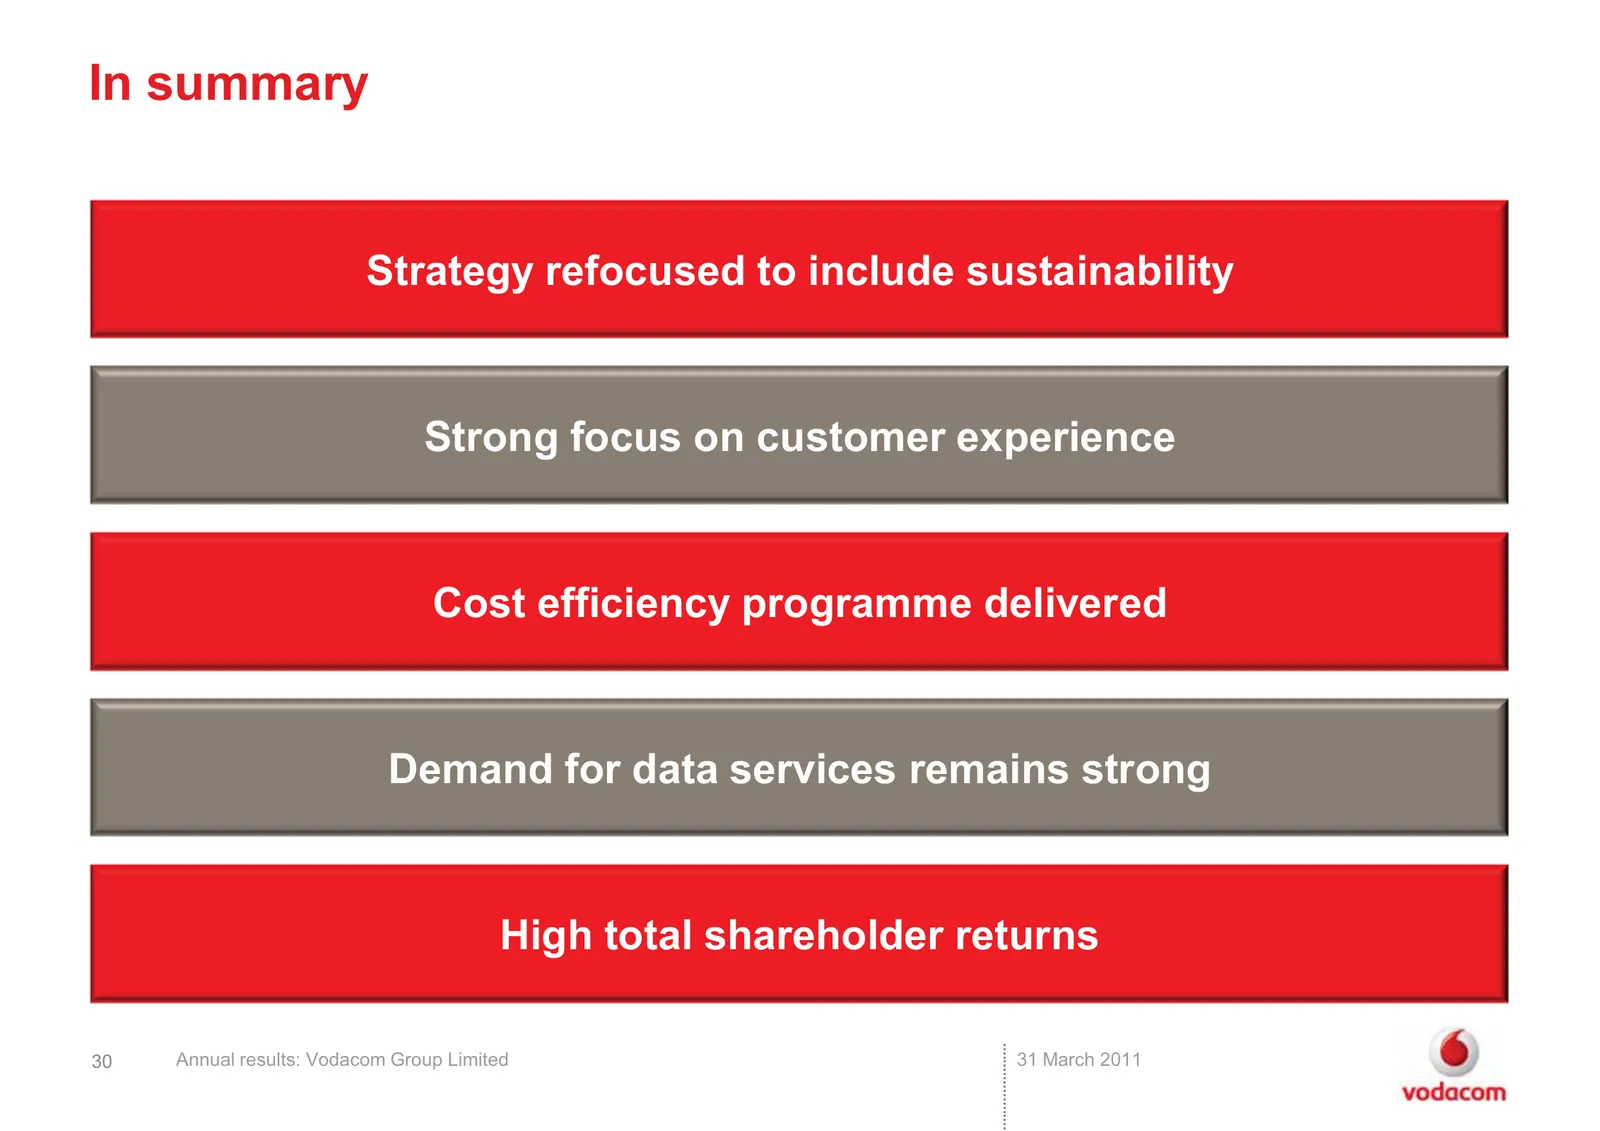
In summary Strategy refocused to include sustainability Strong focus on customer experience Cost efficiency programme delivered Demand for data services remains strong High total shareholder returns 30 Annual results: Vodacom Group Limited 31 March 2011 30
Slide 31: Thank you
Thank you 31 Annual results: Vodacom Group Limited 31 March 2011
Slide 32: Definitions
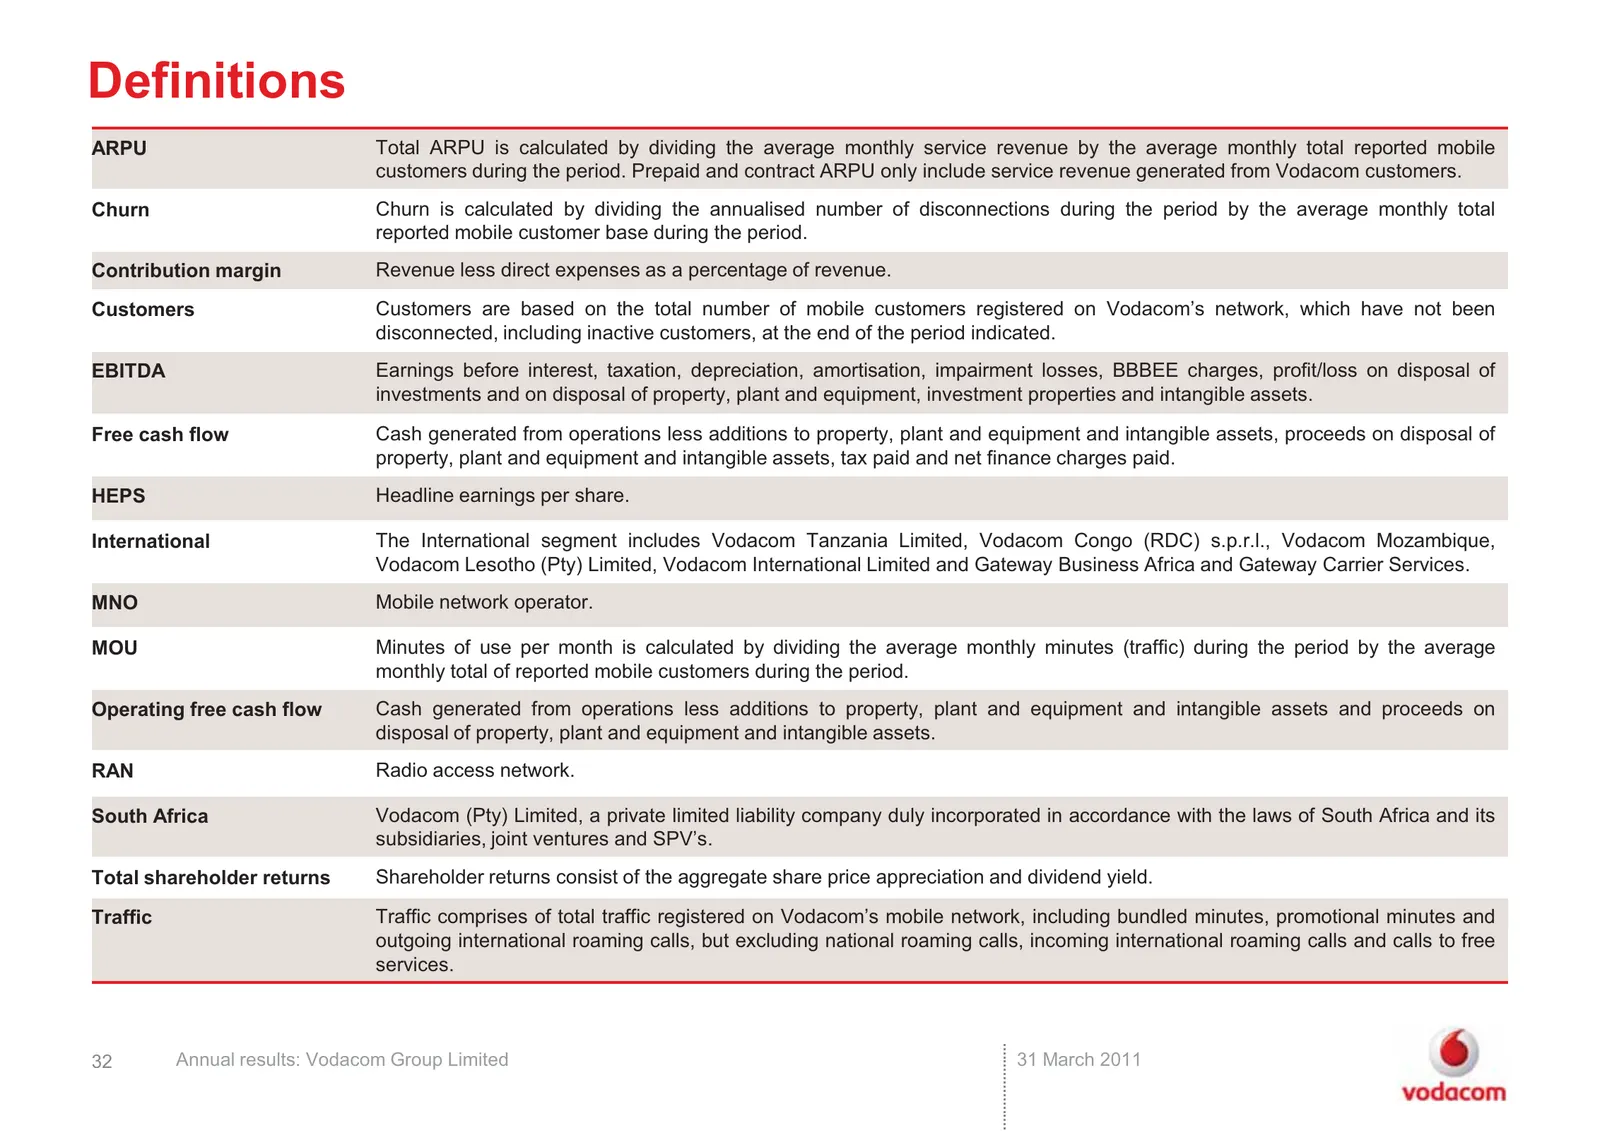
Definitions ARPU Total ARPU is calculated by dividing the average monthly service revenue by the average monthly total reported mobile customers during the period. Prepaid and contract ARPU only include service revenue generated from Vodacom customers. Churn Churn is calculated by dividing the annua
Slide 33: Forward-looking statements
Forward-looking statements This presentation which sets out the annual results for Vodacom Group Limited for the year ended 31 March 2011 contains 'forward-looking statements' with respect to the Group’s financial condition, results of operations and businesses and certain of the Group’s plans and o
Slide 34: Investor Relations
Investor Relations www.vodacom.com Belinda Williams +27 11 653 5195 Annual results for the year ended 31 March 2011 34 Annual results: Vodacom Group Limited 31 March 2011
Source: Internet Archive copy of vodacom.com
More decks from Vodacom Group Limited
 H1 FY2027 Earnings Presentation40 slides · November 2026
 FY2026 Earnings Presentation39 slides · May 11, 2026
 Merger or Acquisition (December 2025)16 slides · Dec 4, 2025
 Q2 2026 Earnings Presentation39 slides · Nov 10, 2025
 FY2025 Earnings Presentation39 slides · May 19, 2025
 Investor Day (February 2025)34 slides · Feb 19, 2025