Priority Technology Holdings, Inc. · NASDAQ:PRTH
Priority Technology — M I Acquisitions — SPAC Merger (February 2018)
39 slides from Priority Technology's SPAC merger presentation, Feb 27, 2018

Slide 1: Technology Holdings Investor Presentation February 2018
Technology Holdings Investor Presentation February 2018
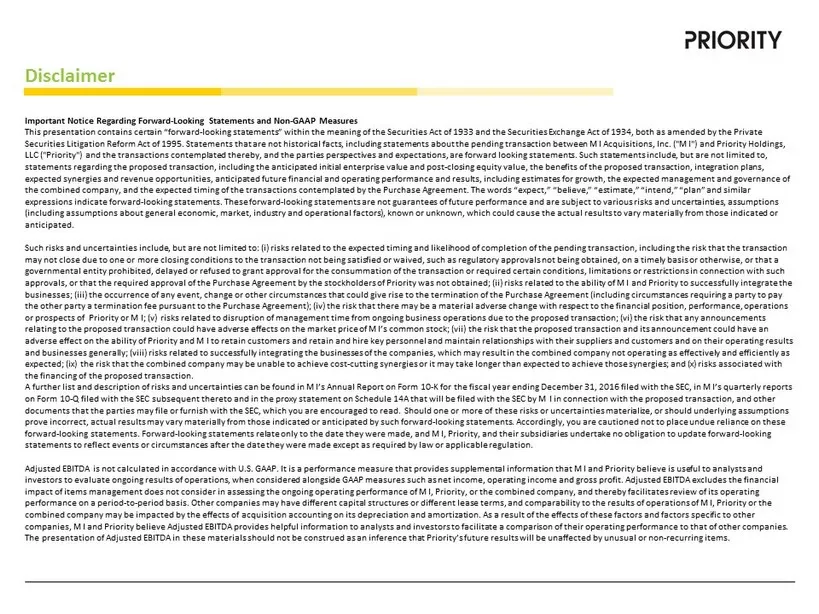
Slide 2: Disclaimer: Forward-Looking Statements and Non-GAAP Measures
Disclaimer Important Notice Regarding Forward - Looking Statements and Non - GAAP Measures This presentation contains certain “forward - looking statements” within the meaning of the Securities Act of 1933 and the Securit ies Exchange Act of 1934, both as amended by the Private Securities Litigation
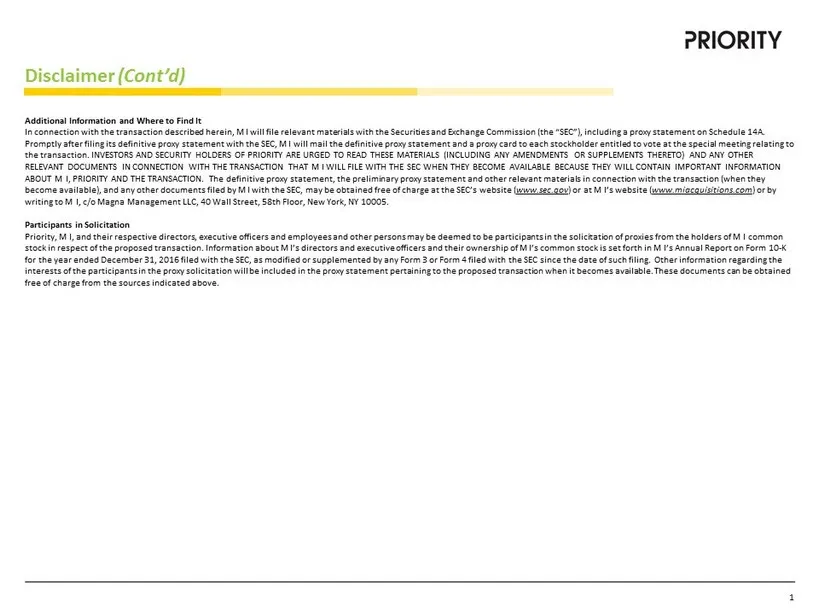
Slide 3: Disclaimer (Cont'd): Additional Information and Where to Find It
Disclaimer (Cont’d) Additional Information and Where to Find It In connection with the transaction described herein, M I will file relevant materials with the Securities and Exchange Commission (the “SEC”), including a proxy statement on Schedule 14 A. Promptly after filing its definitive proxy stat
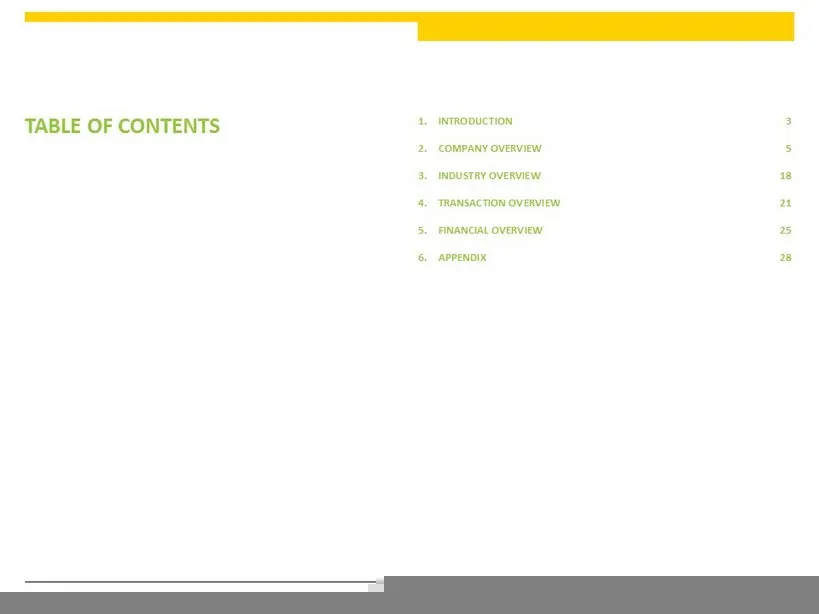
Slide 4: Table of Contents
TABLE OF CONTENTS 1. INTRODUCTION 3 2. COMPANY OVERVIEW 5 3. INDUSTRY OVERVIEW 18 4. TRANSACTION OVERVIEW 21 5. FINANCIAL OVERVIEW 25 6. APPENDIX 28 2

Slide 5: 1. Introduction
Technology Holdings 1. INTRODUCTION
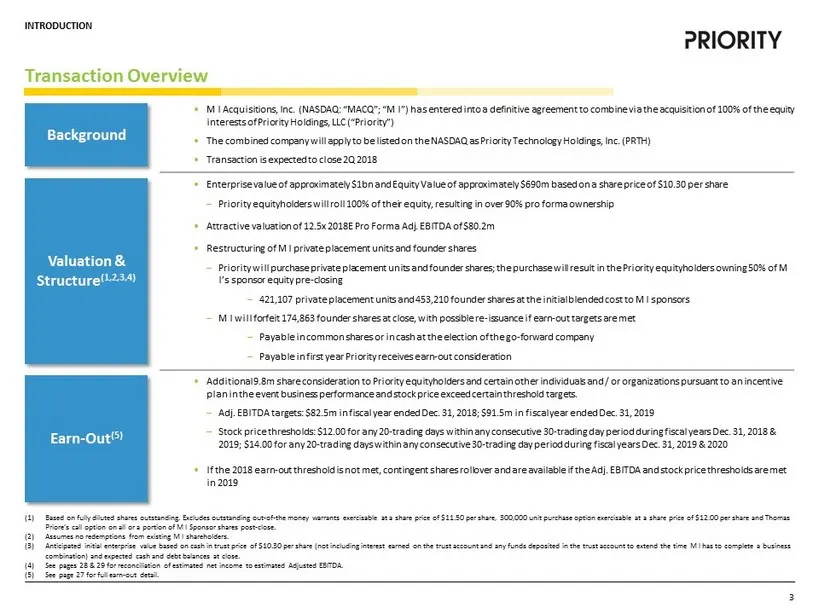
Slide 6: Transaction Overview
Transaction Overview Background • M I Acquisitions, Inc. (NASDAQ: “MACQ”; “M I”) has entered into a definitive agreement to combine via the acquisition of 100 % o f the equity interests of Priority Holdings, LLC (“Priority”) • The combined company will apply to be listed on the NASDAQ as Priority Te
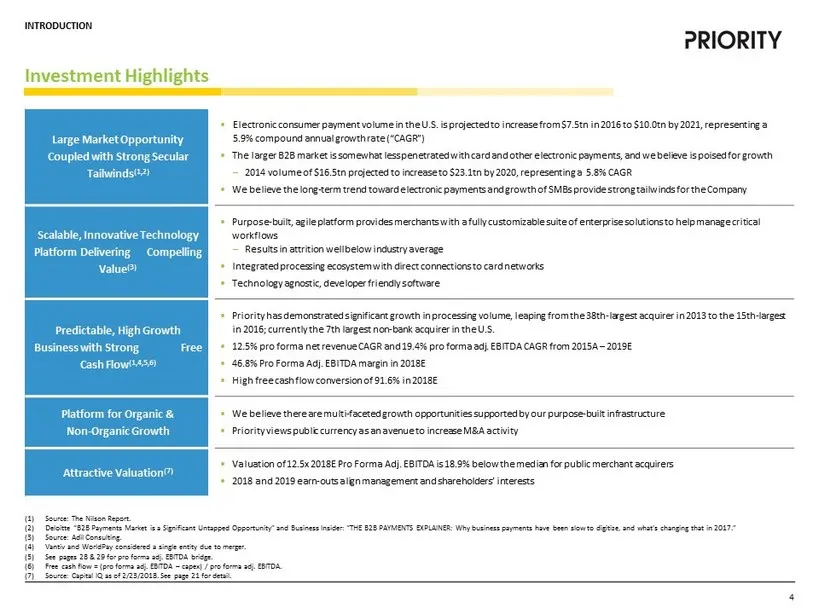
Slide 7: Large Market Opportunity Coupled with Strong Secular Tailwinds
Large Market Opportunity Coupled with Strong Secular Tailwinds (1,2) • Electronic consumer payment volume in the U.S. is projected to increase from $7.5tn in 2016 to $10.0tn by 2021, representing a 5.9% compound annual growth rate (“CAGR”) • The larger B2B market is somewhat less penetrated with car

Slide 8: 2. Company Overview
Technology Holdings 2. COMPANY OVERVIEW
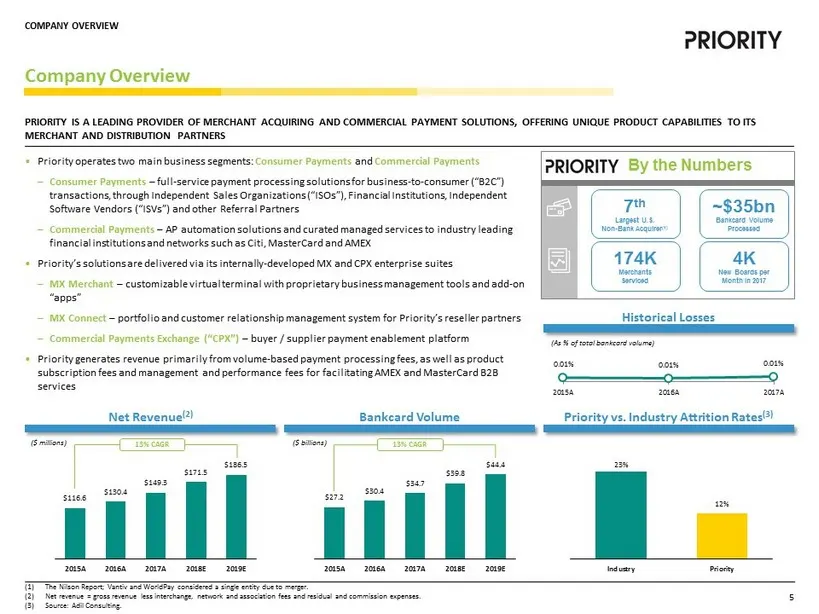
Slide 9: Company Overview
Company Overview (1) The Nilson Report; Vantiv and WorldPay considered a single entity due to merger. (2) Net revenue = gross revenue less interchange, network and association fees and residual and commission expenses . (3) Source: Adil Consulting. PRIORITY IS A LEADING PROVIDER OF MERCHANT ACQUIRIN
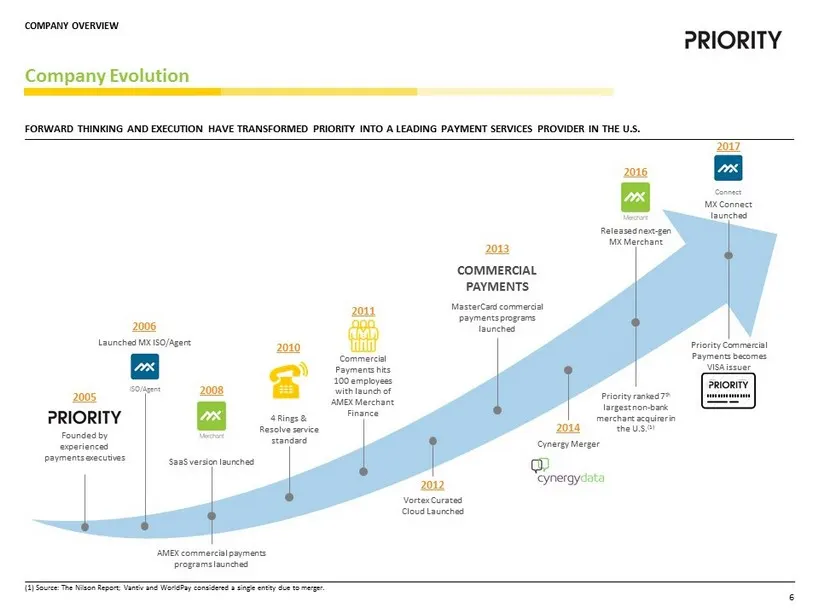
Slide 10: Company Evolution
MX Connect launched Priority Commercial Payments becomes VISA issuer Released next - gen MX Merchant ISO/Agent Launched MX ISO/Agent Company Evolution FORWARD THINKING AND EXECUTION HAVE TRANSFORMED PRIORITY INTO A LEADING PAYMENT SERVICES PROVIDER IN THE U.S. Founded by experienced payments executi
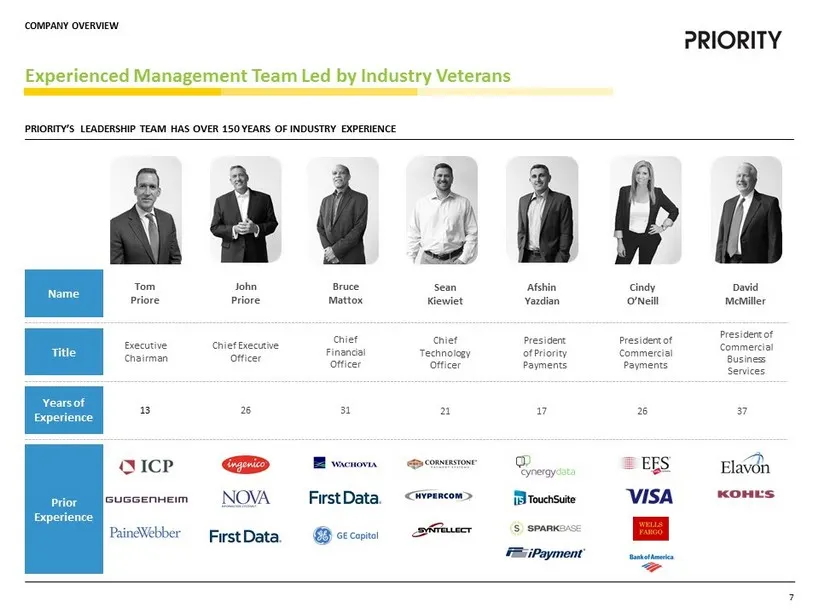
Slide 11: Experienced Management Team Led by Industry Veterans
Experienced Management Team Led by Industry Veterans Name Title Years of Experience Prior Experience Sean Kiewiet Chief Technology Officer 21 Afshin Yazdian President of Priority Payments 17 David McMiller President of Commercial Business Services 37 Cindy O’Neill President of Commercial Payments 26
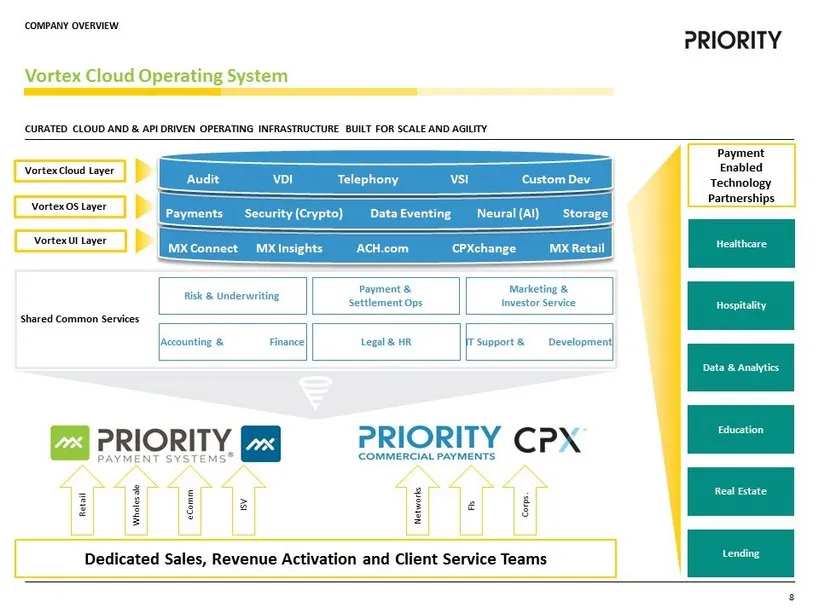
Slide 12: Vortex Cloud Operating System
Shared Common Services Vortex Cloud Operating System CURATED CLOUD AND & API DRIVEN OPERATING INFRASTRUCTURE BUILT FOR SCALE AND AGILITY Vortex Cloud Layer Vortex OS Layer Vortex UI Layer Accounting & Finance Legal & HR Risk & Underwriting IT Support & Development Payment & Settlement Ops Marketing
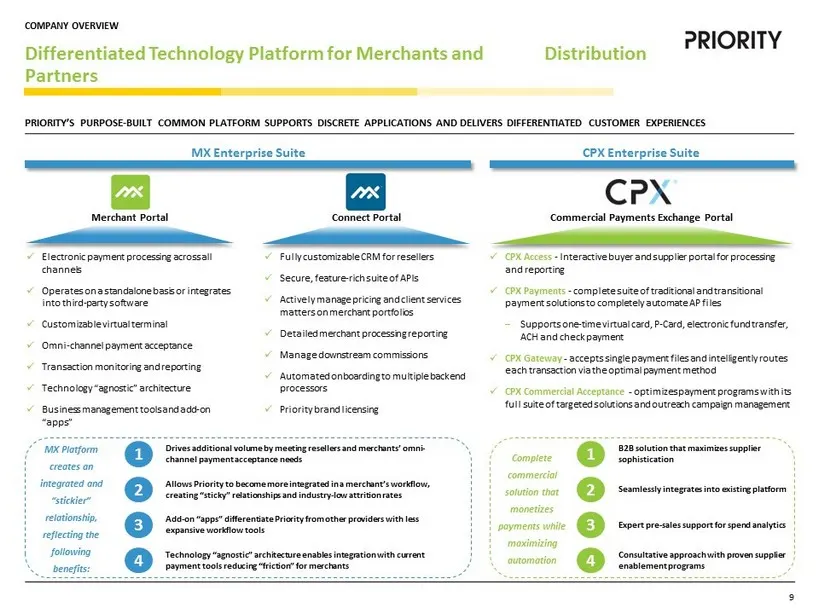
Slide 13: Differentiated Technology Platform for Merchants and Distribution Partners
PRIORITY’S PURPOSE - BUILT COMMON PLATFORM SUPPORTS DISCRETE APPLICATIONS AND DELIVERS DIF FERENTIATED CUSTOMER EXPERIENCES Differentiated Technology Platform for Merchants and Distribution Partners MX Enterprise Suite CPX Enterprise Suite Commercial Payments Exchange Portal Merchant Portal x Electr
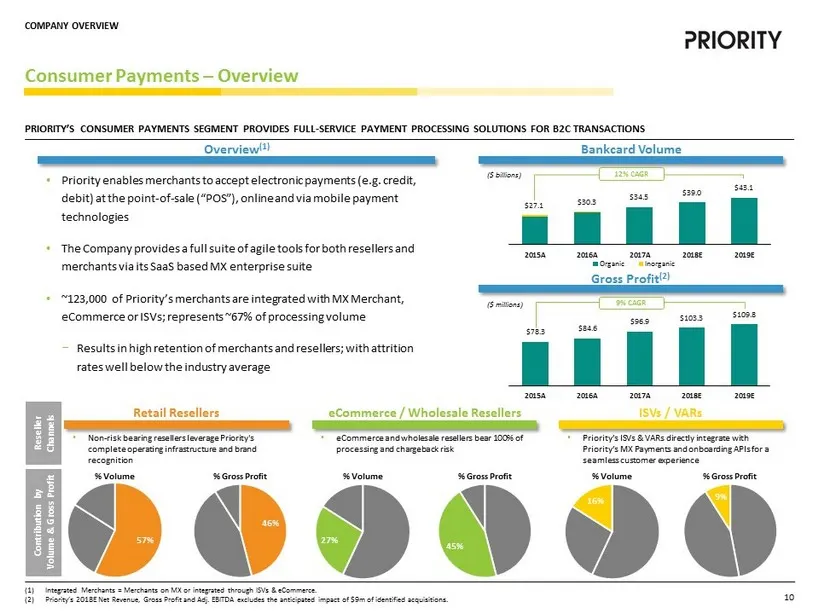
Slide 14: Consumer Payments Segment Overview
$78.3 $84.6 $96.9 $103.3 $109.8 2015A 2016A 2017A 2018E 2019E $27.1 $30.3 $34.5 $39.0 $43.1 2015A 2016A 2017A 2018E 2019E Organic Inorganic 45% 46% PRIORITY’S CONSUMER PAYMENTS SEGMENT PROVIDES FULL - SERVICE PAYME NT PROCESSING SOLUTIONS FOR B2C TRANSACTIONS Consumer Payments – Overview • Priority
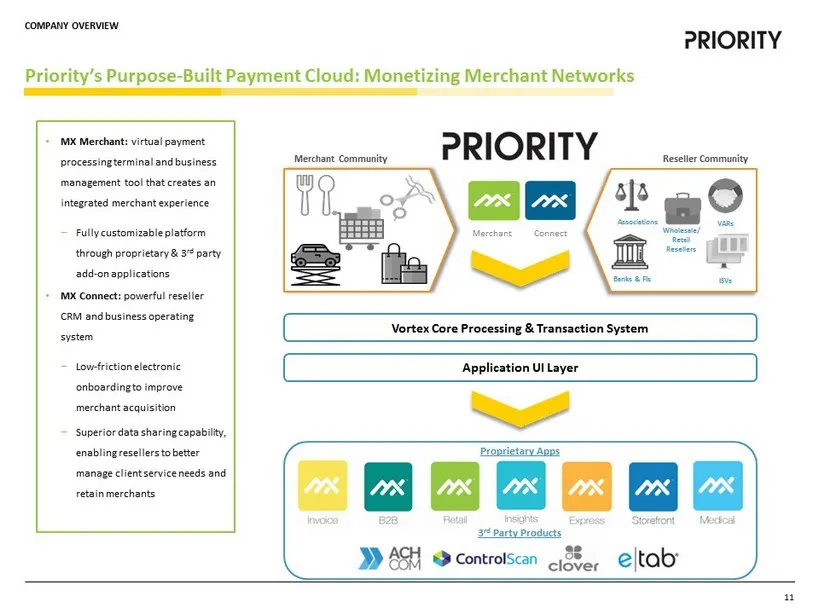
Slide 15: Purpose-Built Payment Cloud: Monetizing Merchant Networks
Priority’s Purpose - Built Payment Cloud: Monetizing Merchant Networks Associations Banks & FIs VARs ISVs Wholesale/ Retail Resellers Merchant Community Reseller Community Vortex Core Processing & Transaction System Connect Merchant Application UI Layer Proprietary Apps 3 rd Party Products • MX Merc
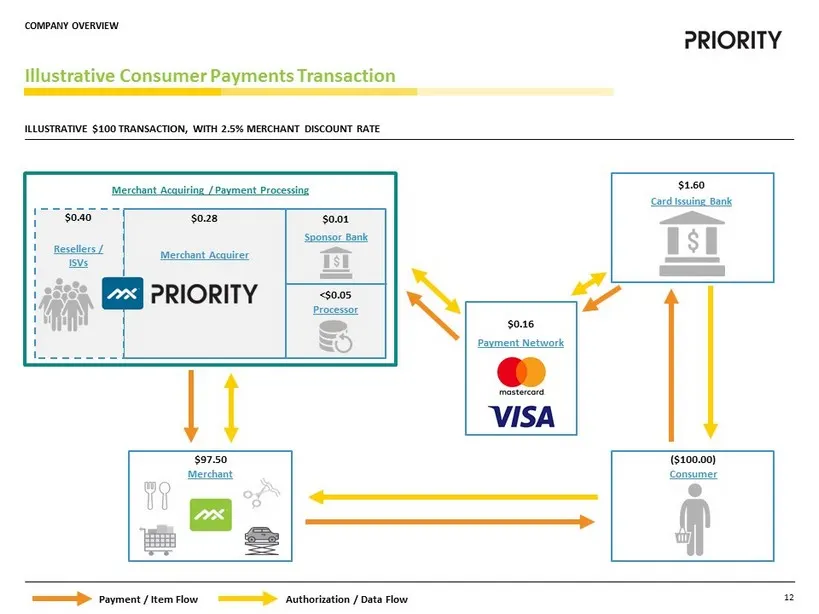
Slide 16: Illustrative Consumer Payments Transaction
ILLUSTRATIVE $100 TRANSACTION, WITH 2.5% MERCHANT DISCOUNT RATE Illustrative Consumer Payments Transaction Consumer ($100.00) Payment Network $0.16 Merchant $97.50 Merchant Acquiring / Payment Processing Card Issuing Bank $1.60 Merchant Acquirer Sponsor Bank Resellers / ISVs $0.28 $0.40 $0.01 Proces
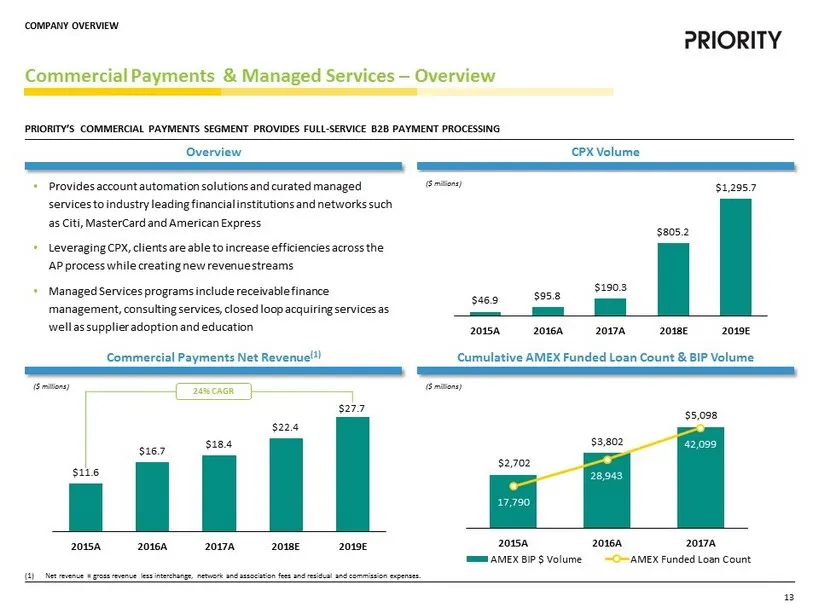
Slide 17: Commercial Payments & Managed Services Overview
$11.6 $16.7 $18.4 $22.4 $27.7 2015A 2016A 2017A 2018E 2019E PRIORITY’S COMMERCIAL PAYMENTS SEGMENT PROVIDES FULL - SERVICE B2B PAYMENT PROCESSING Commercial Payments & Managed Services – Overview • Provides account automation solutions and curated managed services to industry leading financial insti
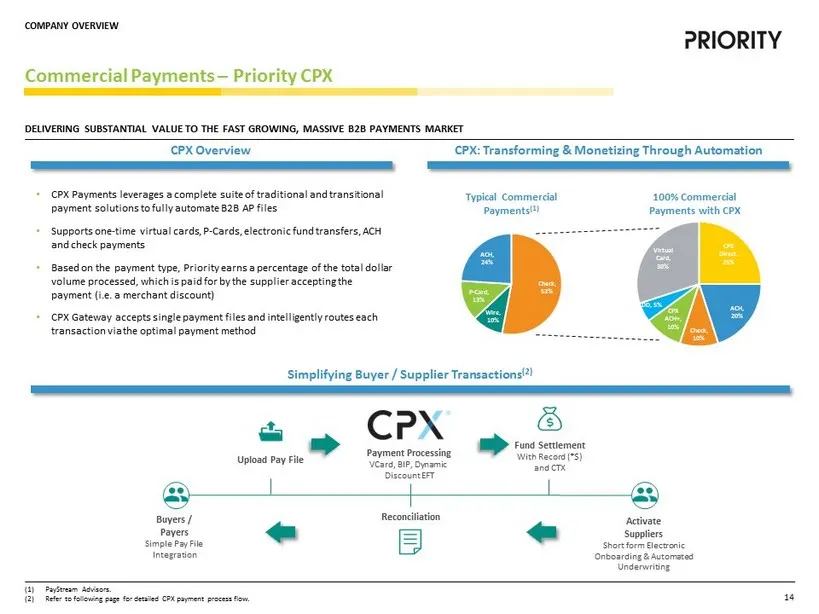
Slide 18: Commercial Payments with CPX
CPX Direct , 25% ACH , 20% Check , 10% CPX ACH+ , 10% DD , 5% Virtual Card , 30% Check , 53% Wire , 10% P - Card , 13% ACH , 24% Typical Commercial Payments (1) 100% Commercial Payments with CPX DELIVERING SUBSTANTIAL VALUE TO THE FAST GROWING, MASSIVE B2B PAYMENTS MAR KET Commercial Payments – Prio
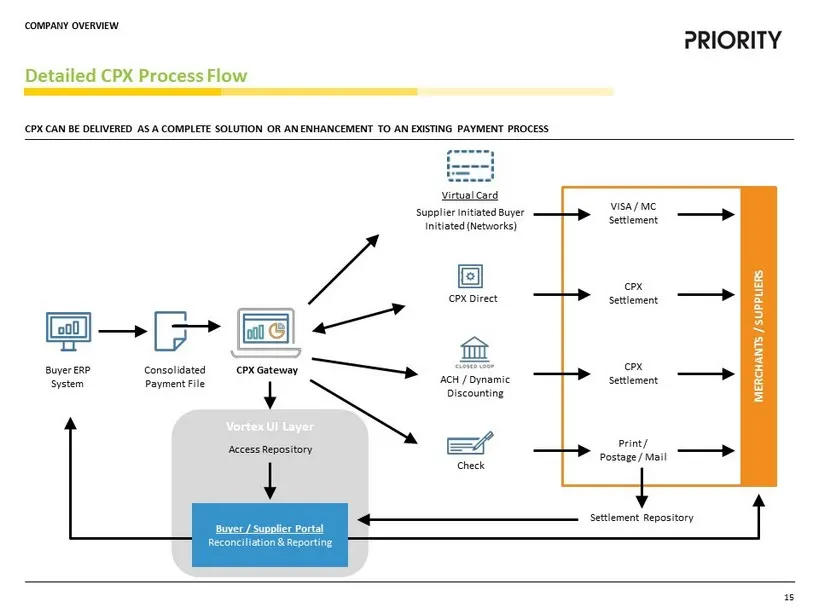
Slide 19: Detailed CPX Process Flow
Vortex UI Layer Detailed CPX Process Flow Buyer ERP System Con s o l i d a ted Payment File CPX Gateway ACH / Dynamic Discounting Ch e c k Virtual Card Supplier Initiated Buyer Initiated (Networks) VISA / MC Settl e ment CPX Settl e ment CPX Settl e ment Print / Pos tag e / Ma i l Settlement R eposi
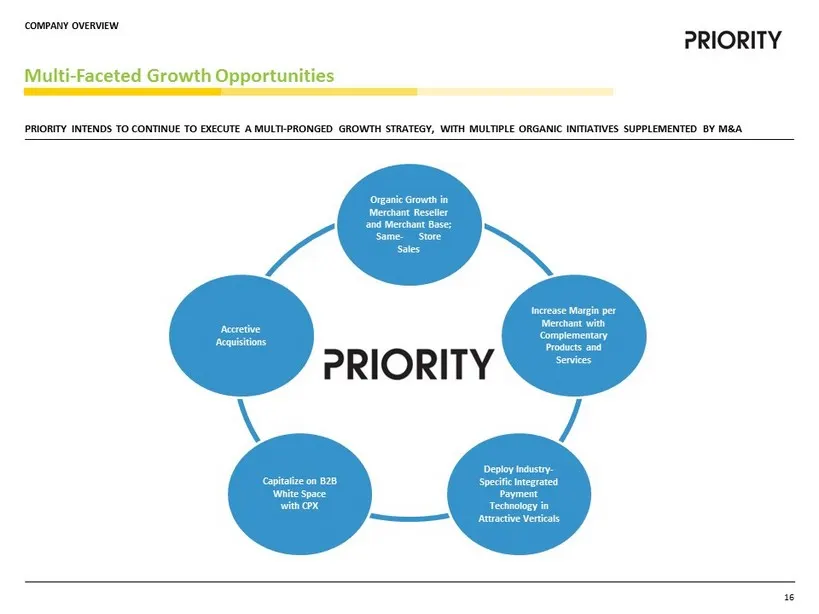
Slide 20: Multi-Faceted Growth Opportunities
Multi - Faceted Growth Opportunities Organic Growth in Merchant Reseller and Merchant Base; Same - Store Sales Capitalize on B2B White Space with CPX Deploy Industry - Specific Integrated Payment Technology in Attractive Verticals Accretive Acquisitions Increase Margin per Merchant with Complementar
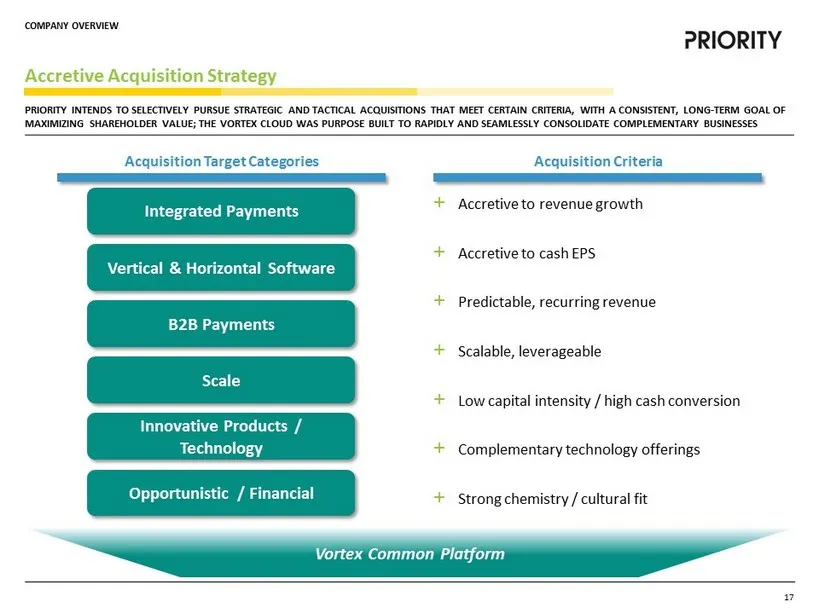
Slide 21: Accretive Acquisition Strategy
Accretive Acquisition Strategy PRIORITY INTENDS TO SELECTIVELY PURSUE STRATEGIC AND TACTICAL AC QUISITIONS THAT MEET CERTAIN CRITERIA, WITH A CONSISTENT, LONG - TERM GOAL OF MAXIMIZING SHAREHOLDER VALUE; THE VORTEX CLOUD WAS PURPOSE BUILT TO RAPIDLY AND SEAMLESSLY CONSOLIDATE COMPLEMENTARY BUSINESSE

Slide 22: 3. Industry
Technology Holdings 3. INDUSTRY OVERVIEW
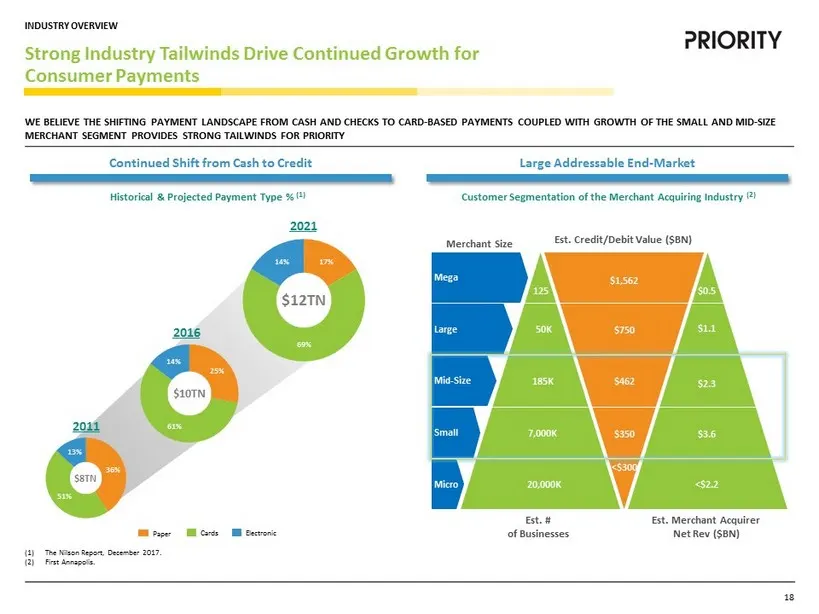
Slide 23: Strong Industry Tailwinds Drive Continued Growth for Consumer Payments
Strong Industry Tailwinds Drive Continued Growth for Consumer Payments Paper Cards Electronic $8TN 36% 51% 13% 2011 $10TN 2016 25% 61% 14% $12TN 17% 69% 14% 2021 Historical & Projected Payment Type % (1) Customer Segmentation of the Merchant Acquiring Industry (2) Micro Small Mega Large Mid - Size $
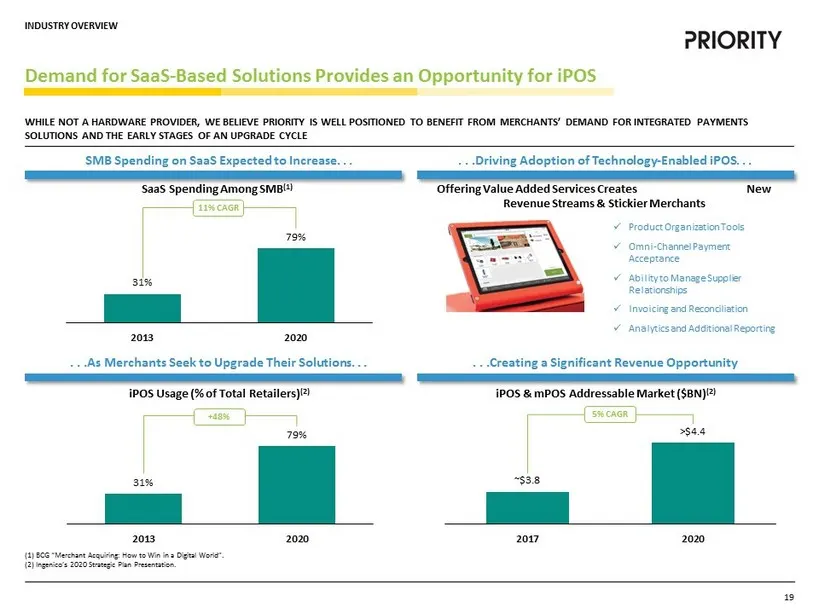
Slide 24: Creating a Significant Revenue Opportunity
31% 79% 2013 2020 31% 79% 2013 2020 ~$3.8 >$4.4 2017 2020 . . .Creating a Significant Revenue Opportunity Demand for SaaS - Based Solutions Provides an Opportunity for iPOS (1) BCG “Merchant Acquiring: How to Win in a Digital World”. (2) Ingenico’s 2020 Strategic Plan Presentation. Offering Value Ad
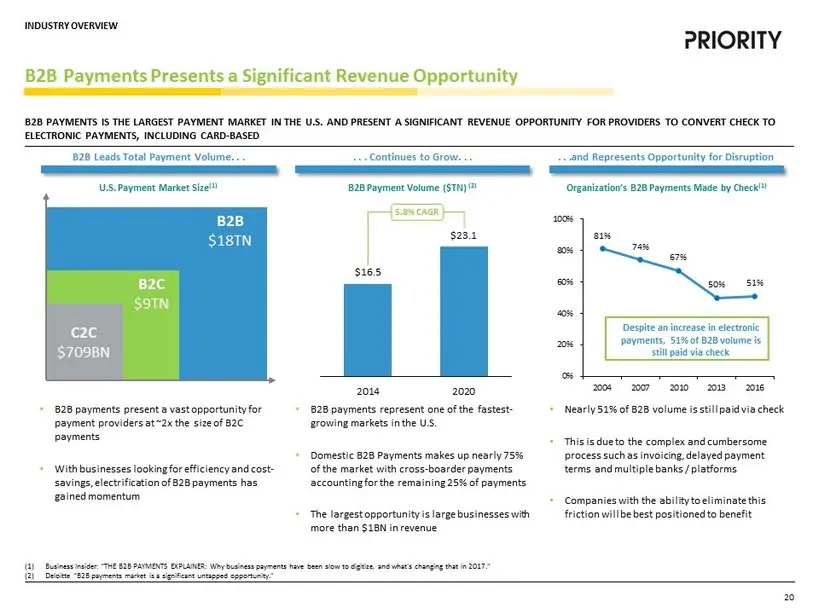
Slide 25: B2B Payments Presents a Significant Revenue Opportunity
81% 74% 67% 50% 51% 0% 20% 40% 60% 80% 100% 2004 2007 2010 2013 2016 $16.5 $23.1 2014 2020 B2B PAYMENTS IS THE LARGEST PAYMENT MARKET IN THE U.S. AND PRESE NT A SIGNIFICANT REVENUE OPPORTUNITY FOR PROVIDERS TO CONVERT CH ECK TO ELECTRONIC PAYMENTS, INCLUDING CARD - BASED B2B Payments Presents a Sign

Slide 26: 4. Transaction
Technology Holdings 4. TRANSACTION OVERVIEW
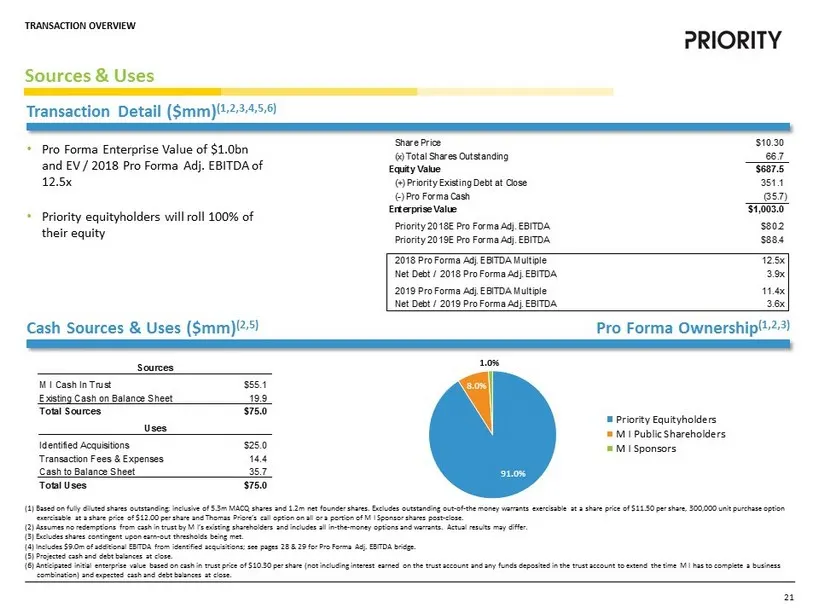
Slide 27: Pro Forma Ownership and Sources & Uses
91.0% 8.0% 1.0% Priority Equityholders M I Public Shareholders M I Sponsors Sources & Uses (1) Based on fully diluted shares outstanding; inclusive of 5.3m MACQ shares and 1.2m net founder shares. Excludes outstandin g o ut - of - the money warrants exercisable at a share price of $11.50 per share,
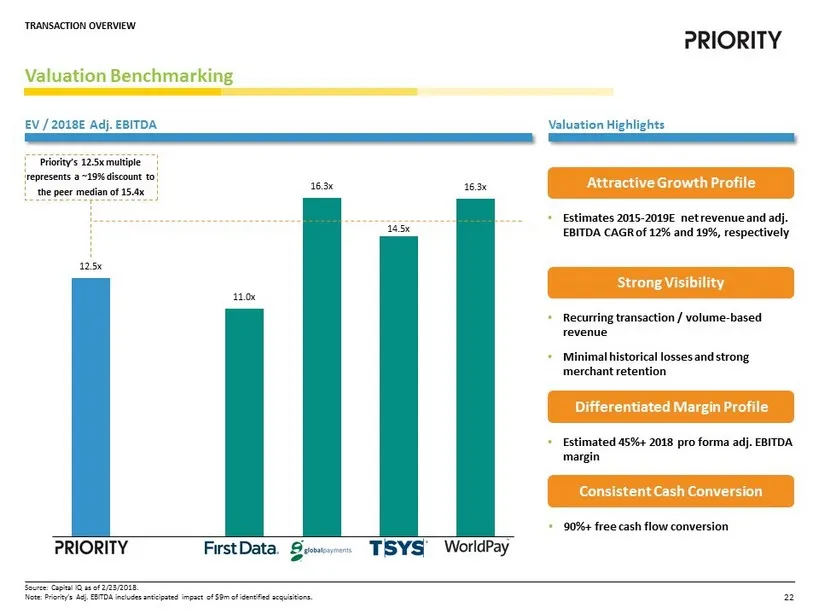
Slide 28: Valuation Benchmarking
12.5x 11.0x 16.3x 14.5x 16.3x PPS FDC GPN TSS WP Valuation Benchmarking Priority’s 12.5x multiple represents a ~19% discount to the peer median of 15.4x EV / 2018E Adj . EBITDA Valuation Highlights Source: Capital IQ as of 2/23/2018. Note: Priority’s Adj. EBITDA includes anticipated impact of $9m of
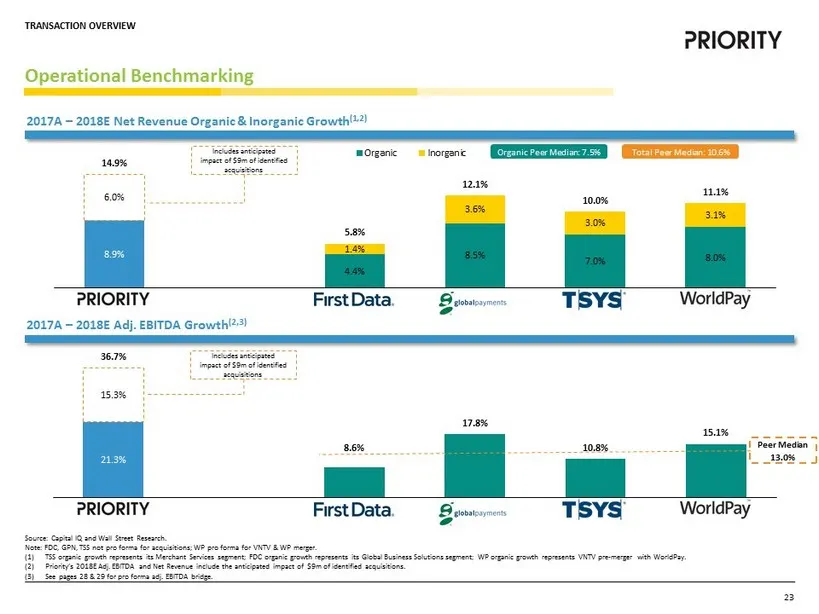
Slide 29: Operational Benchmarking
21.3% 15.3% 36.7% 8.6% 17.8% 10.8% 15.1% PPS FDC GPN TSS WP 8.9% 4.4% 8.5% 7.0% 8.0% 6.0% 1.4% 3.6% 3.0% 3.1% 14.9% 5.8% 12.1% 10.0% 11.1% PPS FDC GPN TSS WP Organic Inorganic 2017A – 2018E Net Revenue Organic & Inorganic Growth (1,2) Operational Benchmarking Source: Capital IQ and Wall Street Resea
Slide 30: Operational Benchmarking (Cont'd)
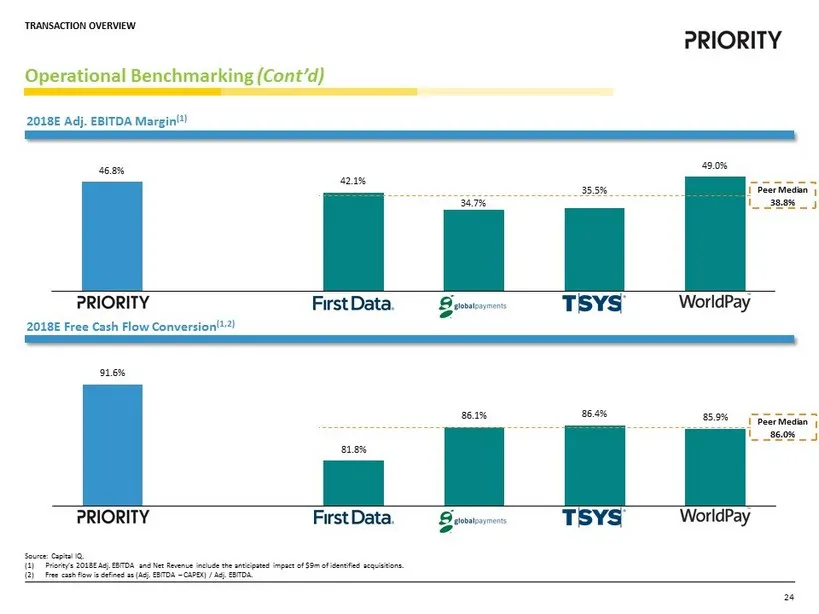
2018E Free Cash Flow Conversion (1,2 ) 91.6% 81.8% 86.1% 86.4% 85.9% PPS FDC GPN TSS WP 46.8% 42.1% 34.7% 35.5% 49.0% PPS FDC GPN TSS WP Operational Benchmarking (Cont’d) Source: Capital IQ. (1) Priority’s 2018E Adj. EBITDA and Net Revenue include the anticipated impact of $ 9m of identified acquisi

Slide 31: 5. Financial
Technology Holdings 5. FINANCIAL OVERVIEW
Slide 32: Historical & Forecasted Financials - Consolidated
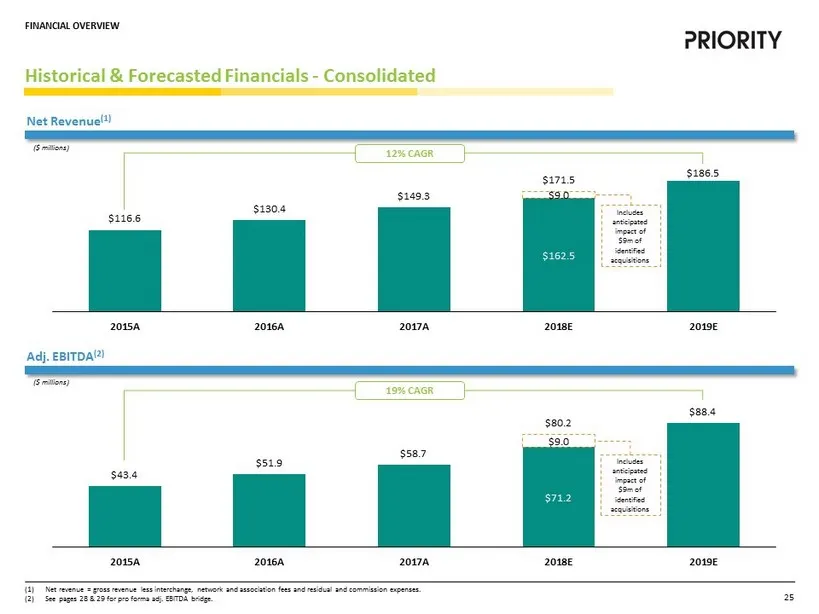
$162.5 $9.0 $116.6 $130.4 $149.3 $171.5 $186.5 2015A 2016A 2017A 2018E 2019E $71.2 $9.0 $43.4 $51.9 $58.7 $80.2 $88.4 2015A 2016A 2017A 2018E 2019E Historical & Forecasted Financials - Consolidated (1) Net revenue = gross revenue less interchange, network and association fees and residual and commis
Slide 33: Historical & Forecasted KPIs - Consumer
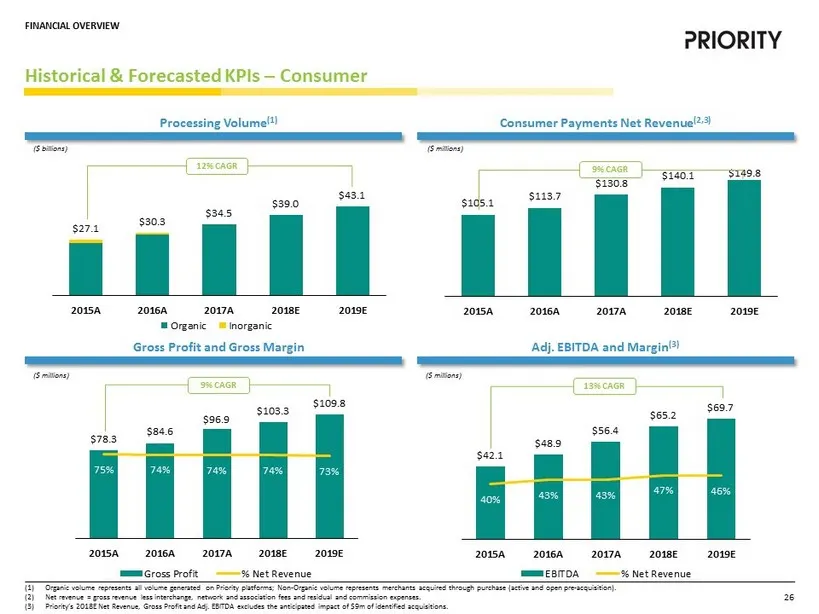
$78.3 $84.6 $96.9 $103.3 $109.8 75% 74% 74% 74% 73% 0% 20% 40% 60% 80% 100% 120% 2015A 2016A 2017A 2018E 2019E $0.0 $20.0 $40.0 $60.0 $80.0 $100.0 $120.0 Gross Profit % Net Revenue $42.1 $48.9 $56.4 $65.2 $69.7 40% 43% 43% 47% 46% 0% 25% 50% 75% 100% $0.0 $20.0 $40.0 $60.0 $80.0 2015A 2016A 2017A 20
Slide 34: Historical & Forecasted KPIs - Commercial
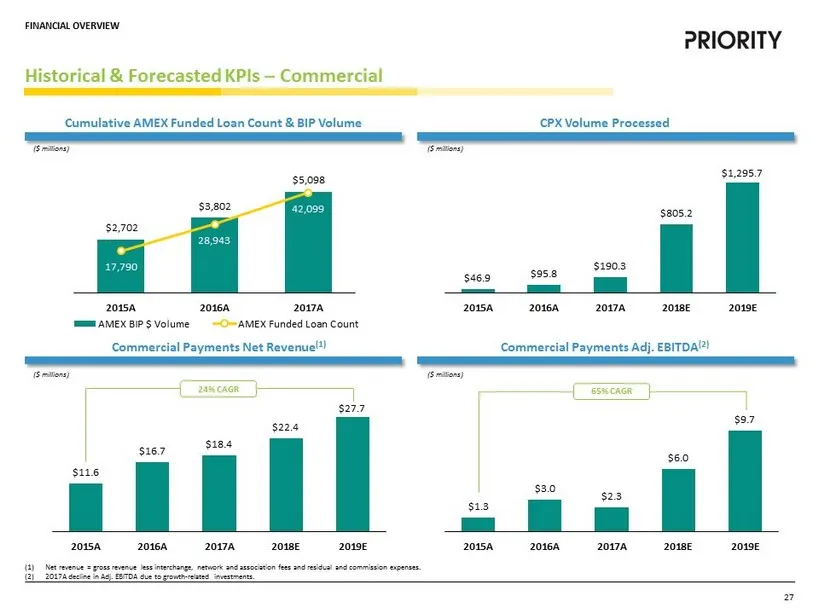
$1.3 $3.0 $2.3 $6.0 $9.7 2015A 2016A 2017A 2018E 2019E $11.6 $16.7 $18.4 $22.4 $27.7 2015A 2016A 2017A 2018E 2019E Historical & Forecasted KPIs – Commercial Cumulative AMEX Funded Loan Count & BIP Volume CPX Volume Processed ($ millions) Commercial Payments Net Revenue (1) Commercial Payments Adj. E

Slide 35: 6. Appendix
Technology Holdings 6. APPENDIX
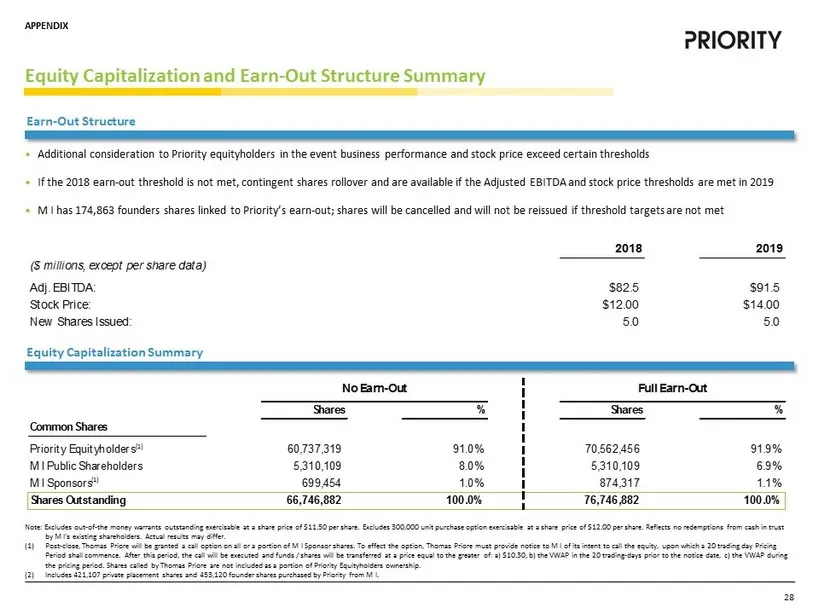
Slide 36: Equity Capitalization and Earn-Out Structure Summary
No Earn-Out Full Earn-Out Shares % Shares % Common Shares Priority Equityholders 60,737,319 91.0% 70,562,456 91.9% M I Public Shareholders 5,310,109 8.0% 5,310,109 6.9% M I Sponsors 699,454 1.0% 874,317 1.1% Shares Outstanding 66,746,882 100.0% 76,746,882 100.0% Equity Capitalization and Earn - Out
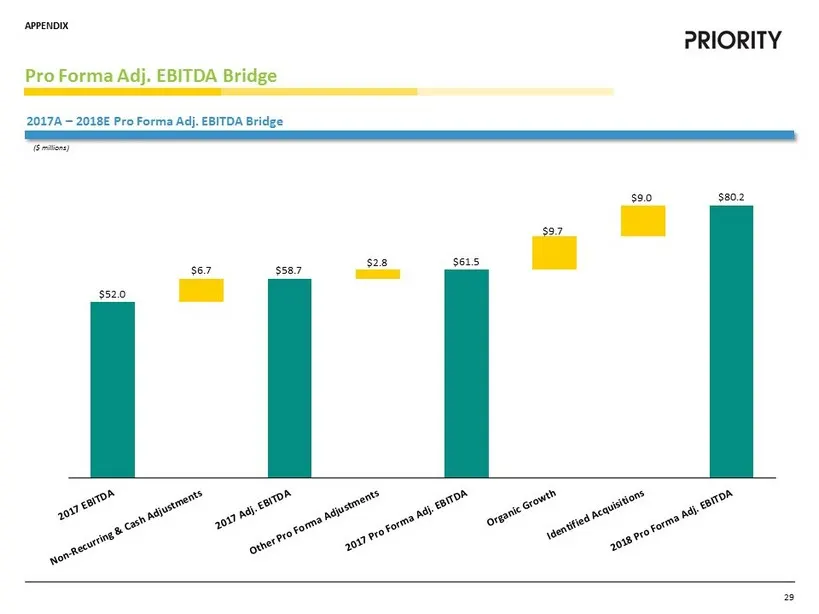
Slide 37: Pro Forma Adj. EBITDA Bridge
Pro Forma Adj. EBITDA Bridge 2017A – 2018E Pro Forma Adj. EBITDA Bridge ($ millions) $52.0 $58.7 $61.5 $80.2 $6.7 $2.8 $9.7 $9.0 29 APPENDIX
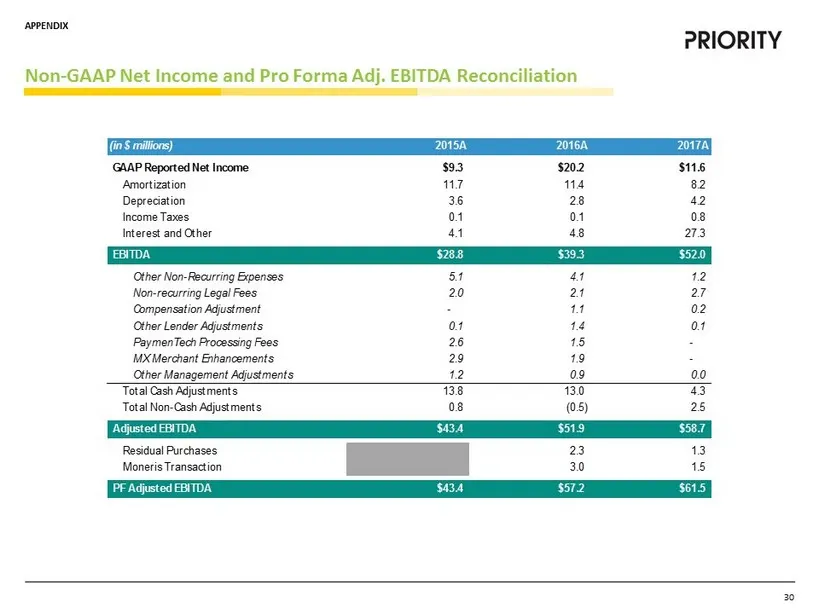
Slide 38: Non-GAAP Net Income and Pro Forma Adj. EBITDA Reconciliation
Non - GAAP Net Income and Pro Forma Adj. EBITDA Reconciliation (in $ millions) 2015A 2016A 2017A GAAP Reported Net Income $9.3 $20.2 $11.6 Amortization 11.7 11.4 8.2 Depreciation 3.6 2.8 4.2 Income Taxes 0.1 0.1 0.8 Interest and Other 4.1 4.8 27.3 EBITDA $28.8 $39.3 $52.0 Other Non-Recurring Expense

Slide 39: Q & A
Q & A
Source: SEC EDGAR · DEFA14A filed Feb 27, 2018
More decks from Priority Technology Holdings, Inc.
 Q2 2026 Earnings Presentation17 slides · August 2026
 Q1 2026 Earnings Presentation18 slides · May 11, 2026
 Q4 2025 Earnings Presentation18 slides · March 2026
 Q3 2025 Earnings Presentation20 slides · November 2025
 Q2 2025 Earnings Presentation19 slides · Aug 7, 2025
 Q1 2025 Earnings Presentation17 slides · May 6, 2025