Heartland Financial USA — Q2 2019 Earnings Presentation
45 slides from Heartland Financial USA's earnings presentation, Jul 30, 2019
Slide 1: Heartland Financial 2Q 2019 Performance
Heartland Financial 2Q 2019 Performance Lynn B. Fuller Executive Operating Chairman Bruce K. Lee President & CEO Bryan R. McKeag Chief Financial Officer
Slide 2: Safe Harbor
Safe Harbor This release, and future oral and written statements of Heartland and its management, may contain forward- looking statements within the meaning of the Private Securities Litigation Reform Act of 1995 about Heartland’s financial condition, results of operations, plans, objectives, future
Slide 3: Agenda
Agenda . Heartland’s history of success and M&A strategy . Heartland’s business highlights and strategy . Financial trends and highlights 3
Slide 4: Tremendous Growth in Assets and Shareholder Return
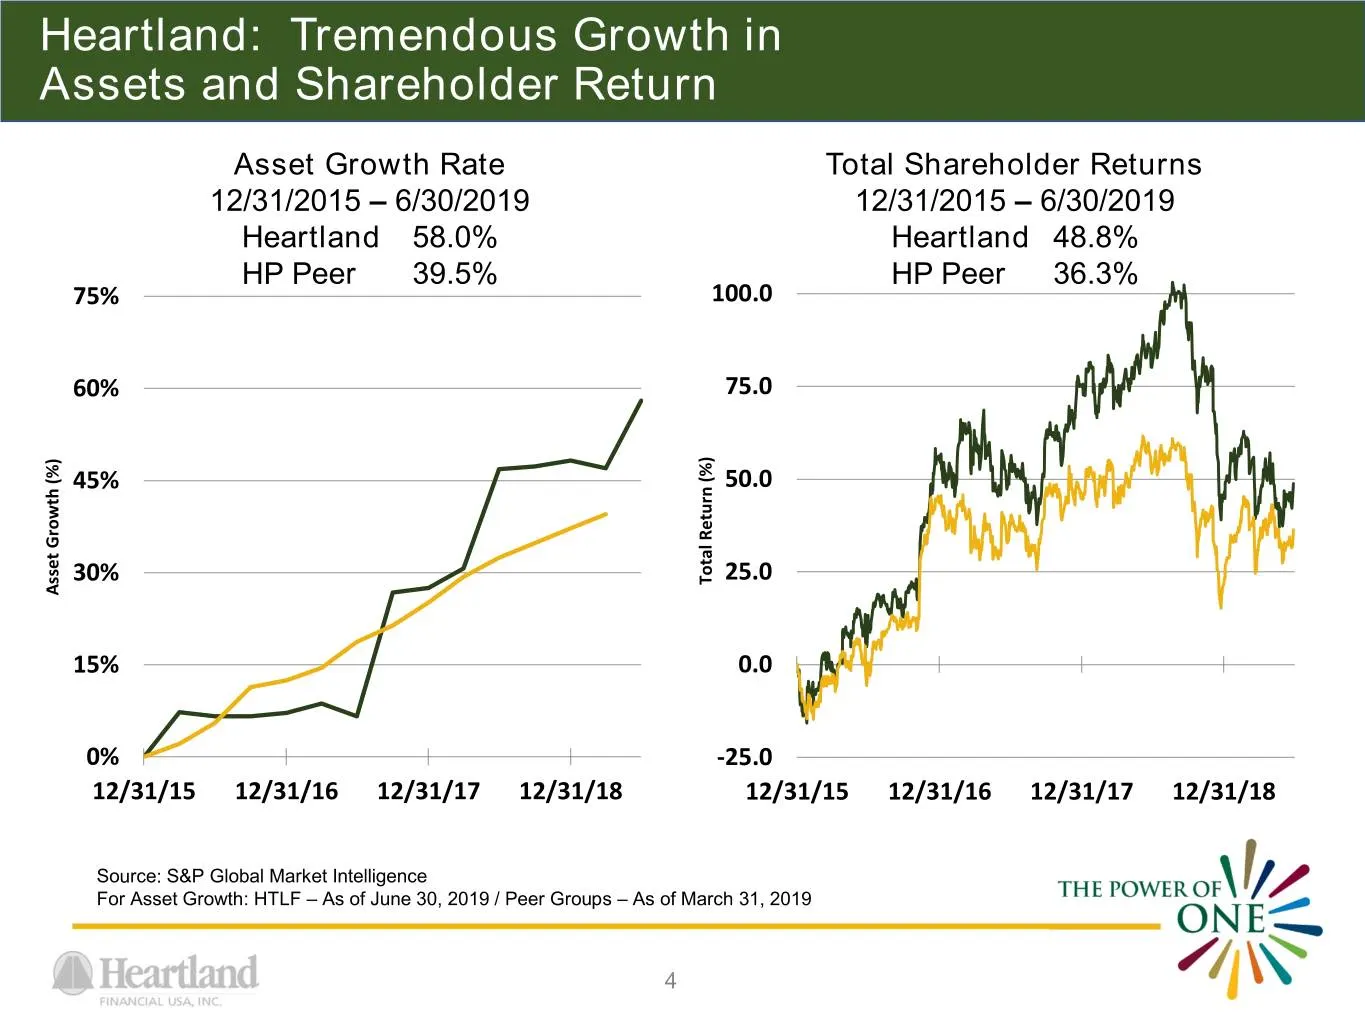
Heartland: Tremendous Growth in Assets and Shareholder Return Asset Growth Rate Total Shareholder Returns 12/31/2015 – 6/30/2019 12/31/2015 – 6/30/2019 Heartland 58.0% Heartland 48.8% HP Peer 39.5% HP Peer 36.3% 75% 100.0 60% 75.0 45% 50.0 30% TotalReturn (%) 25.0 Asset Asset Growth(%) 15% 0.0 0% -2
Slide 5: Exceptional Performance Reflected in Stock Performance
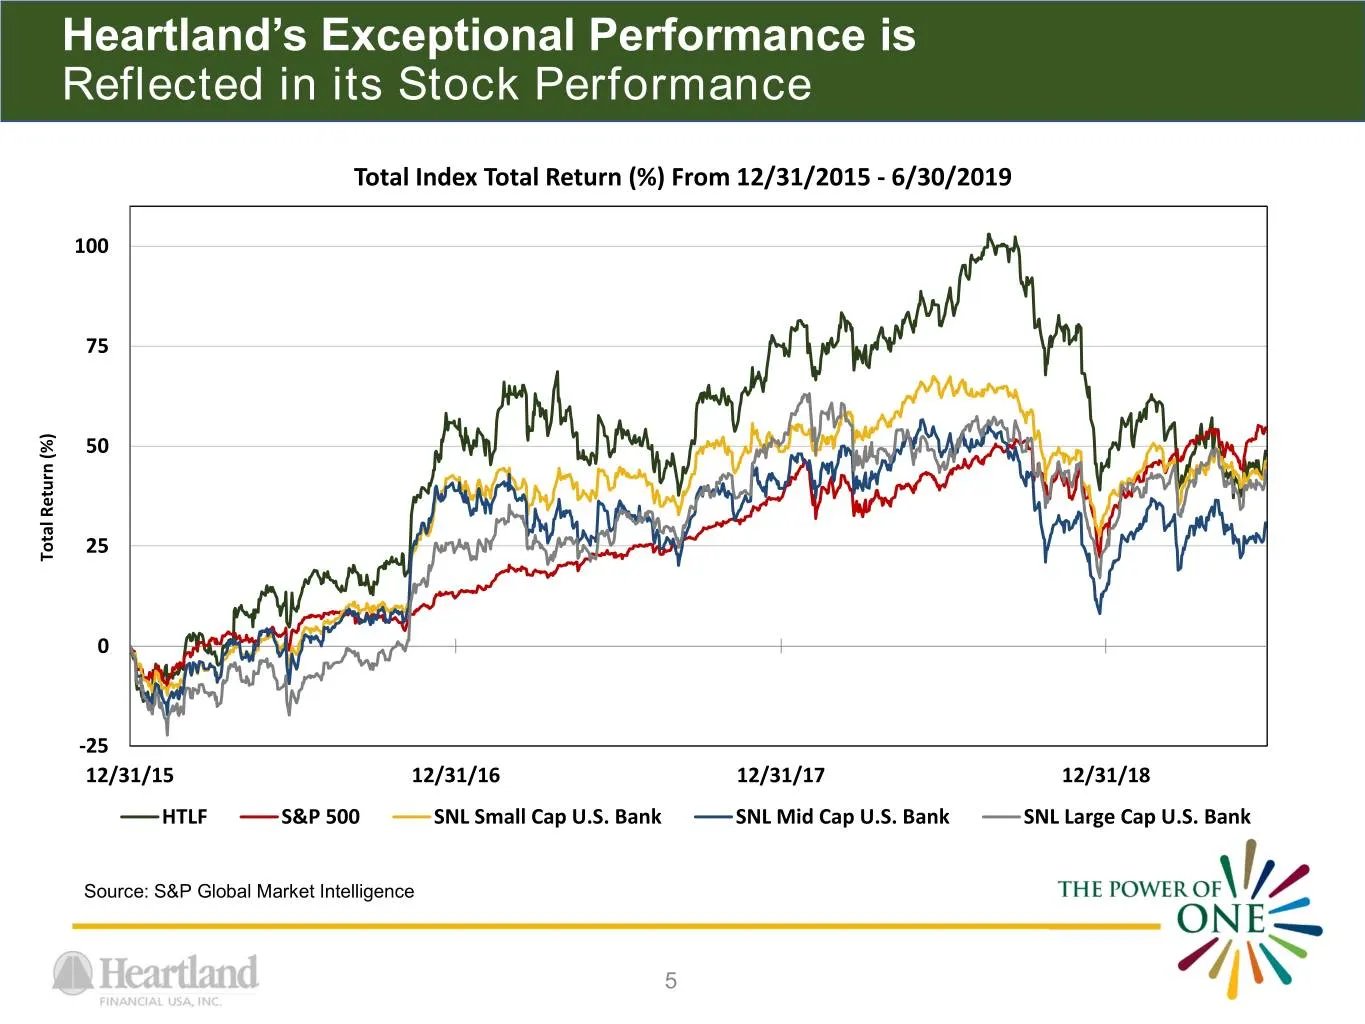
Heartland’s Exceptional Performance is Reflected in its Stock Performance Total Index Total Return (%) From 12/31/2015 - 6/30/2019 100 75 50 25 Total Return Total (%) 0 -25 12/31/15 12/31/16 12/31/17 12/31/18 HTLF S&P 500 SNL Small Cap U.S. Bank SNL Mid Cap U.S. Bank SNL Large Cap U.S. Bank Source:
Slide 6: Long History of Growth, Stability and Geographic Diversity
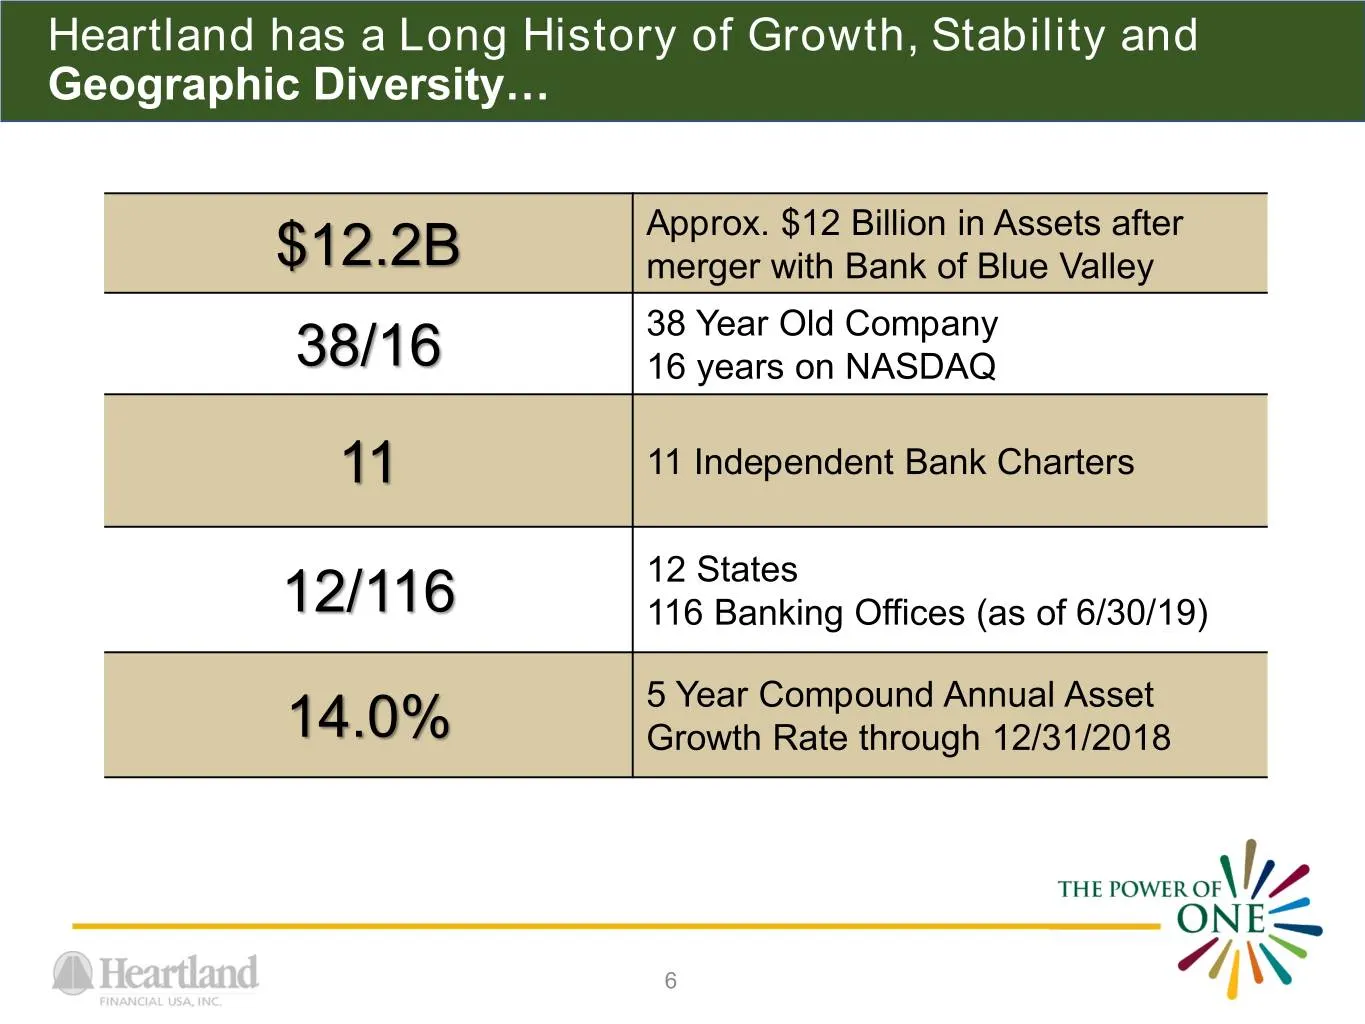
Heartland has a Long History of Growth, Stability and Geographic Diversity… Approx. $12 Billion in Assets after $12.2B merger with Bank of Blue Valley 38 Year Old Company 38/16 16 years on NASDAQ 11 11 Independent Bank Charters 12 States 12/116 116 Banking Offices (as of 6/30/19) 5 Year Compound Ann
Slide 7: Tremendous History of Earnings
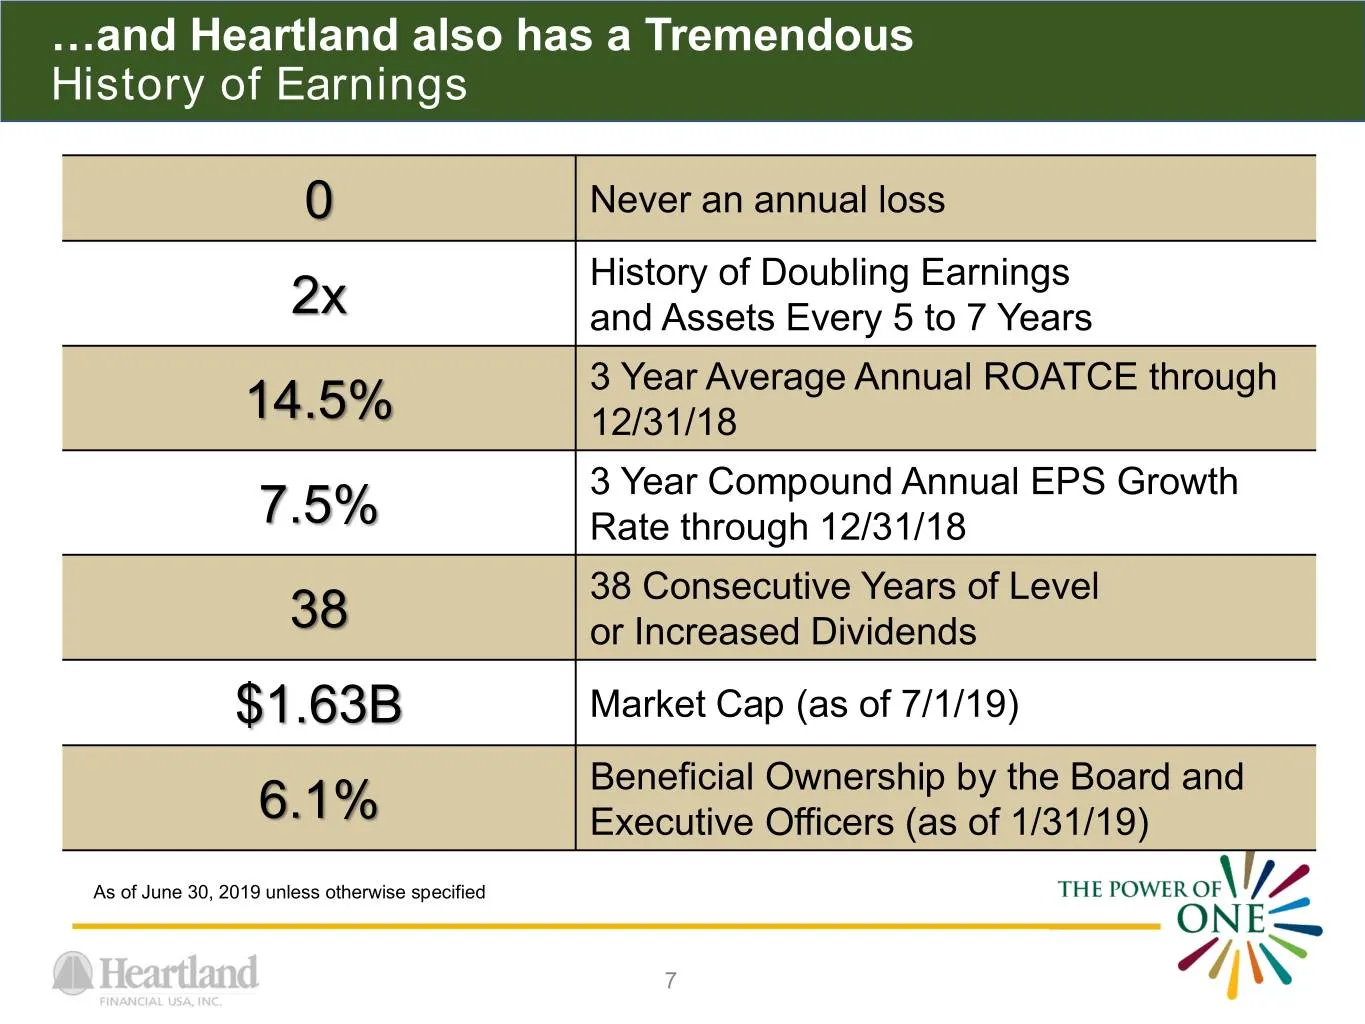
…and Heartland also has a Tremendous History of Earnings 0 Never an annual loss History of Doubling Earnings 2x and Assets Every 5 to 7 Years 3 Year Average Annual ROATCE through 14.5% 12/31/18 3 Year Compound Annual EPS Growth 7.5% Rate through 12/31/18 38 Consecutive Years of Level 38 or Increased
Slide 8: Consistent Asset and Earnings Growth
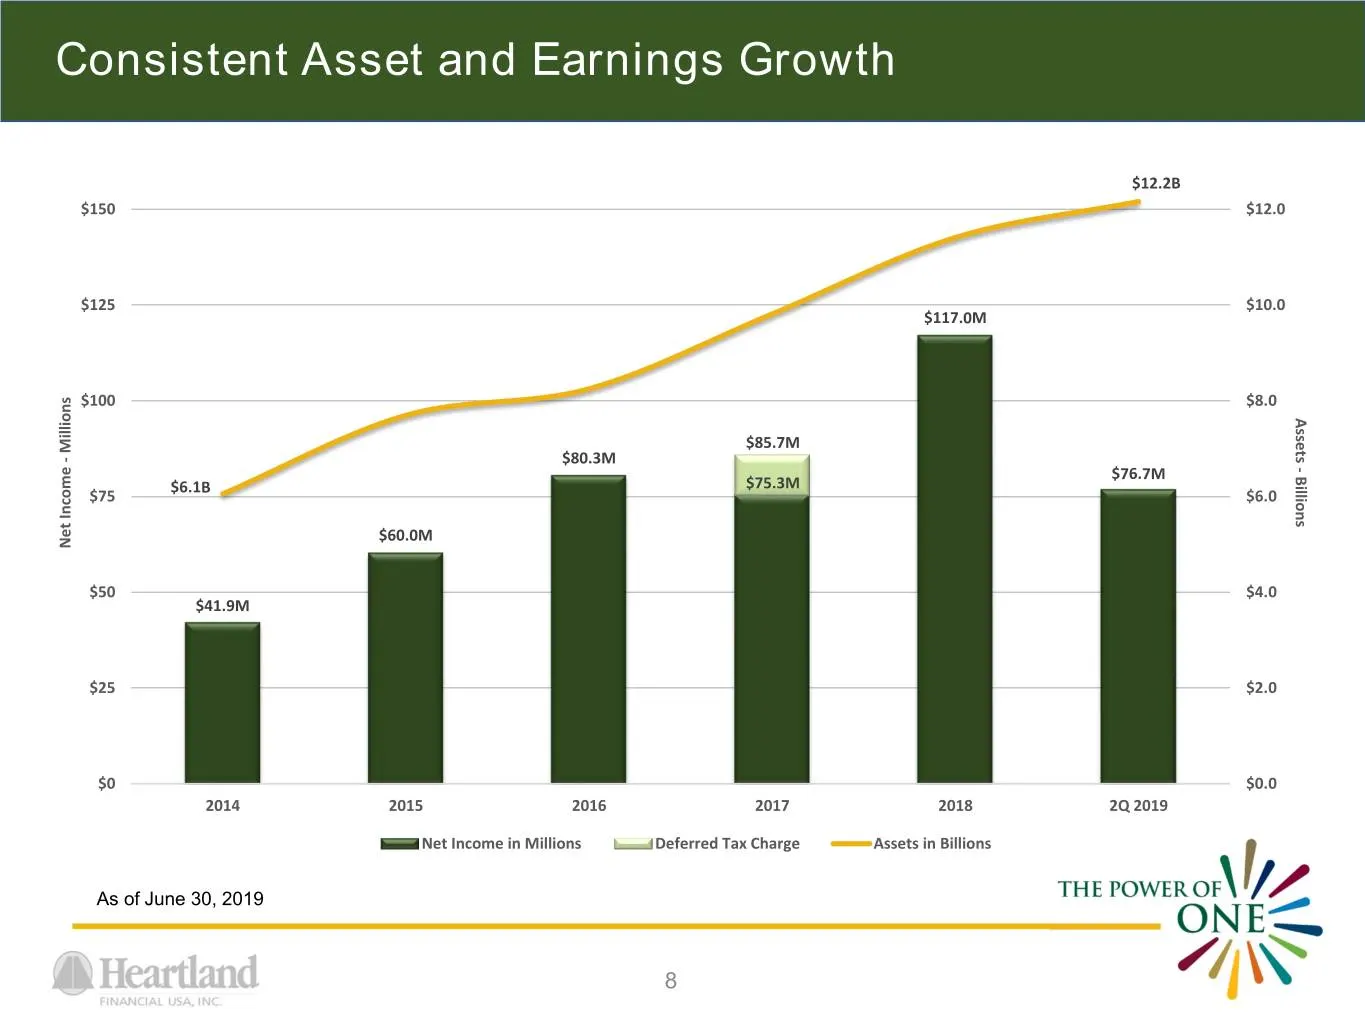
Consistent Asset and Earnings Growth $12.2B $150 $12.0 $125 $10.0 $117.0M $100 $8.0 Assets $85.7M Millions - $80.3M - $76.7M Billions $6.1B $75.3M $75 $6.0 $60.0M Net Income Income Net $50 $4.0 $41.9M $25 $2.0 $0 $0.0 2014 2015 2016 2017 2018 2Q 2019 Net Income in Millions Deferred Tax Charge Assets
Slide 9: Diluted EPS and Dividends
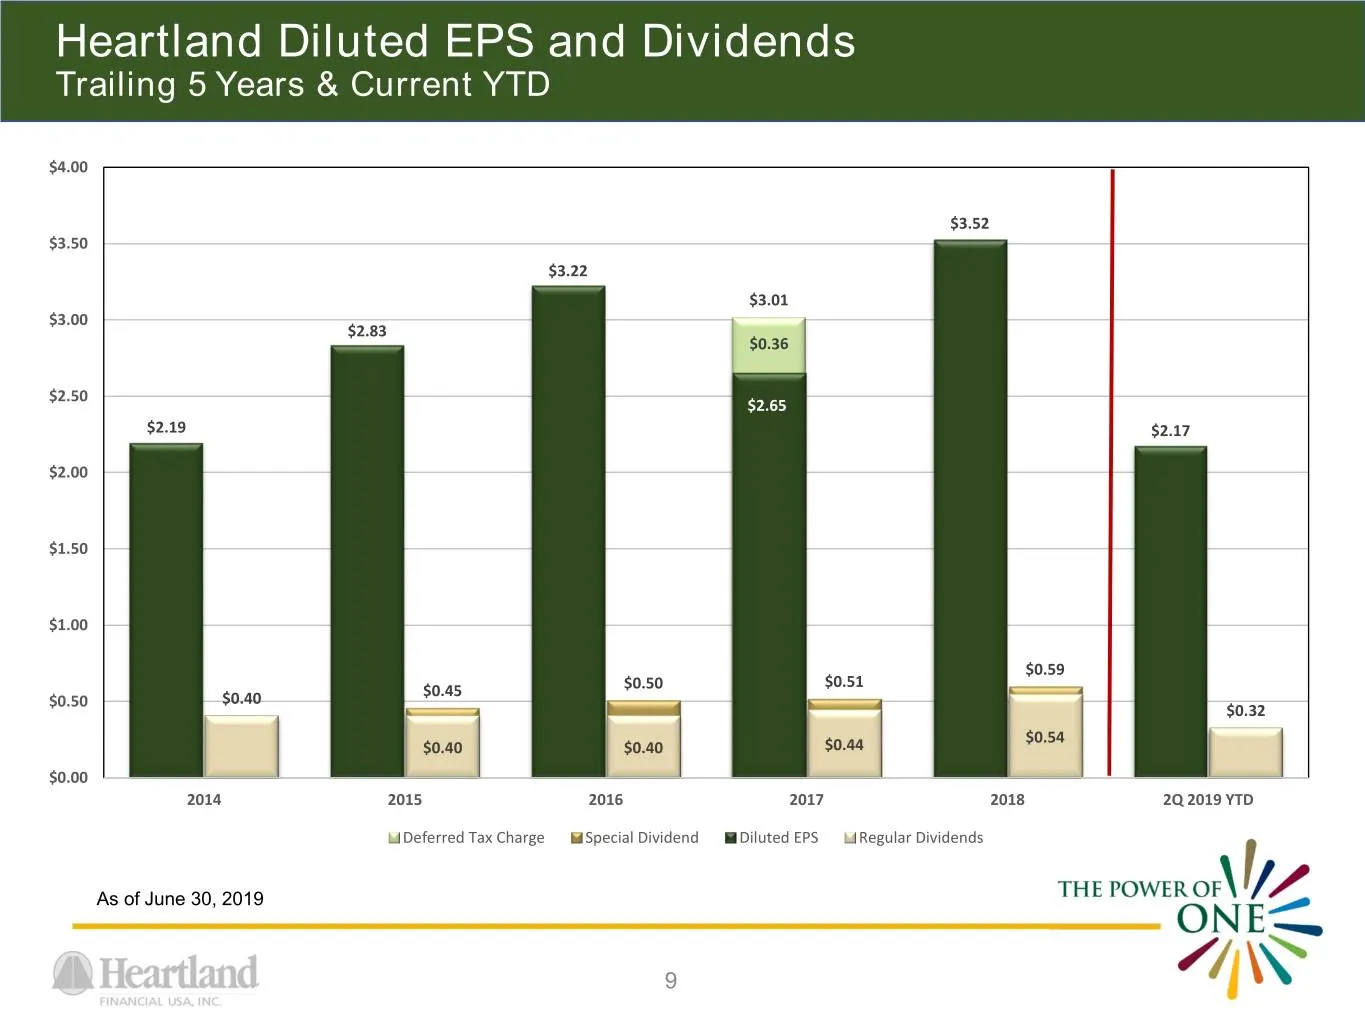
Heartland Diluted EPS and Dividends Trailing 5 Years & Current YTD $4.00 $3.52 $3.50 $3.22 $3.01 $3.00 $2.83 $0.36 $2.50 $2.65 $2.19 $2.17 $2.00 $1.50 $1.00 $0.59 $0.51 $0.45 $0.50 $0.50 $0.40 $0.32 $0.54 $0.40 $0.40 $0.44 $0.00 2014 2015 2016 2017 2018 2Q 2019 YTD Deferred Tax Charge Special Divide
Slide 10: M&A – Core Competency and Strategy
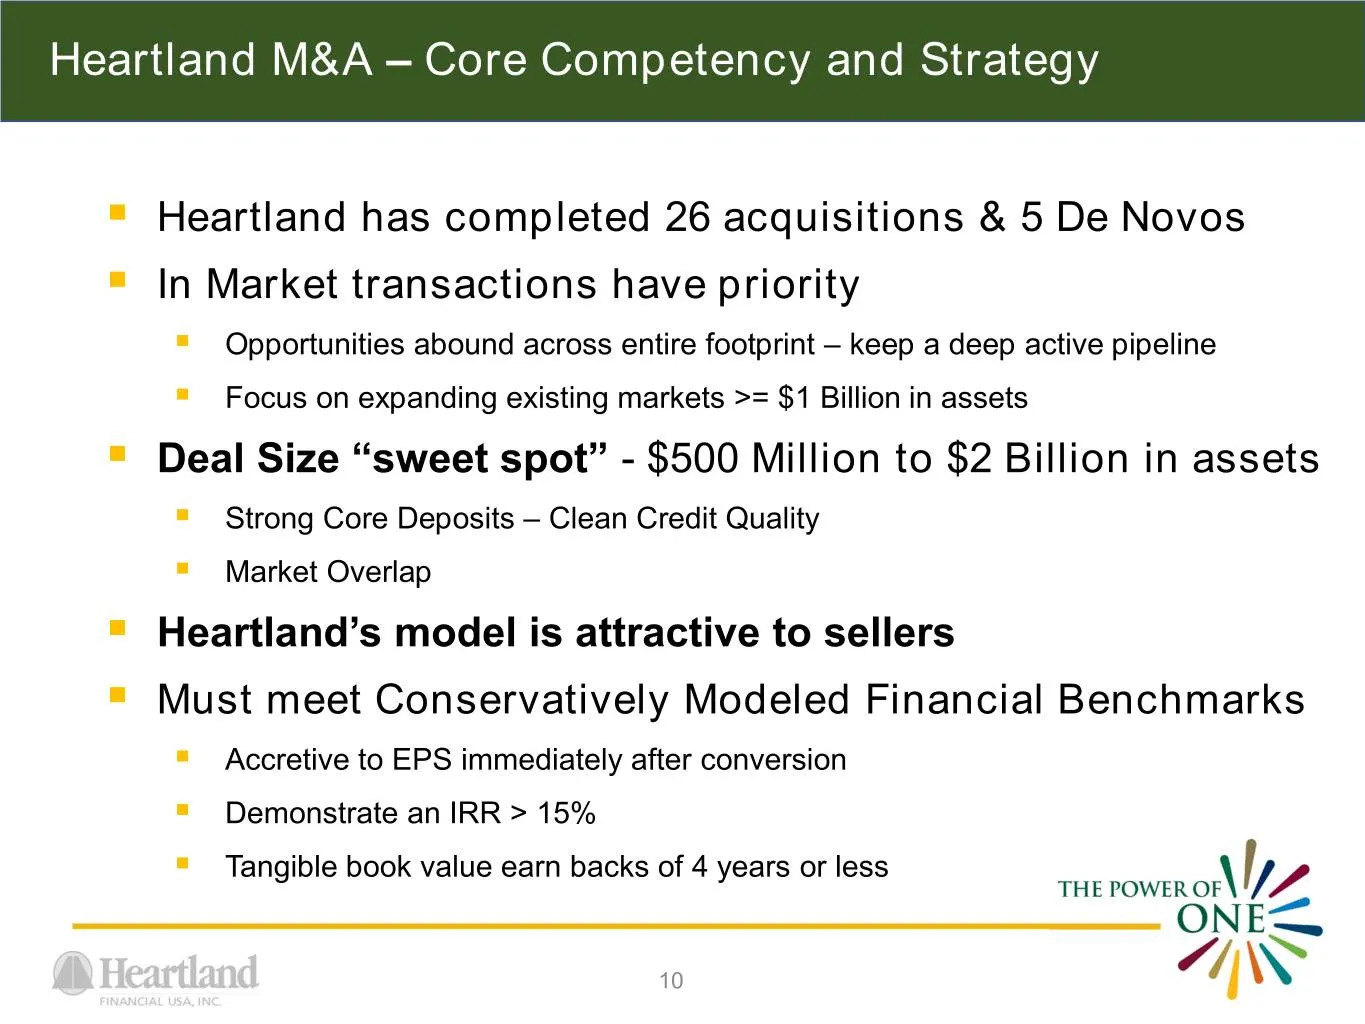
Heartland M&A – Core Competency and Strategy . Heartland has completed 26 acquisitions & 5 De Novos . In Market transactions have priority . Opportunities abound across entire footprint – keep a deep active pipeline . Focus on expanding existing markets >= $1 Billion in assets . Deal Size “sweet spo
Slide 11: Established Core Competencies in the M&A space
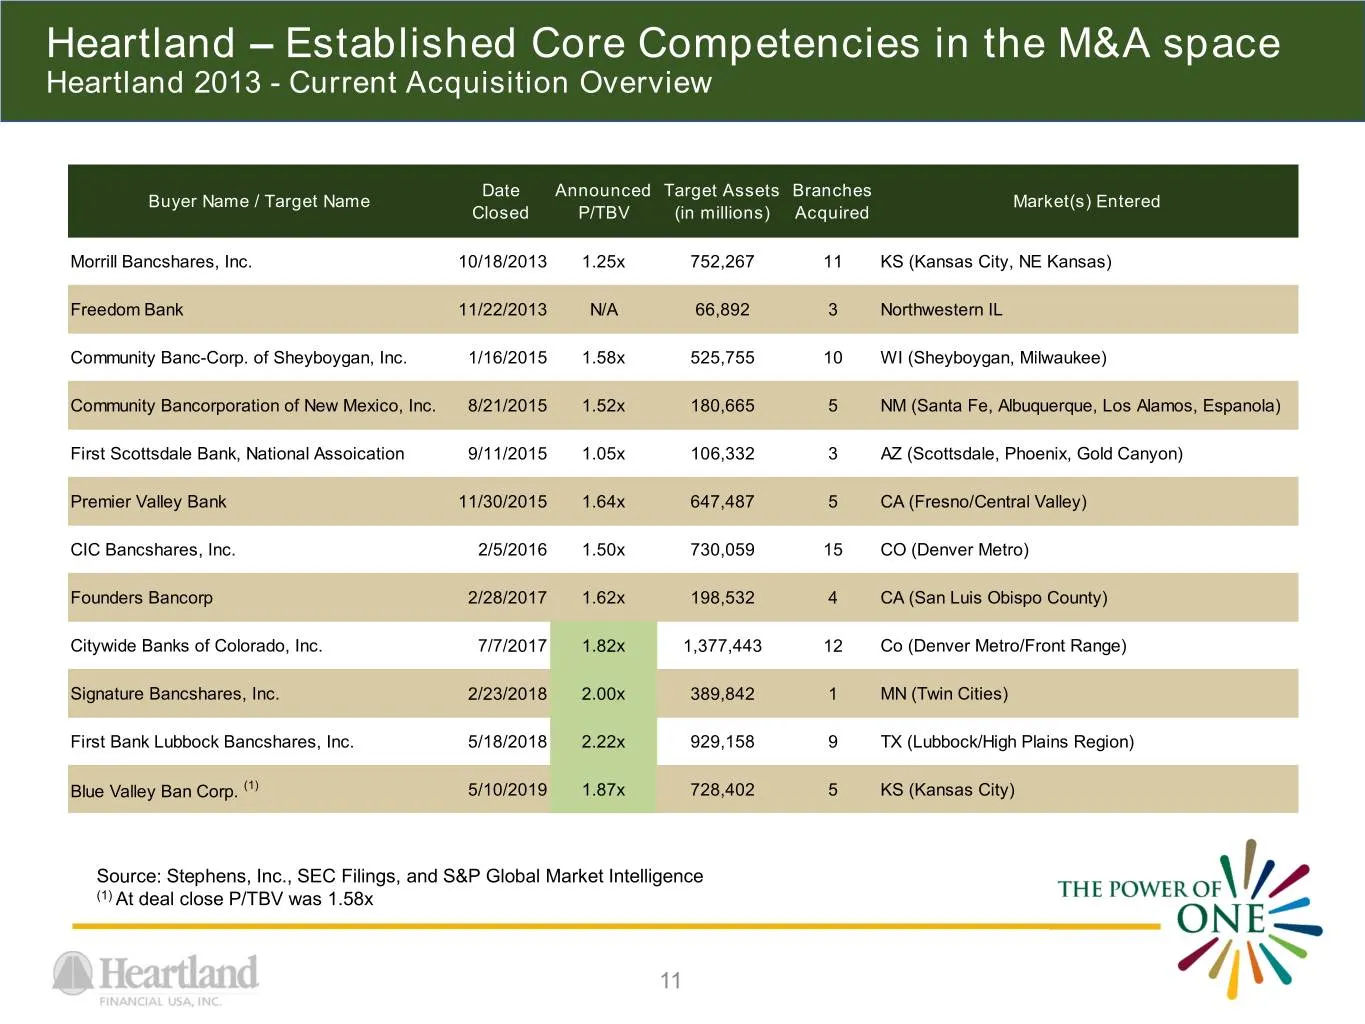
Heartland – Established Core Competencies in the M&A space Heartland 2013 - Current Acquisition Overview Date Announced Target Assets Branches Buyer Name / Target Name Market(s) Entered Closed P/TBV (in millions) Acquired Morrill Bancshares, Inc. 10/18/2013 1.25x 752,267 11 KS (Kansas City, NE Kansa
Slide 12: First Bank & Trust
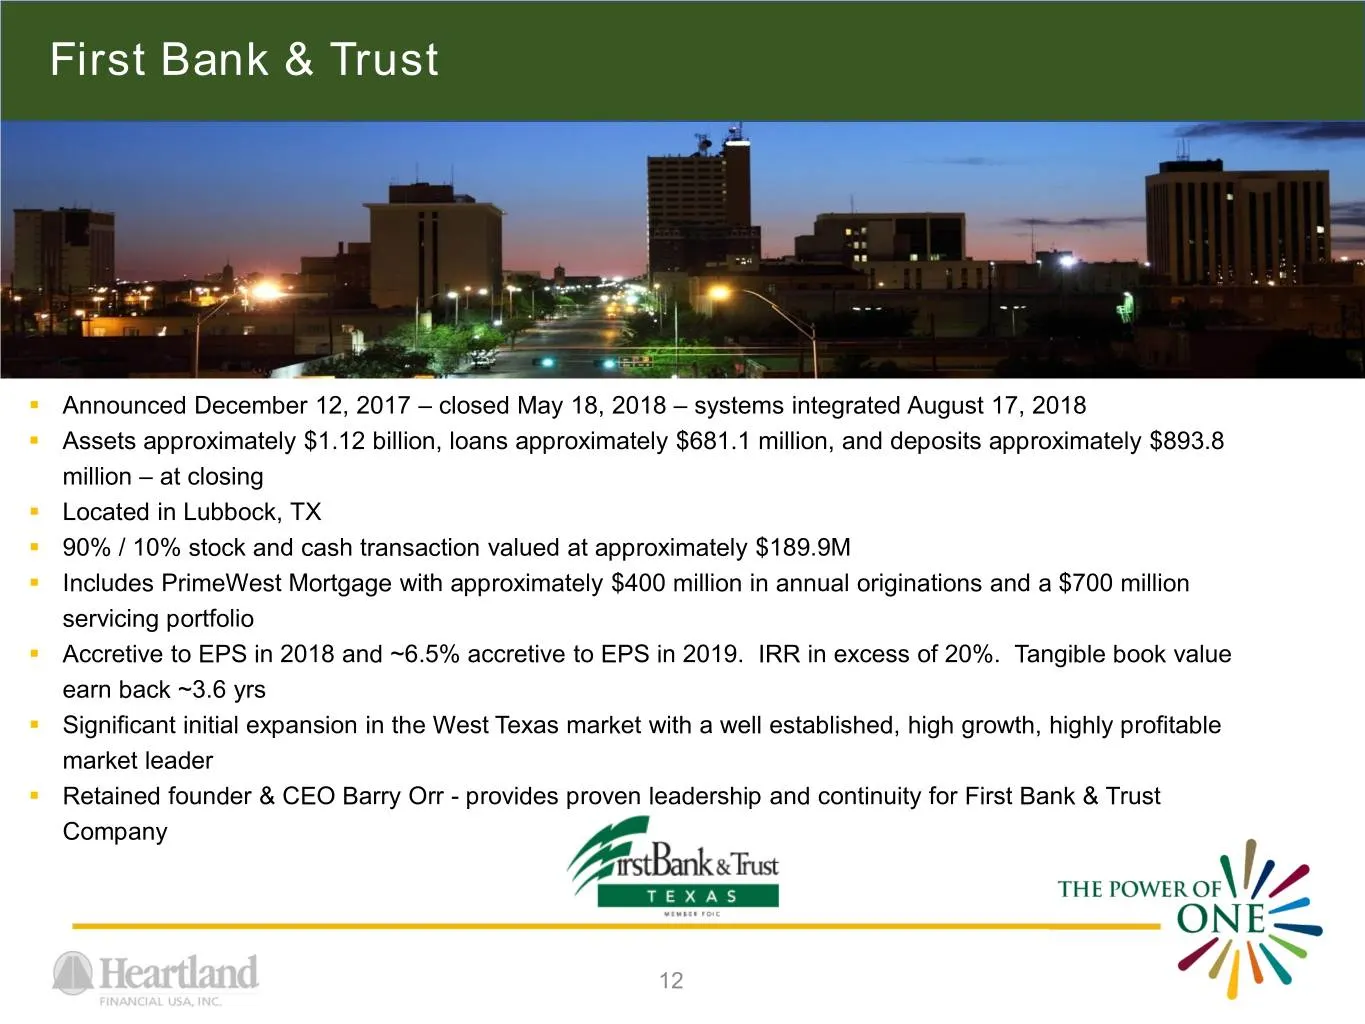
First Bank & Trust . Announced December 12, 2017 – closed May 18, 2018 – systems integrated August 17, 2018 . Assets approximately $1.12 billion, loans approximately $681.1 million, and deposits approximately $893.8 million – at closing . Located in Lubbock, TX . 90% / 10% stock and cash transaction
Slide 13: Bank of Blue Valley
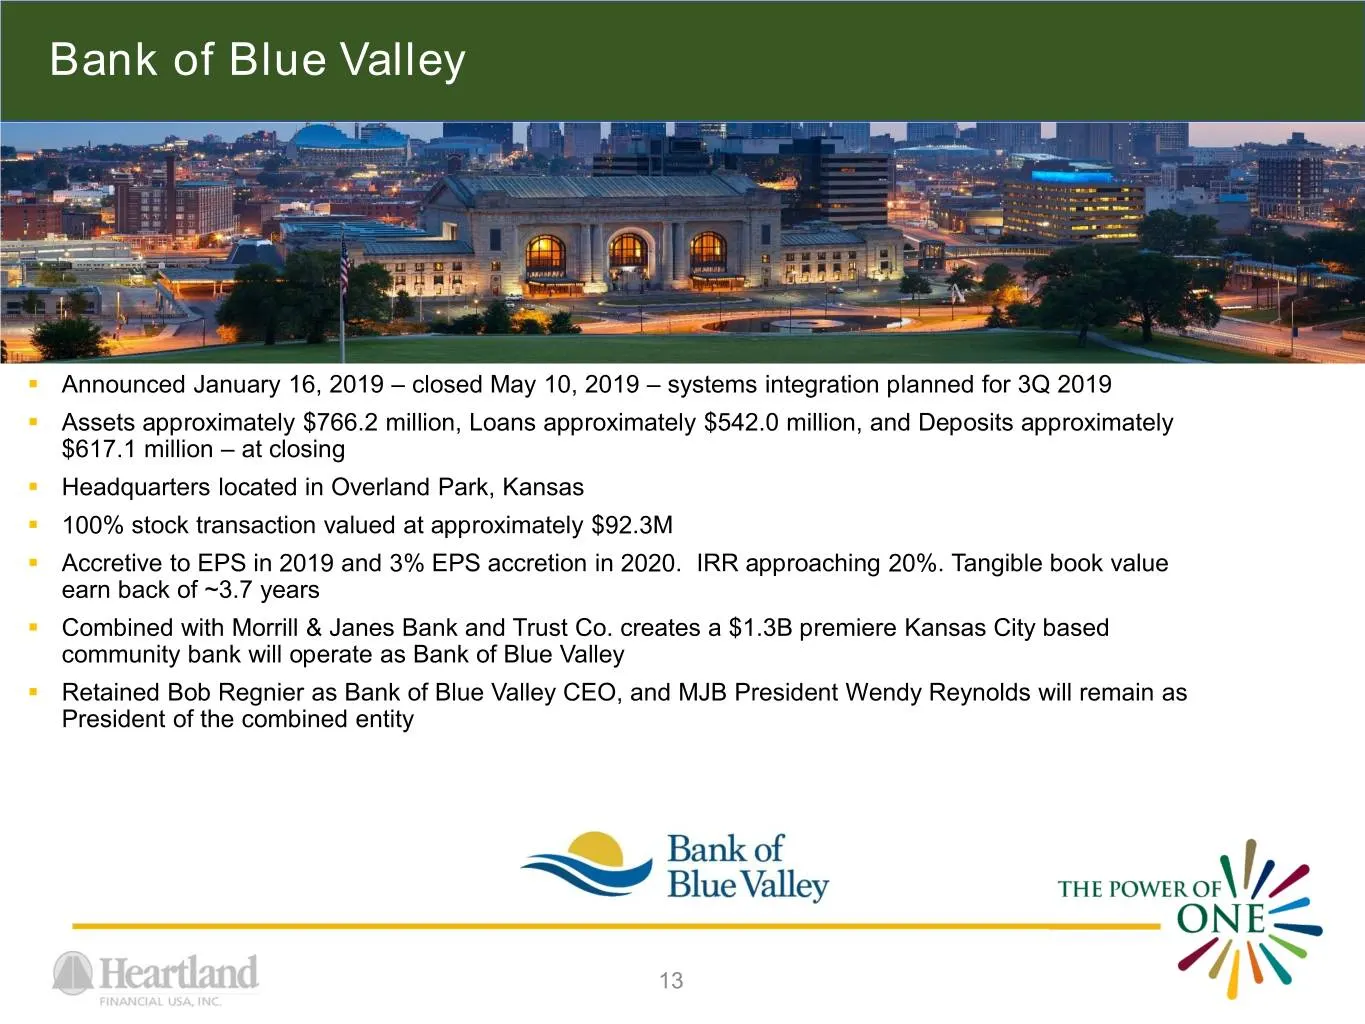
Bank of Blue Valley . Announced January 16, 2019 – closed May 10, 2019 – systems integration planned for 3Q 2019 . Assets approximately $766.2 million, Loans approximately $542.0 million, and Deposits approximately $617.1 million – at closing . Headquarters located in Overland Park, Kansas . 100% st
Slide 14: Agenda
Agenda . Heartland’s history of success and M&A strategy . Heartland’s business highlights and strategy . Financial trends and highlights 14
Slide 15: An Expanding Franchise
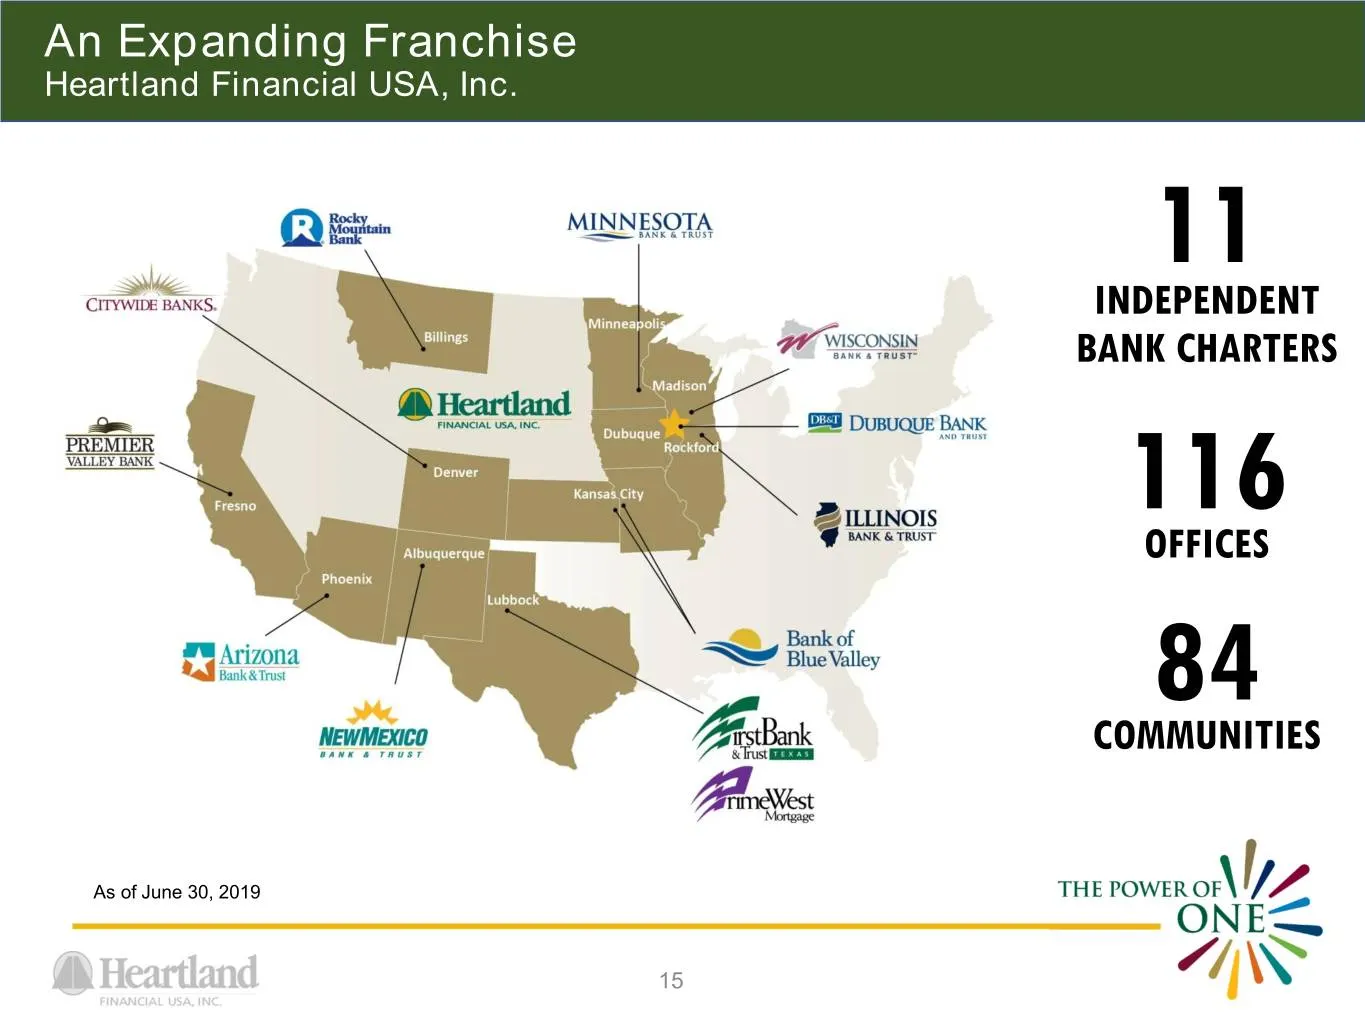
An Expanding Franchise Heartland Financial USA, Inc. 11 INDEPENDENT BANK CHARTERS 116 OFFICES 84 COMMUNITIES As of June 30, 2019 15
Slide 16: Market Overview: Expanding in High Growth Markets
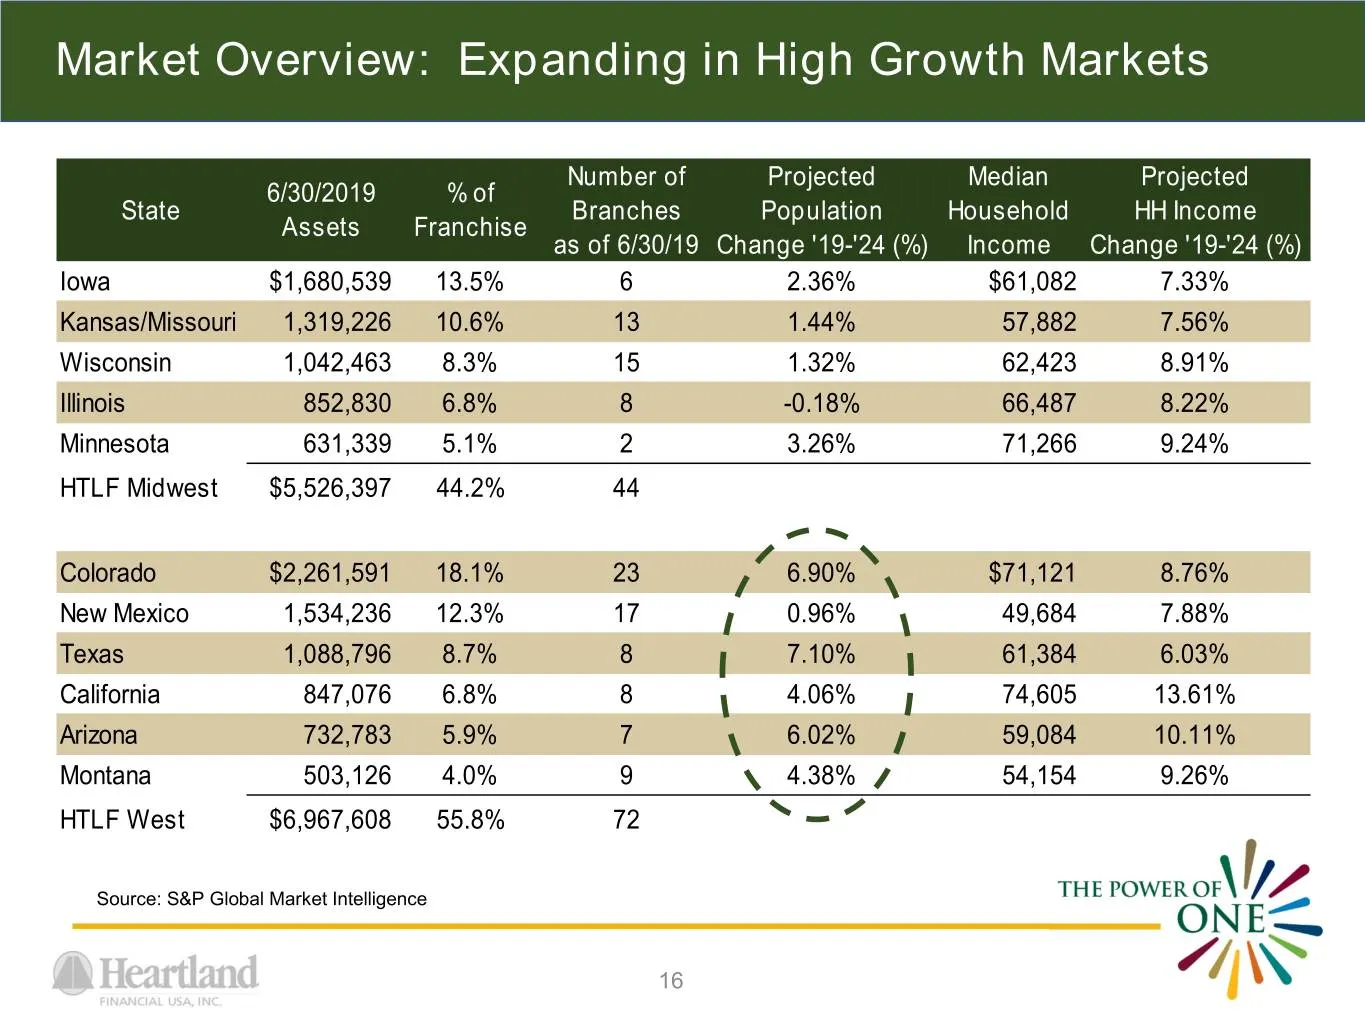
Market Overview: Expanding in High Growth Markets Number of Projected Median Projected 6/30/2019 % of State Branches Population Household HH Income Assets Franchise as of 6/30/19 Change '19-'24 (%) Income Change '19-'24 (%) Iowa $1,680,539 13.5% 6 2.36% $61,082 7.33% Kansas/Missouri 1,319,226 10.6%
Slide 17: Diversified Loan Portfolio
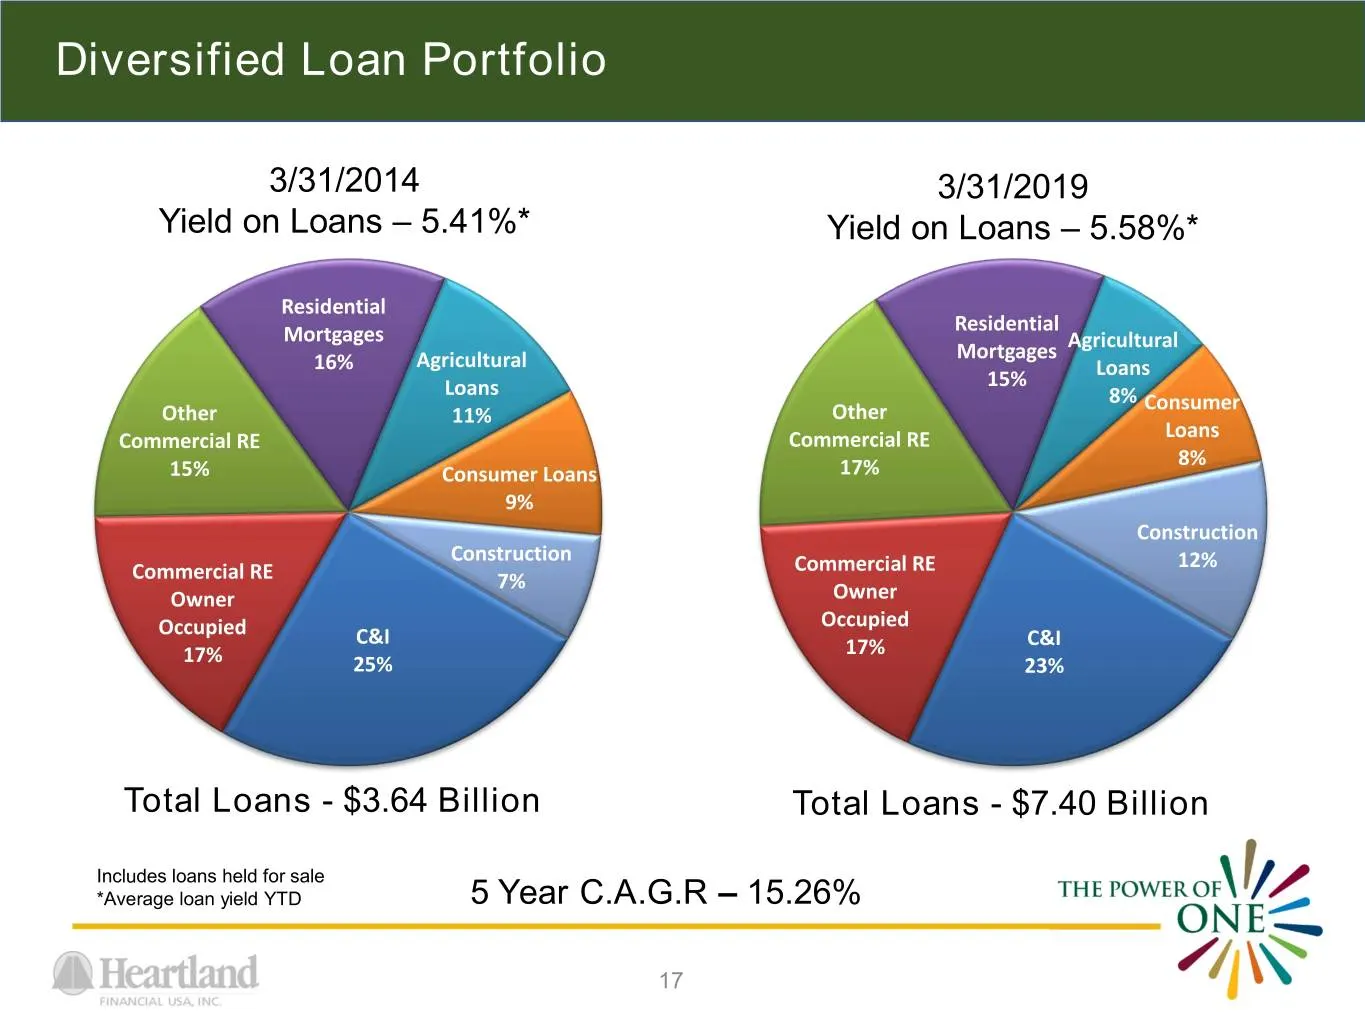
Diversified Loan Portfolio 3/31/2014 3/31/2019 Yield on Loans – 5.41%* Yield on Loans – 5.58%* Residential Mortgages Residential Mortgages Agricultural 16% Agricultural Loans Loans 15% 8% Consumer Other 11% Other Commercial RE Commercial RE Loans 8% 15% Consumer Loans 17% 9% Construction Constructio
Slide 18: Loan Portfolio Trend
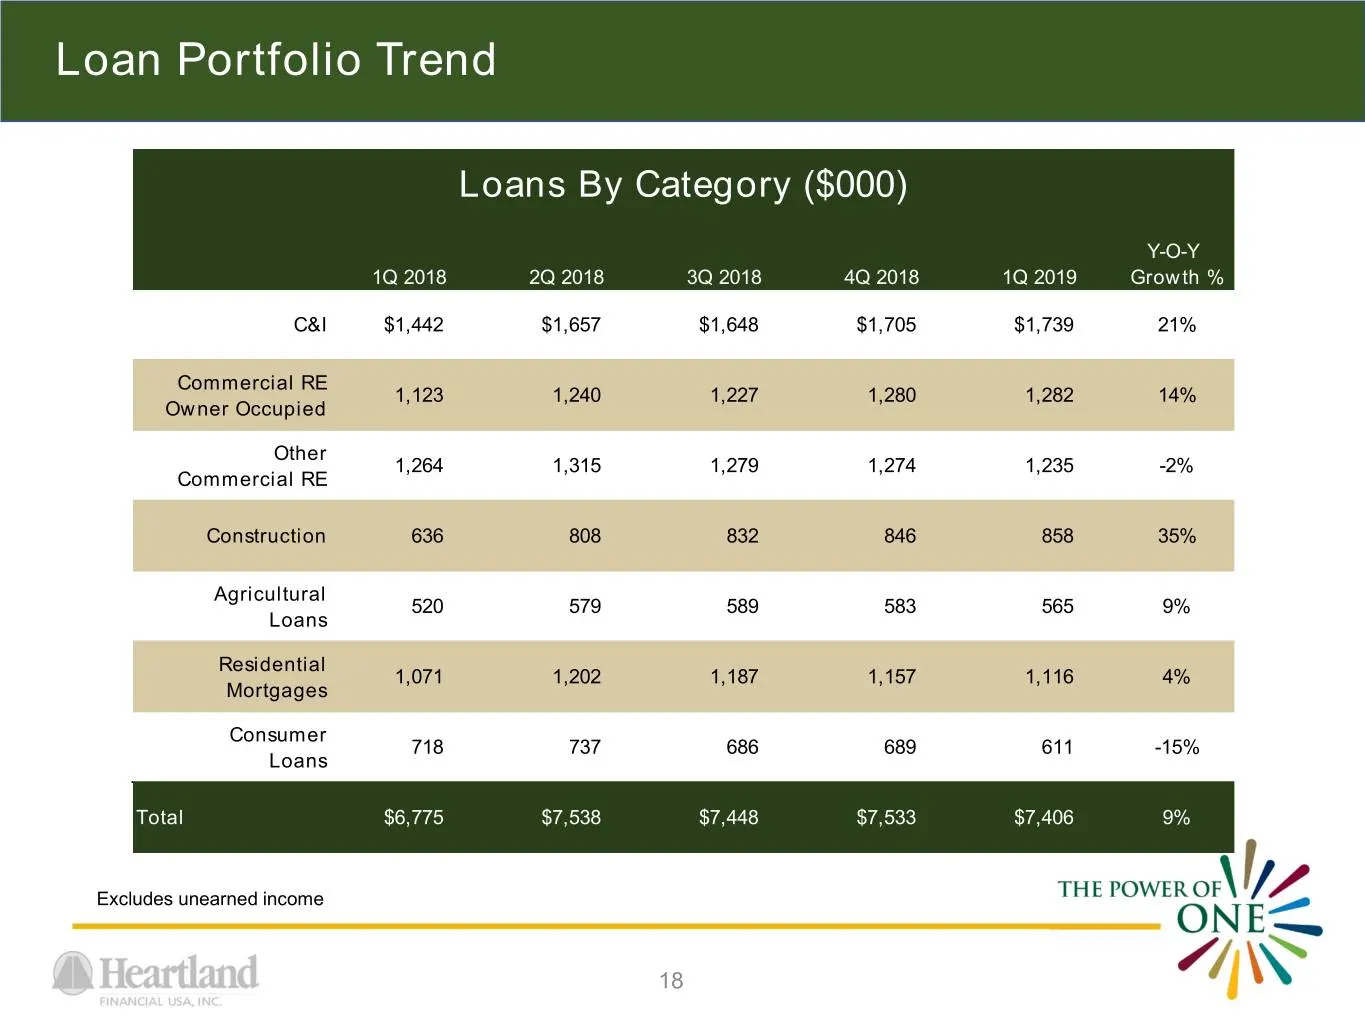
Loan Portfolio Trend Loans By Category ($000) Y-O-Y 1Q 2018 2Q 2018 3Q 2018 4Q 2018 1Q 2019 Growth % C&I $1,442 $1,657 $1,648 $1,705 $1,739 21% Commercial RE 1,123 1,240 1,227 1,280 1,282 14% Owner Occupied Other 1,264 1,315 1,279 1,274 1,235 -2% Commercial RE Construction 636 808 832 846 858 35% Ag
Slide 19: Loan Portfolio Trend
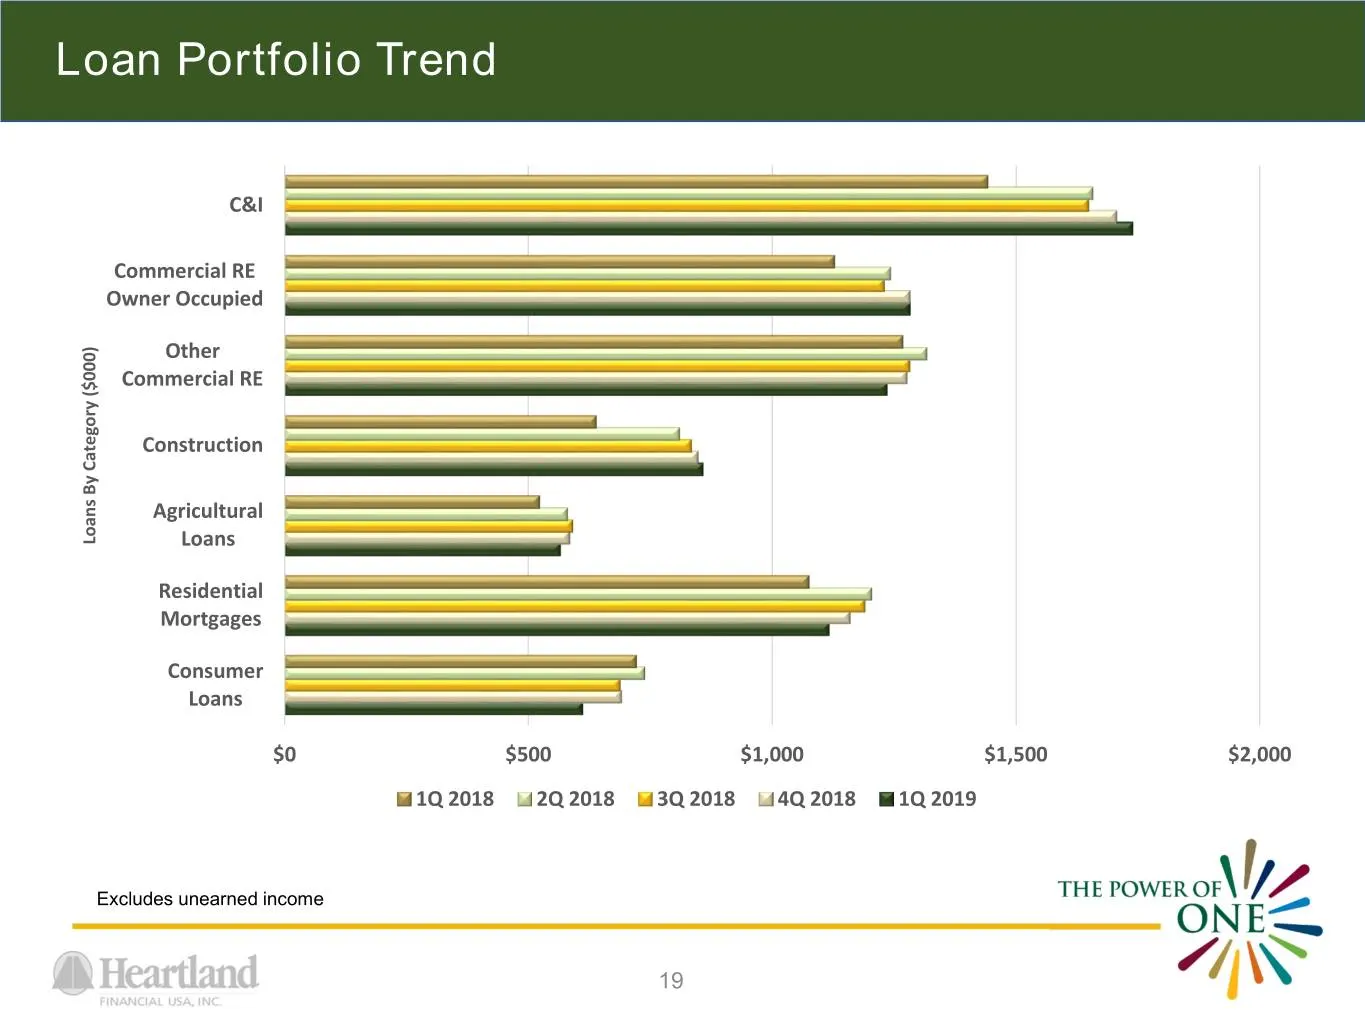
Loan Portfolio Trend C&I Commercial RE Owner Occupied Other Commercial RE Construction Agricultural LoansBy Category ($000) Loans Residential Mortgages Consumer Loans $0 $500 $1,000 $1,500 $2,000 1Q 2018 2Q 2018 3Q 2018 4Q 2018 1Q 2019 Excludes unearned income 19
Slide 20: Well managed CRE and Construction Exposure
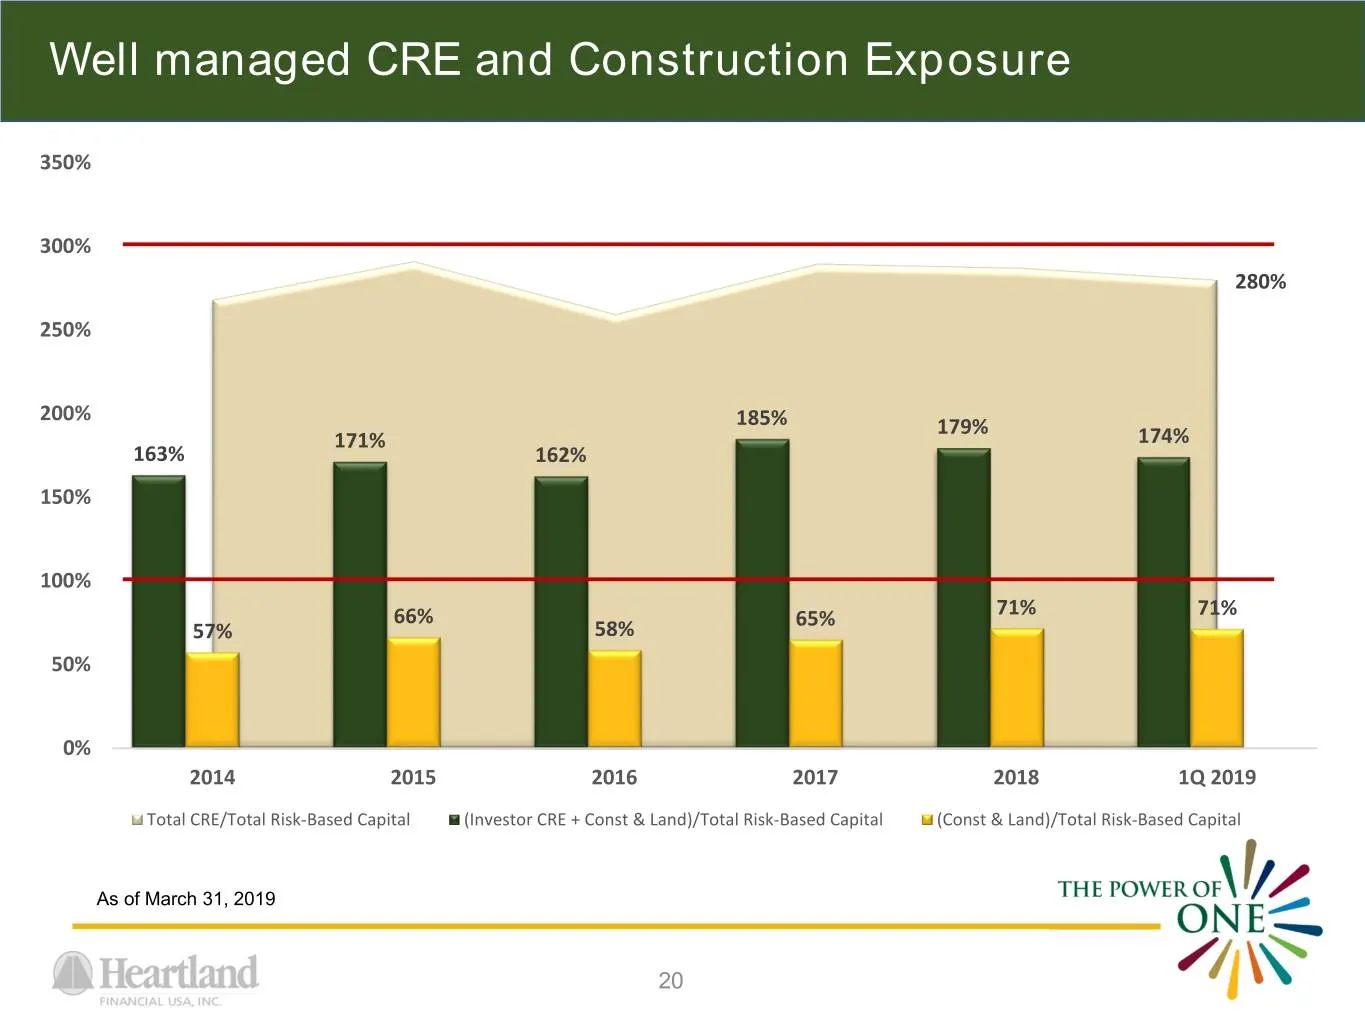
Well managed CRE and Construction Exposure 350% 300% 280% 250% 200% 185% 179% 171% 174% 163% 162% 150% 100% 66% 65% 71% 71% 57% 58% 50% 0% 2014 2015 2016 2017 2018 1Q 2019 Total CRE/Total Risk-Based Capital (Investor CRE + Const & Land)/Total Risk-Based Capital (Const & Land)/Total Risk-Based Capita
Slide 21: Expanding Core Deposit Mix
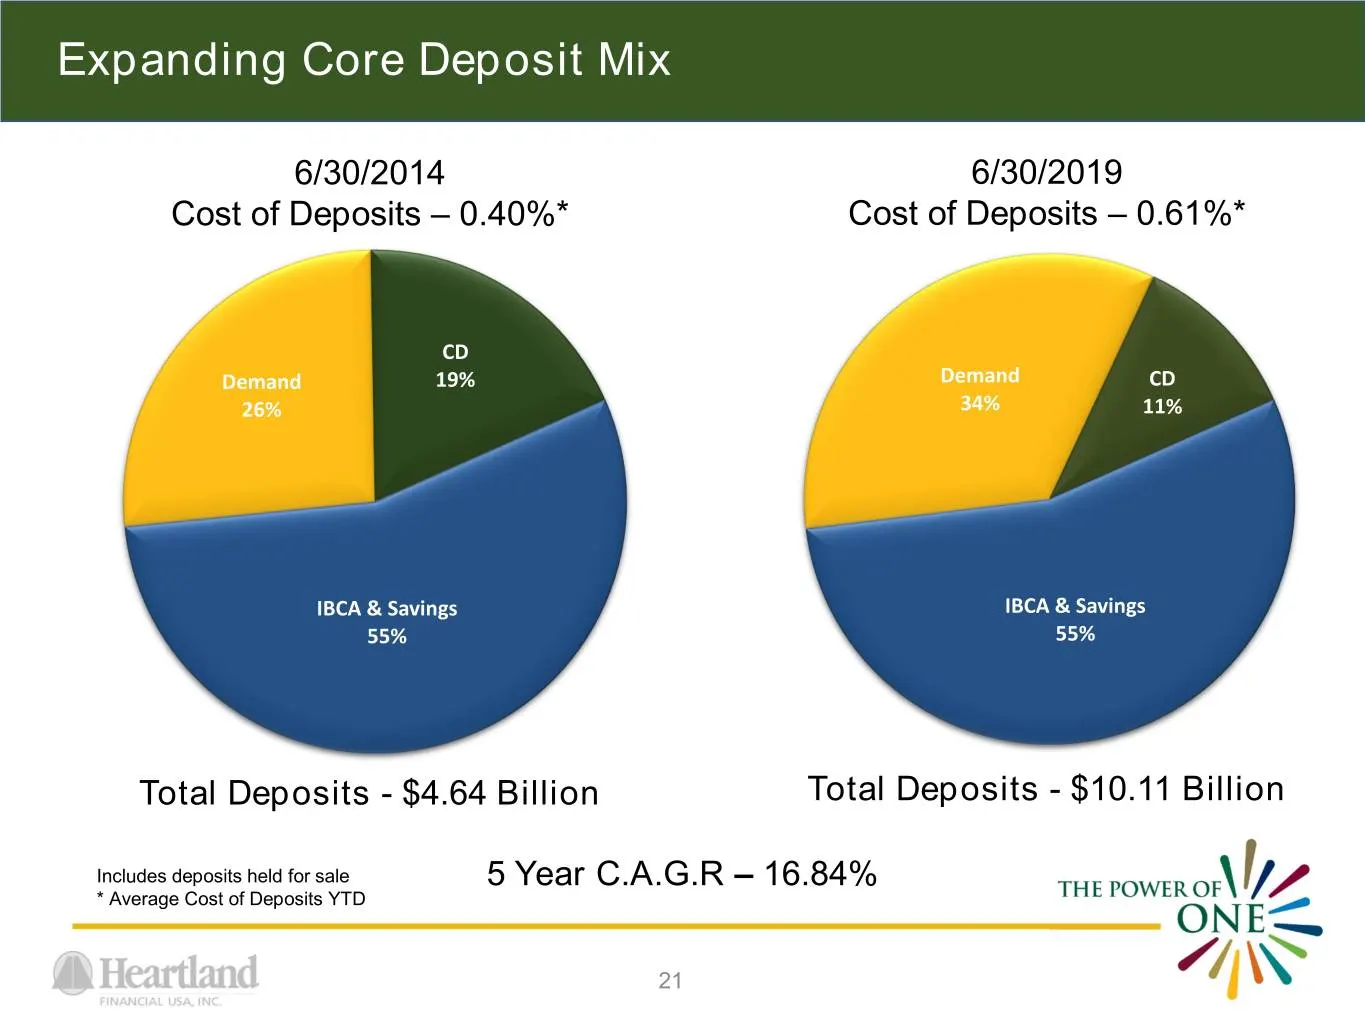
Expanding Core Deposit Mix 6/30/2014 6/30/2019 Cost of Deposits – 0.40%* Cost of Deposits – 0.61%* CD Demand 19% Demand CD 26% 34% 11% IBCA & Savings IBCA & Savings 55% 55% Total Deposits - $4.64 Billion Total Deposits - $10.11 Billion Includes deposits held for sale 5 Year C.A.G.R – 16.84% * Averag
Slide 22: Non-Interest Income by Category
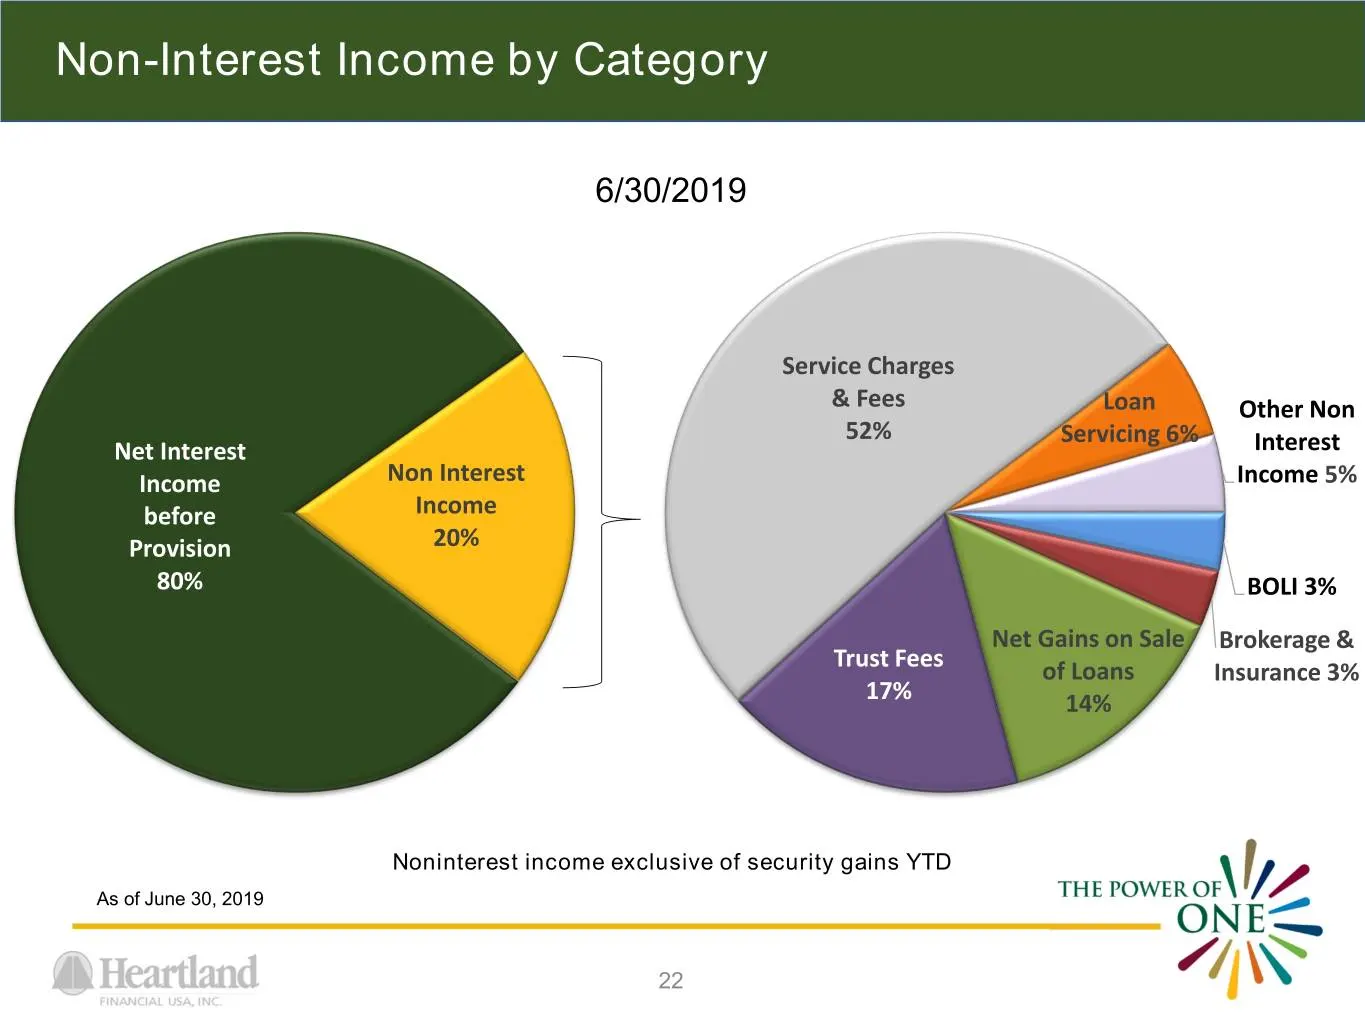
Non-Interest Income by Category 6/30/2019 Service Charges & Fees Loan Other Non 52% Servicing 6% Net Interest Interest Income Non Interest Income 5% before Income Provision 20% 80% BOLI 3% Net Gains on Sale Brokerage & Trust Fees of Loans Insurance 3% 17% 14% Noninterest income exclusive of security
Slide 23: Private Client Services Revenue Trends
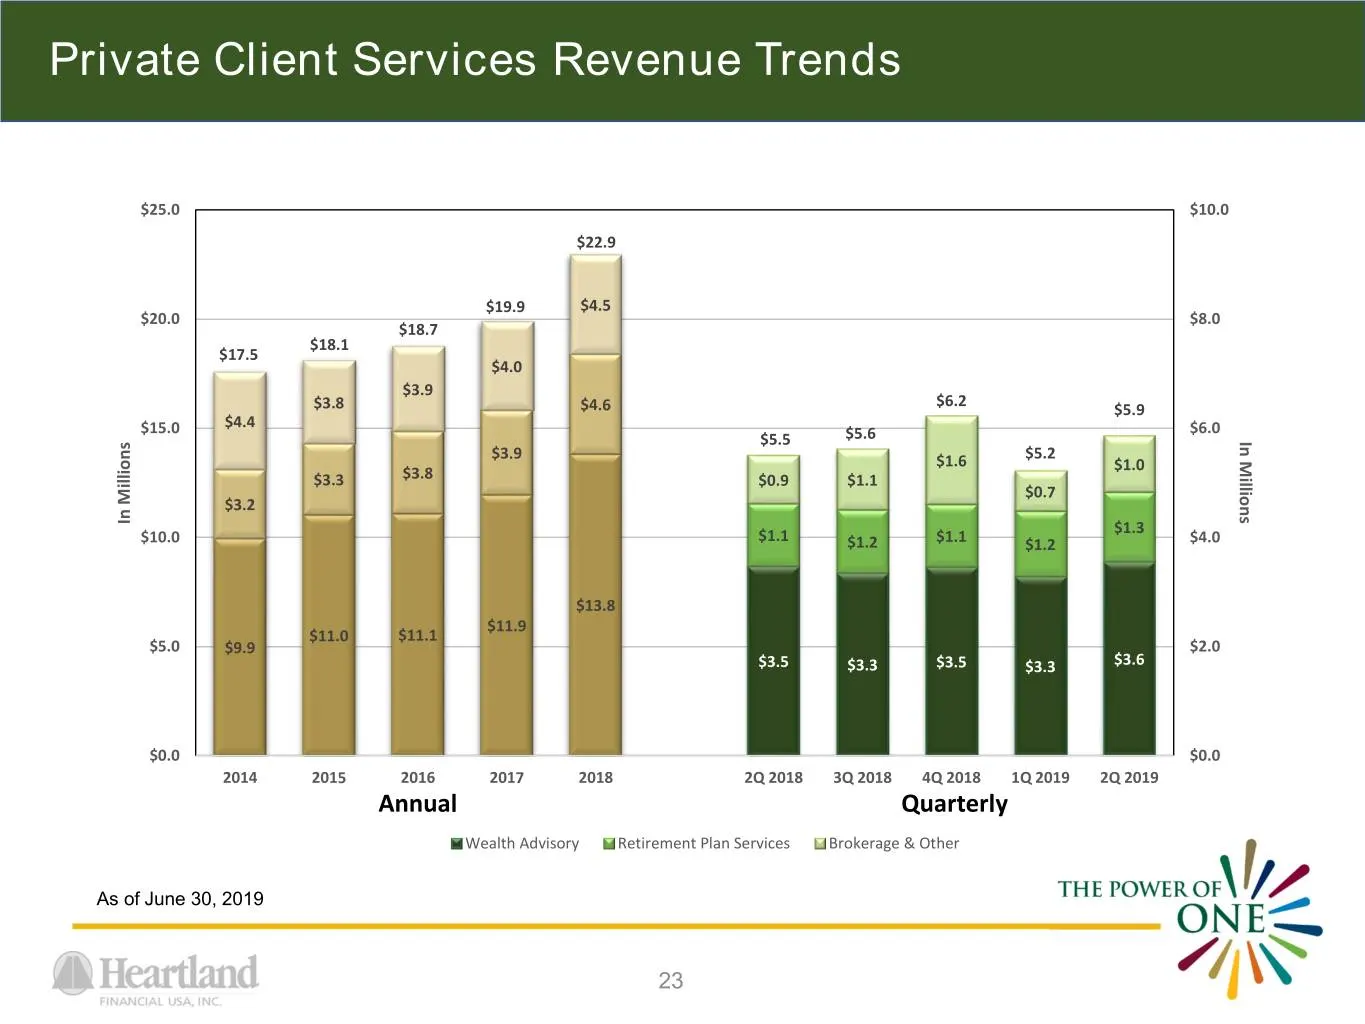
Private Client Services Revenue Trends $25.0 $10.0 $22.9 $19.9 $4.5 $20.0 $8.0 $18.7 $18.1 $17.5 $4.0 $3.9 $6.2 $3.8 $4.6 $5.9 $15.0 $4.4 $6.0 $5.5 $5.6 Millions In $3.9 $5.2 $1.6 $1.0 $3.3 $3.8 $0.9 $1.1 $0.7 $3.2 InMillions $1.1 $1.3 $10.0 $1.2 $1.1 $1.2 $4.0 $13.8 $11.9 $11.0 $11.1 $5.0 $9.9 $2.0
Slide 24: Service Charges & Fees Revenue Trends
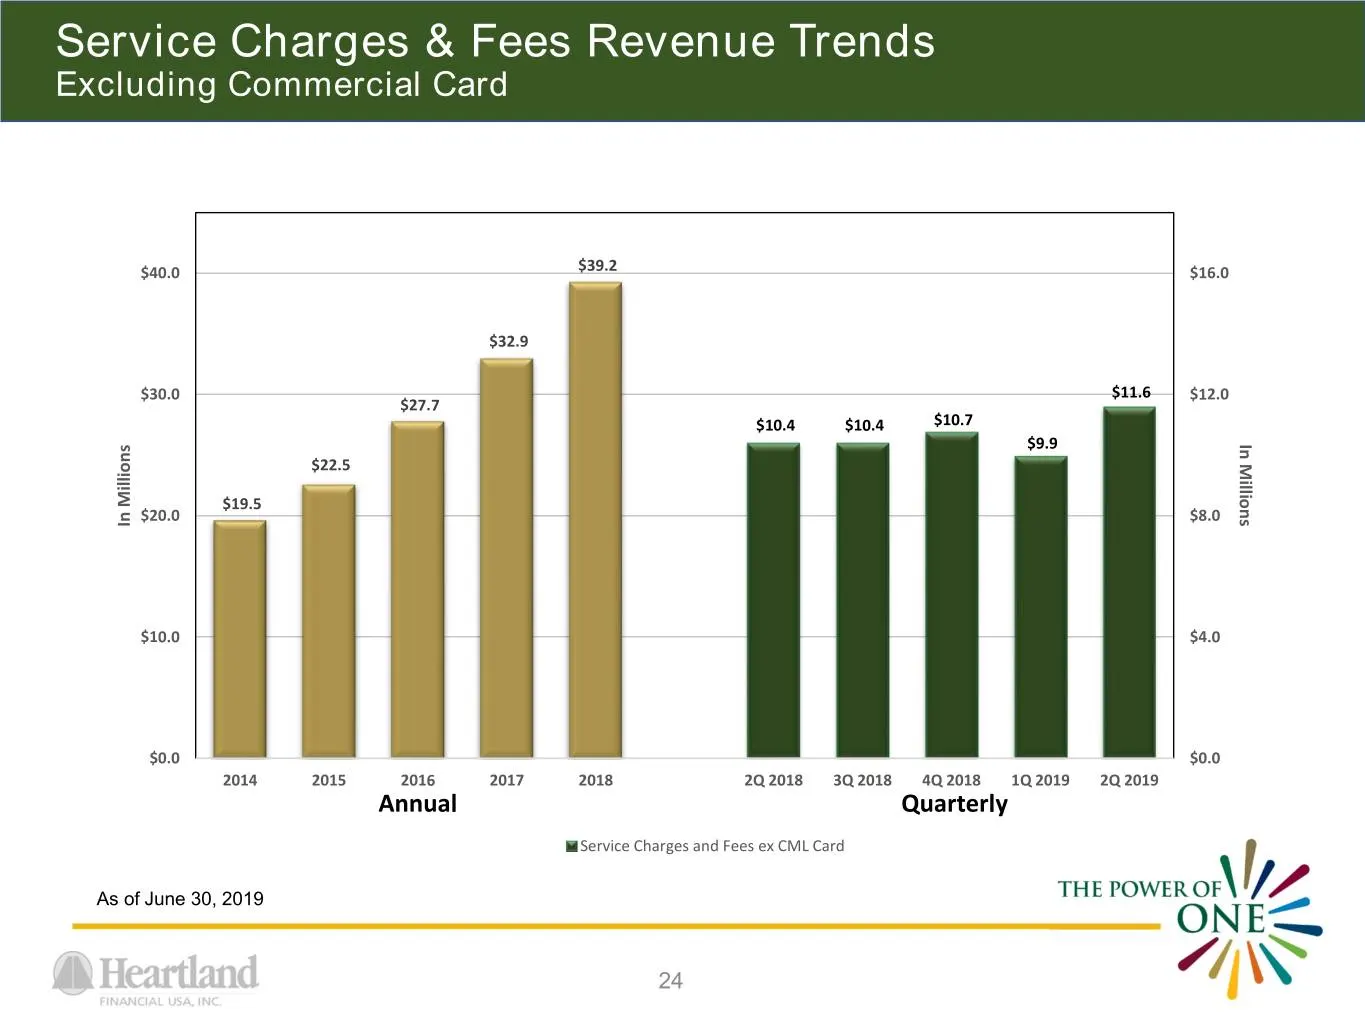
Service Charges & Fees Revenue Trends Excluding Commercial Card $40.0 $39.2 $16.0 $32.9 $30.0 $11.6 $12.0 $27.7 $10.4 $10.4 $10.7 $9.9 Millions In $22.5 $19.5 $20.0 $8.0 InMillions $10.0 $4.0 $0.0 $0.0 2014 2015 2016 2017 2018 2Q 2018 3Q 2018 4Q 2018 1Q 2019 2Q 2019 Annual Quarterly Service Charges
Slide 25: Commercial Card Revenue Trends
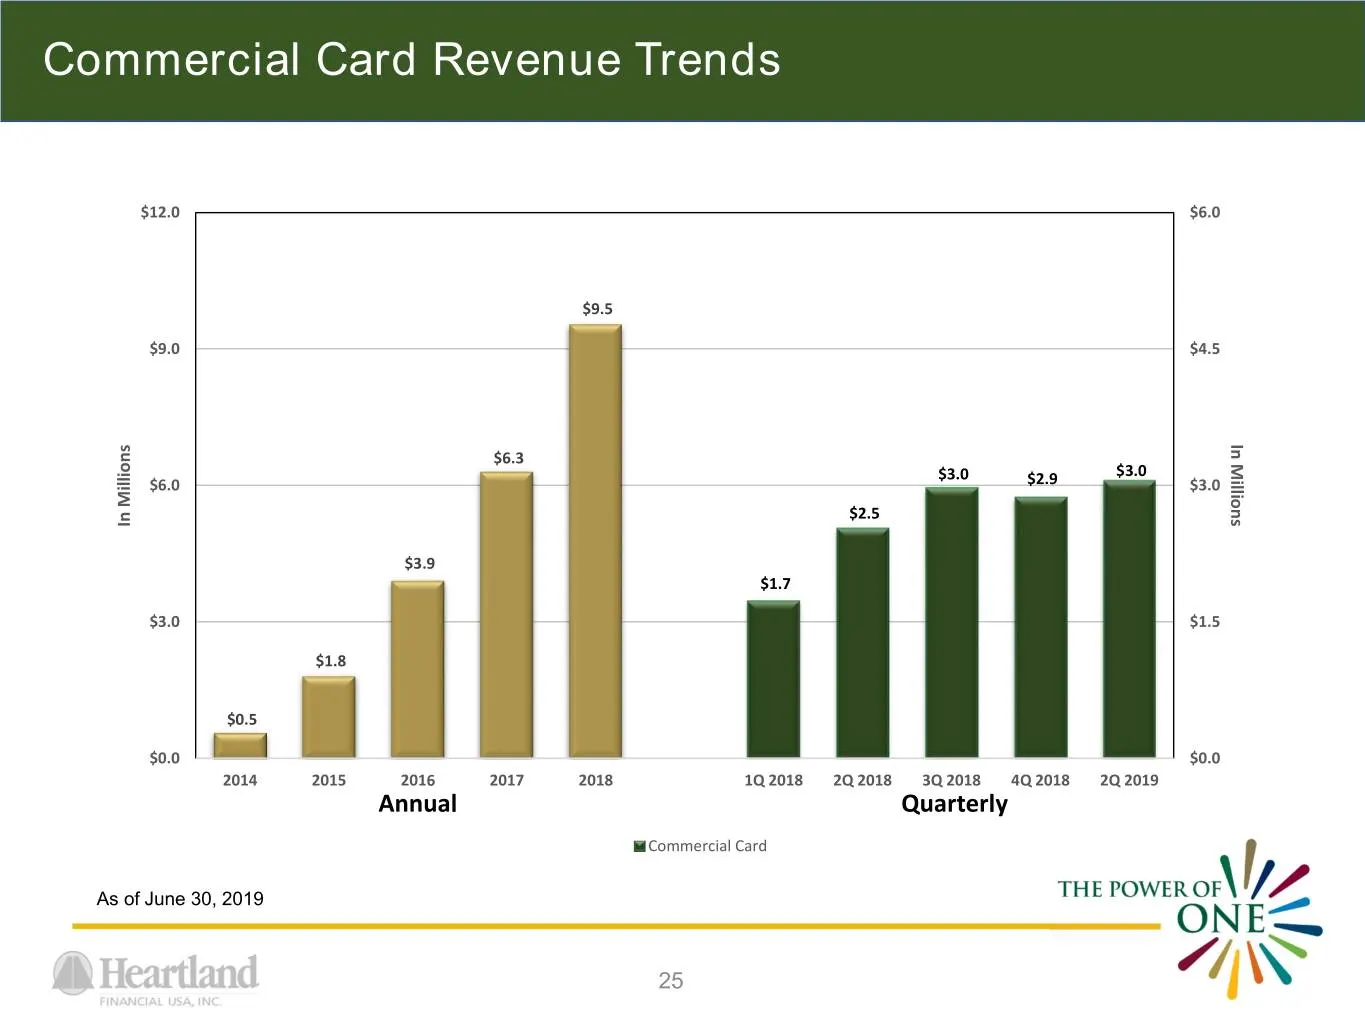
Commercial Card Revenue Trends $12.0 $6.0 $9.5 $9.0 $4.5 In Millions In $6.3 $3.0 $3.0 $6.0 $2.9 $3.0 $2.5 InMillions $3.9 $1.7 $3.0 $1.5 $1.8 $0.5 $0.0 $0.0 2014 2015 2016 2017 2018 1Q 2018 2Q 2018 3Q 2018 4Q 2018 2Q 2019 Annual Quarterly Commercial Card As of June 30, 2019 25
Slide 26: 2019 Top Priorities
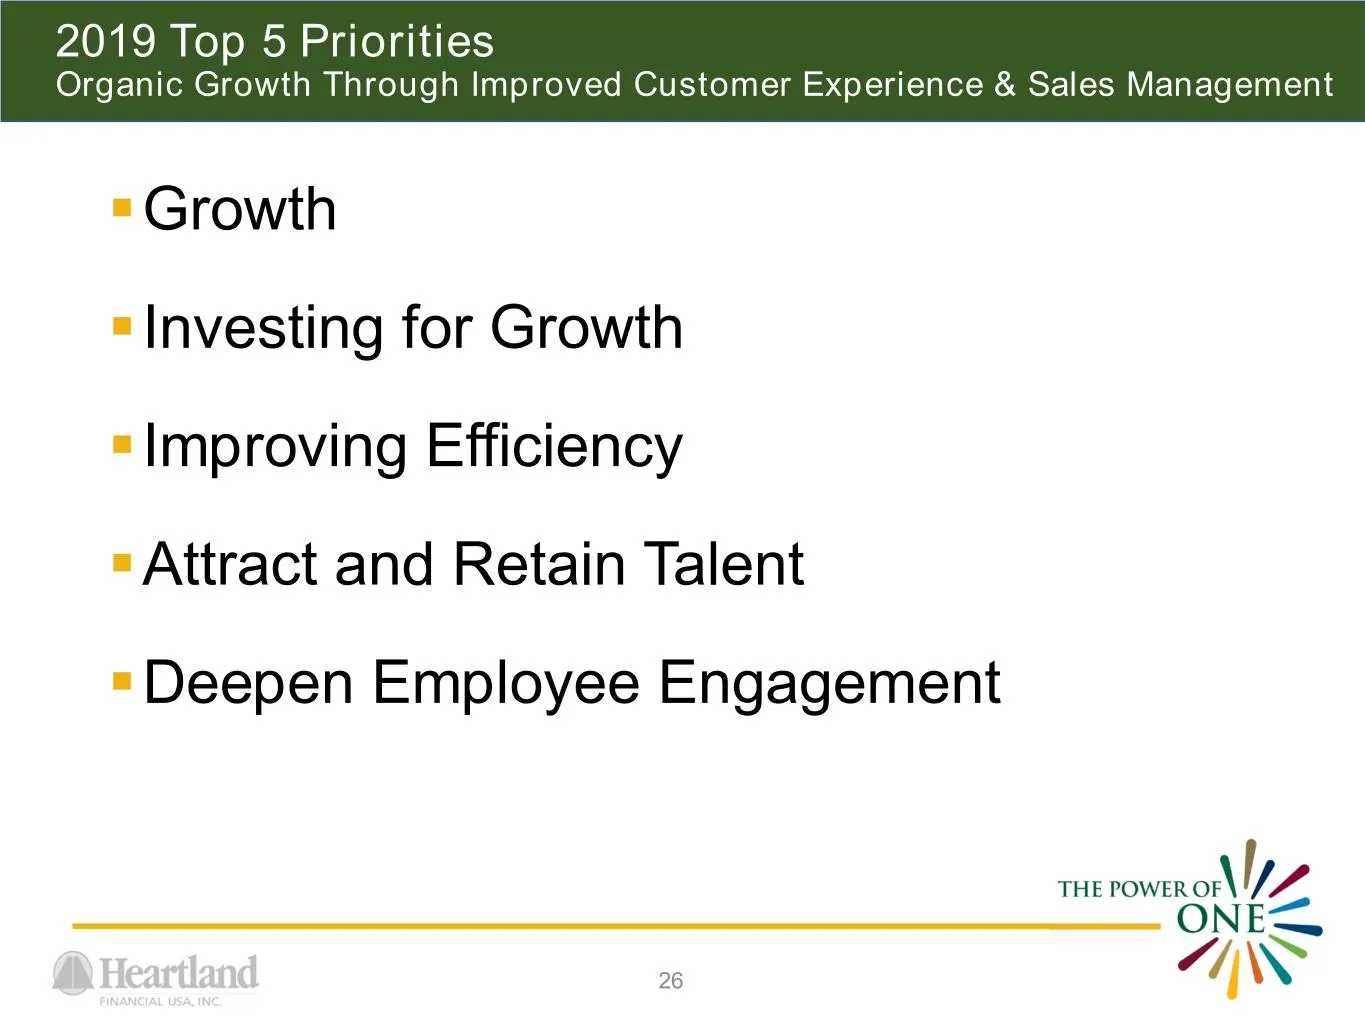
2019 Top 5 Priorities Organic Growth Through Improved Customer Experience & Sales Management .Growth .Investing for Growth .Improving Efficiency .Attract and Retain Talent .Deepen Employee Engagement 26
Slide 27: Agenda
Agenda . Heartland’s history of success and M&A strategy . Heartland’s business highlights and strategy . Financial trends and highlights 27
Slide 28: Streamlining and Investing in Growth
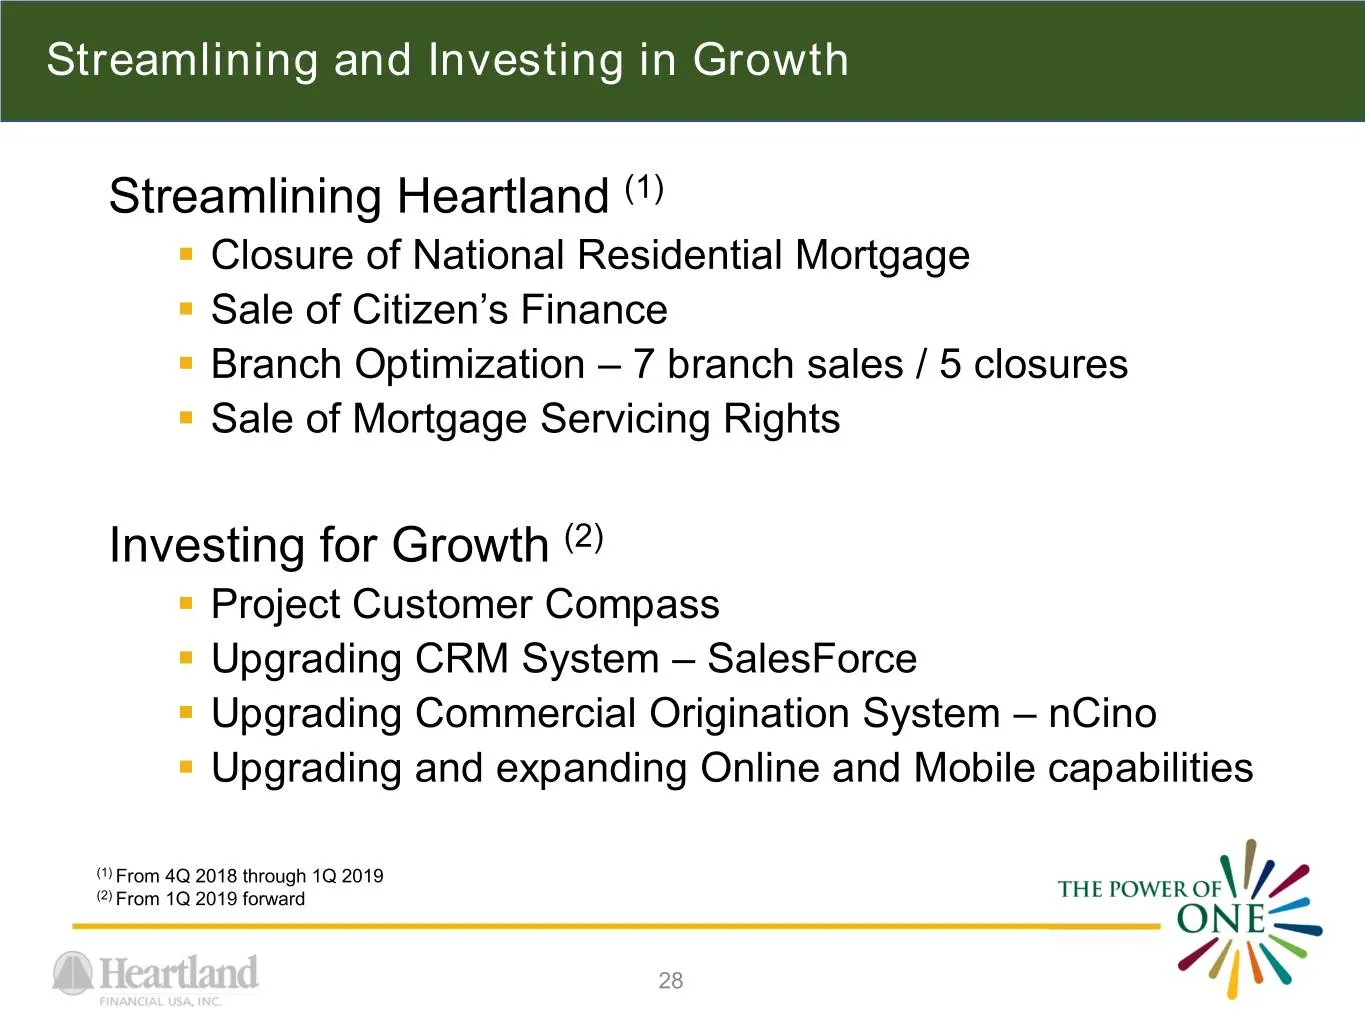
Streamlining and Investing in Growth Streamlining Heartland (1) . Closure of National Residential Mortgage . Sale of Citizen’s Finance . Branch Optimization – 7 branch sales / 5 closures . Sale of Mortgage Servicing Rights Investing for Growth (2) . Project Customer Compass . Upgrading CRM System –
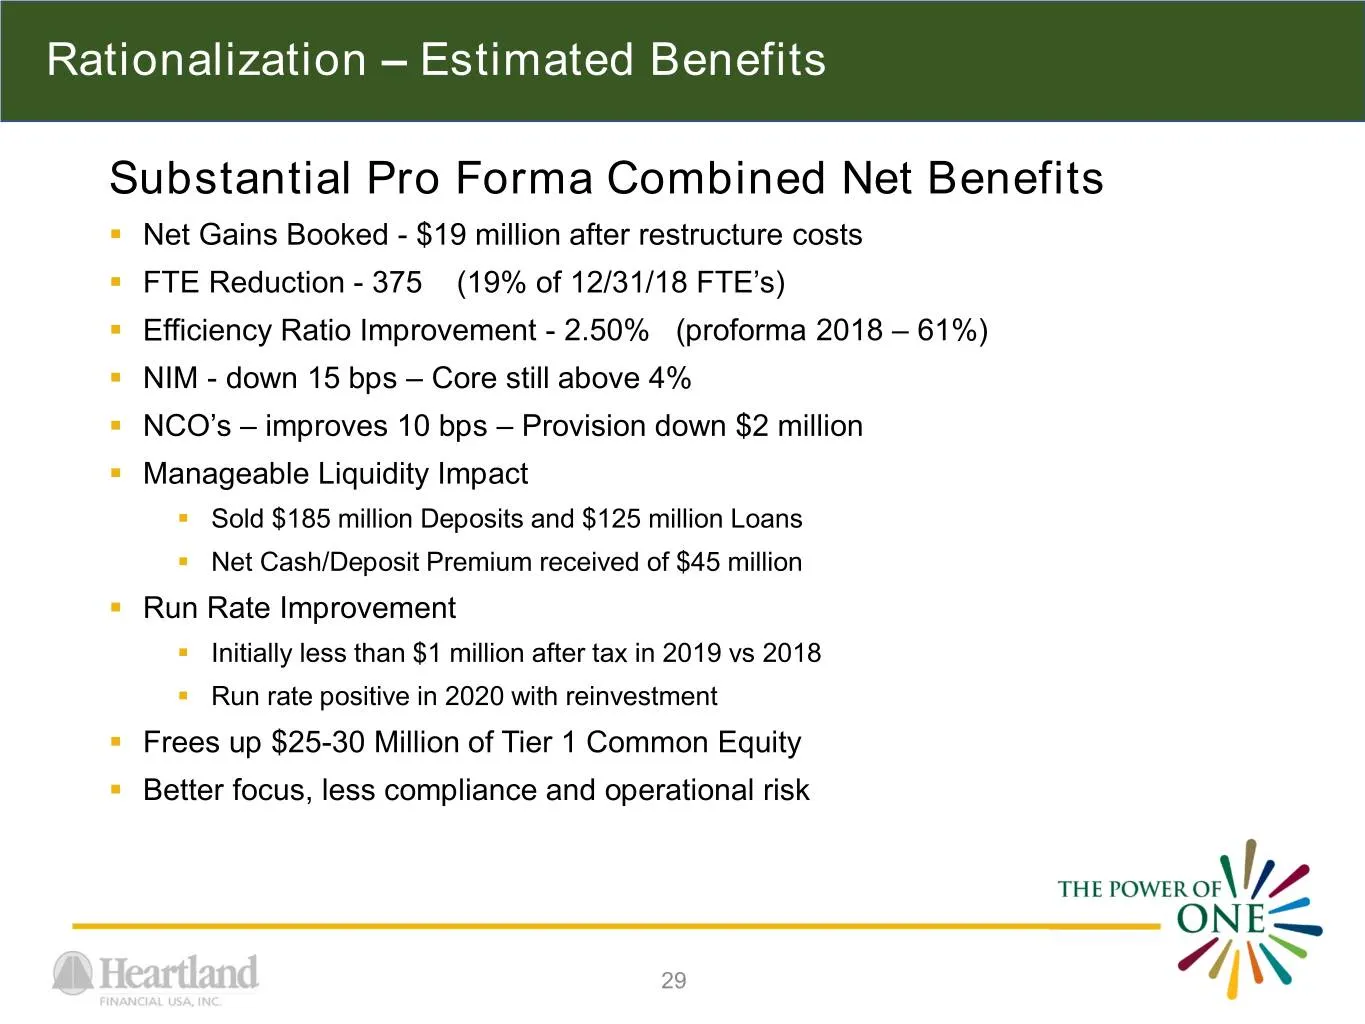
Slide 29: Rationalization – Estimated Benefits
Rationalization – Estimated Benefits Substantial Pro Forma Combined Net Benefits . Net Gains Booked - $19 million after restructure costs . FTE Reduction - 375 (19% of 12/31/18 FTE’s) . Efficiency Ratio Improvement - 2.50% (proforma 2018 – 61%) . NIM - down 15 bps – Core still above 4% . NCO’s – imp
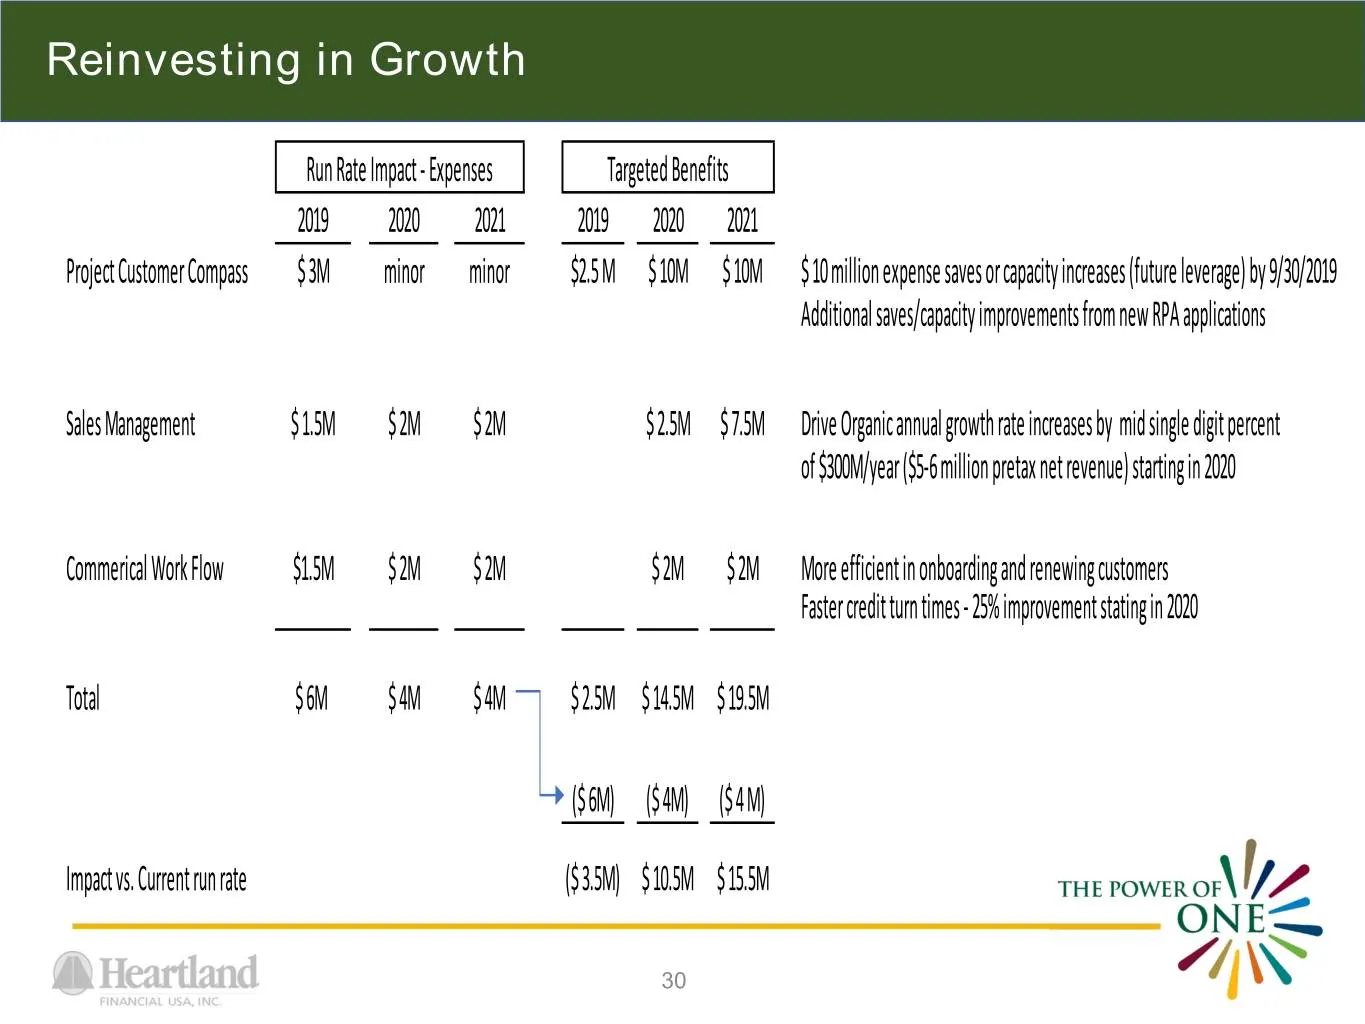
Slide 30: Reinvesting in Growth
Reinvesting in Growth Run Rate Impact - Expenses Targeted Benefits 2019 2020 2021 2019 2020 2021 Project Customer Compass $ 3M minor minor $2.5 M $ 10M $ 10M $ 10 million expense saves or capacity increases (future leverage) by 9/30/2019 Additional saves/capacity improvements from new RPA applicatio
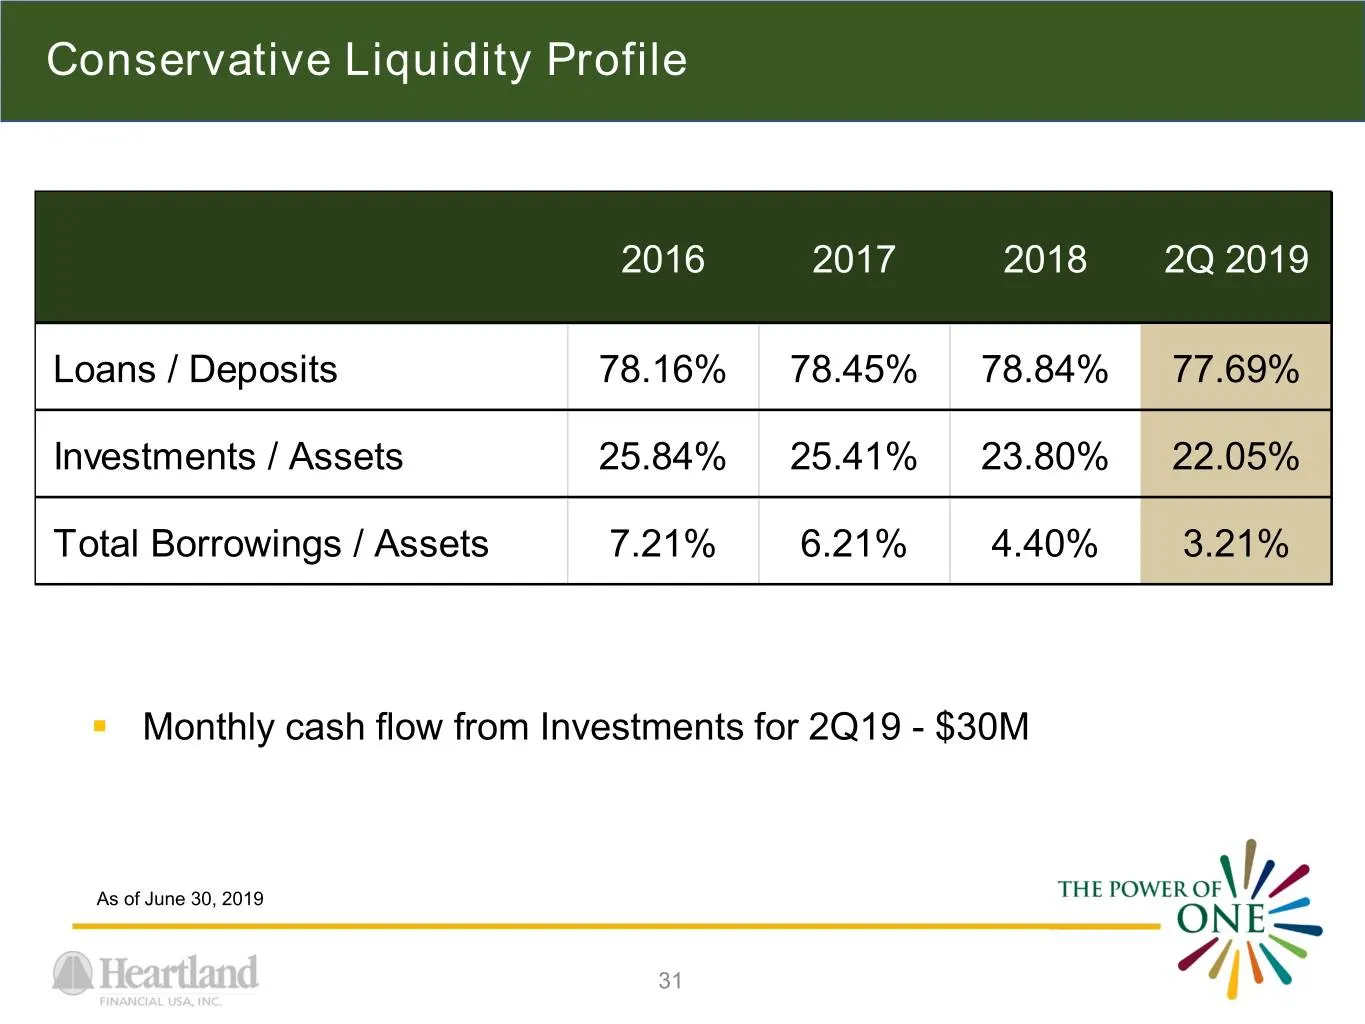
Slide 31: Conservative Liquidity Profile
Conservative Liquidity Profile 2016 2017 2018 2Q 2019 Loans / Deposits 78.16% 78.45% 78.84% 77.69% Investments / Assets 25.84% 25.41% 23.80% 22.05% Total Borrowings / Assets 7.21% 6.21% 4.40% 3.21% . Monthly cash flow from Investments for 2Q19 - $30M As of June 30, 2019 31
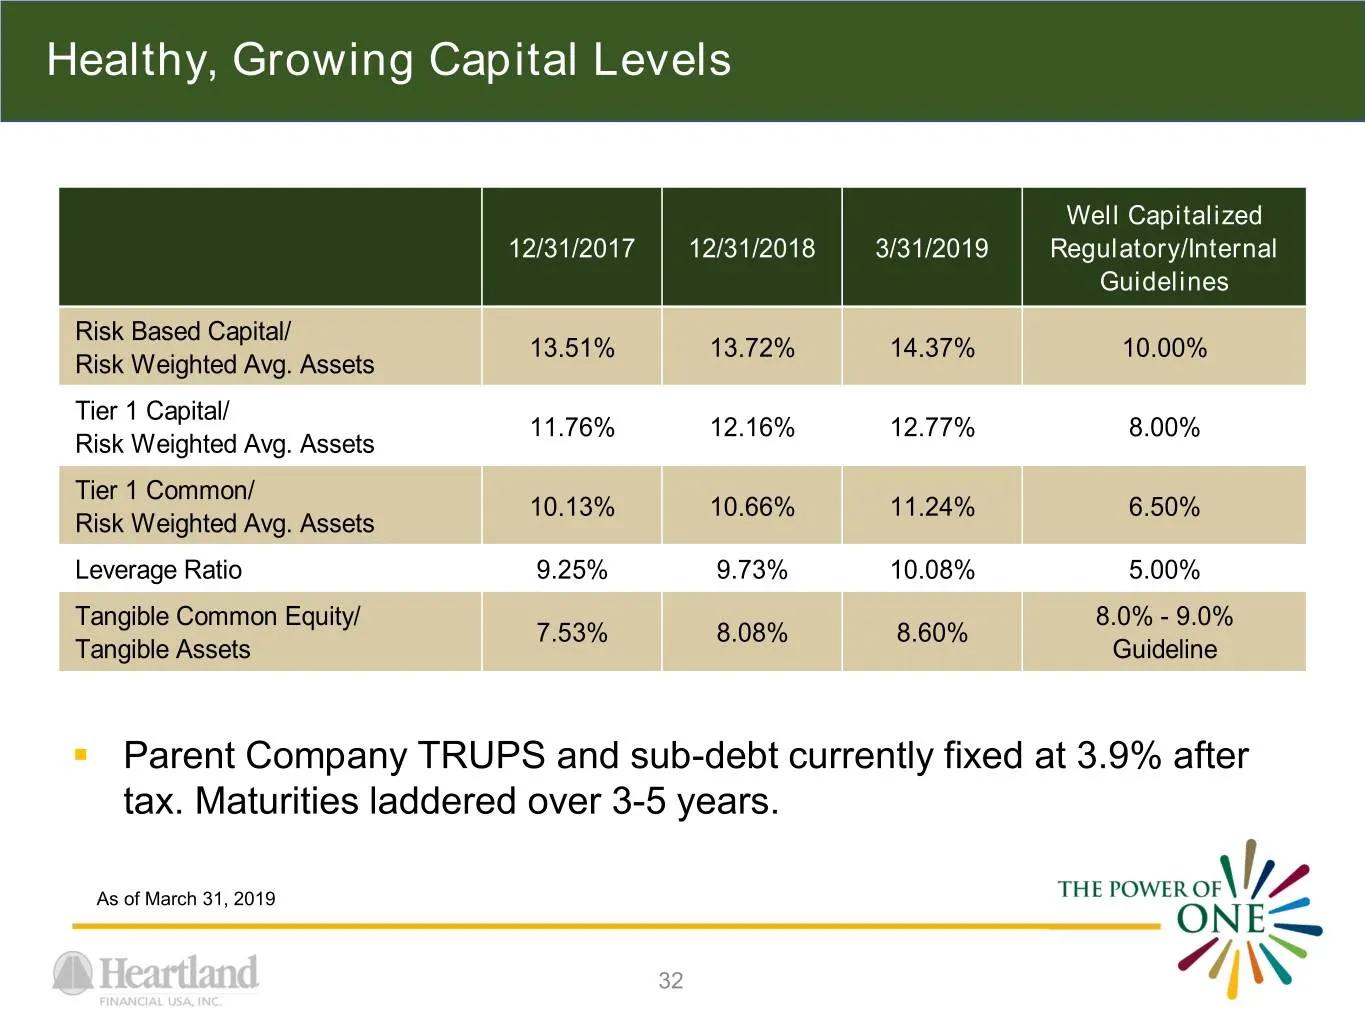
Slide 32: Healthy, Growing Capital Levels
Healthy, Growing Capital Levels Well Capitalized 12/31/2017 12/31/2018 3/31/2019 Regulatory/Internal Guidelines Risk Based Capital/ 13.51% 13.72% 14.37% 10.00% Risk Weighted Avg. Assets Tier 1 Capital/ 11.76% 12.16% 12.77% 8.00% Risk Weighted Avg. Assets Tier 1 Common/ 10.13% 10.66% 11.24% 6.50% Ris
Slide 33: Net Interest Margin
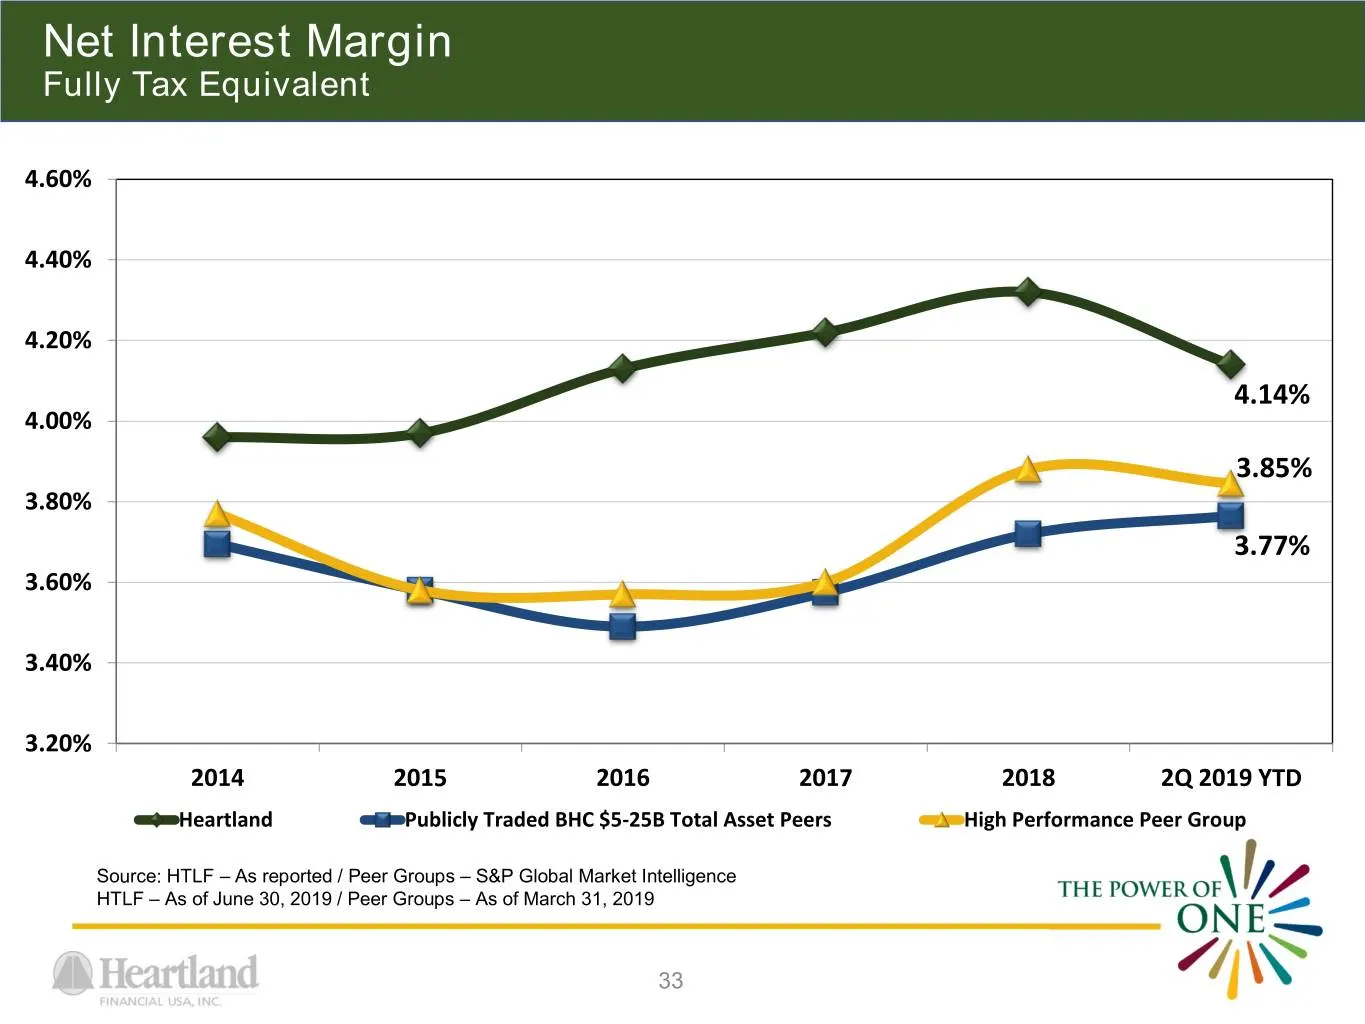
Net Interest Margin Fully Tax Equivalent 4.60% 4.40% 4.20% 4.14% 4.00% 3.85% 3.80% 3.77% 3.60% 3.40% 3.20% 2014 2015 2016 2017 2018 2Q 2019 YTD Heartland Publicly Traded BHC $5-25B Total Asset Peers High Performance Peer Group Source: HTLF – As reported / Peer Groups – S&P Global Market Intelligence
Slide 34: Net Interest Margin Breakdown
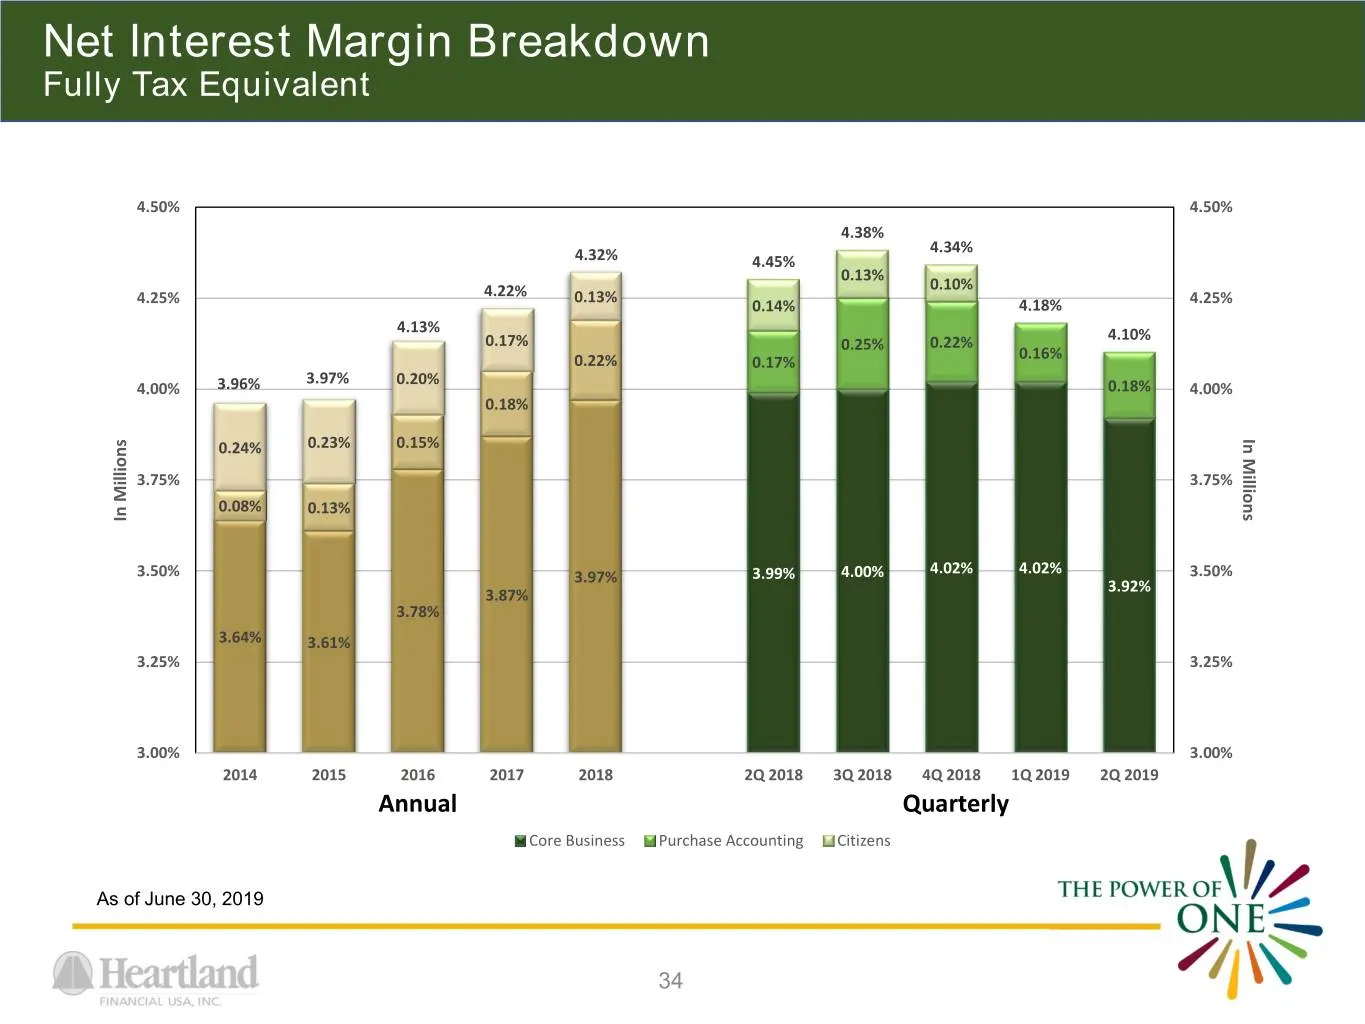
Net Interest Margin Breakdown Fully Tax Equivalent 4.50% 4.50% 4.38% 4.34% 4.32% 4.45% 0.13% 0.10% 4.22% 0.13% 4.25% 0.14% 4.18% 4.25% 4.13% 4.10% 0.17% 0.25% 0.22% 0.16% 0.22% 0.17% 3.97% 0.20% 4.00% 3.96% 0.18% 4.00% 0.18% In Millions In 0.24% 0.23% 0.15% 3.75% 3.75% 0.08% 0.13% InMillions 4.02% 4
Slide 35: Non-Performing Assets/Total Assets
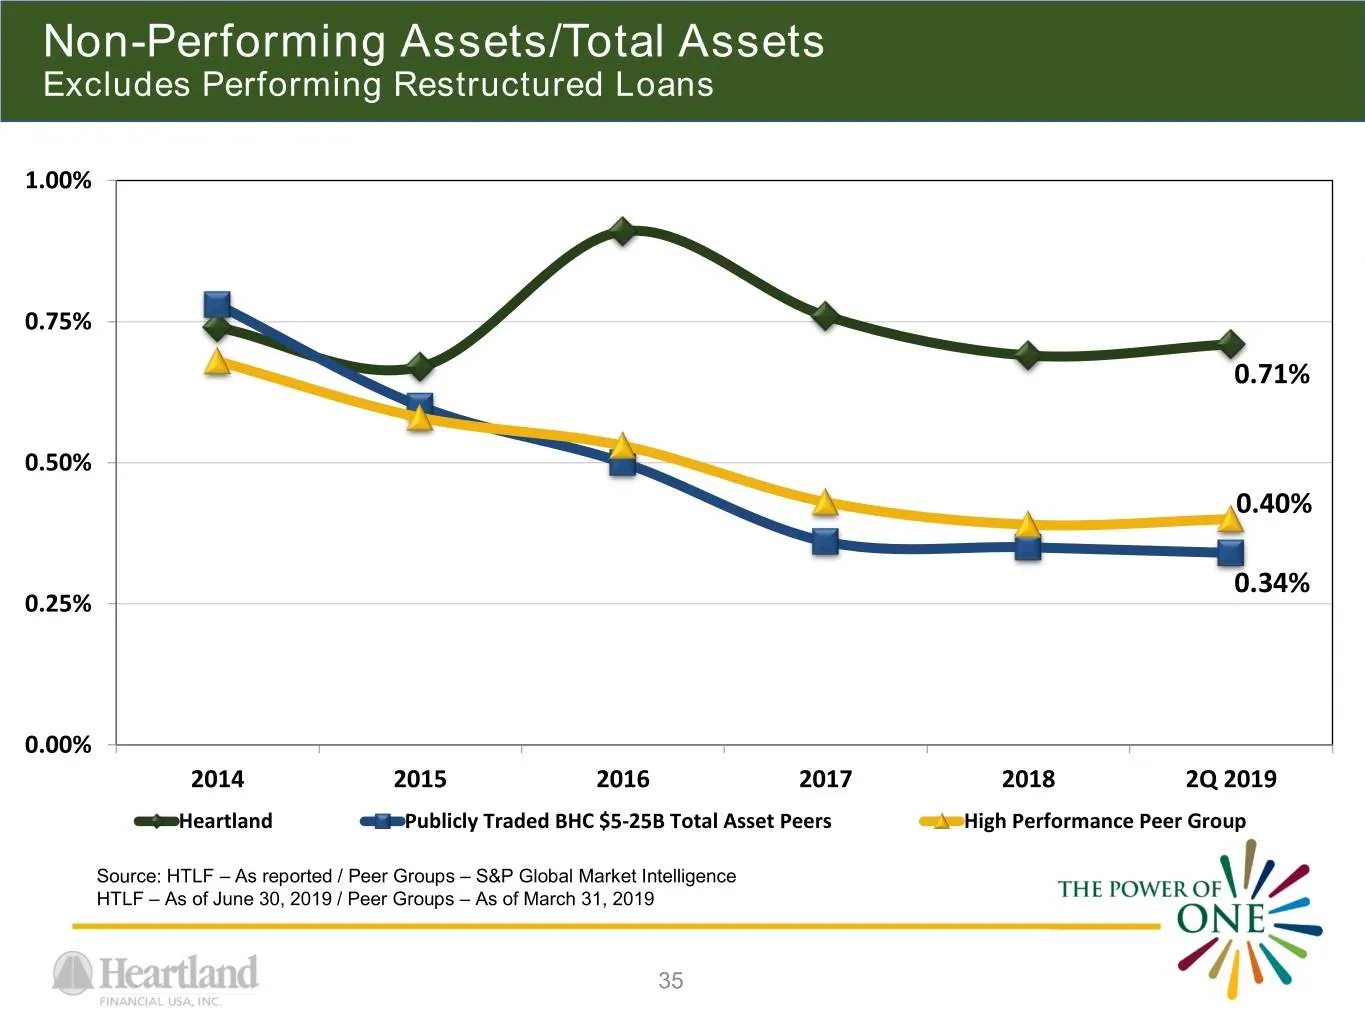
Non-Performing Assets/Total Assets Excludes Performing Restructured Loans 1.00% 0.75% 0.71% 0.50% 0.40% 0.34% 0.25% 0.00% 2014 2015 2016 2017 2018 2Q 2019 Heartland Publicly Traded BHC $5-25B Total Asset Peers High Performance Peer Group Source: HTLF – As reported / Peer Groups – S&P Global Market I
Slide 36: Credit Trends
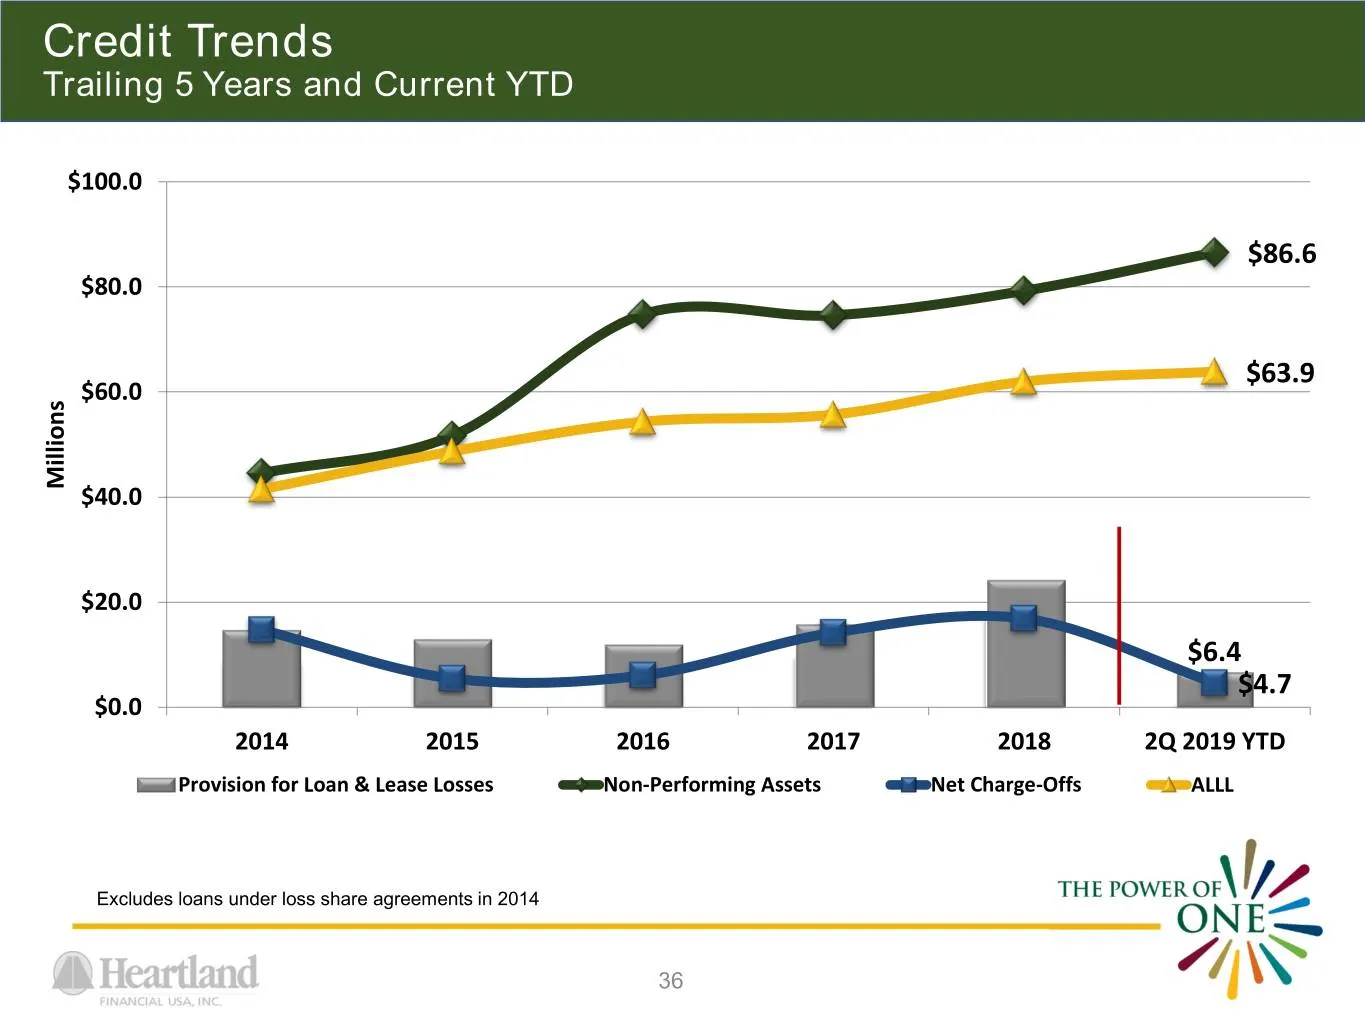
Credit Trends Trailing 5 Years and Current YTD $100.0 $86.6 $80.0 $63.9 $60.0 Millions $40.0 $20.0 $6.4 $4.7 $0.0 2014 2015 2016 2017 2018 2Q 2019 YTD Provision for Loan & Lease Losses Non-Performing Assets Net Charge-Offs ALLL Excludes loans under loss share agreements in 2014 36
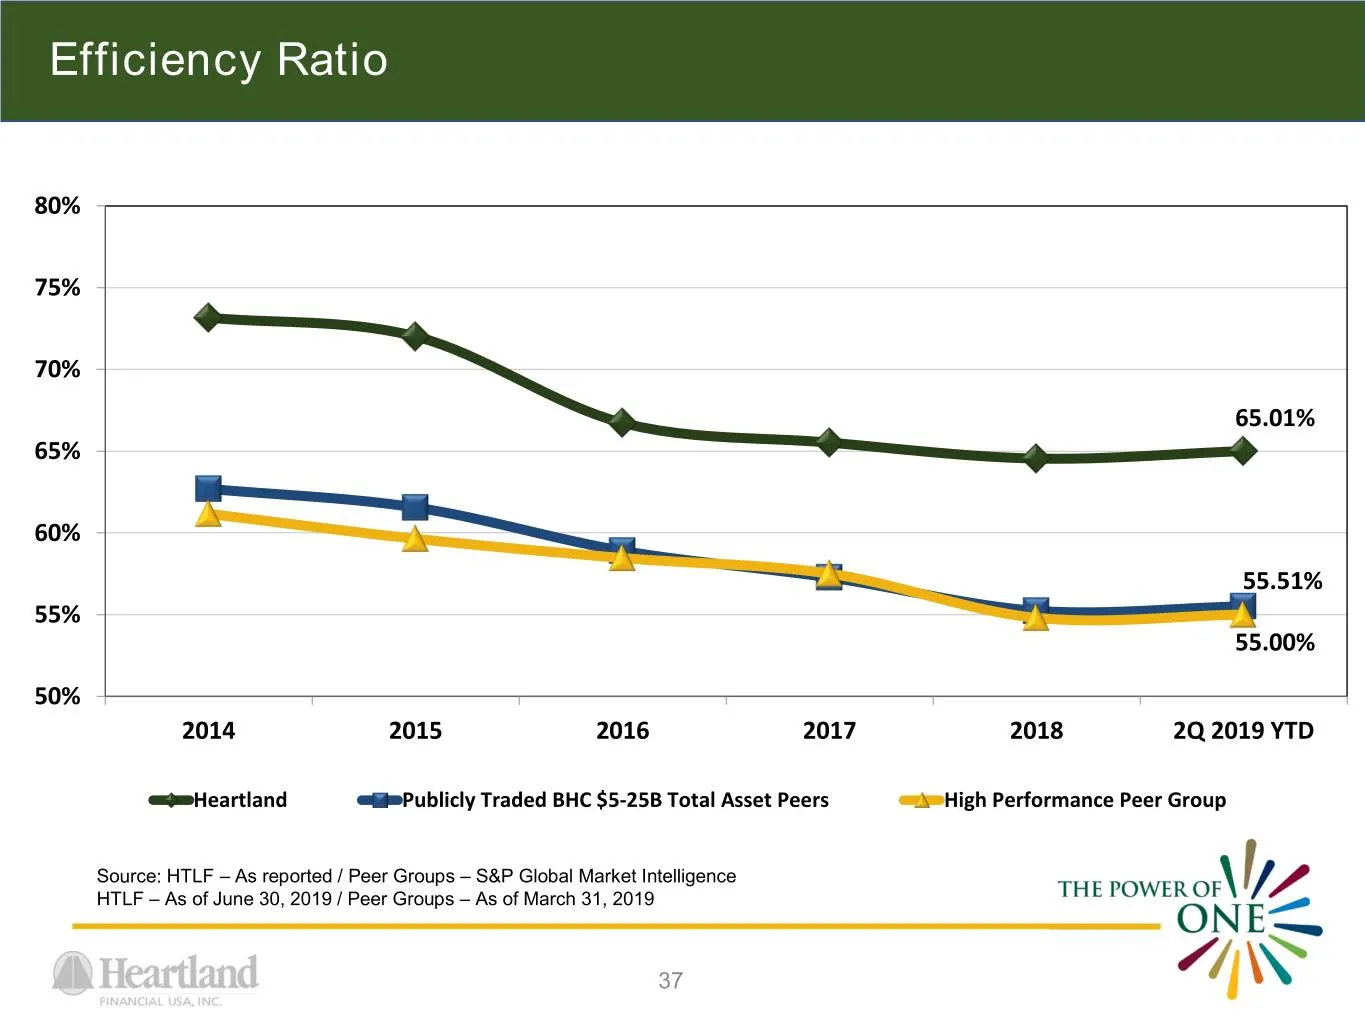
Slide 37: Efficiency Ratio
Efficiency Ratio 80% 75% 70% 65.01% 65% 60% 55.51% 55% 55.00% 50% 2014 2015 2016 2017 2018 2Q 2019 YTD Heartland Publicly Traded BHC $5-25B Total Asset Peers High Performance Peer Group Source: HTLF – As reported / Peer Groups – S&P Global Market Intelligence HTLF – As of June 30, 2019 / Peer Groups
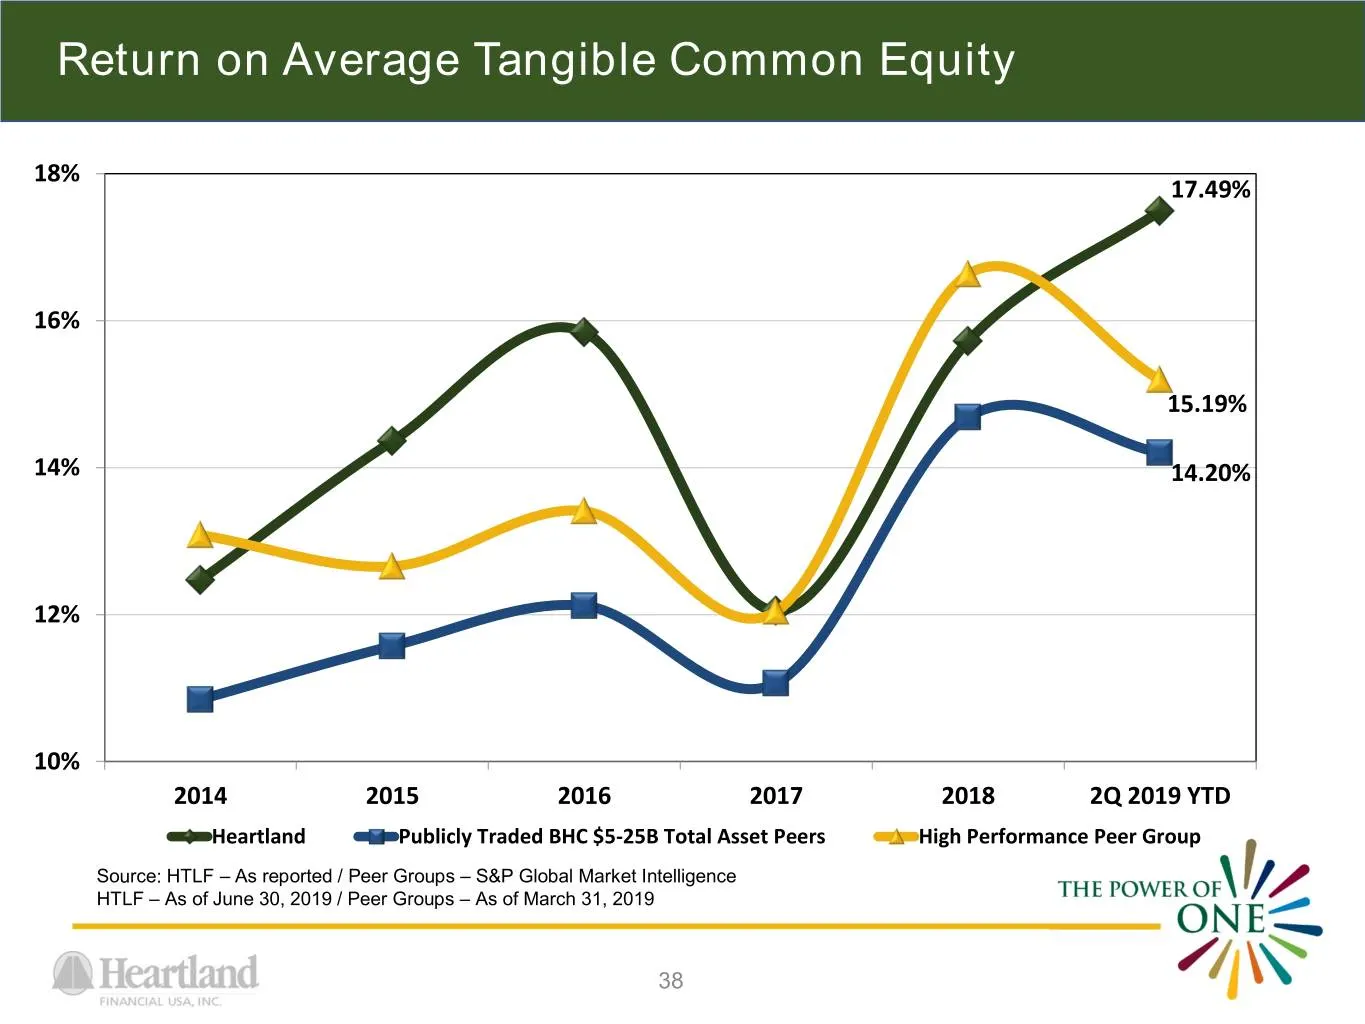
Slide 38: Return on Average Tangible Common Equity
Return on Average Tangible Common Equity 18% 17.49% 16% 15.19% 14% 14.20% 12% 10% 2014 2015 2016 2017 2018 2Q 2019 YTD Heartland Publicly Traded BHC $5-25B Total Asset Peers High Performance Peer Group Source: HTLF – As reported / Peer Groups – S&P Global Market Intelligence HTLF – As of June 30, 20
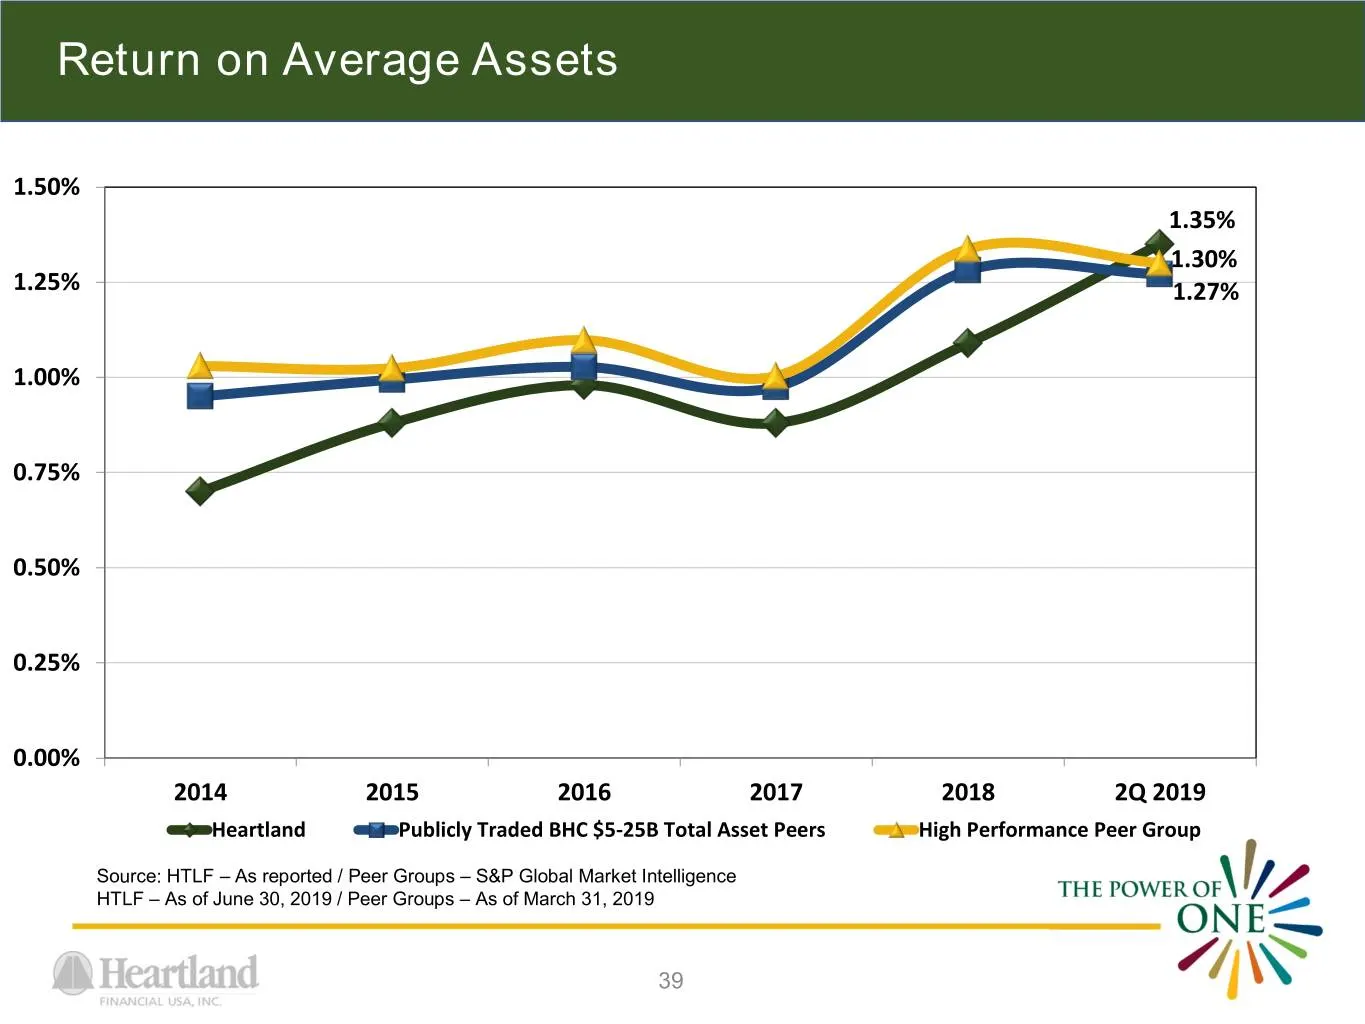
Slide 39: Return on Average Assets
Return on Average Assets 1.50% 1.35% 1.30% 1.25% 1.27% 1.00% 0.75% 0.50% 0.25% 0.00% 2014 2015 2016 2017 2018 2Q 2019 Heartland Publicly Traded BHC $5-25B Total Asset Peers High Performance Peer Group Source: HTLF – As reported / Peer Groups – S&P Global Market Intelligence HTLF – As of June 30, 201
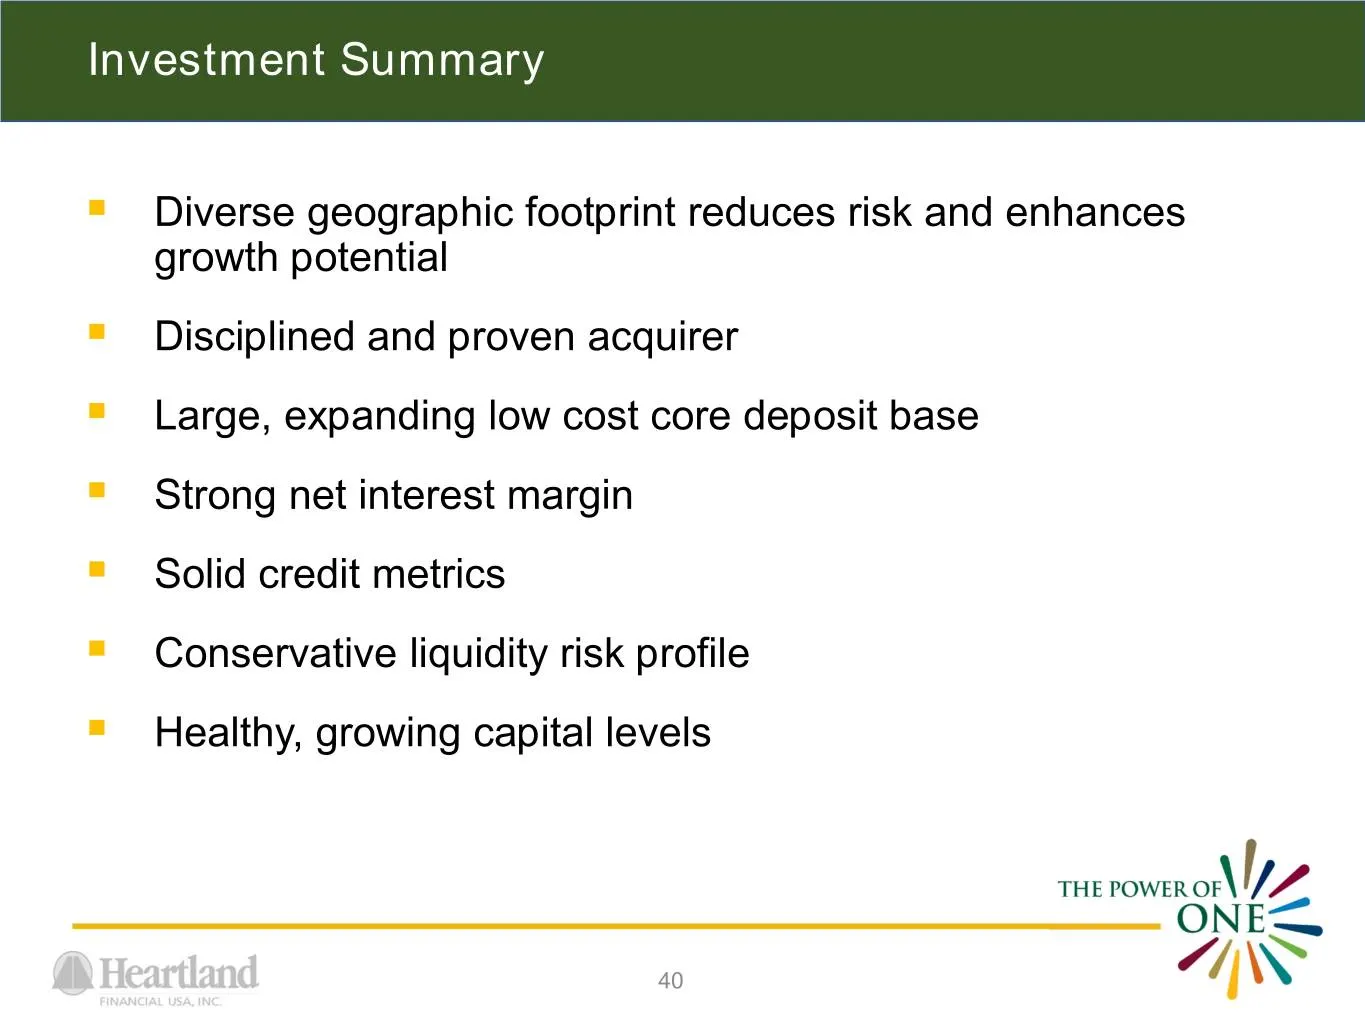
Slide 40: Investment Summary
Investment Summary . Diverse geographic footprint reduces risk and enhances growth potential . Disciplined and proven acquirer . Large, expanding low cost core deposit base . Strong net interest margin . Solid credit metrics . Conservative liquidity risk profile . Healthy, growing capital levels 40
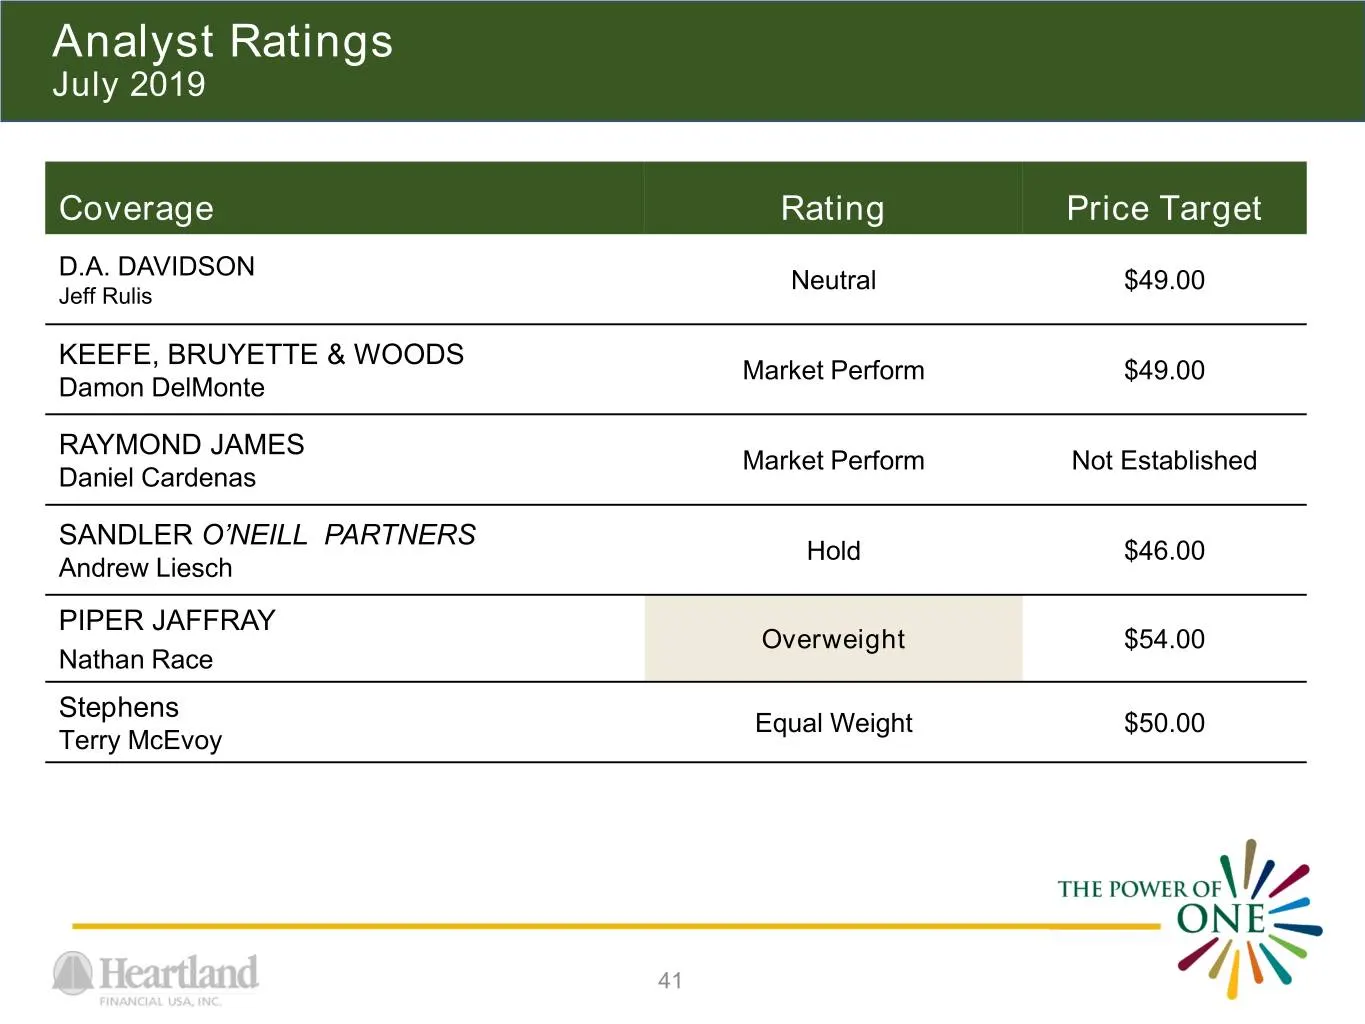
Slide 41: Analyst Ratings July 2019
Analyst Ratings July 2019 Coverage Rating Price Target D.A. DAVIDSON Neutral $49.00 Jeff Rulis KEEFE, BRUYETTE & WOODS Market Perform $49.00 Damon DelMonte RAYMOND JAMES Market Perform Not Established Daniel Cardenas SANDLER O’NEILL PARTNERS Hold $46.00 Andrew Liesch PIPER JAFFRAY Overweight $54.00
Slide 42: Contact Information
Contact Information LYNN B. FULLER BRUCE K. LEE Executive Operating Chairman President a Heartland a Heartland Chief Executive Officer P: 563.589.2105 FINANCIAL USA, INC. FINANCIAL USA, INC, F 563.589.2011 P: 563.587.4176 TOLL-FREE 888.739.2100 F: 563.589.1951 LFuller@htif.com TOLL-FREE 888.739.2100
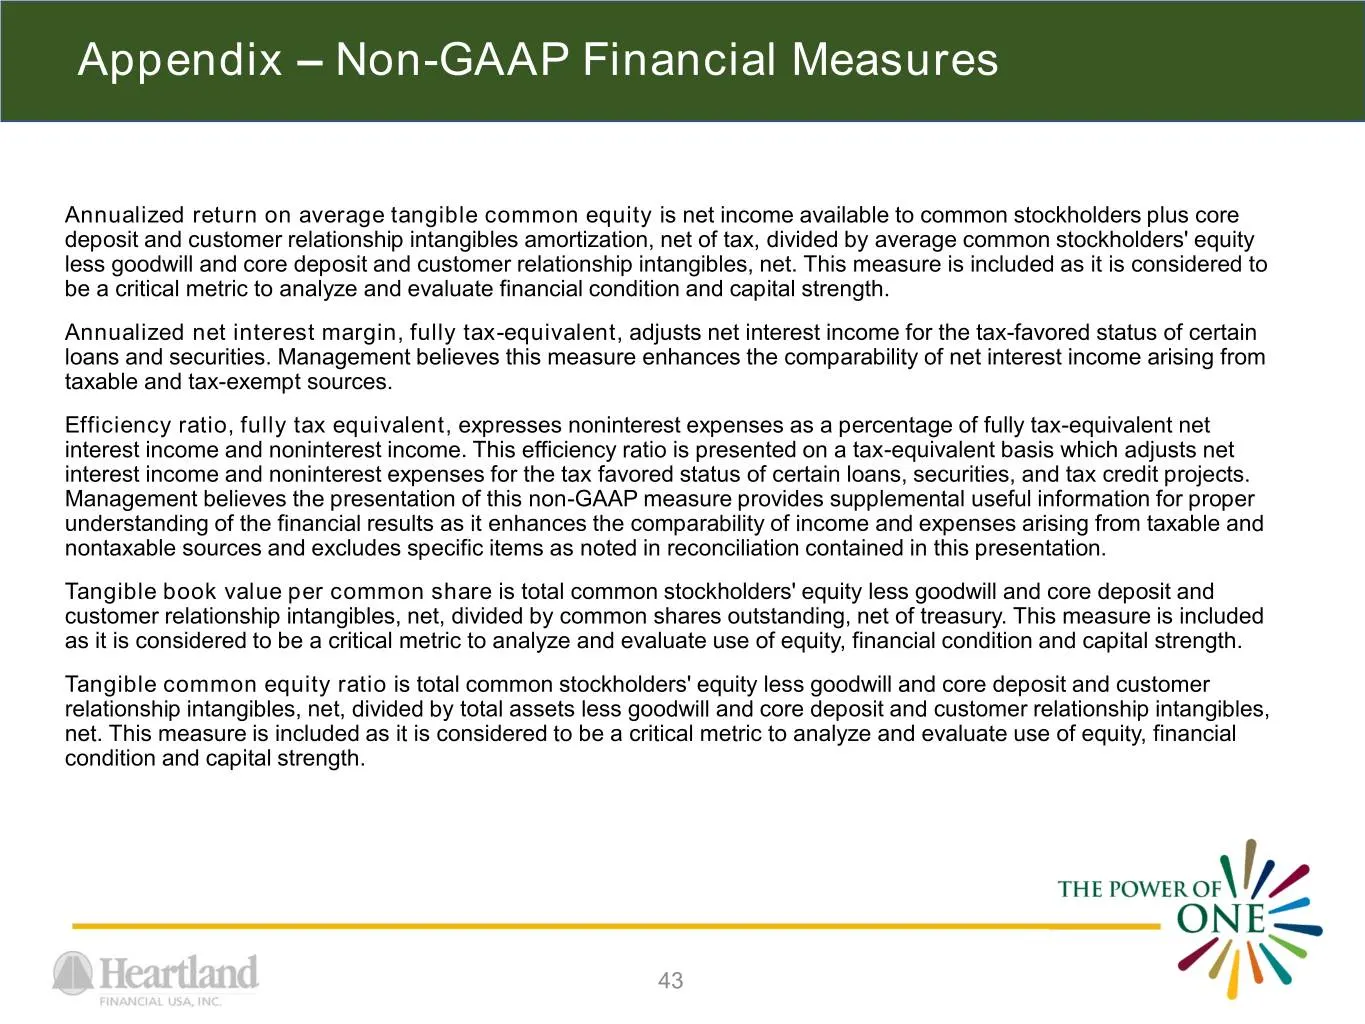
Slide 43: Appendix – Non-GAAP Financial Measures
Appendix – Non-GAAP Financial Measures Annualized return on average tangible common equity is net income available to common stockholders plus core deposit and customer relationship intangibles amortization, net of tax, divided by average common stockholders' equity less goodwill and core deposit an
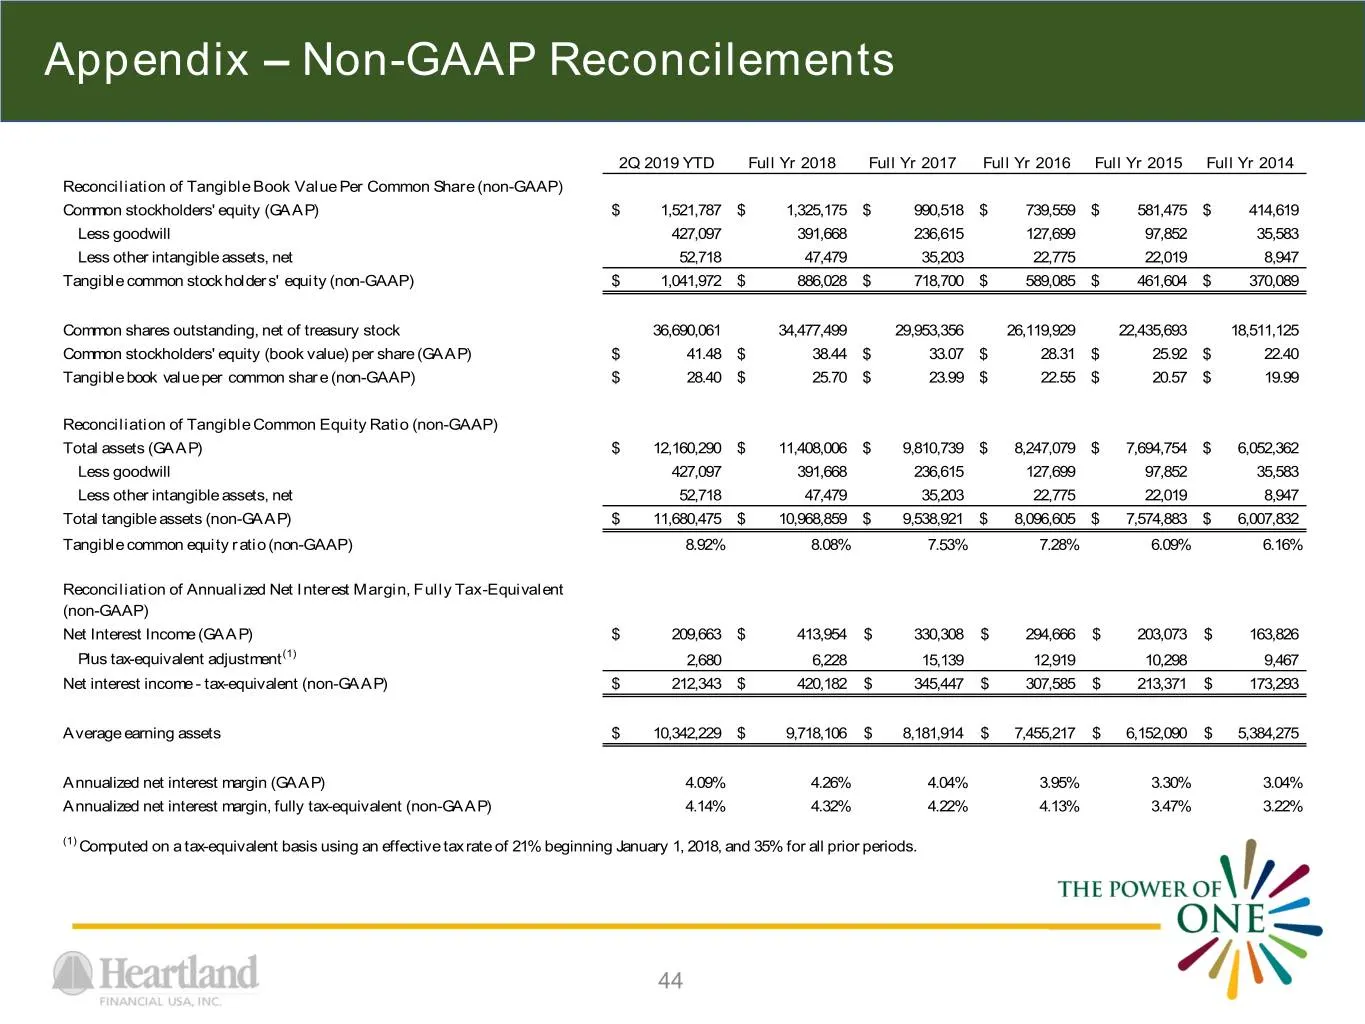
Slide 44: Appendix – Non-GAAP Reconcilements
Appendix – Non-GAAP Reconcilements 2Q 2019 YTD Full Yr 2018 Full Yr 2017 Full Yr 2016 Full Yr 2015 Full Yr 2014 Reconciliation of Tangible Book Value Per Common Share (non-GAAP) Common stockholders' equity (GAAP) $ 1,521,787 $ 1,325,175 $ 990,518 $ 739,559 $ 581,475 $ 414,619 Less goodwill 427,097 3
Slide 45: Appendix – Non-GAAP Reconcilements
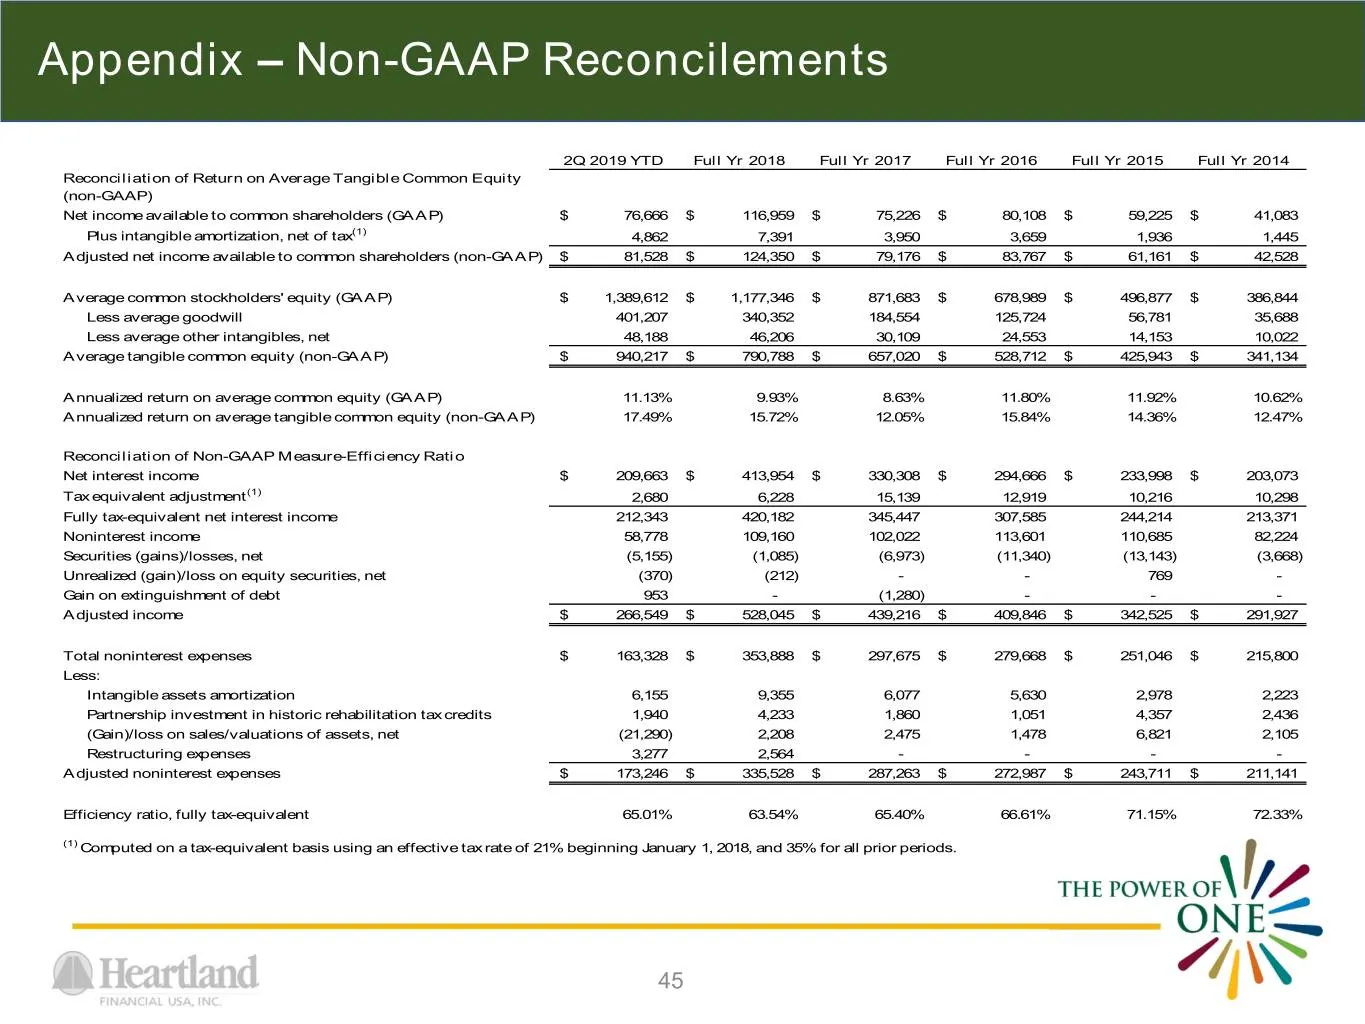
Appendix – Non-GAAP Reconcilements 2Q 2019 YTD Full Yr 2018 Full Yr 2017 Full Yr 2016 Full Yr 2015 Full Yr 2014 Reconciliation of Return on Average Tangible Common Equity (non-GAAP) Net income available to common shareholders (GAAP) $ 76,666 $ 116,959 $ 75,226 $ 80,108 $ 59,225 $ 41,083 Plus intangi
Source: SEC EDGAR · 8-K filed Jul 30, 2019
More decks from Heartland Financial USA Inc
 Merger or Acquisition (July 2024)6 slides · Jul 31, 2024
 Merger or Acquisition (May 2024)6 slides · May 2, 2024
 Merger or Acquisition (May 2024)27 slides · May 2, 2024
 Q4 2023 Earnings Presentation54 slides · Feb 13, 2024
 Q4 2023 Earnings Presentation35 slides · Jan 29, 2024
 Q3 2023 Earnings Presentation55 slides · Nov 15, 2023