Aryzta AG · SIX:ARYN
Aryzta — FY2020 Earnings Presentation
36 slides from Aryzta's earnings presentation, Oct 6, 2020
Slide 1: ARYZTA AG – FY 2020 Results
ARYZTA AG – FY 2020 Results 06 October 2020
Slide 2: Forward Looking Statement
Forward Looking Statement This document contains forward looking statements which reflect the Board of Directors’ current views and estimates. The forward looking statements involve certain risks and uncertainties that could cause actual results to differ materially from those contained in the forwa
Slide 3: FY 2020 Results Materially Impacted by COVID-19; Strong Mitigating Actions Resulted in Solid Liquidity Position
FY 2020 Results Materially Impacted by COVID-19; Strong Mitigating Actions Resulted in Solid Liquidity Position –– Group organic revenue declined by (11.6)%, reflecting impact of COVID-19 in H2 –– Before COVID-19 crisis, five out of six strategic indicators were on track: »» Portfolio refocus into f
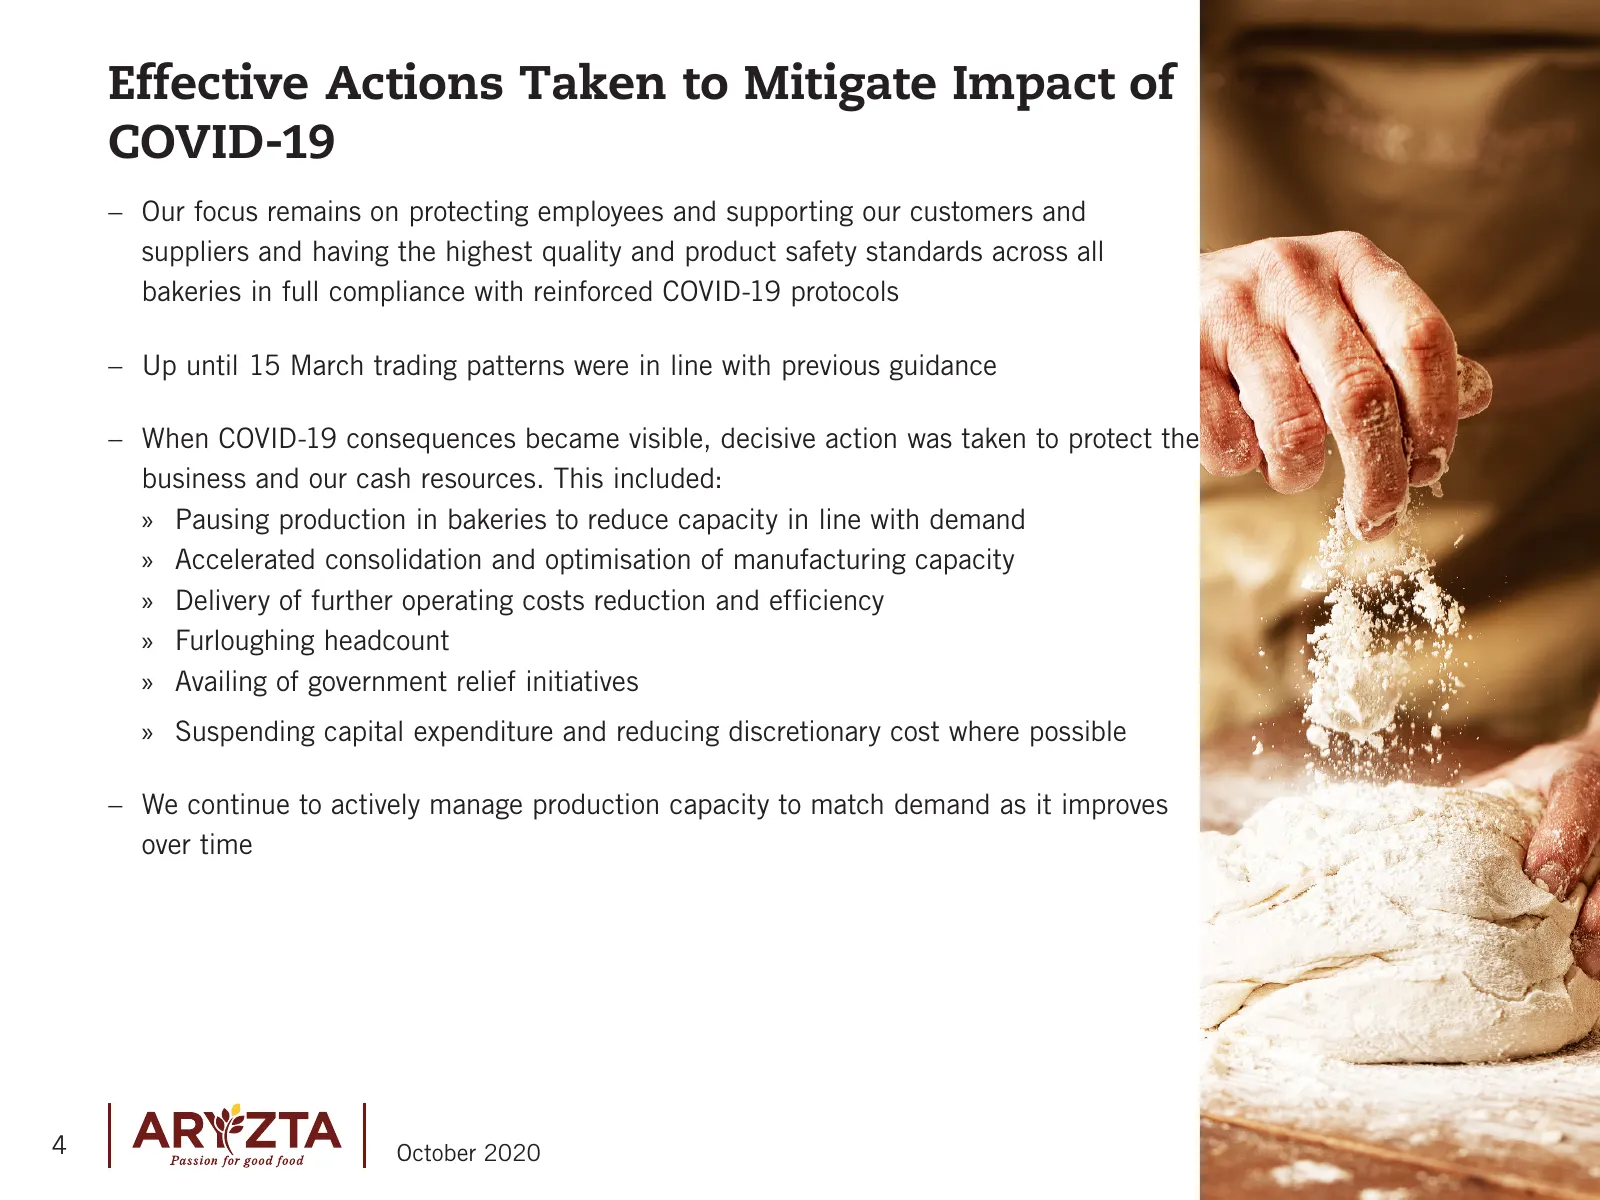
Slide 4: Effective Actions Taken to Mitigate Impact of COVID-19
Effective Actions Taken to Mitigate Impact of COVID-19 –– Our focus remains on protecting employees and supporting our customers and suppliers and having the highest quality and product safety standards across all bakeries in full compliance with reinforced COVID-19 protocols –– Up until 15 March tr
Slide 5: COVID-19 Impact by Channel and Region
COVID-19 Impact by Channel and Region –– Europe »» Retail channel continued to operate but revenue has been impacted by social distancing regulations, labour constraints and the change of consumer behaviour to more packaged goods and home-baking. »» QSR was negatively impacted by reduced footfall bu

Slide 6: Financial Review
Financial Review 6 October 2020
Slide 7: FY 2020 Financial Summary
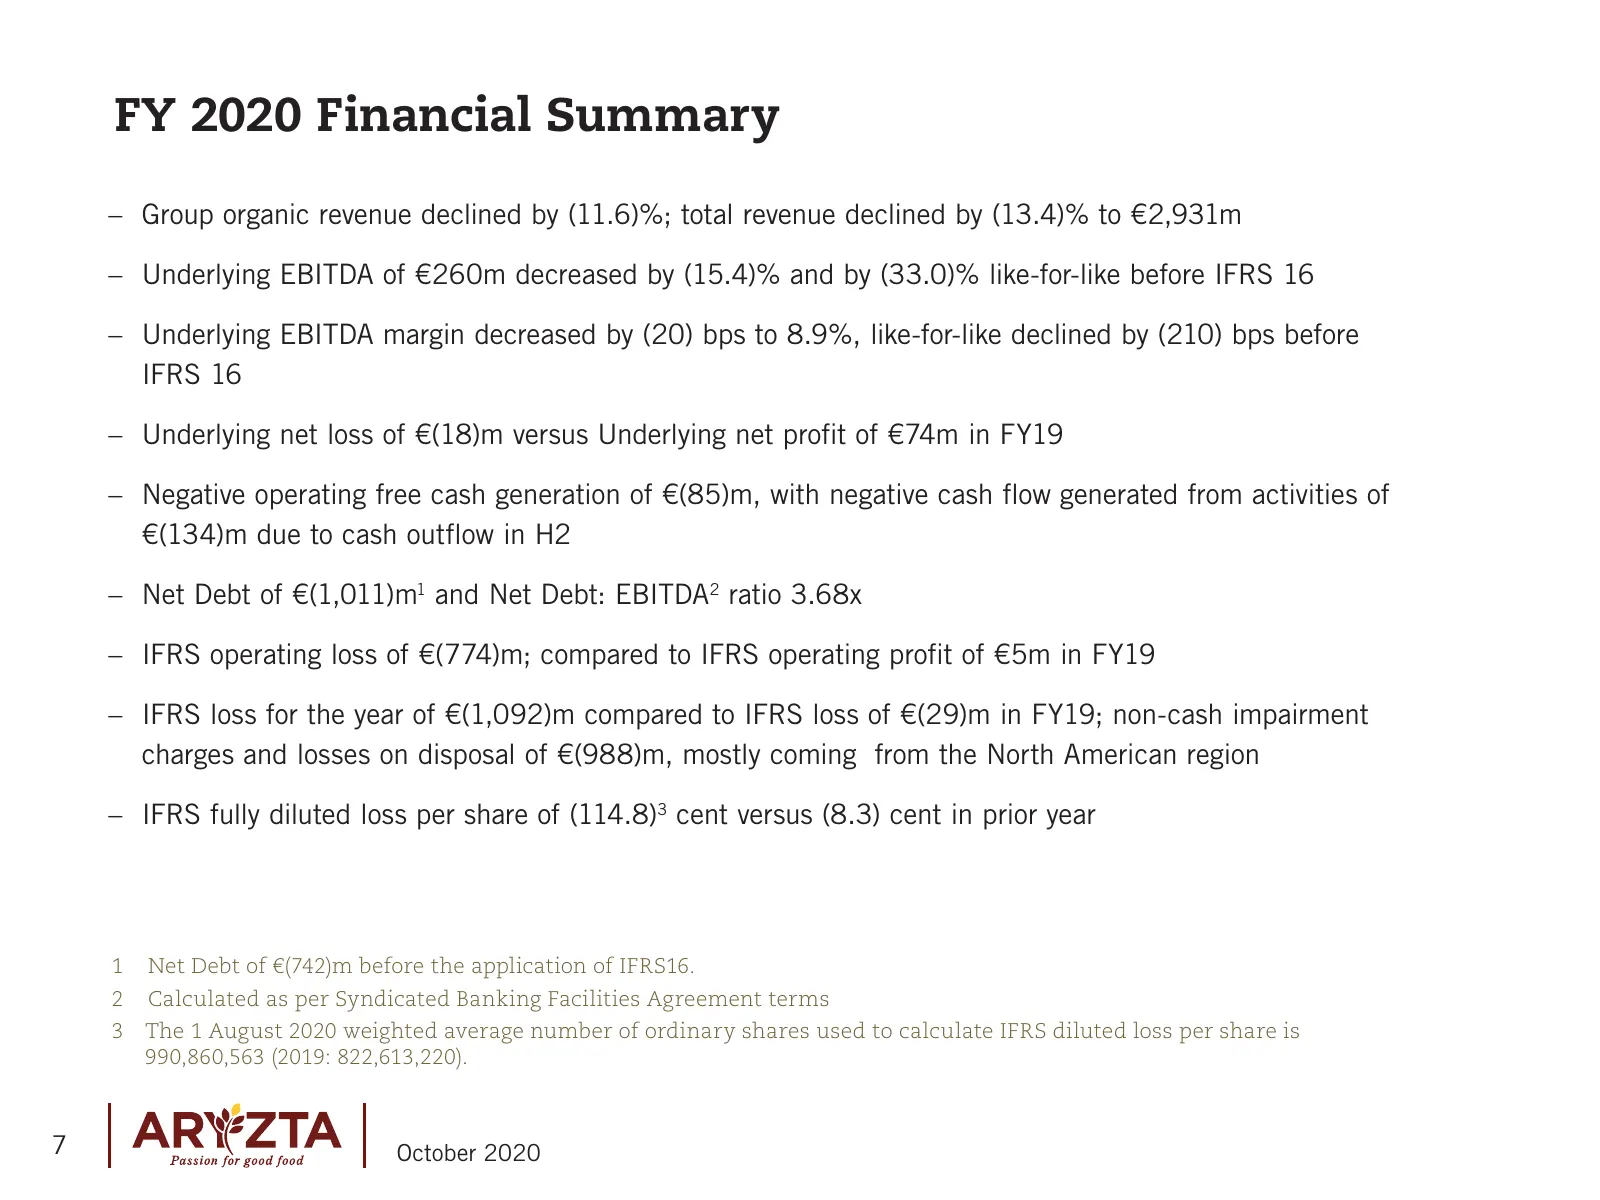
FY 2020 Financial Summary –– Group organic revenue declined by (11.6)%; total revenue declined by (13.4)% to €2,931m –– Underlying EBITDA of €260m decreased by (15.4)% and by (33.0)% like-for-like before IFRS 16 –– Underlying EBITDA margin decreased by (20) bps to 8.9%, like-for-like declined by (21
Slide 8: ARYZTA Group Underlying Income Statement
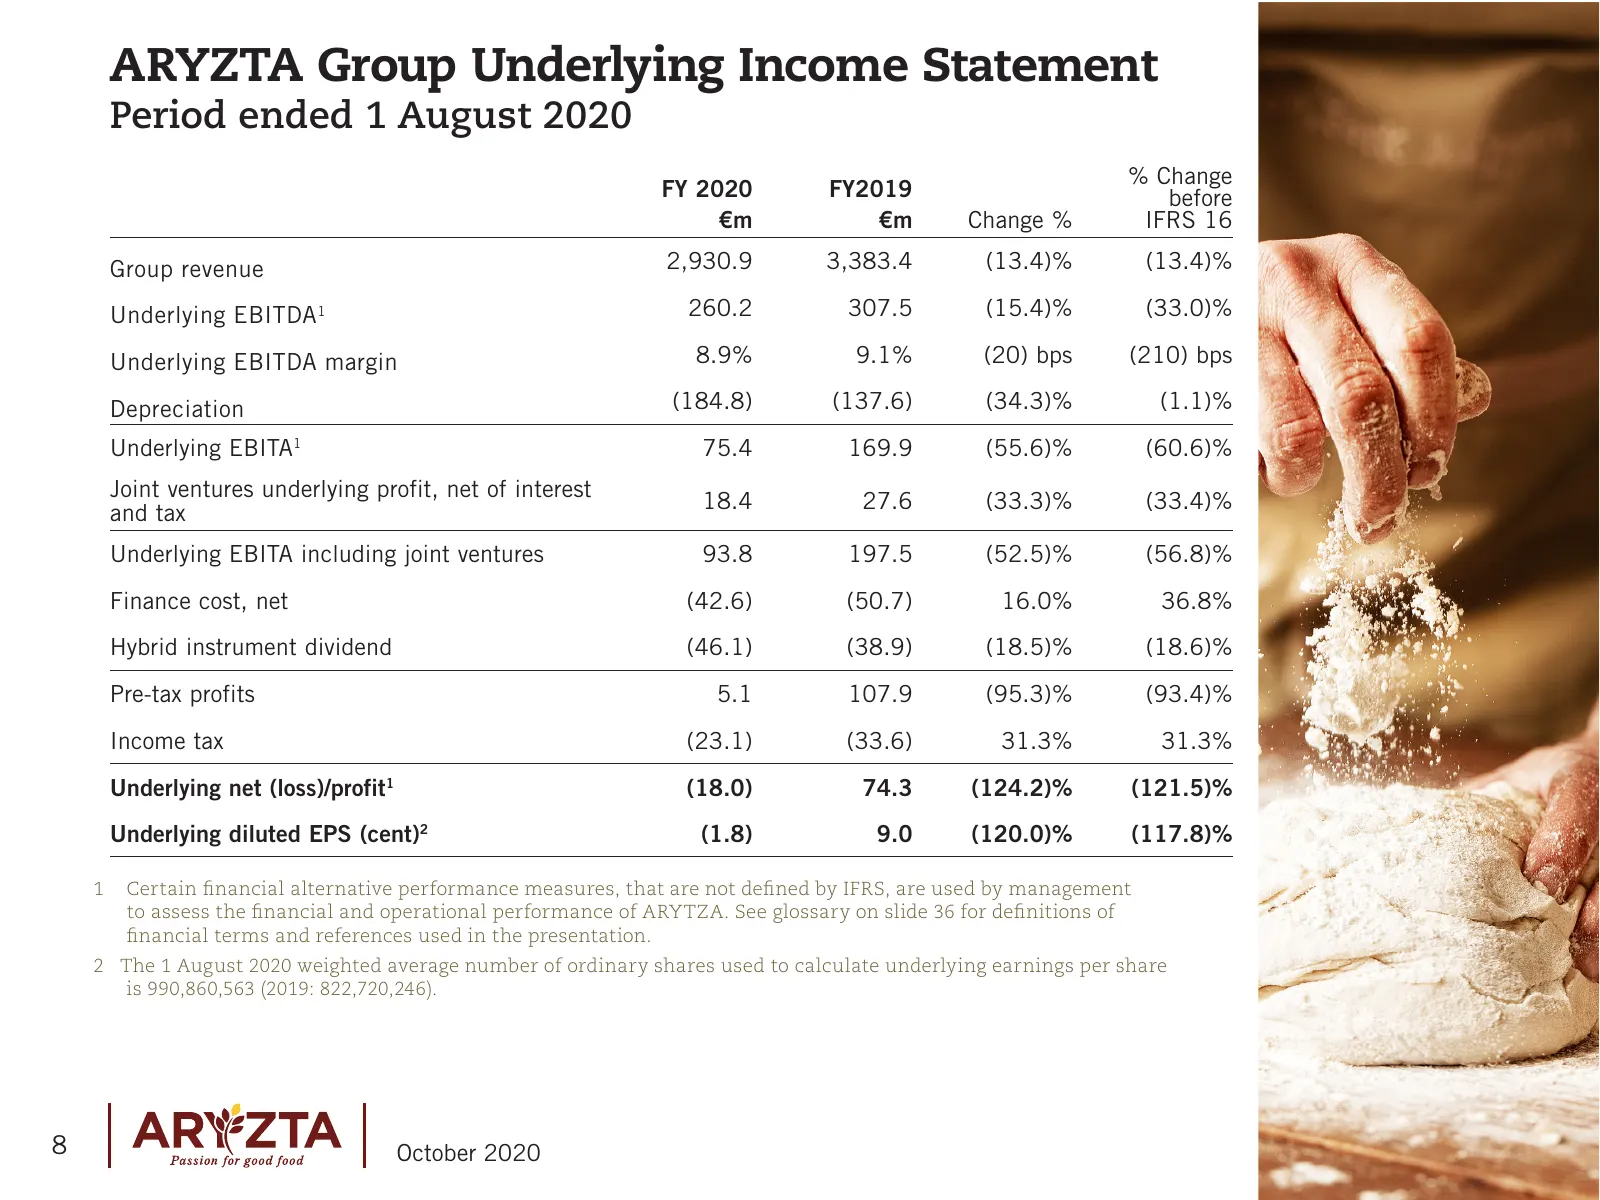
ARYZTA Group Underlying Income Statement Period ended 1 August 2020 % Change FY 2020 FY2019 before €m €m Change % IFRS 16 Group revenue 2,930.9 3,383.4 (13.4)% (13.4)% Underlying EBITDA1 260.2 307.5 (15.4)% (33.0)% Underlying EBITDA margin 8.9% 9.1% (20) bps (210) bps Depreciation (184.8) (137.6) (3
Slide 9: Underlying Income Statement Reconciliation to IFRS
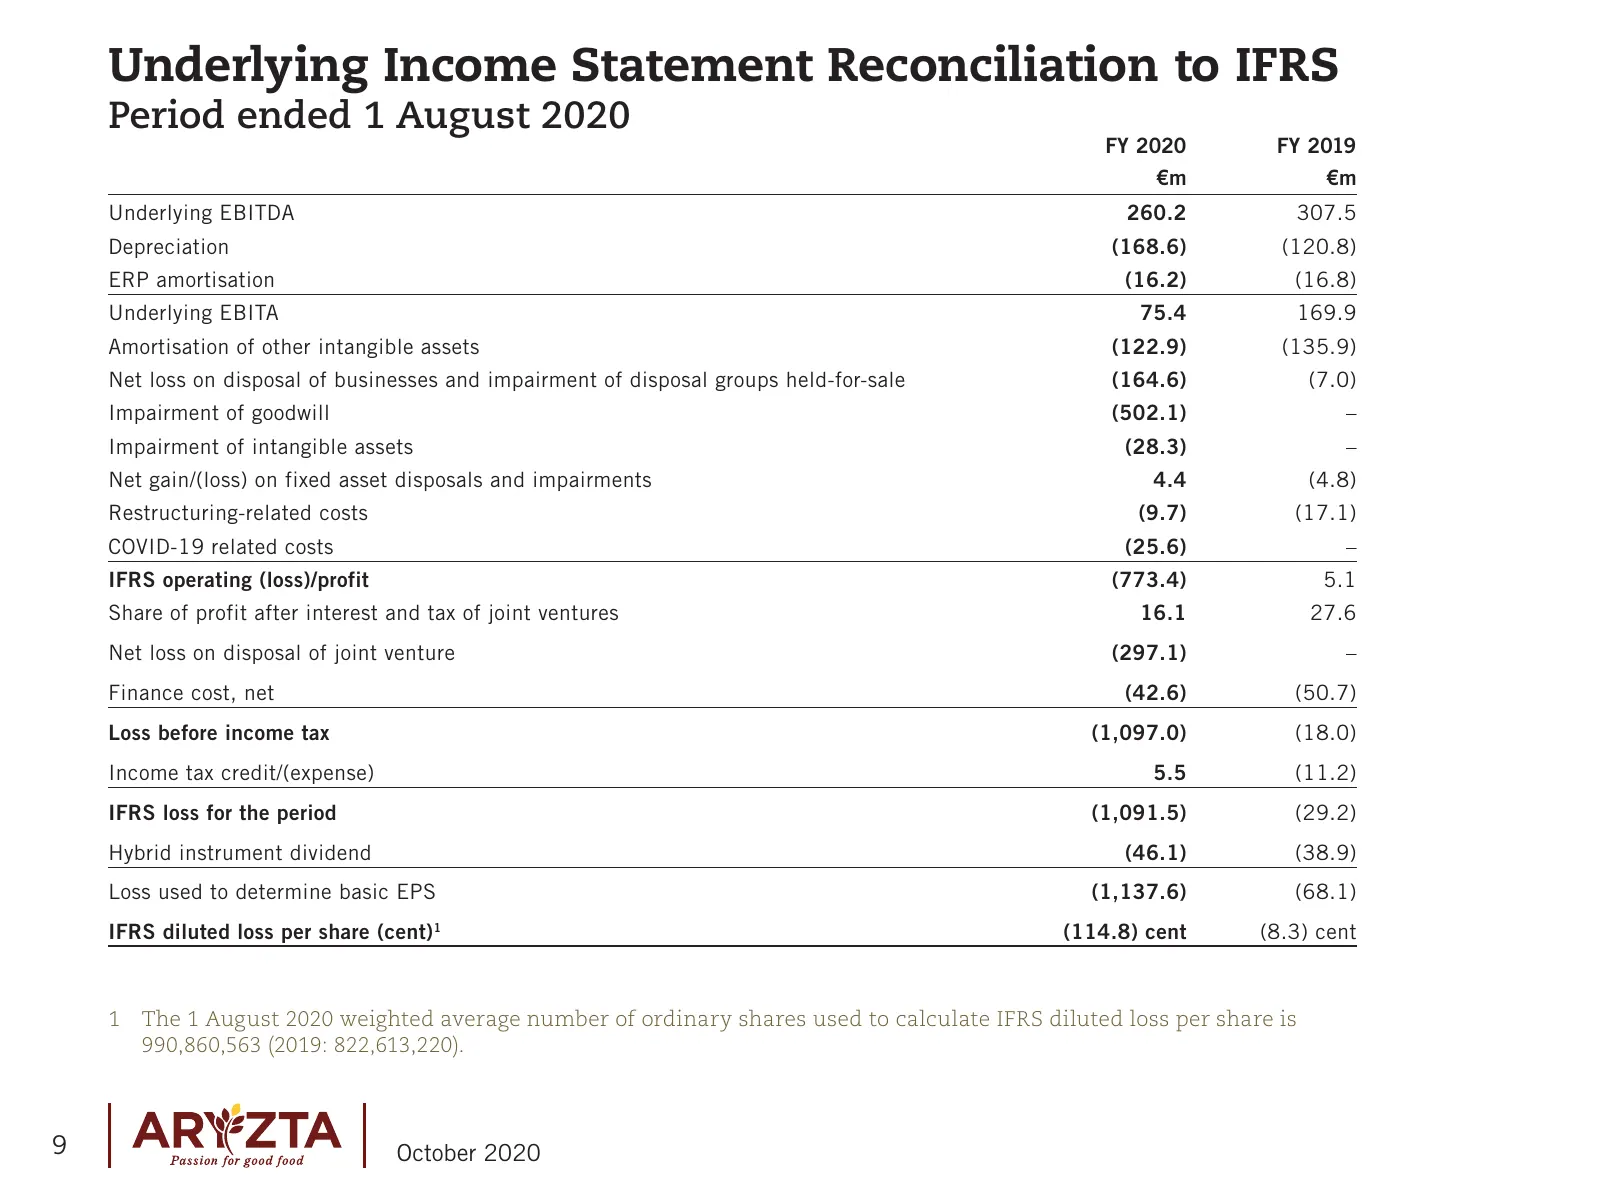
Underlying Income Statement Reconciliation to IFRS Period ended 1 August 2020 FY 2020 FY 2019 €m €m Underlying EBITDA 260.2 307.5 Depreciation (168.6) (120.8) ERP amortisation (16.2) (16.8) Underlying EBITA 75.4 169.9 Amortisation of other intangible assets (122.9) (135.9) Net loss on disposal of bu
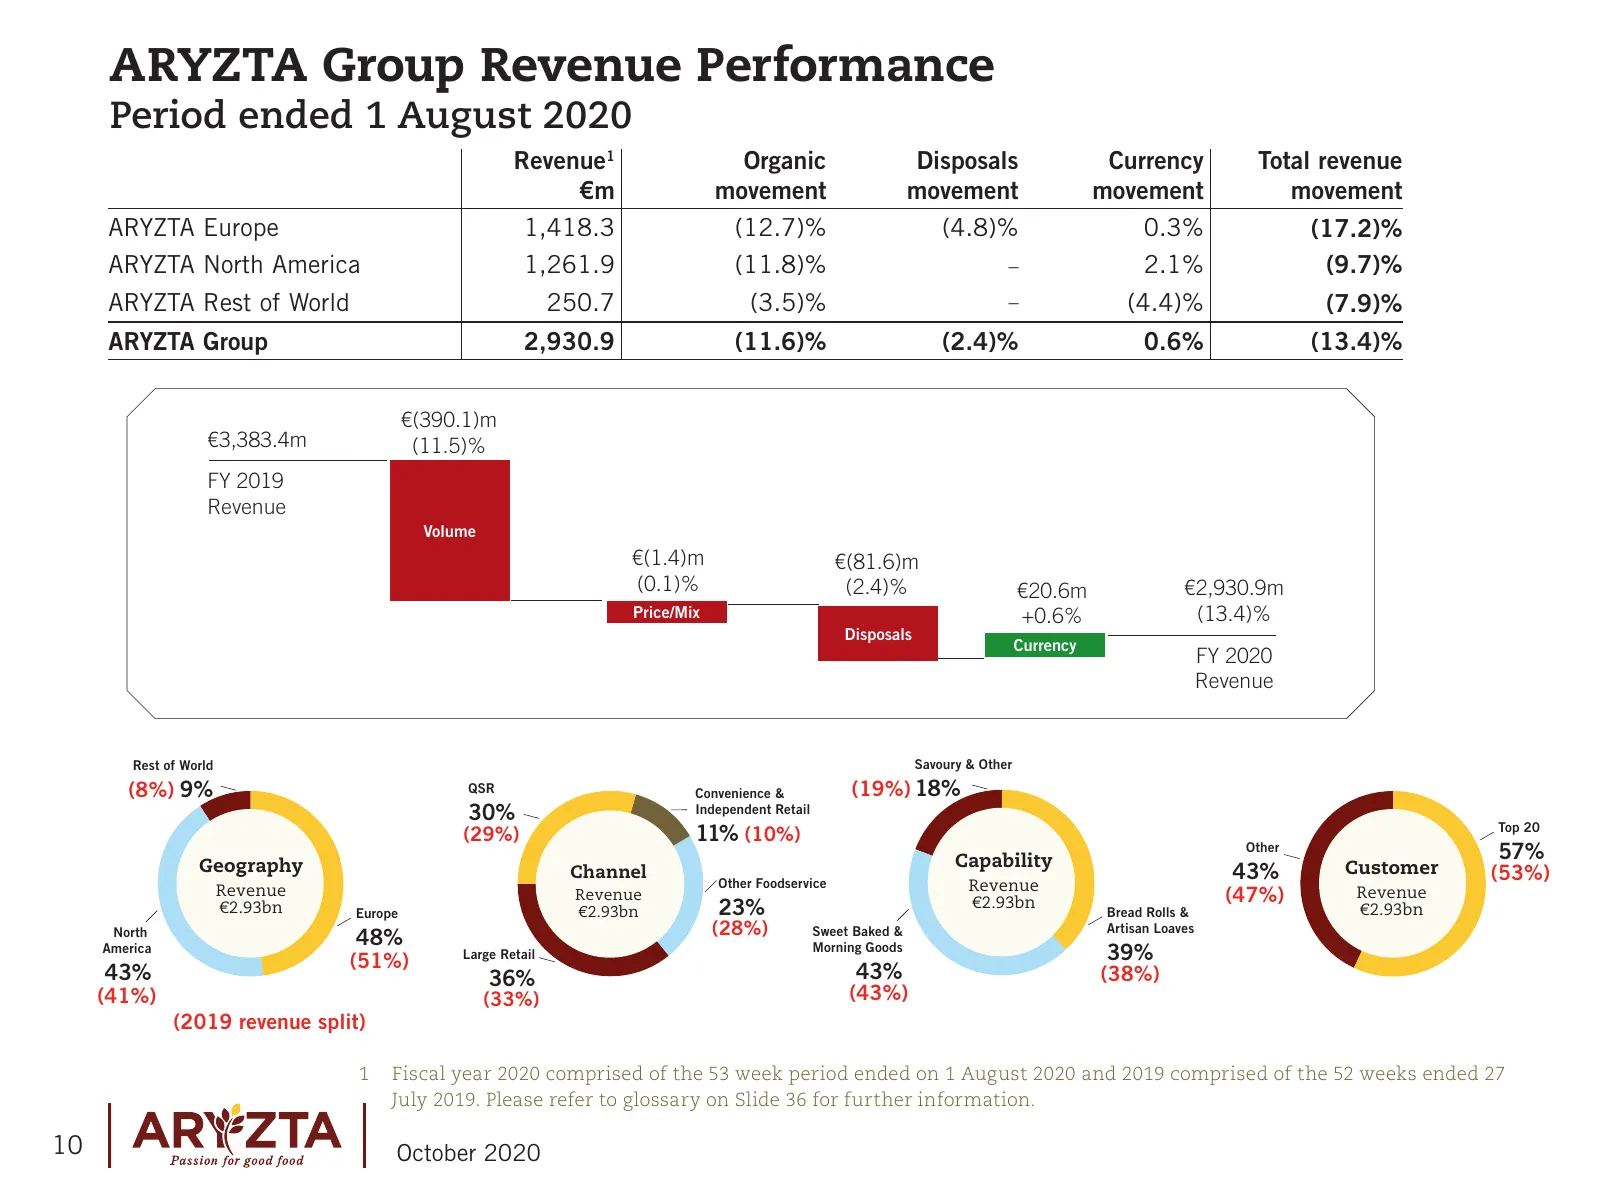
Slide 10: ARYZTA Group Revenue Performance
ARYZTA Group Revenue Performance Period ended 1 August 2020 Revenue1 Organic Disposals Currency Total revenue €m movement movement movement movement ARYZTA Europe 1,418.3 (12.7)% (4.8)% 0.3% (17.2)% ARYZTA North America 1,261.9 (11.8)% – 2.1% (9.7)% ARYZTA Rest of World 250.7 (3.5)% – (4.4)% (7.9)%
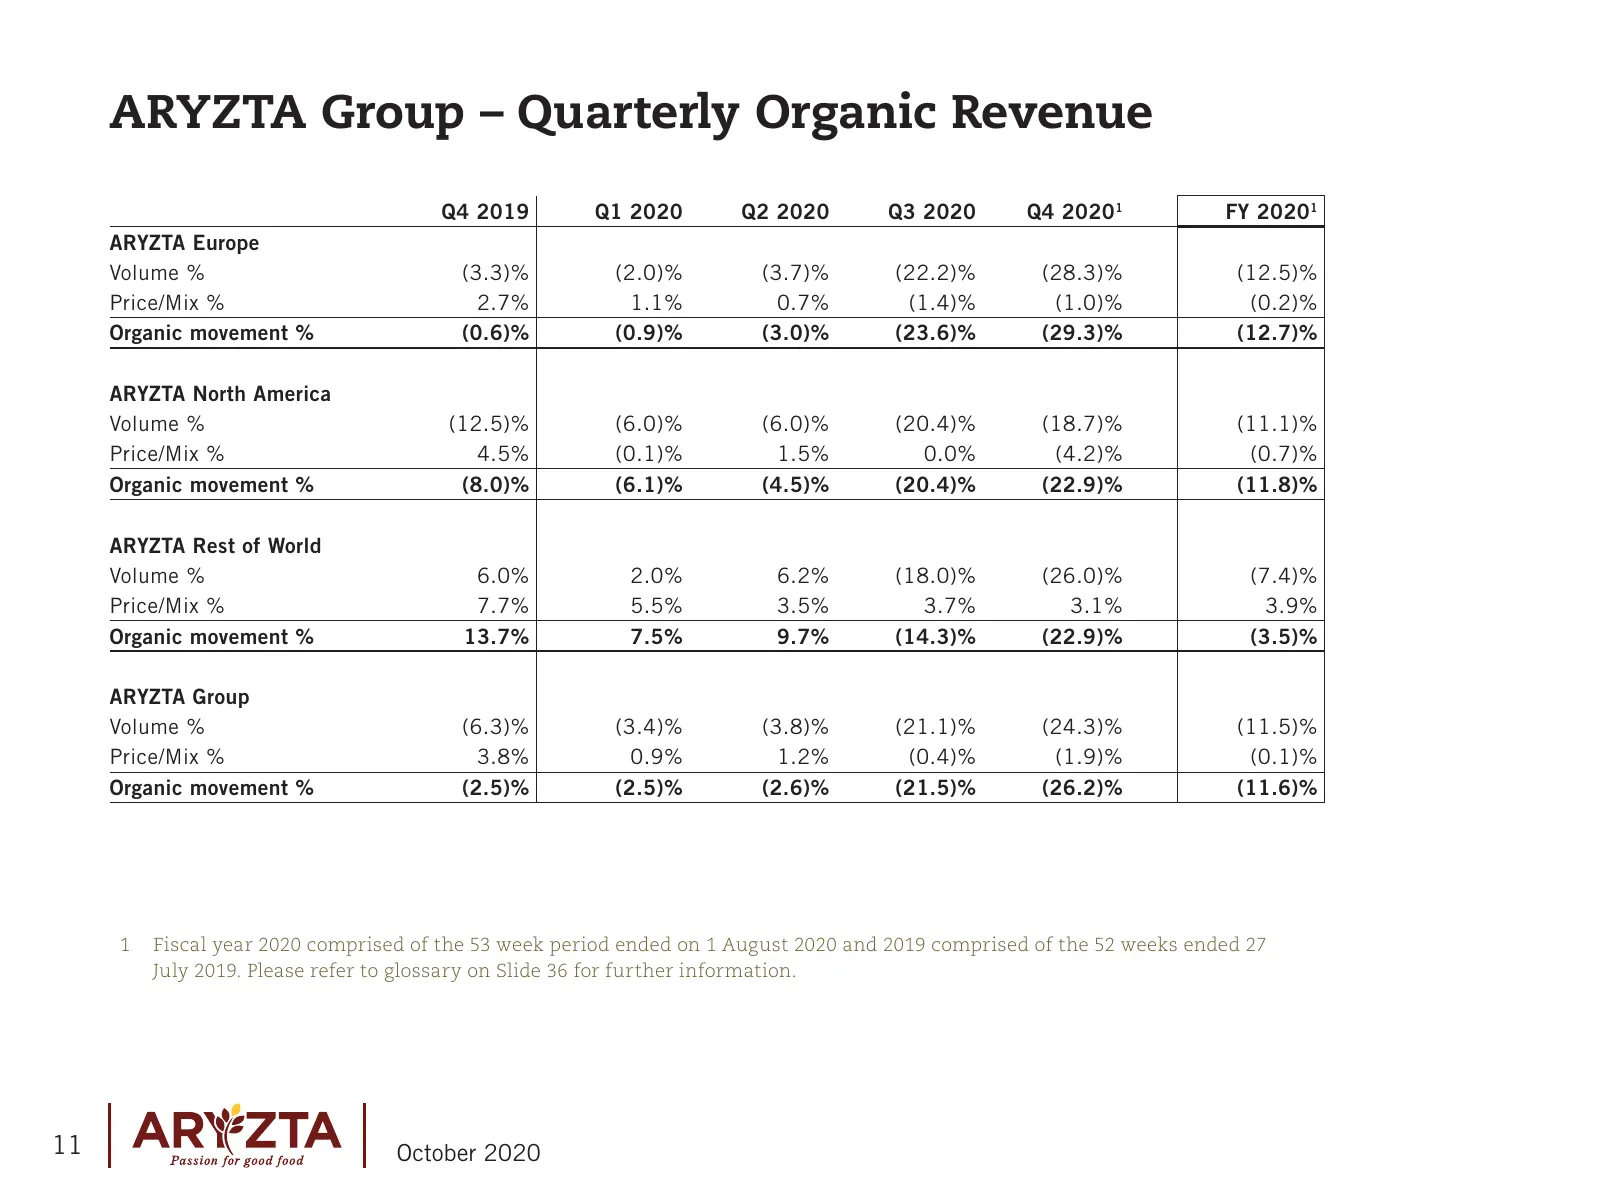
Slide 11: ARYZTA Group – Quarterly Organic Revenue
ARYZTA Group – Quarterly Organic Revenue Q4 2019 Q1 2020 Q2 2020 Q3 2020 Q4 20201 FY 20201 ARYZTA Europe Volume % (3.3)% (2.0)% (3.7)% (22.2)% (28.3)% (12.5)% Price/Mix % 2.7% 1.1% 0.7% (1.4)% (1.0)% (0.2)% Organic movement % (0.6)% (0.9)% (3.0)% (23.6)% (29.3)% (12.7)% ARYZTA North America Volume %
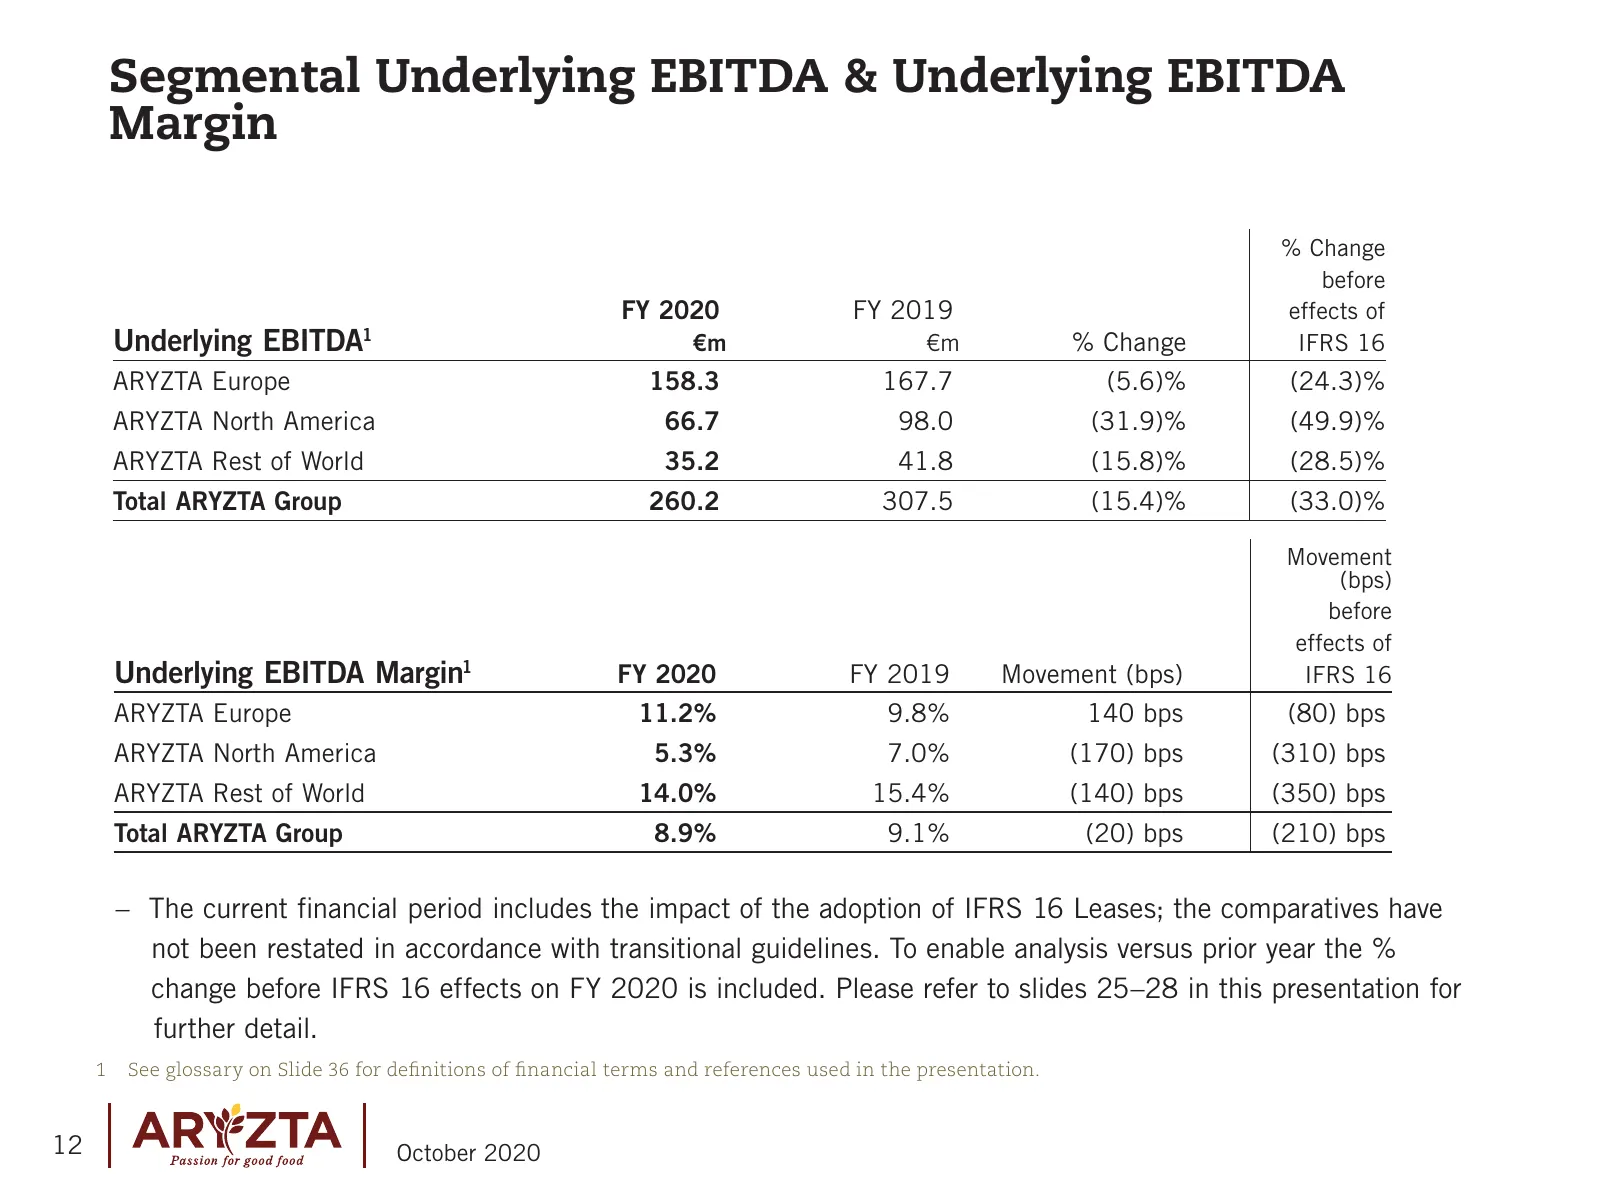
Slide 12: Segmental Underlying EBITDA & Underlying EBITDA Margin
Segmental Underlying EBITDA & Underlying EBITDA Margin % Change before FY 2020 FY 2019 effects of Underlying EBITDA 1 €m €m % Change IFRS 16 ARYZTA Europe 158.3 167.7 (5.6)% (24.3)% ARYZTA North America 66.7 98.0 (31.9)% (49.9)% ARYZTA Rest of World 35.2 41.8 (15.8)% (28.5)% Total ARYZTA Group 260.2
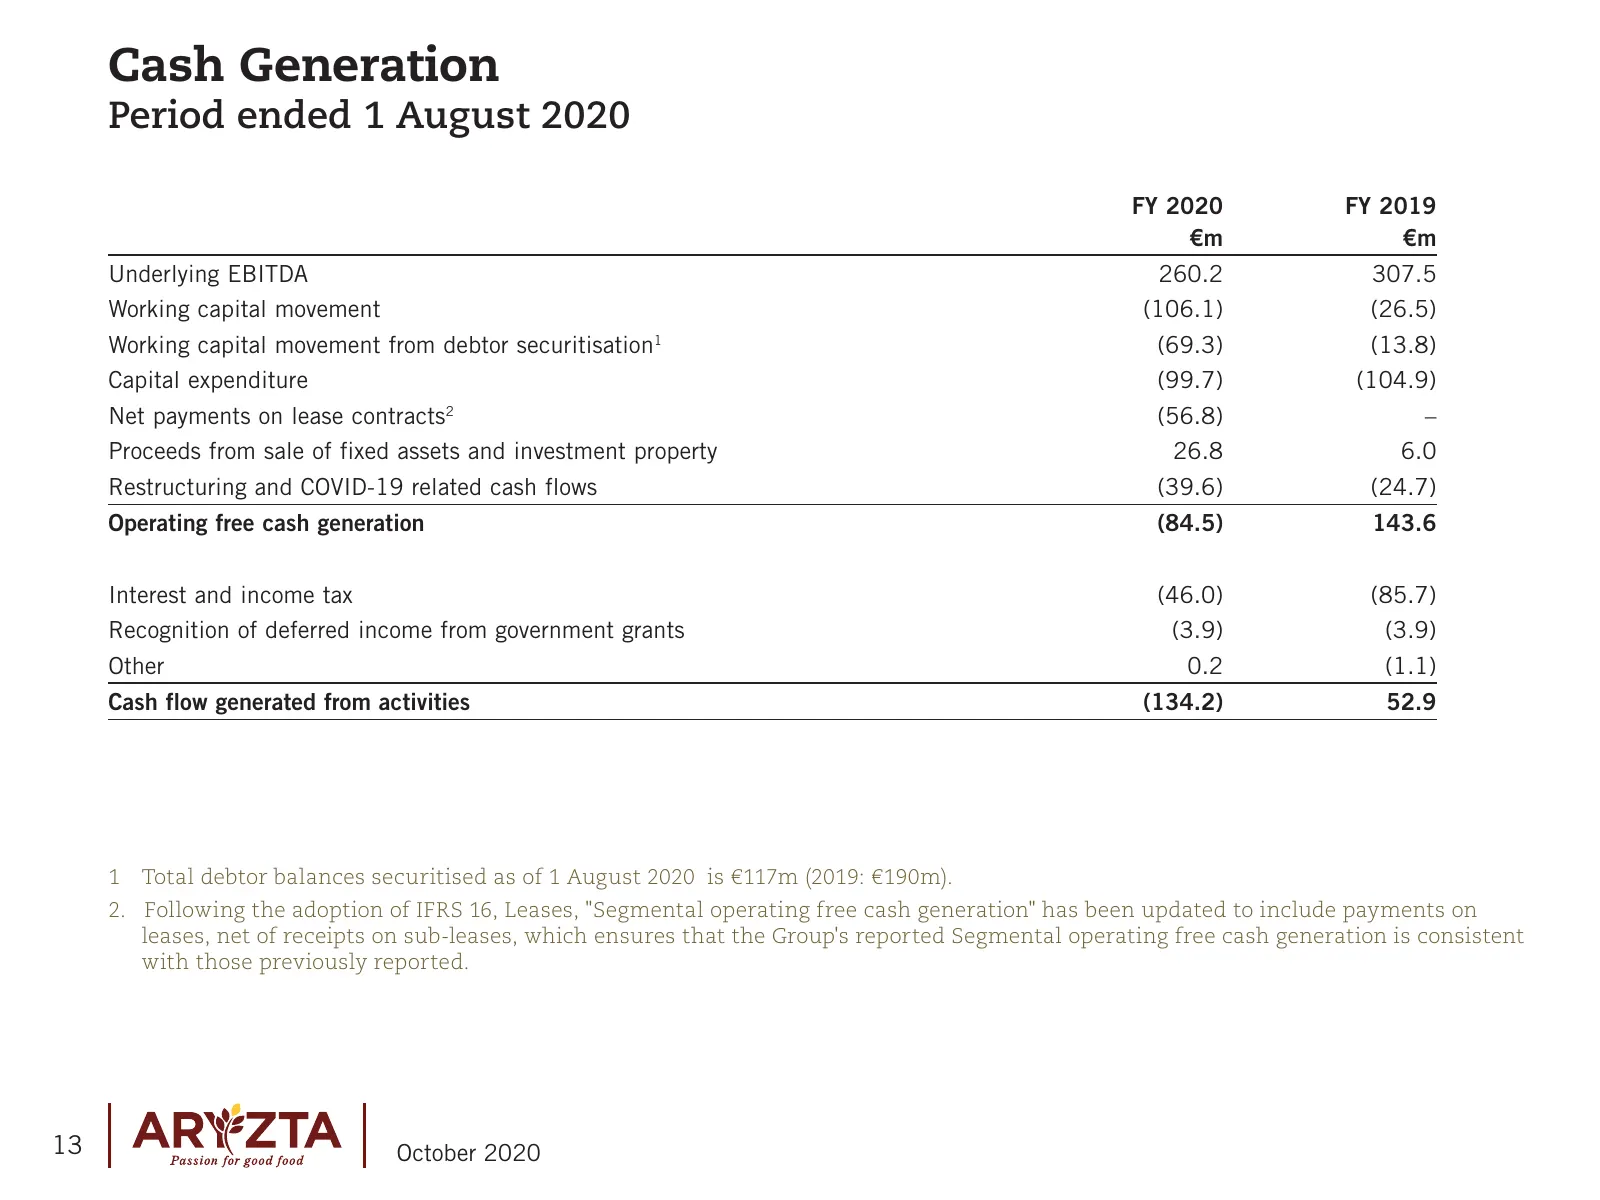
Slide 13: Cash Generation
Cash Generation Period ended 1 August 2020 FY 2020 FY 2019 €m €m Underlying EBITDA 260.2 307.5 Working capital movement (106.1) (26.5) Working capital movement from debtor securitisation 1 (69.3) (13.8) Capital expenditure (99.7) (104.9) Net payments on lease contracts 2 (56.8) – Proceeds from sale
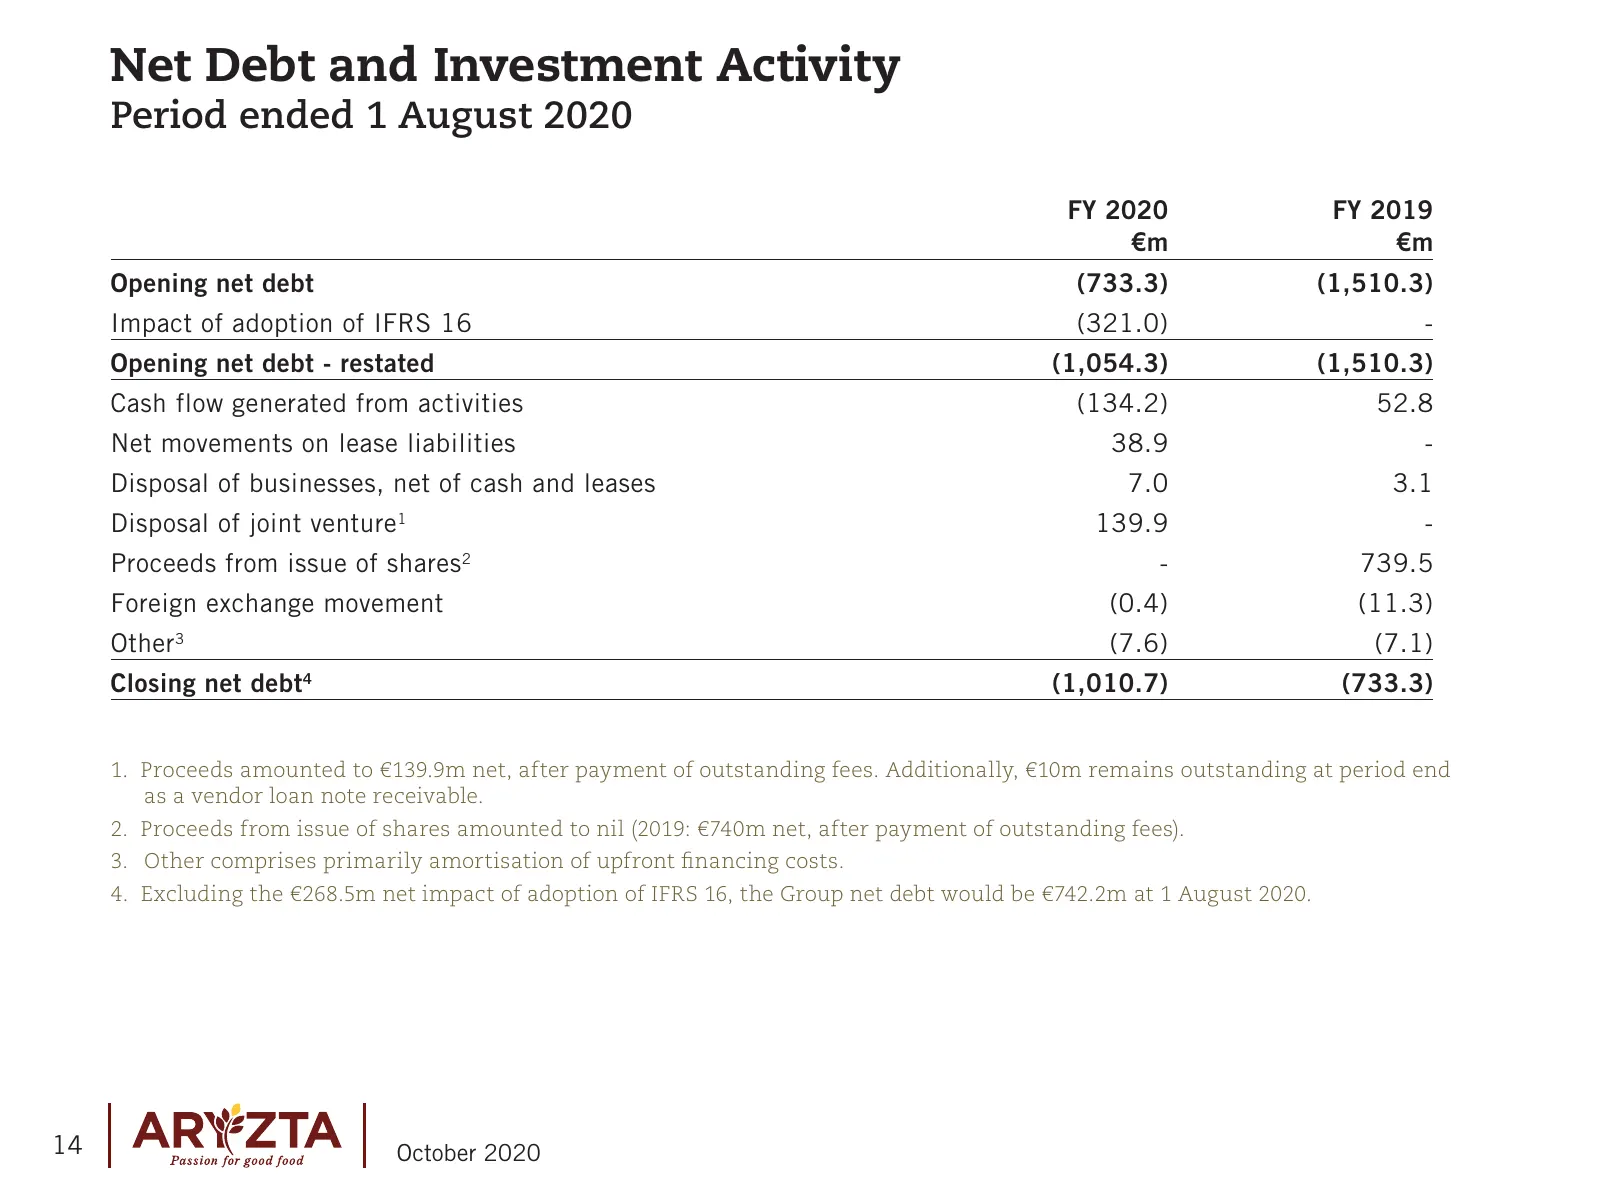
Slide 14: Net Debt and Investment Activity
Net Debt and Investment Activity Period ended 1 August 2020 FY 2020 FY 2019 €m €m Opening net debt (733.3) (1,510.3) Impact of adoption of IFRS 16 (321.0) - Opening net debt - restated (1,054.3) (1,510.3) Cash flow generated from activities (134.2) 52.8 Net movements on lease liabilities 38.9 - Disp
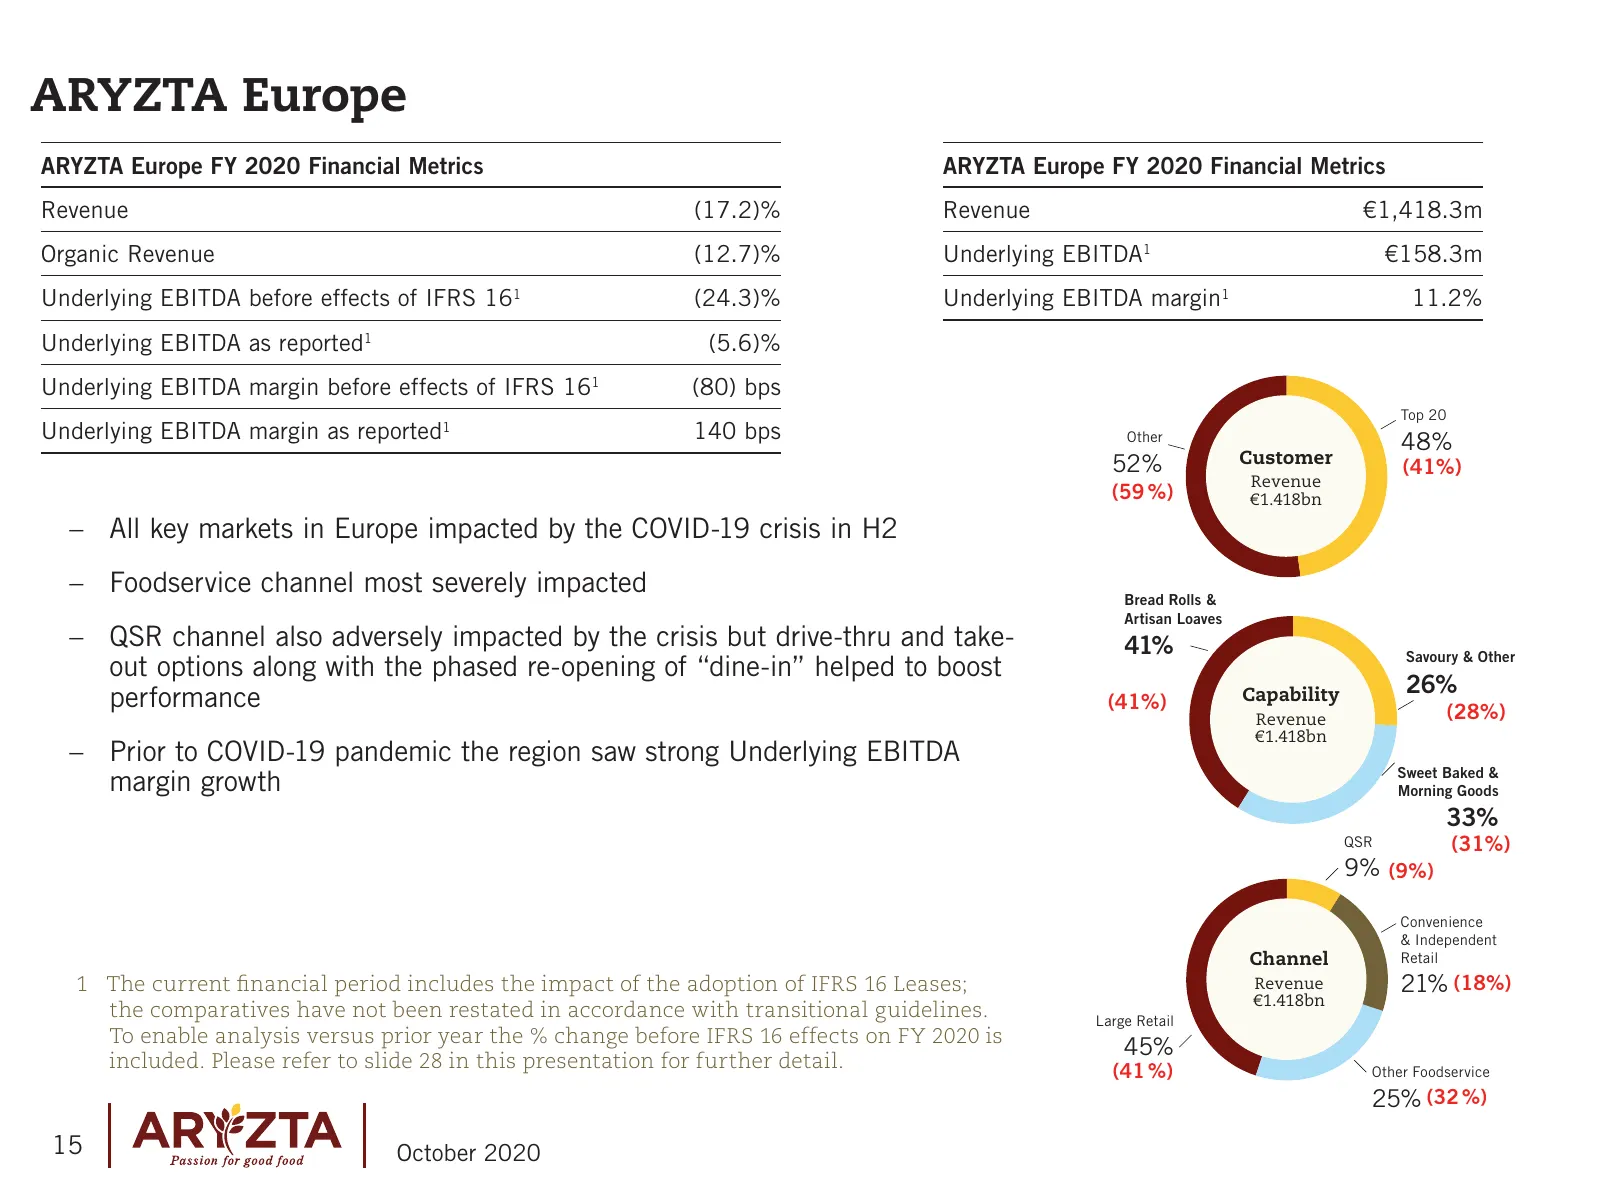
Slide 15: ARYZTA Europe
ARYZTA Europe ARYZTA Europe FY 2020 Financial Metrics ARYZTA Europe FY 2020 Financial Metrics Revenue (17.2)% Revenue €1,418.3m Organic Revenue (12.7)% Underlying EBITDA1 €158.3m Underlying EBITDA before effects of IFRS 161 (24.3)% Underlying EBITDA margin1 11.2% Underlying EBITDA as reported1 (5.6)
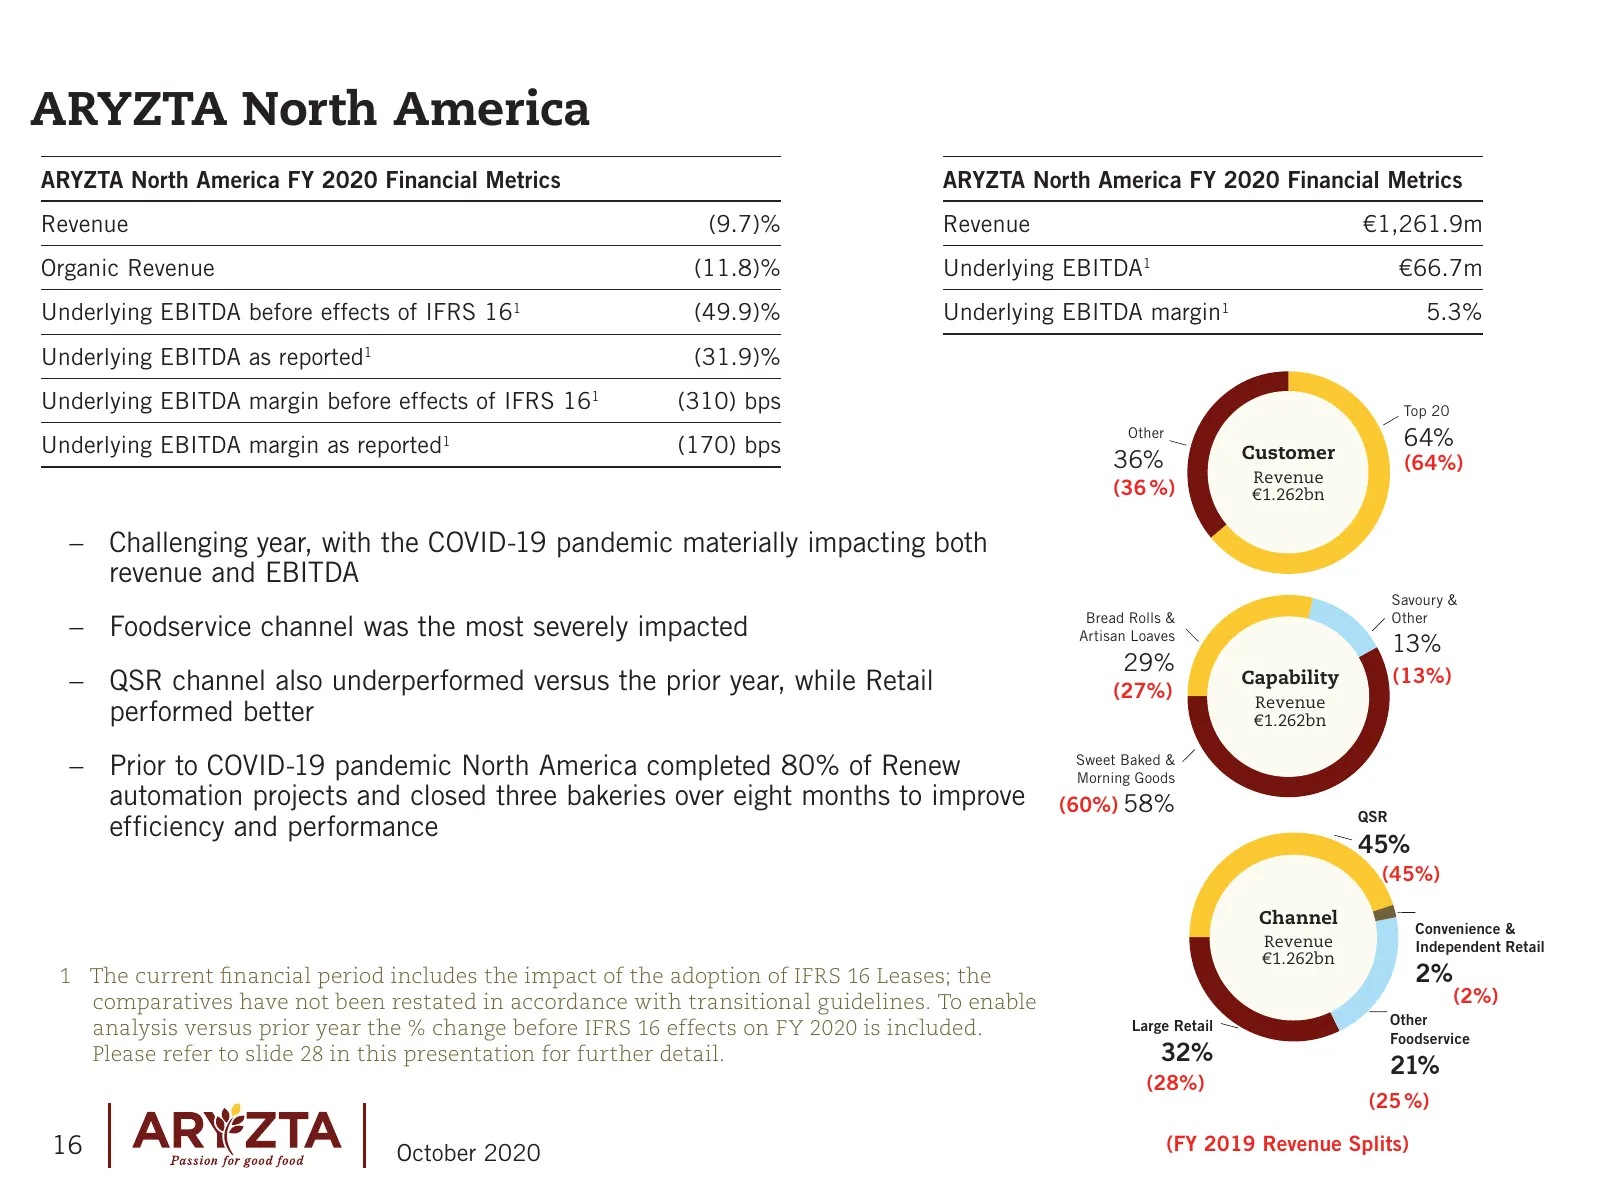
Slide 16: ARYZTA North America
ARYZTA North America ARYZTA North America FY 2020 Financial Metrics ARYZTA North America FY 2020 Financial Metrics Revenue (9.7)% Revenue €1,261.9m Organic Revenue (11.8)% Underlying EBITDA1 €66.7m Underlying EBITDA before effects of IFRS 161 (49.9)% Underlying EBITDA margin1 5.3% Underlying EBITDA
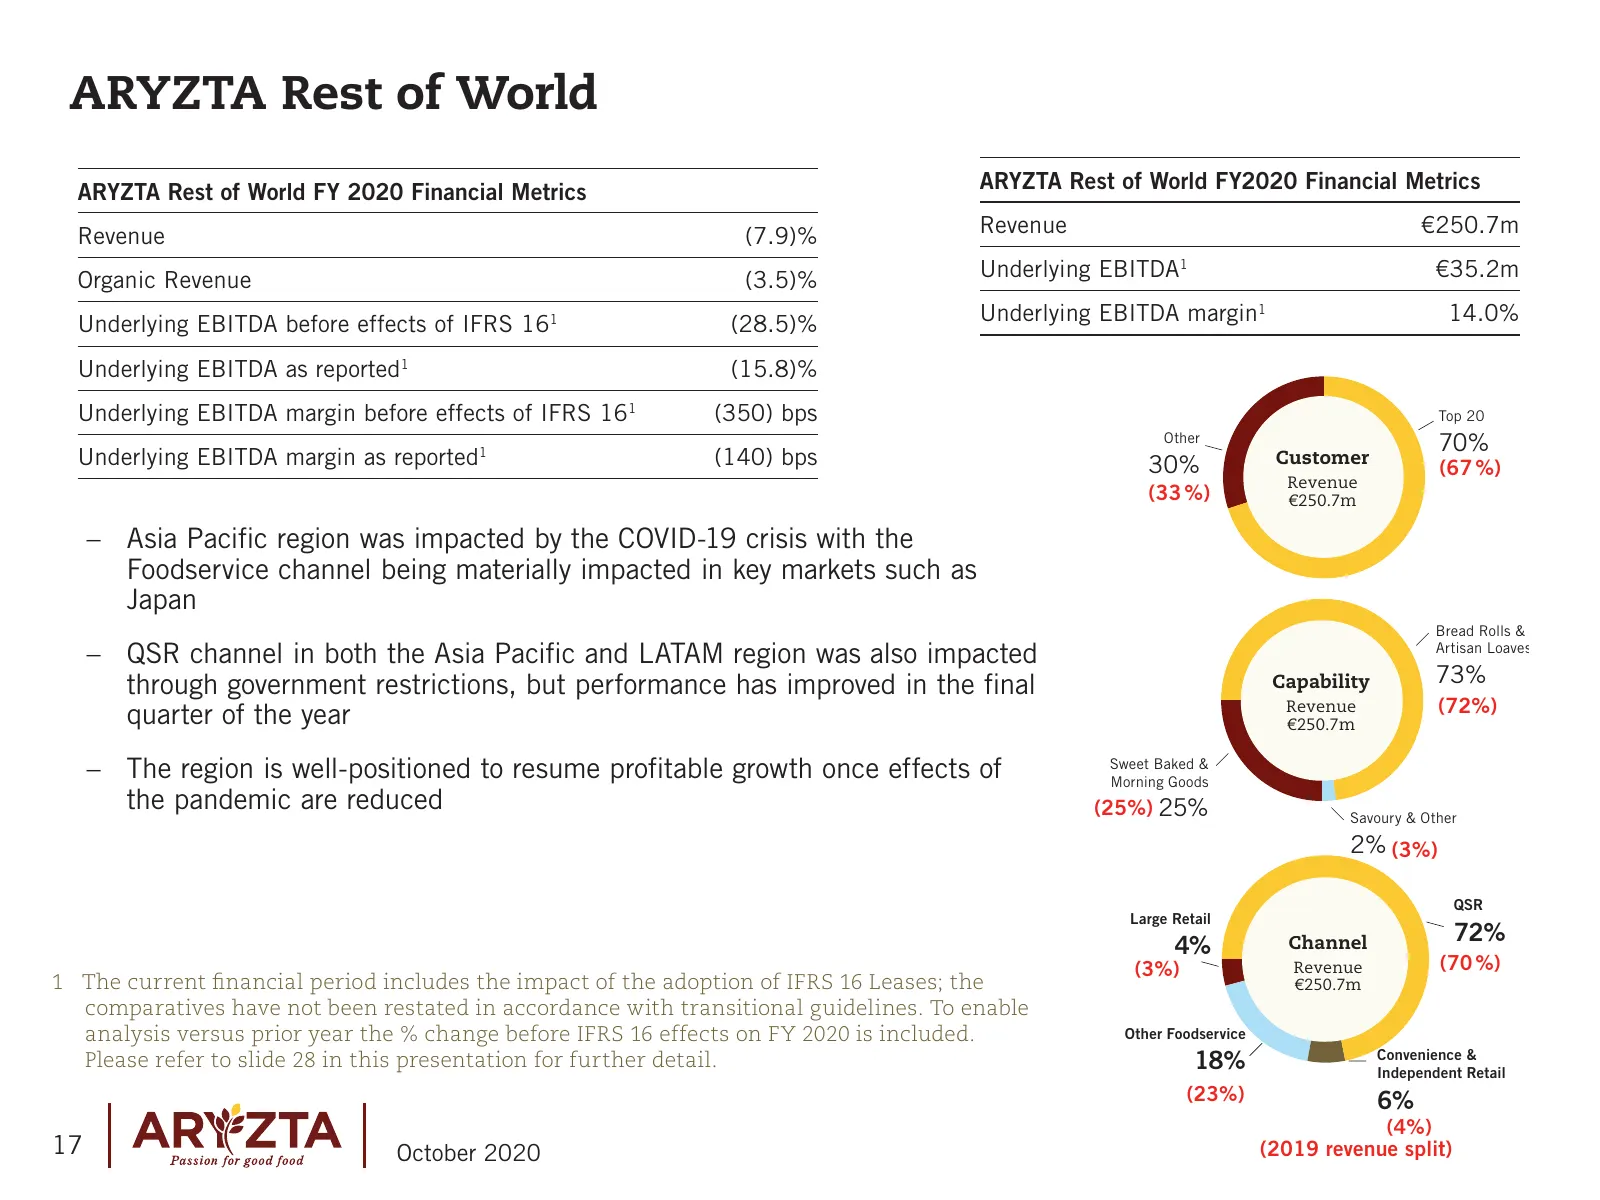
Slide 17: ARYZTA Rest of World
ARYZTA Rest of World ARYZTA Rest of World FY 2020 Financial Metrics ARYZTA Rest of World FY2020 Financial Metrics Revenue (7.9)% Revenue €250.7m Organic Revenue (3.5)% Underlying EBITDA1 €35.2m Underlying EBITDA before effects of IFRS 161 (28.5)% Underlying EBITDA margin1 14.0% Underlying EBITDA as
Slide 18: ARYZTA Senior Debt Financing
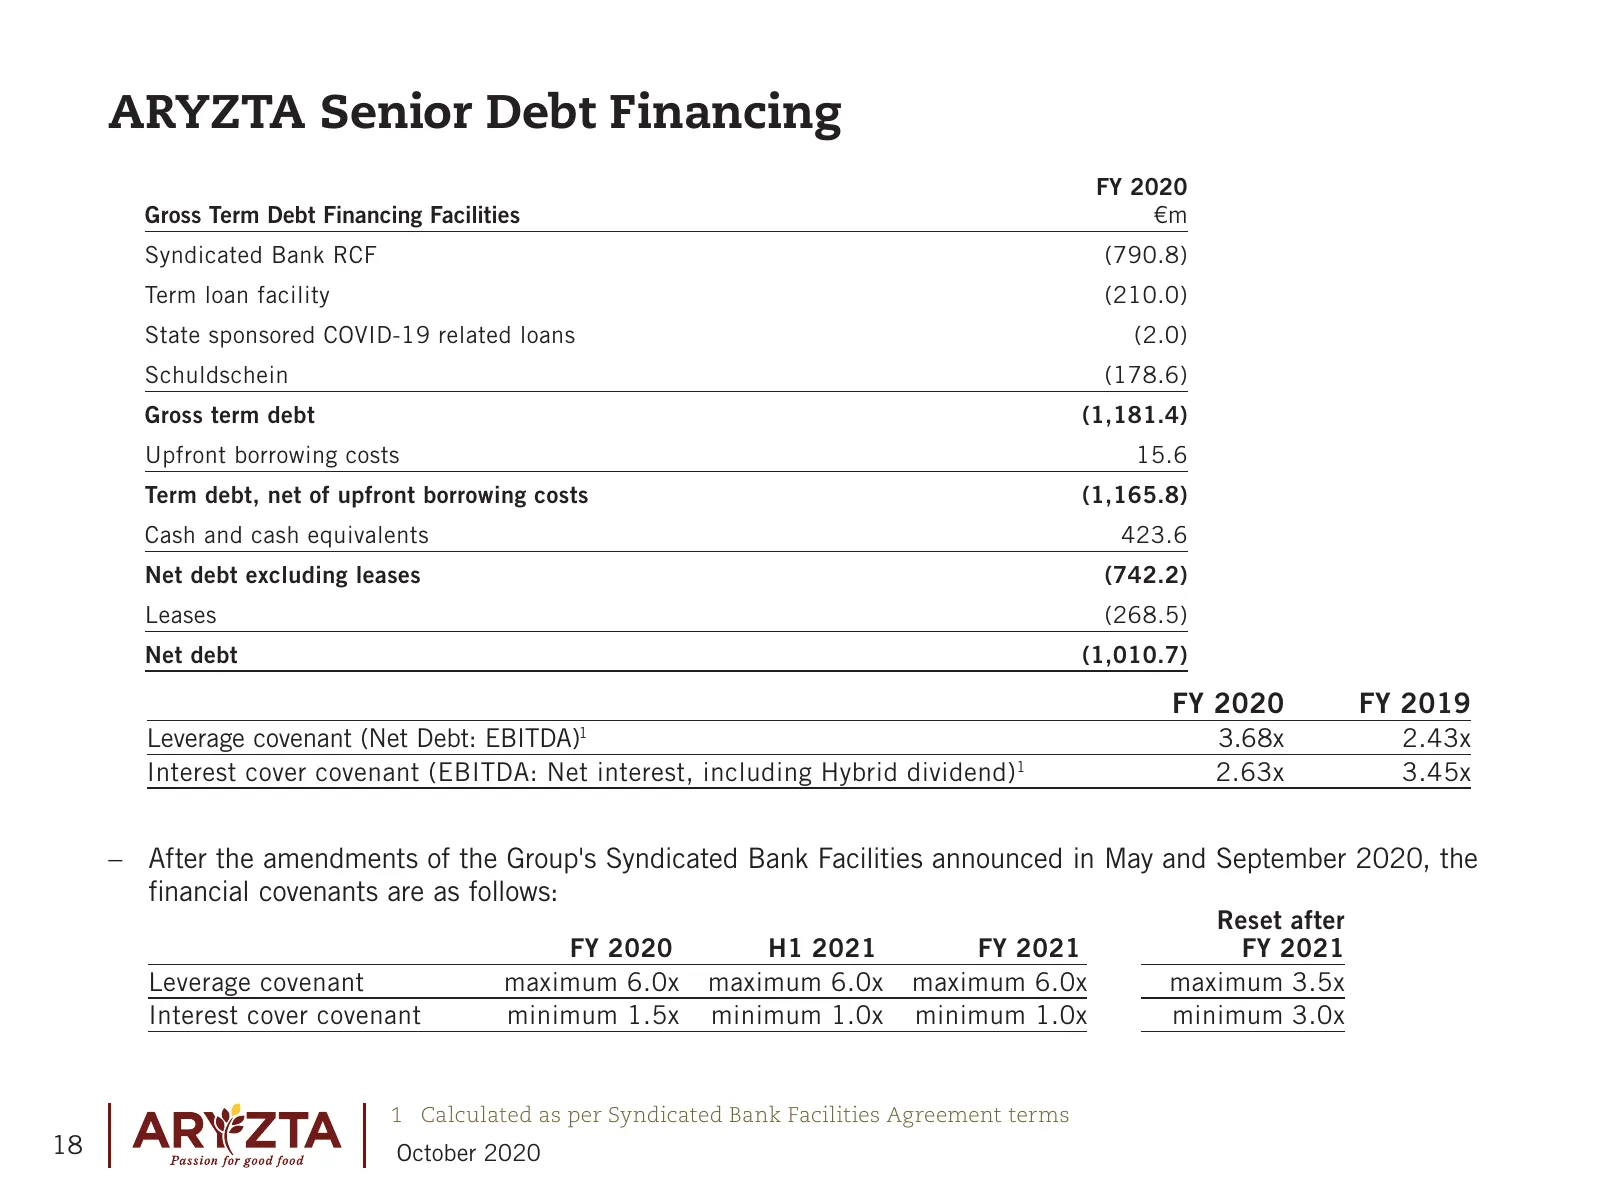
ARYZTA Senior Debt Financing FY 2020 Gross Term Debt Financing Facilities €m Syndicated Bank RCF (790.8) Term loan facility (210.0) State sponsored COVID-19 related loans (2.0) Schuldschein (178.6) Gross term debt (1,181.4) Upfront borrowing costs 15.6 Term debt, net of upfront borrowing costs (1,16
Slide 19: Impairment, Disposal, Restructuring and COVID-19 Related Costs
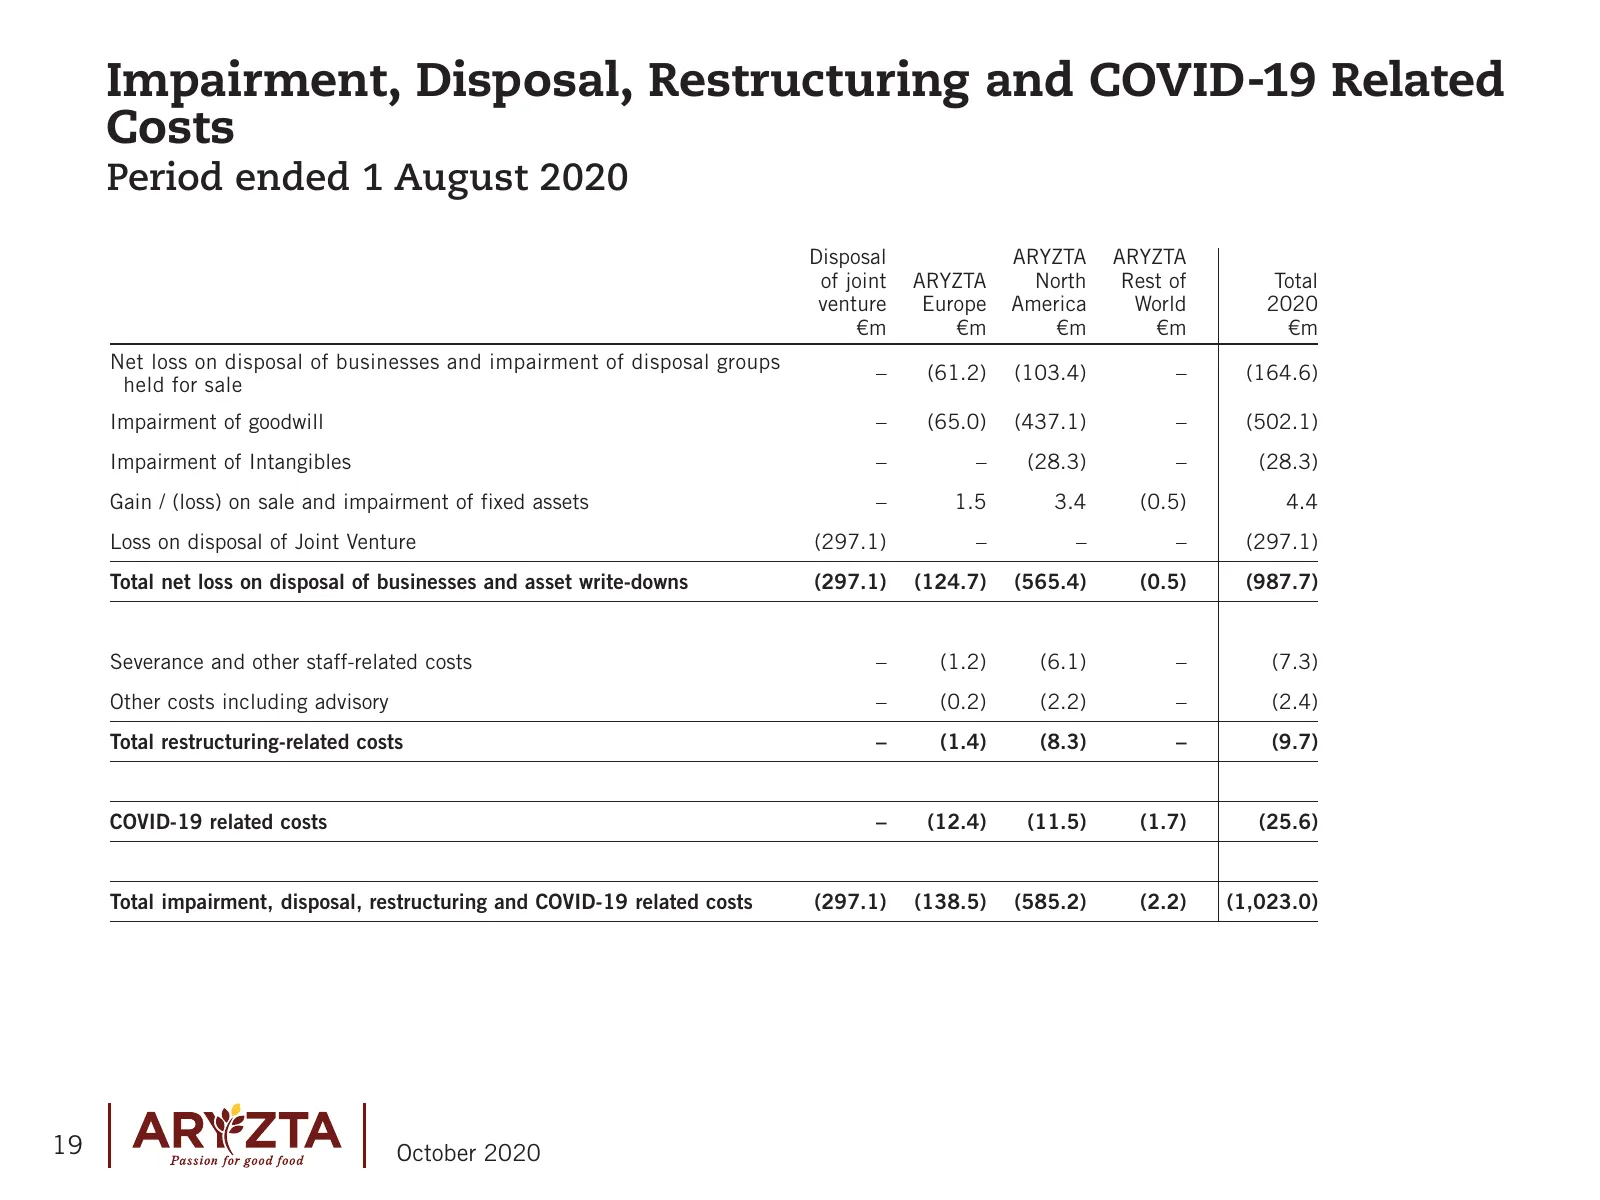
Impairment, Disposal, Restructuring and COVID-19 Related Costs Period ended 1 August 2020 Disposal ARYZTA ARYZTA of joint ARYZTA North Rest of Total venture Europe America World 2020 €m €m €m €m €m Net loss on disposal of businesses and impairment of disposal groups – (61.2) (103.4) – (164.6) held f
Slide 20: Picard
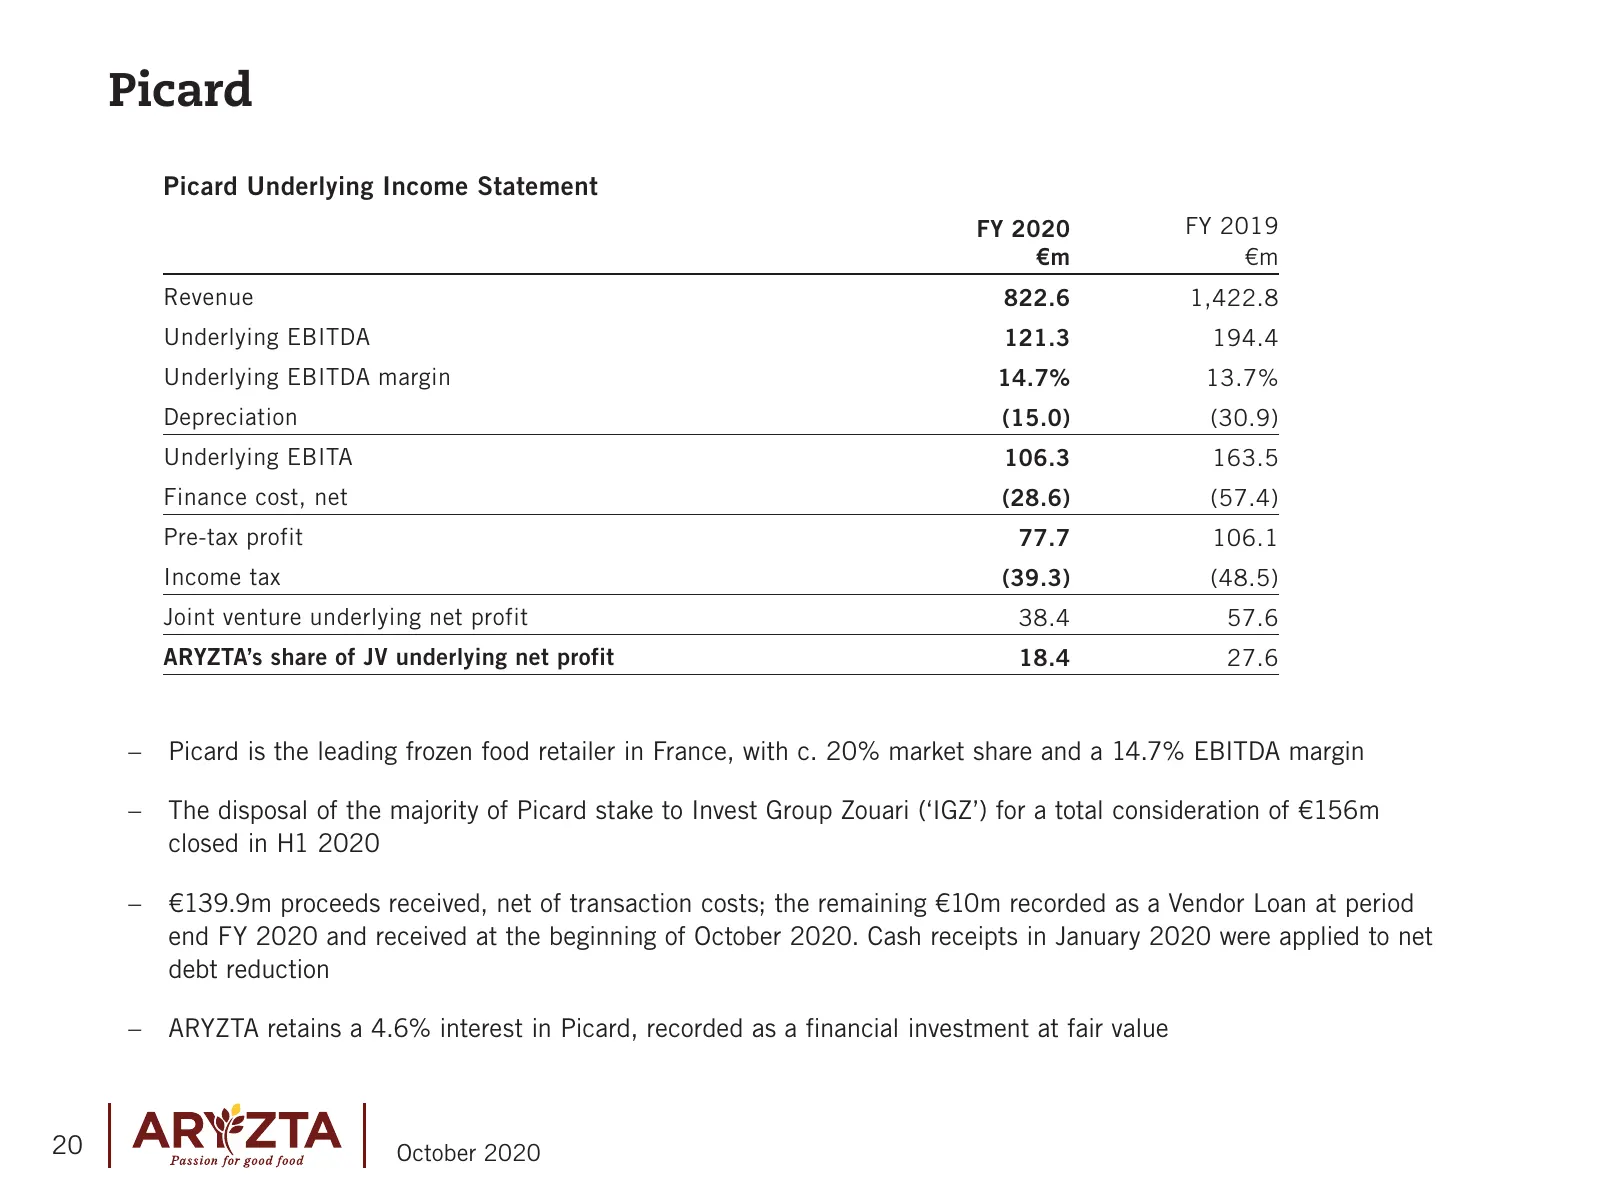
Picard Picard Underlying Income Statement FY 2020 FY 2019 €m €m Revenue 822.6 1,422.8 Underlying EBITDA 121.3 194.4 Underlying EBITDA margin 14.7% 13.7% Depreciation (15.0) (30.9) Underlying EBITA 106.3 163.5 Finance cost, net (28.6) (57.4) Pre-tax profit 77.7 106.1 Income tax (39.3) (48.5) Joint ve
Slide 21: Project Renew Interrupted by COVID-19 but Continuing to Deliver
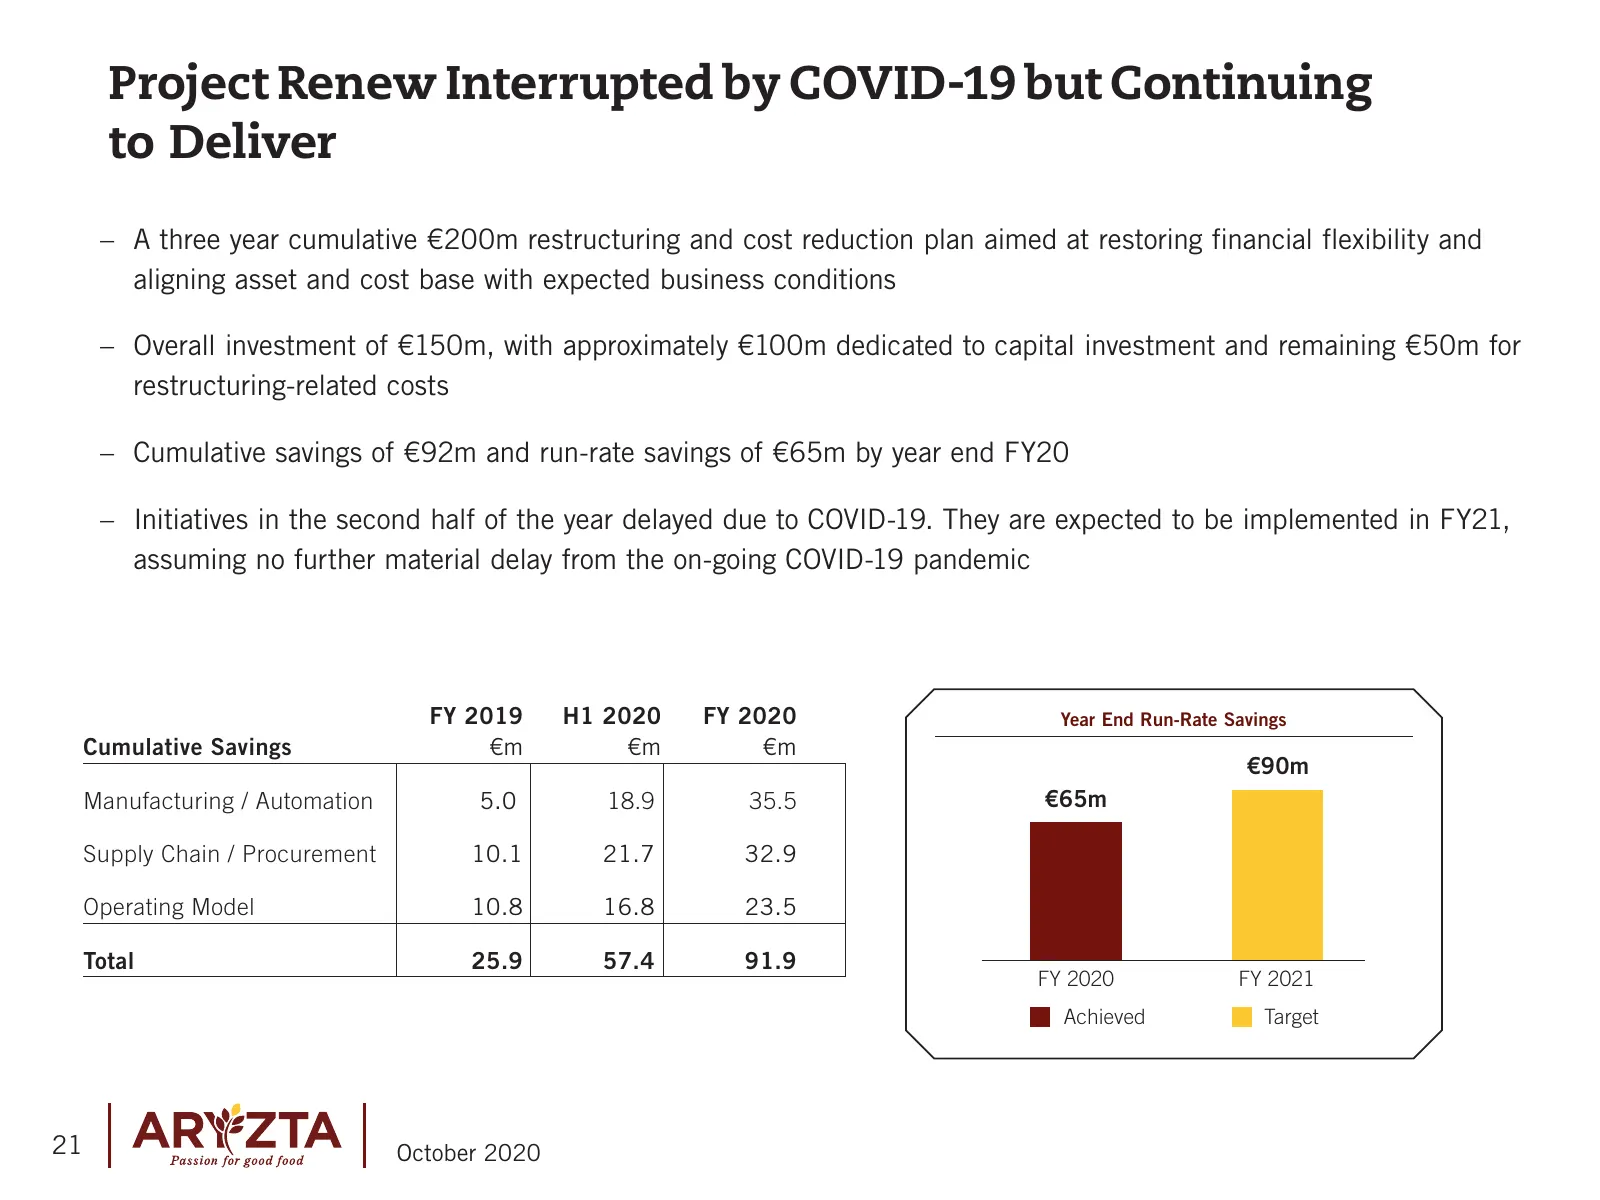
Project Renew Interrupted by COVID-19 but Continuing to Deliver –– A three year cumulative €200m restructuring and cost reduction plan aimed at restoring financial flexibility and aligning asset and cost base with expected business conditions –– Overall investment of €150m, with approximately €100m

Slide 22: Developments since EGM & Chairman's View
Developments since EGM & Chairman's View 22 October 2020
Slide 23: Developments since EGM
Developments since EGM –– Overwhelming EGM vote mandate for change –– ARYZTA potential can be unlocked –– 2020 results underpin need for substantial change –– COVID-19 impact –– Positive banking development –– New strategic board committee formed –– Will explore all strategic options in the best int
Slide 24: Chairman's view
Chairman's view –– Need for simplified business model and organization –– Excessive debt level needs to be reduced –– Explore all strategic options and evaluate all unsolicited expressions of interest received –– ARYZTA has close customer relationships, well invested assets and experienced employees
Slide 25: Appendix I - IFRS 16 Impact
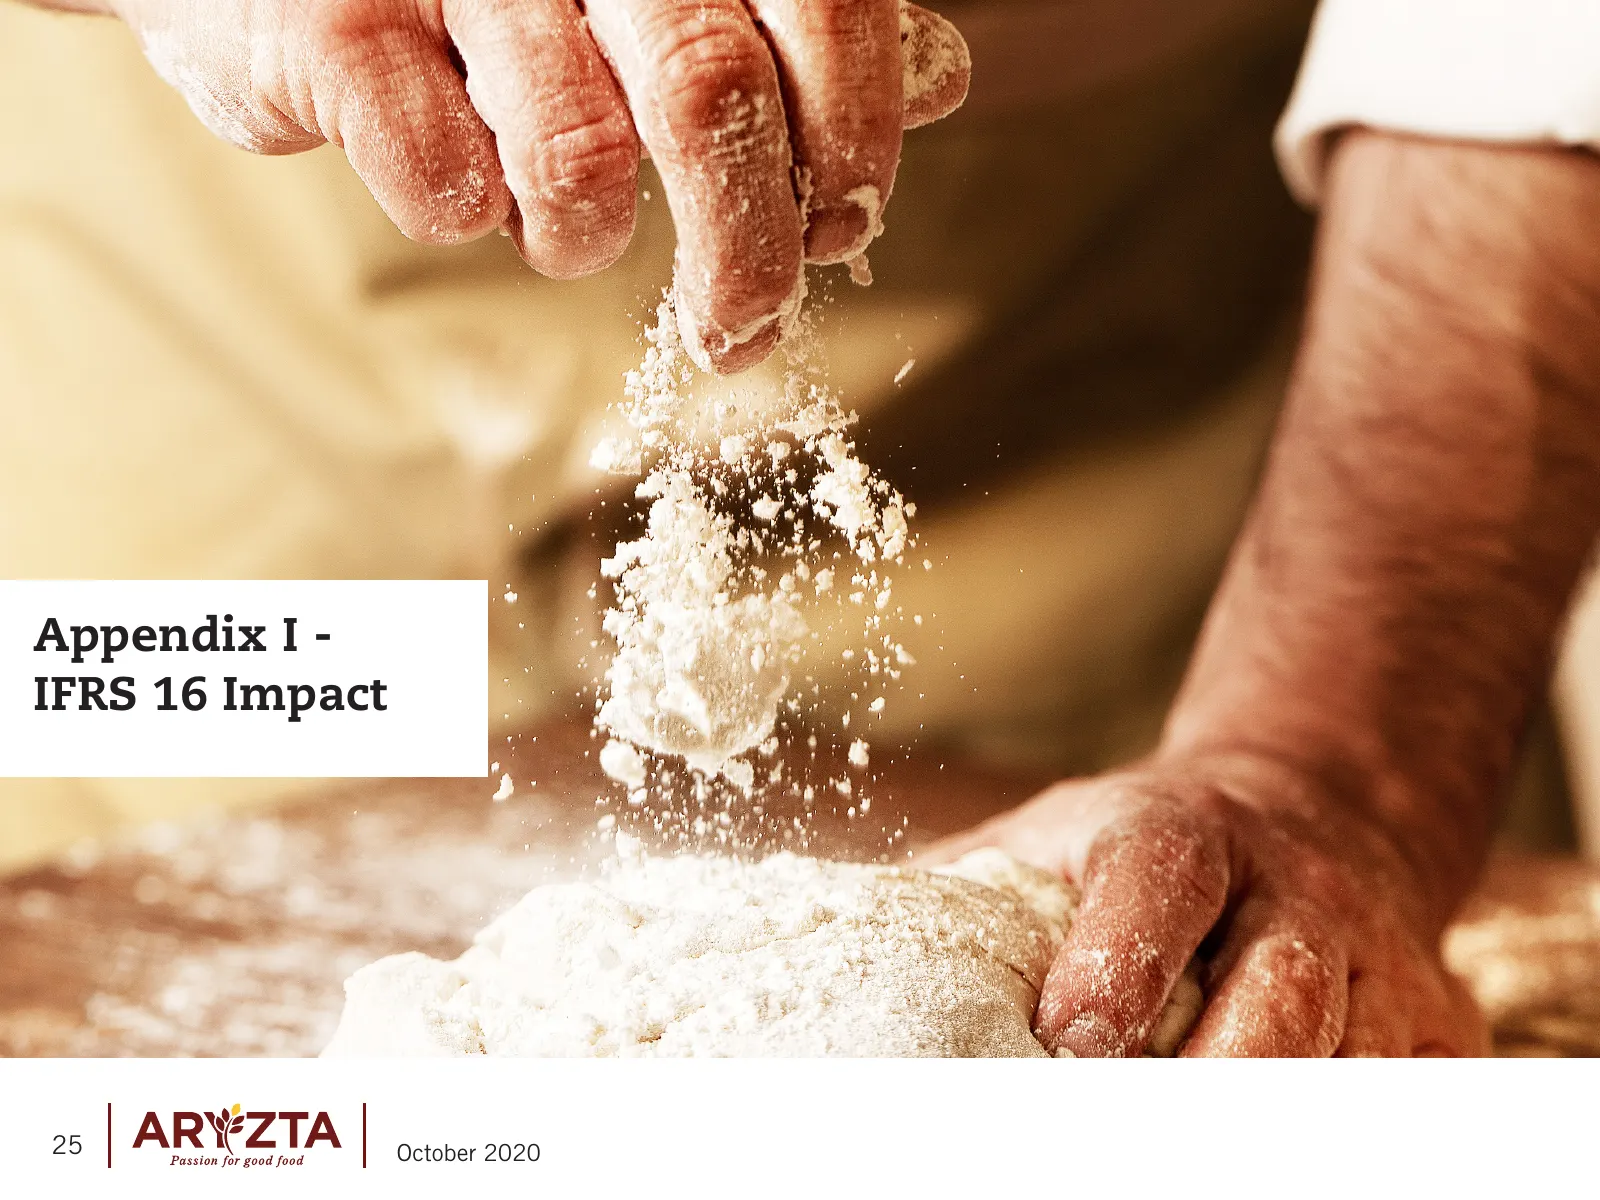
Appendix I - IFRS 16 Impact 25 October 2020
Slide 26: IFRS 16 – New Accounting Standard on Leases
IFRS 16 – New Accounting Standard on Leases –– IFRS 16 requires a lessee to recognise assets and liabilities for all leases with a term of more than 12 months »» Balance sheet impact: increase of property, plant and equipment, other receivables (net investment in sub- leases) and total financial deb
Slide 27: ARYZTA Group Underlying Income Statement (post and prior IFRS 16)
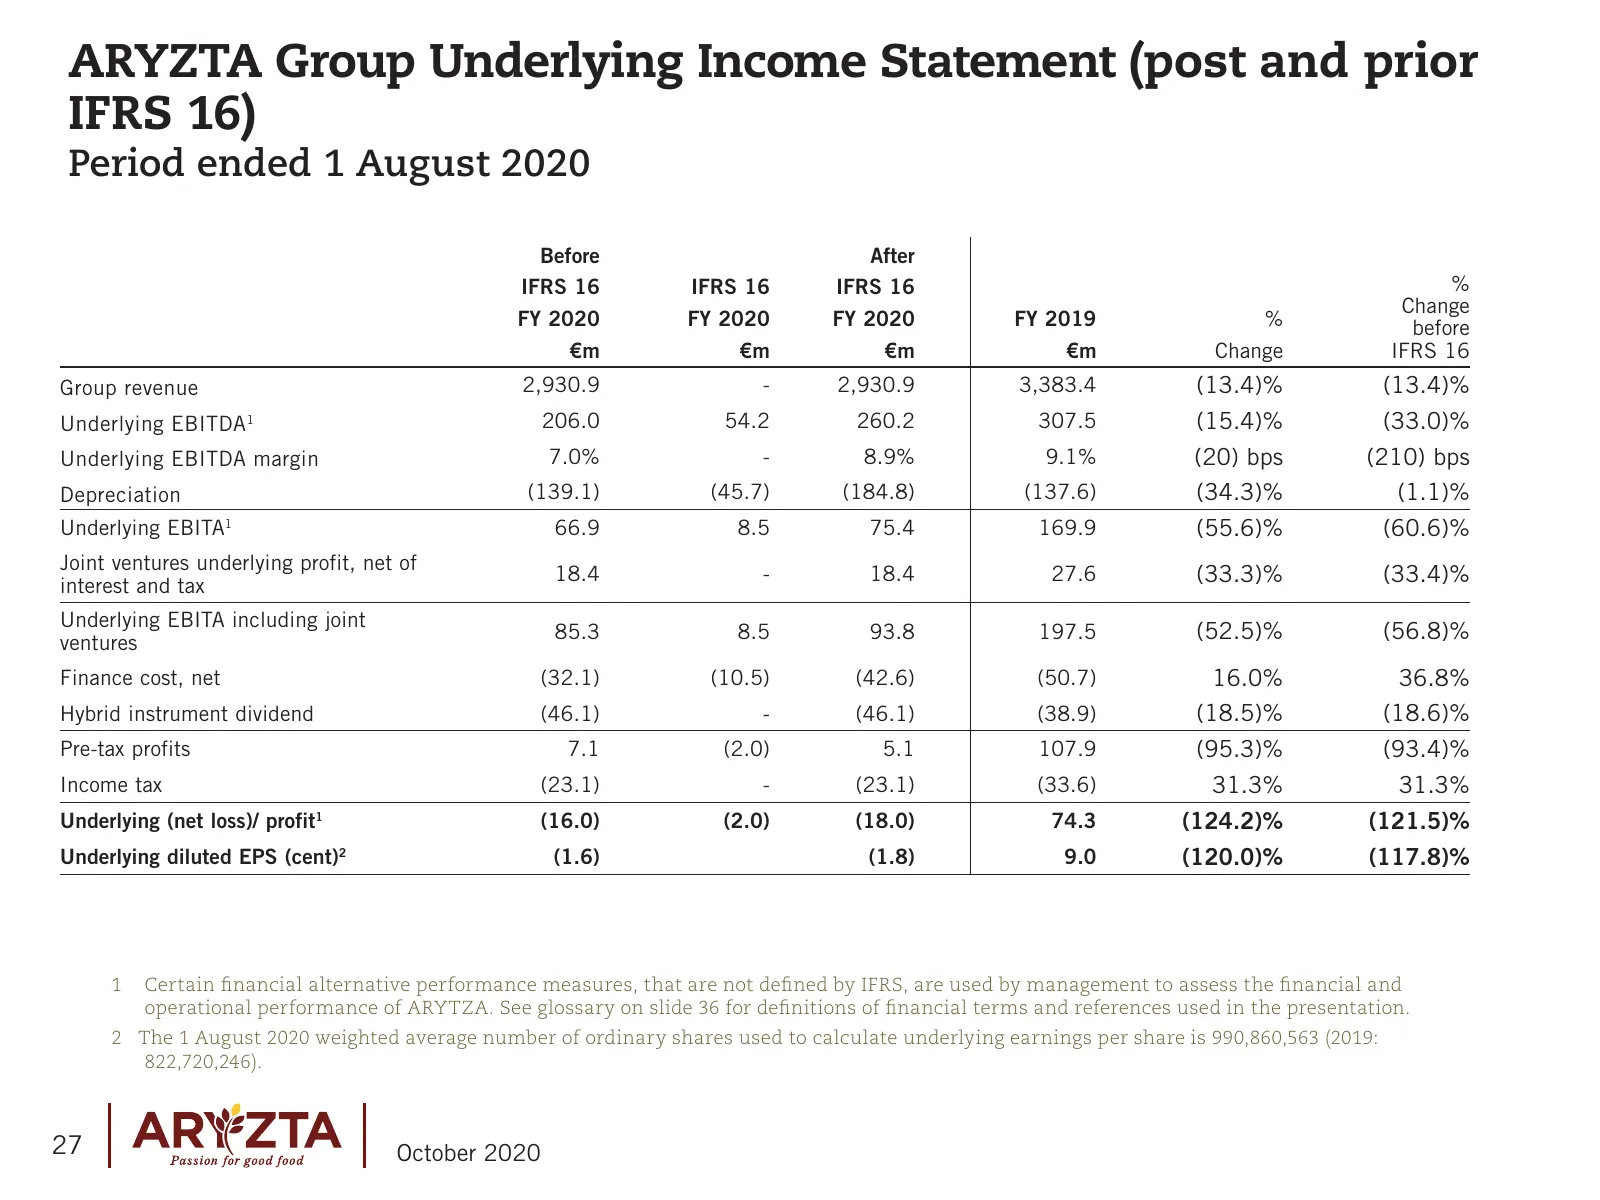
ARYZTA Group Underlying Income Statement (post and prior IFRS 16) Period ended 1 August 2020 Before After IFRS 16 IFRS 16 IFRS 16 % Change FY 2020 FY 2020 FY 2020 FY 2019 % before €m €m €m €m Change IFRS 16 Group revenue 2,930.9 - 2,930.9 3,383.4 (13.4)% (13.4)% Underlying EBITDA1 206.0 54.2 260.2 3
Slide 28: Effects of IFRS 16 – Leases on Segmental Underlying EBITDA
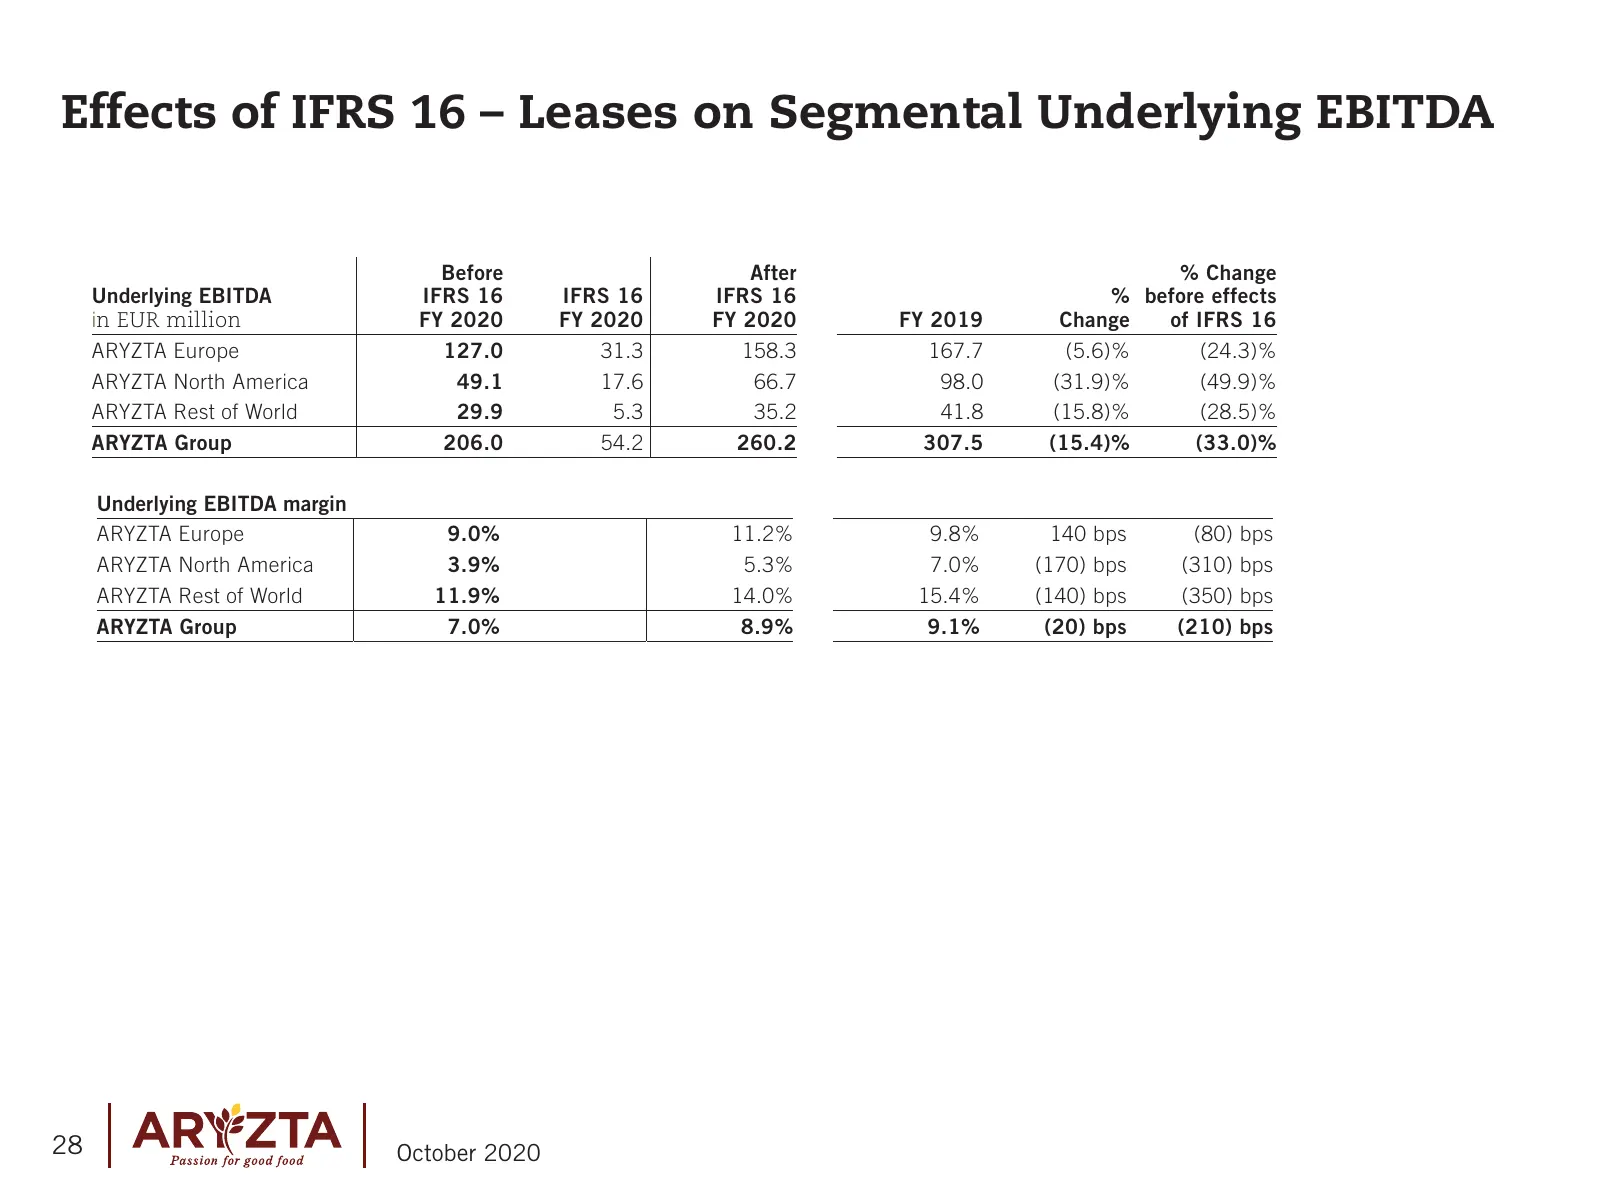
Effects of IFRS 16 – Leases on Segmental Underlying EBITDA Before After % Change Underlying EBITDA IFRS 16 IFRS 16 IFRS 16 % before effects in EUR million FY 2020 FY 2020 FY 2020 FY 2019 Change of IFRS 16 ARYZTA Europe 127.0 31.3 158.3 167.7 (5.6)% (24.3)% ARYZTA North America 49.1 17.6 66.7 98.0 (3

Slide 29: Appendix II
Appendix II o9 | ARYZTA Passion for good food October 2020
Slide 30: ARYZTA Group Balance Sheet
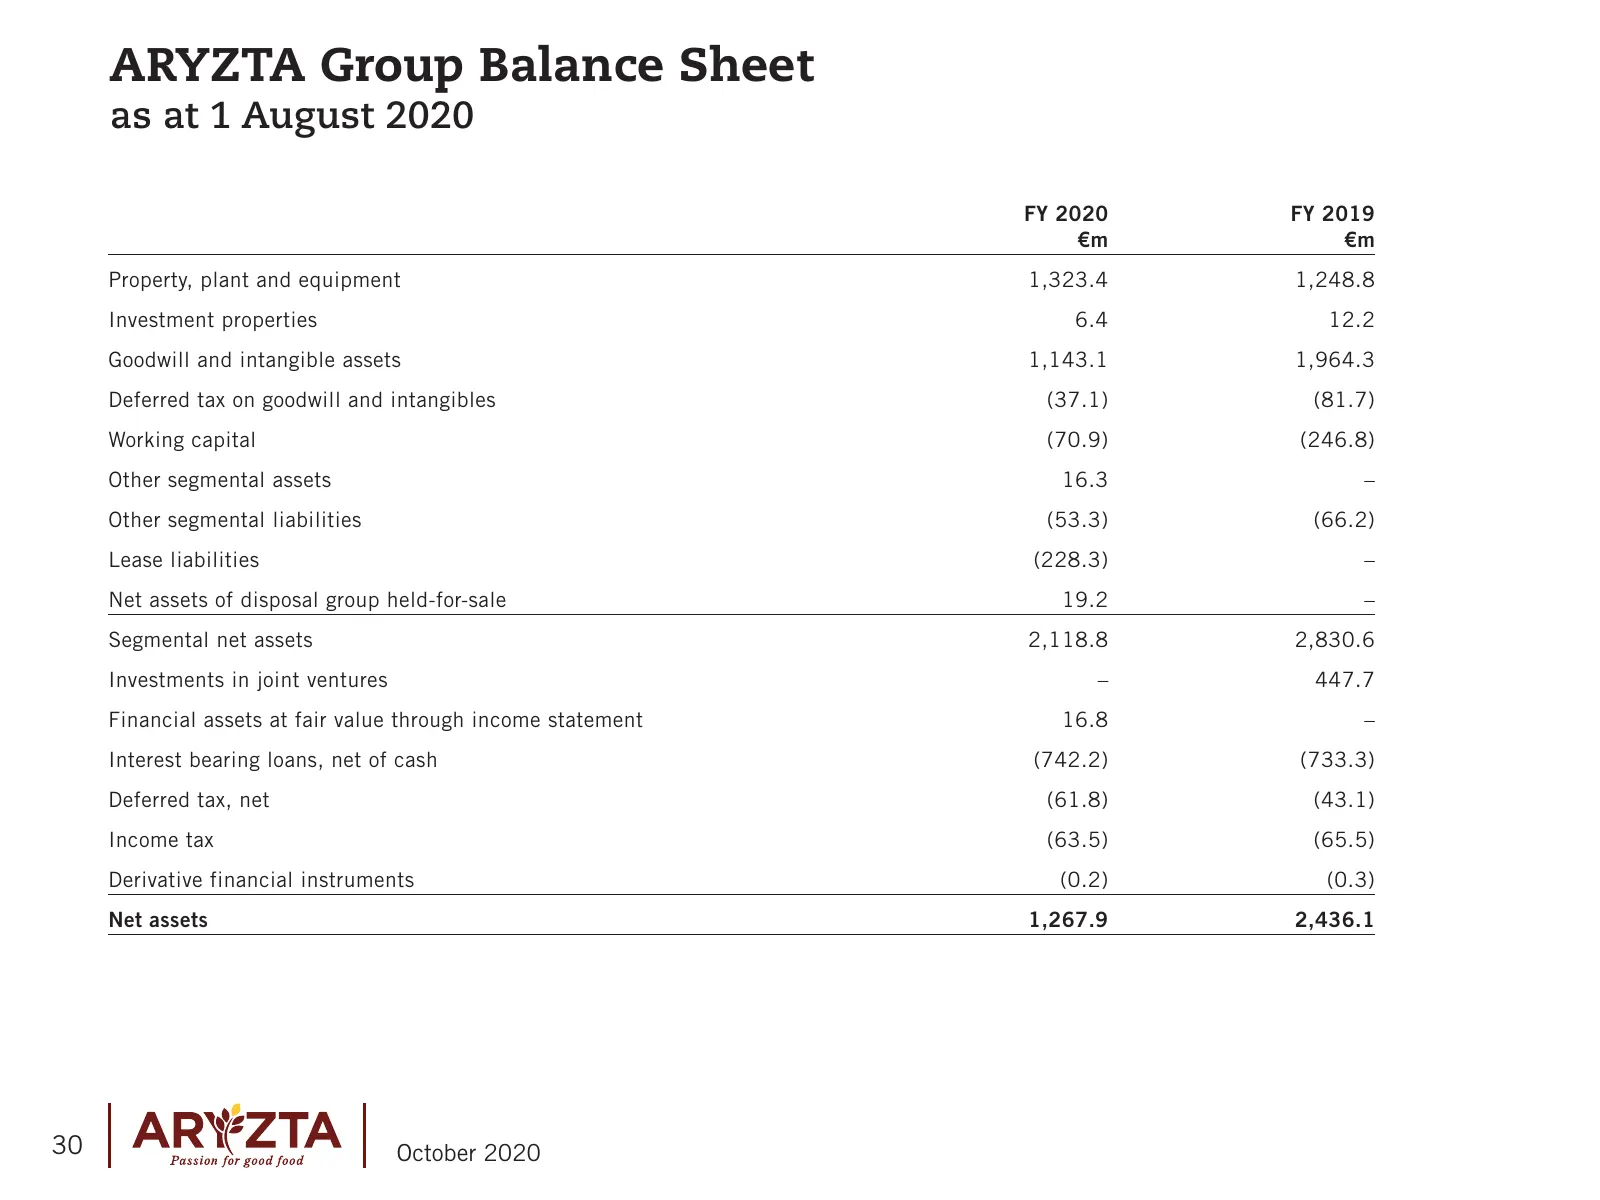
ARYZTA Group Balance Sheet as at 1 August 2020 FY 2020 FY 2019 €m €m Property, plant and equipment 1,323.4 1,248.8 Investment properties 6.4 12.2 Goodwill and intangible assets 1,143.1 1,964.3 Deferred tax on goodwill and intangibles (37.1) (81.7) Working capital (70.9) (246.8) Other segmental asset
Slide 31: ARYZTA Group Gross Term Debt Financing Facilities
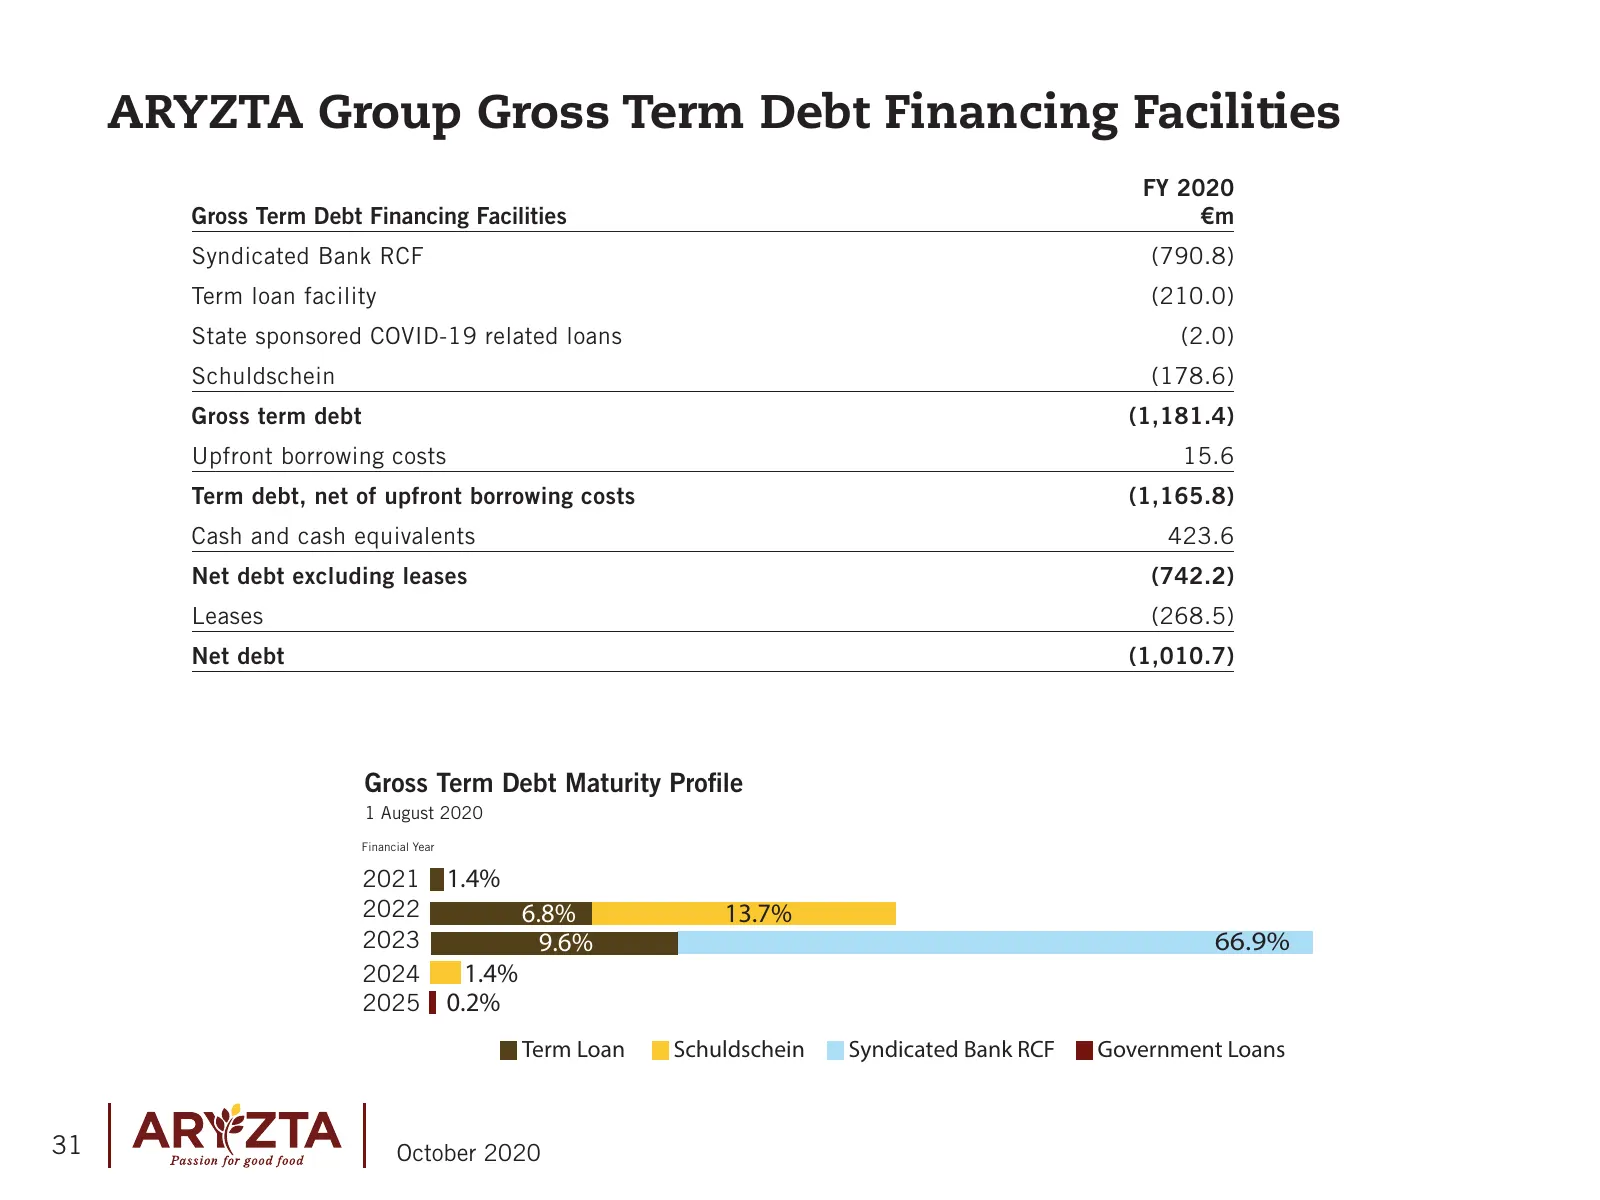
ARYZTA Group Gross Term Debt Financing Facilities FY 2020 Gross Term Debt Financing Facilities €m Syndicated Bank RCF (790.8) Term loan facility (210.0) State sponsored COVID-19 related loans (2.0) Schuldschein (178.6) Gross term debt (1,181.4) Upfront borrowing costs 15.6 Term debt, net of upfront
Slide 32: Hybrid Financing
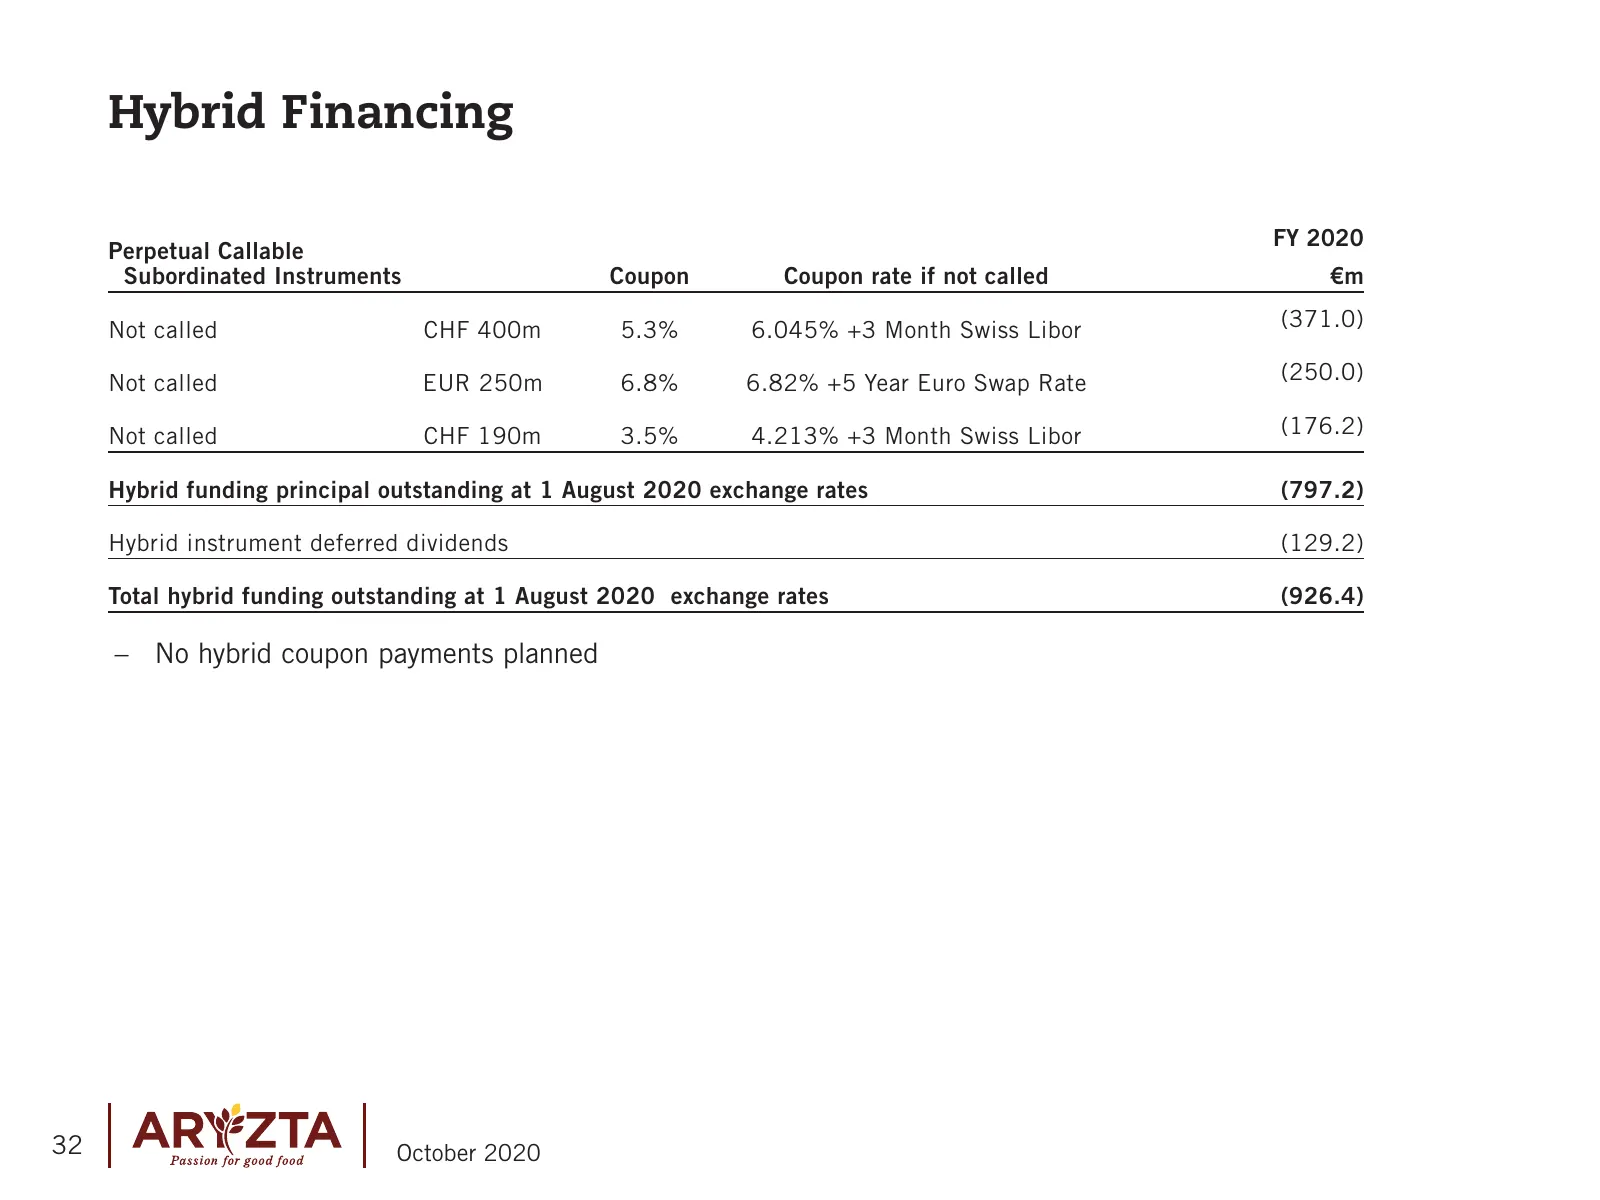
Hybrid Financing FY 2020 Perpetual Callable Subordinated Instruments Coupon Coupon rate if not called €m Not called CHF 400m 5.3% 6.045% +3 Month Swiss Libor (371.0) Not called EUR 250m 6.8% 6.82% +5 Year Euro Swap Rate (250.0) Not called CHF 190m 3.5% 4.213% +3 Month Swiss Libor (176.2) Hybrid fund
Slide 33: ARYZTA Group – Return on Invested Capital
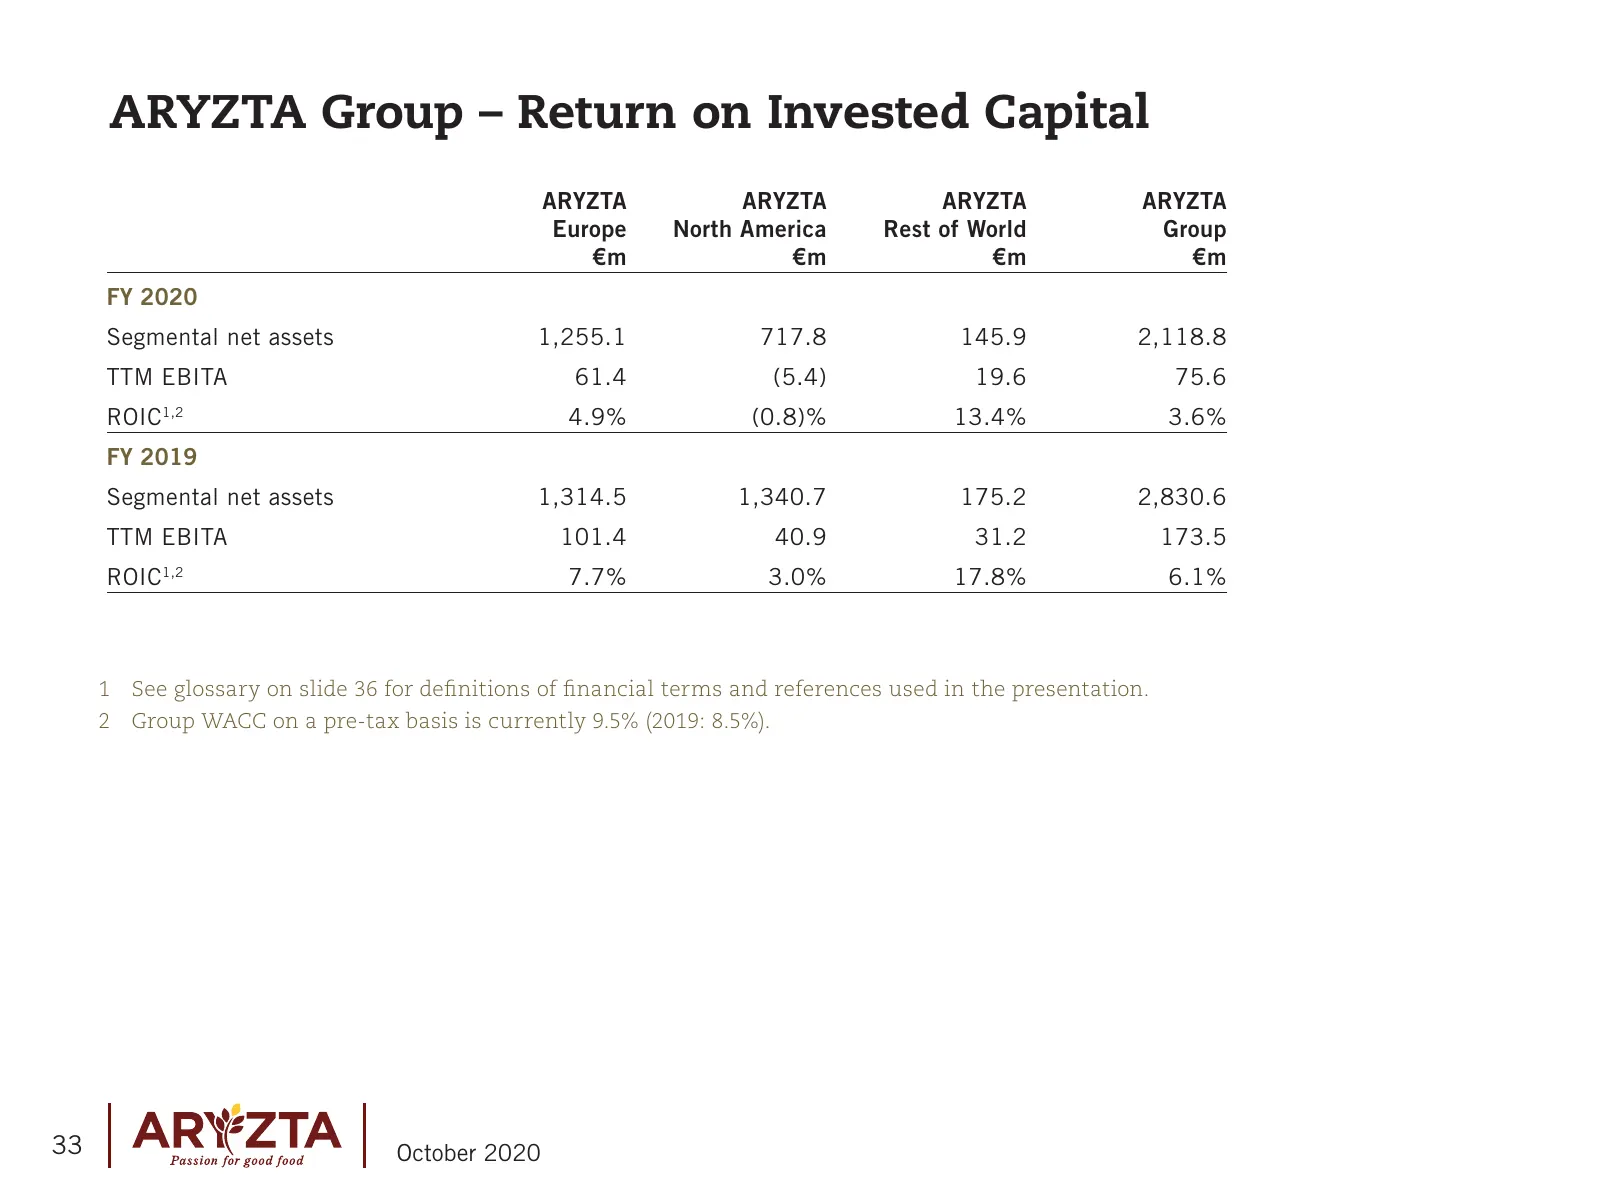
ARYZTA Group – Return on Invested Capital ARYZTA ARYZTA ARYZTA ARYZTA Europe North America Rest of World Group €m €m €m €m FY 2020 Segmental net assets 1,255.1 717.8 145.9 2,118.8 TTM EBITA 61.4 (5.4) 19.6 75.6 ROIC1,2 4.9% (0.8)% 13.4% 3.6% FY 2019 Segmental net assets 1,314.5 1,340.7 175.2 2,830.6
Slide 34: BREXIT
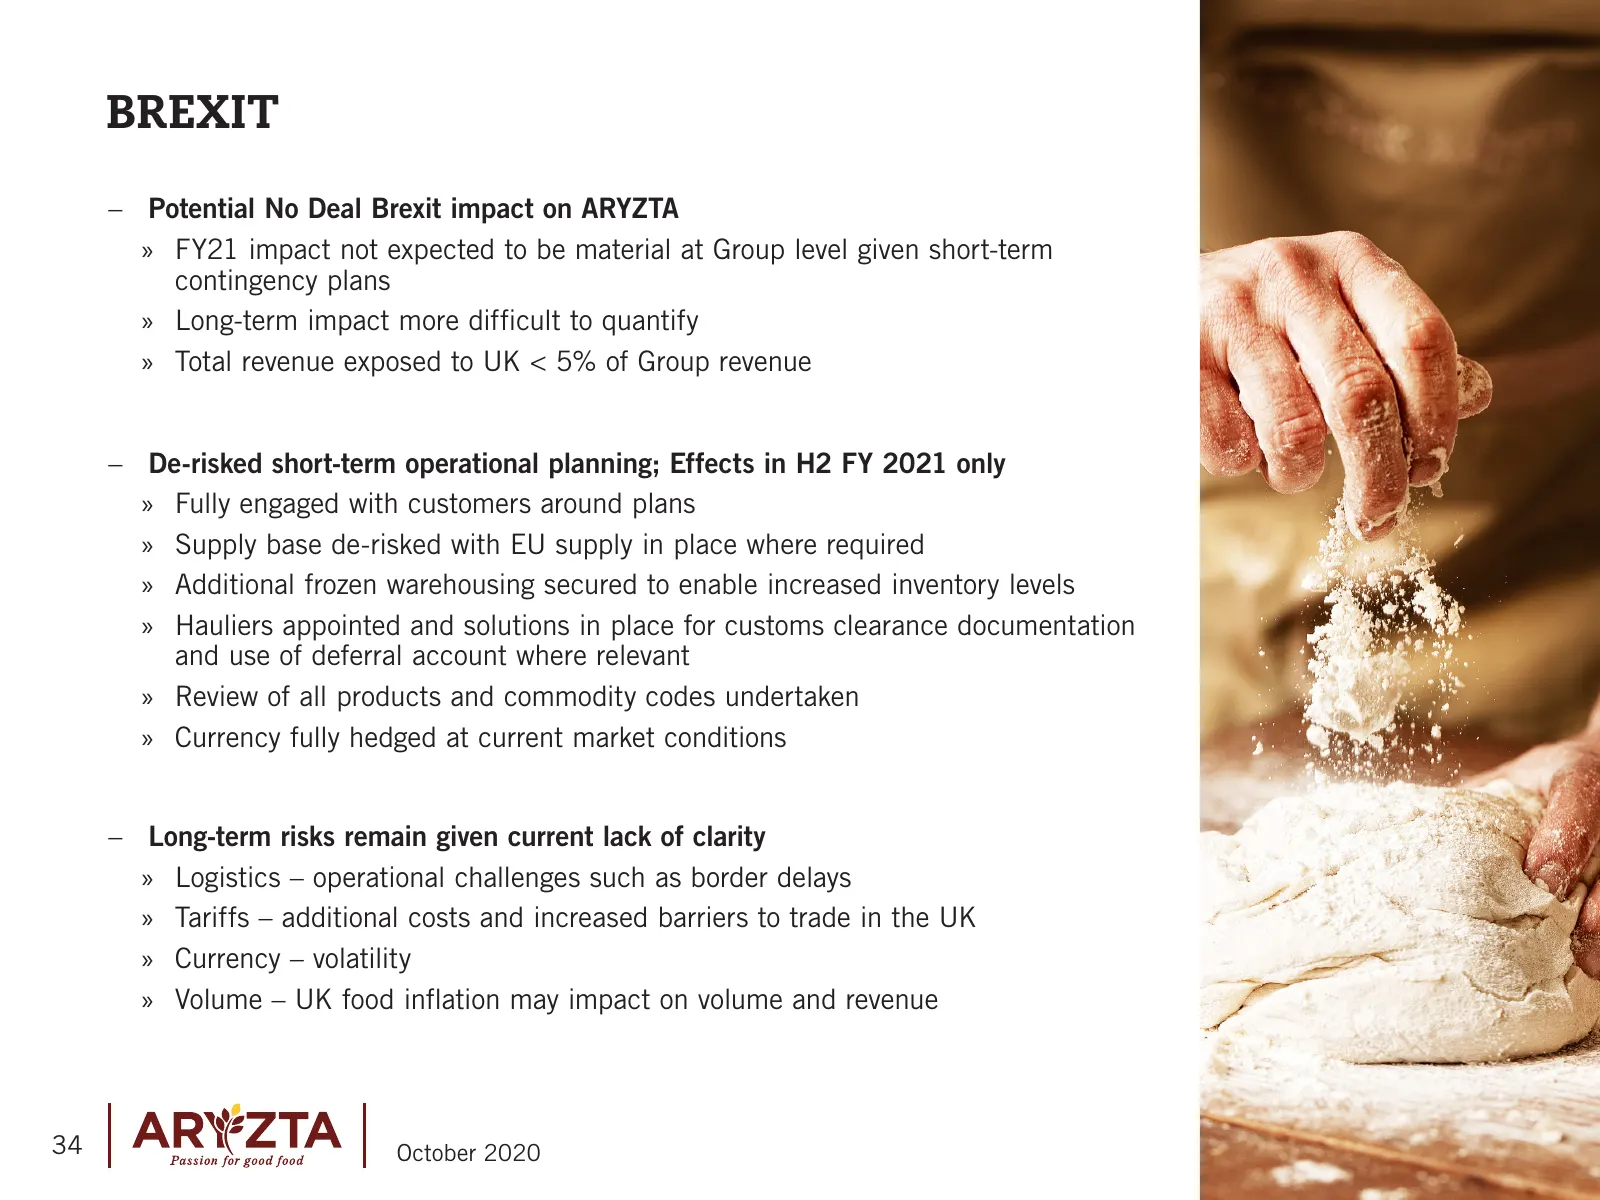
BREXIT –– Potential No Deal Brexit impact on ARYZTA »» FY21 impact not expected to be material at Group level given short-term contingency plans »» Long-term impact more difficult to quantify »» Total revenue exposed to UK < 5% of Group revenue –– De-risked short-term operational planning; Effects i
Slide 35: EUR Closing and Average FX Rates
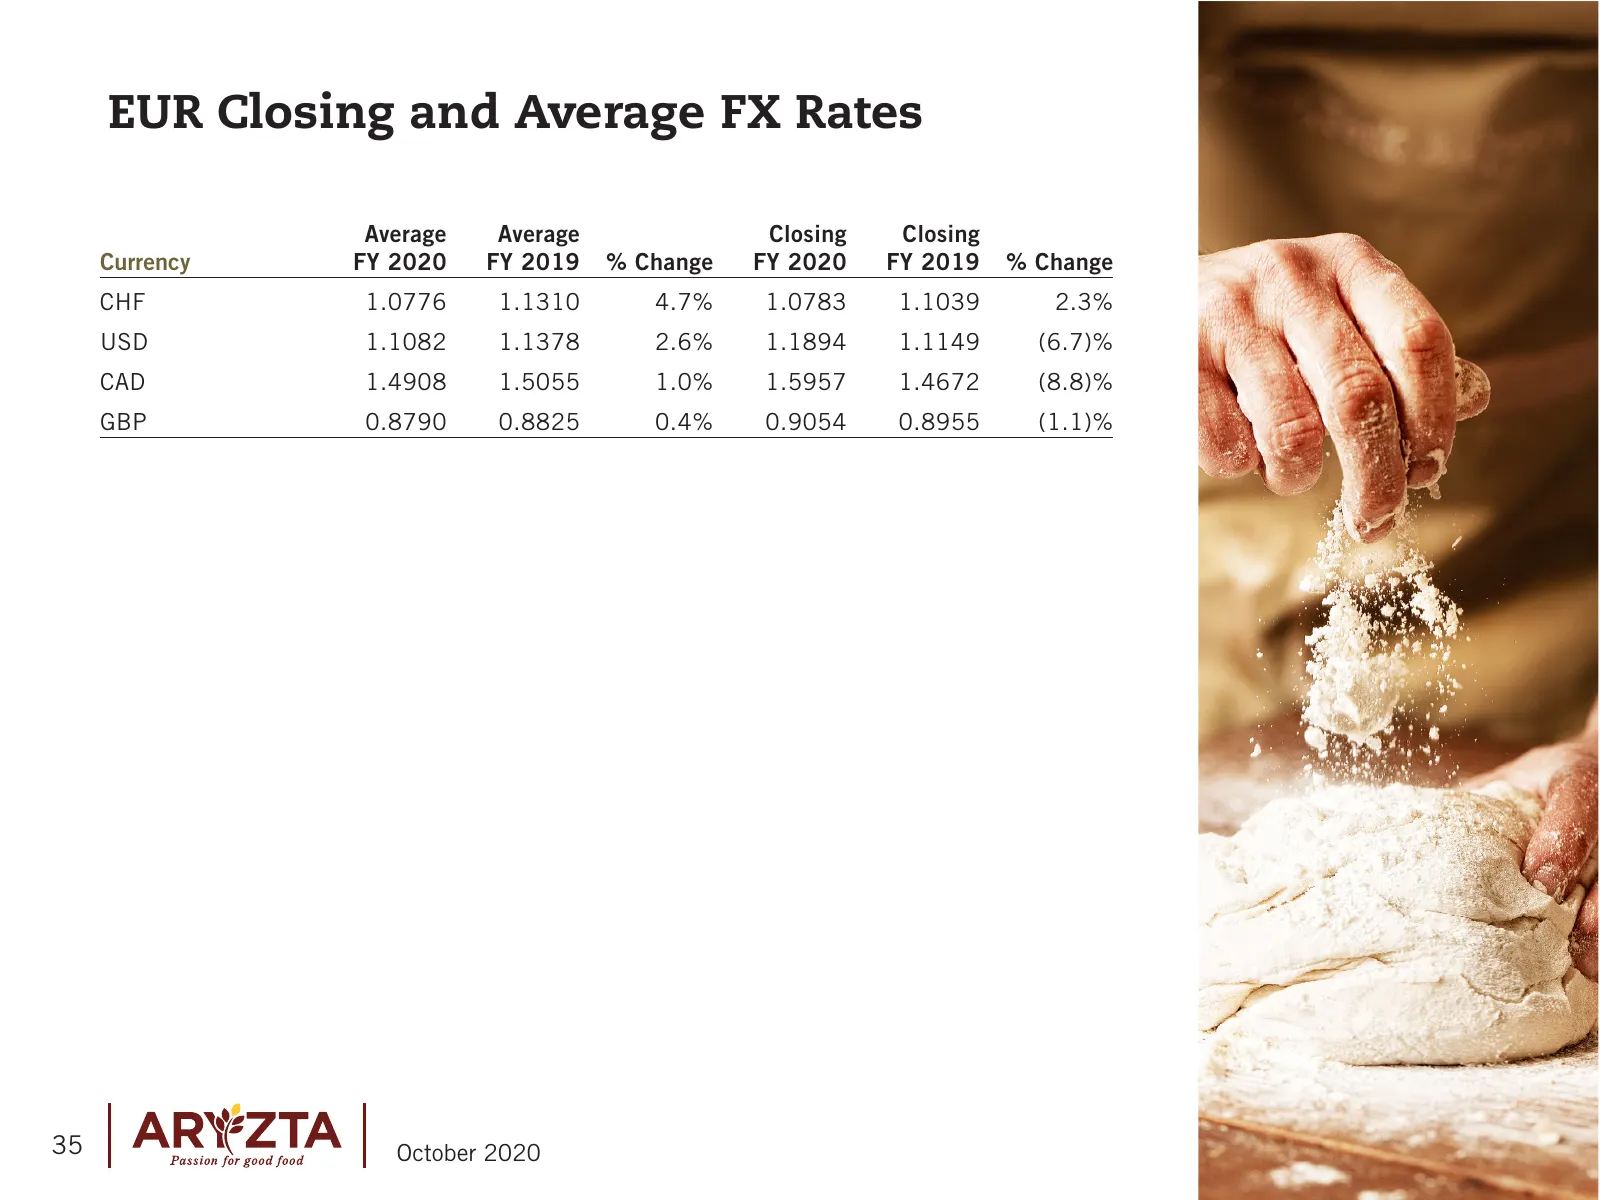
EUR Closing and Average FX Rates Average Average Closing Closing Currency FY 2020 FY 2019 % Change FY 2020 FY 2019 % Change CHF 1.0776 1.1310 4.7% 1.0783 1.1039 2.3% USD 1.1082 1.1378 2.6% 1.1894 1.1149 (6.7)% CAD 1.4908 1.5055 1.0% 1.5957 1.4672 (8.8)% GBP 0.8790 0.8825 0.4% 0.9054 0.8955 (1.1)% 35
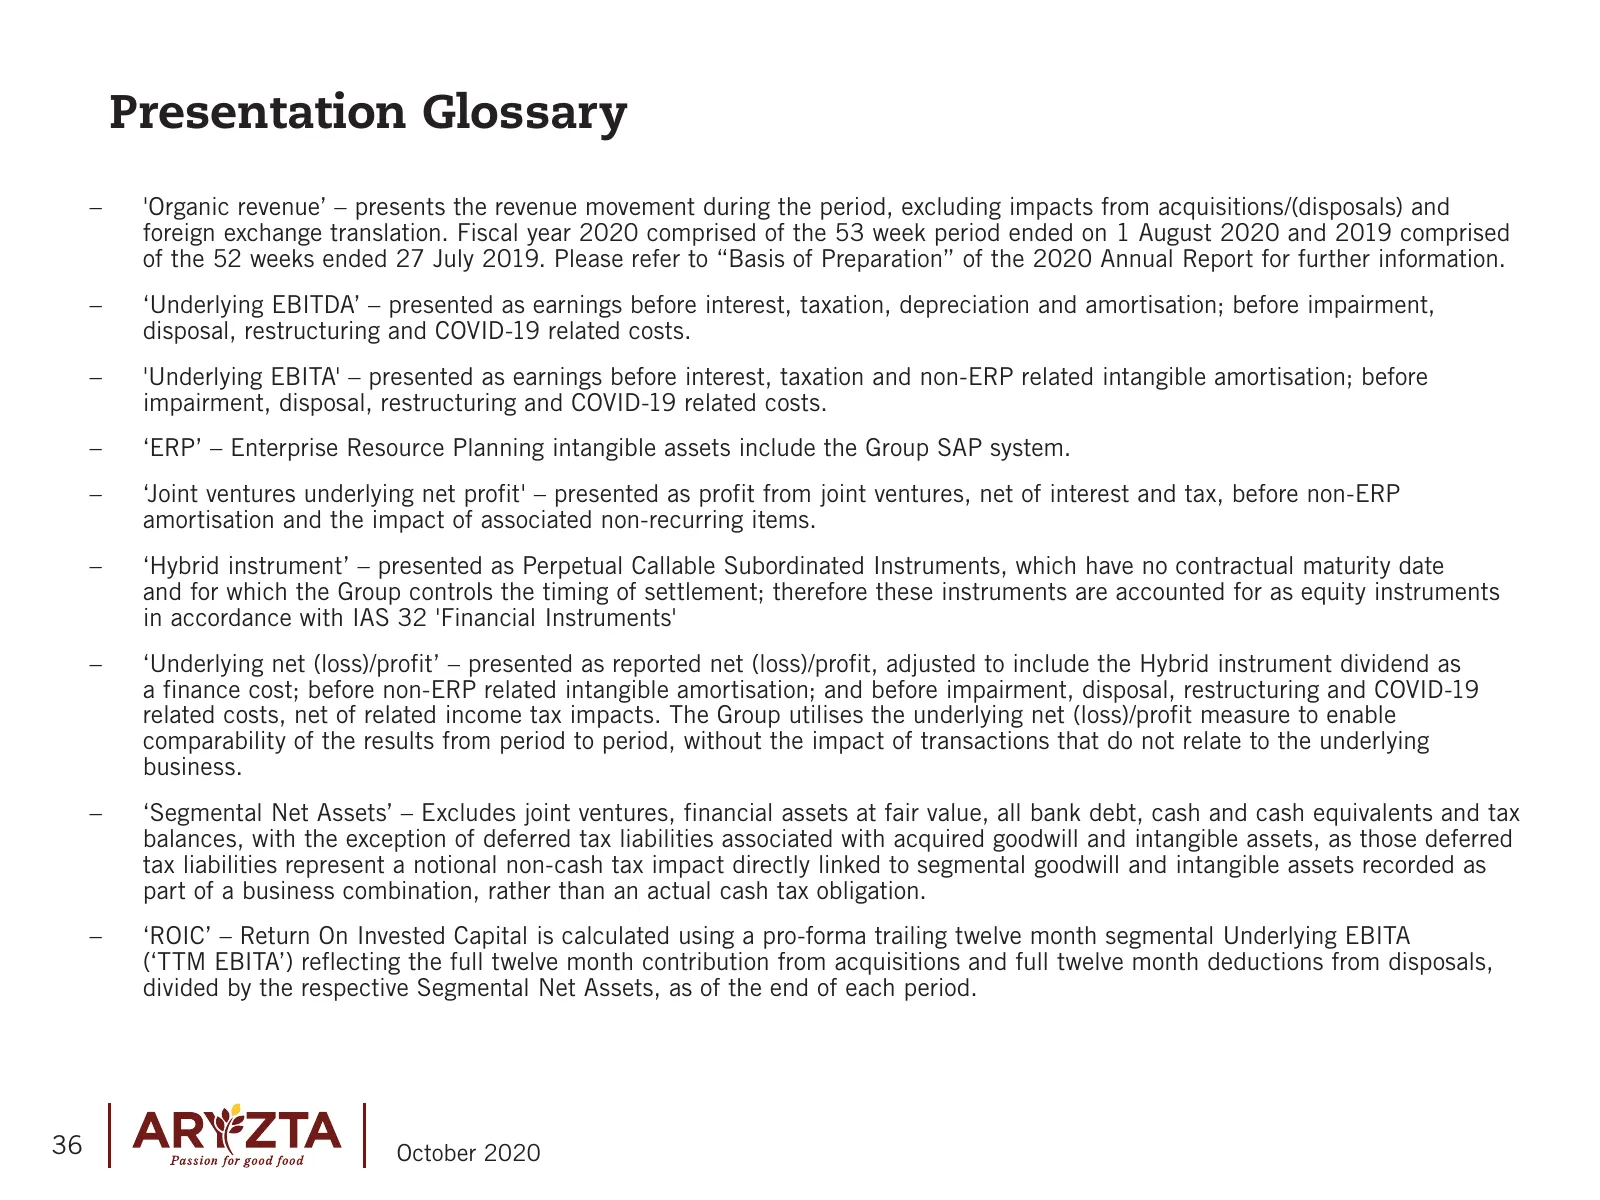
Slide 36: Presentation Glossary
Presentation Glossary –– 'Organic revenue’ – presents the revenue movement during the period, excluding impacts from acquisitions/(disposals) and foreign exchange translation. Fiscal year 2020 comprised of the 53 week period ended on 1 August 2020 and 2019 comprised of the 52 weeks ended 27 July 201
Source: Internet Archive copy of aryzta.com
More decks from Aryzta AG
 H1 2026 Earnings Presentation32 slides · Aug 10, 2026
 FY2025 Earnings Presentation7 slides · Jan 22, 2026
 Q3 2025 Earnings Presentation15 slides · Oct 20, 2025
 H1 2025 Earnings Presentation34 slides · Aug 11, 2025
 Investor Day (May 2025)48 slides · May 7, 2025
 Q1 2025 Earnings Presentation35 slides · Mar 2, 2025