Tellurian — Investor Presentation (November 2021)
36 slides from Tellurian's investor presentation, Nov 3, 2021

Slide 1: Tellurian Inc. Corporate presentation November 2021
Tellurian Inc. November 2021 Corporate presentation
Slide 2: Cautionary statements
Cautionary statements The information in this presentation includes “forward - looking statements” within the meaning of Section 27A of the Securities Act of 1933, as amended, and Section 21E of the Securities Exchange Act of 1934, as amended. All statements other than statements of historical fact
Slide 3: LNG critical to global decarbonization
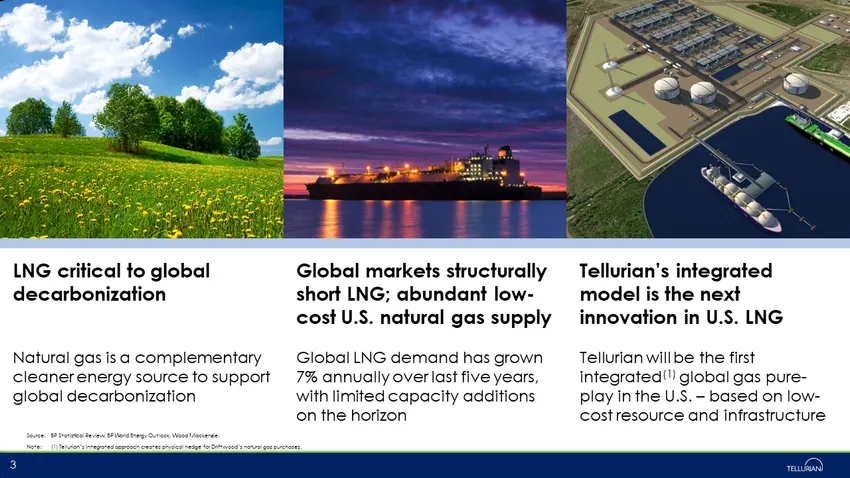
LNG critical to global decarbonization Source: BP Statistical Review, BP World Energy Outlook, Wood Mackenzie. Note: (1) Tellurian’s integrated approach creates physical hedge for Driftwood’s natural gas purchases. Global markets structurally short LNG; abundant low - cost U.S. natural gas supply Te
Slide 4: The integrated Tellurian model is the next innovation in U.S. LNG
The integrated Tellurian model is the next innovation in U.S. LNG
Slide 5: Tellurian executive summary
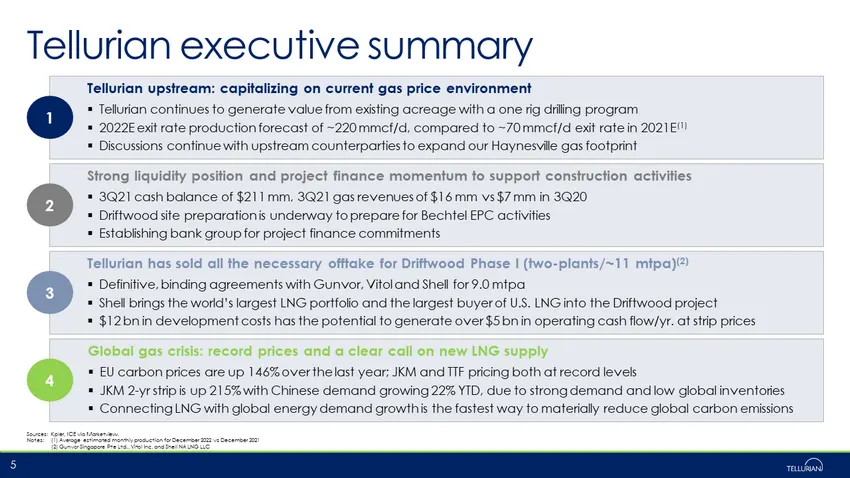
Tellurian executive summary 5 Tellurian has sold all the necessary offtake for Driftwood Phase I (two - plants/~11 mtpa) (2) ▪ Definitive, binding agreements with Gunvor, Vitol and Shell for 9.0 mtpa ▪ Shell brings the world’s largest LNG portfolio and the largest buyer of U.S. LNG into the Driftwoo
Slide 6: Upstream performance
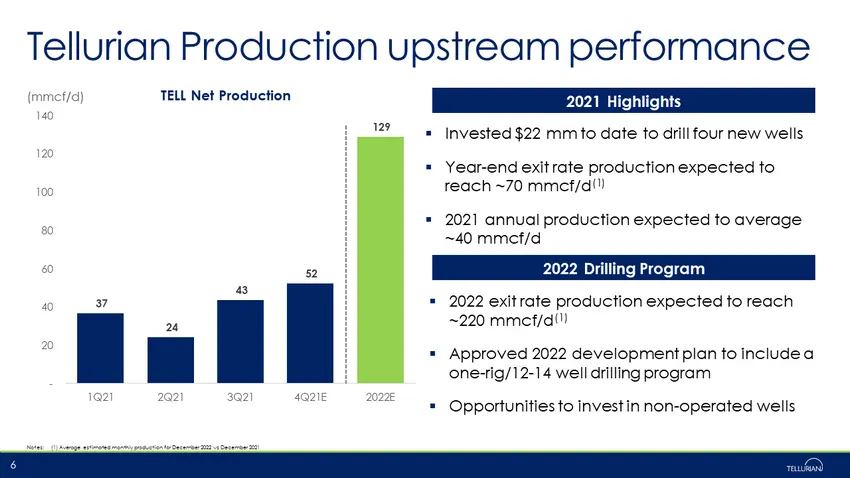
▪ Invested $22 mm to date to drill four new wells ▪ Year - end exit rate production expected to reach ~70 mmcf /d (1) ▪ 2021 annual production expected to average ~40 mmcf /d 37 24 43 52 129 - 20 40 60 80 100 120 140 1Q21 2Q21 3Q21 4Q21E 2022E TELL Net Production ( mmcf /d) Tellurian Production upst
Slide 7: Haynesville Basin: primed for consolidation
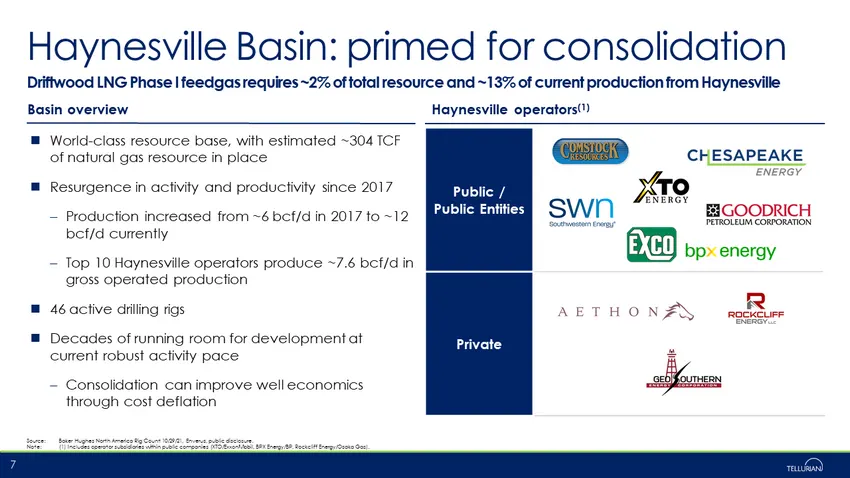
Driftwood LNG Phase I feedgas requires ~2% of total resource and ~13% of current production from Haynesville Public / Public Entities Private World - class resource base, with estimated ~304 TCF of natural gas resource in place Resurgence in activity and productivity since 2017 – Production increase
Slide 8: Tellurian: fully integrated, pure-play LNG
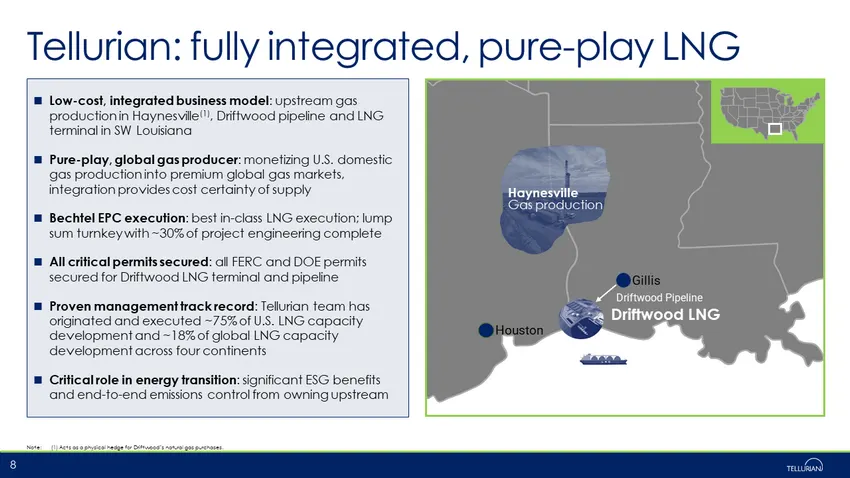
Houston Gillis Haynesville Gas production Driftwood LNG Driftwood Pipeline Tellurian: fully integrated, pure - play LNG 8 Low - cost, integrated business model : upstream gas production in Haynesville (1) , Driftwood pipeline and LNG terminal in SW Louisiana Pure - play, global gas producer : moneti
Slide 9: Phase I Driftwood LNG: sold out
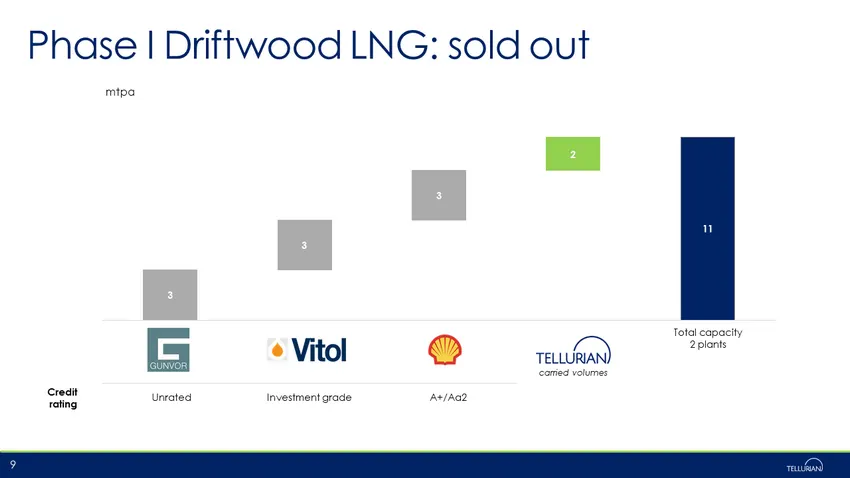
3 11 3 3 2 Total capacity 2 plants Credit rating Unrated Investment grade A+/Aa2 9 carried volumes mtpa Phase I Driftwood LNG: sold out
Slide 10: Preparing Driftwood LNG site for construction
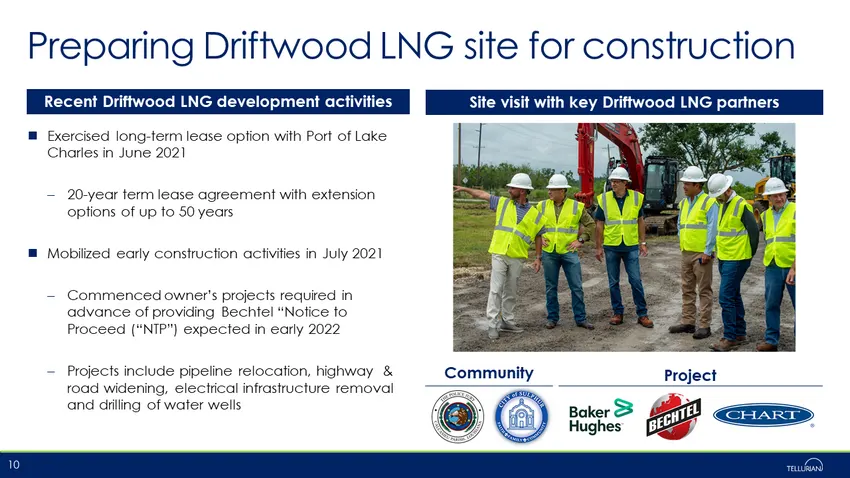
Preparing Driftwood LNG site for construction Exercised long - term lease option with Port of Lake Charles in June 2021 – 20 - year term lease agreement with extension options of up to 50 years Mobilized early construction activities in July 2021 – Commenced owner’s projects required in advance of p
Slide 11: Driftwood LNG Phase I development costs
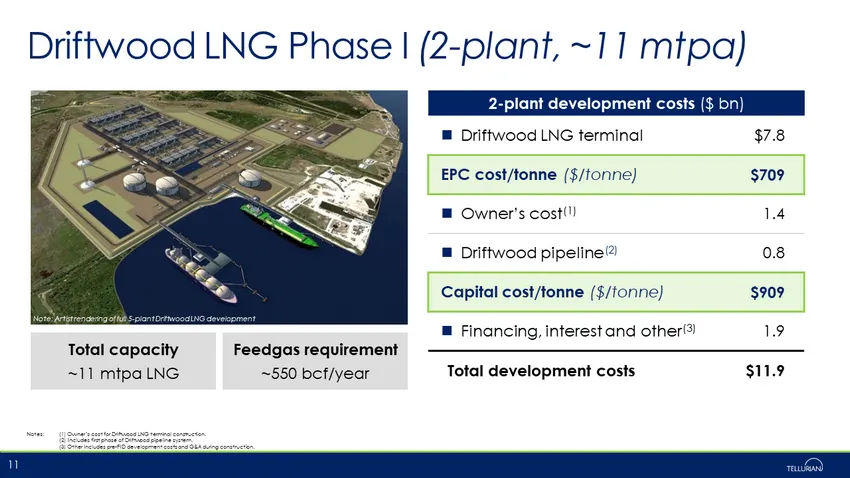
Driftwood LNG Phase I (2 - plant, ~11 mtpa) Notes: (1) Owner’s cost for Driftwood LNG terminal construction. (2) Includes first phase of Driftwood pipeline system. (3) Other includes pre - FID development costs and G&A during construction. 11 2 - plant development costs ($ bn) Driftwood LNG terminal
Slide 12: Illustrative Phase I cash flows @ $14 JKM
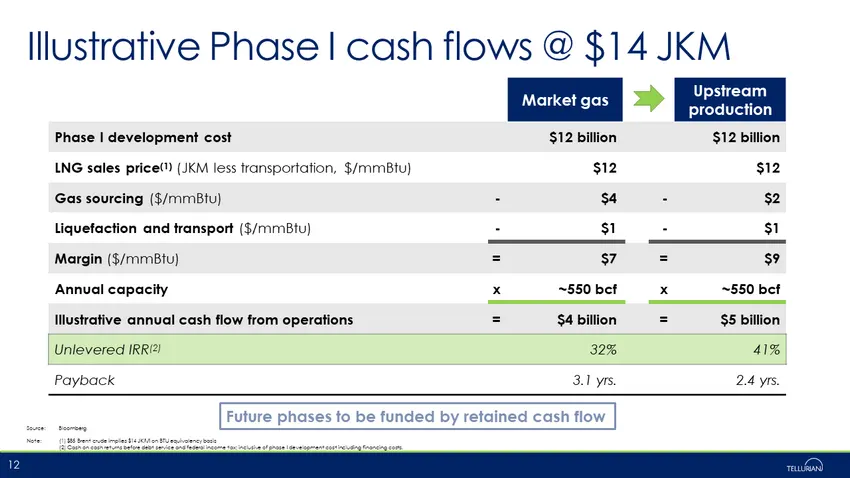
Illustrative Phase I cash flows @ $14 JKM Source: Bloomberg Note: (1) $85 Brent crude implies $14 JKM on BTU equivalency basis (2) Cash on cash returns before debt service and federal income tax; inclusive of phase I development cost including financin g costs. 12 Market gas Upstream production Phas
Slide 13: Global energy crisis: higher for longer
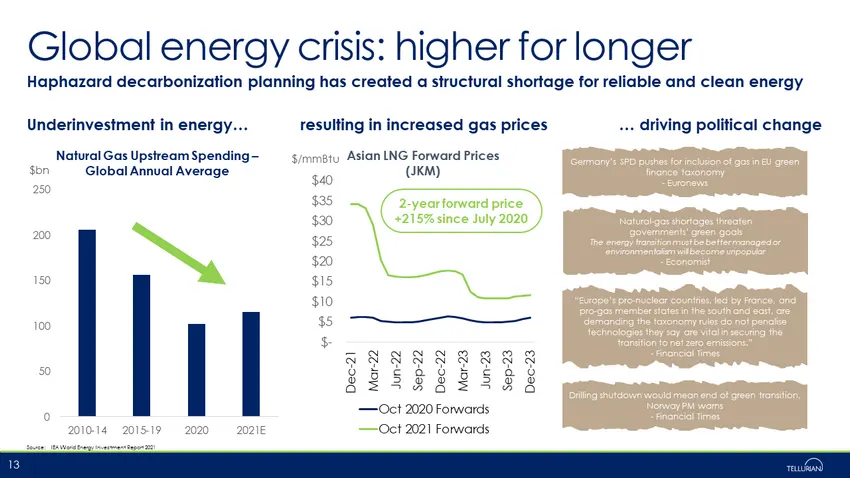
Global energy crisis: higher for longer 0 50 100 150 200 250 2010-14 2015-19 2020 2021E Natural Gas Upstream Spending – Global Annual Average Haphazard decarbonization planning has created a structural shortage for reliable and clean energy Source: IEA World Energy Investment Report 2021 13 Underinv
Slide 14: Low-cost U.S. supply provides global gas arbitrage
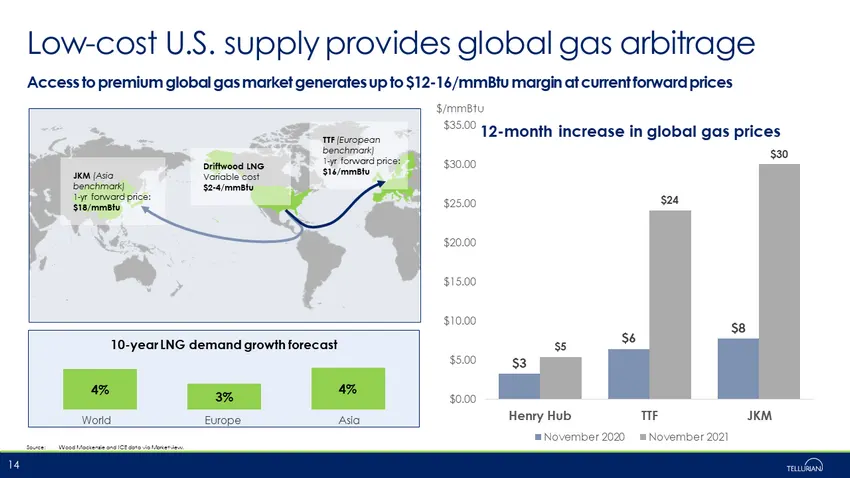
Low - cost U.S. supply provides global gas arbitrage 14 Access to premium global gas market generates up to $12 - 16/ mmBtu margin at current forward prices JKM (Asia benchmark) 1 - yr forward price: $ 18 / mmBtu TTF (European benchmark) 1 - yr forward price: $16/ mmBtu Driftwood LNG Variable cost $
Slide 15: Carbon prices supporting EU gas prices
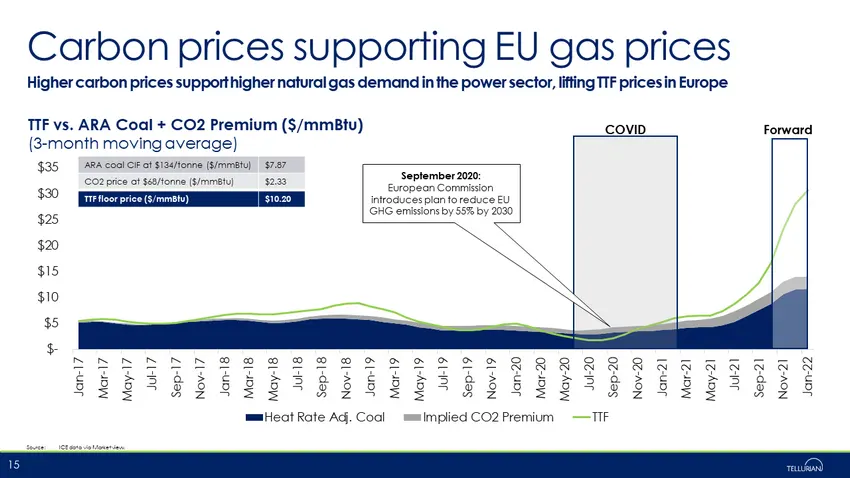
$- $5 $10 $15 $20 $25 $30 $35 Jan-17 Mar-17 May-17 Jul-17 Sep-17 Nov-17 Jan-18 Mar-18 May-18 Jul-18 Sep-18 Nov-18 Jan-19 Mar-19 May-19 Jul-19 Sep-19 Nov-19 Jan-20 Mar-20 May-20 Jul-20 Sep-20 Nov-20 Jan-21 Mar-21 May-21 Jul-21 Sep-21 Nov-21 Jan-22 Heat Rate Adj. Coal Implied CO2 Premium TTF Carbon pr
Slide 16: Upstream and banks to fund Phase I
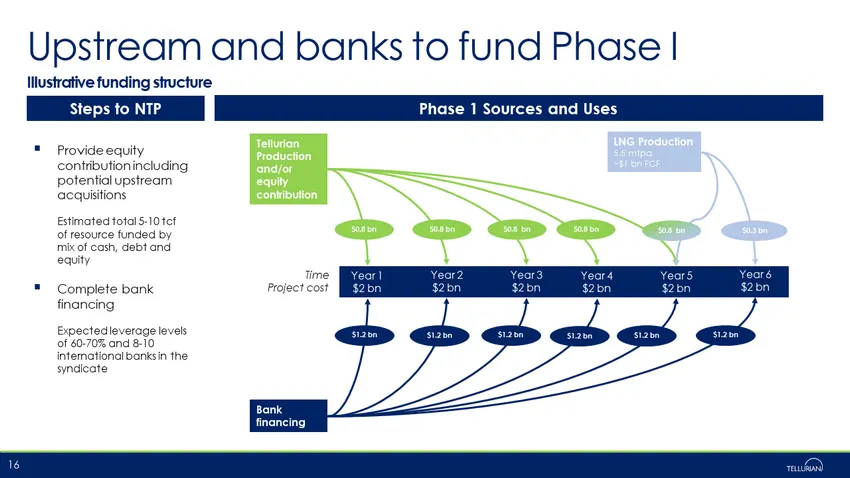
Upstream and banks to fund Phase I Illustrative funding structure 16 Steps to NTP ▪ Provide equity contribution including potential upstream acquisitions Estimated total 5 - 10 tcf of resource funded by mix of cash, debt and equity Phase 1 Sources and Uses Bank financing Year 1 $2 bn Year 2 $2 bn Ye
Slide 17: Notice to Proceed expected in 1Q22
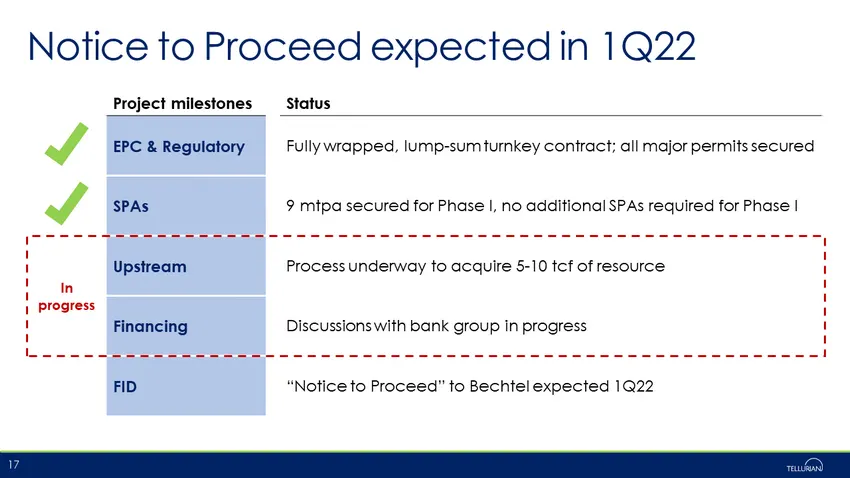
Notice to Proceed expected in 1Q22 17 Project milestones Status EPC & Regulatory Fully wrapped, lump - sum turnkey contract; all major permits secured SPAs 9 mtpa secured for Phase I, no additional SPAs required for Phase I Upstream Process underway to acquire 5 - 10 tcf of resource Financing Discus

Slide 18: Contact us
Contact us ▪ Matt Phillips VP, Investor Relations & Finance +1 832 320 9331 matthew.phillips@tellurianinc.com ▪ Joi Lecznar EVP, Public & Government Affairs +1 832 962 4044 joi.lecznar@tellurianinc.com 18 ▪ Johan Yokay Director , Investor Relations & Finance +1 832 320 9327 johan.yokay@tellurianinc.
Slide 19: Low-cost U.S. natural gas critical in supplying global LNG demand growth
Low - cost U.S. natural gas critical in supplying global LNG demand growth
Slide 20: Gas and LNG fastest growing fuels
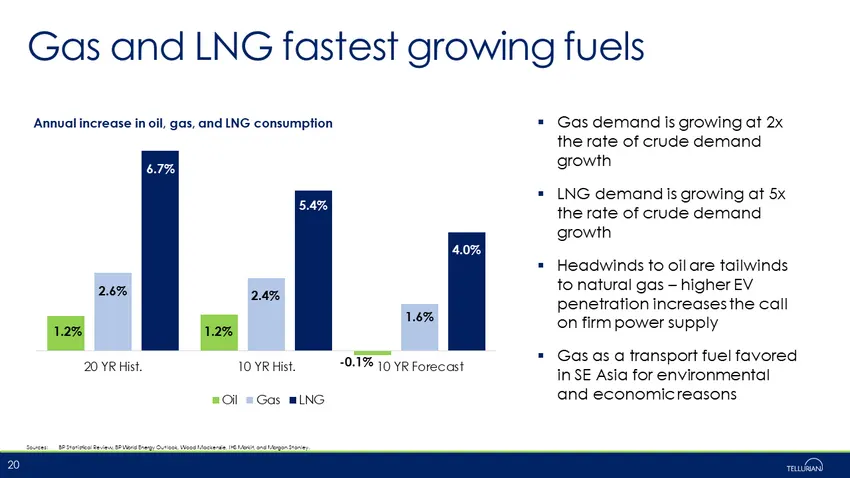
Gas and LNG fastest growing fuels ▪ Gas demand is growing at 2x the rate of crude demand growth ▪ LNG demand is growing at 5x the rate of crude demand growth ▪ Headwinds to oil are tailwinds to natural gas – higher EV penetration increases the call on firm power supply ▪ Gas as a transport fuel favo
Slide 21: Structural factors driving LNG demand
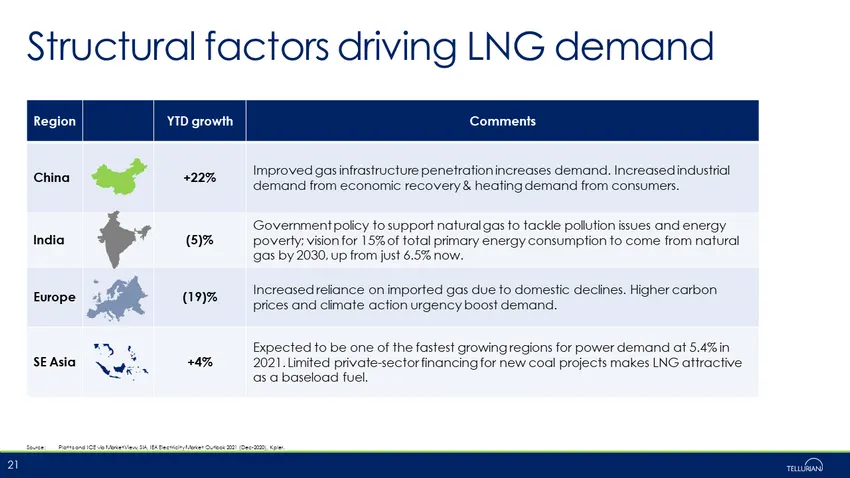
Structural factors driving LNG demand Source: Platts and ICE via MarketView, SIA, IEA Electricity Market Outlook 2021 (Dec - 2020), Kpler . 21 Region YTD growth Comments China +22% Improved gas infrastructure penetration increases demand. Increased industrial demand from economic recovery & heating
Slide 22: Asian LNG demand up 10% this year
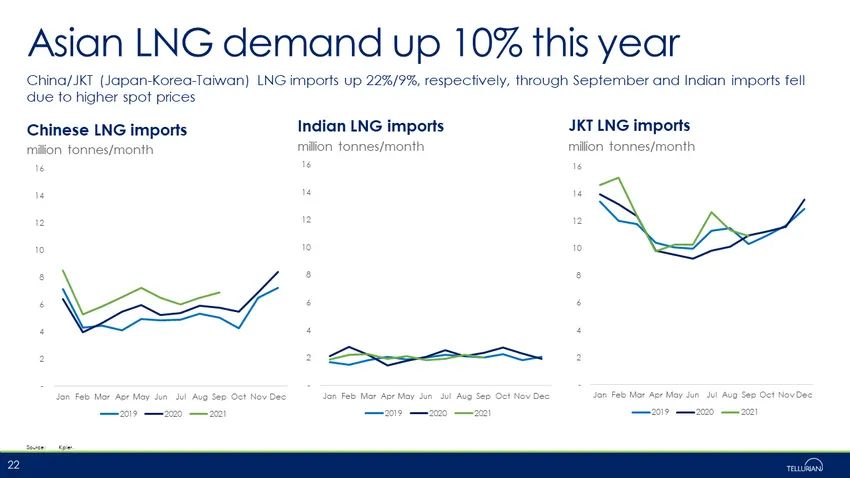
- 2 4 6 8 10 12 14 16 Jan Feb Mar Apr May Jun Jul Aug Sep Oct Nov Dec 2019 2020 2021 Asian LNG demand up 10% this year China/JKT (Japan - Korea - Taiwan) LNG imports up 22%/9%, respectively, through September and Indian imports fell due to higher spot prices 22 Source: Kpler . Chinese LNG imports In
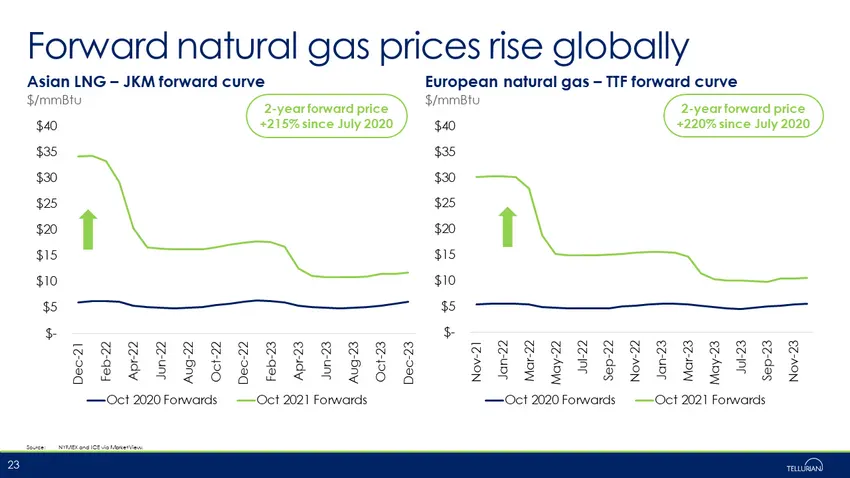
Slide 23: Forward natural gas prices rise globally
$- $5 $10 $15 $20 $25 $30 $35 $40 Dec-21 Feb-22 Apr-22 Jun-22 Aug-22 Oct-22 Dec-22 Feb-23 Apr-23 Jun-23 Aug-23 Oct-23 Dec-23 Oct 2020 Forwards Oct 2021 Forwards Forward natural gas prices rise globally Asian LNG – JKM forward curve European natural gas – TTF forward curve 23 $/ mmBtu $/ mmBtu Source
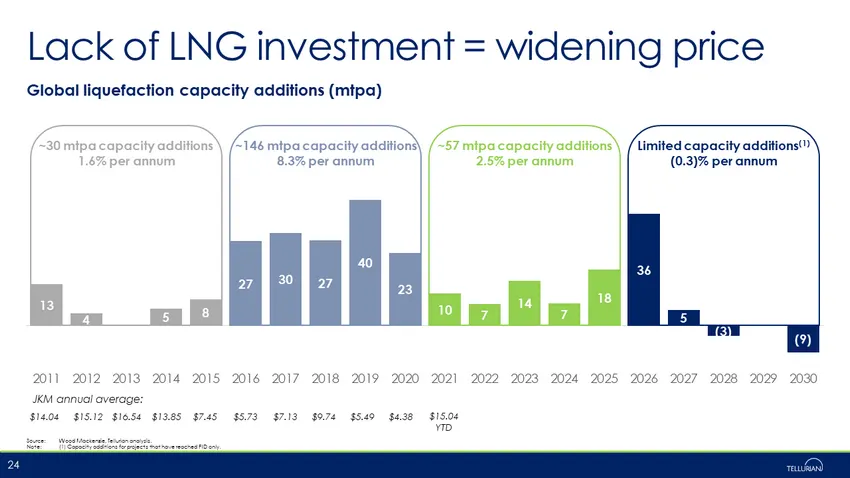
Slide 24: Lack of LNG investment = widening price
Lack of LNG investment = widening price Source: Wood Mackenzie, Tellurian analysis. Note: (1) Capacity additions for projects that have reached FID only. 24 13 4 (0) 5 8 27 30 27 40 23 10 7 14 7 18 36 5 (3) -- (9) 2011 2012 2013 2014 2015 2016 2017 2018 2019 2020 2021 2022 2023 2024 2025 2026 2027 2
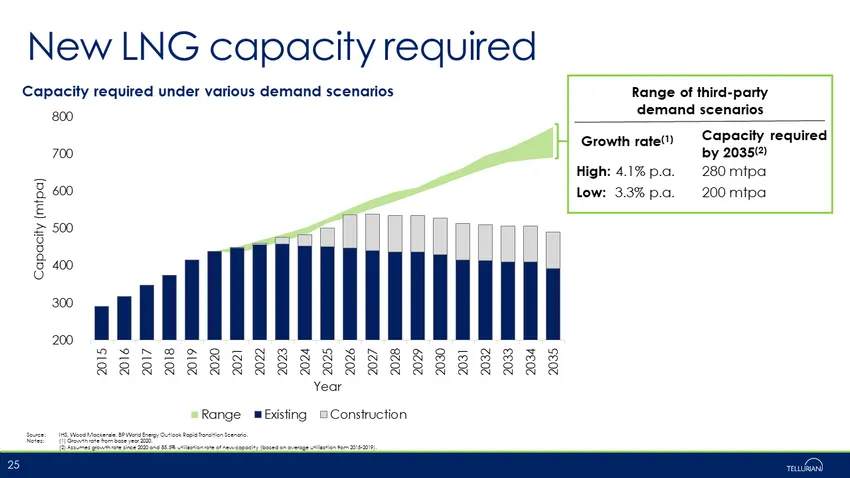
Slide 25: New LNG capacity required
New LNG capacity required Source: IHS, Wood Mackenzie, BP World Energy Outlook Rapid Transition Scenario. Notes: (1) Growth rate from base year 2020. (2) Assumes growth rate since 2020 and 85.5% utilization rate of new capacity (based on average utilization from 2015 - 2019). 25 Range of third - par

Slide 26: LNG critical to global decarbonization
LNG critical to global decarbonization
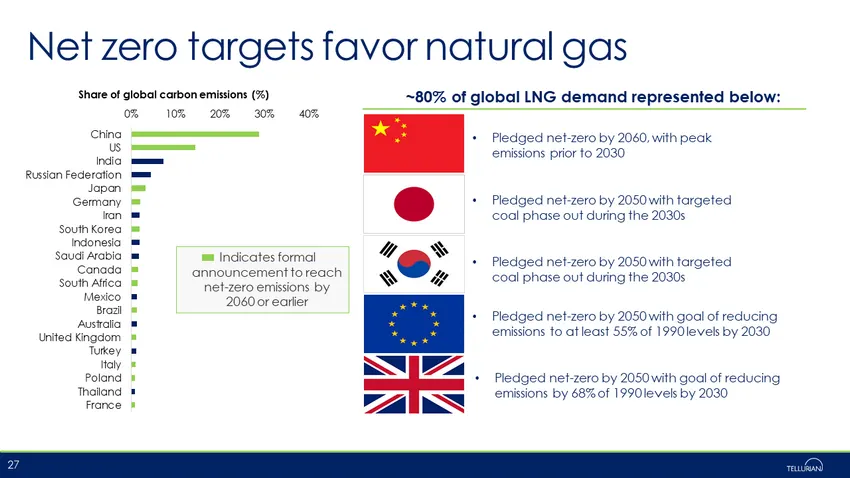
Slide 27: Net zero targets favor natural gas
Indicates formal announcement to reach net - zero emissions by 2060 or earlier Net zero targets favor natural gas 27 ~80% of global LNG demand represented below: • Pledged net - zero by 2060, with peak emissions prior to 2030 • Pledged net - zero by 2050 with targeted coal phase out during the 2030s
Slide 28: Carbon reduction: the U.S. template works
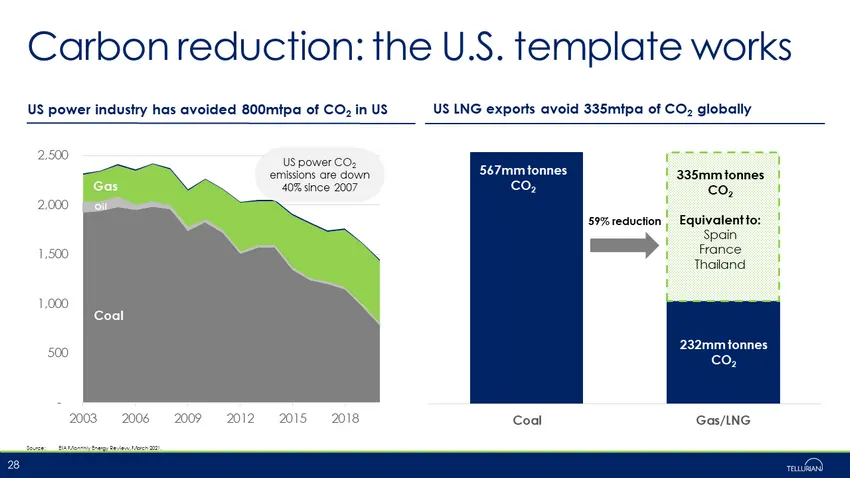
Carbon reduction: the U.S. template works 28 US power industry has avoided 800mtpa of CO 2 in US Source: EIA Monthly Energy Review, March 2021. Coal Gas/LNG 567mm tonnes CO 2 335mm tonnes CO 2 Equivalent to: Spain France Thailand 232mm tonnes CO 2 59% reduction US LNG exports avoid 335mtpa of CO 2 g
Slide 29: Carbon reduction is exportable
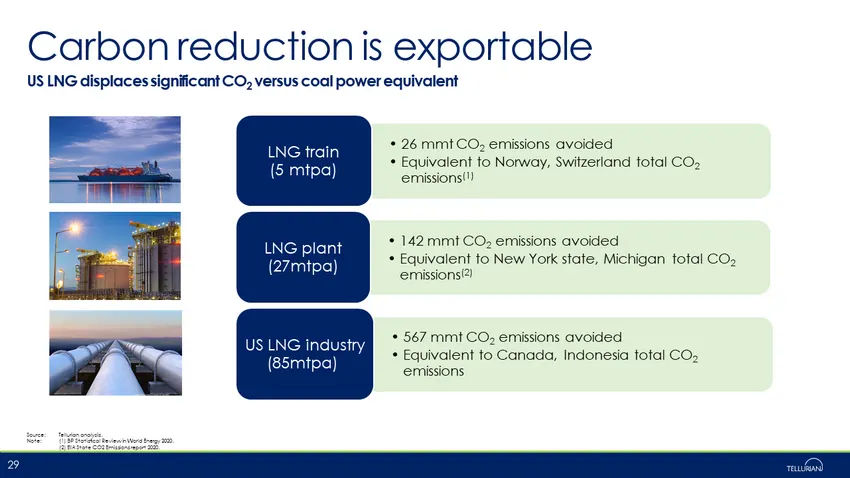
Carbon reduction is exportable Source: Tellurian analysis. Note: (1) BP Statistical Review in World Energy 2020. (2) EIA State CO2 Emissions report 2020. 29 US LNG displaces significant CO 2 versus coal power equivalent • 26 mmt CO 2 emissions avoided • Equivalent to Norway, Switzerland total CO 2 e
Slide 30: Air quality improvements with LNG imports
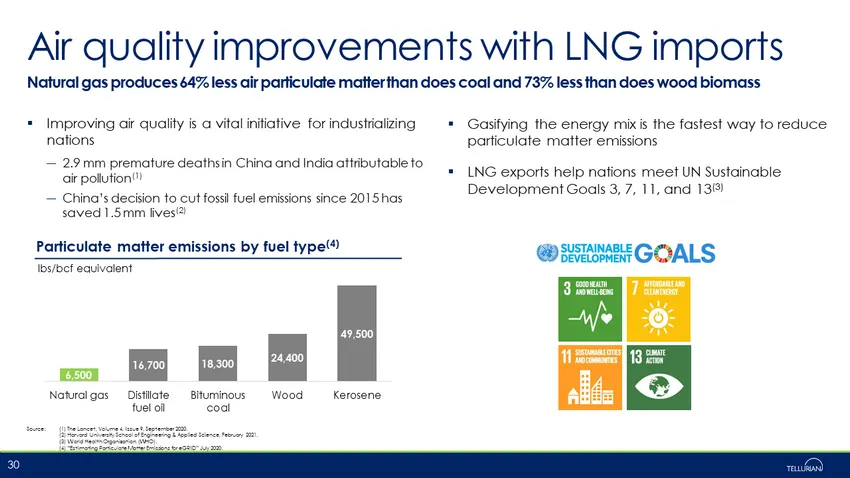
Air quality improvements with LNG imports Natural gas produces 64% less air particulate matter than does coal and 73% less than does wood biomass ▪ Improving air quality is a vital initiative for industrializing nations ― 2.9 mm premature deaths in China and India attributable to air pollution (1) ―
Slide 31: China decarbonization requires natural gas
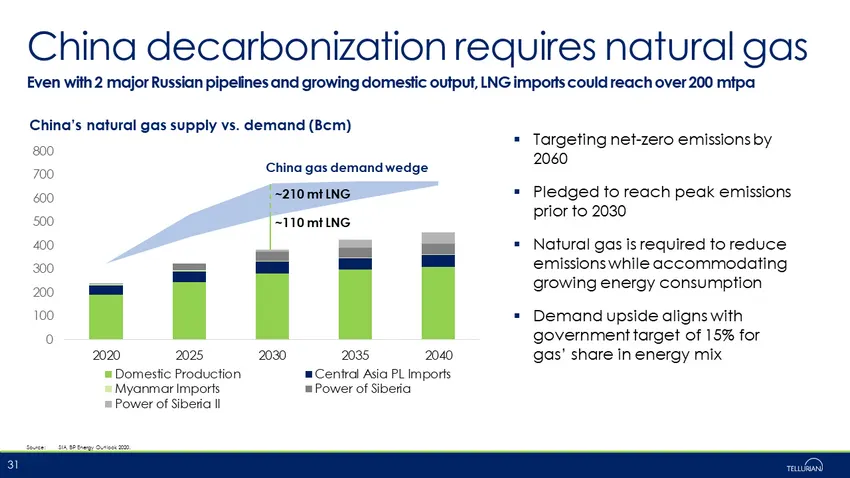
China decarbonization requires natural gas Even with 2 major Russian pipelines and growing domestic output, LNG imports could reach over 200 mtpa ▪ Targeting net - zero emissions by 2060 ▪ Pledged to reach peak emissions prior to 2030 ▪ Natural gas is required to reduce emissions while accommodating
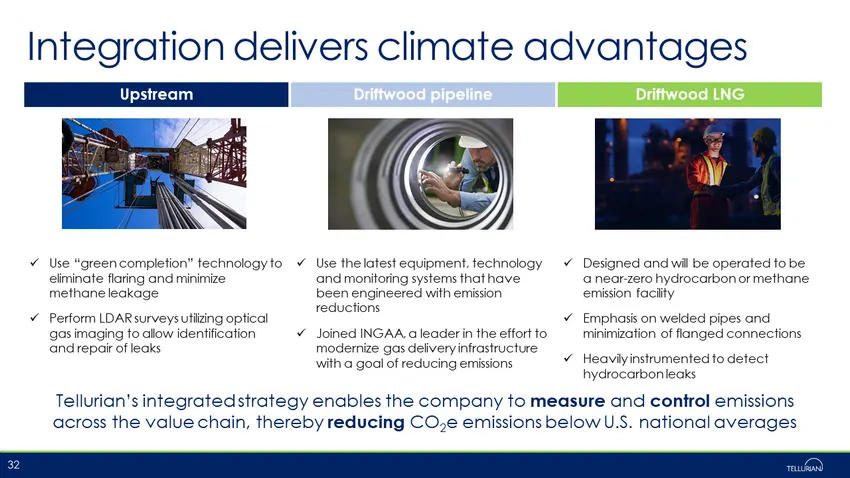
Slide 32: Integration delivers climate advantages
Upstream Driftwood pipeline Driftwood LNG x Use “green completion” technology to eliminate flaring and minimize methane leakage x Perform LDAR surveys utilizing optical gas imaging to allow identification and repair of leaks x Use the latest equipment, technology and monitoring systems that have bee
Slide 33: Appendix: Driftwood LNG details
Appendix: Driftwood LNG details
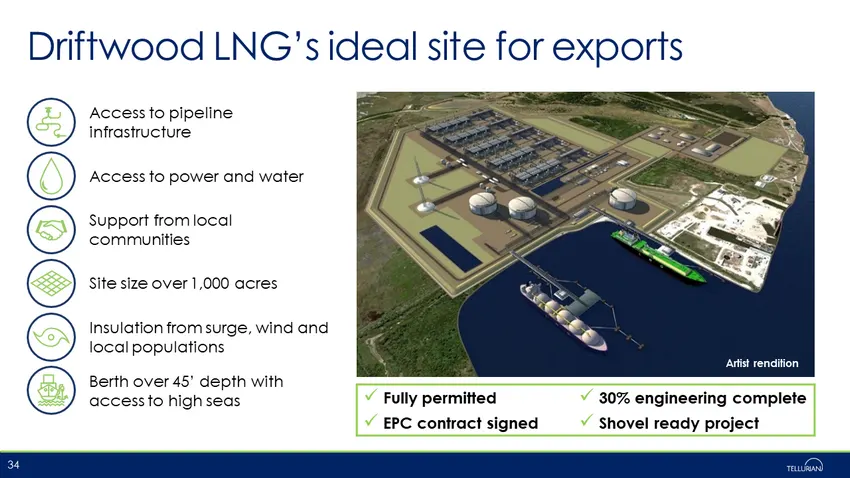
Slide 34: Driftwood LNG's ideal site for exports
Driftwood LNG’s ideal site for exports 34 Access to power and water Berth over 45’ depth with access to high seas Support from local communities Access to pipeline infrastructure Site size over 1,000 acres Insulation from surge, wind and local populations Artist rendition x Fully permitted x 30% eng
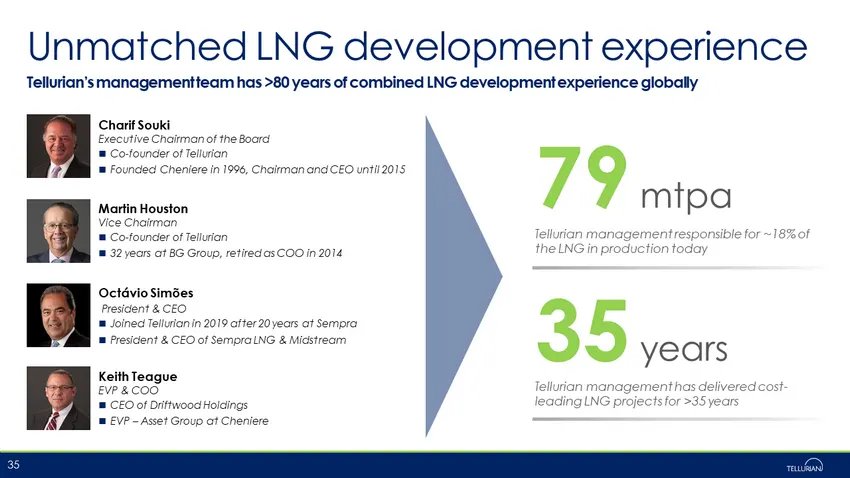
Slide 35: Unmatched LNG development experience
Unmatched LNG development experience Tellurian’s management team has >80 years of combined LNG development experience globally 35 Charif Souki Executive Chairman of the Board Co - founder of Tellurian Founded Cheniere in 1996, Chairman and CEO until 2015 Martin Houston Vice Chairman Co - founder of
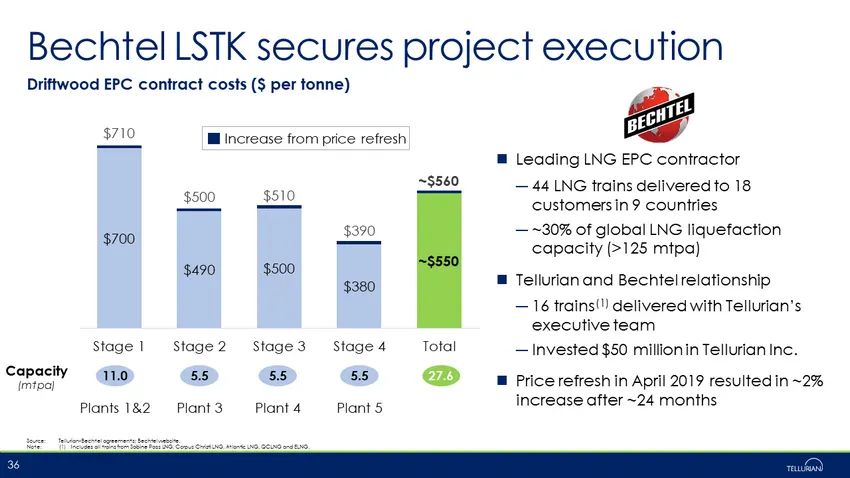
Slide 36: Bechtel LSTK secures project execution
$700 $490 $500 $380 ~$550 $710 $500 $510 $390 ~ $560 Stage 1 Stage 2 Stage 3 Stage 4 Total Bechtel LSTK secures project execution Leading LNG EPC contractor ― 44 LNG trains delivered to 18 customers in 9 countries ― ~30% of global LNG liquefaction capacity (>125 mtpa) Tellurian and Bechtel relations
Source: SEC EDGAR · 8-K filed Nov 3, 2021
More decks from Tellurian Inc
 Merger or Acquisition (July 2024)27 slides · Jul 22, 2024
 Investor Presentation (March 2024)16 slides · Mar 4, 2024
 Investor Presentation (August 2023)20 slides · Aug 7, 2023
 Investor Presentation (May 2023)20 slides · May 3, 2023
 Investor Presentation (February 2023)21 slides · Feb 22, 2023
 Investor Presentation (November 2022)19 slides · Nov 2, 2022