Kimball International — Investor Presentation (December 2015)
35 slides from Kimball International's investor presentation, Dec 10, 2015

Slide 1: Investor Presentation December 2015
176 0 0 137 132 126 237 23 23 46 46 46 51 132 156 252 202 59 Investor Presentation December 2015 Exhibit 99.1
Slide 2: Safe Harbor Statement
176 0 0 137 132 126 237 23 23 46 46 46 51 132 156 252 202 59 Page 2 Safe Harbor Statement Certain statements contained within this presentation may be considered forward-looking under the Private Securities Litigation Reform Act of 1995 and are subject to risks and uncertainties including, but not l
Slide 3: Who We Are
176 0 0 137 132 126 237 23 23 46 46 46 51 132 156 252 202 59 Page 3 We are a leading manufacturer of design driven, technology savvy, high quality furnishings providing solutions for the workplace, learning, healing, and hospitality environments. Our unifying bond throughout everything we do is our
Slide 4: Vertical Markets We Serve
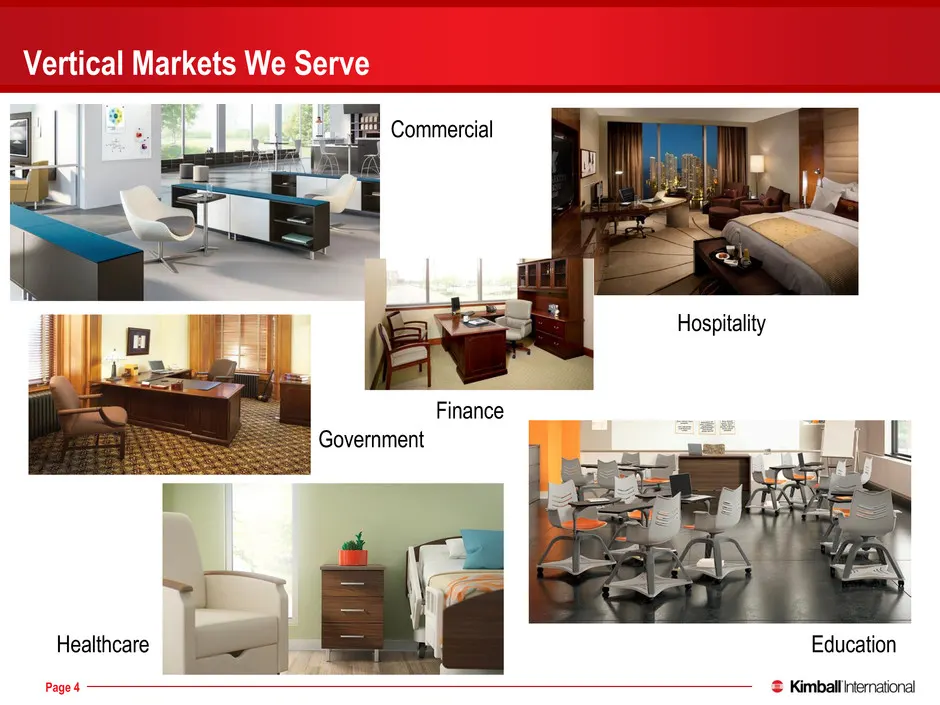
176 0 0 137 132 126 237 23 23 46 46 46 51 132 156 252 202 59 Page 4 Vertical Markets We Serve Commercial Government Hospitality Education Healthcare Finance
Slide 5: Our Brands and Who We Serve
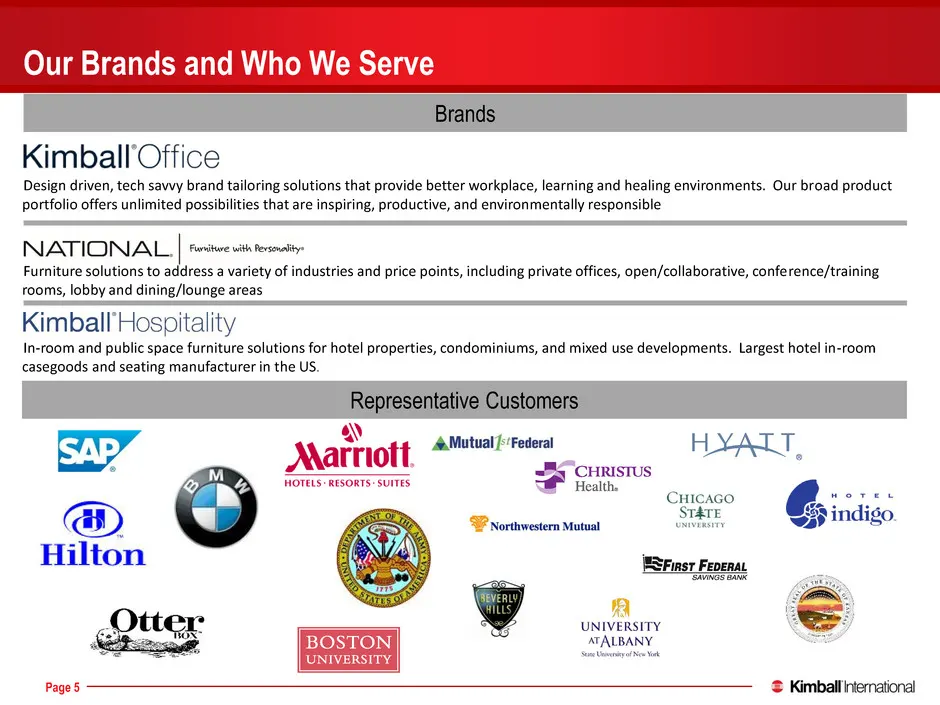
176 0 0 137 132 126 237 23 23 46 46 46 51 132 156 252 202 59 Page 5 Brands Representative Customers Design driven, tech savvy brand tailoring solutions that provide better workplace, learning and healing environments. Our broad product portfolio offers unlimited possibilities that are inspiring, pro
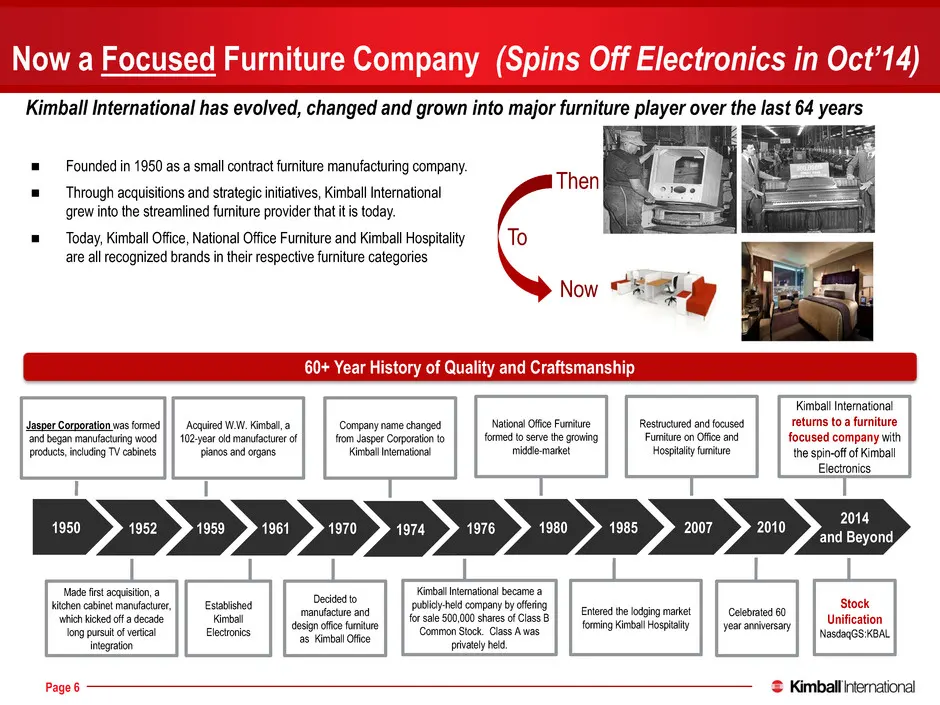
Slide 6: Now a Focused Furniture Company: 60+ Year History
176 0 0 137 132 126 237 23 23 46 46 46 51 132 156 252 202 59 Page 6 Now a Focused Furniture Company (Spins Off Electronics in Oct’14) 60+ Year History of Quality and Craftsmanship Founded in 1950 as a small contract furniture manufacturing company. Through acquisitions and strategic initiatives,
Slide 7: Why Invest in Us
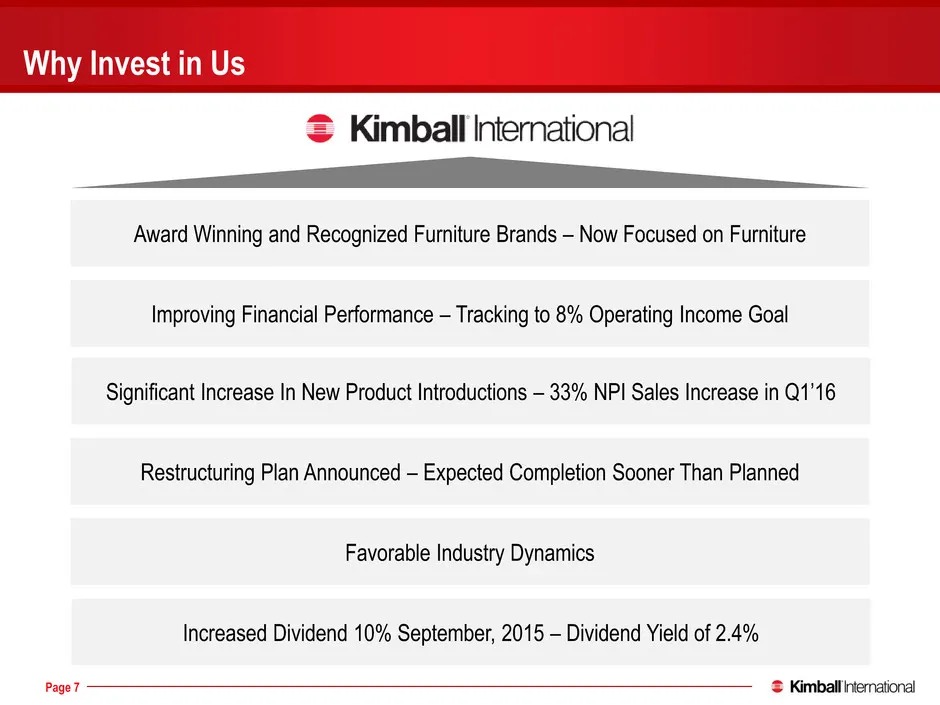
176 0 0 137 132 126 237 23 23 46 46 46 51 132 156 252 202 59 Page 7 Award Winning and Recognized Furniture Brands – Now Focused on Furniture Favorable Industry Dynamics Increased Dividend 10% September, 2015 – Dividend Yield of 2.4% Restructuring Plan Announced – Expected Completion Sooner Than Plan
Slide 8: A New Day: Key Operating Changes
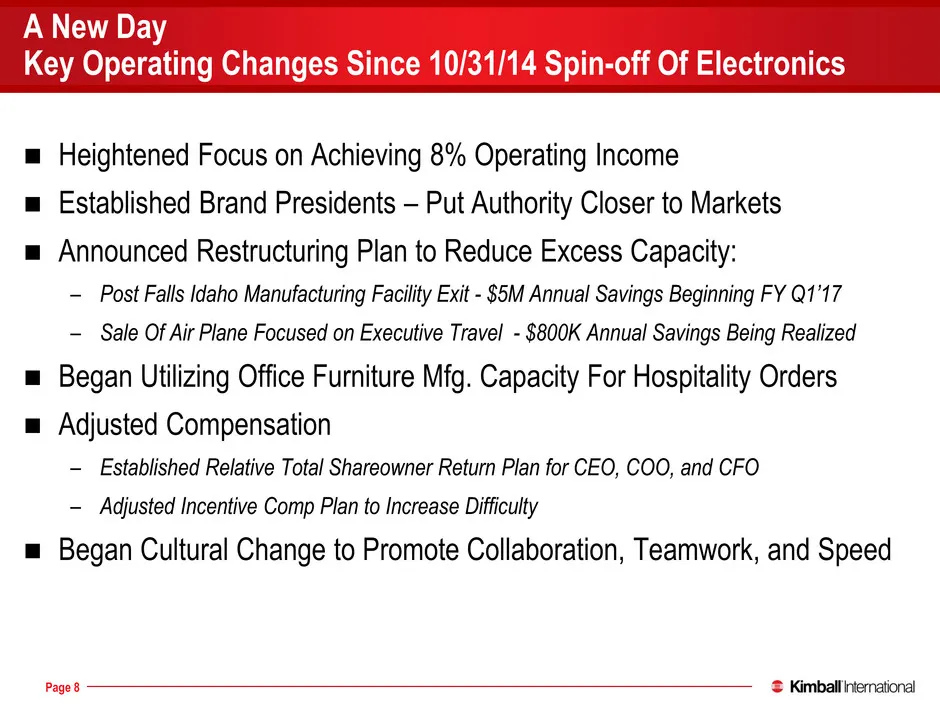
176 0 0 137 132 126 237 23 23 46 46 46 51 132 156 252 202 59 Page 8 Heightened Focus on Achieving 8% Operating Income Established Brand Presidents – Put Authority Closer to Markets Announced Restructuring Plan to Reduce Excess Capacity: – Post Falls Idaho Manufacturing Facility Exit - $5M Annu
Slide 9: A New Day: Key Governance Changes
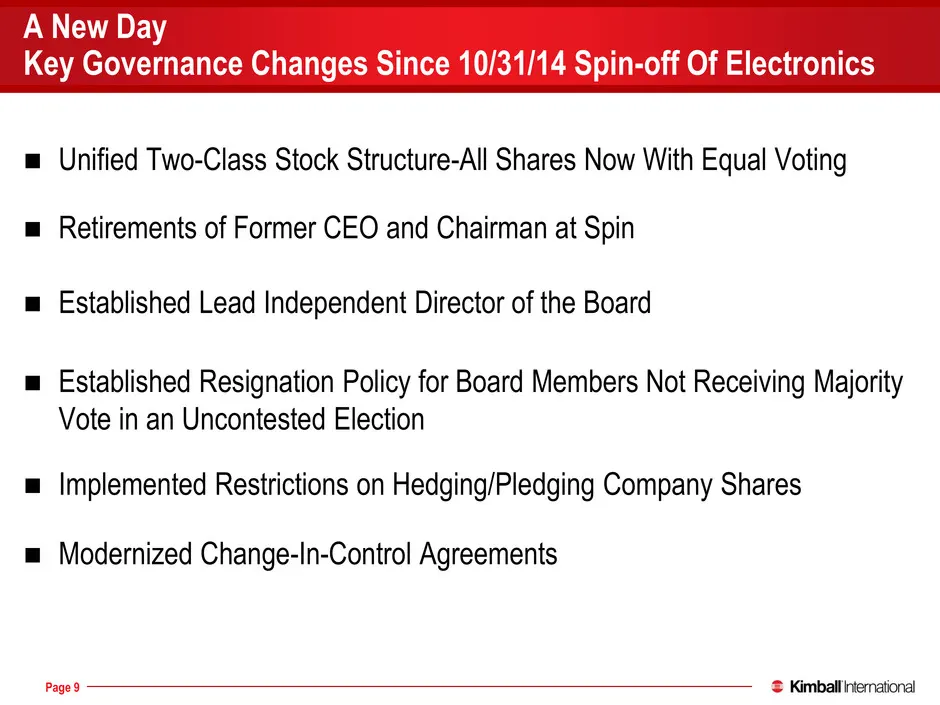
176 0 0 137 132 126 237 23 23 46 46 46 51 132 156 252 202 59 Page 9 Established Lead Independent Director of the Board A New Day Key Governance Changes Since 10/31/14 Spin-off Of Electronics Unified Two-Class Stock Structure-All Shares Now With Equal Voting Established Resignation Policy for B
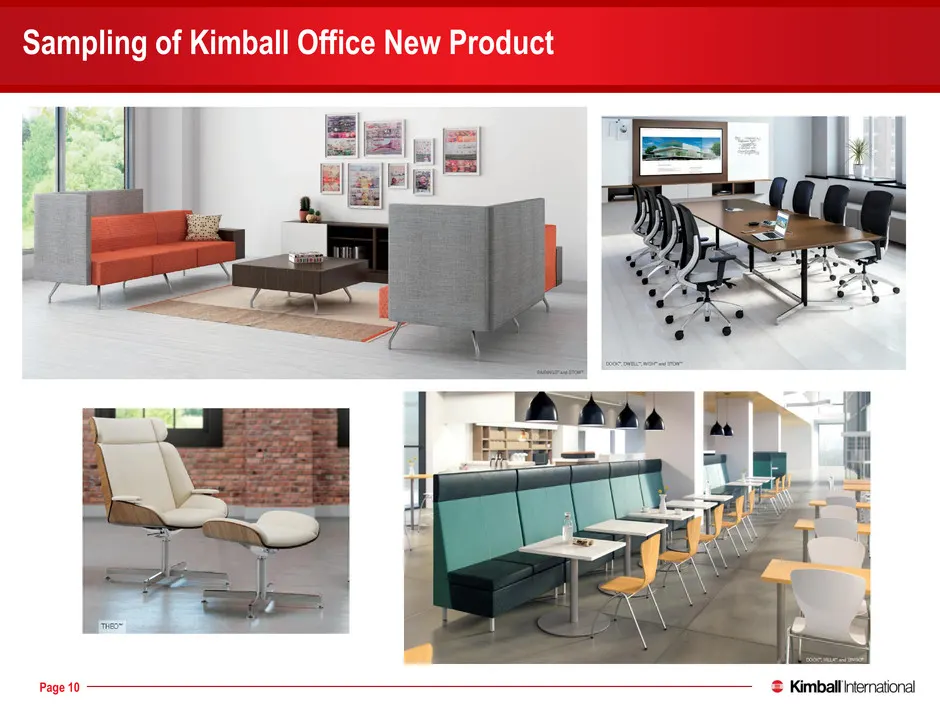
Slide 10: Sampling of Kimball Office New Product
176 0 0 137 132 126 237 23 23 46 46 46 51 132 156 252 202 59 Page 10 Sampling of Kimball Office New Product
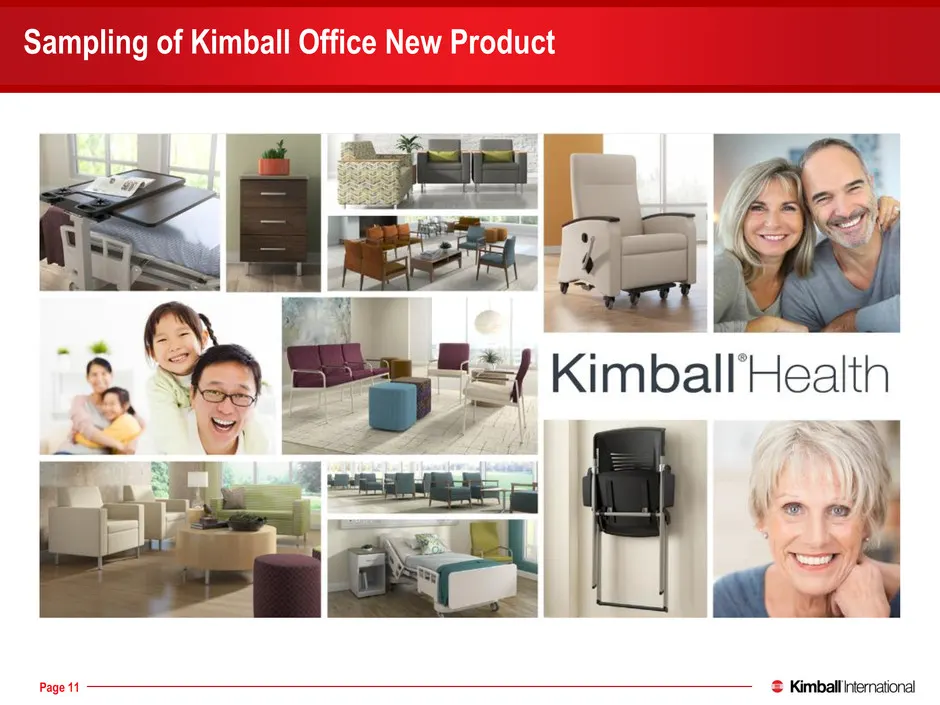
Slide 11: Sampling of Kimball Office New Product
176 0 0 137 132 126 237 23 23 46 46 46 51 132 156 252 202 59 Page 11 Sampling of Kimball Office New Product
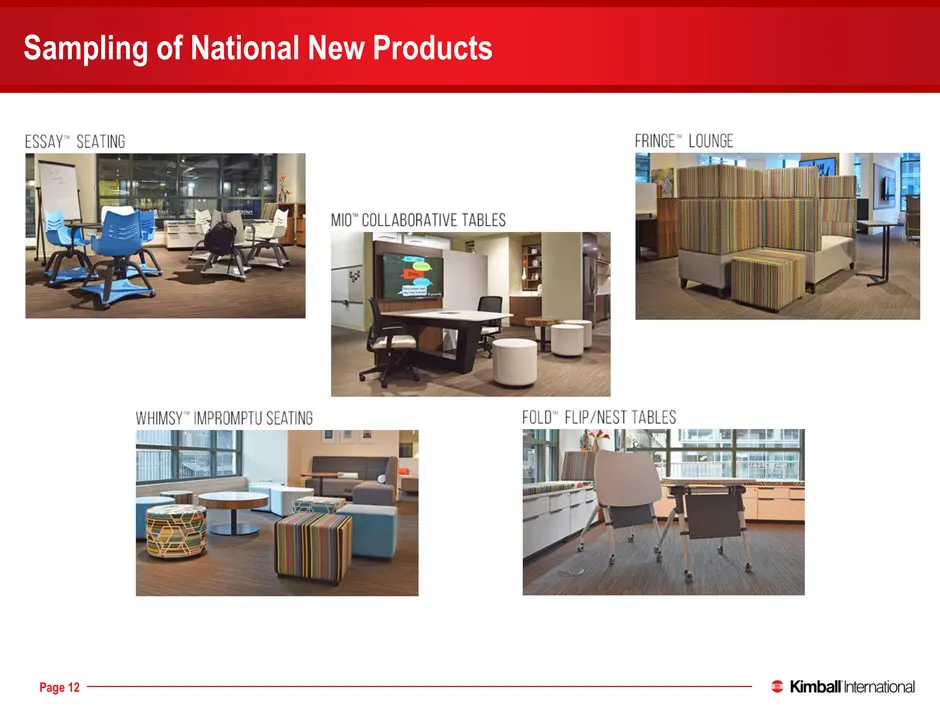
Slide 12: Sampling of National New Products
176 0 0 137 132 126 237 23 23 46 46 46 51 132 156 252 202 59 Page 12 Sampling of National New Products
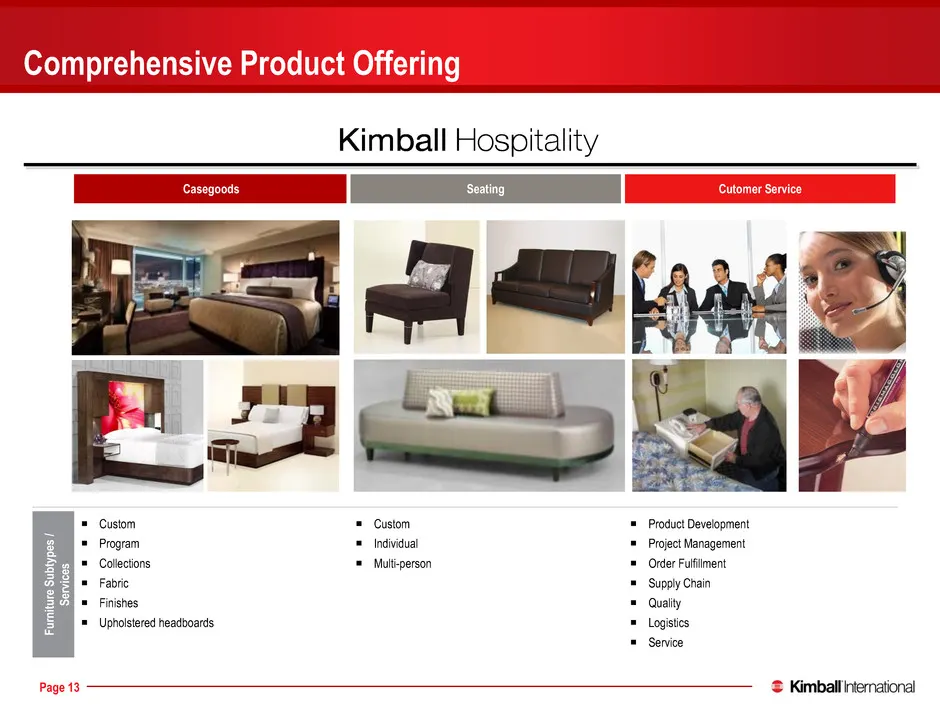
Slide 13: Comprehensive Product Offering
176 0 0 137 132 126 237 23 23 46 46 46 51 132 156 252 202 59 Page 13 Comprehensive Product Offering Casegoods Seating Cutomer Service Fu rni tur e Su bty pe s / Se rvi ce s Custom Program Collections Fabric Finishes Upholstered headboards Custom Individual Multi-person Product De
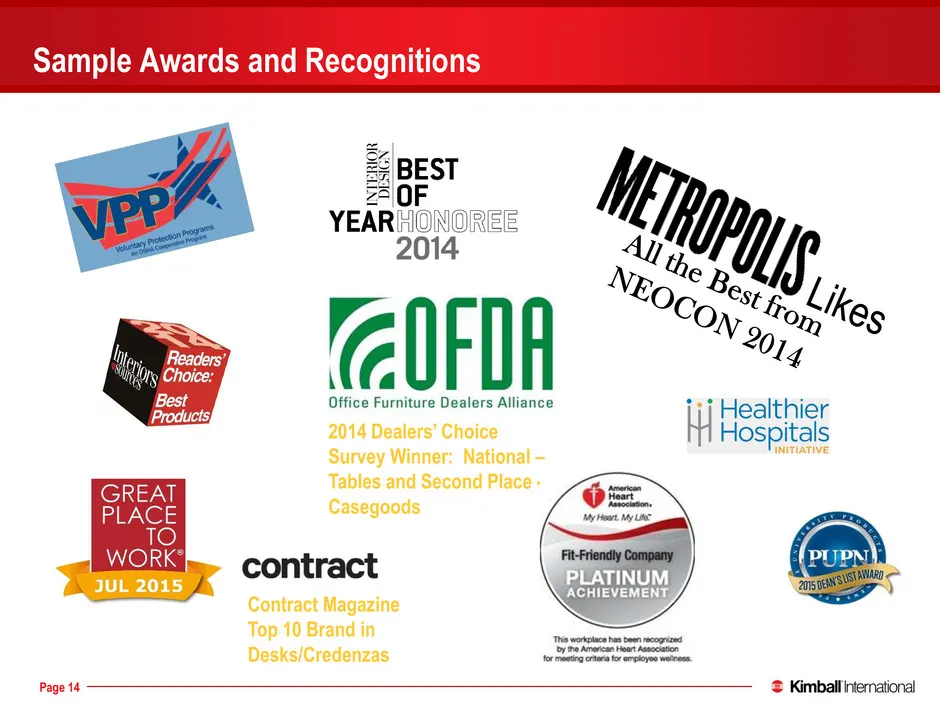
Slide 14: Awards and Recognitions
176 0 0 137 132 126 237 23 23 46 46 46 51 132 156 252 202 59 Page 14 2014 Dealers’ Choice Survey Winner: National – Tables and Second Place - Casegoods Sample Awards and Recognitions Contract Magazine Top 10 Brand in Desks/Credenzas
Slide 15: Furniture Industry Indicators
176 0 0 137 132 126 237 23 23 46 46 46 51 132 156 252 202 59 Furniture Industry Indicators
Slide 16: The Evolving Office Landscape
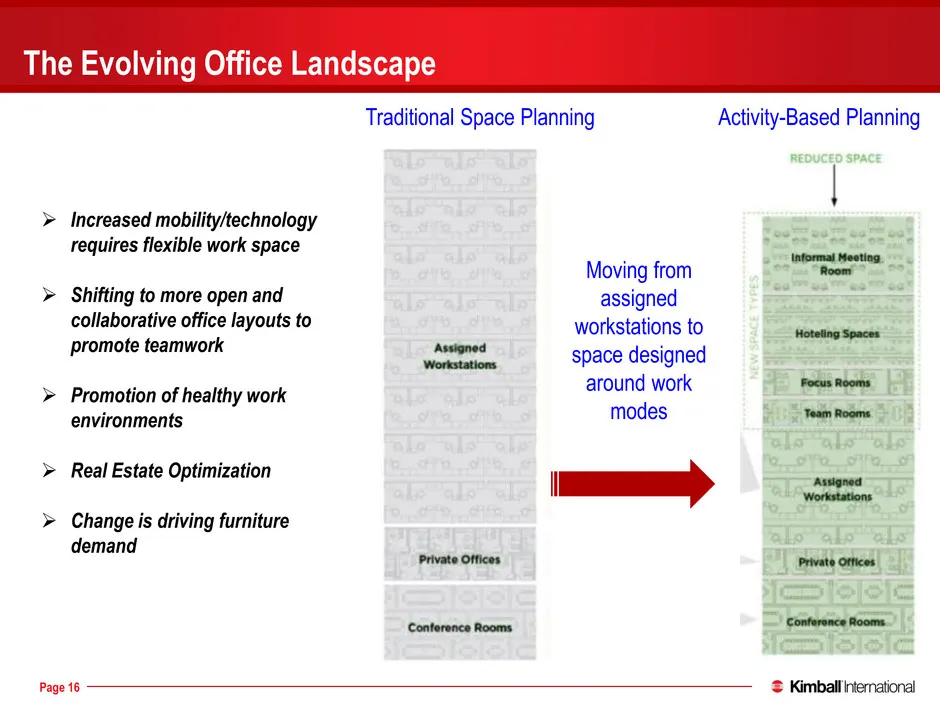
176 0 0 137 132 126 237 23 23 46 46 46 51 132 156 252 202 59 Page 16 The Evolving Office Landscape Increased mobility/technology requires flexible work space Shifting to more open and collaborative office layouts to promote teamwork Promotion of healthy work environments Real Estate Optimiza
Slide 17: The Evolving Office Landscape
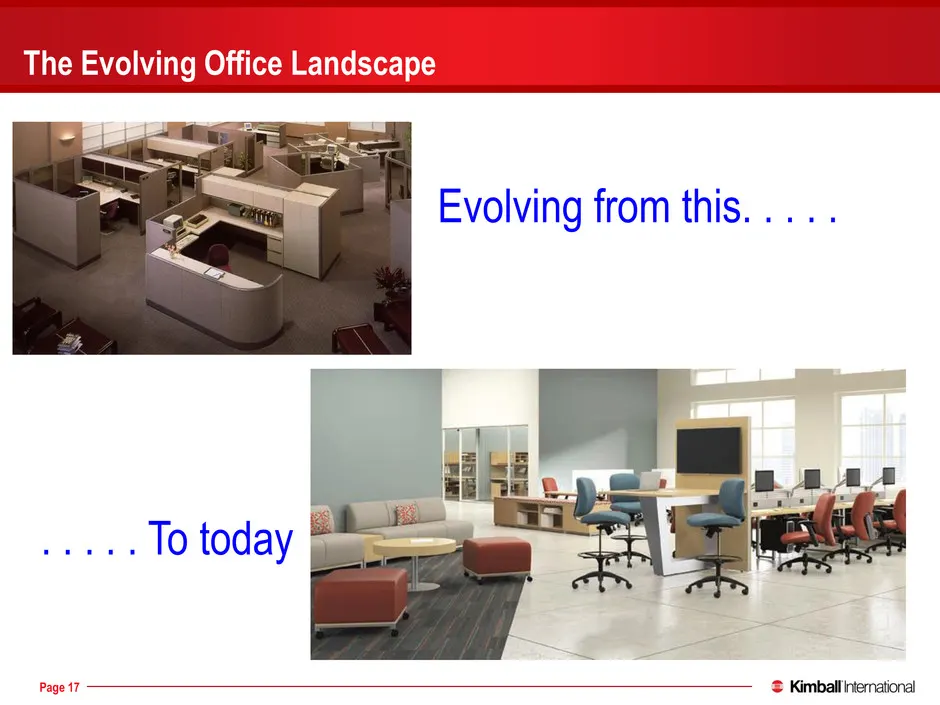
176 0 0 137 132 126 237 23 23 46 46 46 51 132 156 252 202 59 Page 17 The Evolving Office Landscape Evolving from this. . . . . . . . . . To today
Slide 18: U.S. Furniture Leading Indicators are Improving
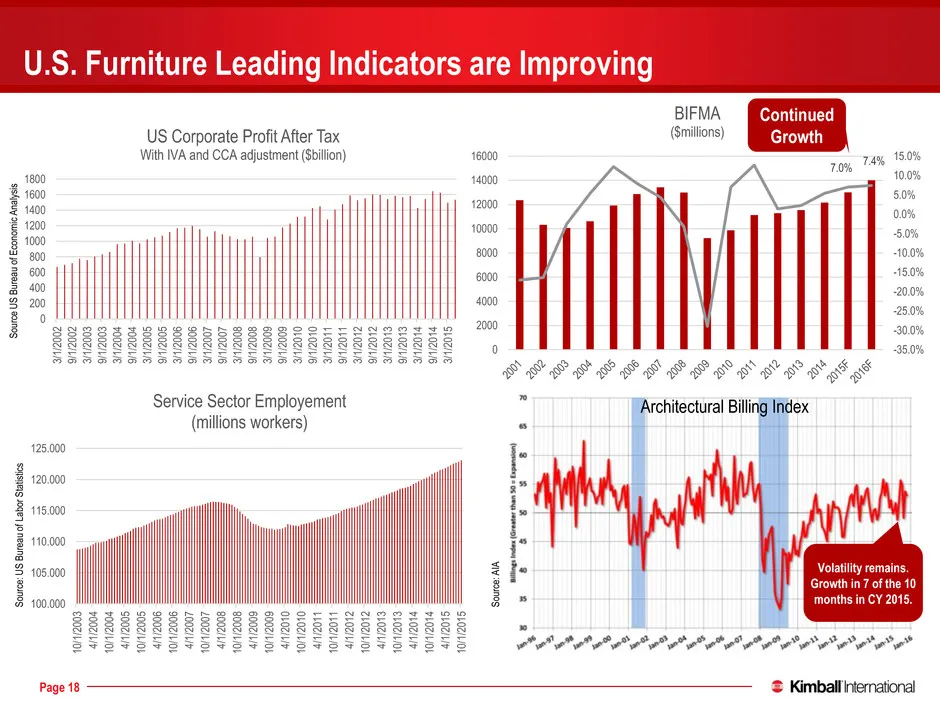
176 0 0 137 132 126 237 23 23 46 46 46 51 132 156 252 202 59 Page 18 U.S. Furniture Leading Indicators are Improving S ou rc e U S B ur ea u of E co no m ic A na ly si s S ou rc e: U S B ur ea u of L ab or S ta tis tic s S ou rc e: A IA Architectural Billing Index 7.0% 7.4% -35.0% -30.0% -25.0% -20.
Slide 19: Hospitality Leading Indicators are Strong
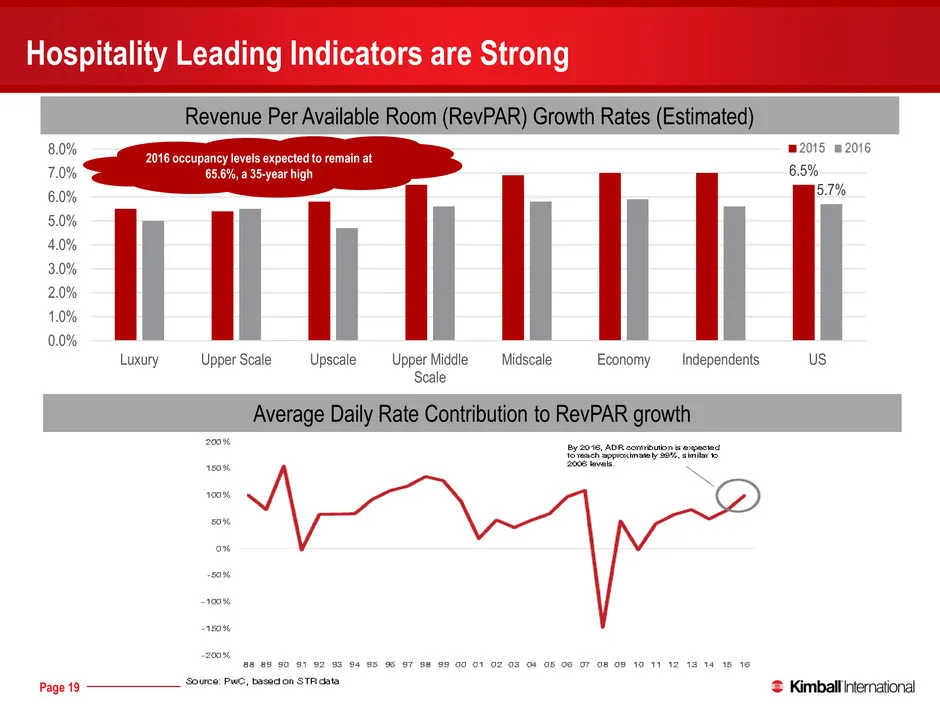
176 0 0 137 132 126 237 23 23 46 46 46 51 132 156 252 202 59 Page 19 Hospitality Leading Indicators are Strong 6.5% 5.7% 0.0% 1.0% 2.0% 3.0% 4.0% 5.0% 6.0% 7.0% 8.0% Luxury Upper Scale Upscale Upper Middle Scale Midscale Economy Independents US 2015 2016 Source: PWC Hospitality Directions May 2015 R
Slide 20: Kimball International Financial Overview
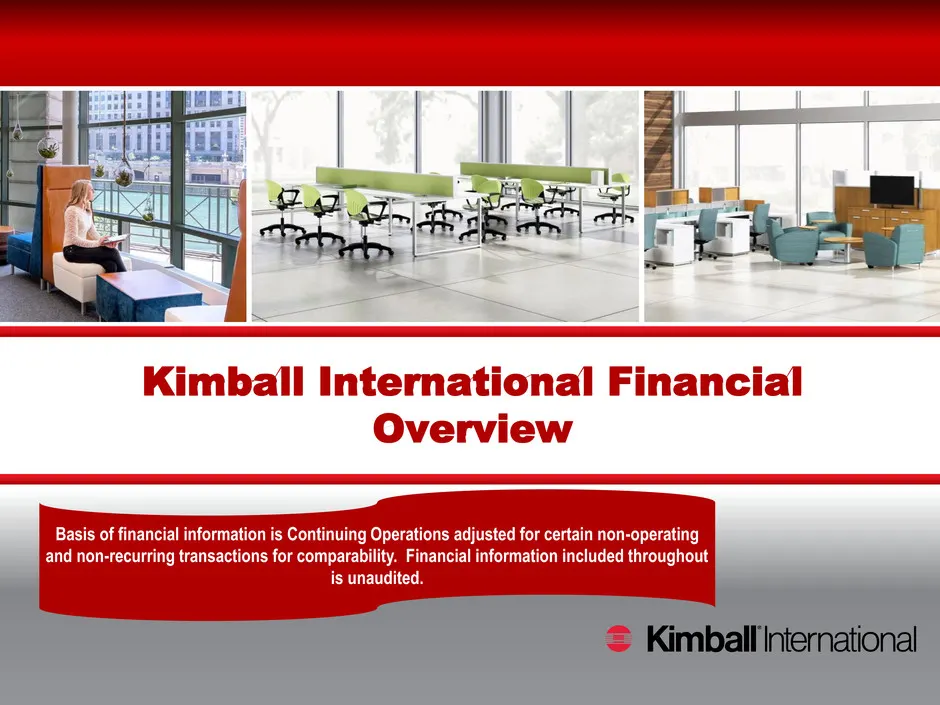
176 0 0 137 132 126 237 23 23 46 46 46 51 132 156 252 202 59 Kimball International Financial Overview Basis of financial information is Continuing Operations adjusted for certain non-operating and non-recurring transactions for comparability. Financial information included throughout is unaudited.
Slide 21: Improving Performance
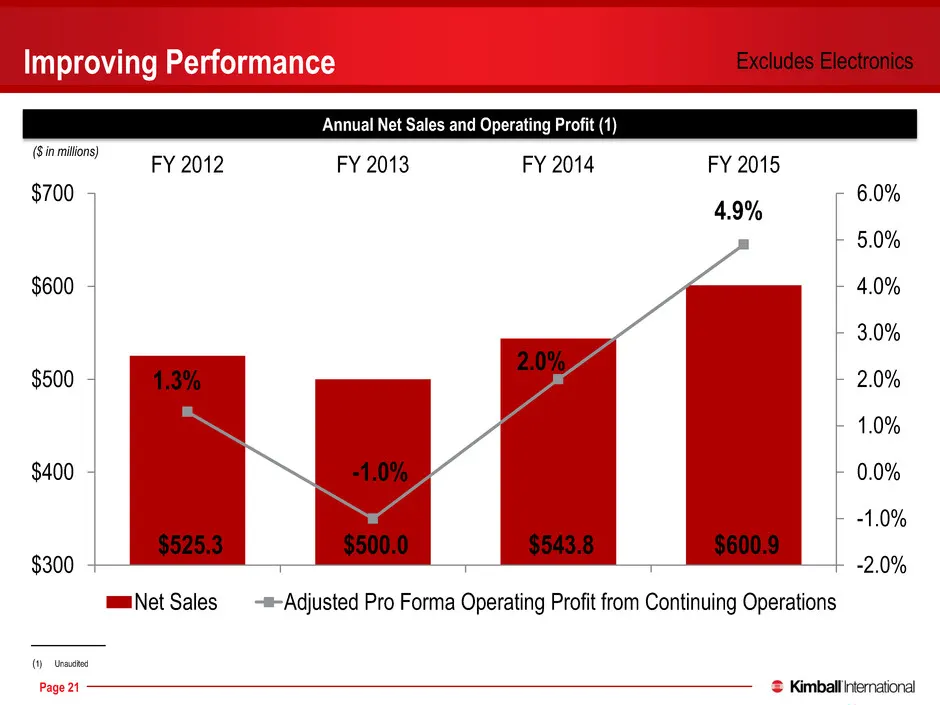
176 0 0 137 132 126 237 23 23 46 46 46 51 132 156 252 202 59 Page 21 Improving Performance Annual Net Sales and Operating Profit (1) ($ in millions) $525.3 $500.0 $543.8 $600.9 1.3% -1.0% 2.0% 4.9% -2.0% -1.0% 0.0% 1.0% 2.0% 3.0% 4.0% 5.0% 6.0% $300 $400 $500 $600 $700 FY 2012 FY 2013 FY 2014 FY 201
Slide 22: Sales Growth Each Quarter
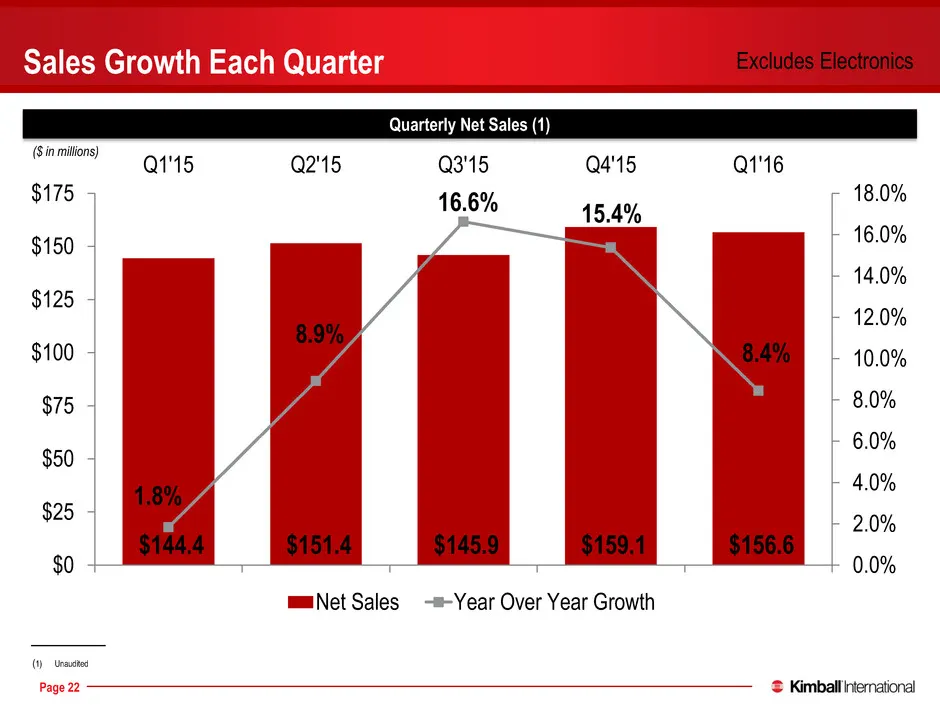
176 0 0 137 132 126 237 23 23 46 46 46 51 132 156 252 202 59 Page 22 Sales Growth Each Quarter Quarterly Net Sales (1) ($ in millions) $144.4 $151.4 $145.9 $159.1 $156.6 1.8% 8.9% 16.6% 15.4% 8.4% 0.0% 2.0% 4.0% 6.0% 8.0% 10.0% 12.0% 14.0% 16.0% 18.0% $0 $25 $50 $75 $100 $125 $150 $175 Q1'15 Q2'15 Q
Slide 23: Order Levels
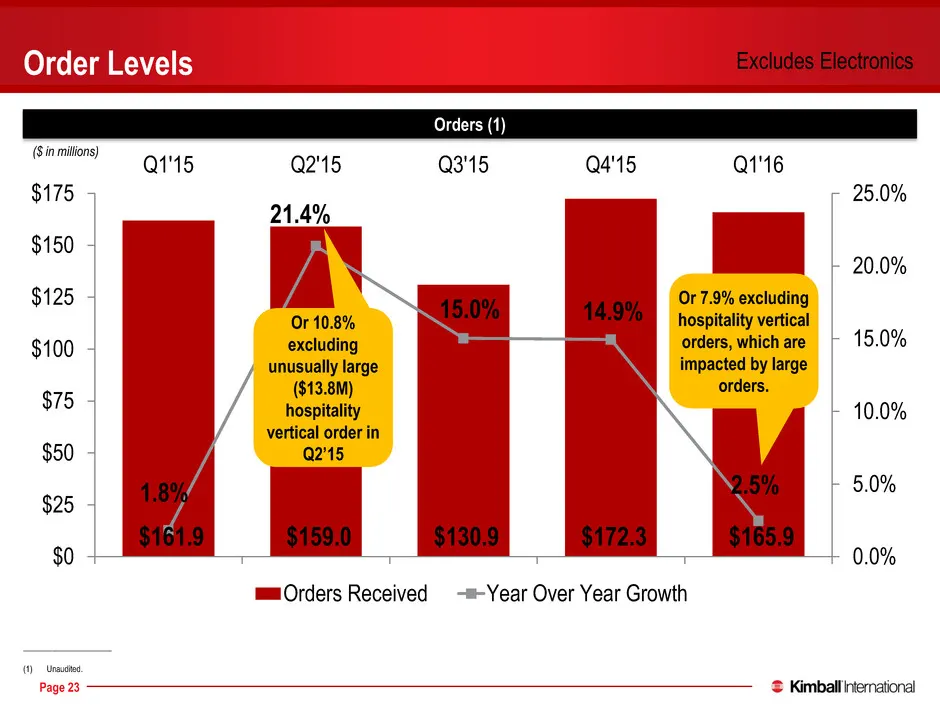
176 0 0 137 132 126 237 23 23 46 46 46 51 132 156 252 202 59 Page 23 Order Levels Orders (1) ($ in millions) $161.9 $159.0 $130.9 $172.3 $165.9 1.8% 21.4% 15.0% 14.9% 2.5% 0.0% 5.0% 10.0% 15.0% 20.0% 25.0% $0 $25 $50 $75 $100 $125 $150 $175 Q1'15 Q2'15 Q3'15 Q4'15 Q1'16 Orders Received Year Over Yea
Slide 24: Quarterly Operating Profit
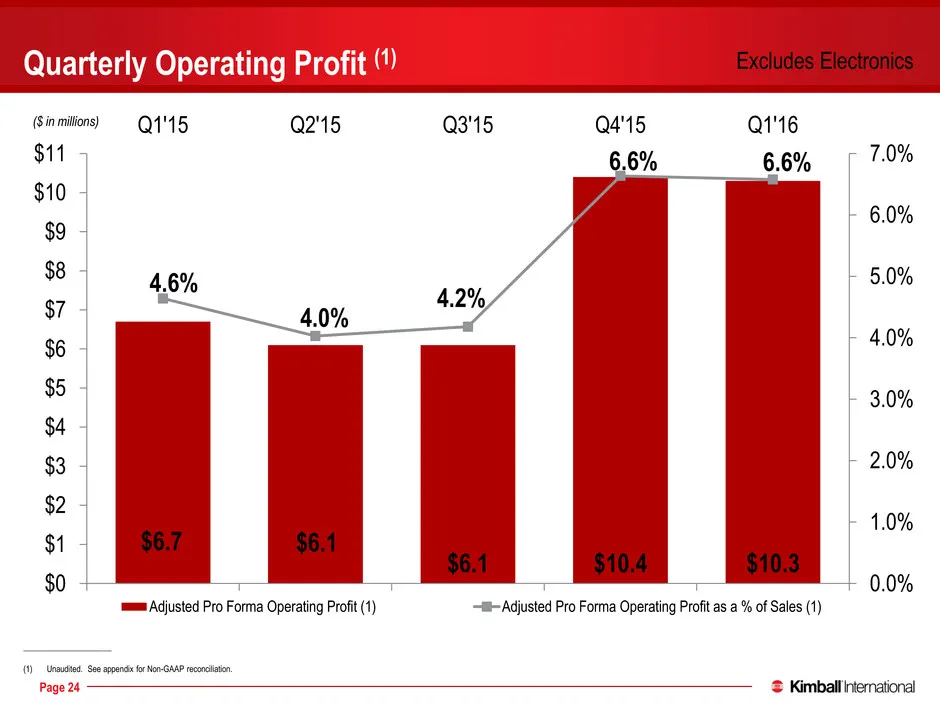
176 0 0 137 132 126 237 23 23 46 46 46 51 132 156 252 202 59 Page 24 $6.7 $6.1 $6.1 $10.4 $10.3 4.6% 4.0% 4.2% 6.6% 6.6% 0.0% 1.0% 2.0% 3.0% 4.0% 5.0% 6.0% 7.0% $0 $1 $2 $3 $4 $5 $6 $7 $8 $9 $10 $11 Q1'15 Q2'15 Q3'15 Q4'15 Q1'16 Adjusted Pro Forma Operating Profit (1) Adjusted Pro Forma Operating Pr
Slide 25: Free Cash Flow – Last Quarters
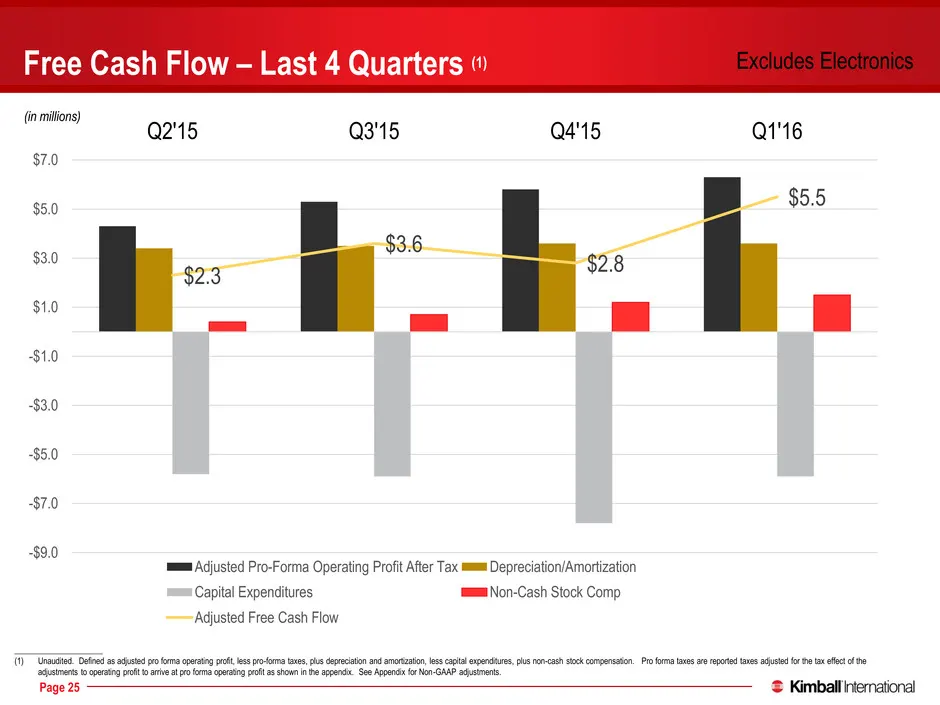
176 0 0 137 132 126 237 23 23 46 46 46 51 132 156 252 202 59 Page 25 Free Cash Flow – Last 4 Quarters (1) _____________________ (1) Unaudited. Defined as adjusted pro forma operating profit, less pro-forma taxes, plus depreciation and amortization, less capital expenditures, plus non-cash stock comp
Slide 26: Sales by Vertical – Good Diversification
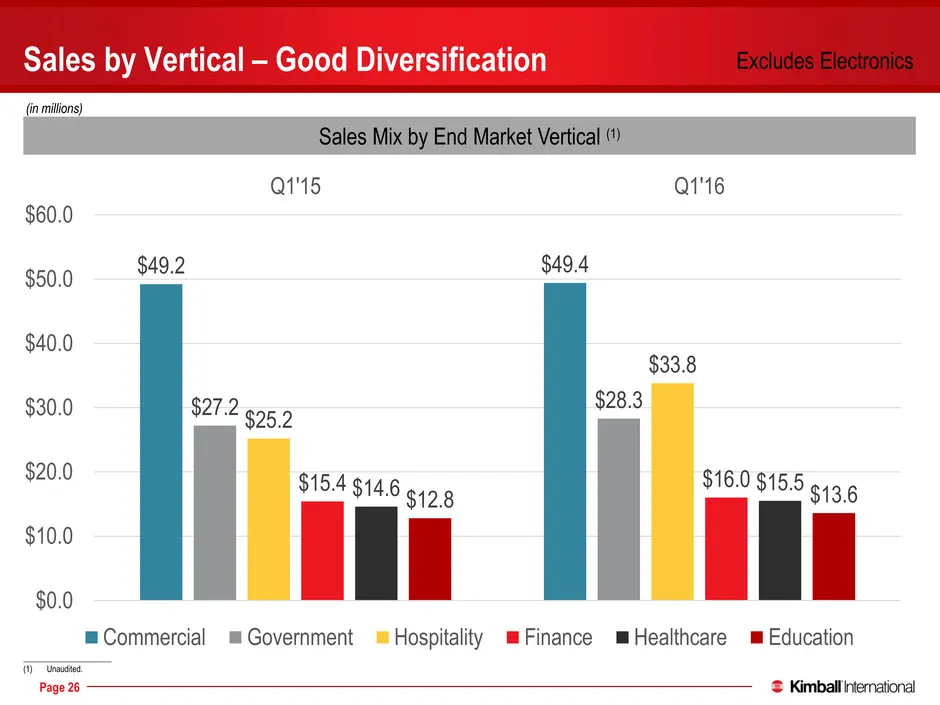
176 0 0 137 132 126 237 23 23 46 46 46 51 132 156 252 202 59 Page 26 Sales by Vertical – Good Diversification Sales Mix by End Market Vertical (1) _____________________ (1) Unaudited. Excludes Electronics $49.2 $49.4 $27.2 $28.3 $25.2 $33.8 $15.4 $16.0 $14.6 $15.5 $12.8 $13.6 $0.0 $10.0 $20.0 $30.0
Slide 27: Orders by Vertical
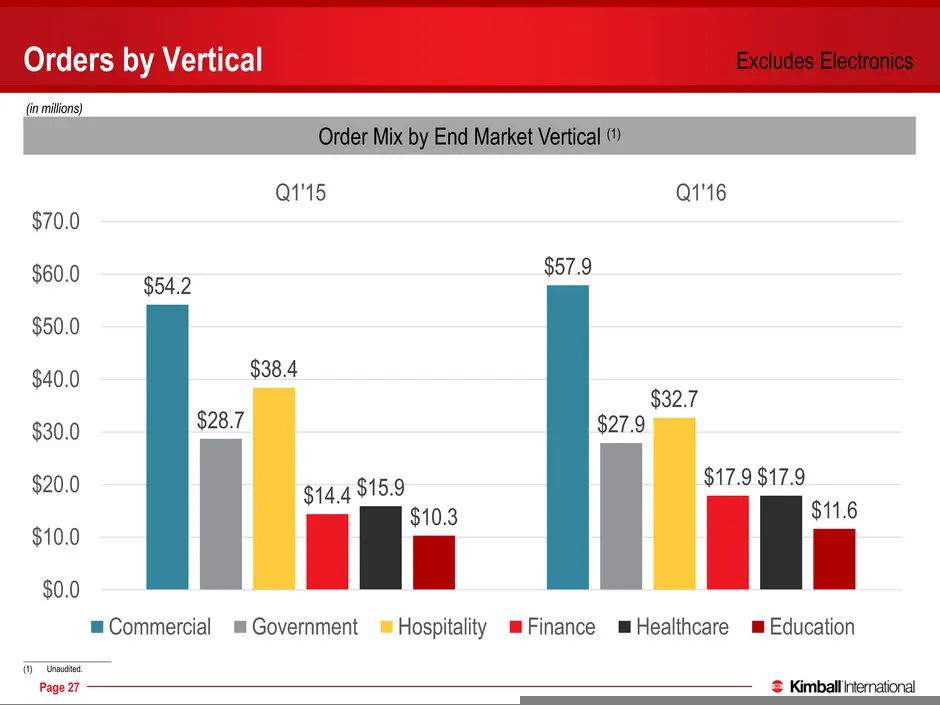
176 0 0 137 132 126 237 23 23 46 46 46 51 132 156 252 202 59 Page 27 Orders by Vertical Order Mix by End Market Vertical (1) _____________________ (1) Unaudited. Excludes Electronics $54.2 $57.9 $28.7 $27.9 $38.4 $32.7 $14.4 $17.9 $15.9 $17.9 $10.3 $11.6 $0.0 $10.0 $20.0 $30.0 $40.0 $50.0 $60.0 $70.
Slide 28: Financial Outlook
176 0 0 137 132 126 237 23 23 46 46 46 51 132 156 252 202 59 Financial Outlook
Slide 29: Progress Being Made Towards Published 8% Operating Profit Goal
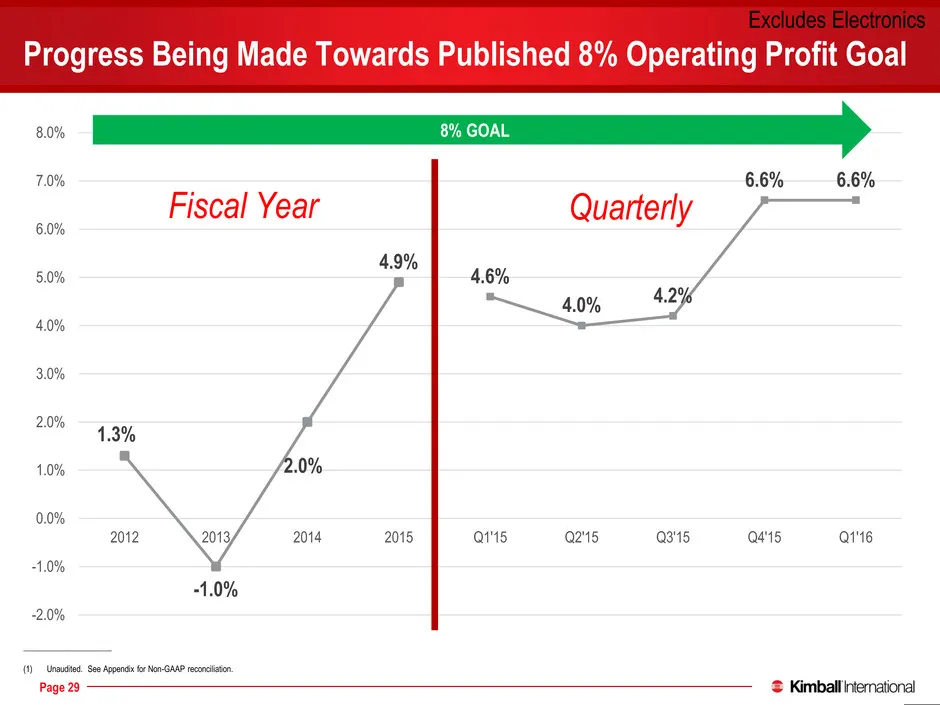
176 0 0 137 132 126 237 23 23 46 46 46 51 132 156 252 202 59 Page 29 Progress Being Made Towards Published 8% Operating Profit Goal _____________________ (1) Unaudited. See Appendix for Non-GAAP reconciliation. Excludes Electronics 1.3% -1.0% 2.0% 4.9% 4.6% 4.0% 4.2% 6.6% 6.6% -2.0% -1.0% 0.0% 1.0%
Slide 30: Planning Assumptions to FY Q2'17
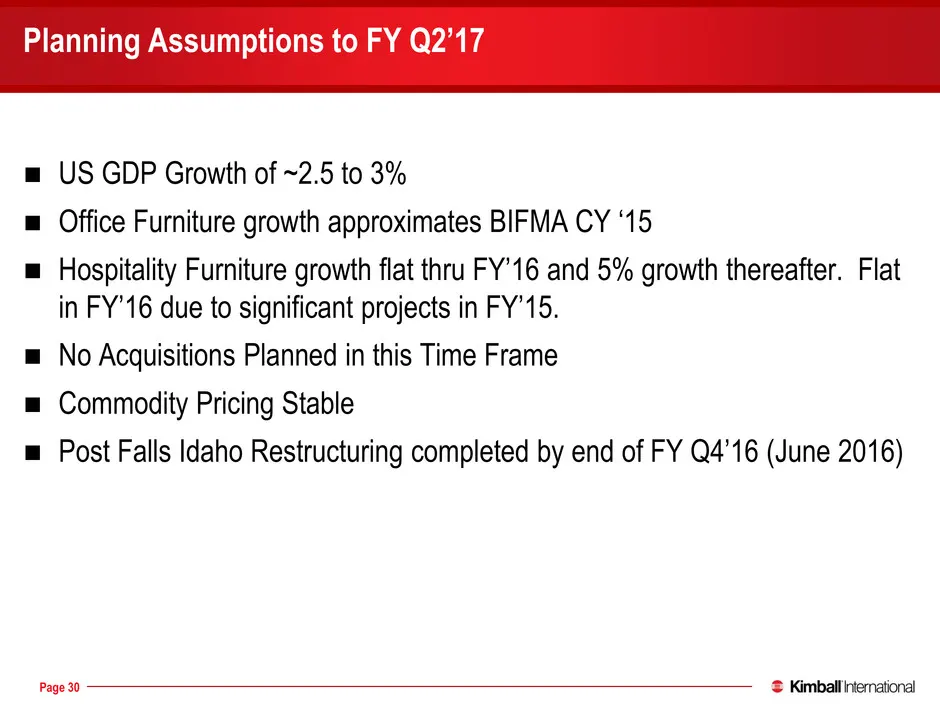
176 0 0 137 132 126 237 23 23 46 46 46 51 132 156 252 202 59 Page 30 Planning Assumptions to FY Q2’17 US GDP Growth of ~2.5 to 3% Office Furniture growth approximates BIFMA CY ‘15 Hospitality Furniture growth flat thru FY’16 and 5% growth thereafter. Flat in FY’16 due to significant projects i
Slide 31: Targeting 8% Operating Profit by Q2'17
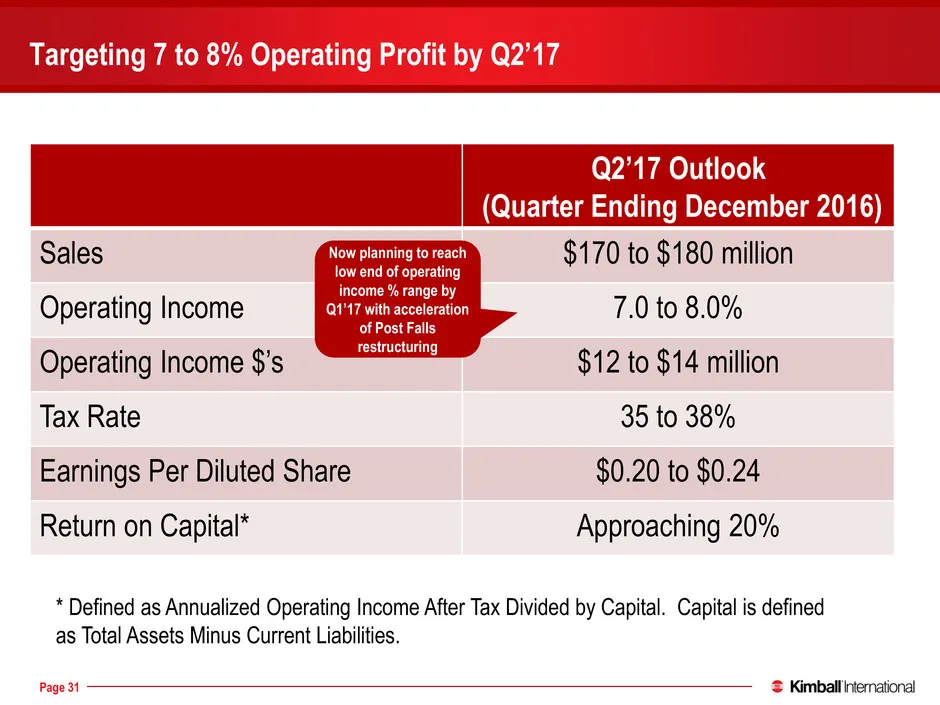
176 0 0 137 132 126 237 23 23 46 46 46 51 132 156 252 202 59 Page 31 Targeting 7 to 8% Operating Profit by Q2’17 Q2’17 Outlook (Quarter Ending December 2016) Sales $170 to $180 million Operating Income 7.0 to 8.0% Operating Income $’s $12 to $14 million Tax Rate 35 to 38% Earnings Per Diluted Share
Slide 32: Stock Price Since Spin
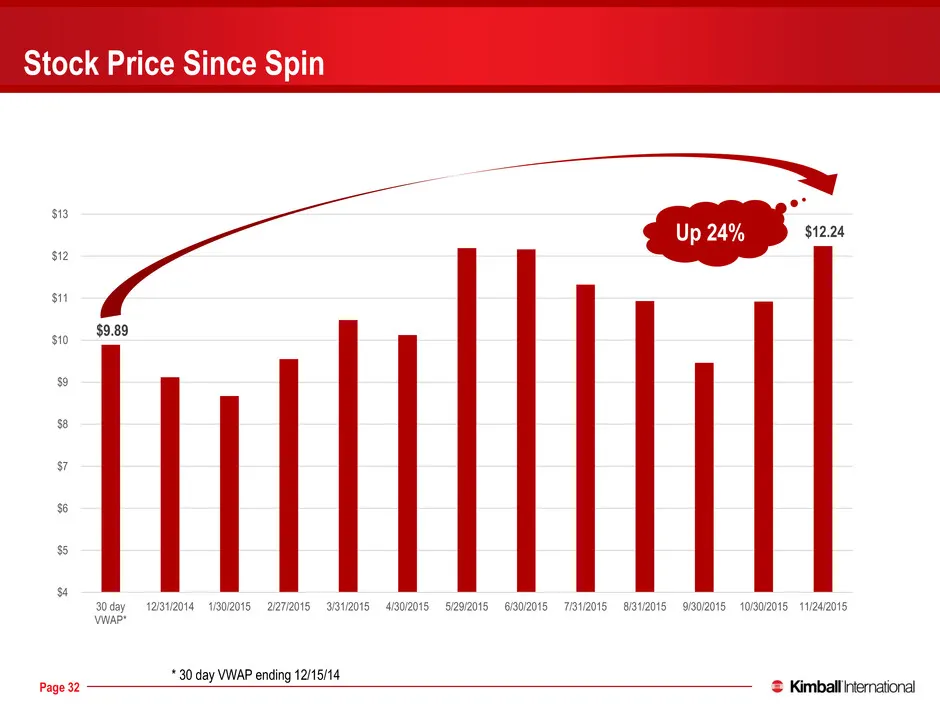
176 0 0 137 132 126 237 23 23 46 46 46 51 132 156 252 202 59 Page 32 $9.89 $12.24 $4 $5 $6 $7 $8 $9 $10 $11 $12 $13 30 day VWAP* 12/31/2014 1/30/2015 2/27/2015 3/31/2015 4/30/2015 5/29/2015 6/30/2015 7/31/2015 8/31/2015 9/30/2015 10/30/2015 11/24/2015 Stock Price Since Spin Up 24% * 30 day VWAP endi
Slide 33: Appendix
176 0 0 137 132 126 237 23 23 46 46 46 51 132 156 252 202 59 Appendix
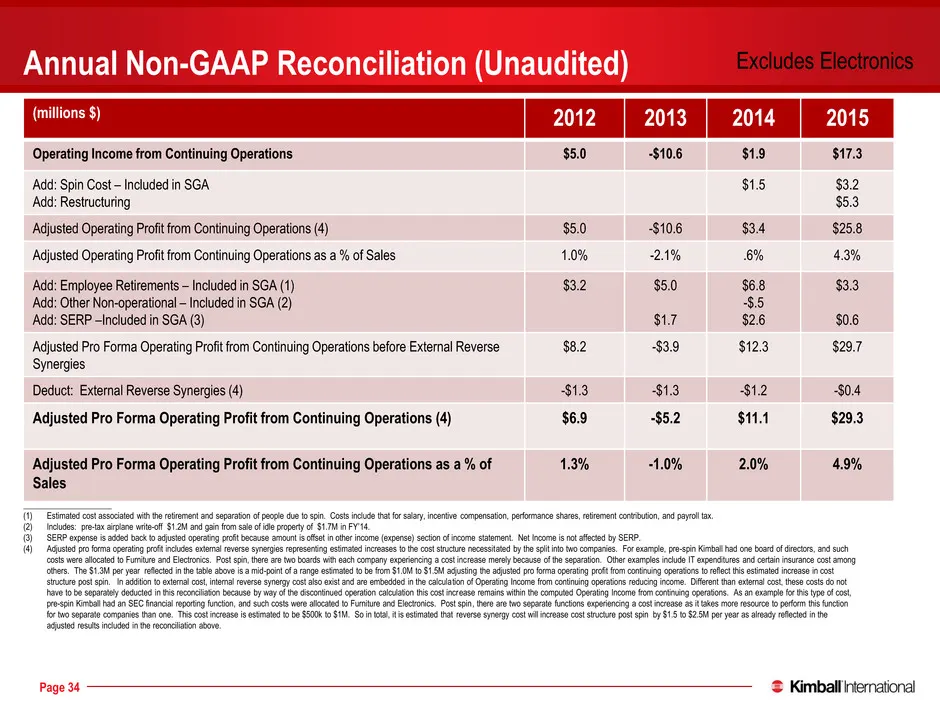
Slide 34: Annual Non-GAAP Reconciliation
176 0 0 137 132 126 237 23 23 46 46 46 51 132 156 252 202 59 Page 34 Annual Non-GAAP Reconciliation (Unaudited) (millions $) 2012 2013 2014 2015 Operating Income from Continuing Operations $5.0 -$10.6 $1.9 $17.3 Add: Spin Cost – Included in SGA Add: Restructuring $1.5 $3.2 $5.3 Adjusted Operating Pr
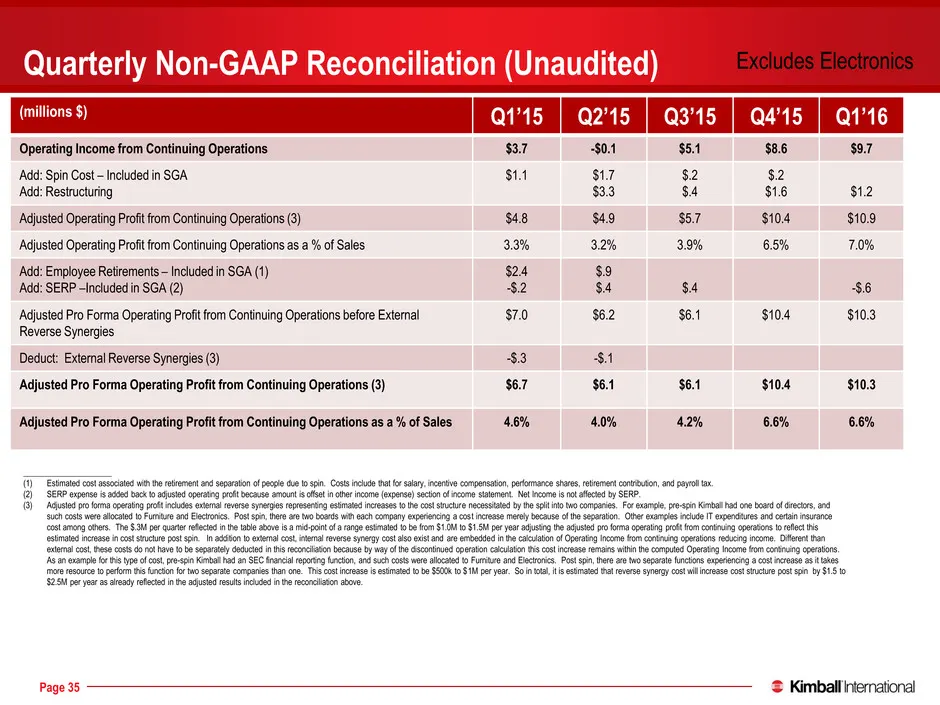
Slide 35: Quarterly Non-GAAP Reconciliation
176 0 0 137 132 126 237 23 23 46 46 46 51 132 156 252 202 59 Page 35 Quarterly Non-GAAP Reconciliation (Unaudited) (millions $) Q1’15 Q2’15 Q3’15 Q4’15 Q1’16 Operating Income from Continuing Operations $3.7 -$0.1 $5.1 $8.6 $9.7 Add: Spin Cost – Included in SGA Add: Restructuring $1.1 $1.7 $3.3 $.2 $
Source: SEC EDGAR · 8-K filed Dec 10, 2015
More decks from Kimball International Inc
 Merger or Acquisition (May 2023)30 slides · May 23, 2023
 Merger or Acquisition (March 2023)15 slides · Mar 8, 2023
 Q2 FY2023 Earnings Presentation16 slides · Feb 2, 2023
 Q1 FY2023 Earnings Presentation17 slides · Nov 3, 2022
 Q4 FY2022 Earnings Presentation18 slides · Aug 4, 2022
 Q3 FY2022 Earnings Presentation17 slides · May 3, 2022