Kimball International — Q4 FY2022 Earnings Presentation
18 slides from Kimball International's earnings presentation, Aug 4, 2022
Slide 1: Q4 FY'22 Quarterly Earnings & Strategic Update
Q4 FY’22 Quarterly Earnings & Strategic Update August 4, 2022 Exhibit 99.2
Slide 2: Safe Harbor Statement
Safe Harbor Statement This document may contain certain forward-looking statements about the Company, such as discussions of Company’s pricing trends, liquidity, new business results, expansion plans, anticipated expenses and planned schedules. The Company intends such forward-looking statements to
Slide 3: Strong Finish to Fiscal 2022 Reflected the Positive Momentum in our Business
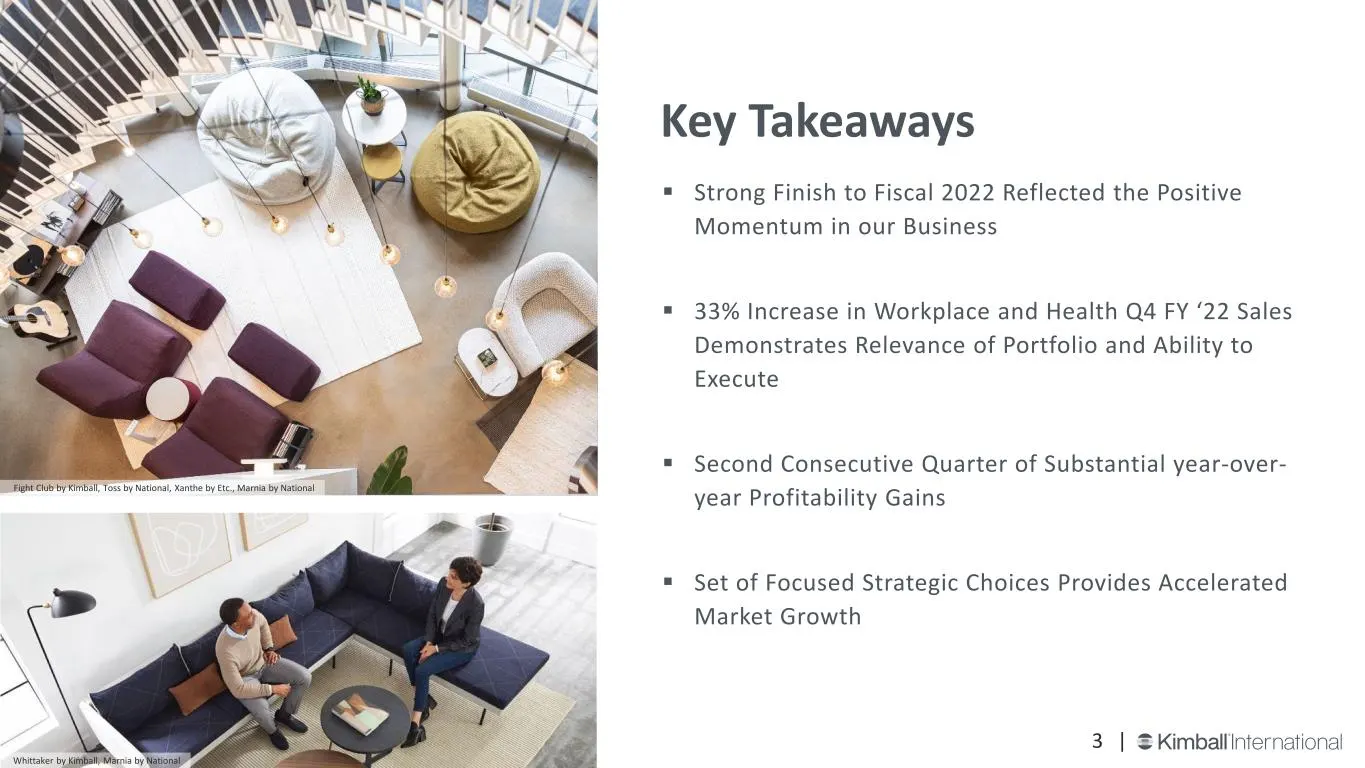
Strong Finish to Fiscal 2022 Reflected the Positive Momentum in our Business 33% Increase in Workplace and Health Q4 FY ‘22 Sales Demonstrates Relevance of Portfolio and Ability to Execute Second Consecutive Quarter of Substantial year-over- year Profitability Gains Set of Focused Strategic
Slide 4: Expertise in Ancillary Products & Secondary Geographies
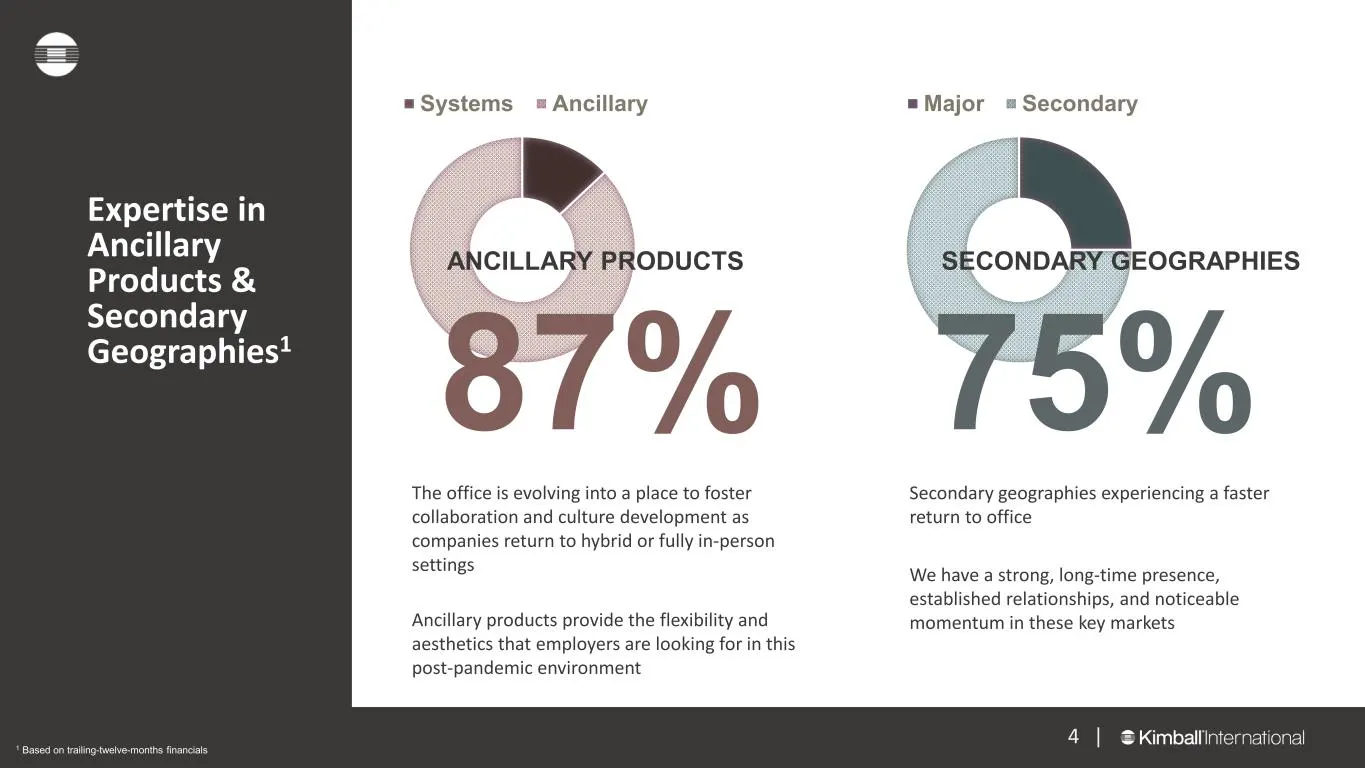
Expertise in Ancillary Products & Secondary Geographies1 Major SecondarySystems Ancillary 87% 75% ANCILLARY PRODUCTS SECONDARY GEOGRAPHIES The office is evolving into a place to foster collaboration and culture development as companies return to hybrid or fully in-person settings Ancillary products
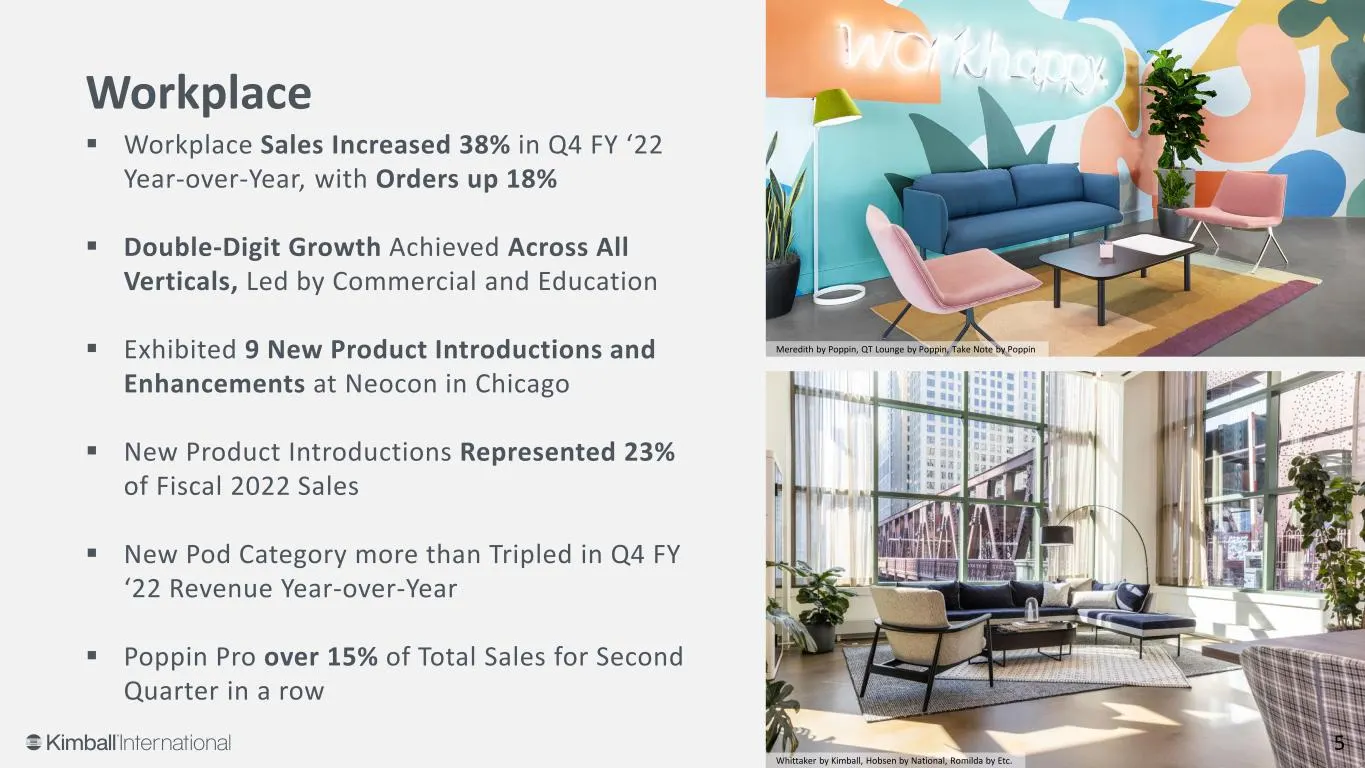
Slide 5: Workplace Sales Increased 38% in Q4 FY'22 Year-over-Year, with Orders up 18%
Workplace Sales Increased 38% in Q4 FY ‘22 Year-over-Year, with Orders up 18% Double-Digit Growth Achieved Across All Verticals, Led by Commercial and Education Exhibited 9 New Product Introductions and Enhancements at Neocon in Chicago New Product Introductions Represented 23% of Fiscal 202
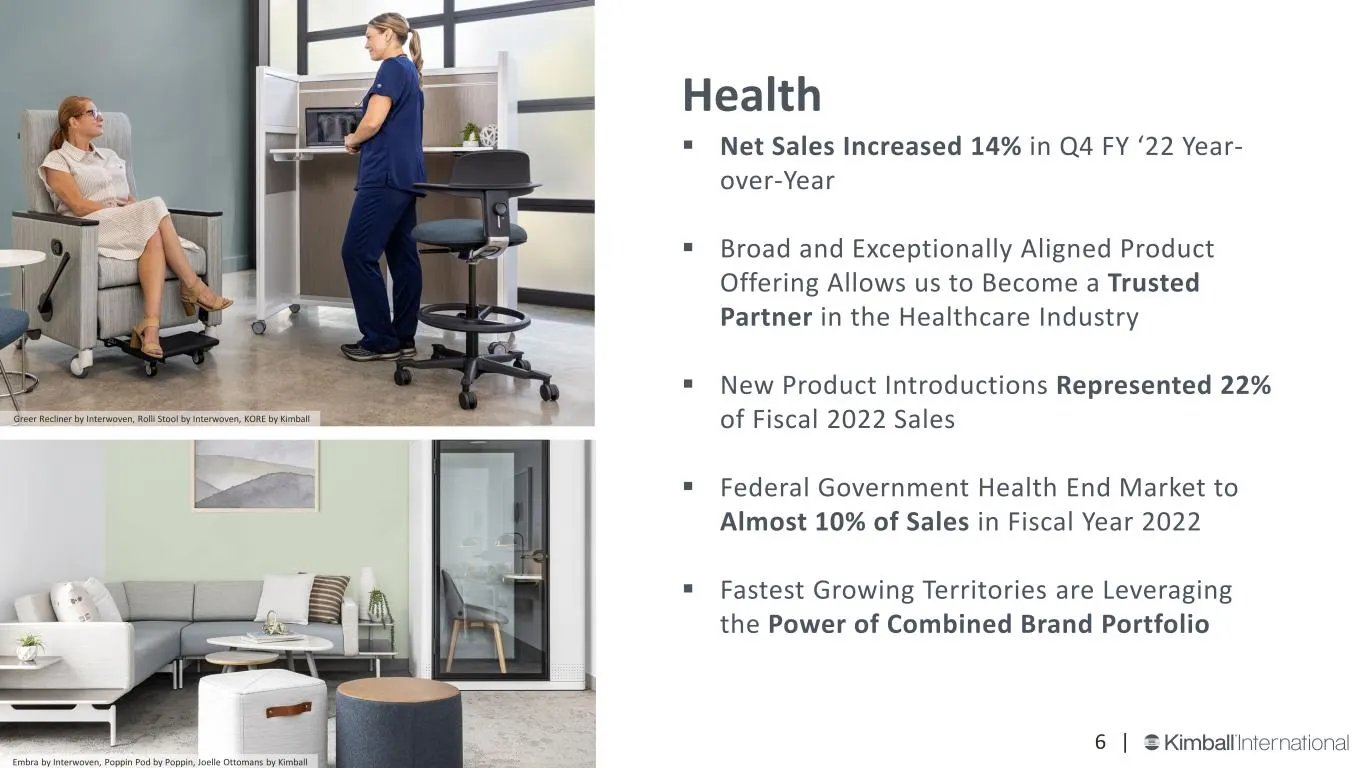
Slide 6: Health: Net Sales Increased 14% in Q4 FY'22 Year-over-Year
Health Net Sales Increased 14% in Q4 FY ‘22 Year- over-Year Broad and Exceptionally Aligned Product Offering Allows us to Become a Trusted Partner in the Healthcare Industry New Product Introductions Represented 22% of Fiscal 2022 Sales Federal Government Health End Market to Almost 10% of S
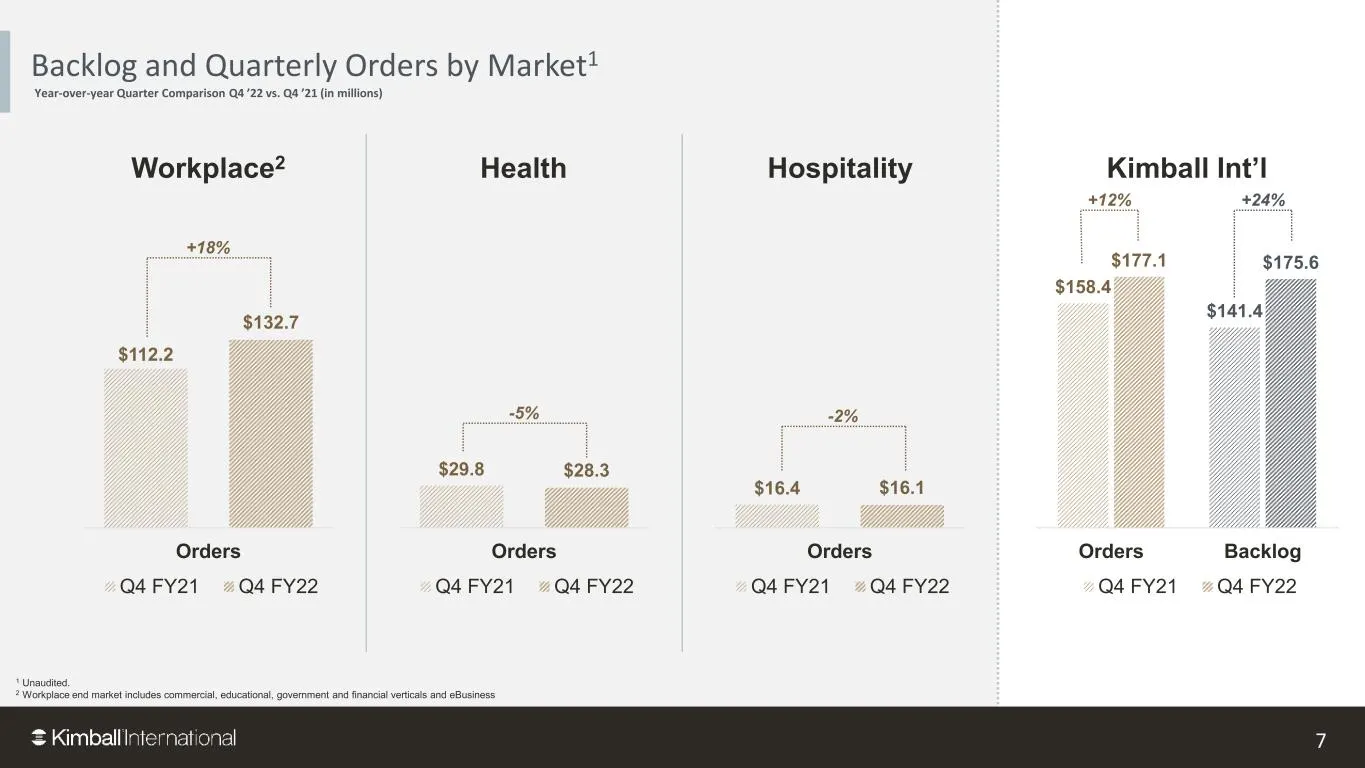
Slide 7: Backlog and Quarterly Orders by Market
$158.4 $141.4 $177.1 $175.6 Orders Backlog Q4 FY21 Q4 FY22 Backlog and Quarterly Orders by Market1 Year-over-year Quarter Comparison Q4 ’22 vs. Q4 ’21 (in millions) 7 1 Unaudited. 2 Workplace end market includes commercial, educational, government and financial verticals and eBusiness $112.2 $132.7
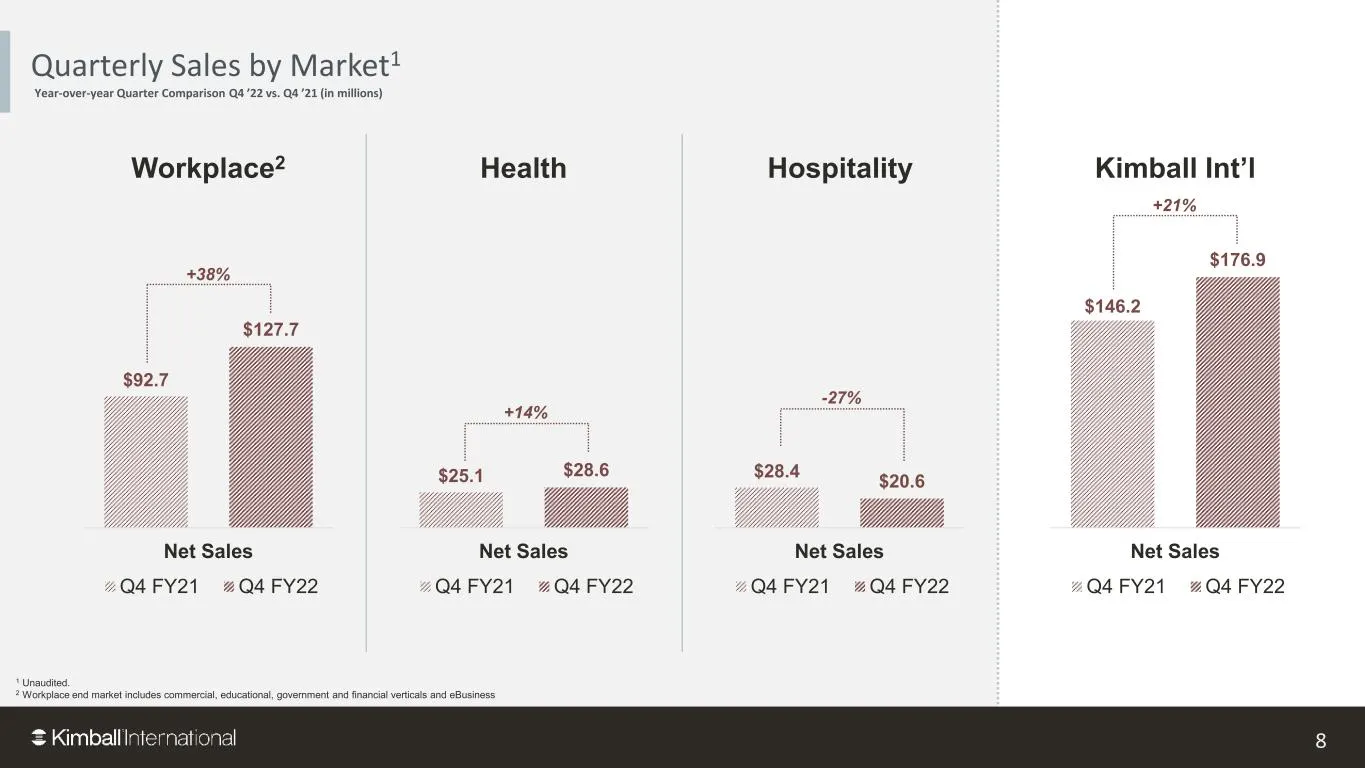
Slide 8: Quarterly Sales by Market
Quarterly Sales by Market1 Year-over-year Quarter Comparison Q4 ’22 vs. Q4 ’21 (in millions) 8 1 Unaudited. 2 Workplace end market includes commercial, educational, government and financial verticals and eBusiness $92.7 $127.7 Net Sales Q4 FY21 Q4 FY22 Workplace2 Health Hospitality Kimball Int’l $25
Slide 9: Q4 FY'22 Financial Highlights
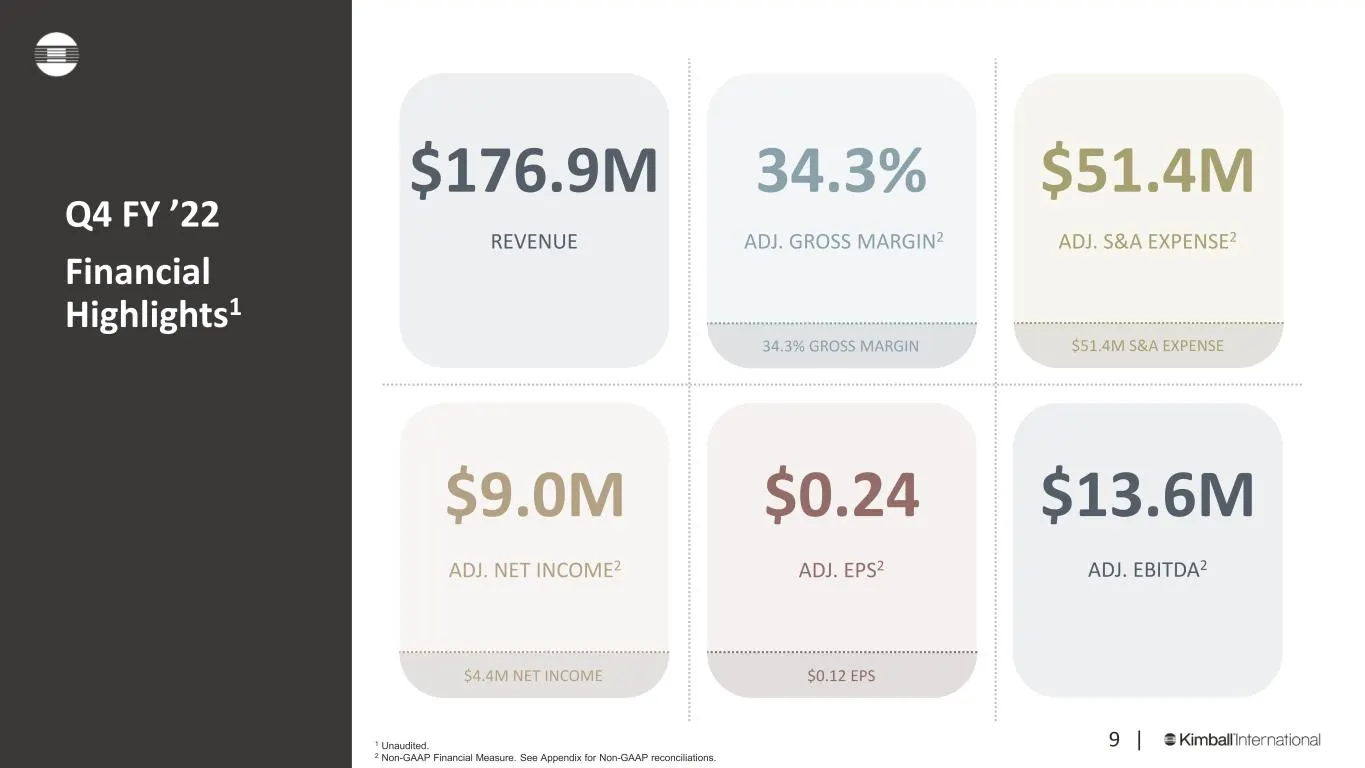
Q4 FY ’22 Financial Highlights1 34.3% ADJ. GROSS MARGIN2 $51.4M ADJ. S&A EXPENSE2 $9.0M ADJ. NET INCOME2 $0.24 ADJ. EPS2 $176.9M REVENUE $13.6M ADJ. EBITDA2 1 Unaudited. 2 Non-GAAP Financial Measure. See Appendix for Non-GAAP reconciliations. $51.4M S&A EXPENSE $4.4M NET INCOME $0.12 EPS 9 | 34.3% G
Slide 10: Full Year FY'22 Financial Highlights
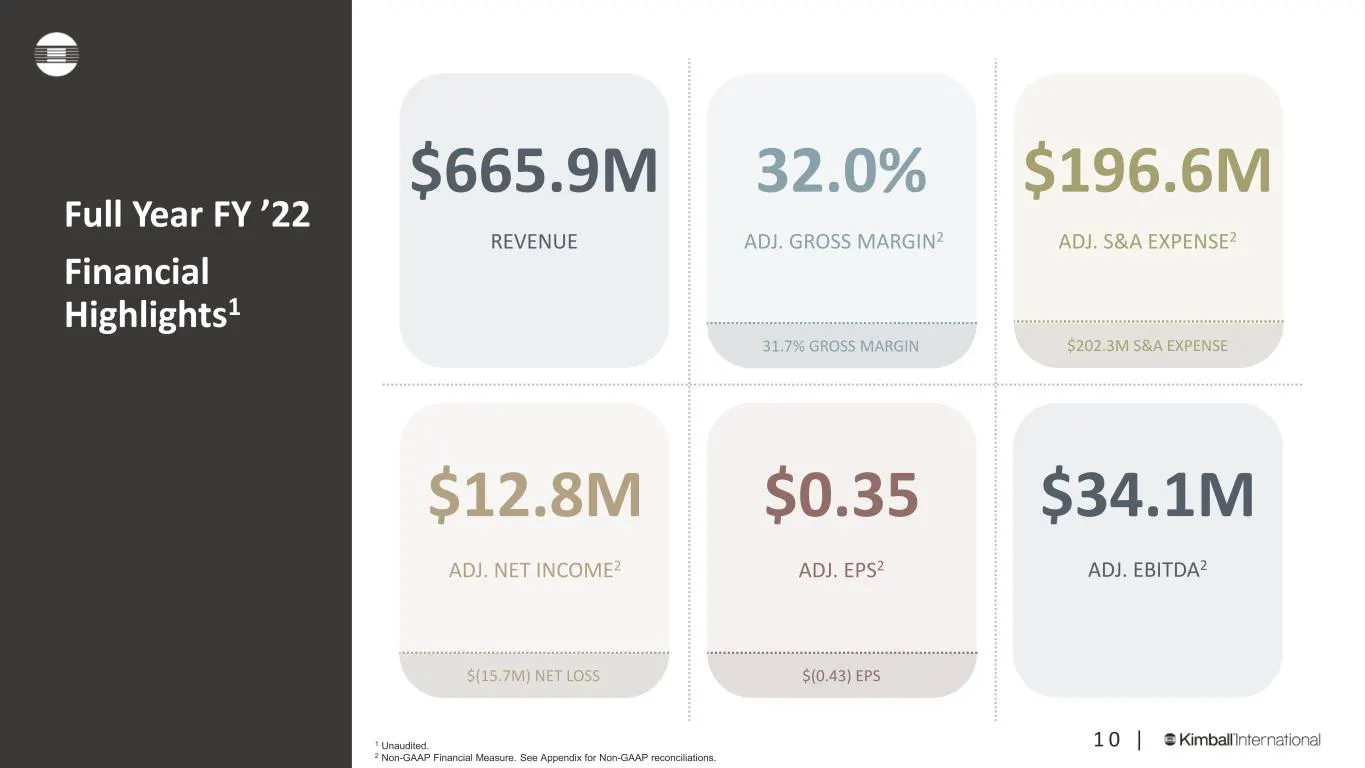
Full Year FY ’22 Financial Highlights1 32.0% ADJ. GROSS MARGIN2 $196.6M ADJ. S&A EXPENSE2 $12.8M ADJ. NET INCOME2 $0.35 ADJ. EPS2 $665.9M REVENUE $34.1M ADJ. EBITDA2 1 Unaudited. 2 Non-GAAP Financial Measure. See Appendix for Non-GAAP reconciliations. $202.3M S&A EXPENSE $(15.7M) NET LOSS $(0.43) EP
Slide 11: Q4 and Full Year FY'22 Liquidity and Capital Allocation
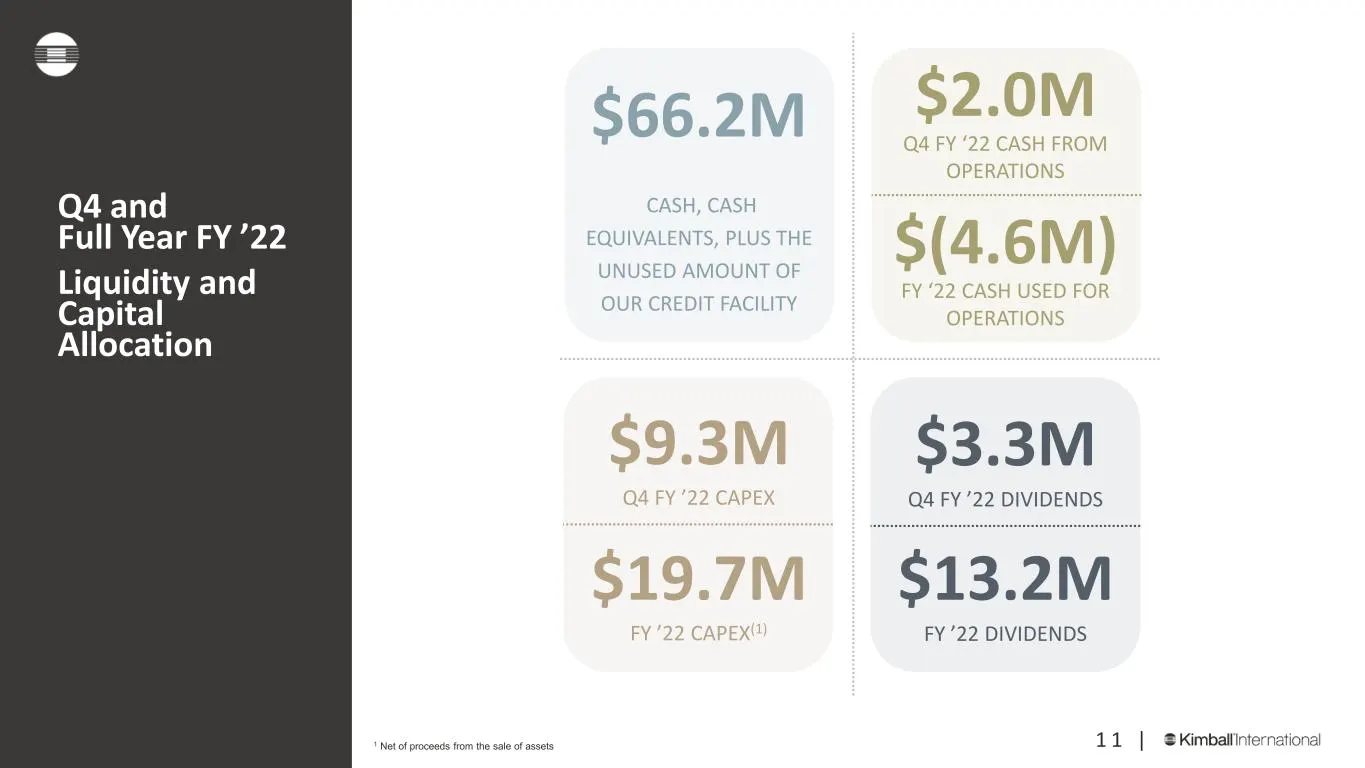
Q4 and Full Year FY ’22 Liquidity and Capital Allocation $66.2M CASH, CASH EQUIVALENTS, PLUS THE UNUSED AMOUNT OF OUR CREDIT FACILITY 1 1 | $9.3M Q4 FY ’22 CAPEX $19.7M FY ’22 CAPEX(1) $3.3M Q4 FY ’22 DIVIDENDS $13.2M FY ’22 DIVIDENDS $2.0M Q4 FY ‘22 CASH FROM OPERATIONS $(4.6M) FY ‘22 CASH USED FOR
Slide 12: FY'23 Guidance
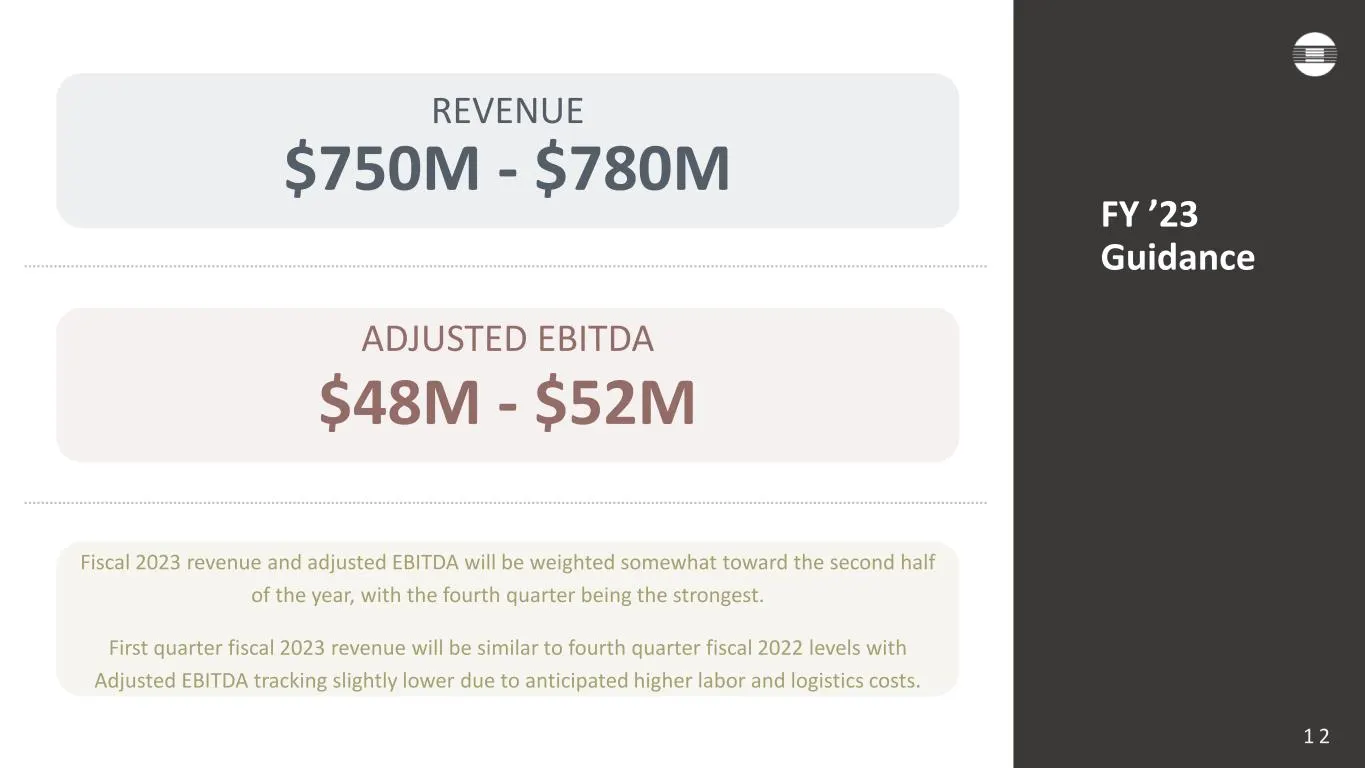
FY ’23 Guidance $750M - $780M REVENUE $48M - $52M ADJUSTED EBITDA 1 2 Fiscal 2023 revenue and adjusted EBITDA will be weighted somewhat toward the second half of the year, with the fourth quarter being the strongest. First quarter fiscal 2023 revenue will be similar to fourth quarter fiscal 2022 lev
Slide 13: Looking Ahead
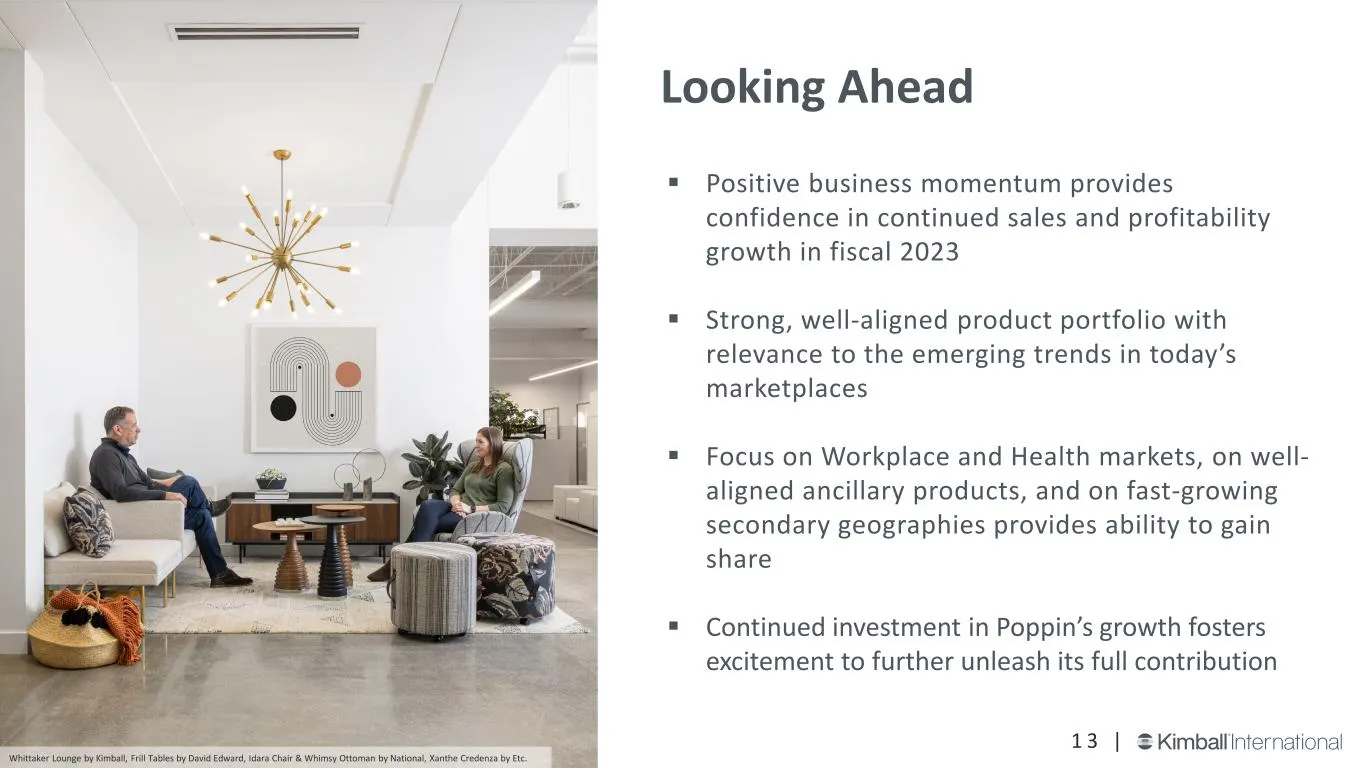
Positive business momentum provides confidence in continued sales and profitability growth in fiscal 2023 Strong, well-aligned product portfolio with relevance to the emerging trends in today’s marketplaces Focus on Workplace and Health markets, on well- aligned ancillary products, and on fast
Slide 14: Our Vision for Impact: ESG Roadmap
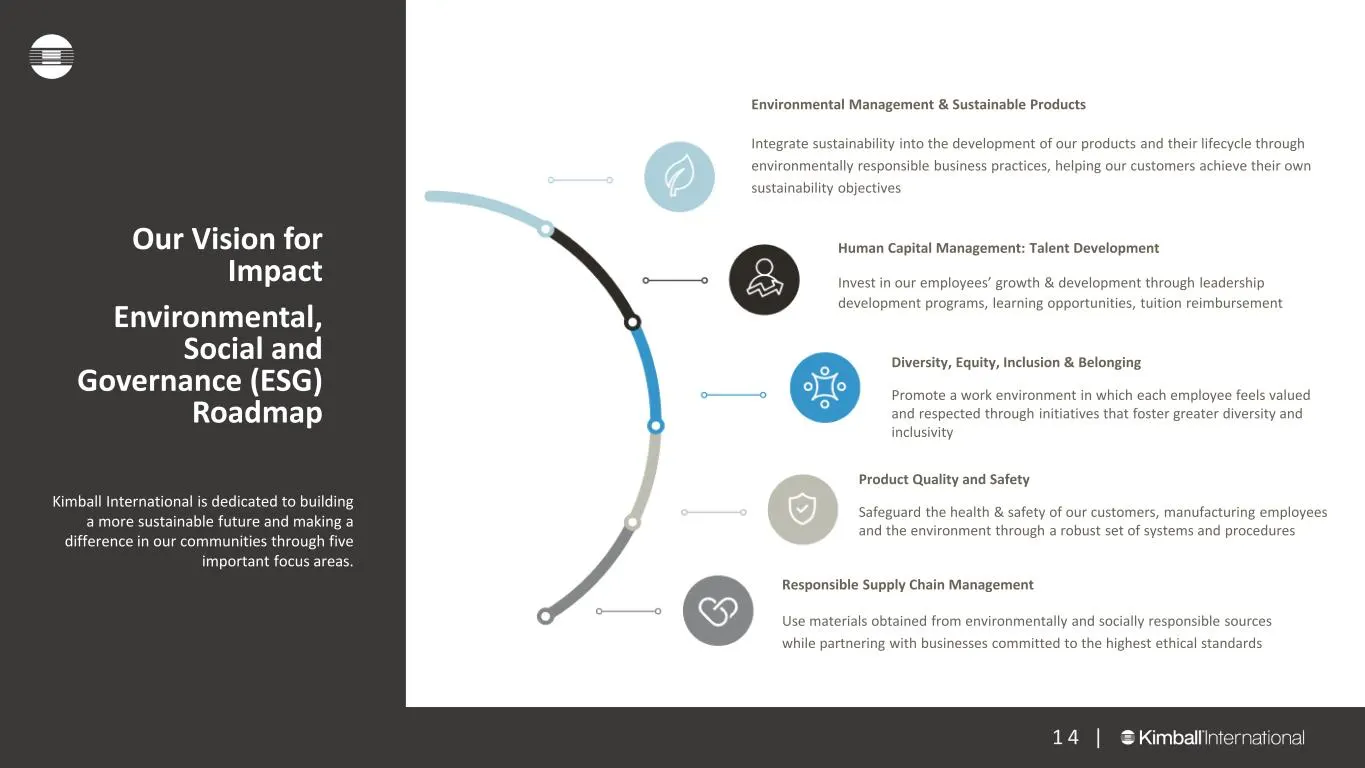
Our Vision for Impact Environmental, Social and Governance (ESG) Roadmap Kimball International is dedicated to building a more sustainable future and making a difference in our communities through five important focus areas. Environmental Management & Sustainable Products Integrate sustainability in

Slide 15: Appendix
Appendix $ Kimballinternational
Slide 16: Non-GAAP Reconciliation (Unaudited)
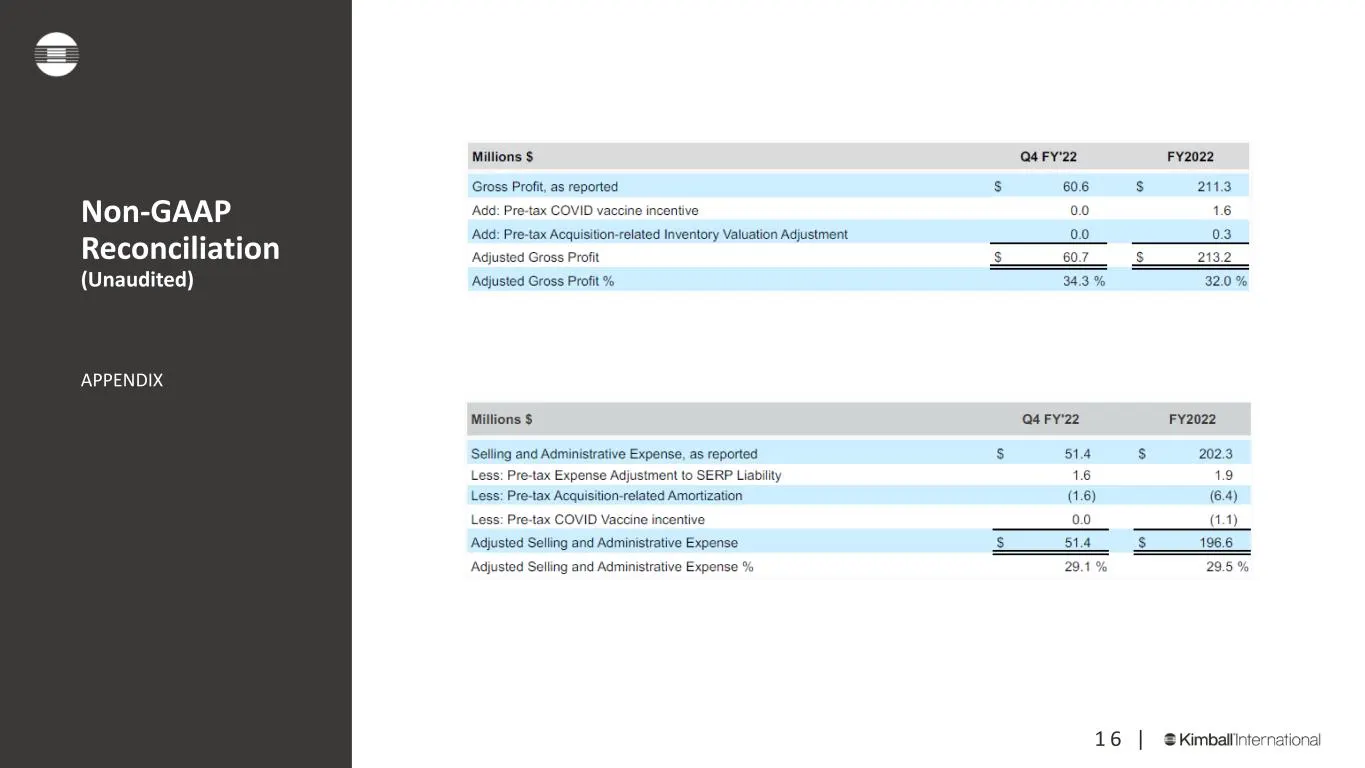
Non-GAAP Reconciliation (Unaudited) APPENDIX 1 6 |
Slide 17: Non-GAAP Reconciliation (Unaudited) (cont.)
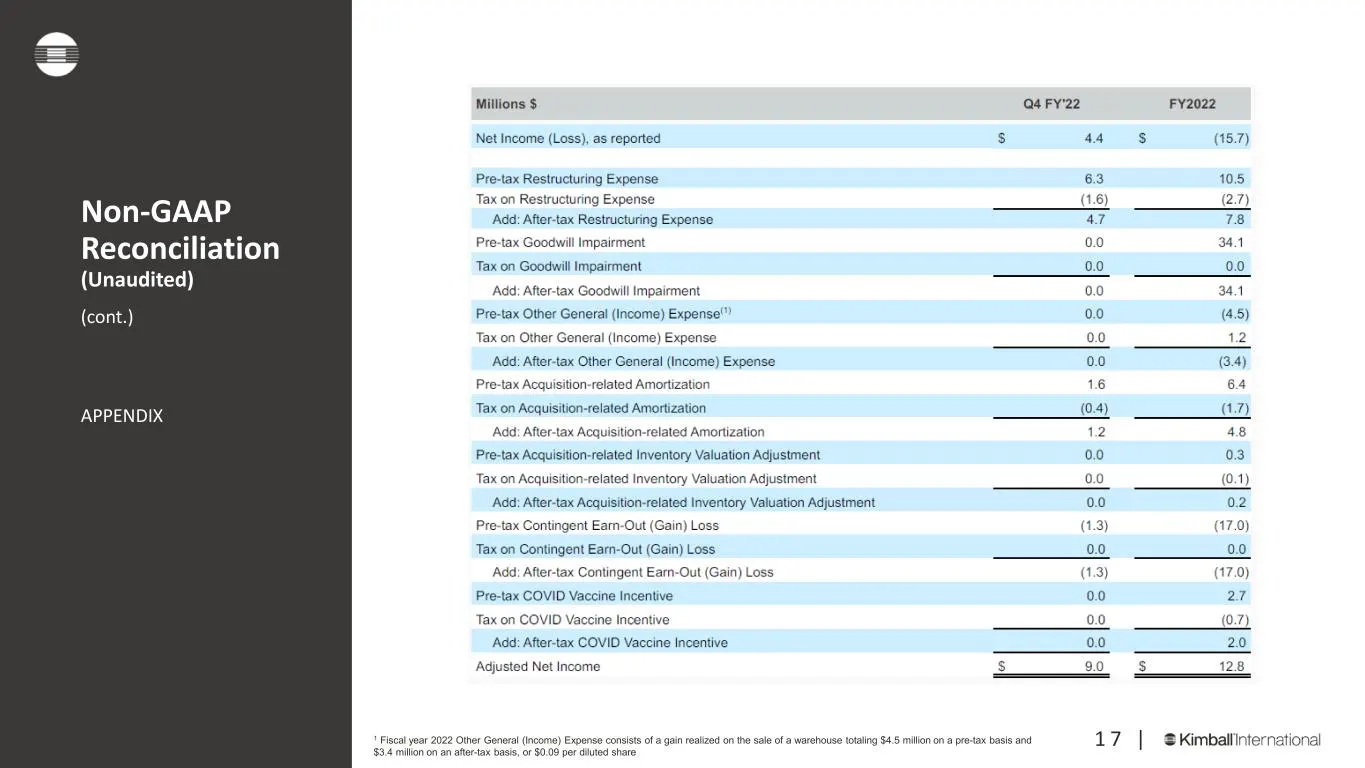
Non-GAAP Reconciliation (Unaudited) (cont.) APPENDIX 1 7 |1 Fiscal year 2022 Other General (Income) Expense consists of a gain realized on the sale of a warehouse totaling $4.5 million on a pre-tax basis and $3.4 million on an after-tax basis, or $0.09 per diluted share
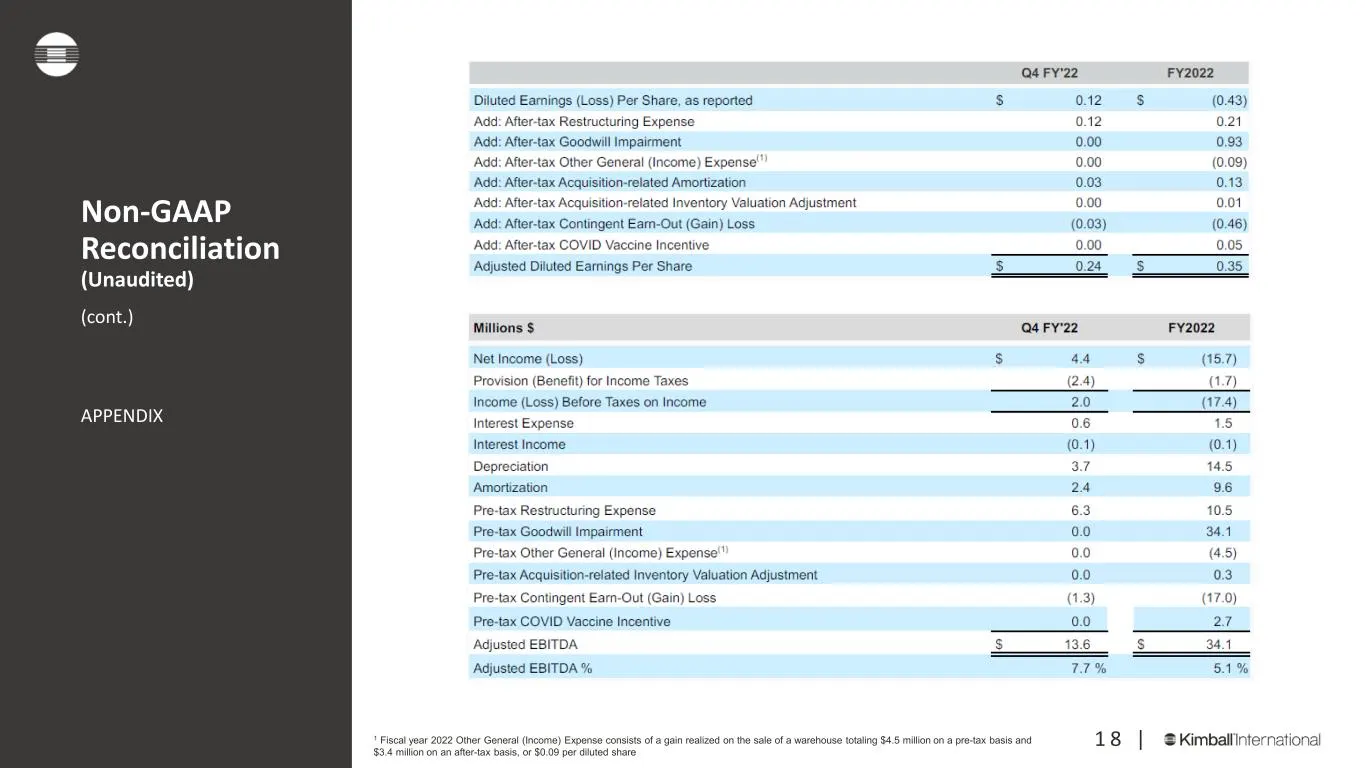
Slide 18: Non-GAAP Reconciliation (Unaudited) (cont.)
Non-GAAP Reconciliation (Unaudited) (cont.) APPENDIX 1 8 |1 Fiscal year 2022 Other General (Income) Expense consists of a gain realized on the sale of a warehouse totaling $4.5 million on a pre-tax basis and $3.4 million on an after-tax basis, or $0.09 per diluted share
Source: SEC EDGAR · 8-K filed Aug 4, 2022
More decks from Kimball International Inc
 Merger or Acquisition (May 2023)30 slides · May 23, 2023
 Merger or Acquisition (March 2023)15 slides · Mar 8, 2023
 Q2 FY2023 Earnings Presentation16 slides · Feb 2, 2023
 Q1 FY2023 Earnings Presentation17 slides · Nov 3, 2022
 Q3 FY2022 Earnings Presentation17 slides · May 3, 2022
 Q2 FY2022 Earnings Presentation17 slides · Feb 3, 2022