comScore, Inc. · NASDAQ:SCOR
comScore — US Future in Focus Webinar (February 2012)
46 slides from comScore's conference presentation, February 2012
Slide 1: Trends Every Marketer Needs to Know
Trends Every Marketer Needs to Know Eli Goodman, Media Evangelist @LosBuenos #FutureInFocus @comScore
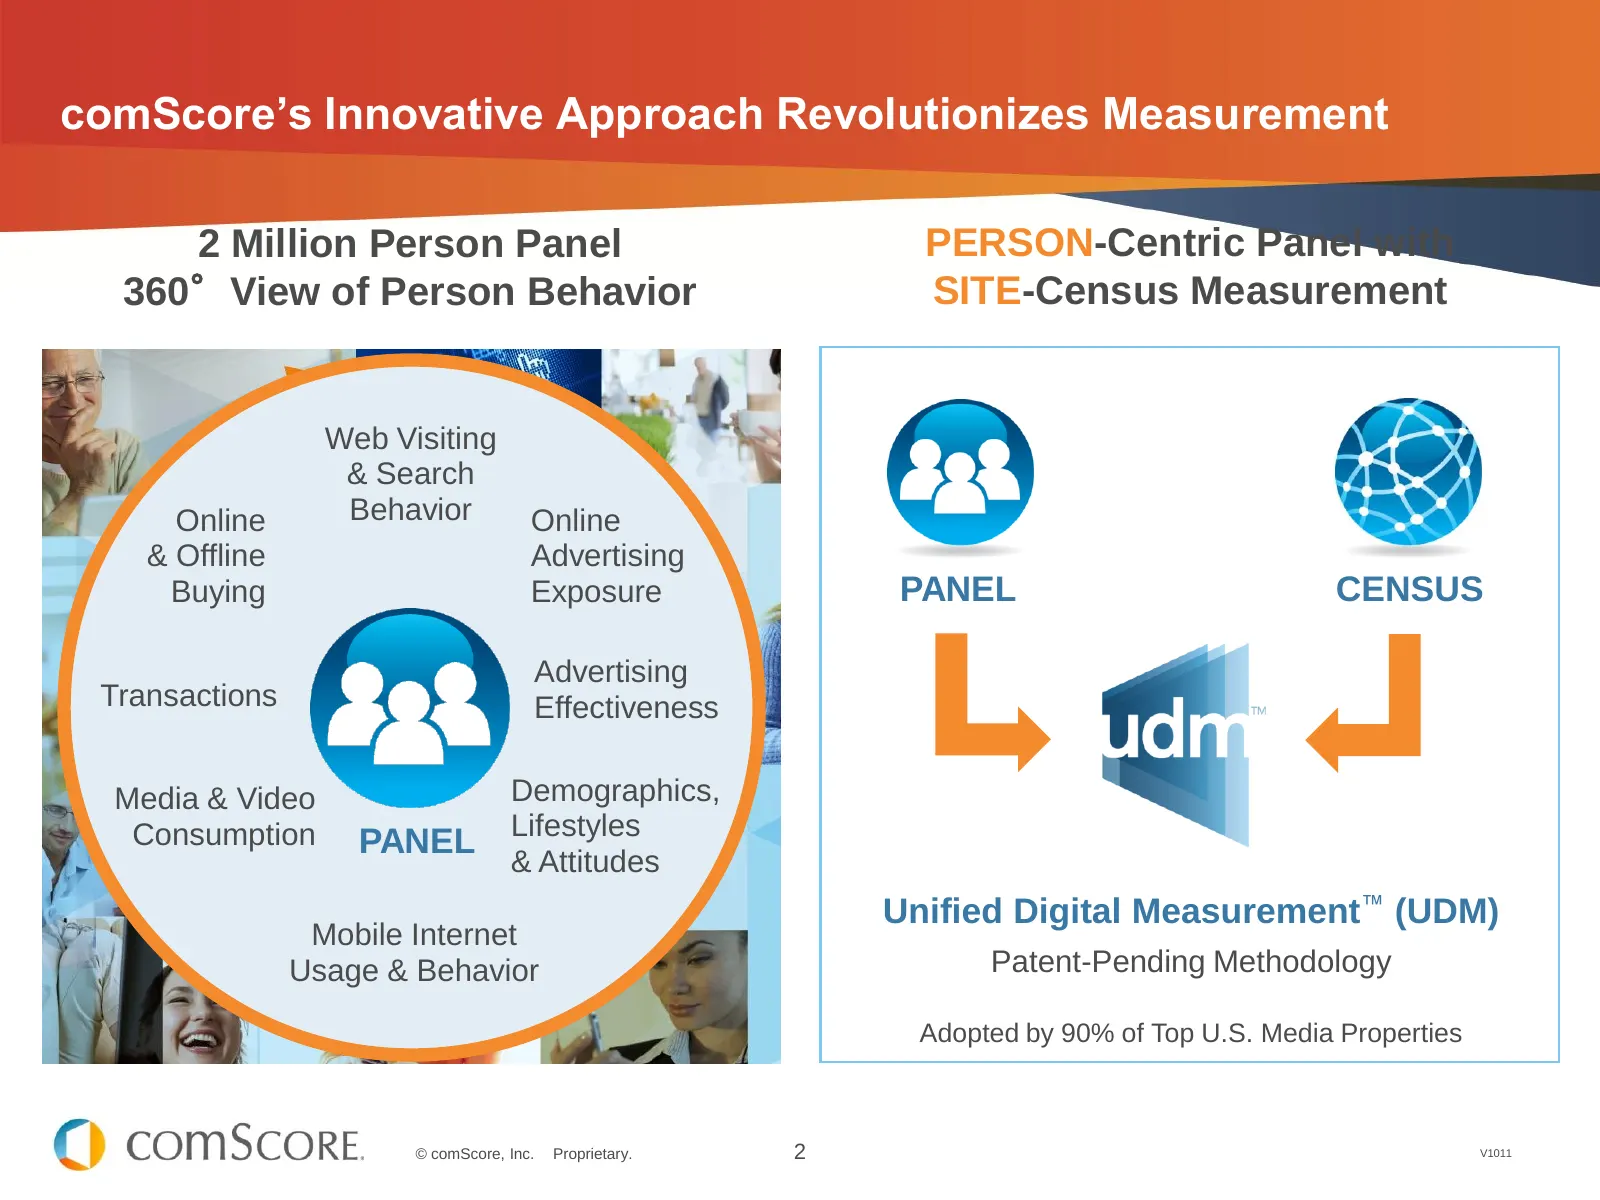
Slide 2: comScore's Innovative Approach Revolutionizes Measurement
comScore’s Innovative Approach Revolutionizes Measurement 2 Million Person Panel PERSON-Centric Panel with 360°View of Person Behavior SITE-Census Measurement Web Visiting & Search Online Behavior Online & Offline Advertising Buying Exposure PANEL CENSUS Advertising Transactions Effectiveness Media
Slide 3: What Trends are Shaping the Year
What Trends are Shaping the Year TOP WEB PROPERTIES SOCIAL NETWORKING 1 Social Networking is the SEARCH Most Popular Online Activity ONLINE VIDEO Worldwide DIGITAL ADVERTISING MOBILE E-COMMERCE

Slide 4: Top Web Properties
TOP WEB PROPERTIES © comScore.
Slide 5: Facebook-Led Social Media Market Is Redefining Communication
FACEBOOK-LED SOCIAL MEDIA MARKET IS REDEFINING COMMUNICATION IN THE DIGITAL AND PHYSICAL WORLDS © comScore, Inc. Proprietary. 5
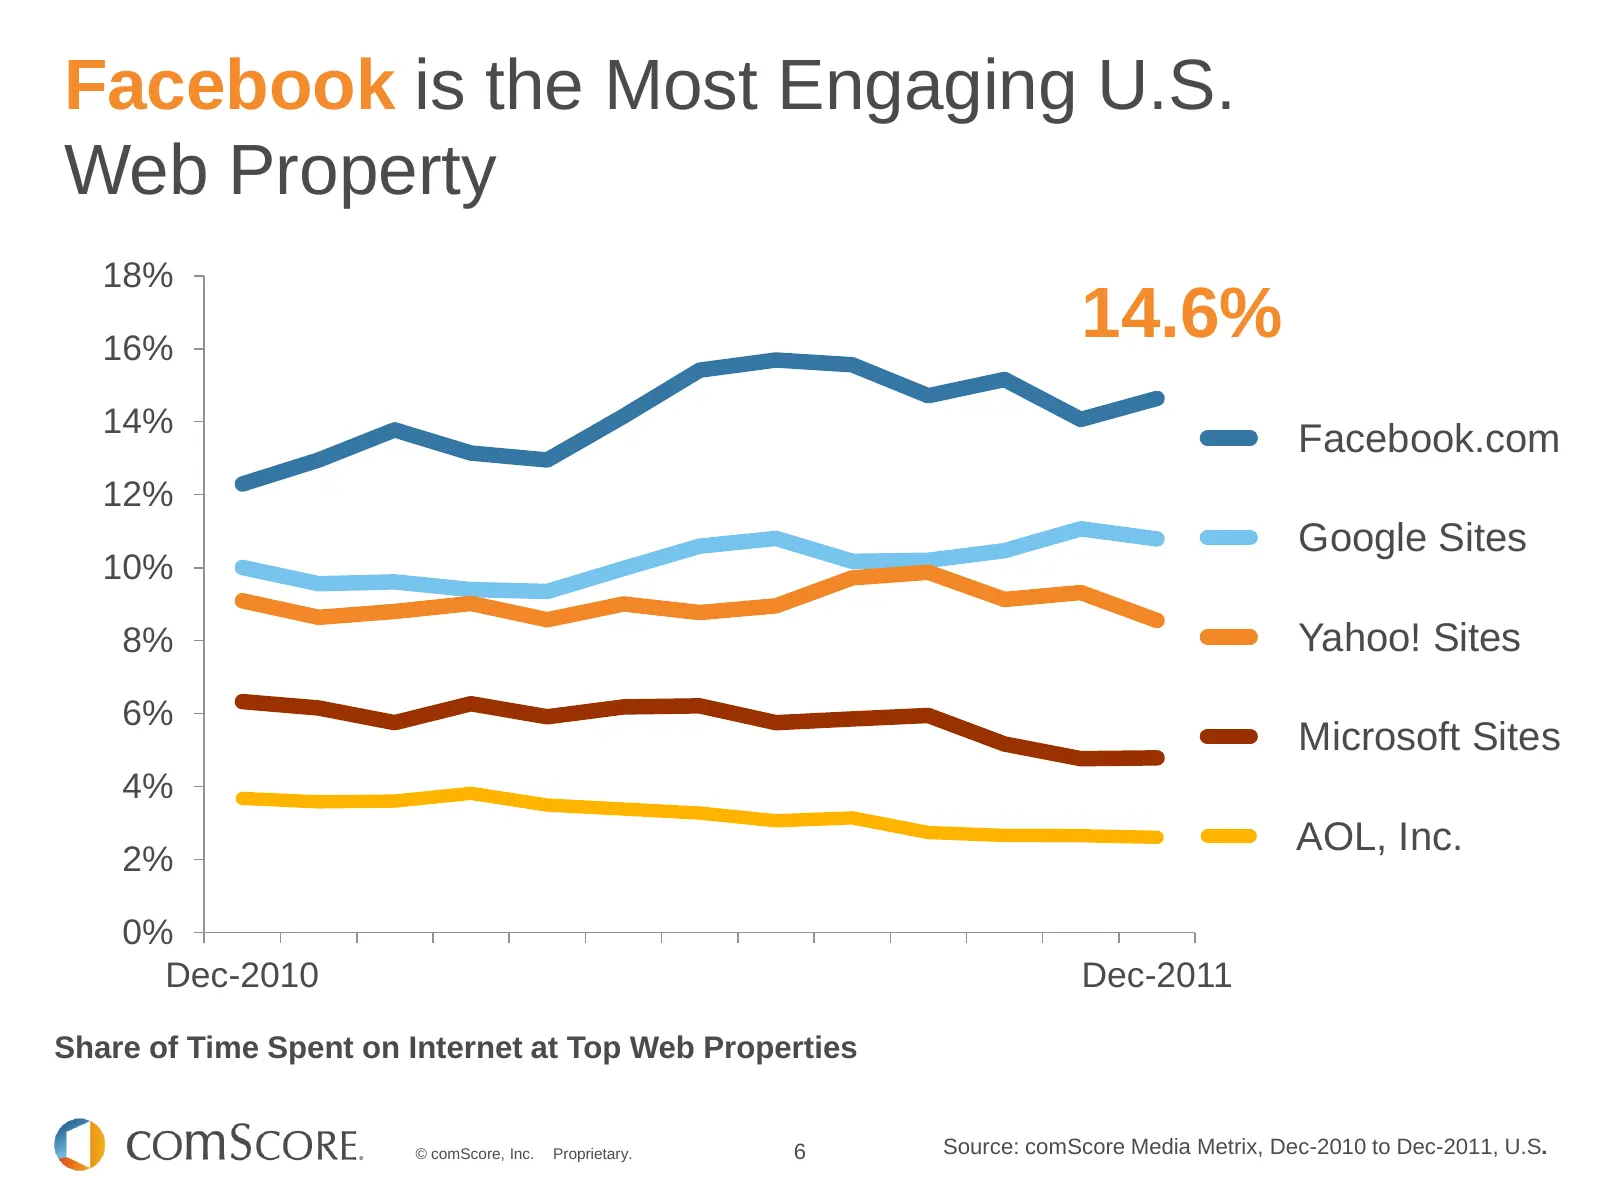
Slide 6: Facebook is the Most Engaging U.S. Web Property
Facebook is the Most Engaging U.S. Web Property 18% 16% 14.6% 14.6% 1 14% Social Networking is the Facebook.com 12% 10% Most Popular Online Activity Google Sites 8% 6% Worldwide Yahoo! Sites Microsoft Sites 4% AOL, Inc. 2% 0% Dec-2010 Dec-2011 Share of Time Spent on Internet at Top Web Properties ©
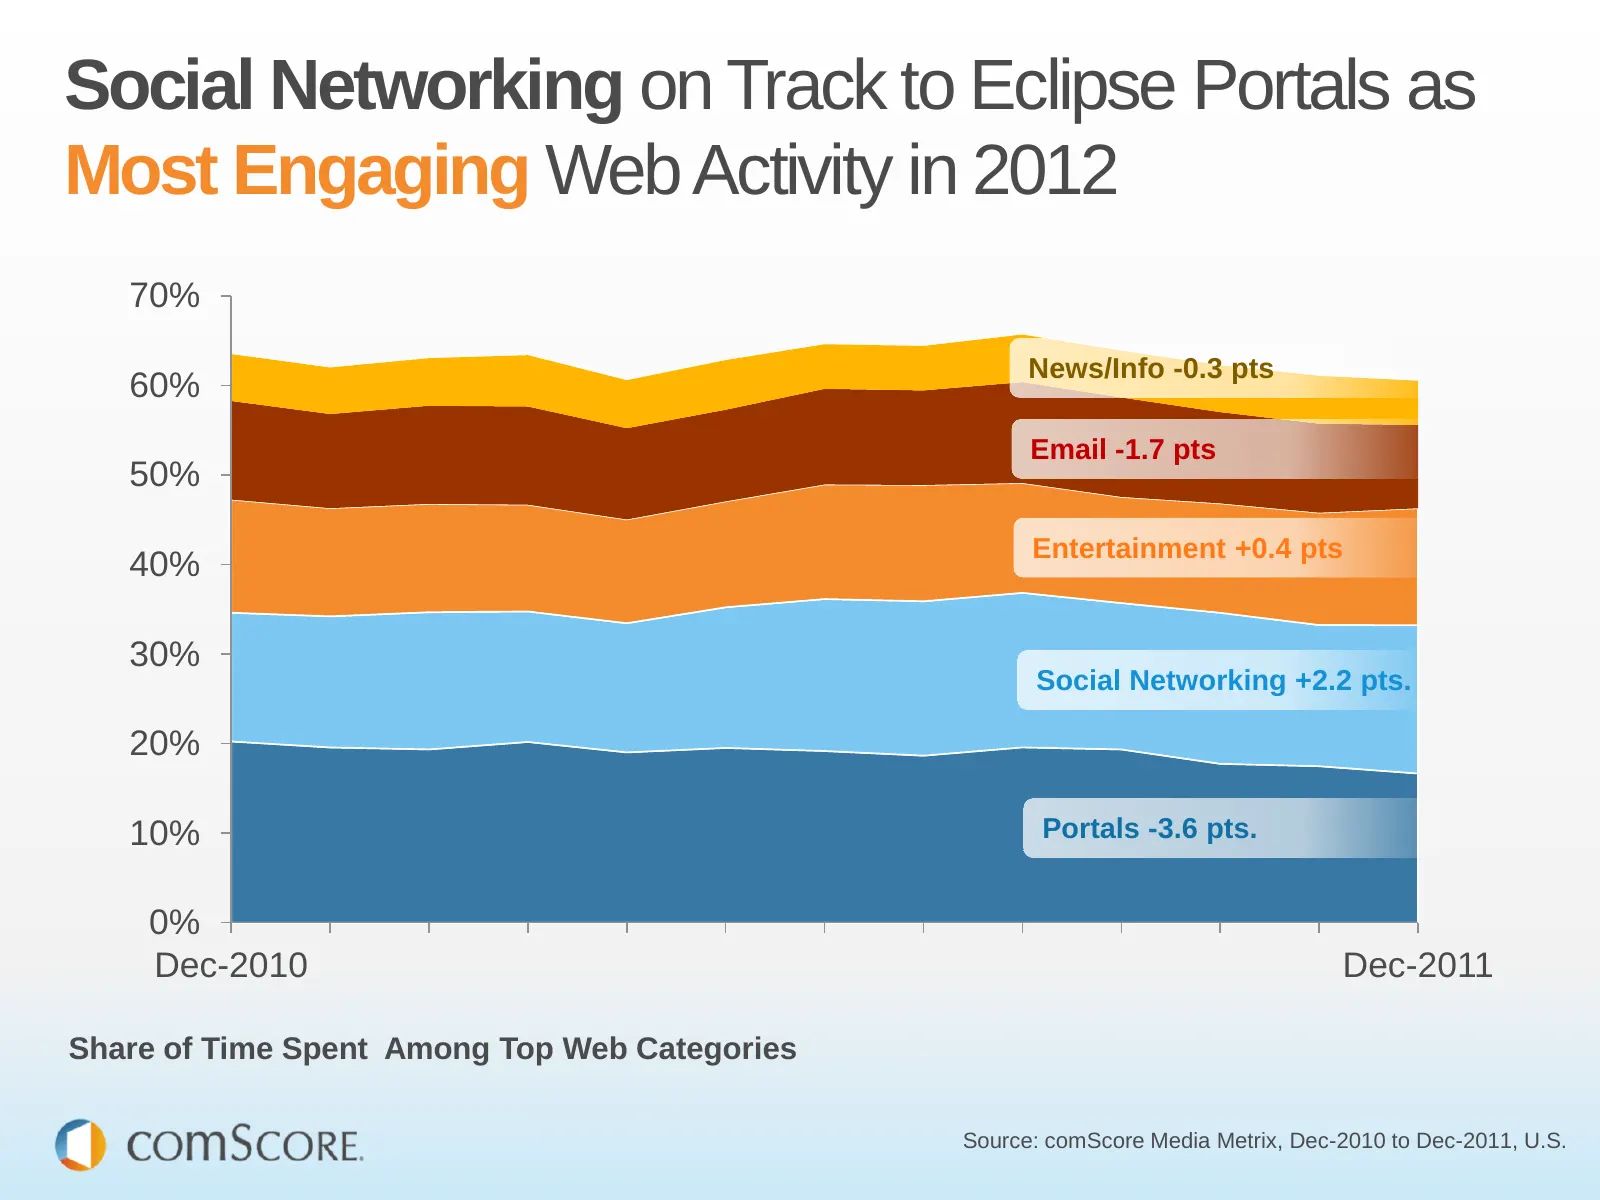
Slide 7: Social Networking on Track to Eclipse Portals in 2012
Social Networking on Track to Eclipse Portals as Most Engaging Web Activity in 2012 70% News/Info -0.3 pts 60% Email -1.7 pts 50% Entertainment +0.4 pts 40% 30% Social Networking +2.2 pts. 20% 10% Portals -3.6 pts. 0% Dec-2010 Dec-2011 Share of Time Spent Among Top Web Categories Source: comScore Me
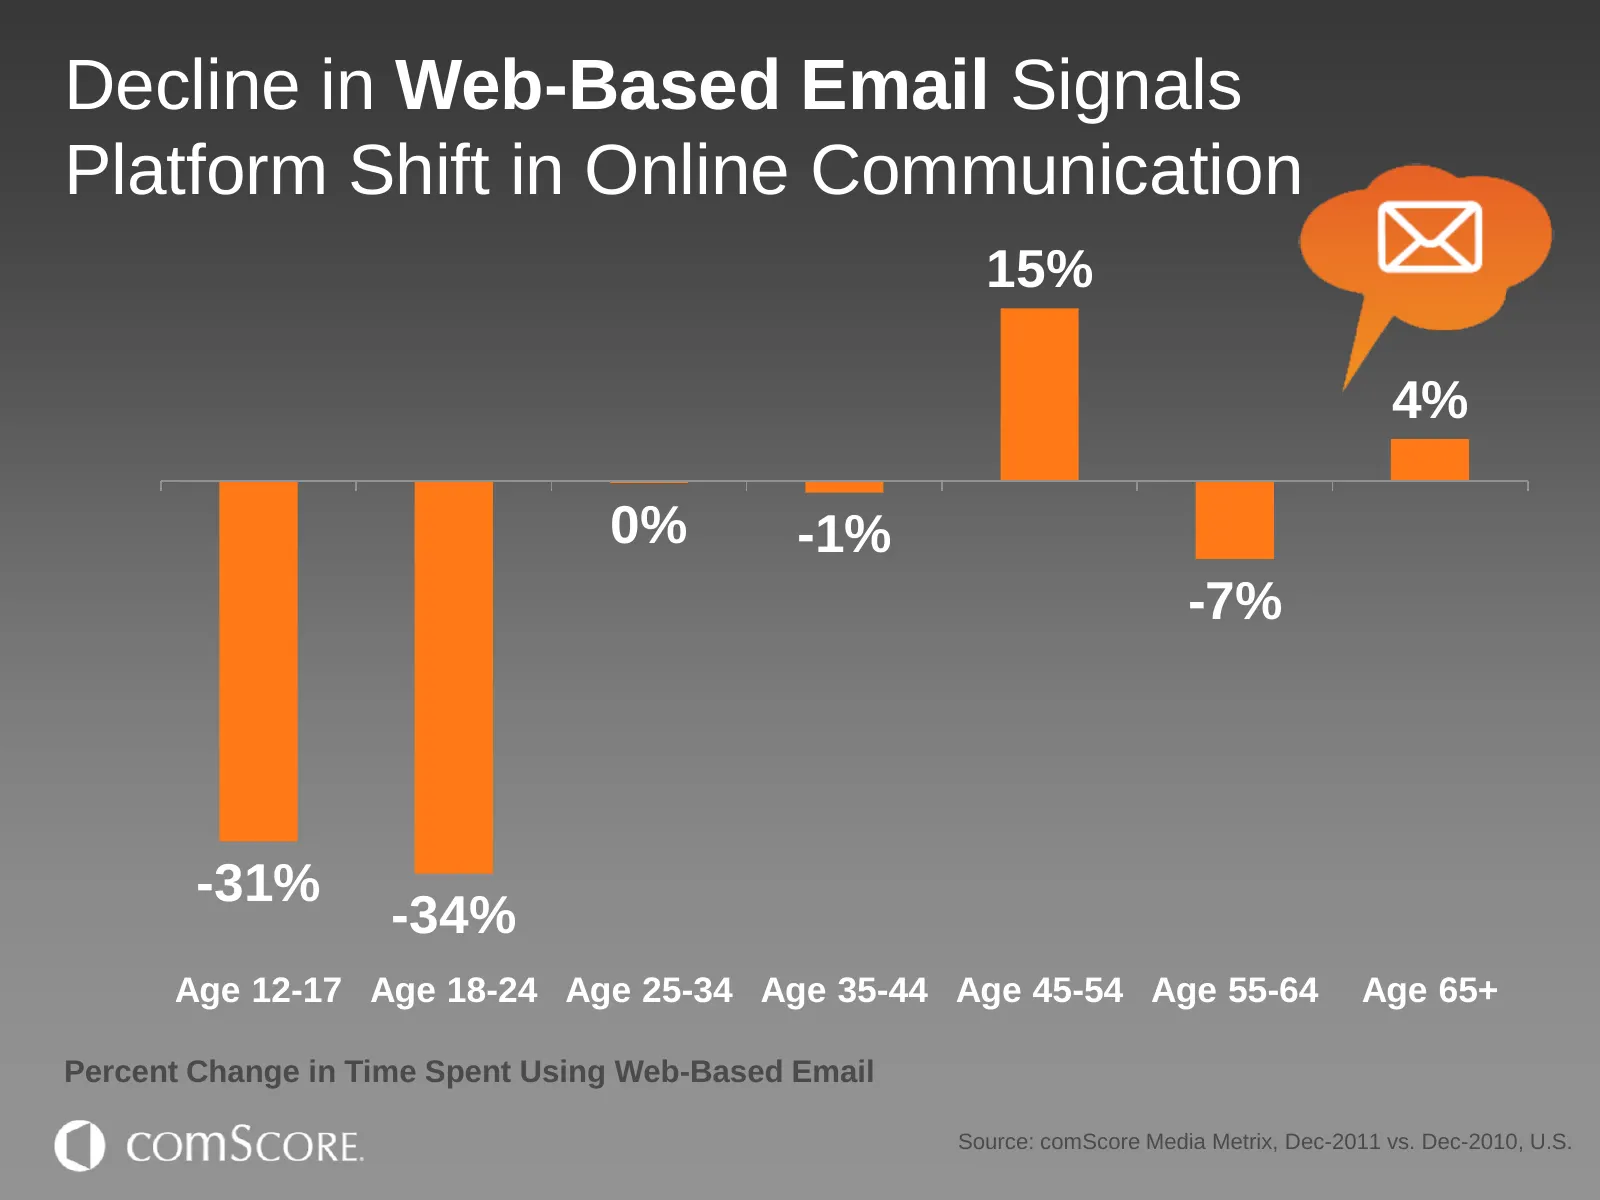
Slide 8: Decline in Web-Based Email Signals Platform Shift
Decline in Web-Based Email Signals Platform Shift in Online Communication 15% 4% 0% -1% -7% -31% -34% Age 12-17 Age 18-24 Age 25-34 Age 35-44 Age 45-54 Age 55-64 Age 65+ Percent Change in Time Spent Using Web-Based Email Source: comScore Media Metrix, Dec-2011 vs. Dec-2010, U.S.
Slide 9: Social Networking
SOCIAL NETWORKING © comScore.
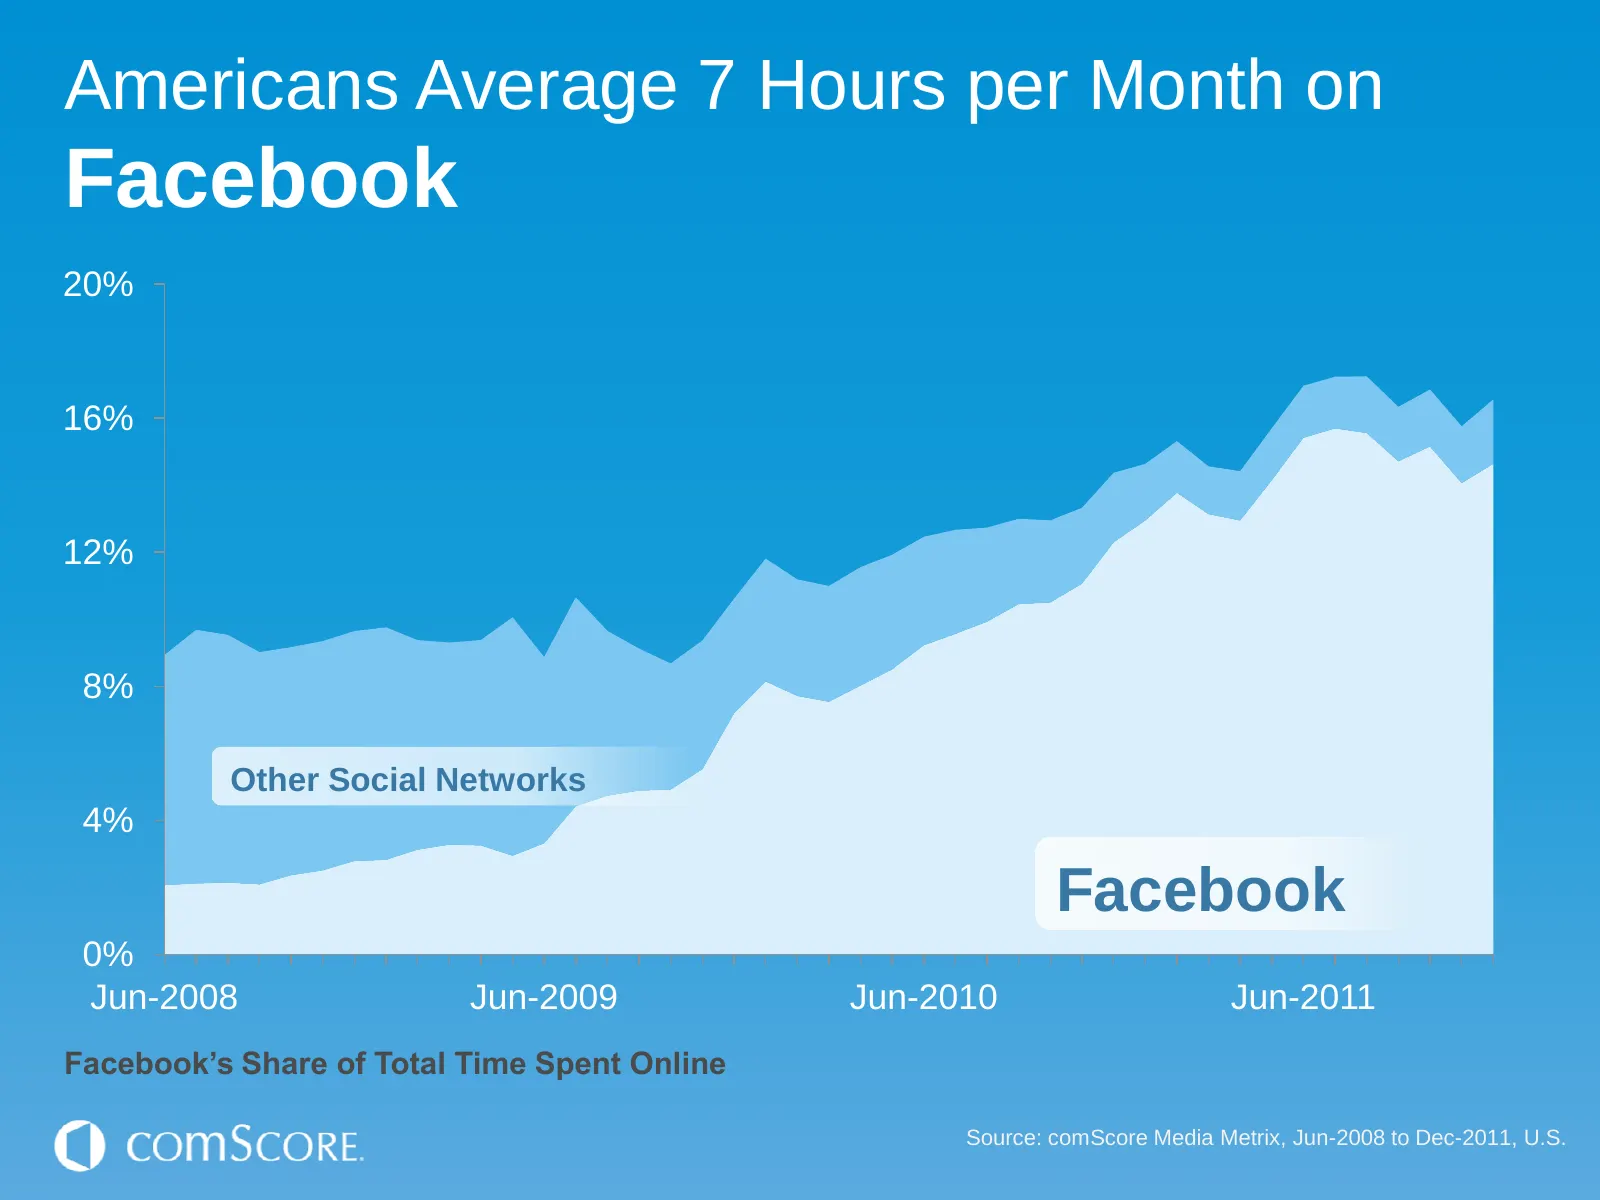
Slide 10: Facebook's Share of Total Time Spent Online
Americans Average 7 Hours per Month on Facebook 20% 16% 12% 8% Other Social Networks 4% Facebook 0% Jun-2008 Jun-2009 Jun-2010 Jun-2011 Facebook’s Share of Total Time Spent Online Source: comScore Media Metrix, Jun-2008 to Dec-2011, U.S.
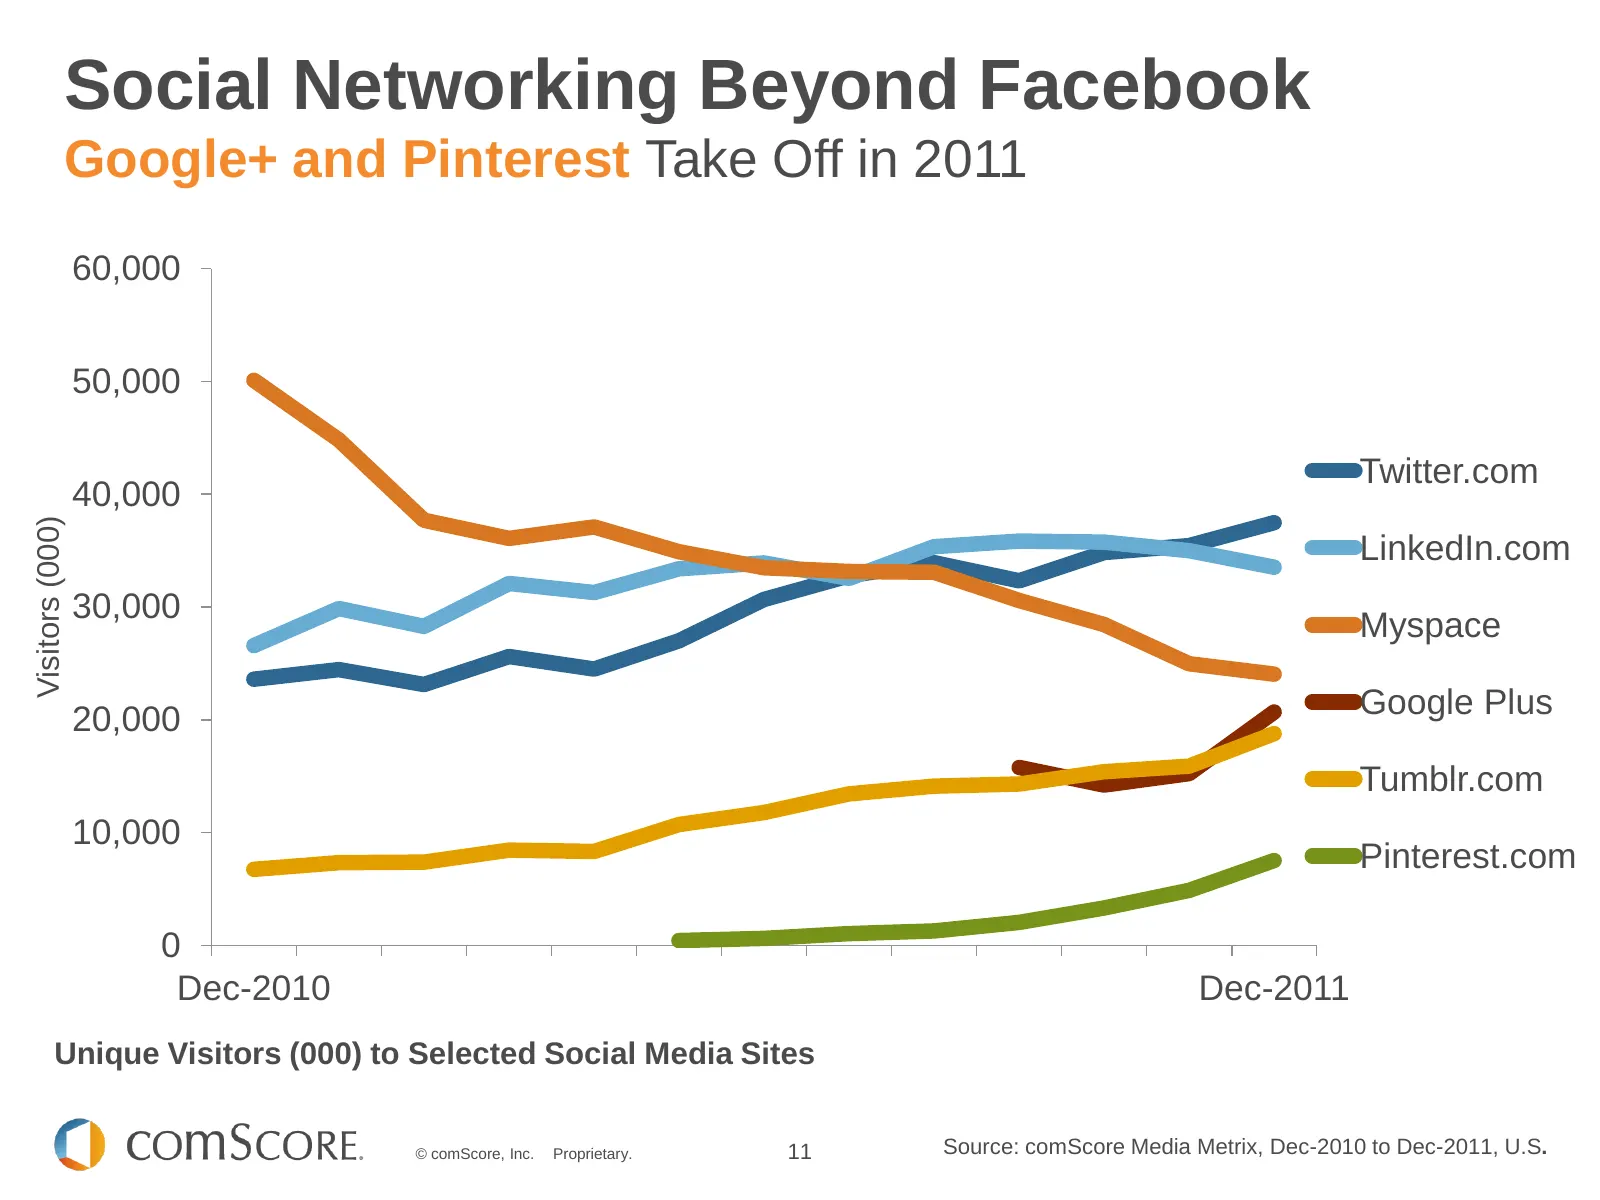
Slide 11: Social Networking Beyond Facebook
Social Networking Beyond Facebook Google+ and Pinterest Take Off in 2011 60,000 50,000 1 Social Networking is the Twitter.com 40,000 Most Popular Online Activity Visitors (000) LinkedIn.com 30,000 Worldwide Myspace Google Plus 20,000 Tumblr.com 10,000 Pinterest.com 0 Dec-2010 Dec-2011 Unique Visitor
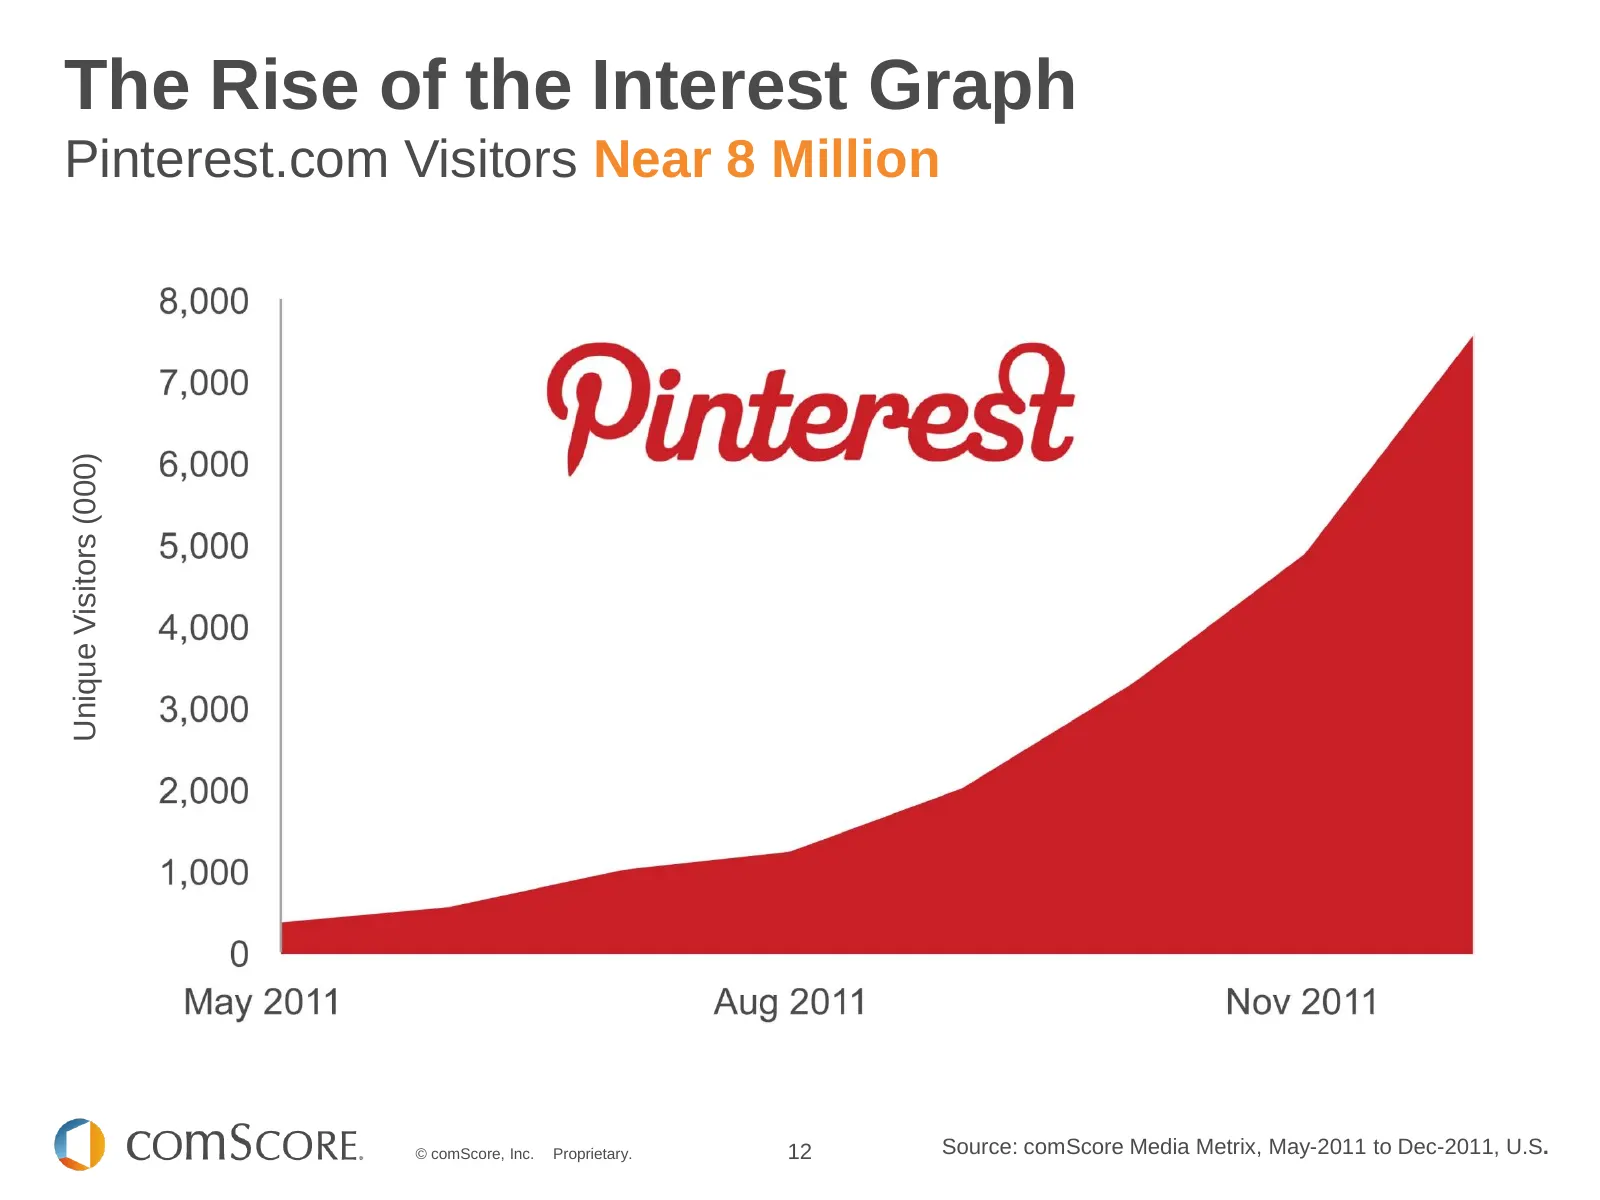
Slide 12: The Rise of the Interest Graph
The Rise of the Interest Graph Pinterest.com Visitors Near 8 Million Social Networking is the Unique Visitors (000) Most Popular Online Activity Worldwide © comScore, Inc. Proprietary. 12 Source: comScore Media Metrix, May-2011 to Dec-2011, U.S.
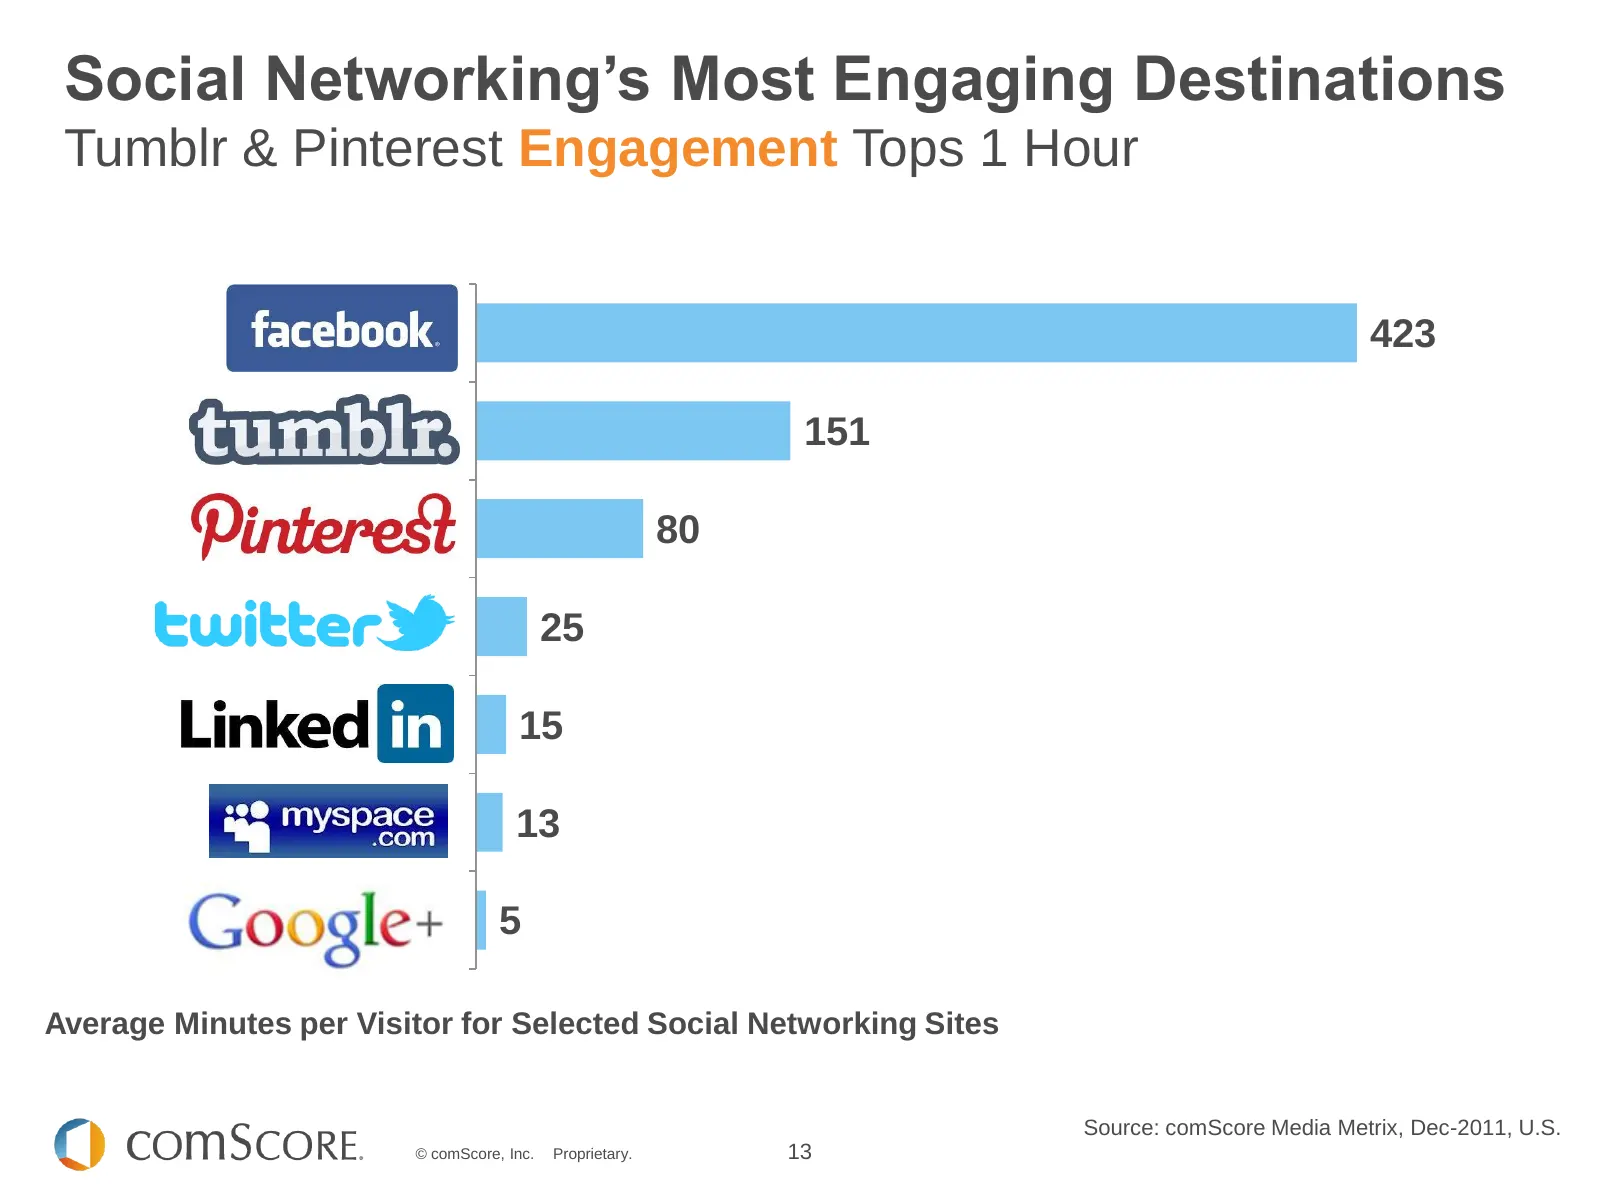
Slide 13: Social Networking's Most Engaging Destinations
Social Networking’s Most Engaging Destinations Tumblr & Pinterest Engagement Tops 1 Hour 423 Social Networking 151 is the 1 Most Popular 80 Worldwide 25 Online Activity 15 13 5 Average Minutes per Visitor for Selected Social Networking Sites Source: comScore Media Metrix, Dec-2011, U.S. © comScore,

Slide 14: Search
© comScore.
Slide 15: Bing Gains Ground in Search
BING GAINS GROUND IN SEARCH © comScore, Inc. Proprietary. 15
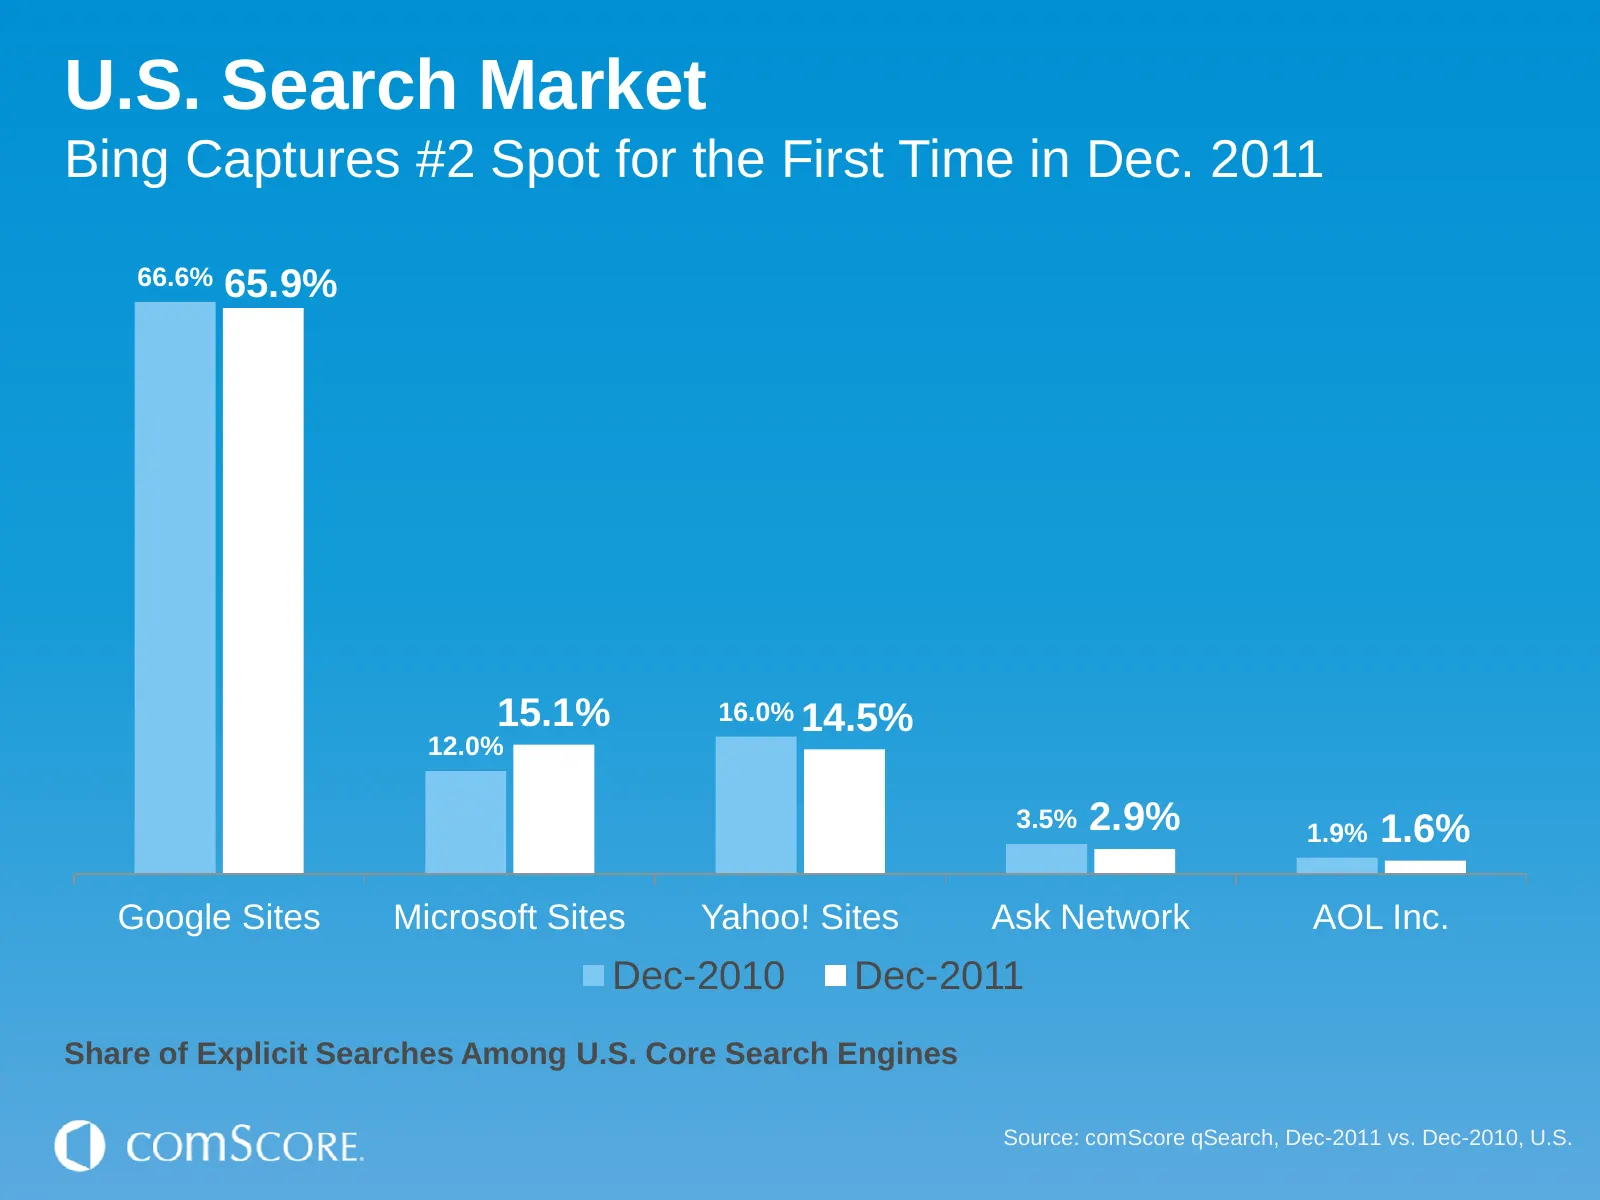
Slide 16: U.S. Search Market
U.S. Search Market Bing Captures #2 Spot for the First Time in Dec. 2011 66.6% 65.9% 15.1% 16.0% 14.5% 12.0% 3.5% 2.9% 1.9% 1.6% Google Sites Microsoft Sites Yahoo! Sites Ask Network AOL Inc. Dec-2010 Dec-2011 Share of Explicit Searches Among U.S. Core Search Engines Source: comScore qSearch, Dec-20
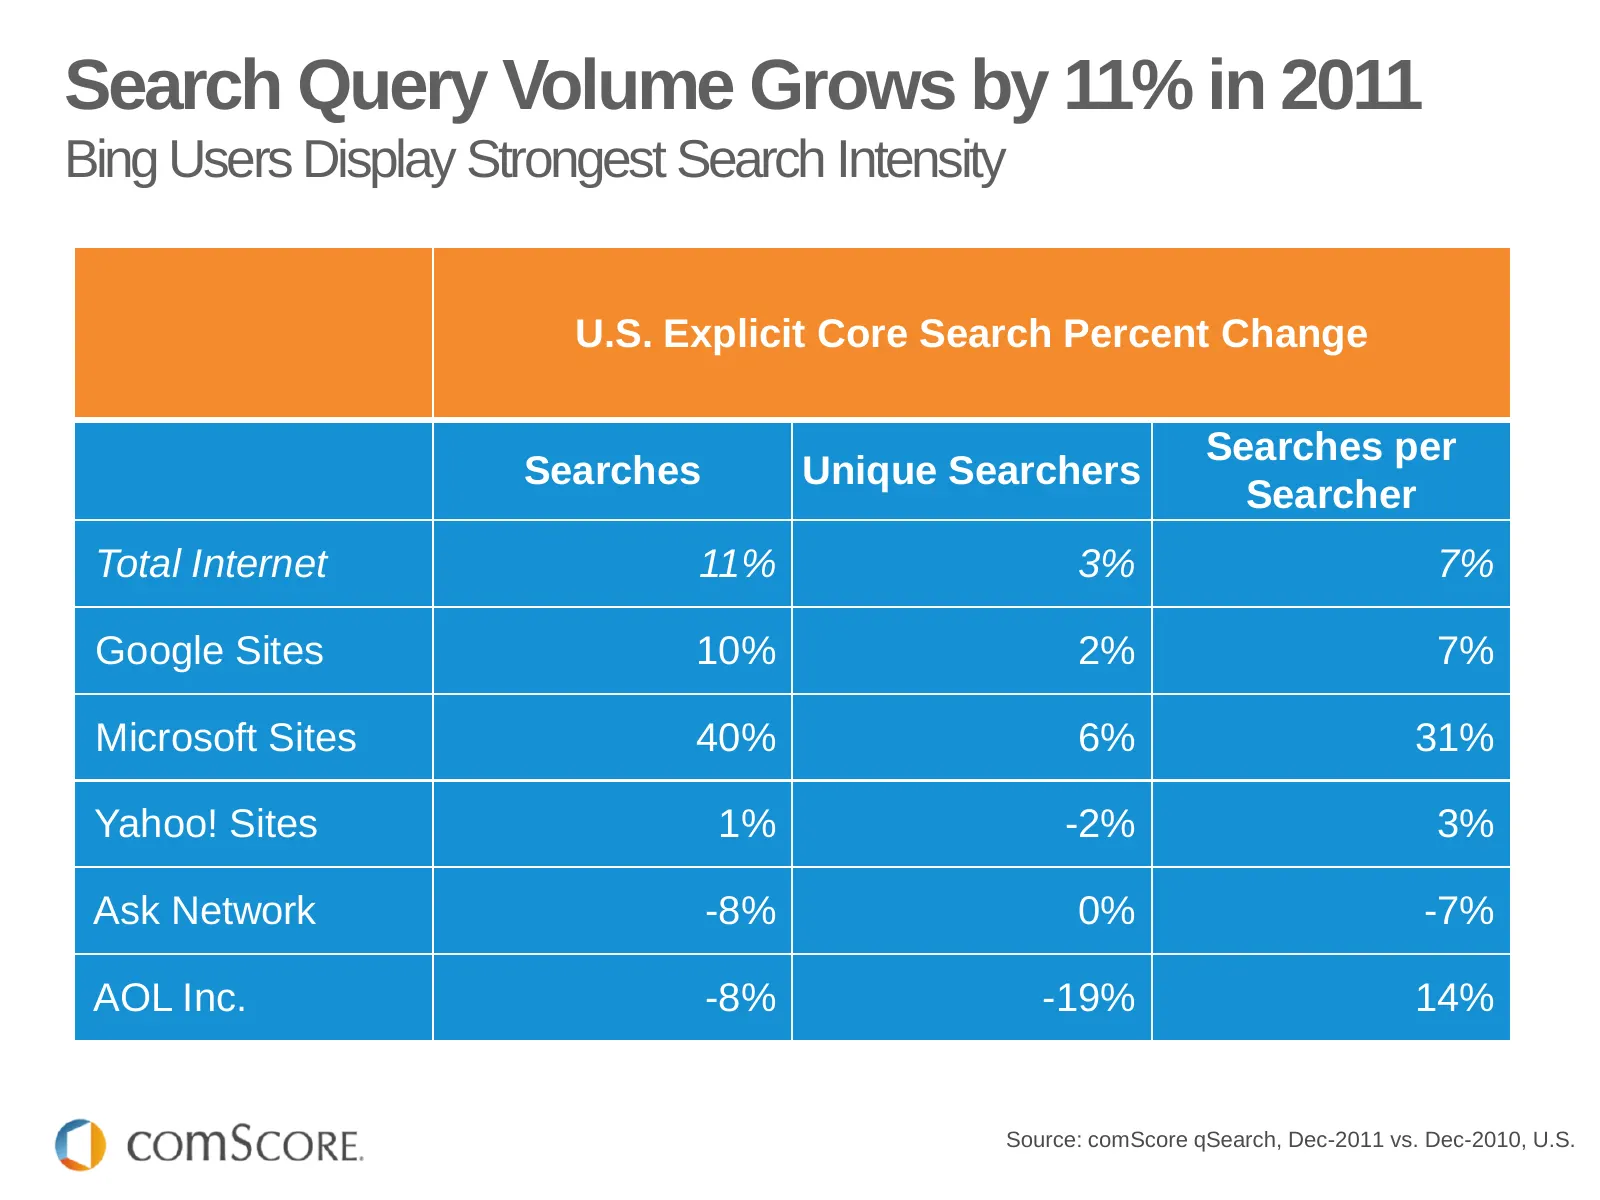
Slide 17: Search Query Volume Grows by 11% in 2011
Search Query Volume Grows by 11% in 2011 Bing Users Display Strongest Search Intensity U.S. Explicit Core Search Percent Change Searches per Searches Unique Searchers Searcher Total Internet 11% 3% 7% Google Sites 10% 2% 7% Microsoft Sites 40% 6% 31% Yahoo! Sites 1% -2% 3% Ask Network -8% 0% -7% AOL

Slide 18: Online Video
ONLINE VIDEO © comScore.

Slide 19: Online Video Boom Signals Sea Change in Video Ecosystem
ONLINE VIDEO BOOM SIGNALS SEA CHANGE IN VIDEO ECOSYSTEM © comScore, Inc. Proprietary. 19
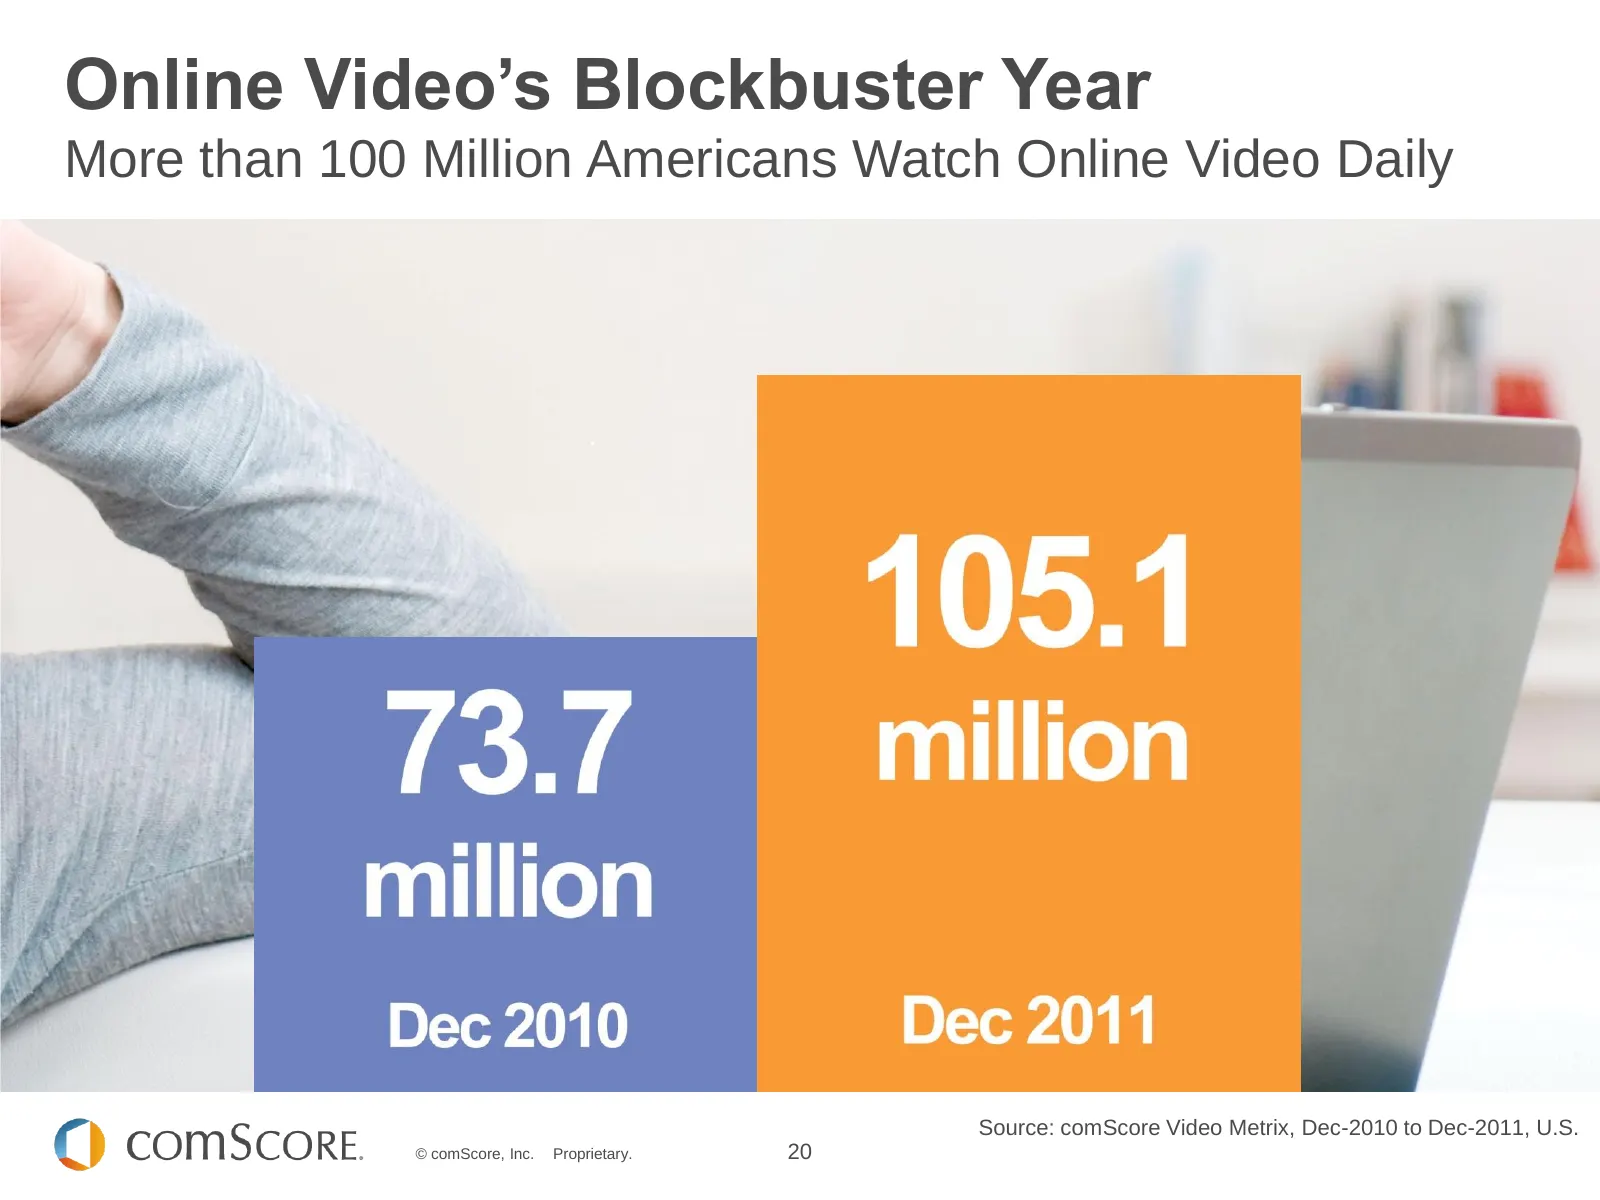
Slide 20: Online Video's Blockbuster Year
Online Video’s Blockbuster Year More than 100 Million Americans Watch Online Video Daily 1 Social Networking is the Most Popular Online Activity Worldwide Source: comScore Video Metrix, Dec-2010 to Dec-2011, U.S. © comScore, Inc. Proprietary. 20
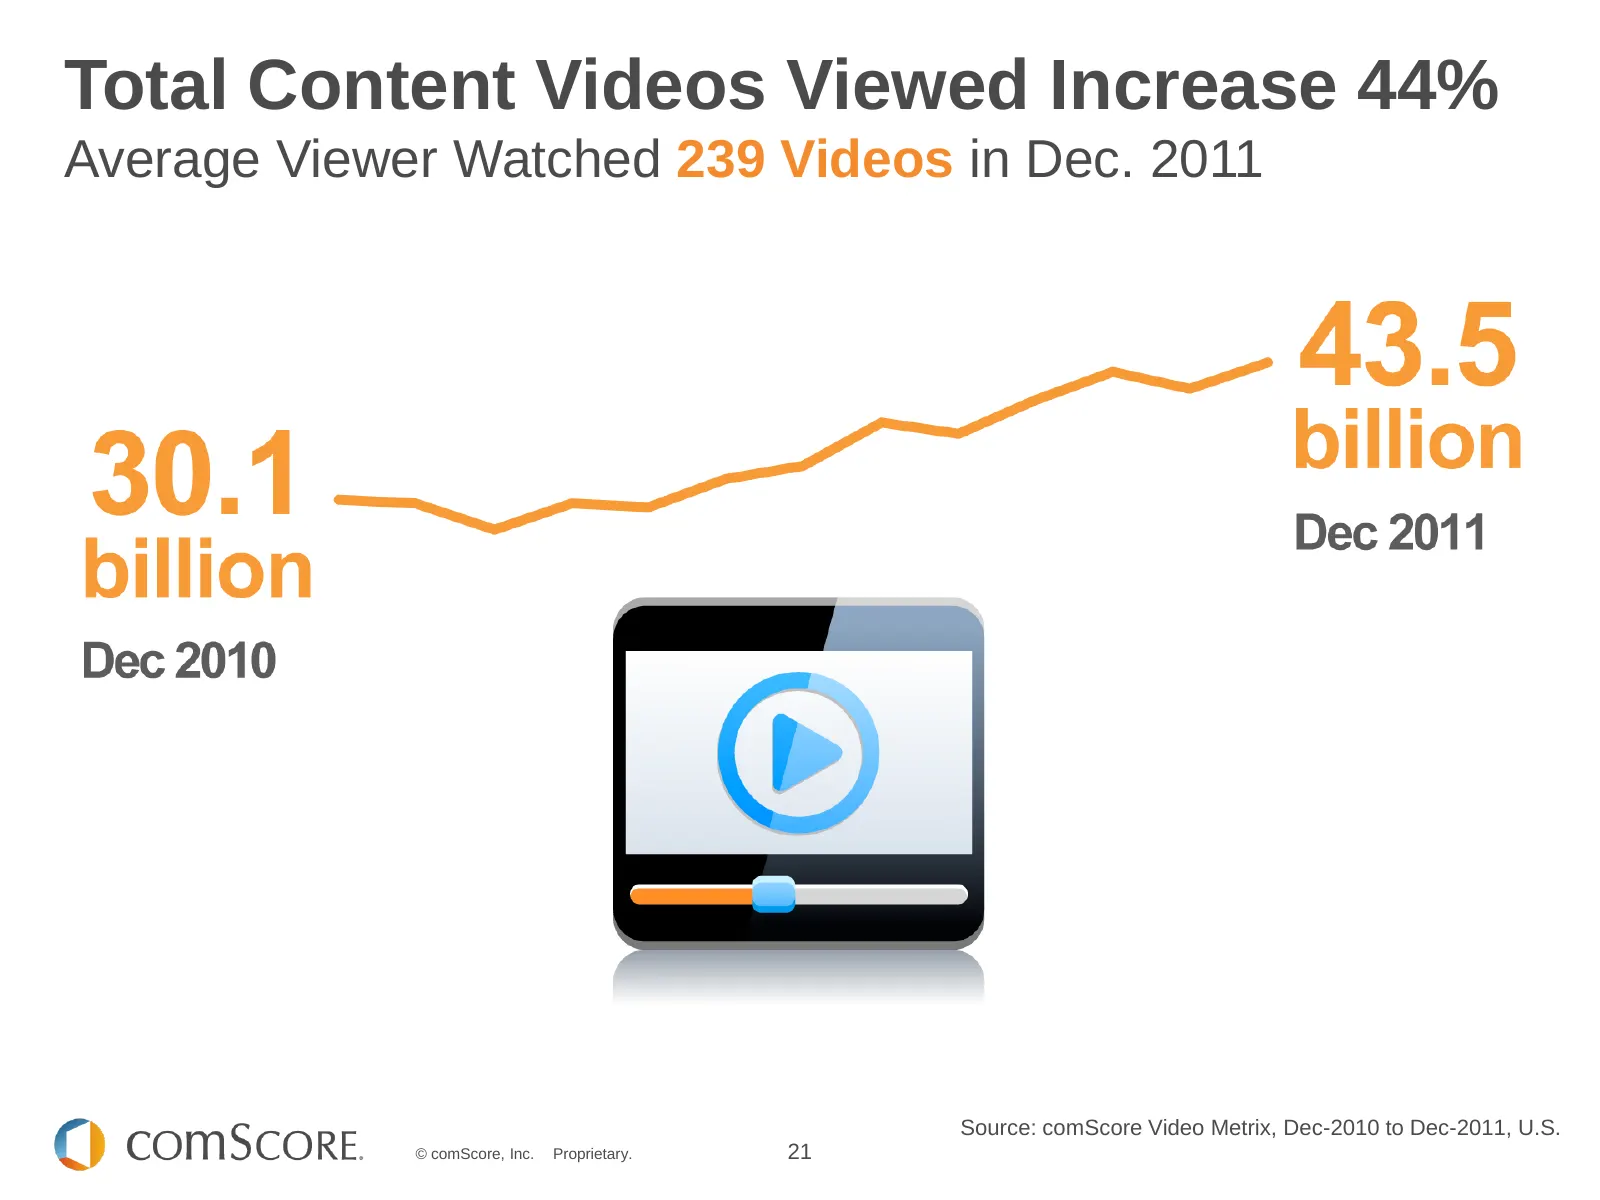
Slide 21: Total Content Videos Viewed Increase 44%
Total Content Videos Viewed Increase 44% Average Viewer Watched 239 Videos in Dec. 2011 1 Social Networking is the Most Popular Online Activity Worldwide Source: comScore Video Metrix, Dec-2010 to Dec-2011, U.S. © comScore, Inc. Proprietary. 21
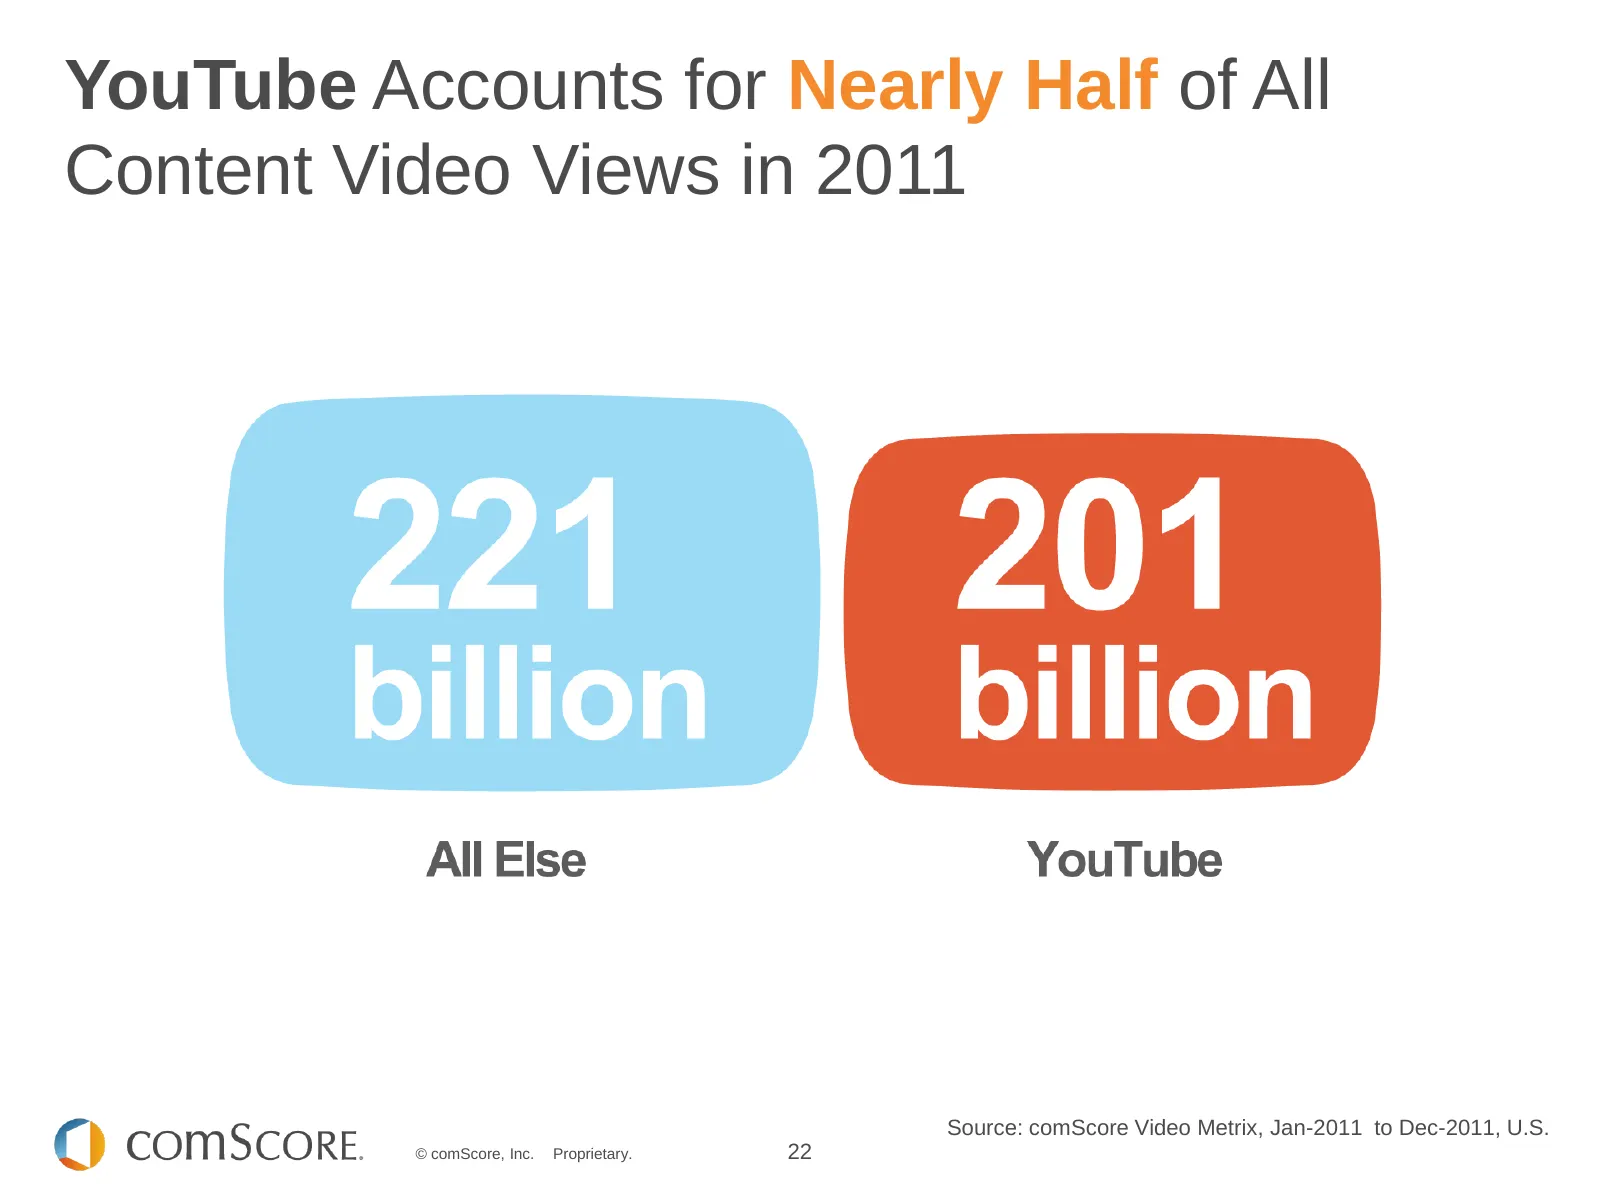
Slide 22: YouTube Accounts for Nearly Half of Content Video Views
YouTube Accounts for Nearly Half of All Content Video Views in 2011 1 Social Networking is the Most Popular Online Activity Worldwide Source: comScore Video Metrix, Jan-2011 to Dec-2011, U.S. © comScore, Inc. Proprietary. 22
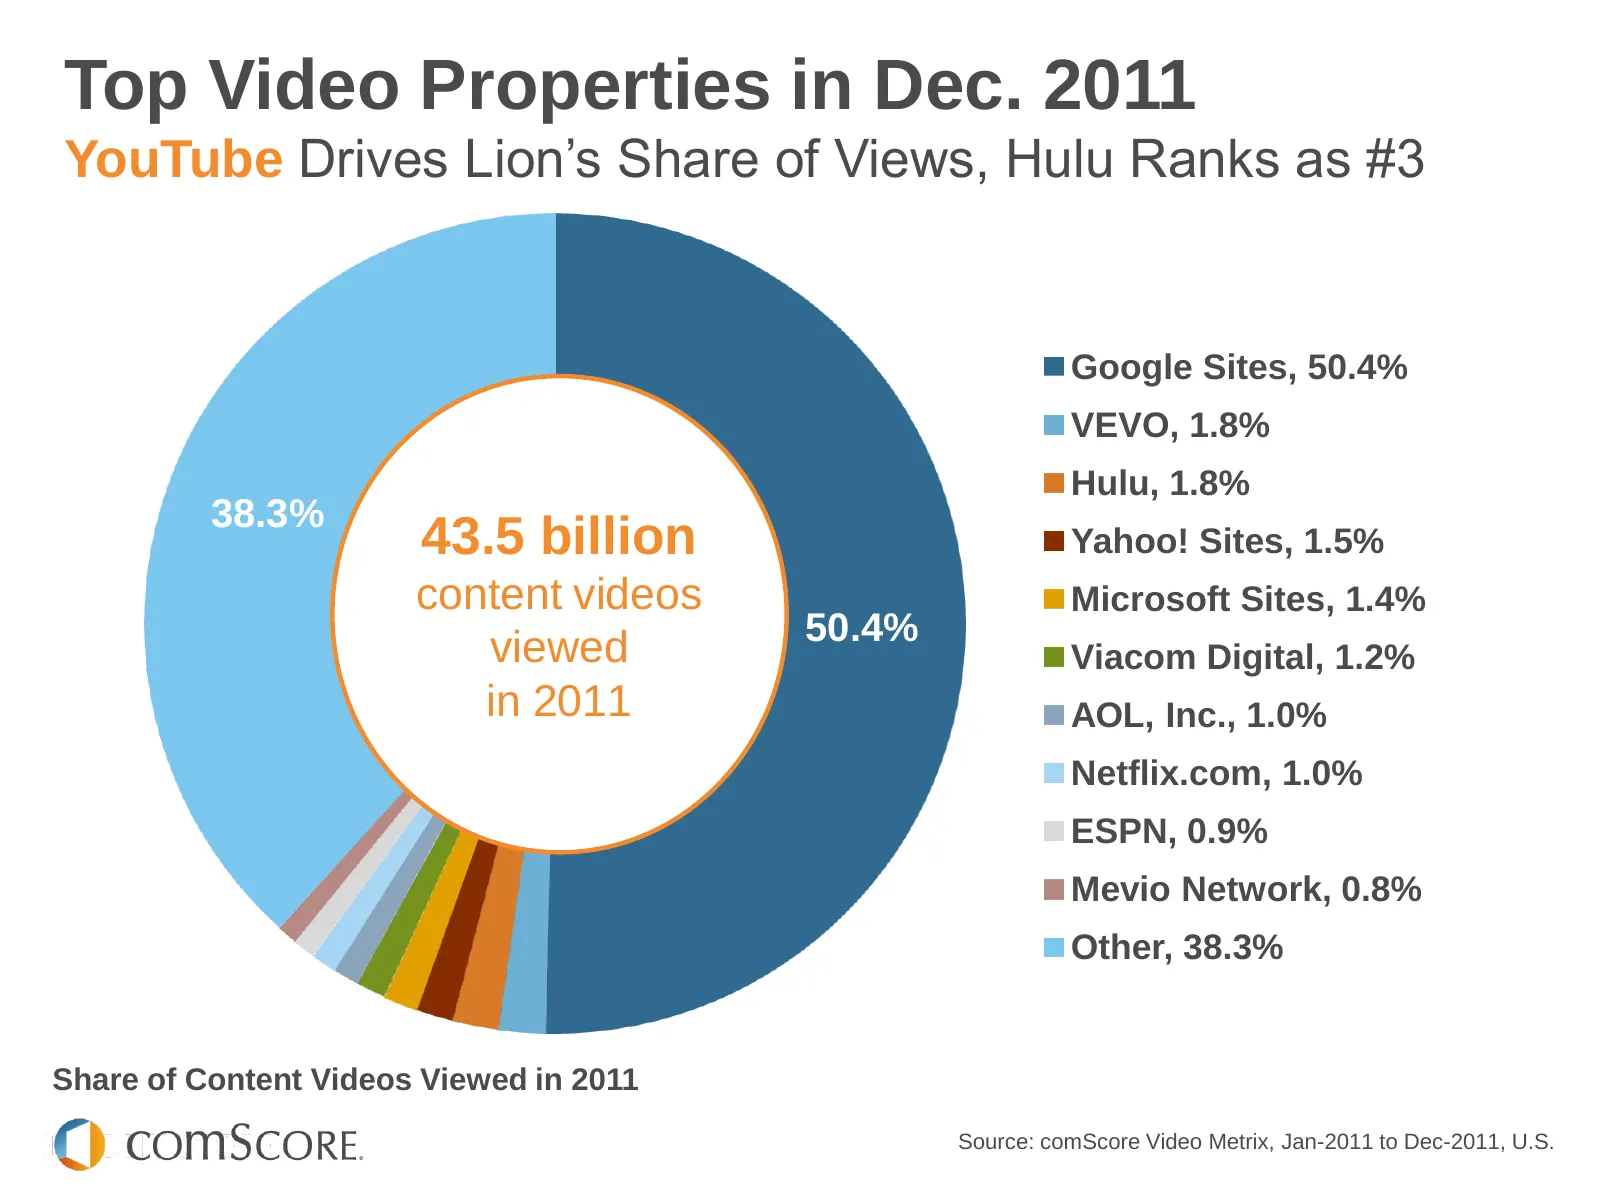
Slide 23: Top Video Properties in Dec. 2011
Top Video Properties in Dec. 2011 YouTube Drives Lion’s Share of Views, Hulu Ranks as #3 Google Sites, 50.4% VEVO, 1.8% Hulu, 1.8% 38.3% 43.5 billion Yahoo! Sites, 1.5% content videos Microsoft Sites, 1.4% 50.4% viewed Viacom Digital, 1.2% in 2011 AOL, Inc., 1.0% Netflix.com, 1.0% ESPN, 0.9% Mevio N
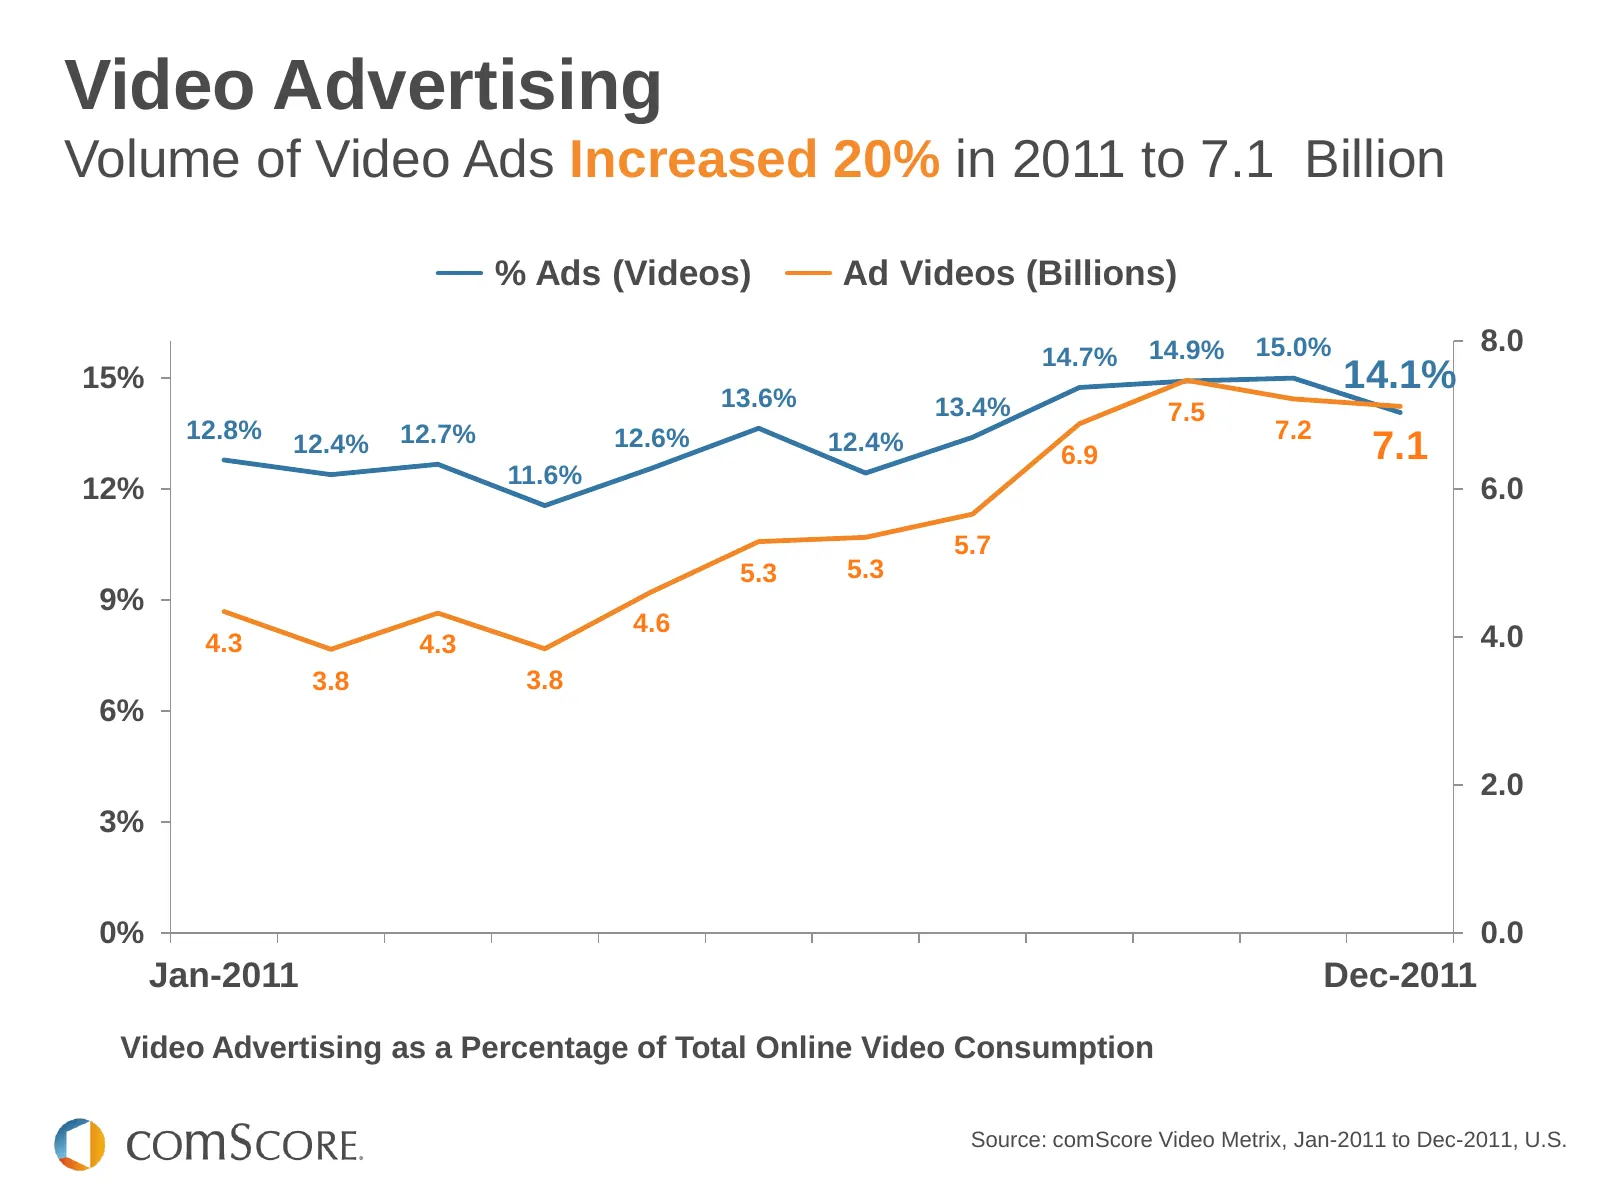
Slide 24: Video Advertising
Video Advertising Volume of Video Ads Increased 20% in 2011 to 7.1 Billion % Ads (Videos) Ad Videos (Billions) 14.7% 14.9% 15.0% 8.0 15% 13.6% 14.1% 13.4% 7.5 12.8% 12.7% 12.6% 7.2 12.4% 12.4% 6.9 7.1 11.6% 12% 6.0 5.7 5.3 5.3 9% 4.6 4.3 4.3 4.0 3.8 3.8 6% 2.0 3% 0% 0.0 Jan-2011 Dec-2011 Video Adver
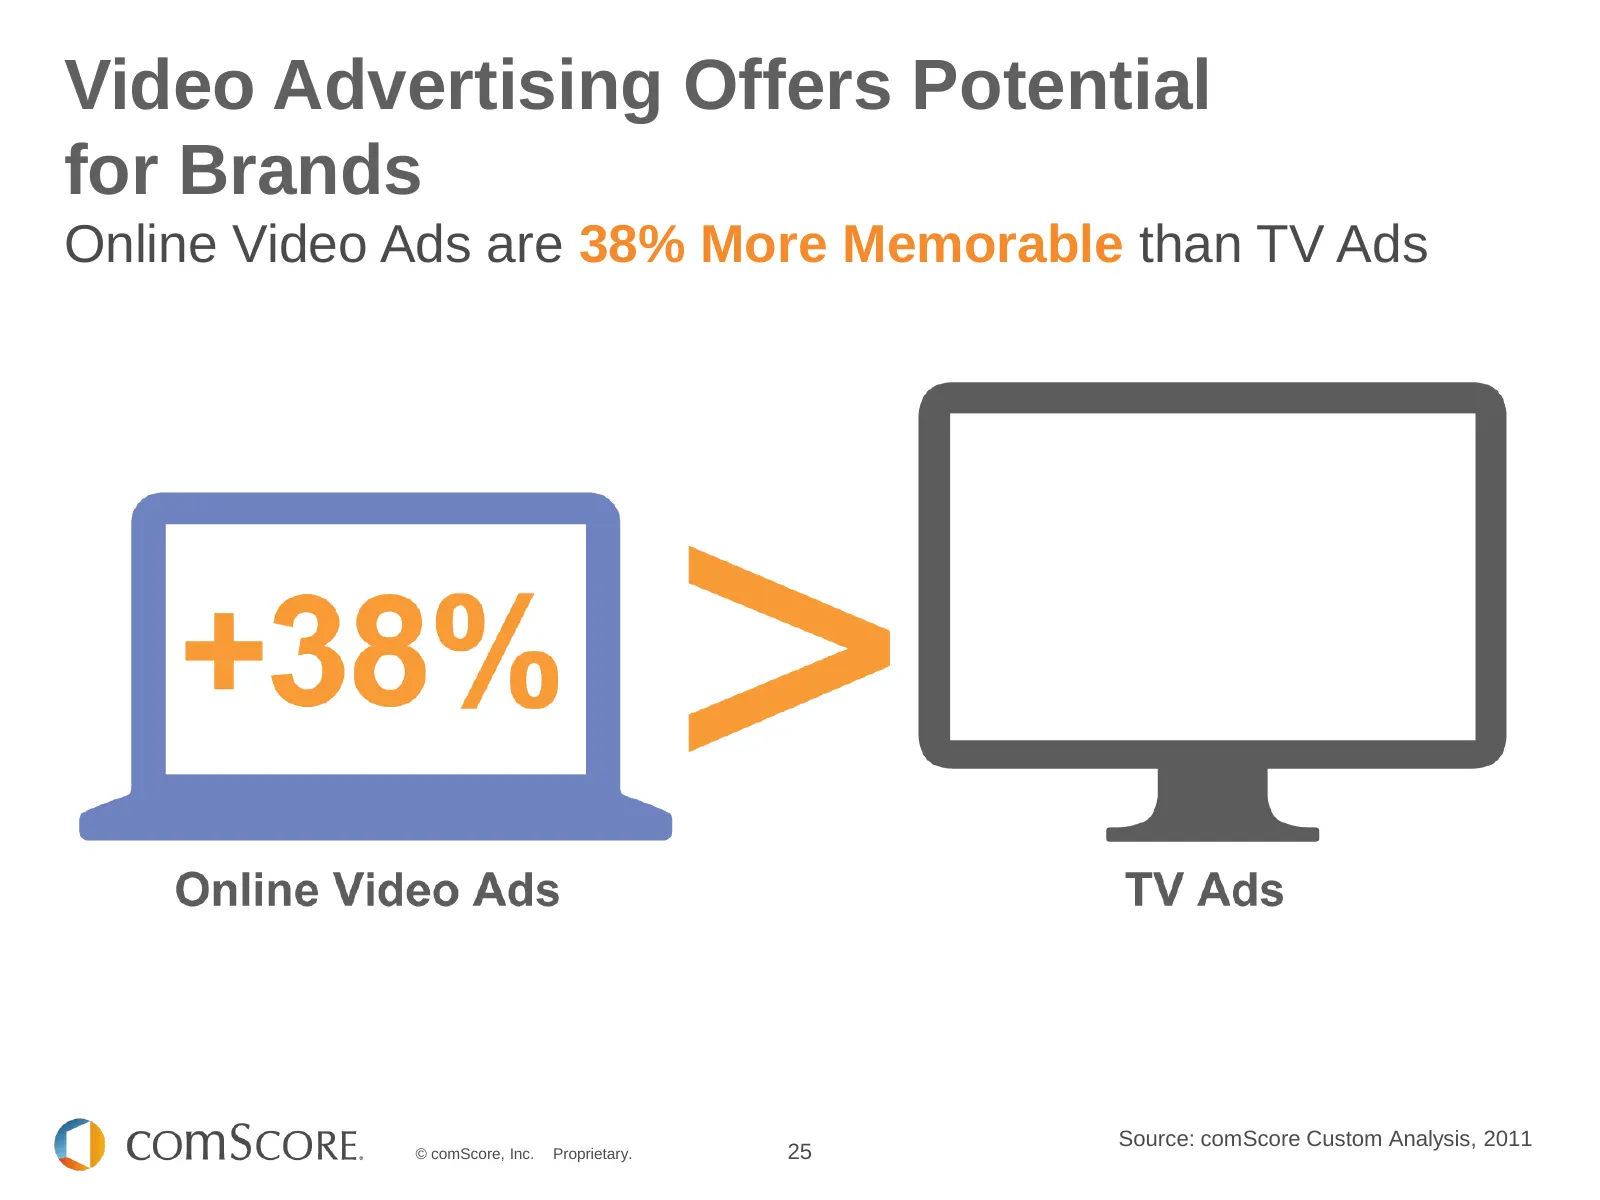
Slide 25: Video Advertising Offers Potential for Brands
Video Advertising Offers Potential for Brands Online Video Ads are 38% More Memorable than TV Ads 1 Social Networking is the Most Popular Online Activity Worldwide Source: comScore Custom Analysis, 2011 © comScore, Inc. Proprietary. 25

Slide 26: Digital Advertising
DIGITAL ADVERTISING © comScore, Inc. Proprietary. 26

Slide 27: Digital Advertising Enters Era of Increased Accountability
DIGITAL ADVERTISING ENTERS ERA OF INCREASED ACCOUNTABILITY AS BRAND DOLLARS CONTINUE TO SHIFT ONLINE © comScore, Inc. Proprietary. 27
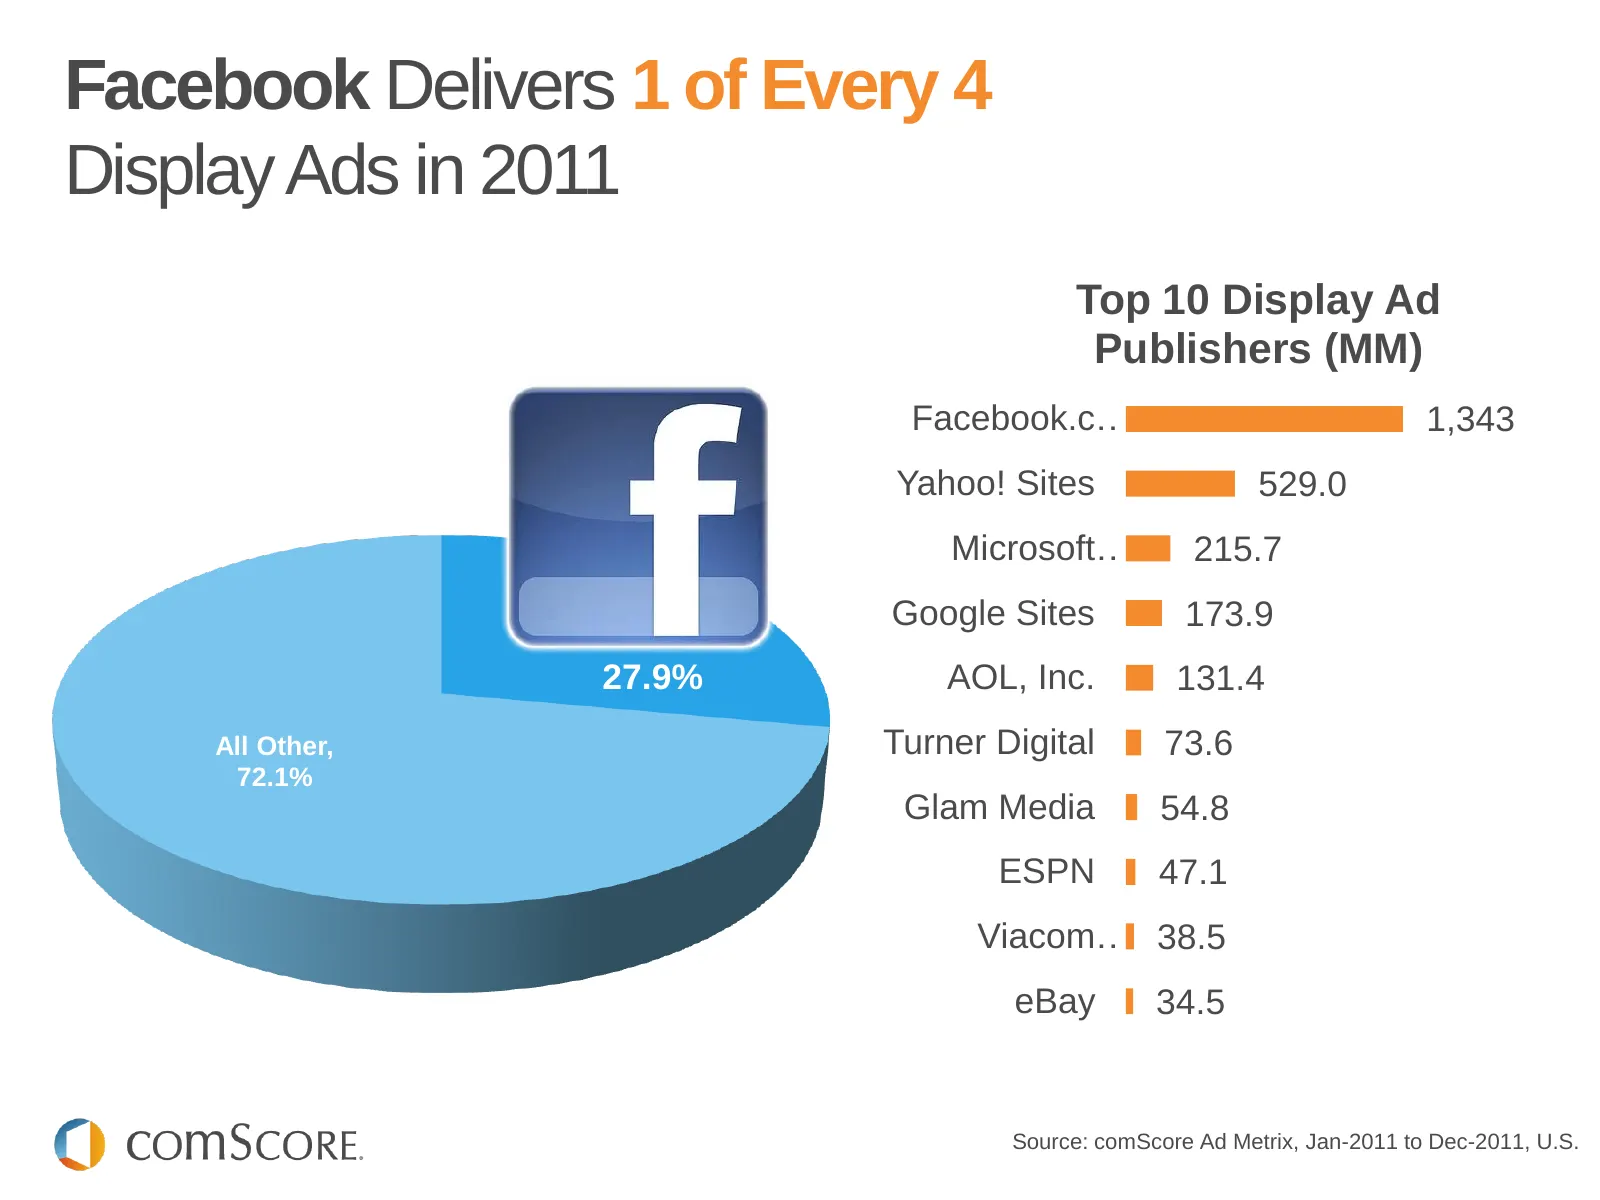
Slide 28: Facebook Delivers 1 of Every 4 Display Ads in 2011
Facebook Delivers 1 of Every 4 Display Ads in 2011 Top 10 Display Ad Publishers (MM) Facebook.c… 1,343 Yahoo! Sites 529.0 Microsoft… 215.7 Facebook, 27.9% Google Sites 173.9 27.9% AOL, Inc. 131.4 2011 All Other, Turner Digital 73.6 Impressi 72.1% ons in Glam Media 54.8 ESPN 47.1 Viacom… 38.5 eBay 34
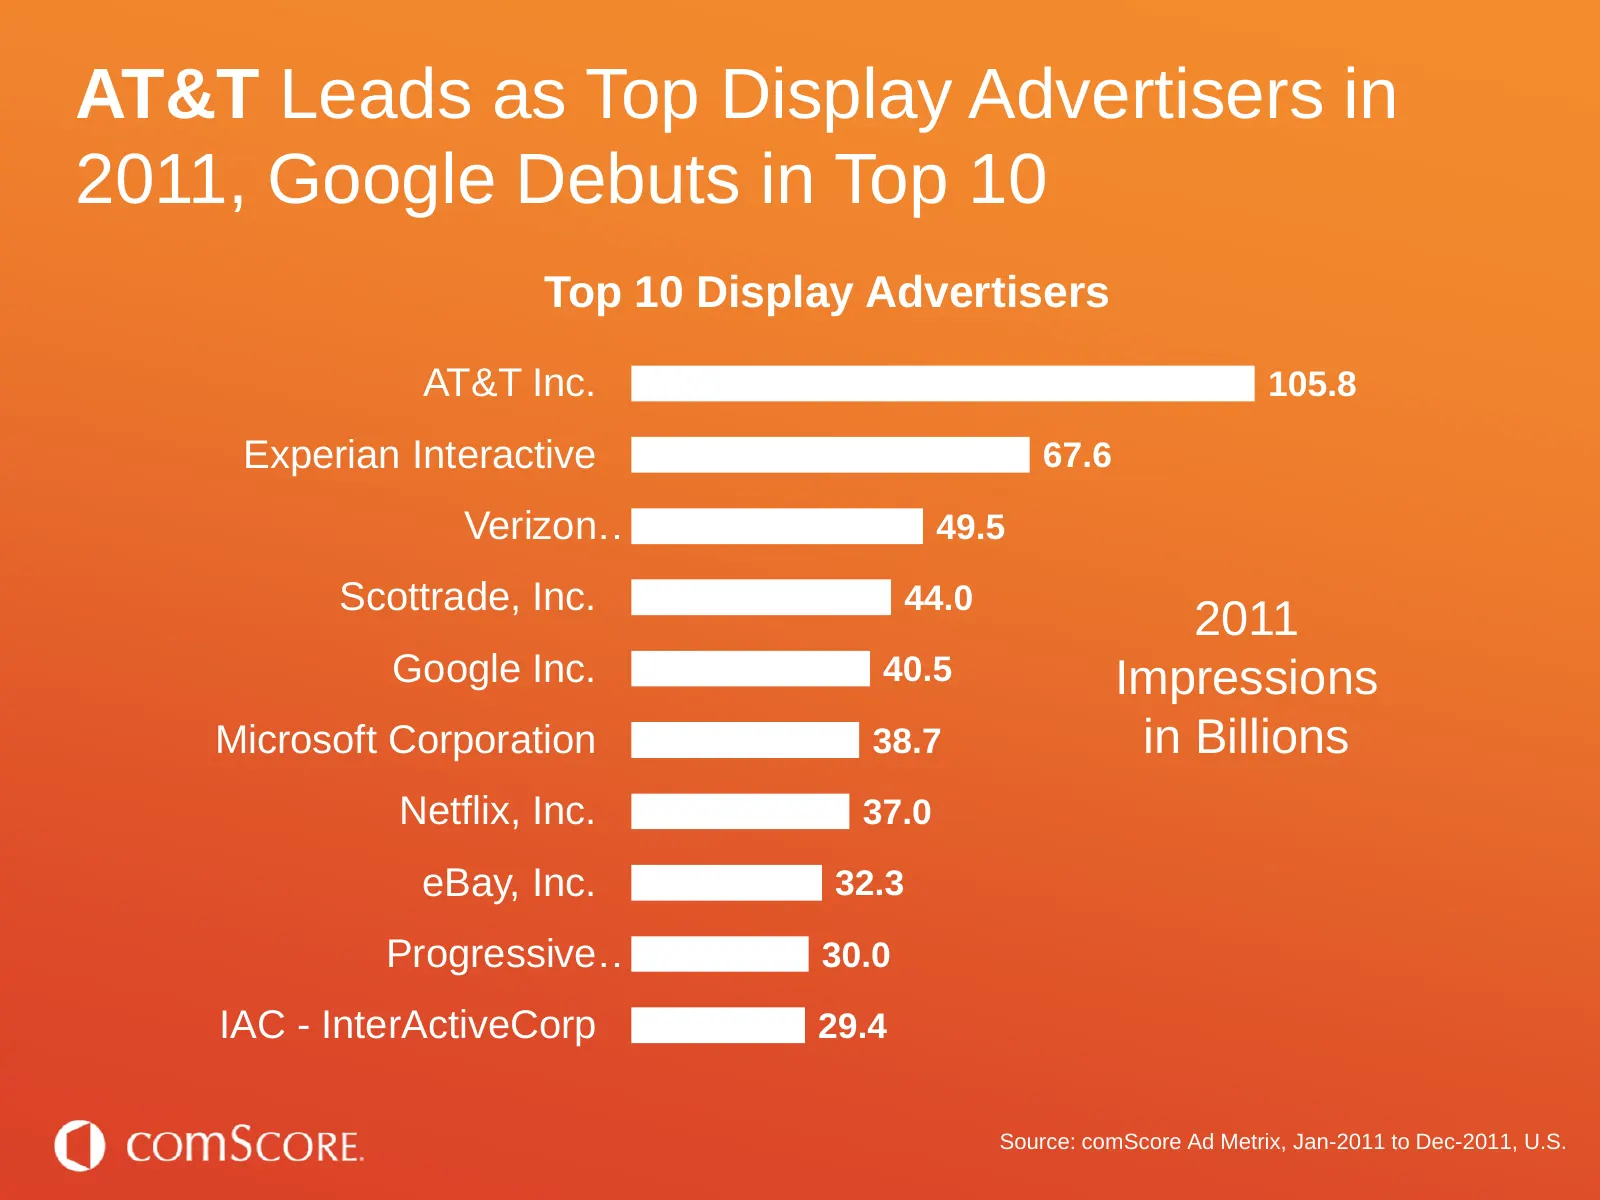
Slide 29: AT&T Leads as Top Display Advertisers in 2011
AT&T Leads as Top Display Advertisers in 2011, Google Debuts in Top 10 Top 10 Display Advertisers AT&T Inc. 105.8 Experian Interactive 67.6 Verizon… 49.5 Scottrade, Inc. 44.0 2011 Google Inc. 40.5 Impressions Microsoft Corporation 38.7 in Billions Netflix, Inc. 37.0 eBay, Inc. 32.3 Progressive… 30.0
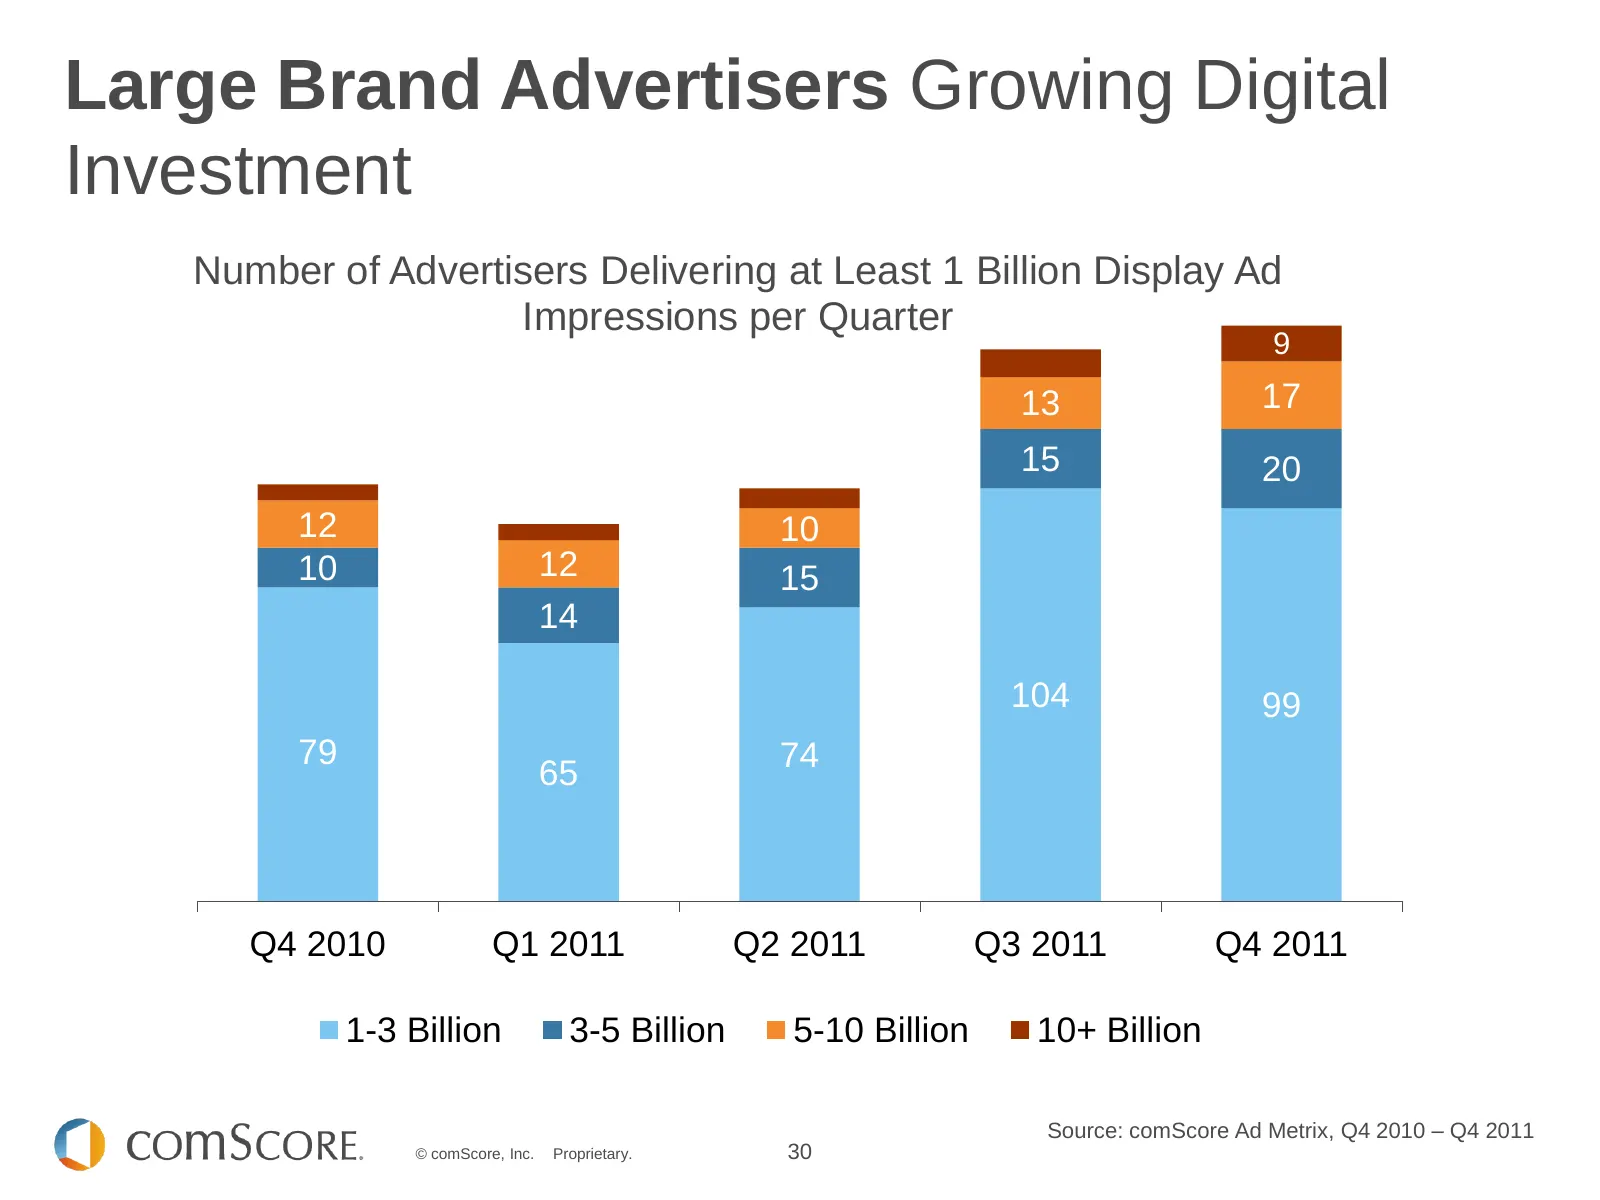
Slide 30: Large Brand Advertisers Growing Digital Investment
Large Brand Advertisers Growing Digital Investment Number of Advertisers Delivering at Least 1 Billion Display Ad Impressions per Quarter 9 1 Social Networking is the 13 15 17 20 Most Popular Online Activity 12 10 12 10 15 14 Worldwide 104 99 79 74 65 Q4 2010 Q1 2011 Q2 2011 Q3 2011 Q4 2011 1-3 Bill

Slide 31: Mobile
MOBILE © comScore.
Slide 32: Smartphones and Tablets Fuel the Rise of the Digital Omnivore
SMARTPHONES AND TABLETS FUEL THE RISE OF THE DIGITAL OMNIVORE © comScore, Inc. Proprietary. 32
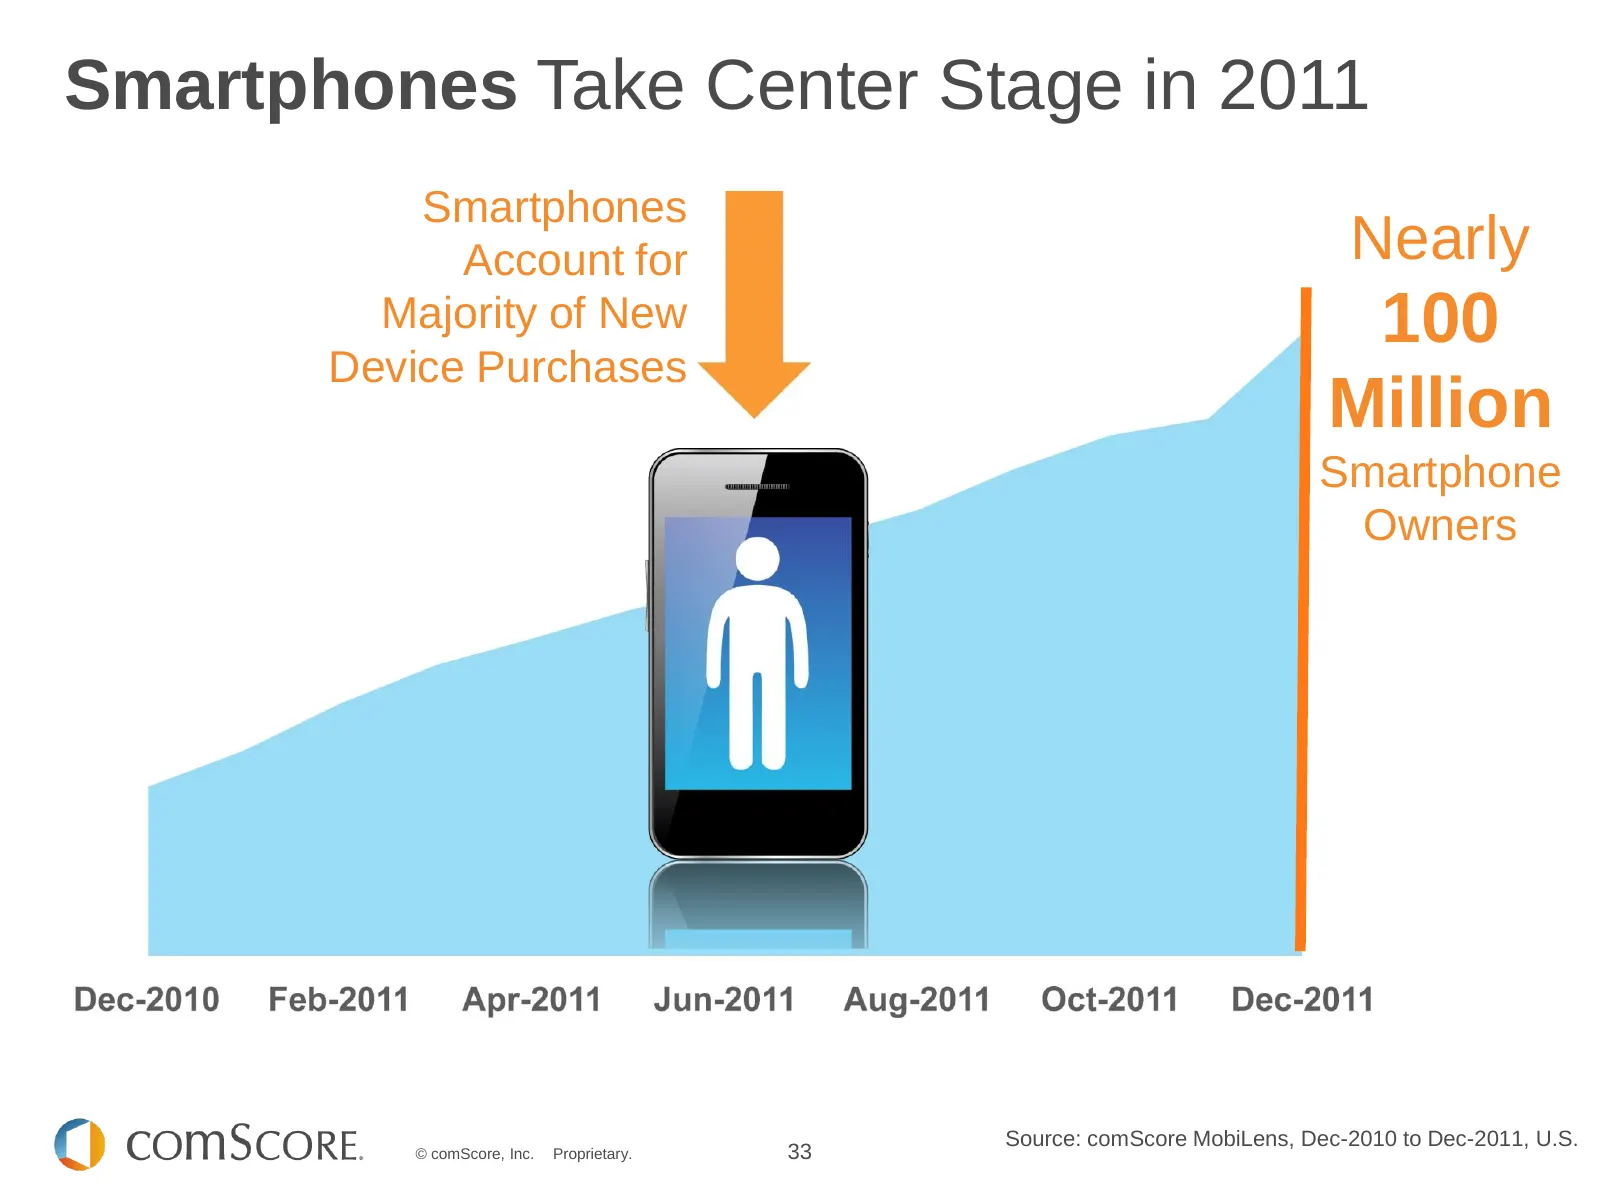
Slide 33: Smartphones Take Center Stage in 2011
Smartphones Take Center Stage in 2011 Smartphones Account for Nearly Majority of New 100 Device Purchases 1 Social Networking is the Smartphone Million Most Popular Online Activity Owners Worldwide Source: comScore MobiLens, Dec-2010 to Dec-2011, U.S. © comScore, Inc. Proprietary. 33
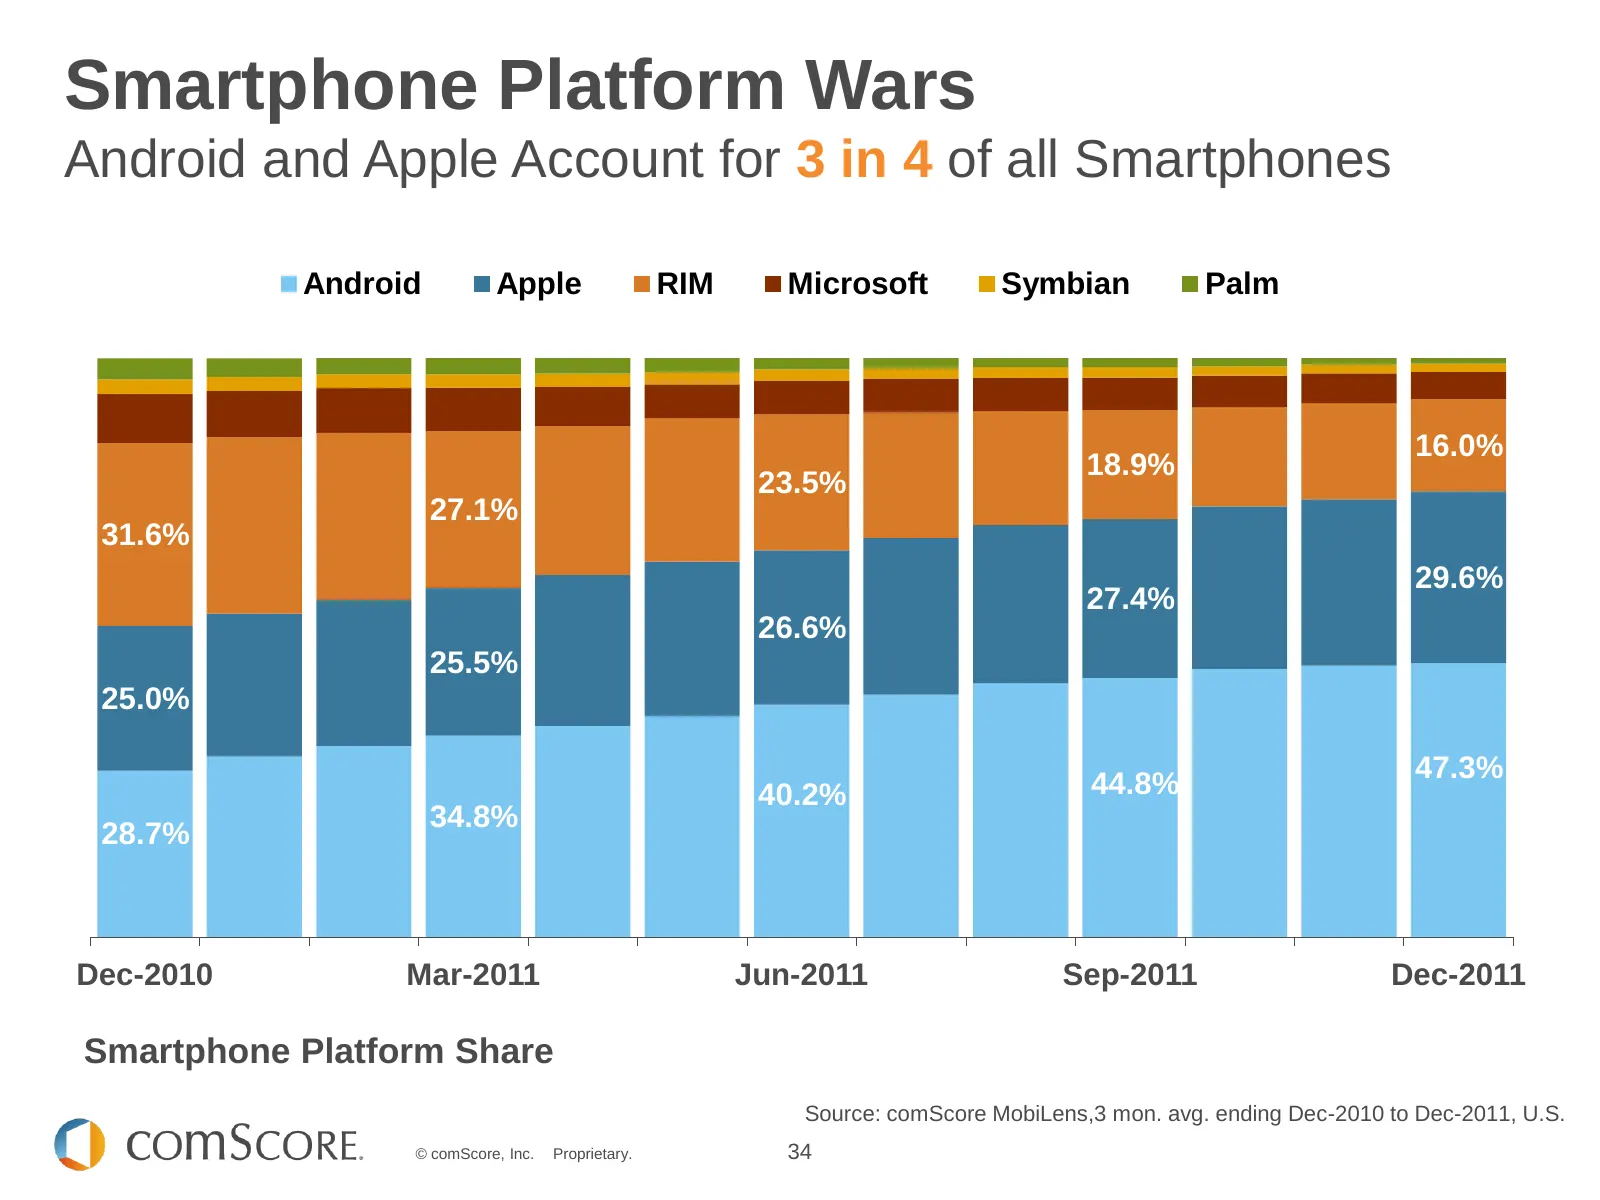
Slide 34: Smartphone Platform Wars
Smartphone Platform Wars Android and Apple Account for 3 in 4 of all Smartphones Android Apple RIM Microsoft Symbian Palm 1 Social Networking is the 23.5% 18.9% 16.0% 31.6% Most Popular Online Activity 27.1% 27.4% 29.6% 25.0% Worldwide 25.5% 26.6% 47.3% 40.2% 44.8% 34.8% 28.7% Dec-2010 Mar-2011 Jun-
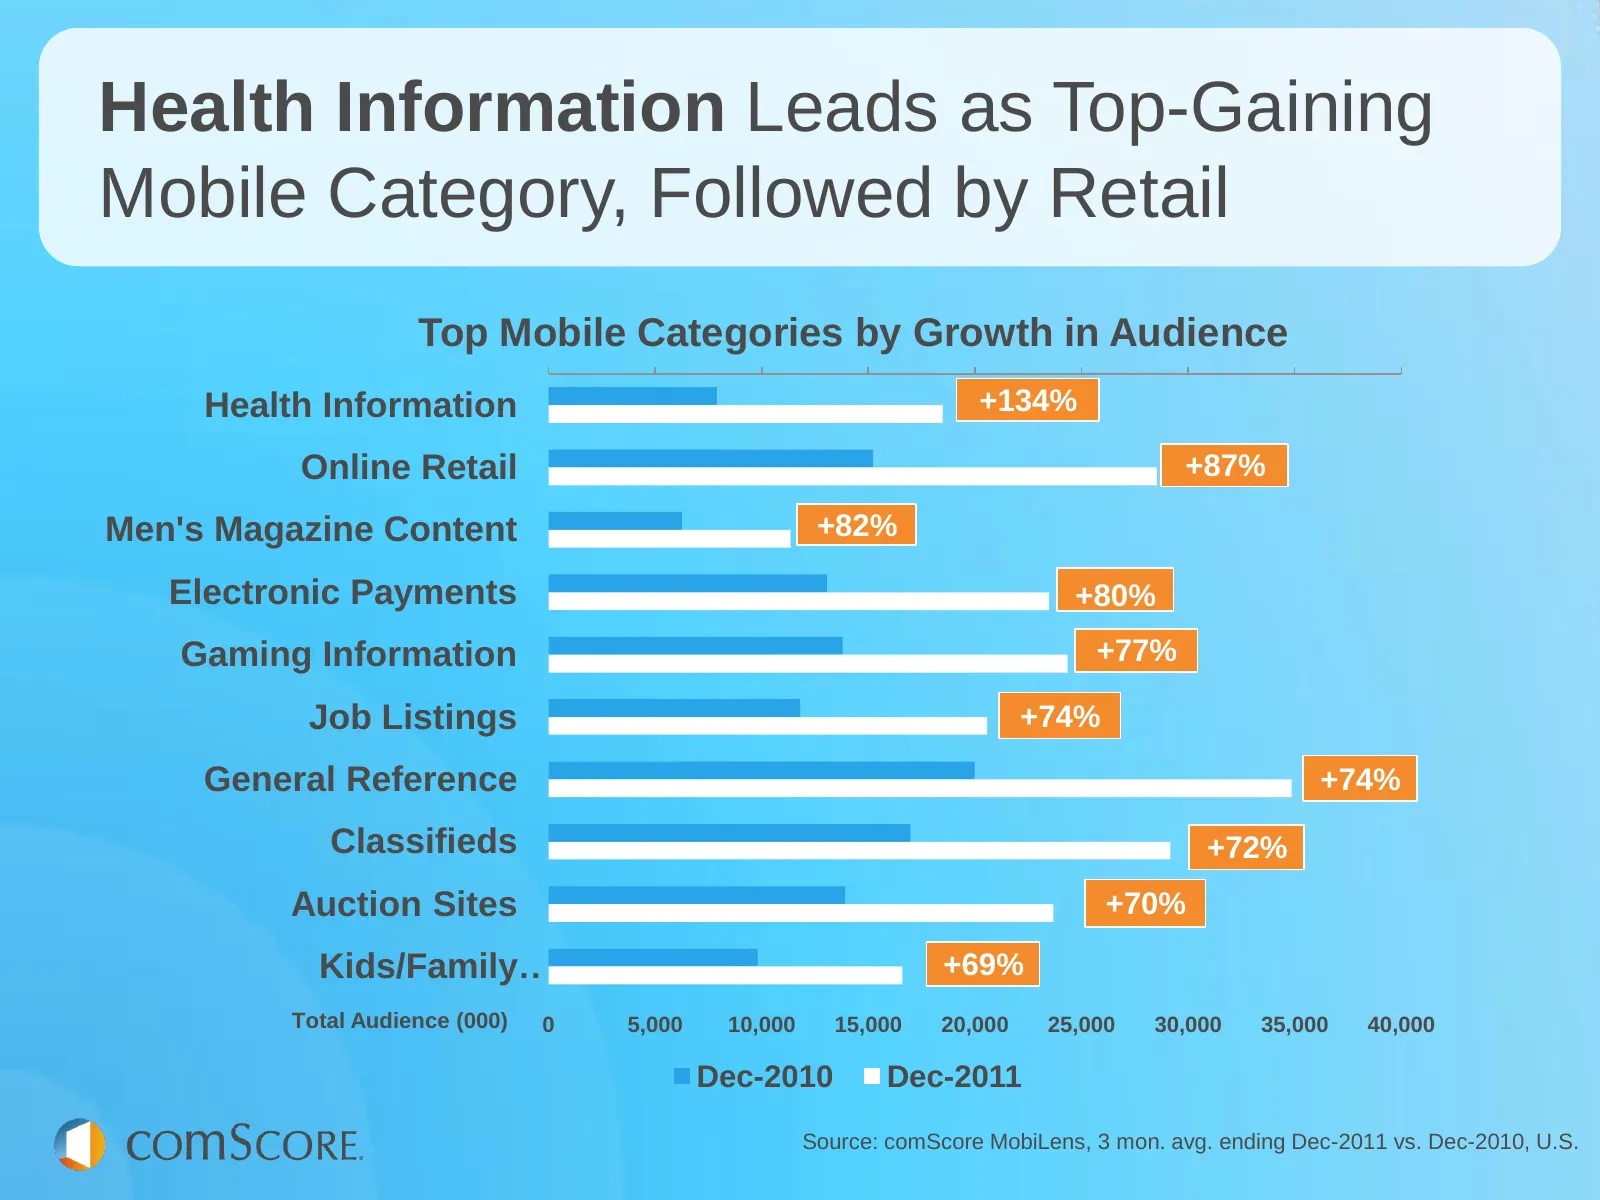
Slide 35: Health Information Leads as Top-Gaining Mobile Category
Health Information Leads as Top-Gaining Mobile Category, Followed by Retail Top Mobile Categories by Growth in Audience Health Information +134% Online Retail +87% Men's Magazine Content +82% Electronic Payments +80% Gaming Information +77% Job Listings +74% General Reference +74% Classifieds +72% A
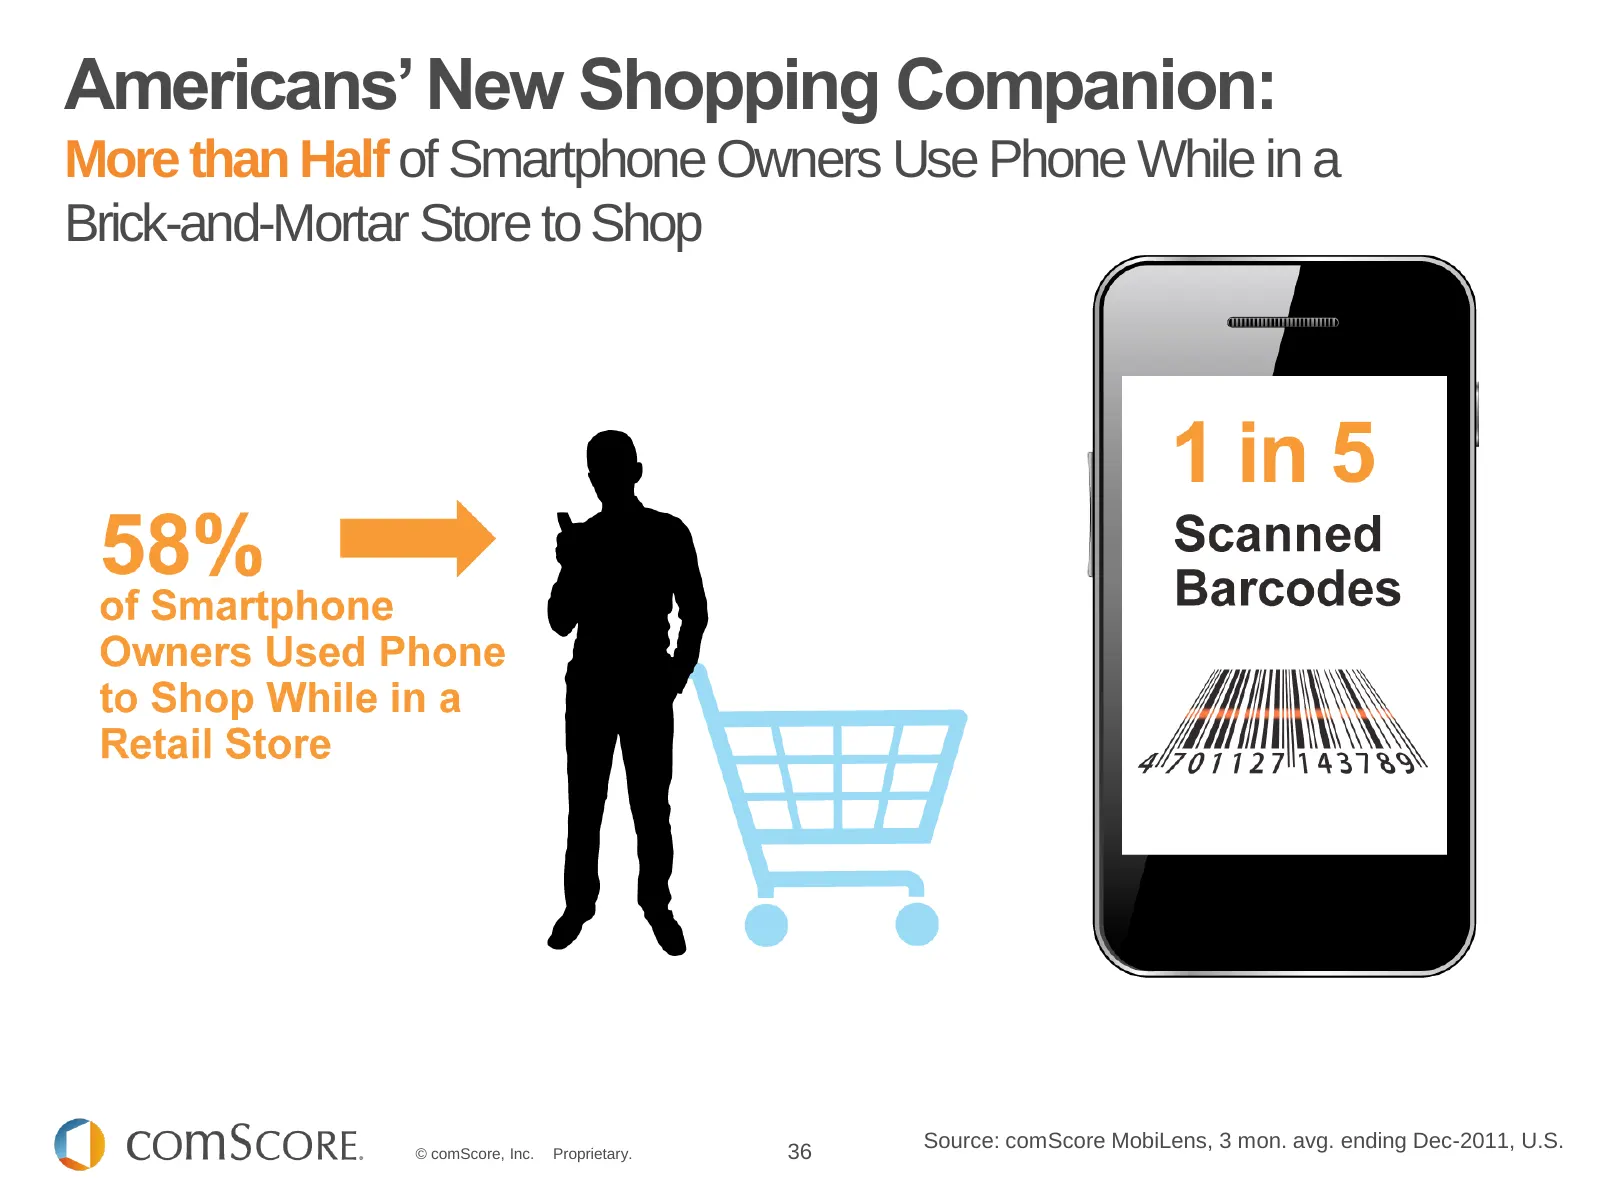
Slide 36: Americans' New Shopping Companion
Americans’ New Shopping Companion: More than Half of Smartphone Owners Use Phone While in a Brick-and-Mortar Store to Shop 1 Social Networking is the Most Popular Online Activity Worldwide Source: comScore MobiLens, 3 mon. avg. ending Dec-2011, U.S. © comScore, Inc. Proprietary. 36
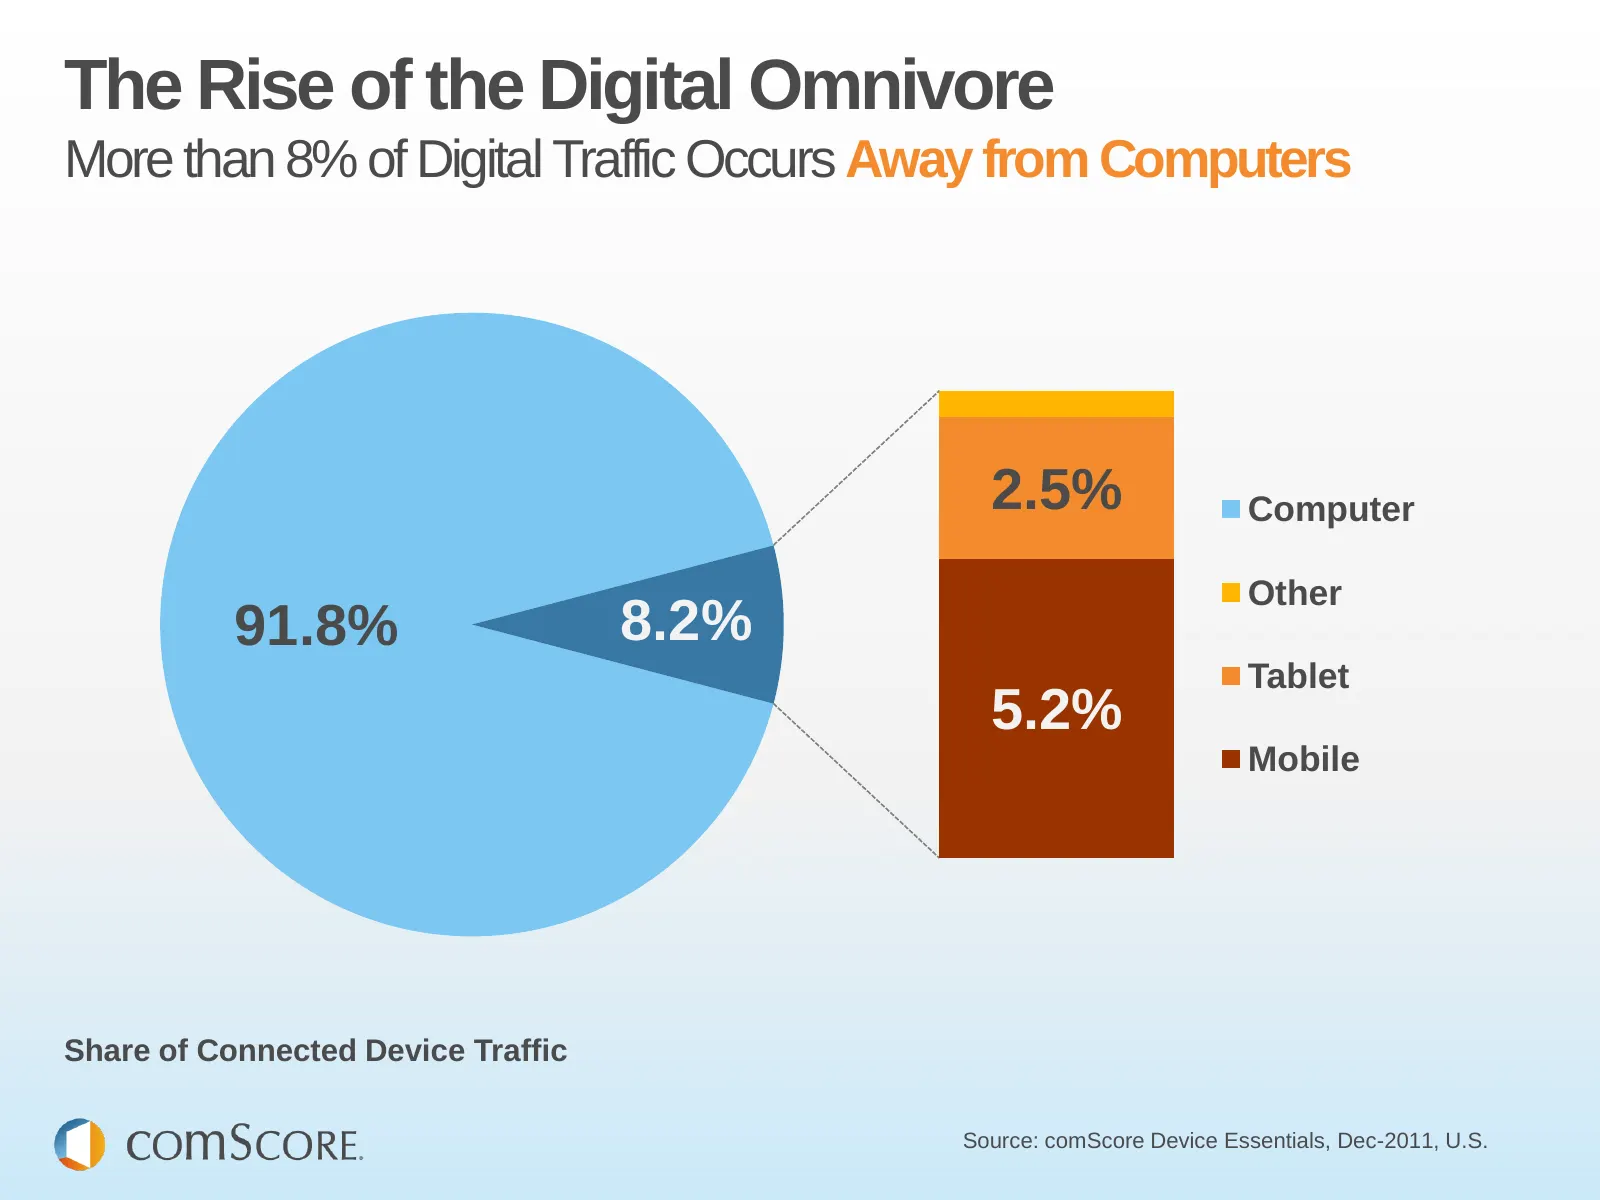
Slide 37: The Rise of the Digital Omnivore
The Rise of the Digital Omnivore More than 8% of Digital Traffic Occurs Away from Computers 2.5% Computer Other 91.8% 8.2% Tablet 5.2% Mobile Share of Connected Device Traffic Source: comScore Device Essentials, Dec-2011, U.S.

Slide 38: E-Commerce
E-COMMERCE © comScore.

Slide 39: E-Commerce Is Back and Bigger Than Ever
E-COMMERCE IS BACK AND BIGGER THAN EVER © comScore, Inc. Proprietary. 39
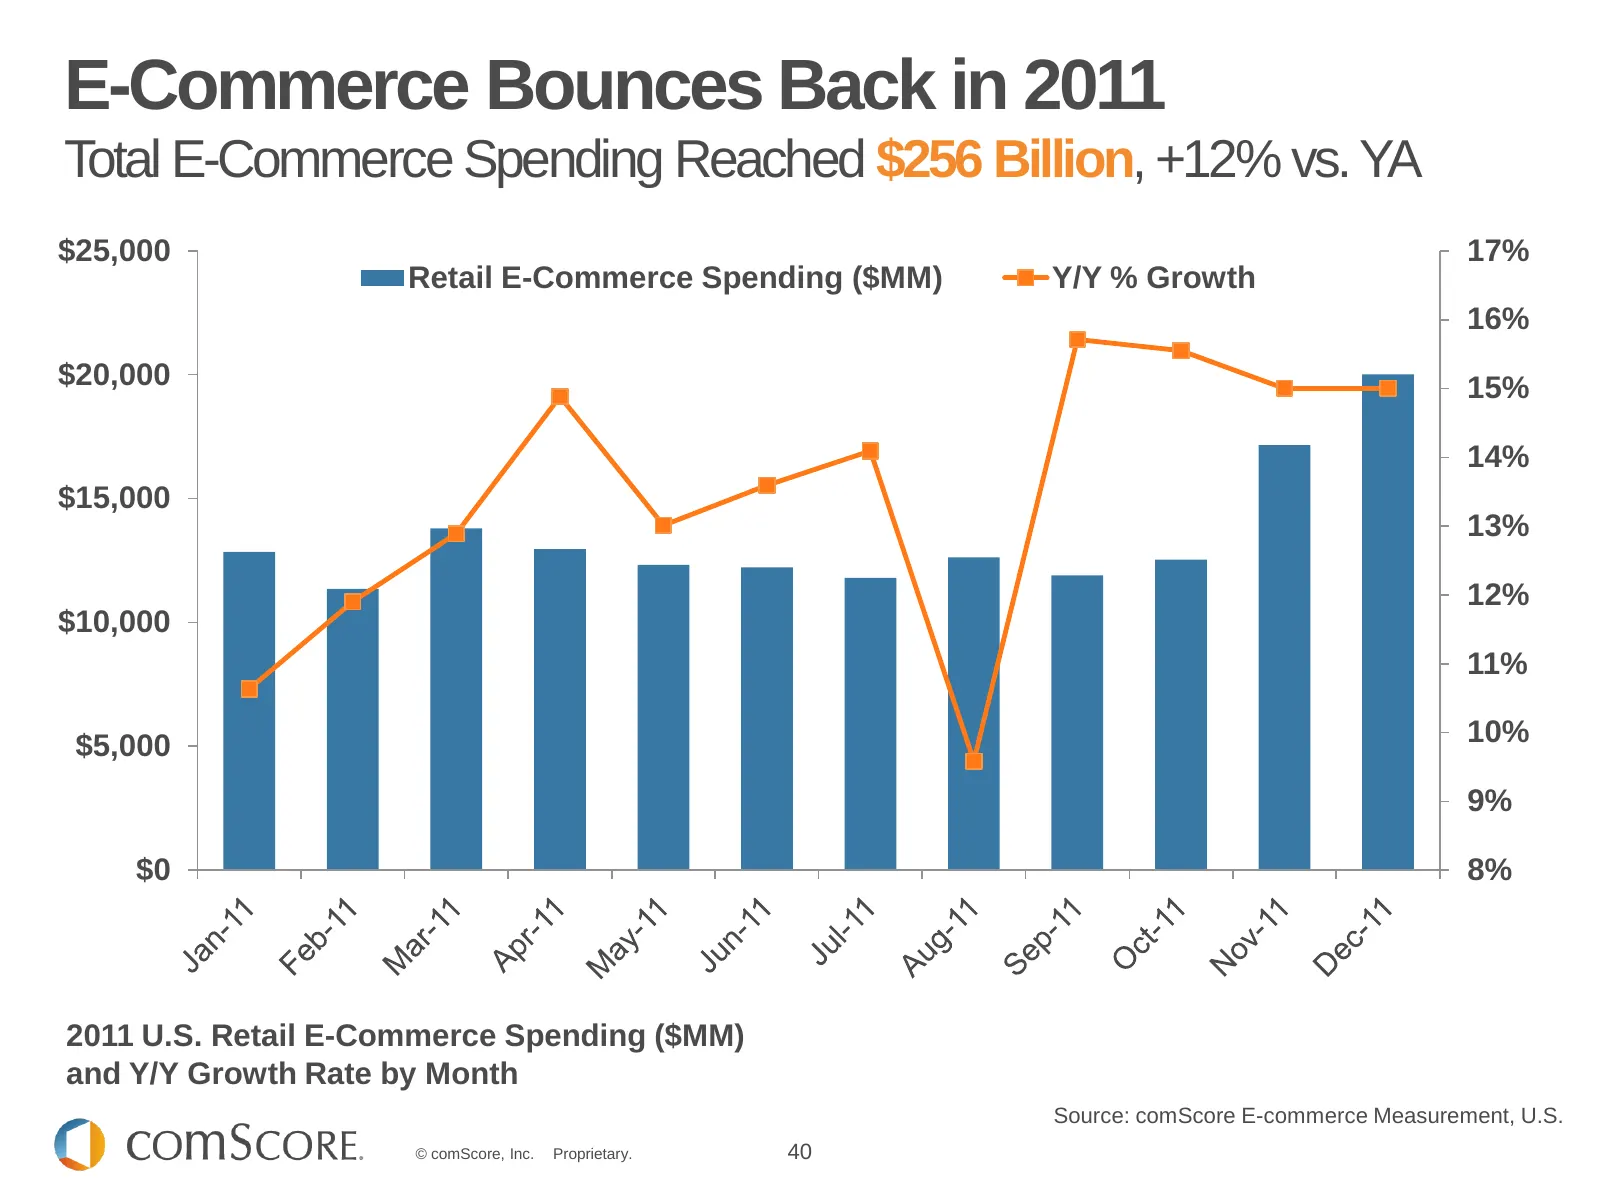
Slide 40: E-Commerce Bounces Back in 2011
E-Commerce Bounces Back in 2011 Total E-Commerce Spending Reached $256 Billion, +12% vs. YA $25,000 17% Retail E-Commerce Spending ($MM) Y/Y % Growth 16% $20,000 15% 14% $15,000 13% 12% $10,000 11% $5,000 10% 9% $0 8% 2011 U.S. Retail E-Commerce Spending ($MM) and Y/Y Growth Rate by Month Source: co
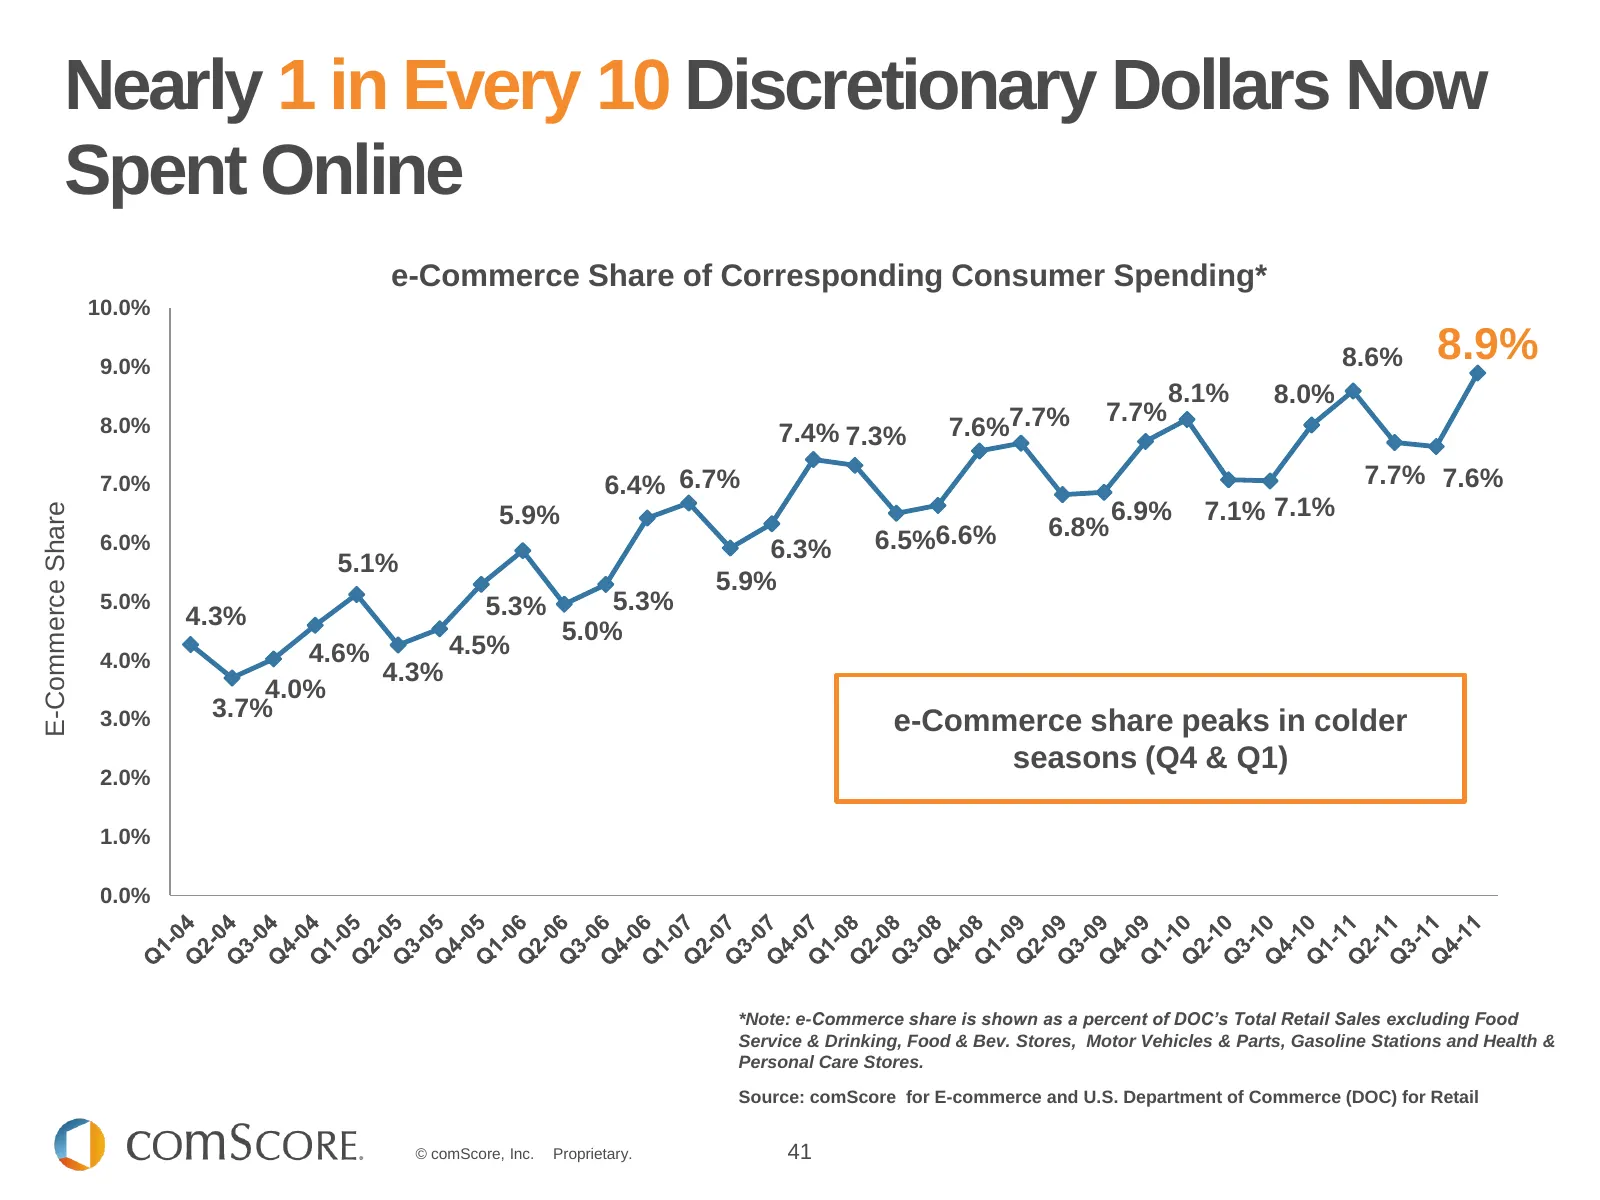
Slide 41: E-Commerce Share of Discretionary Dollars
Nearly 1 in Every 10 Discretionary Dollars Now Spent Online e-Commerce Share of Corresponding Consumer Spending* 10.0% 9.0% 8.6% 8.9% 1 8.0% 7.0% Social Networking is the 6.4% 6.7% 7.4% 7.3% 7.6%7.7% 7.7% 8.1% 8.0% 7.7% 7.6% Most Popular Online Activity 7.1% 7.1% E-Commerce Share 5.9% 6.9% 6.8% 6.0%
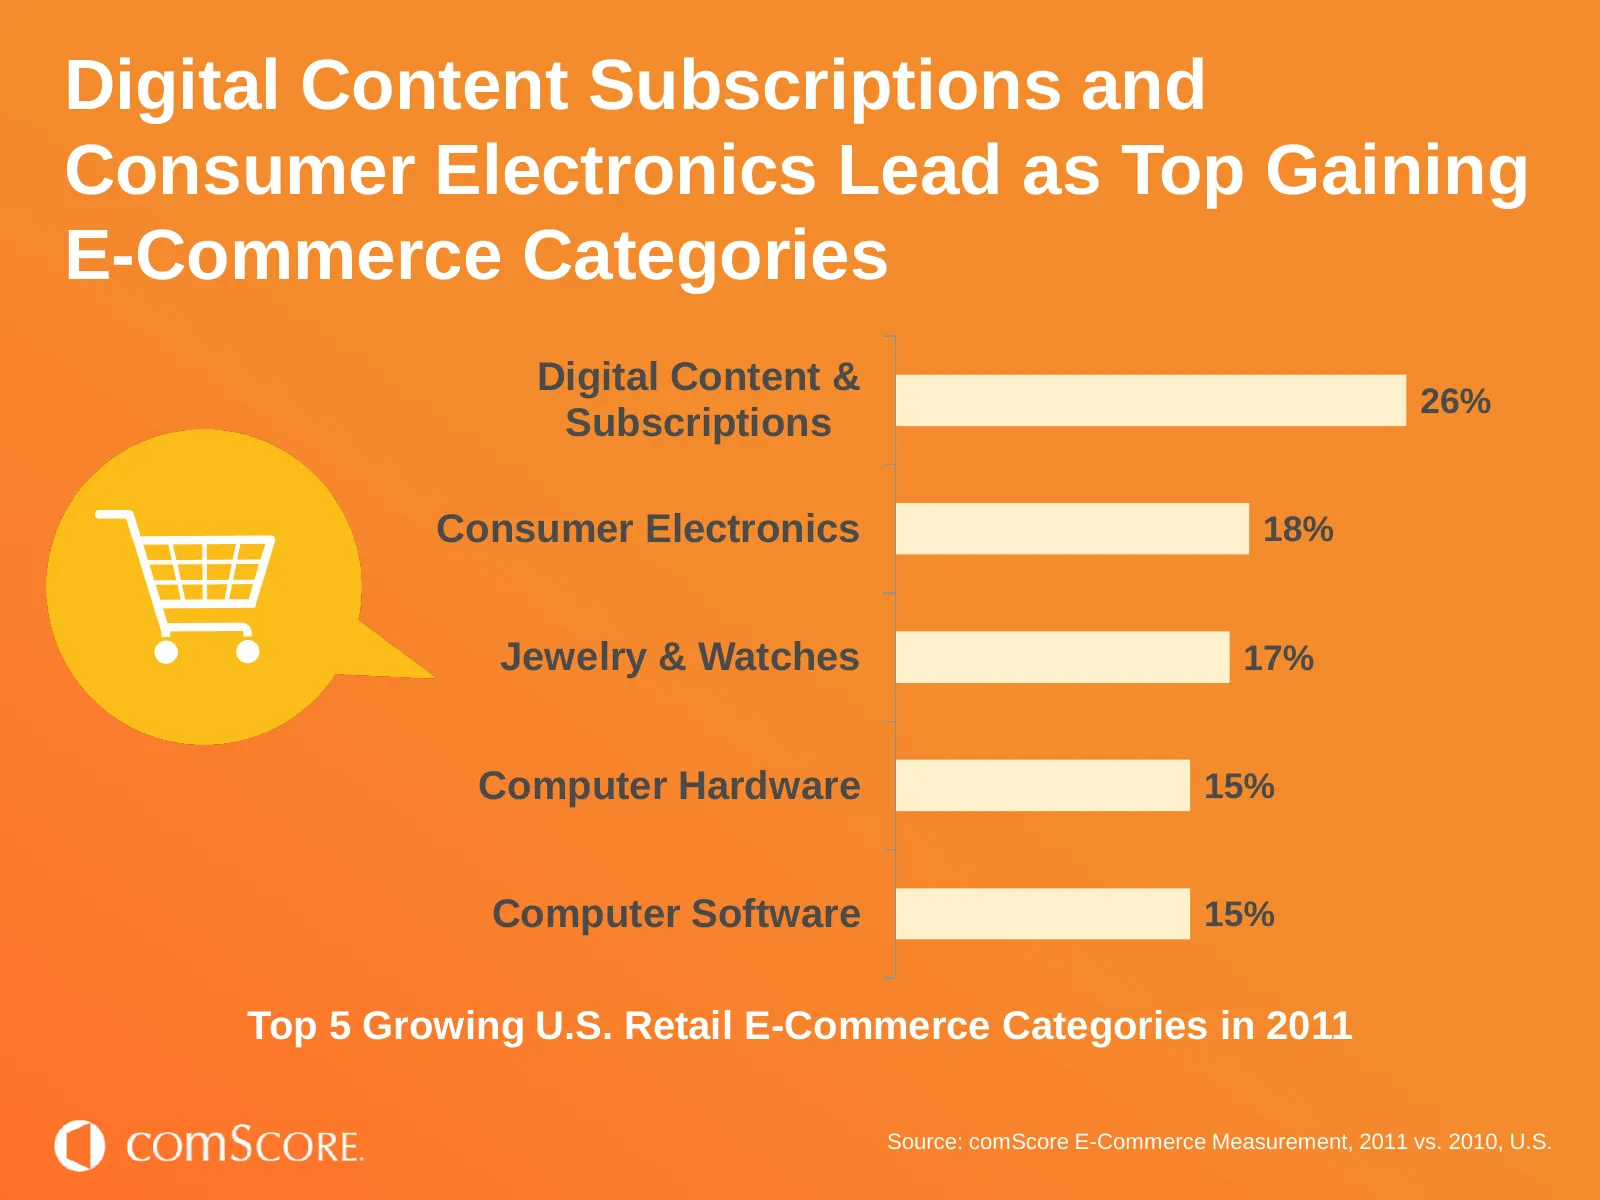
Slide 42: Top Gaining E-Commerce Categories
Digital Content Subscriptions and Consumer Electronics Lead as Top Gaining E-Commerce Categories Digital Content & 26% Subscriptions Consumer Electronics 18% Jewelry & Watches 17% Computer Hardware 15% Computer Software 15% Top 5 Growing U.S. Retail E-Commerce Categories in 2011 Source: comScore E-C
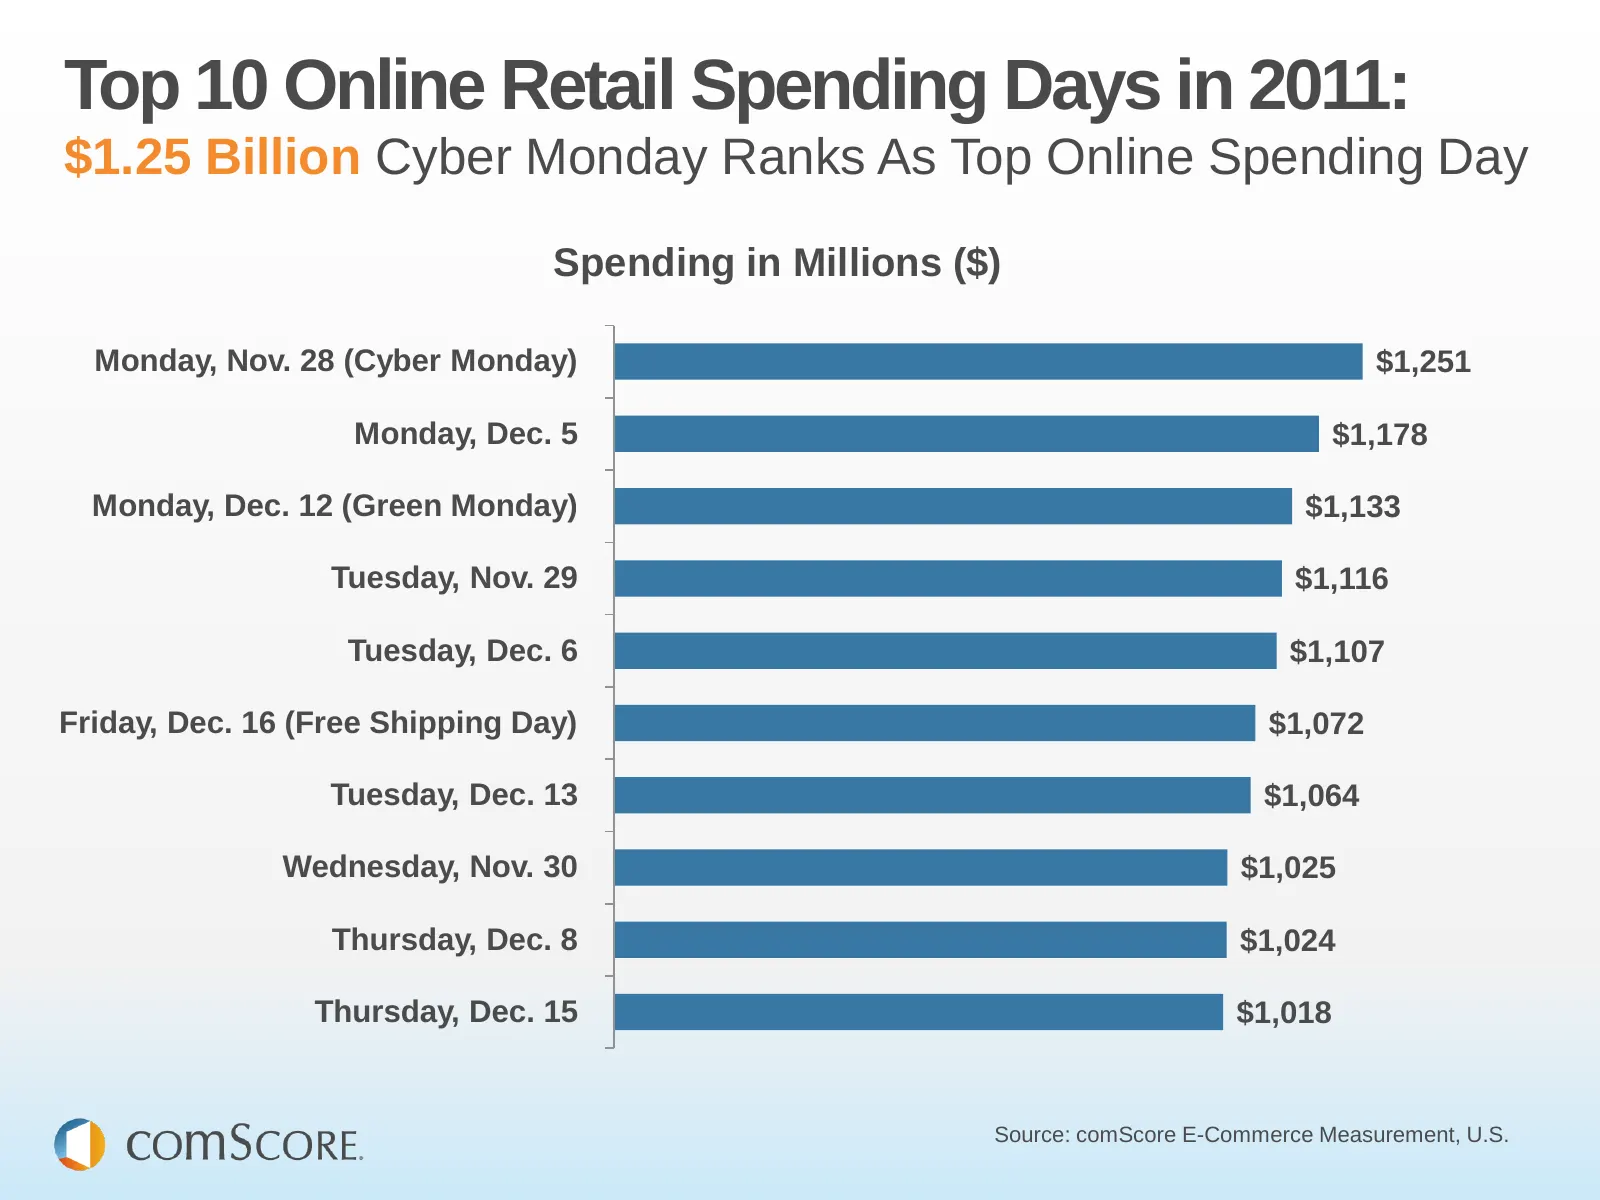
Slide 43: Top Online Retail Spending Days in 2011
Top 10 Online Retail Spending Days in 2011: $1.25 Billion Cyber Monday Ranks As Top Online Spending Day Spending in Millions ($) Monday, Nov. 28 (Cyber Monday) $1,251 Monday, Dec. 5 $1,178 Monday, Dec. 12 (Green Monday) $1,133 Tuesday, Nov. 29 $1,116 Tuesday, Dec. 6 $1,107 Friday, Dec. 16 (Free Ship
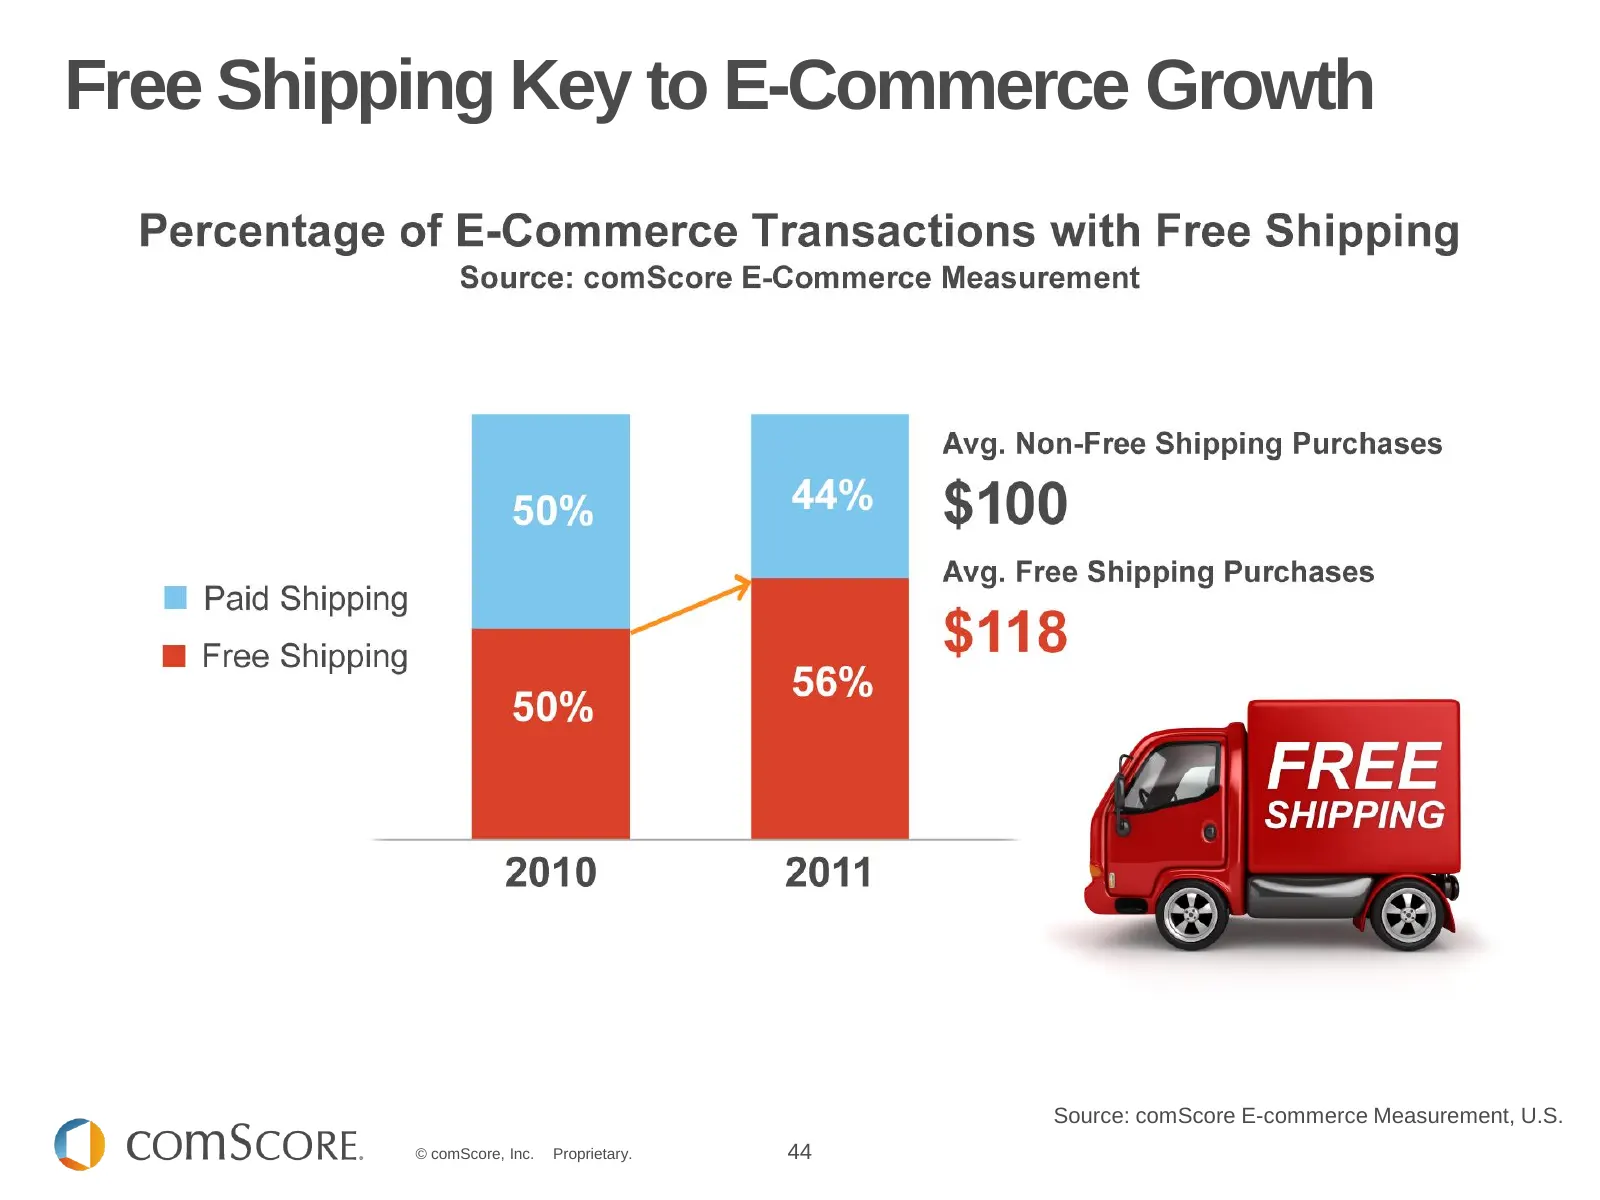
Slide 44: Free Shipping Key to E-Commerce Growth
Free Shipping Key to E-Commerce Growth 1 Social Networking is the Most Popular Online Activity Worldwide Source: comScore E-commerce Measurement, U.S. © comScore, Inc. Proprietary. 44
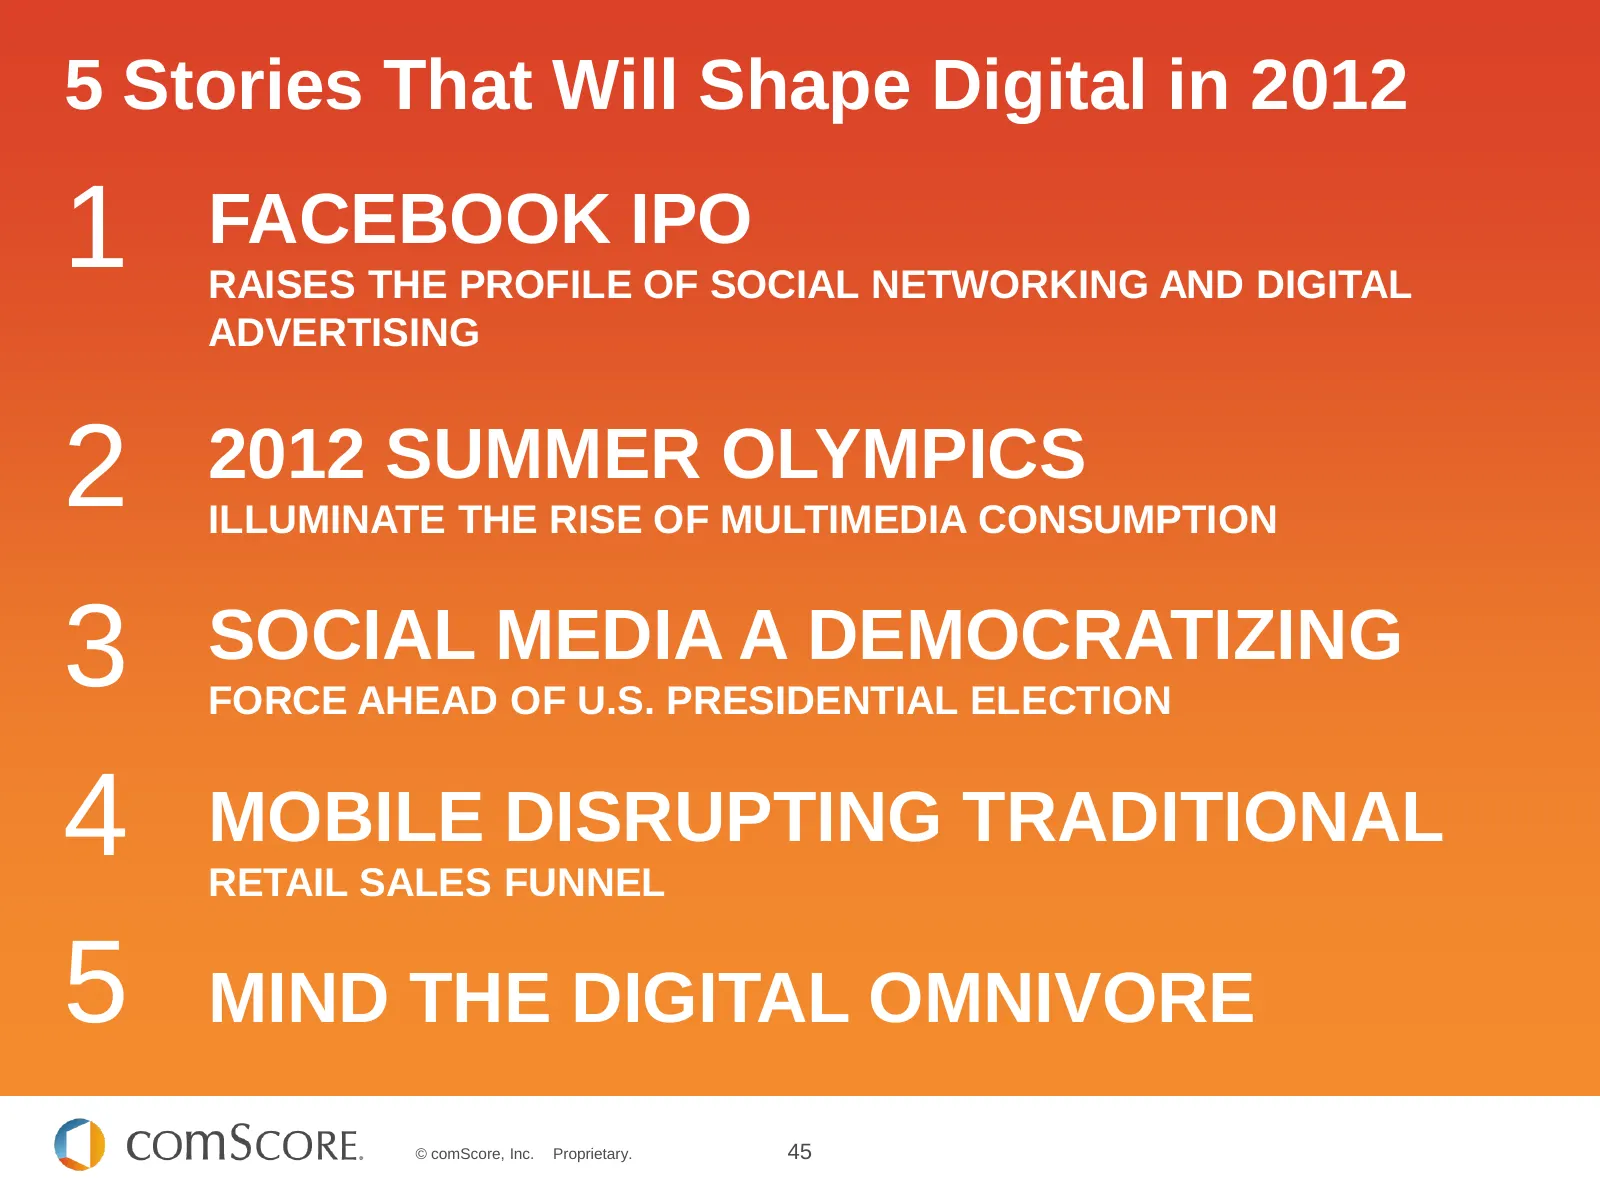
Slide 45: Stories That Will Shape Digital in 2012
5 Stories That Will Shape Digital in 2012 1 FACEBOOK IPO RAISES THE PROFILE OF SOCIAL NETWORKING AND DIGITAL ADVERTISING 2 2012 SUMMER OLYMPICS ILLUMINATE THE RISE OF MULTIMEDIA CONSUMPTION 3 SOCIAL MEDIA A DEMOCRATIZING FORCE AHEAD OF U.S. PRESIDENTIAL ELECTION 4 MOBILE DISRUPTING TRADITIONAL RETAI
Slide 46: Thank You!
THANK YOU! Eli Goodman, Media Evangelist egoodman@comscore.com @LosBuenos To download a copy of the 2012 U.S. Digital Future in Focus, please visit: www.comscore.com/2012USDigitalFutureinFocus @comScore
Source: Internet Archive copy of comscore.com
More decks from comScore, Inc.
 Q3 2026 Earnings Presentation17 slides · Nov 3, 2026
 Q2 2026 Earnings Presentation20 slides · Aug 12, 2026
 Investor Presentation (June 2026)27 slides · Jun 10, 2026
 Q4 2025 Earnings Presentation13 slides · Mar 17, 2026
 Q3 2025 Earnings Presentation15 slides · Nov 4, 2025
 Q2 2025 Earnings Presentation11 slides · Aug 5, 2025