SiriusPoint Ltd. · NYSE:SPNT
SiriusPoint — Q2 2024 Earnings Presentation
20 slides from SiriusPoint's earnings presentation, Aug 2, 2024

Slide 1: SiriusPoint Ltd. – A Global Underwriter: 2024 Second Quarter and Half Year Results
SIRIUSPOINT LTD. – A GLOBAL UNDERWRITER 2024 Second Quarter and Half Year Results August 1, 2024
Slide 2: Disclaimer
Disclaimer Basis of Presentation and Non-GAAP Financial Measures: Unless the context otherwise indicates or requires, as used in this presentation references to “we,” “our,” “us,” the “Company,” and "SiriusPoint" refer to SiriusPoint Ltd. and its directly and indirectly owned subsidiaries, as a comb

Slide 3: Agenda
Agenda • Introduction ◦ Key Messages ◦ Strategic Priorities Update ◦ Track Record of Delivery ◦ Specialized Business Model • Half Year and Quarterly Results Update 3

Slide 4: Introduction
Introduction 4
Slide 5: Key Messages: Progress Across Strategic Priorities Shown in Results
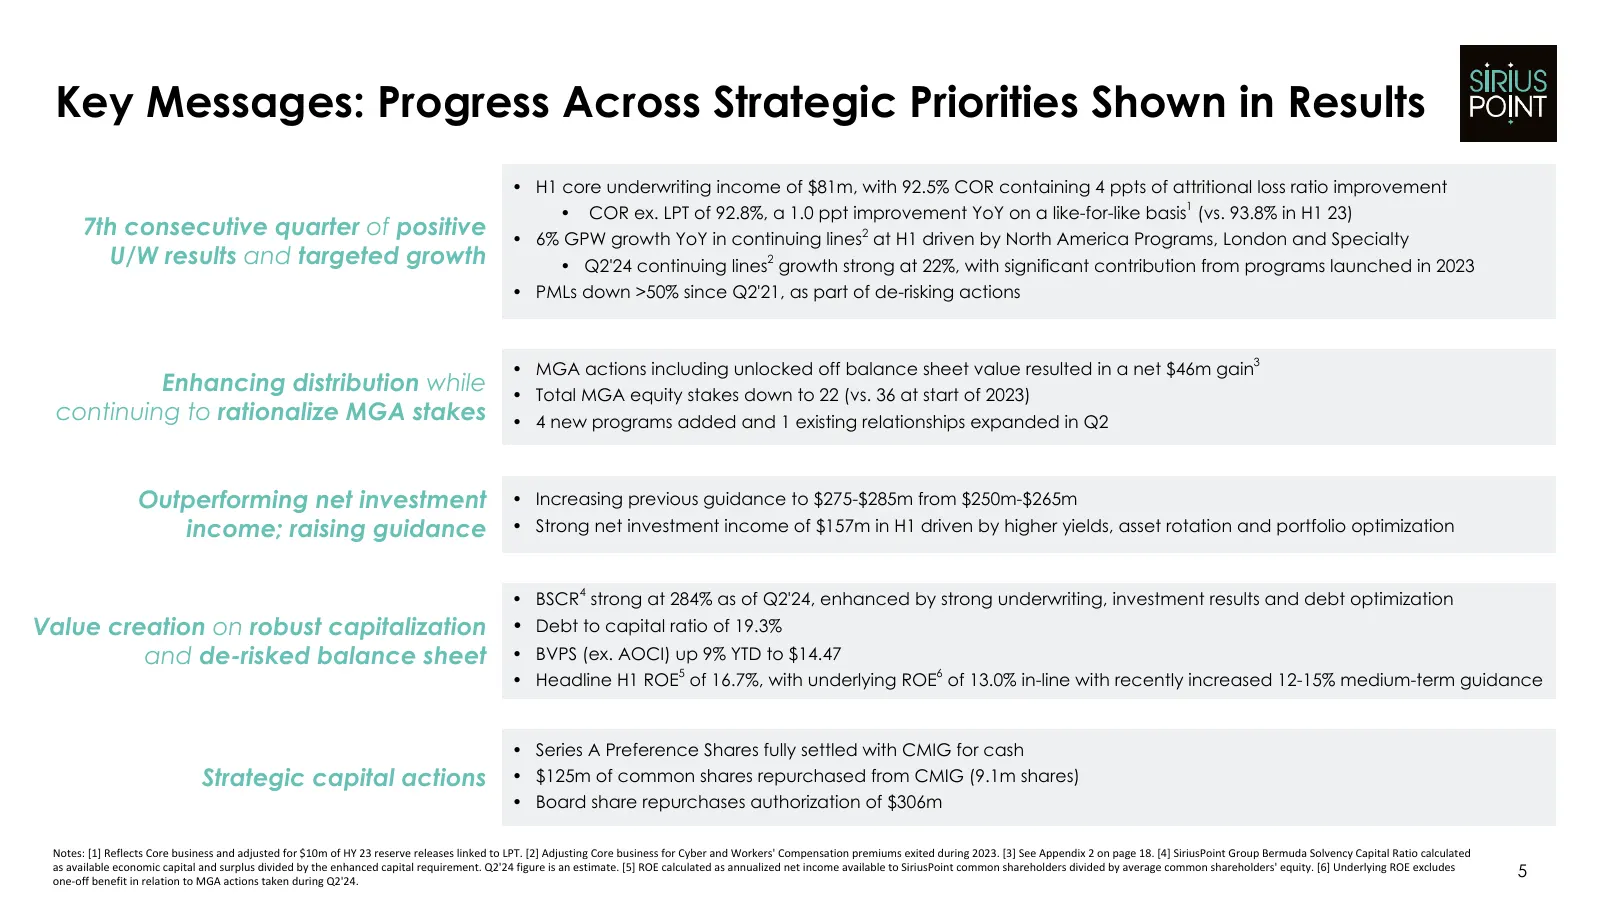
Key Messages: Progress Across Strategic Priorities Shown in Results • H1 core underwriting income of $81m, with 92.5% COR containing 4 ppts of attritional loss ratio improvement 1 • COR ex. LPT of 92.8%, a 1.0 ppt improvement YoY on a like-for-like basis (vs. 93.8% in H1 23) 7th consecutive quarter
Slide 6: Decisive Actions Across Three Priorities To Become a Better Performing Underwriter
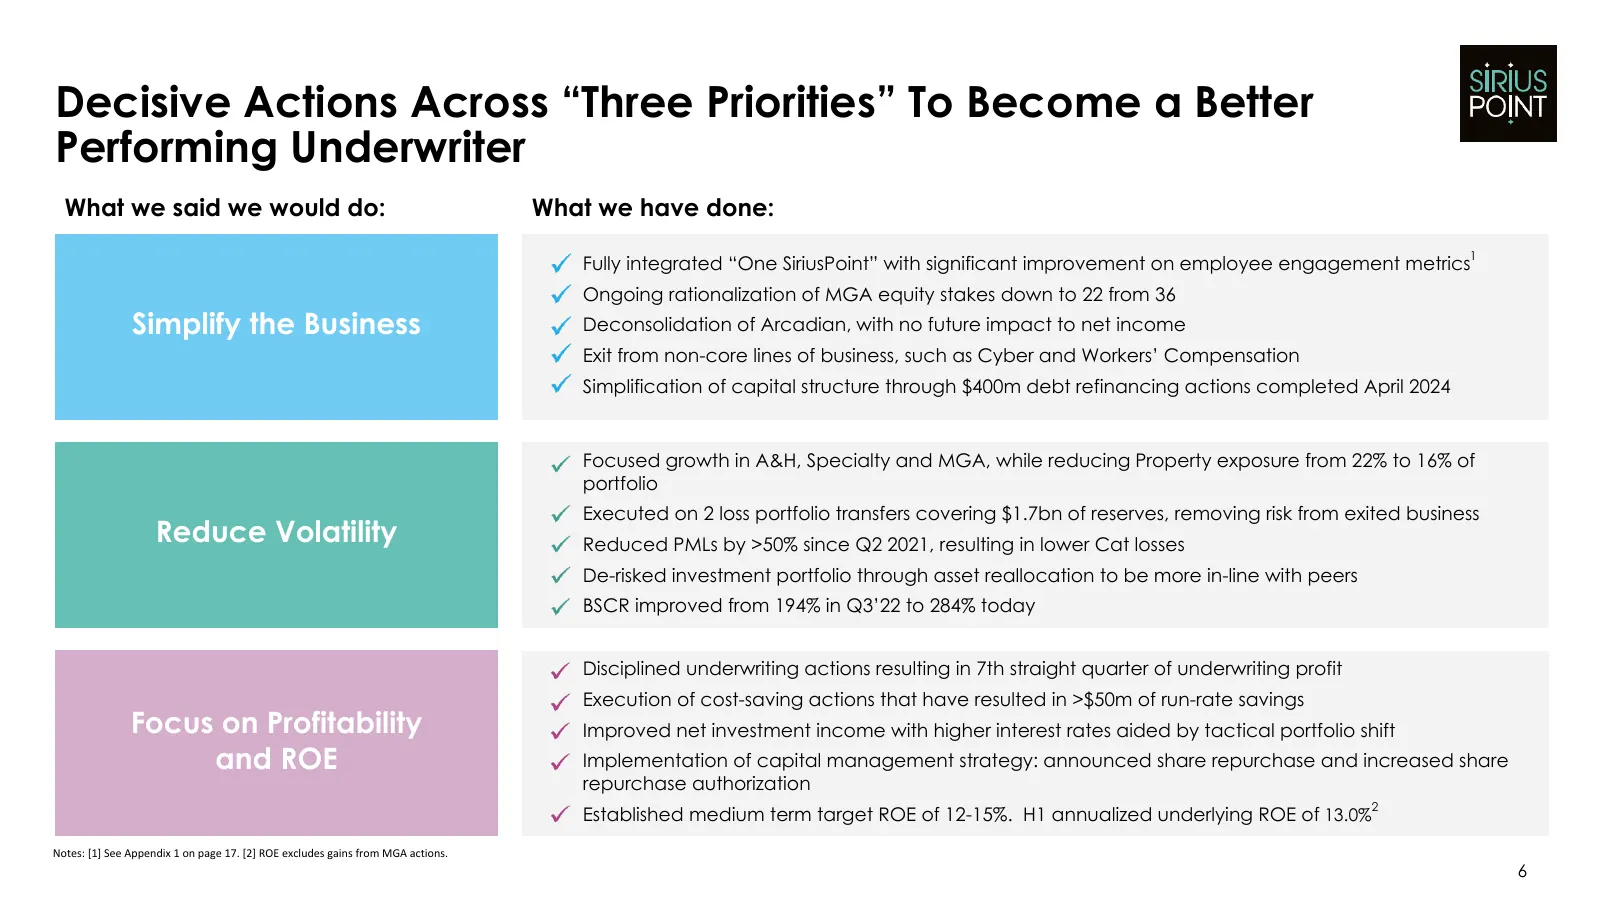
Decisive Actions Across “Three Priorities” To Become a Better Performing Underwriter What we said we would do: What we have done: 1 Fully integrated “One SiriusPoint” with significant improvement on employee engagement metrics Ongoing rationalization of MGA equity stakes down to 22 from 36 Simplify
Slide 7: Building a Track Record of Delivery
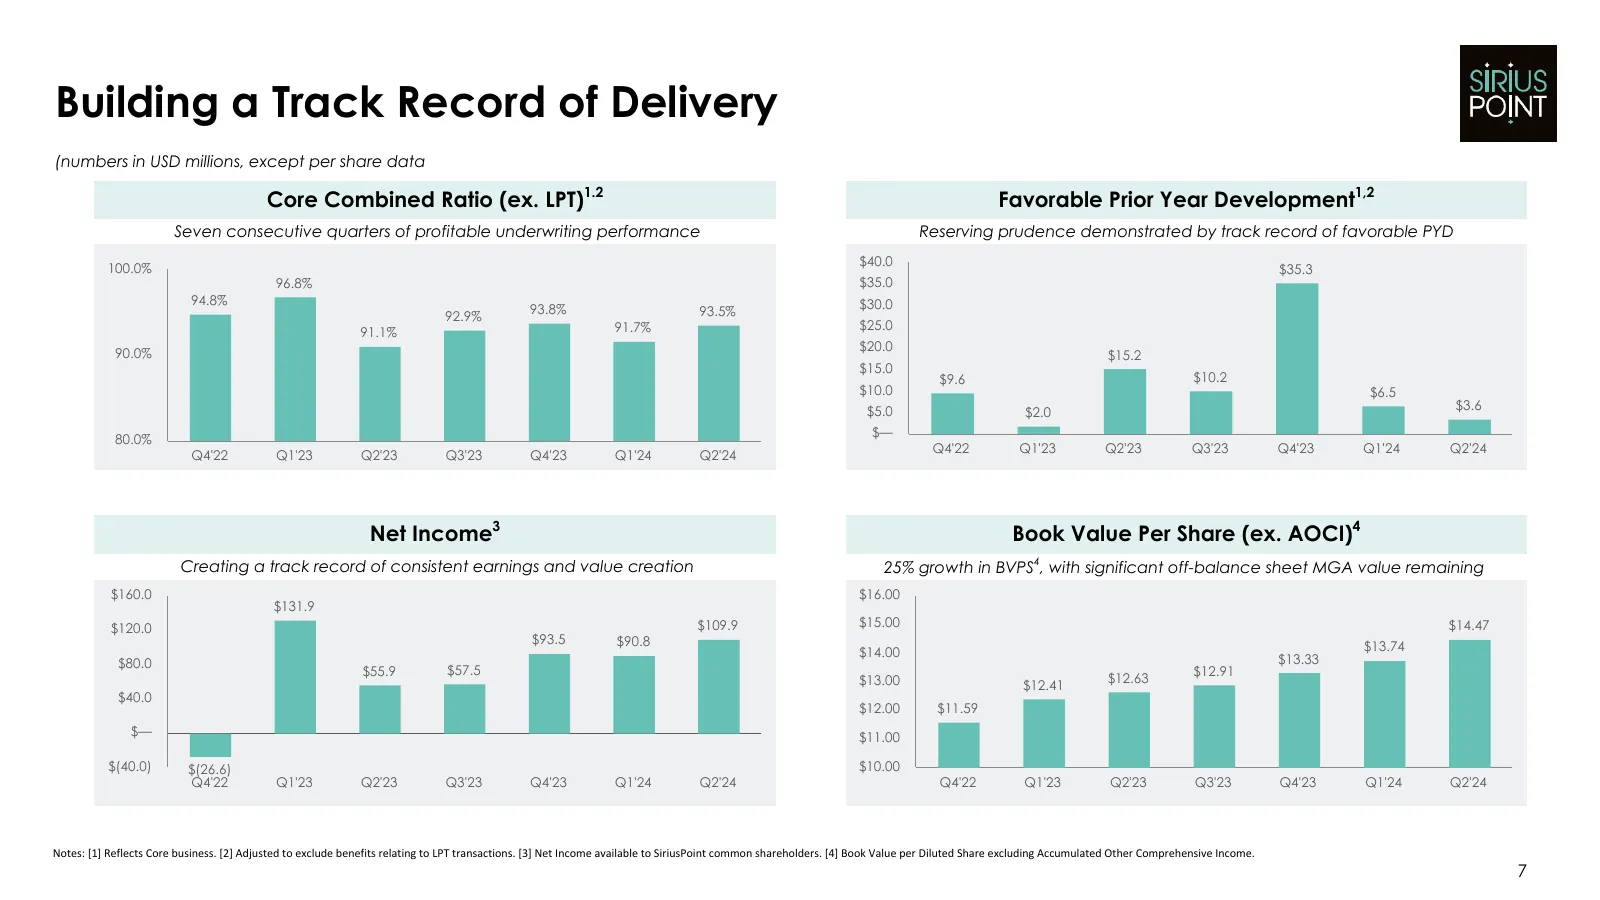
Building a Track Record of Delivery (numbers in USD millions, except per share data 1.2 1,2 Core Combined Ratio (ex. LPT) Favorable Prior Year Development Seven consecutive quarters of profitable underwriting performance Reserving prudence demonstrated by track record of favorable PYD $40.0 100.0% $
Slide 8: Specialized Business Model: All Engines are Delivering
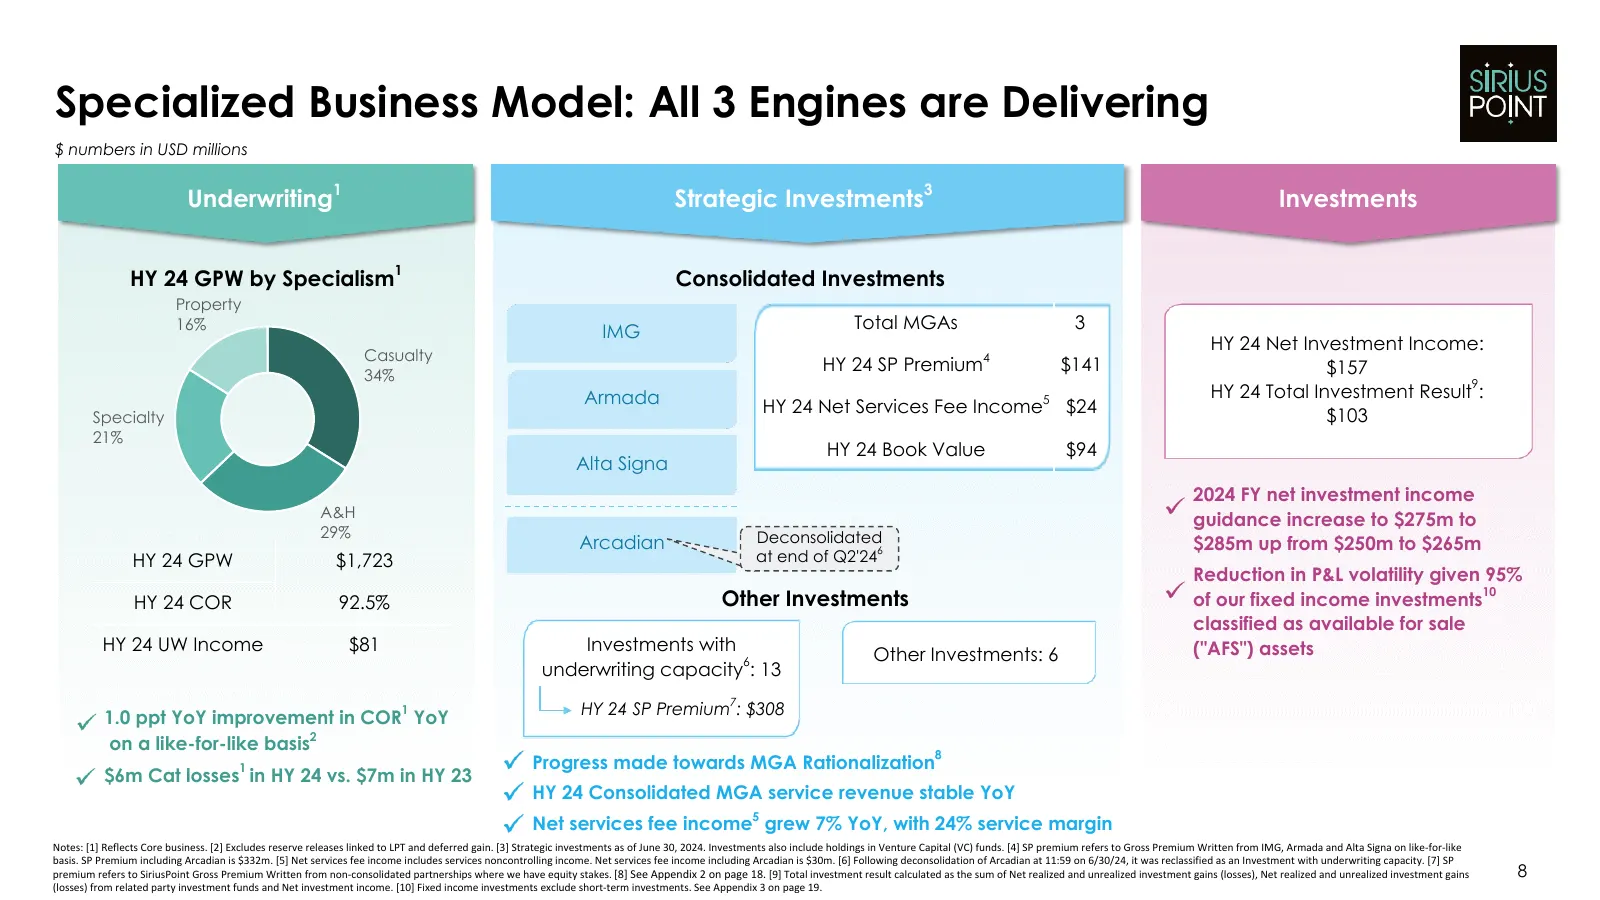
Specialized Business Model: All 3 Engines are Delivering $ numbers in USD millions 1 3 Underwriting Strategic Investments Investments 1 HY 24 GPW by Specialism Consolidated Investments Property 16% Total MGAs 3 IMG HY 24 Net Investment Income: Casualty 4 HY 24 SP Premium $141 $157 34% 9 Armada 5 HY
Slide 9: Half Year and Quarterly Results Update
Half Year and Quarterly Results Update 9
Slide 10: Q2 2024 Financial Results
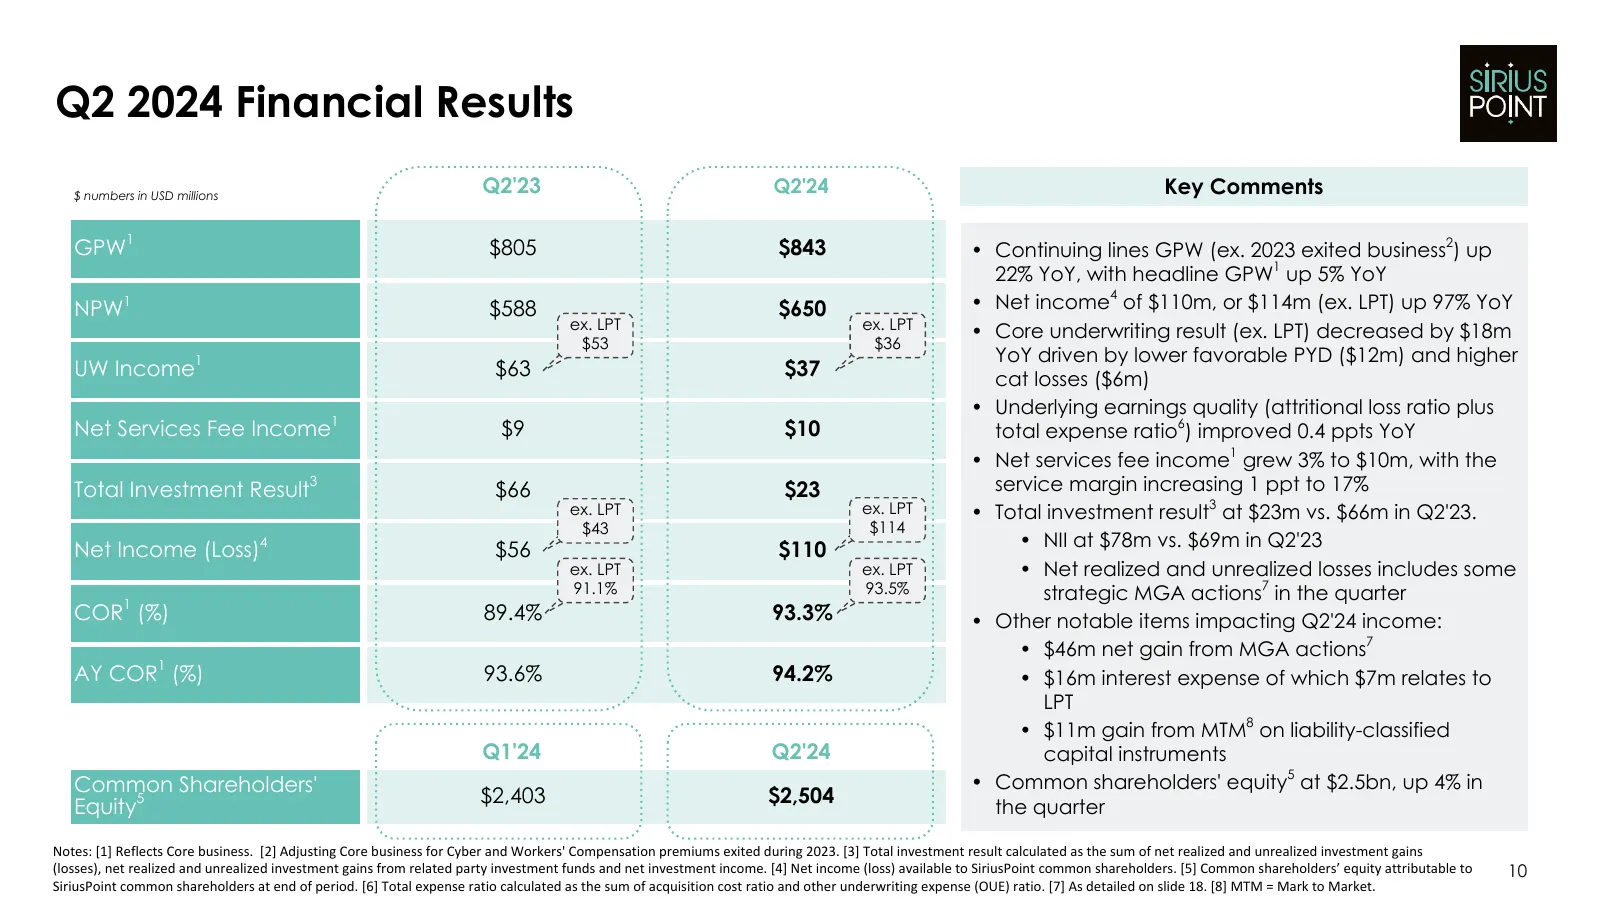
Q2 2024 Financial Results $ numbers in USD millions Q2'23 Q2'24 Key Comments 1 GPW $805 $843 • Continuing lines GPW (ex. 2023 exited business ) up 2 1 22% YoY, with headline GPW up 5% YoY 4 NPW 1 $588 $650 • Net income of $110m, or $114m (ex. LPT) up 97% YoY ex. LPT ex. LPT • Core underwriting resul
Slide 11: Half Year 2024 Financial Results
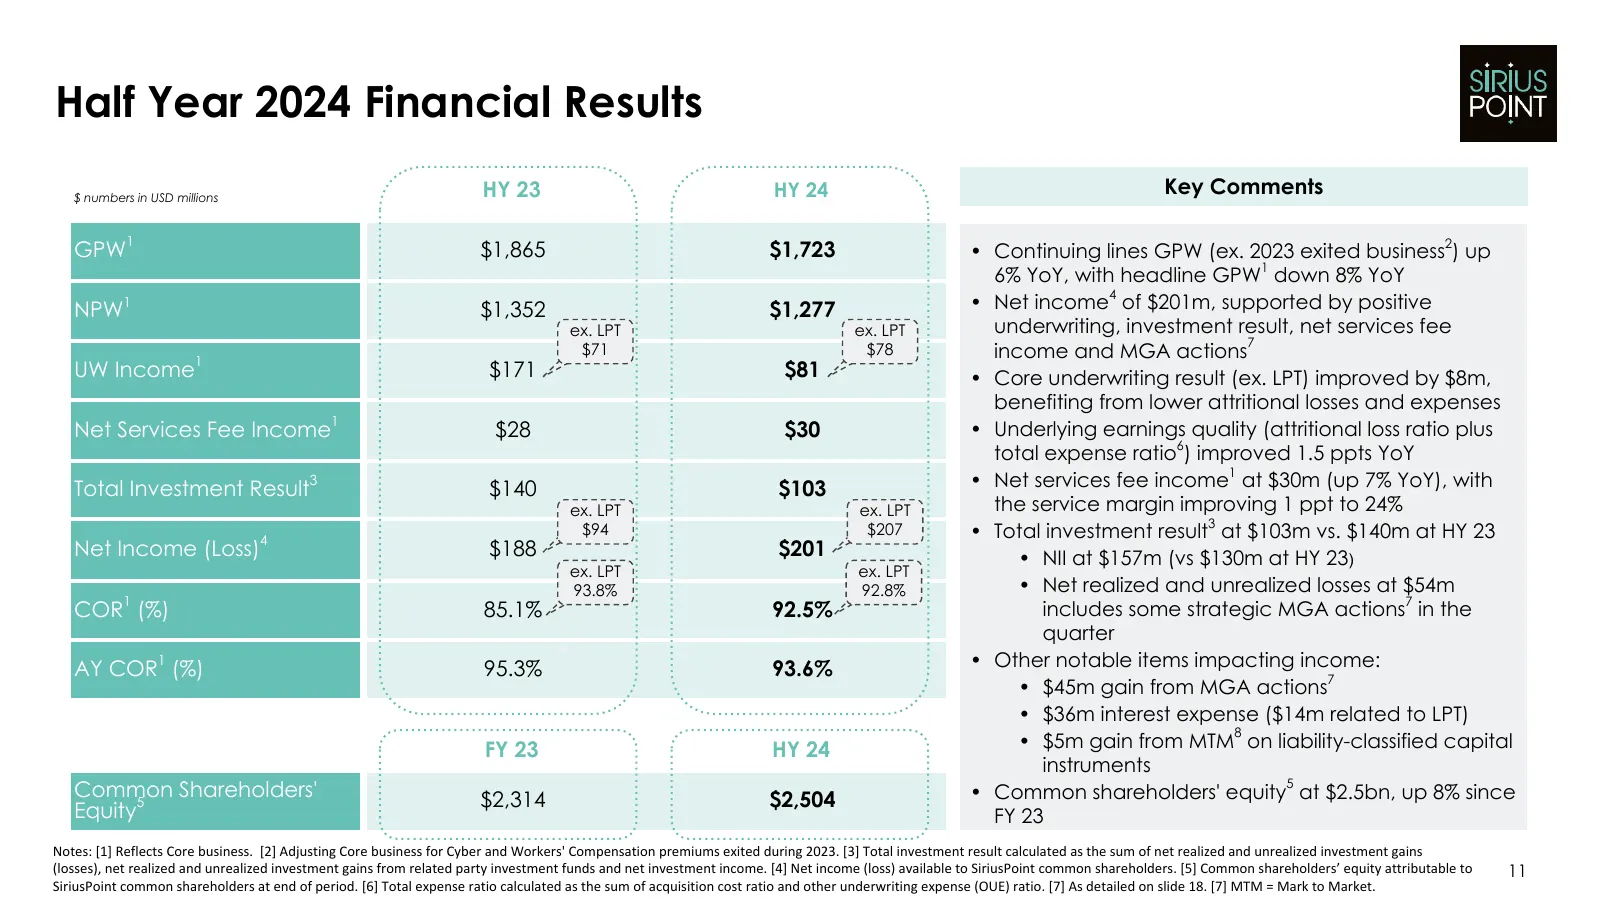
Half Year 2024 Financial Results $ numbers in USD millions HY 23 HY 24 Key Comments 1 2 GPW $1,865 $1,723 • Continuing lines GPW (ex. 2023 exited business ) up 1 6% YoY, with headline GPW down 8% YoY 4 NPW 1 $1,352 $1,277 • Net income of $201m, supported by positive ex. LPT ex. LPT underwriting, inv
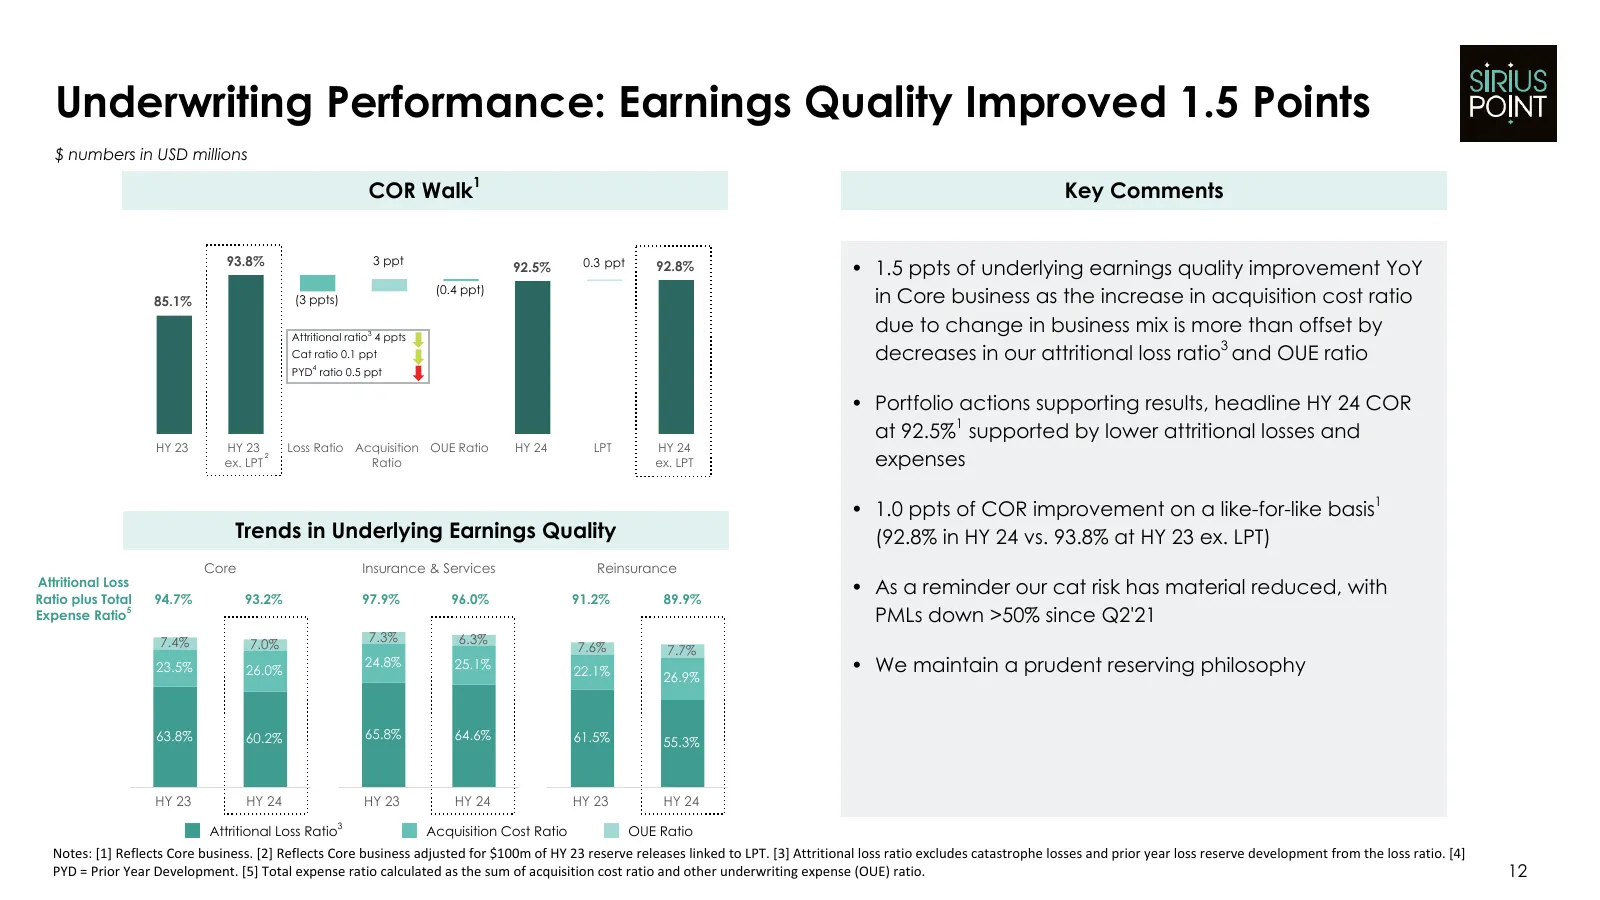
Slide 12: Underwriting Performance: Earnings Quality Improved 1.5 Points
Underwriting Performance: Earnings Quality Improved 1.5 Points $ numbers in USD millions 1 COR Walk Key Comments 93.8% 3 ppt 0.3 ppt 92.5% 92.8% • 1.5 ppts of underlying earnings quality improvement YoY (0.4 ppt) 85.1% (3 ppts) in Core business as the increase in acquisition cost ratio 3 Attritional
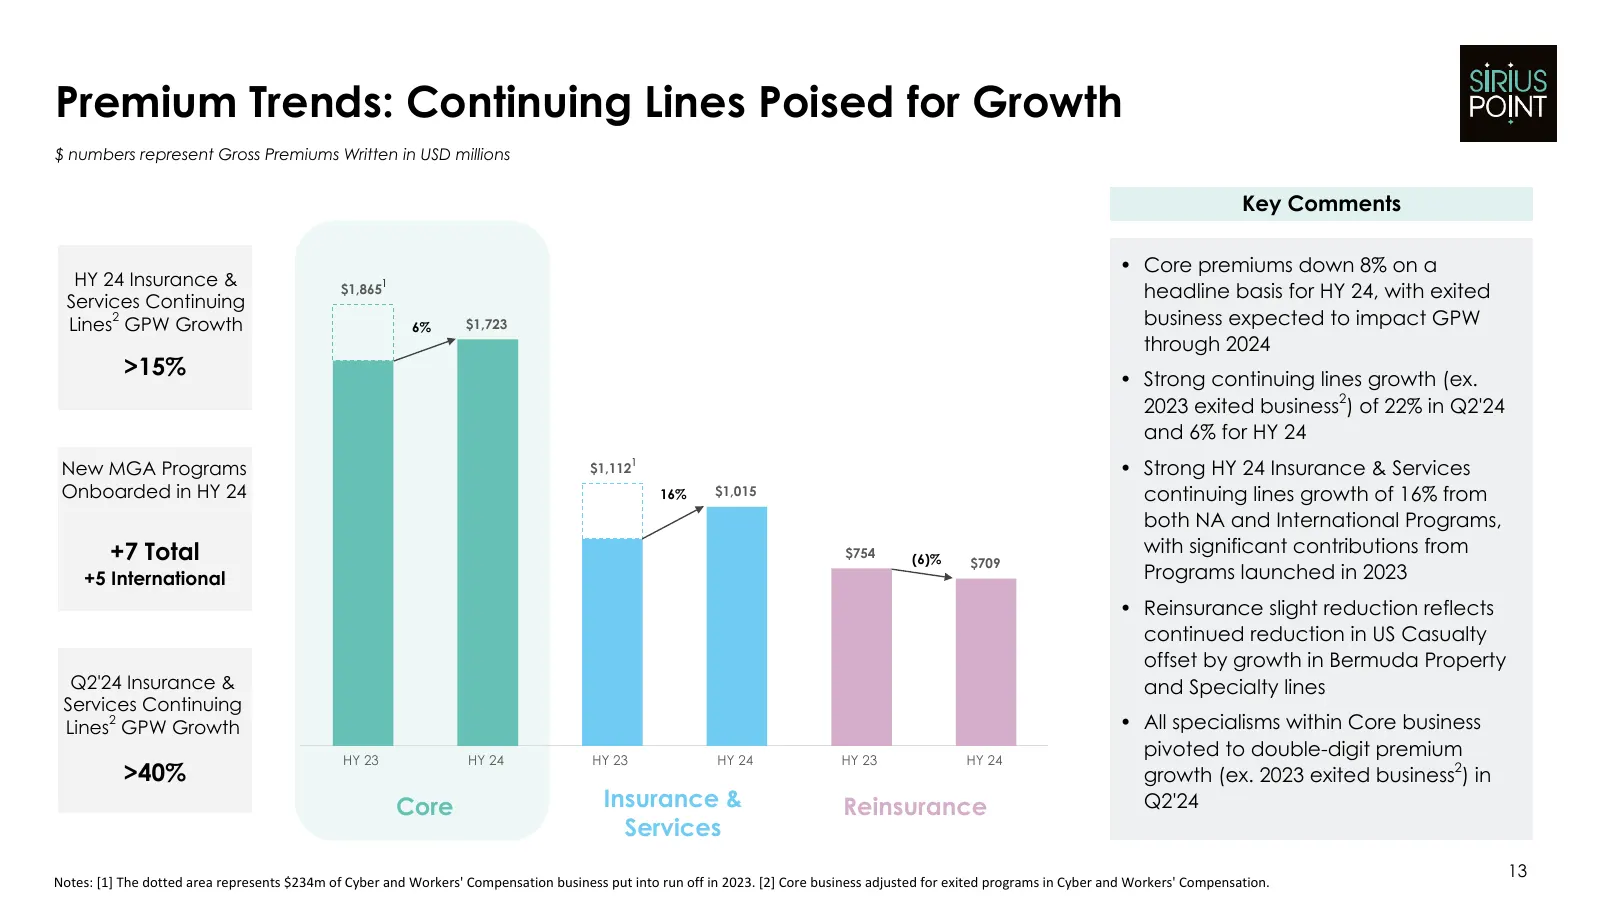
Slide 13: Premium Trends: Continuing Lines Poised for Growth
Premium Trends: Continuing Lines Poised for Growth $ numbers represent Gross Premiums Written in USD millions Key Comments • Core premiums down 8% on a HY 24 Insurance & 1 Services Continuing $1,865 headline basis for HY 24, with exited 2 Lines GPW Growth 6% $1,723 business expected to impact GPW th
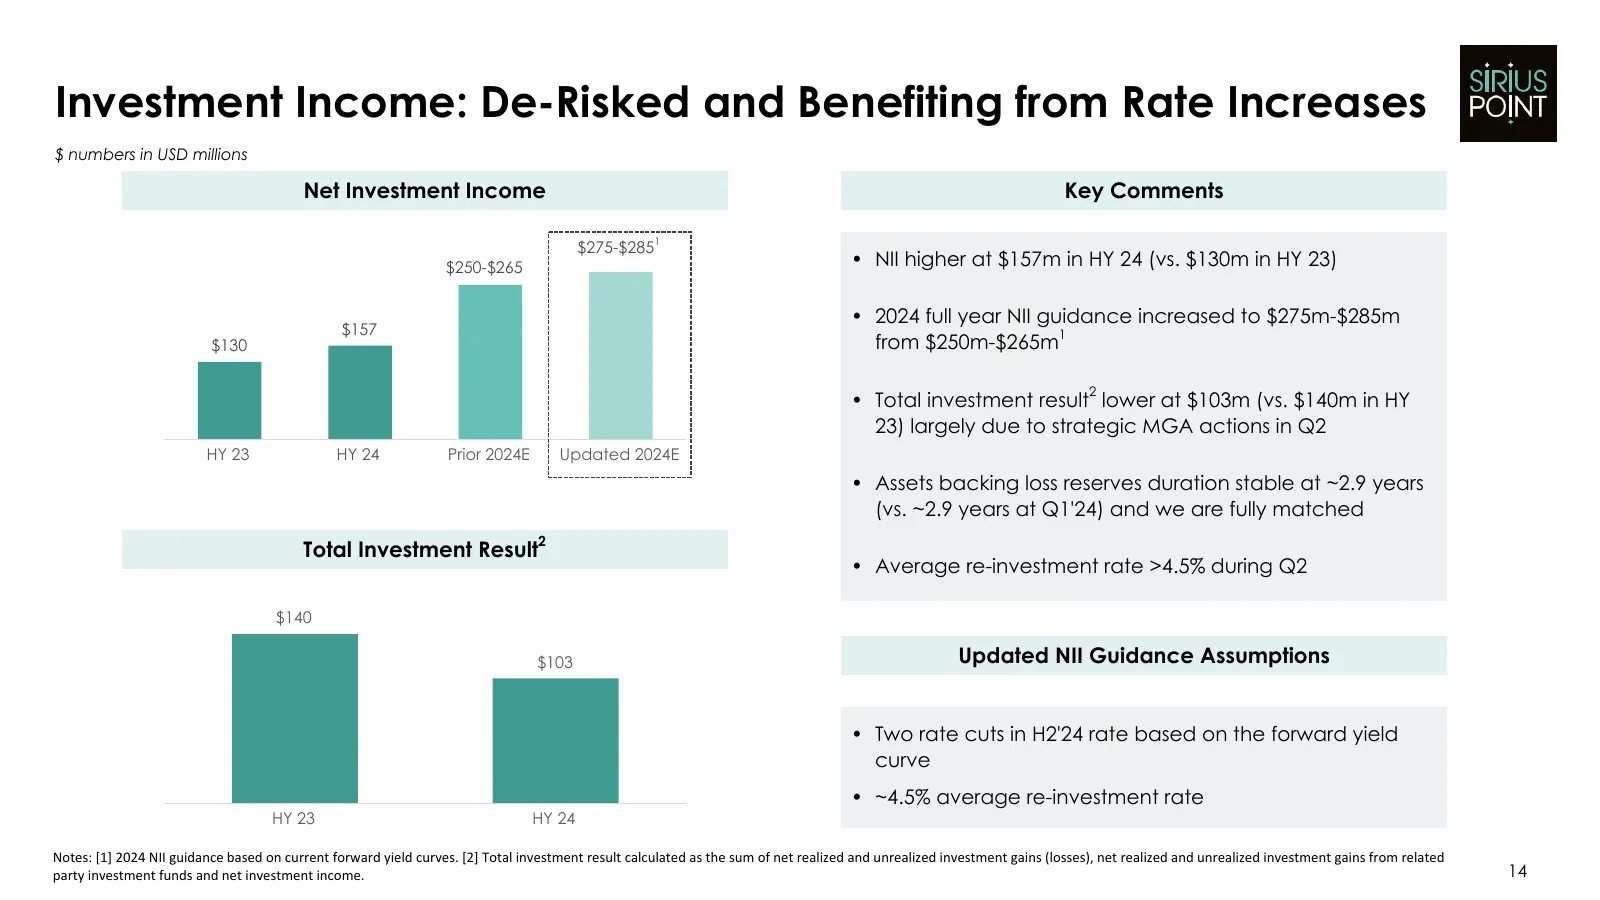
Slide 14: Investment Income: De-Risked and Benefiting from Rate Increases
Investment Income: De-Risked and Benefiting from Rate Increases $ numbers in USD millions Net Investment Income Key Comments 1 $275-$285 $250-$265 • NII higher at $157m in HY 24 (vs. $130m in HY 23) • 2024 full year NII guidance increased to $275m-$285m $157 1 $130 from $250m-$265m 2 • Total investm
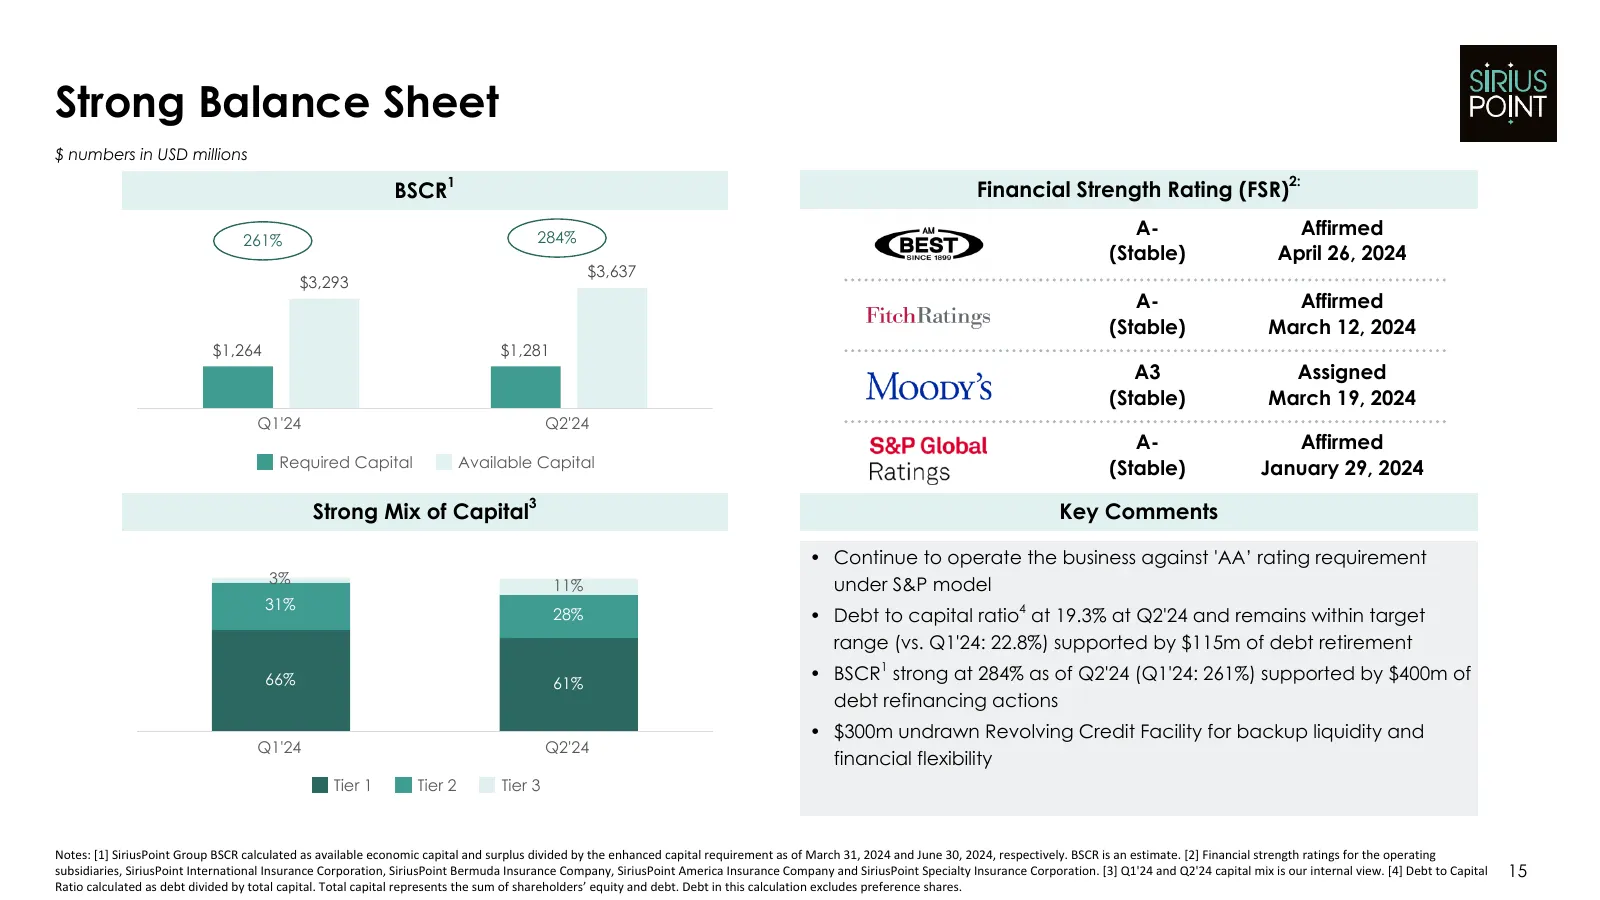
Slide 15: Strong Balance Sheet
Strong Balance Sheet $ numbers in USD millions 1 2: BSCR Financial Strength Rating (FSR) 284% A- Affirmed 261% (Stable) April 26, 2024 $3,637 $3,293 A- Affirmed (Stable) March 12, 2024 $1,264 $1,281 A3 Assigned (Stable) March 19, 2024 Q1'24 Q2'24 A- Affirmed Required Capital Available Capital (Stabl

Slide 16: Appendix
SiRiUs POINT
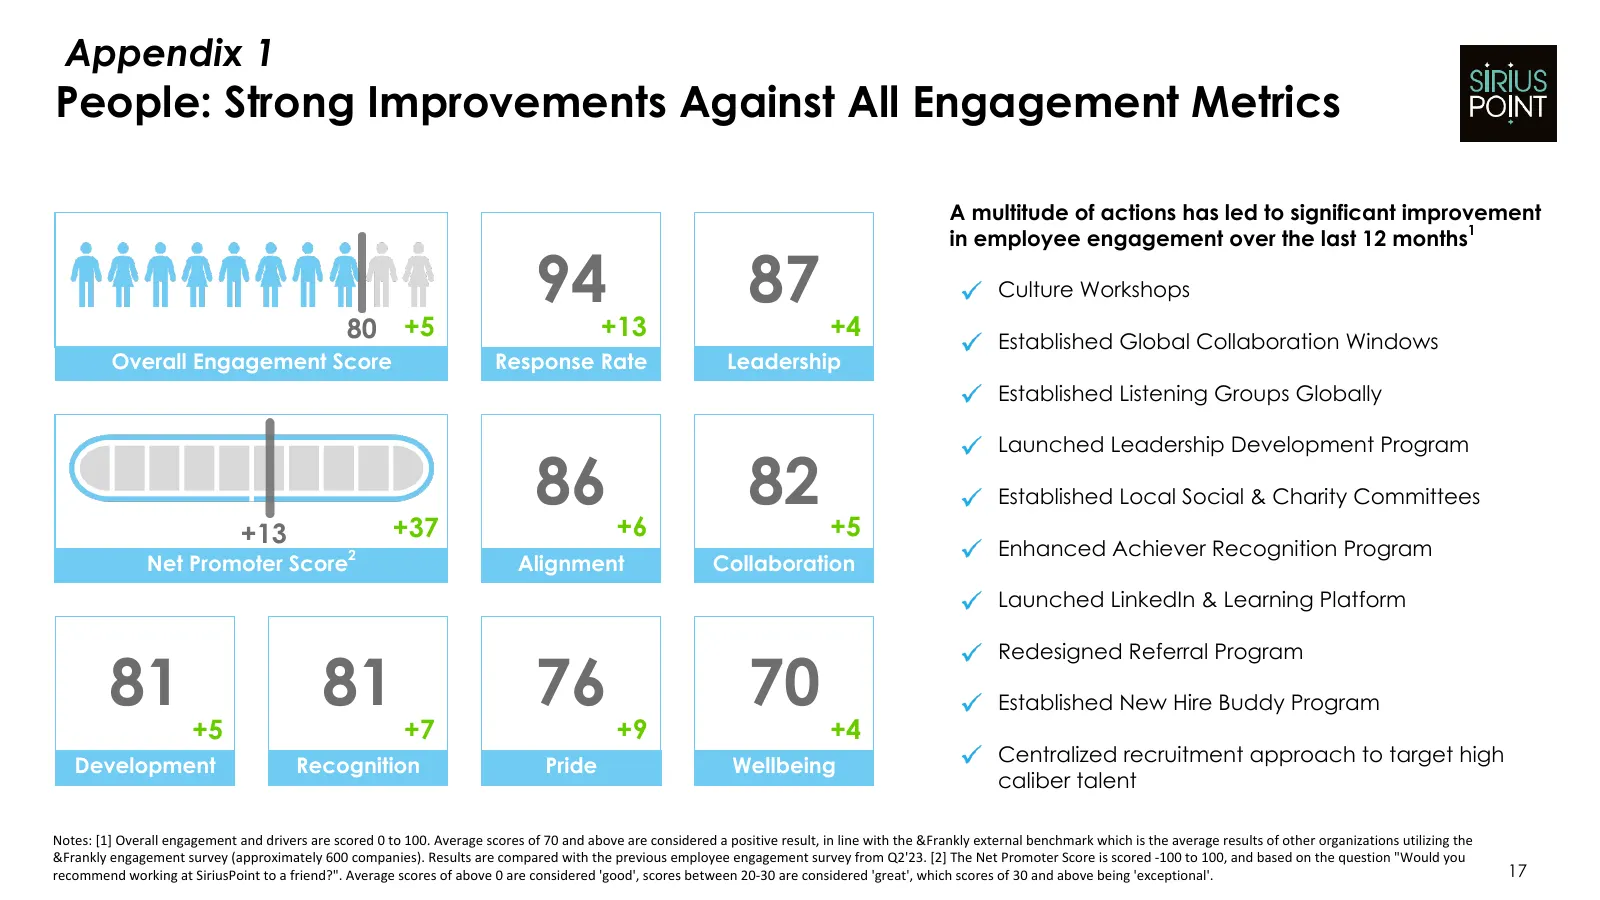
Slide 17: People: Strong Improvements Against All Engagement Metrics
Appendix 1 People: Strong Improvements Against All Engagement Metrics A multitude of actions has led to significant improvement 1 in employee engagement over the last 12 months 94 87 Culture Workshops 80 +5 +13 +4 Established Global Collaboration Windows Overall Engagement Score Response Rate Leader
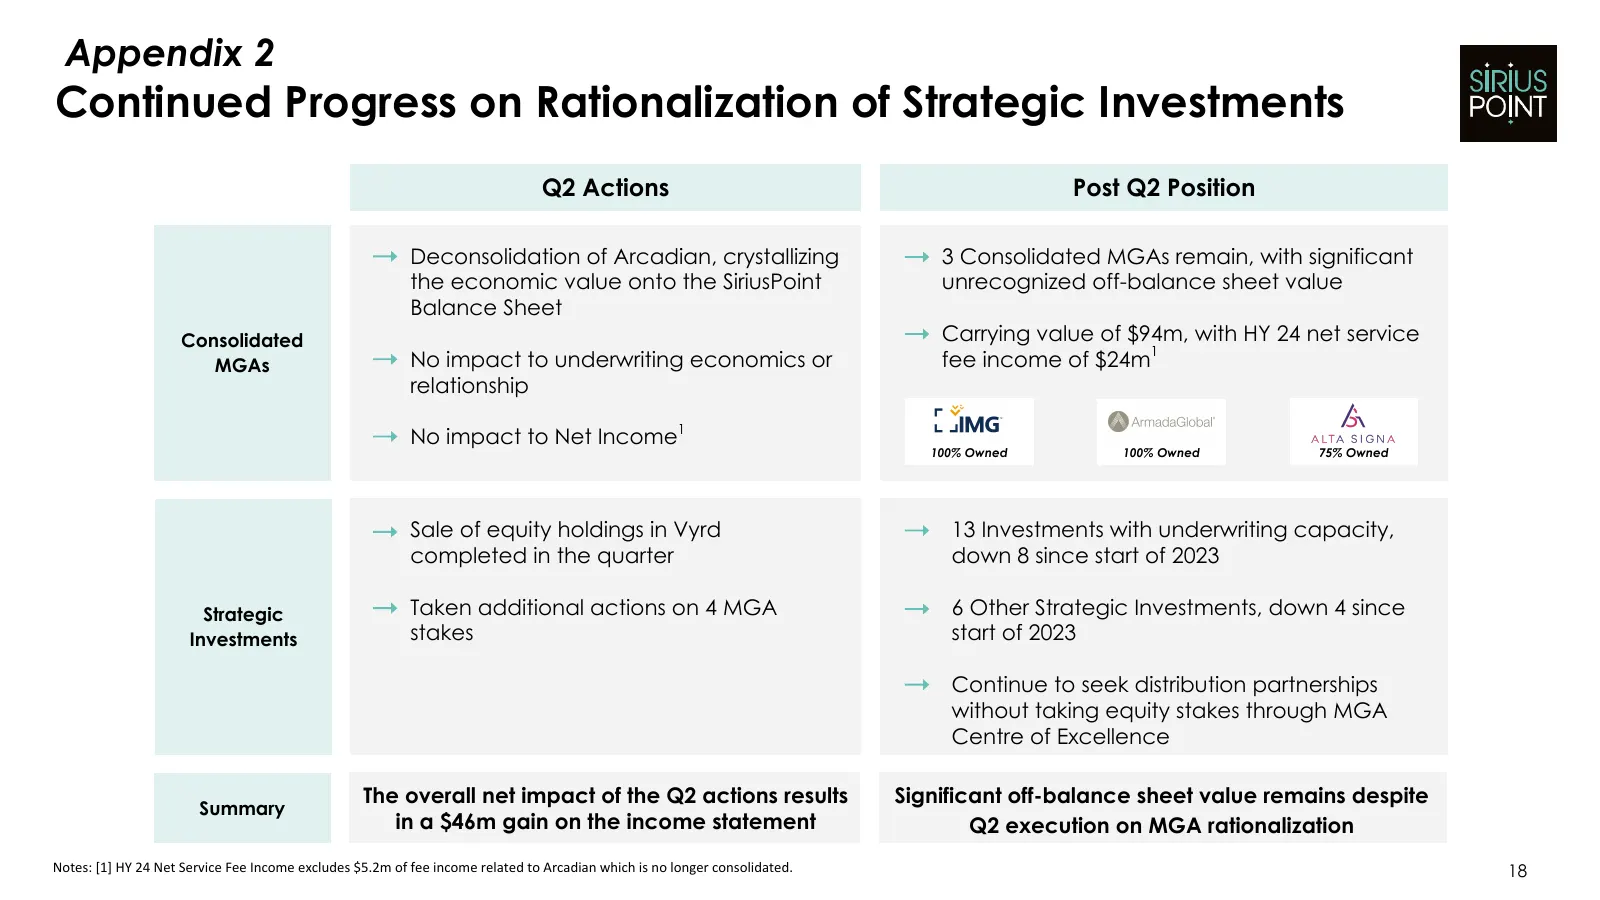
Slide 18: Continued Progress on Rationalization of Strategic Investments
Appendix 2 Continued Progress on Rationalization of Strategic Investments Q2 Actions Post Q2 Position Deconsolidation of Arcadian, crystallizing 3 Consolidated MGAs remain, with significant the economic value onto the SiriusPoint unrecognized off-balance sheet value Balance Sheet Consolidated Carryi
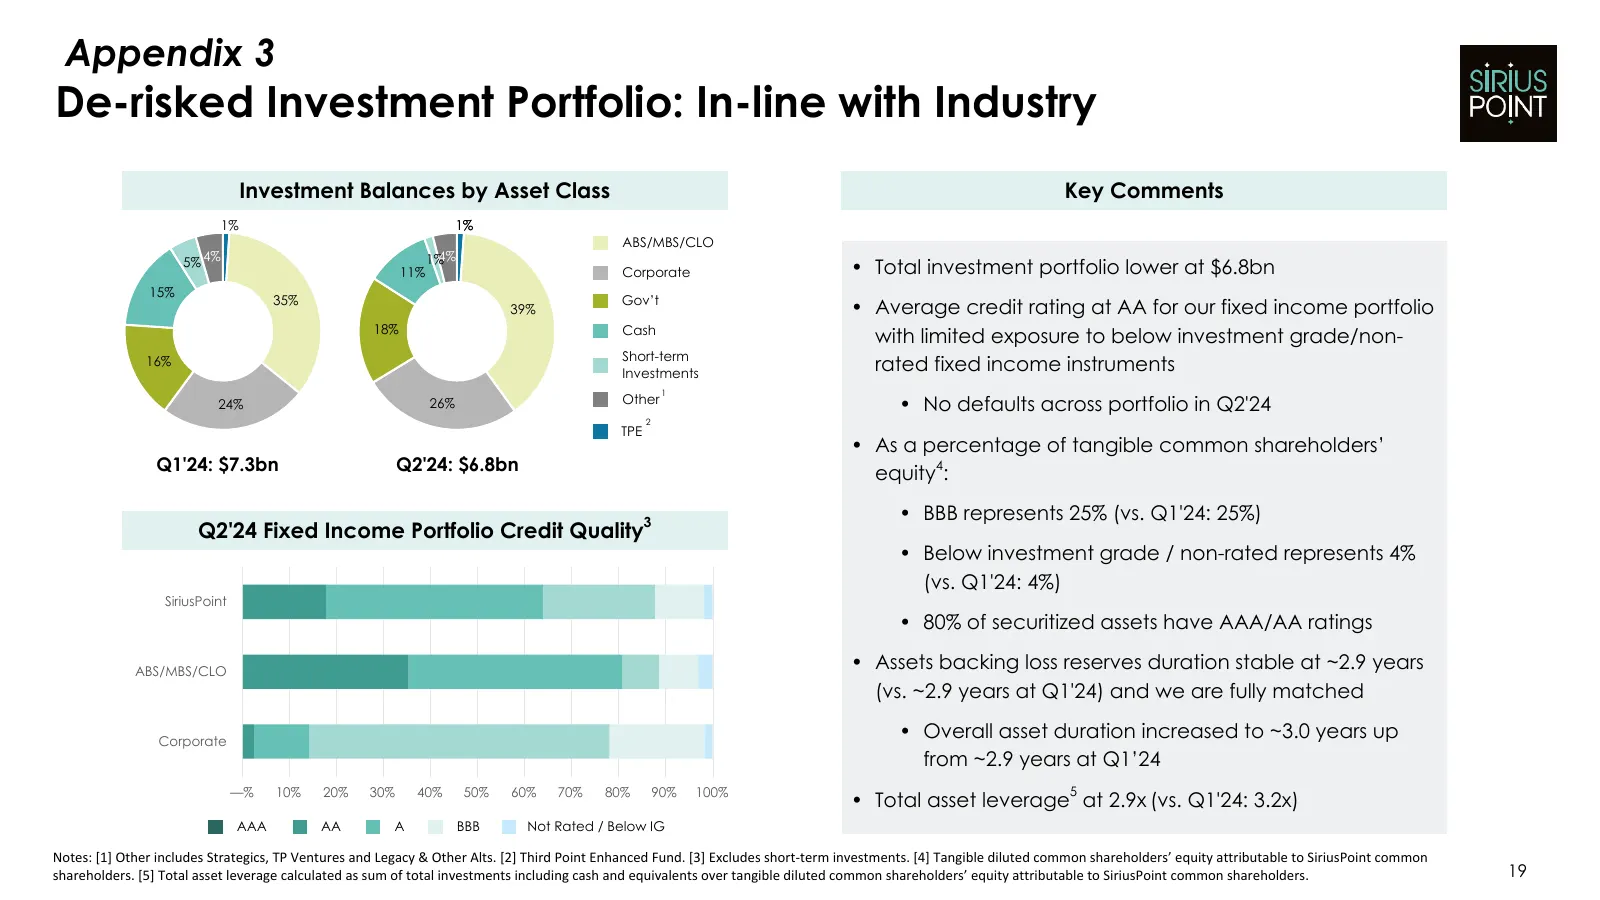
Slide 19: De-risked Investment Portfolio: In-line with Industry
Appendix 3 De-risked Investment Portfolio: In-line with Industry Investment Balances by Asset Class Key Comments 1% 1% ABS/MBS/CLO 5% 4% 1%4% 11% Corporate • Total investment portfolio lower at $6.8bn 15% 35% Gov’t 39% • Average credit rating at AA for our fixed income portfolio 18% Cash with limite

Slide 20: Thank You
SiRiUs POINT
Source: 6ix earnings call
More decks from SiriusPoint Ltd.
 Q3 2026 Earnings Presentation37 slides · Nov 6, 2026
 Q2 2026 Earnings Presentation37 slides · Jul 30, 2026
 Q1 2026 Earnings Presentation32 slides · May 8, 2026
 Q4 2025 Earnings Presentation34 slides · Feb 19, 2026
 Q3 2025 Earnings Presentation31 slides · Oct 30, 2025
 Q2 2025 Earnings Presentation29 slides · Aug 4, 2025