SiriusPoint Ltd. · NYSE:SPNT
SiriusPoint — Q3 2025 Earnings Presentation
31 slides from SiriusPoint's earnings presentation, Oct 30, 2025
Slide 1: Q3 2025 Investor Presentation
Q3 2025 INVESTOR PRESENTATION October 30, 2025 NYSE: SPNT
Slide 2: Disclaimer
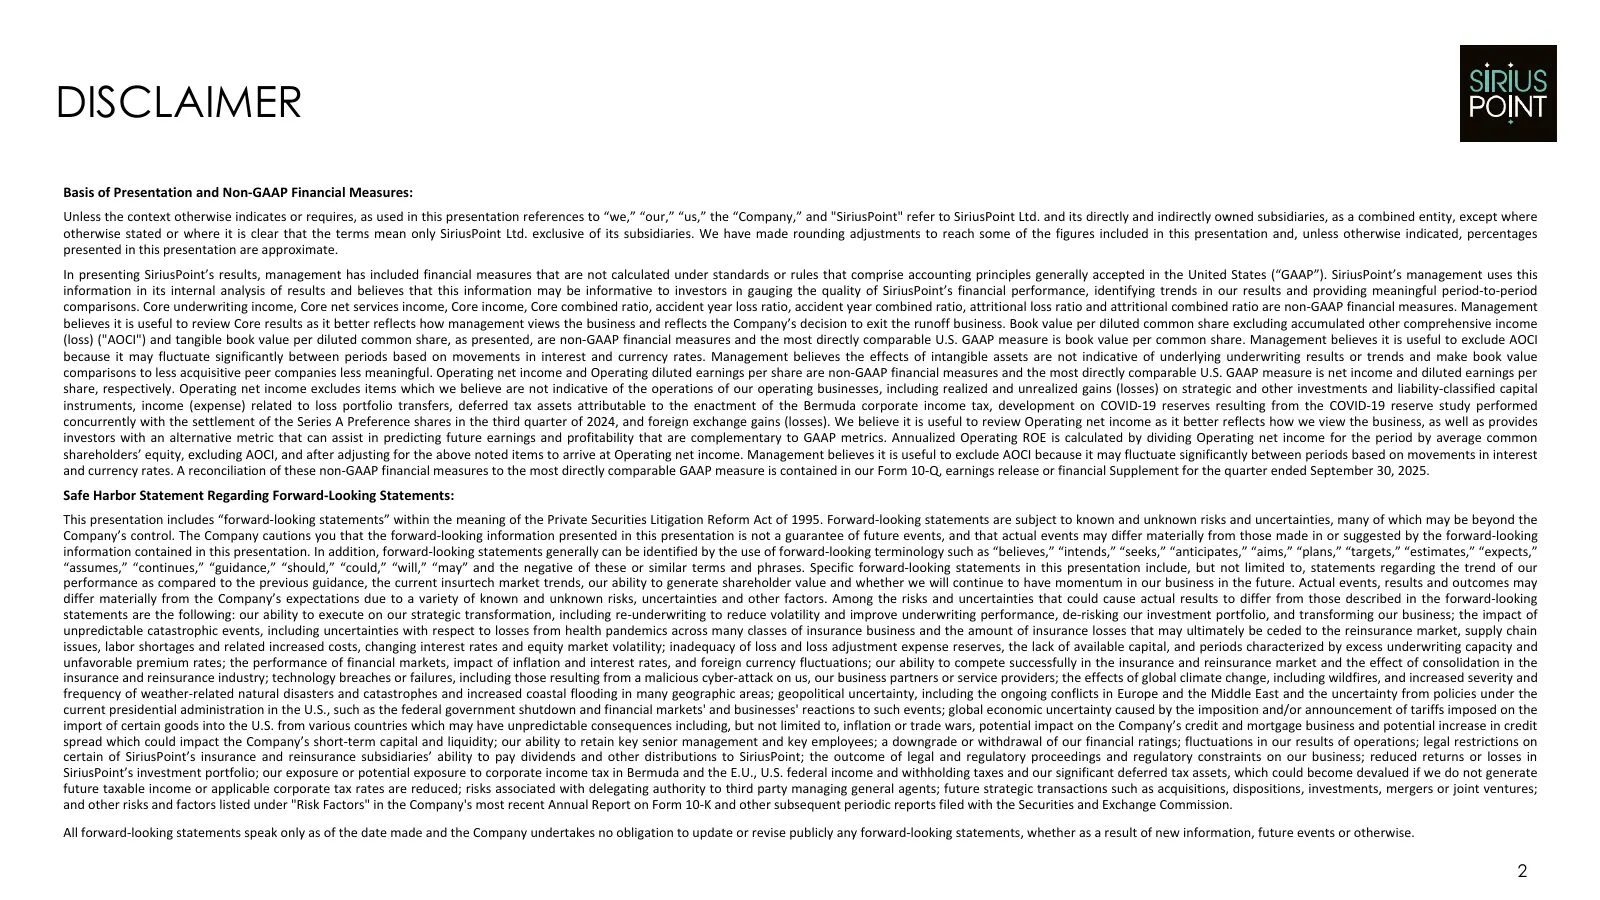
DISCLAIMER Basis of Presentation and Non-GAAP Financial Measures: Unless the context otherwise indicates or requires, as used in this presentation references to “we,” “our,” “us,” the “Company,” and "SiriusPoint" refer to SiriusPoint Ltd. and its directly and indirectly owned subsidiaries, as a comb

Slide 3: Agenda
AGENDA Highlights & Strategic Update Scott Egan, Group CEO Third Quarter & Nine Months Results Update Jim McKinney, Group CFO Q&A 3

Slide 4: Highlights & Strategic Update
Highlights & Strategic Update
Slide 5: SiriusPoint Overview
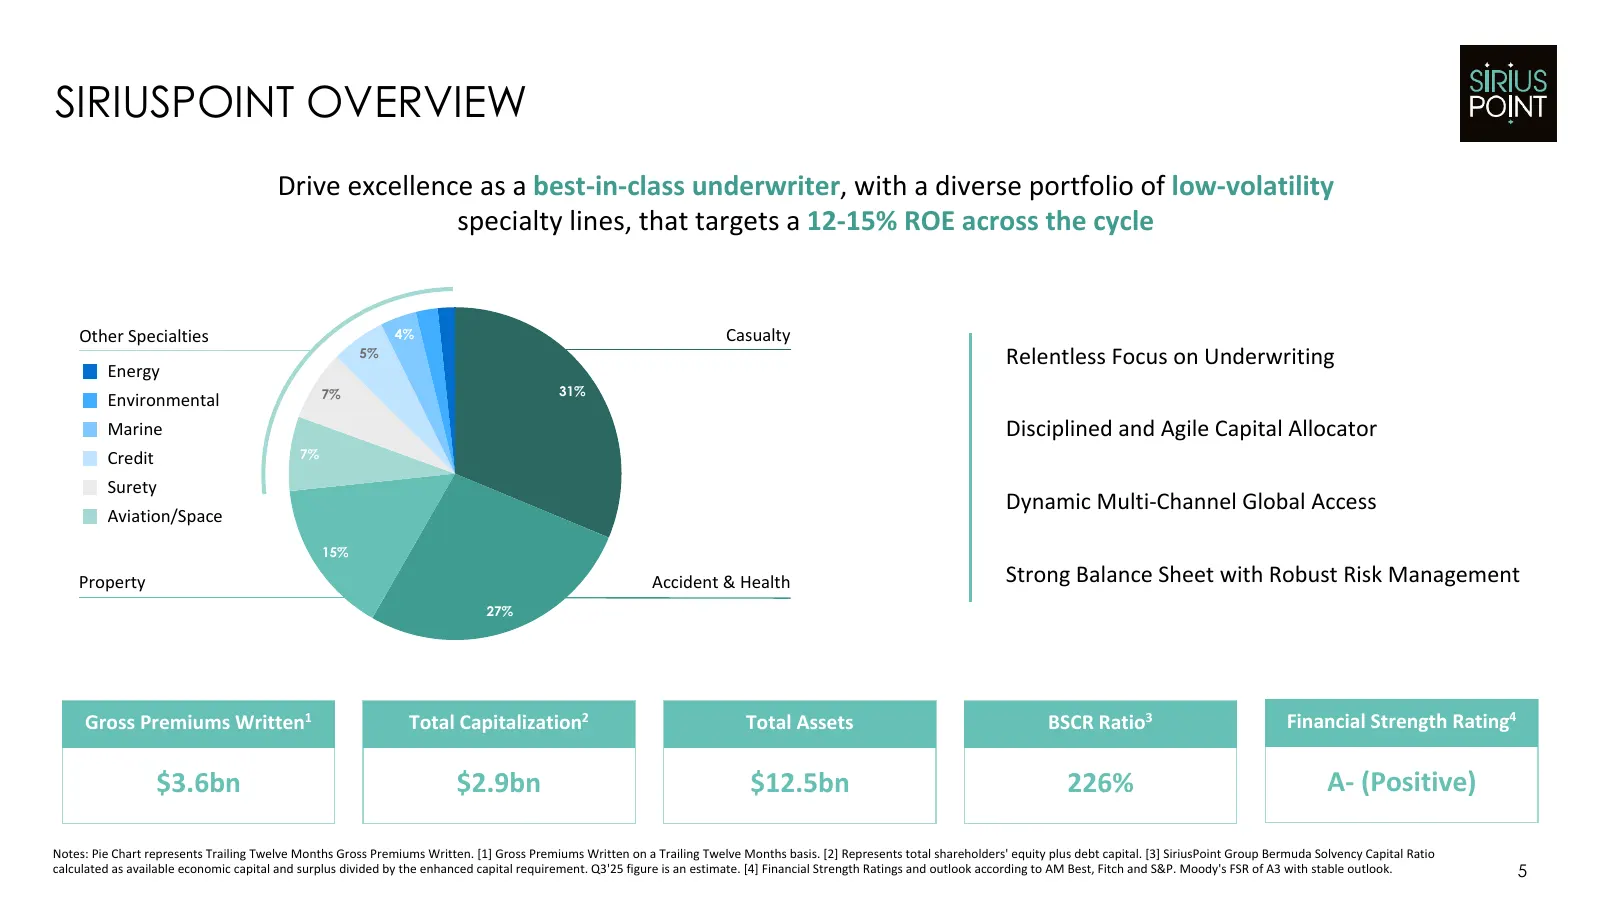
SIRIUSPOINT OVERVIEW Drive excellence as a best-in-class underwriter, with a diverse portfolio of low-volatility specialty lines, that targets a 12-15% ROE across the cycle Other Specialties 4% Casualty 5% Relentless Focus on Underwriting Energy 7% 31% Environmental Marine Disciplined and Agile Capi
Slide 6: Another Quarter of Strong Earnings & Profitable Growth
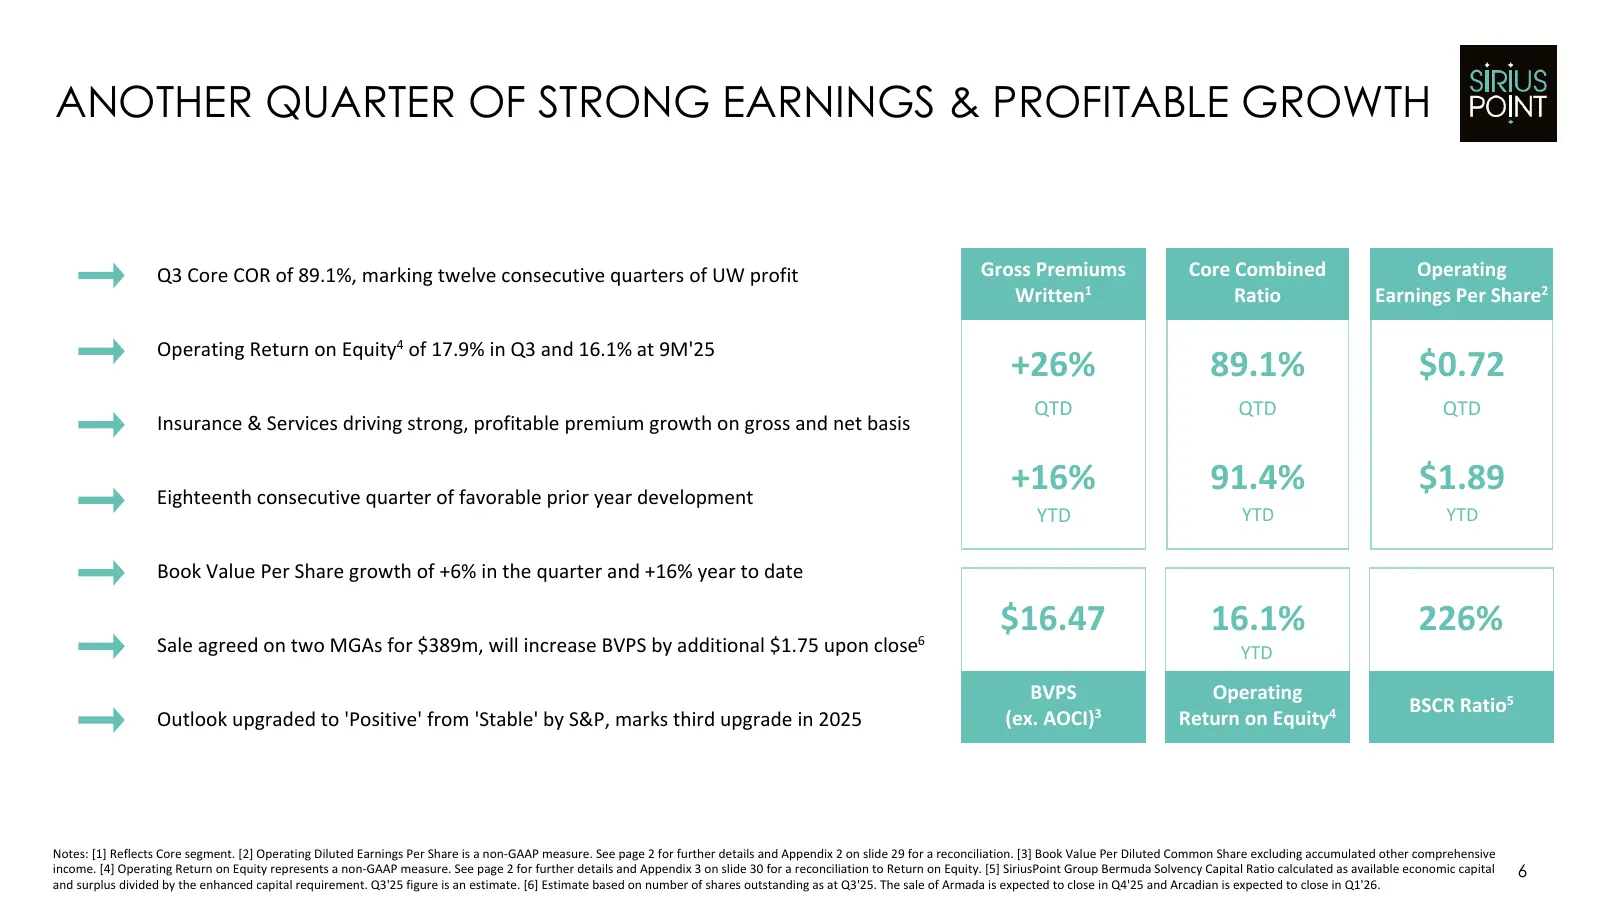
ANOTHER QUARTER OF STRONG EARNINGS & PROFITABLE GROWTH Q3 Core COR of 89.1%, marking twelve consecutive quarters of UW profit Gross Premiums Core Combined Operating Written1 Ratio Earnings Per Share2 Operating Return on Equity4 of 17.9% in Q3 and 16.1% at 9M'25 +26% 89.1% $0.72 QTD QTD QTD Insurance
Slide 7: Reshaped Platform Enabling Profitable Growth
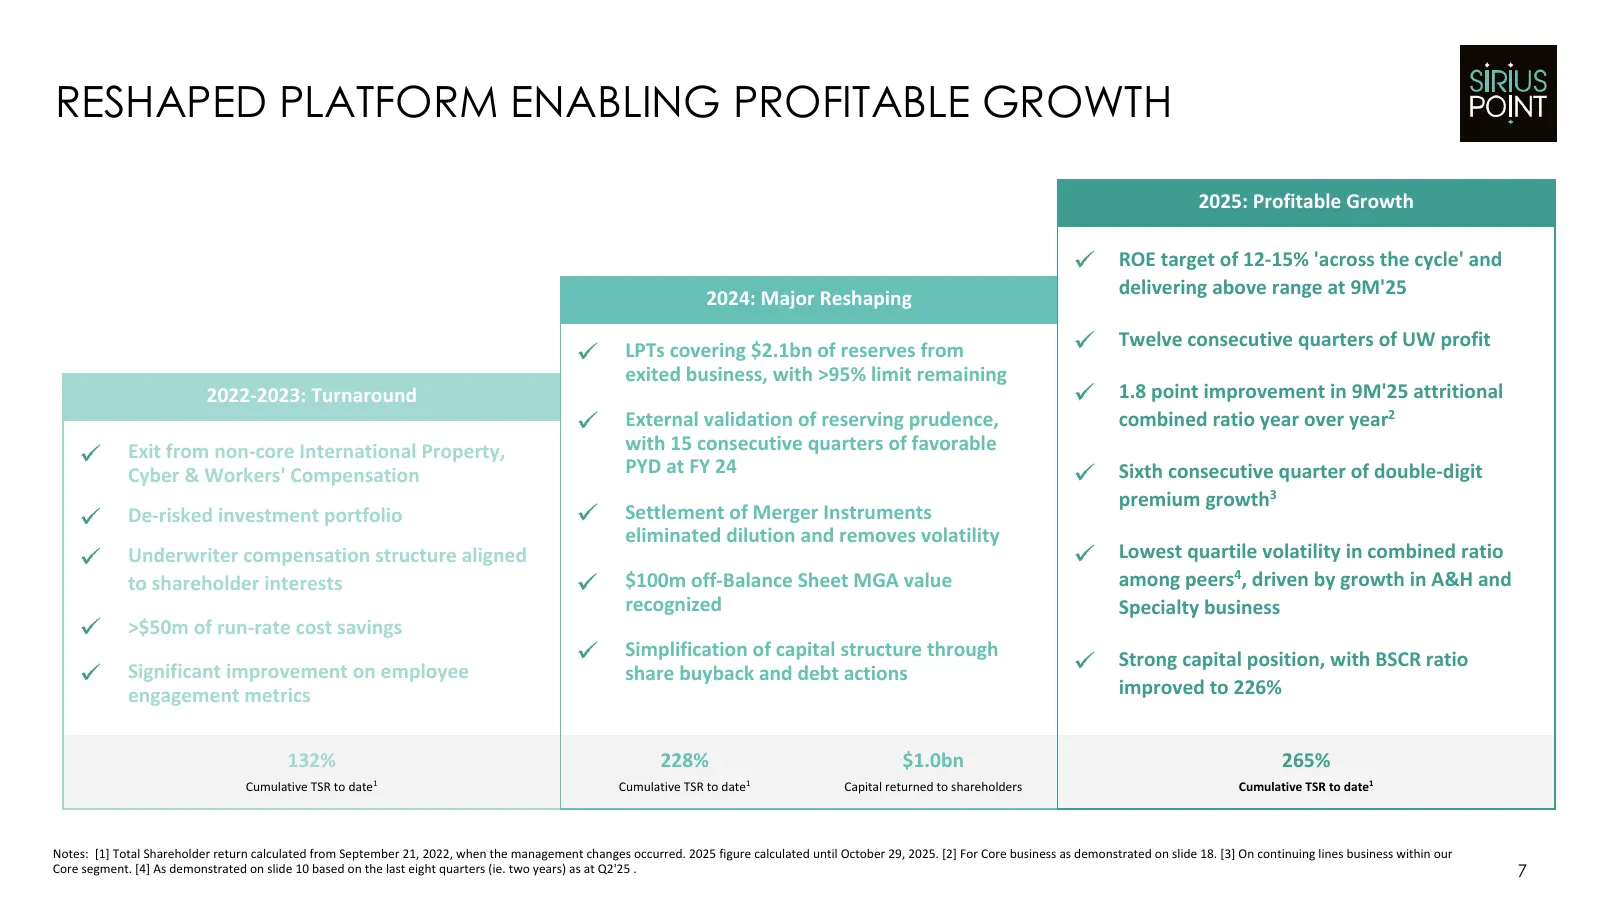
RESHAPED PLATFORM ENABLING PROFITABLE GROWTH 2025: Profitable Growth ROE target of 12-15% 'across the cycle' and delivering above range at 9M'25 2024: Major Reshaping Twelve consecutive quarters of UW profit LPTs covering $2.1bn of reserves from exited business, with >95% limit remaining 2022-2023:
Slide 8: Track Record of Attractive Earnings and Value Creation
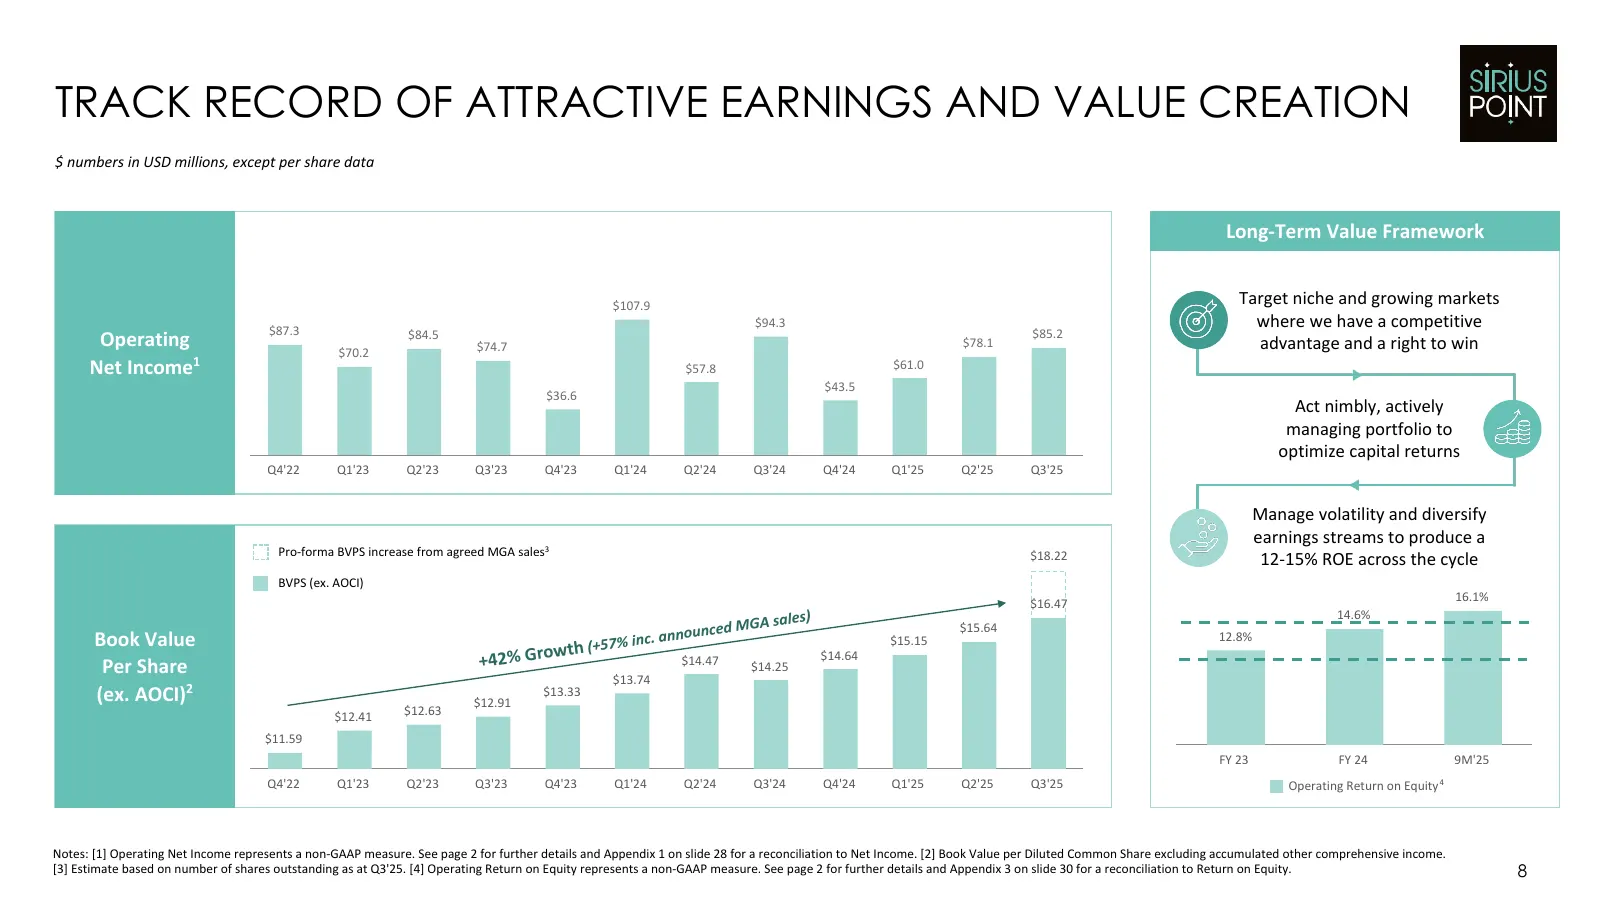
TRACK RECORD OF ATTRACTIVE EARNINGS AND VALUE CREATION $ numbers in USD millions, except per share data Long-Term Value Framework $107.9 Target niche and growing markets $87.3 $94.3 where we have a competitive $85.2 Operating $84.5 $74.7 $78.1 advantage and a right to win $70.2 Net Income1 $57.8 $61
Slide 9: Progress Towards Our Aim of Best-in-Class Underwriting
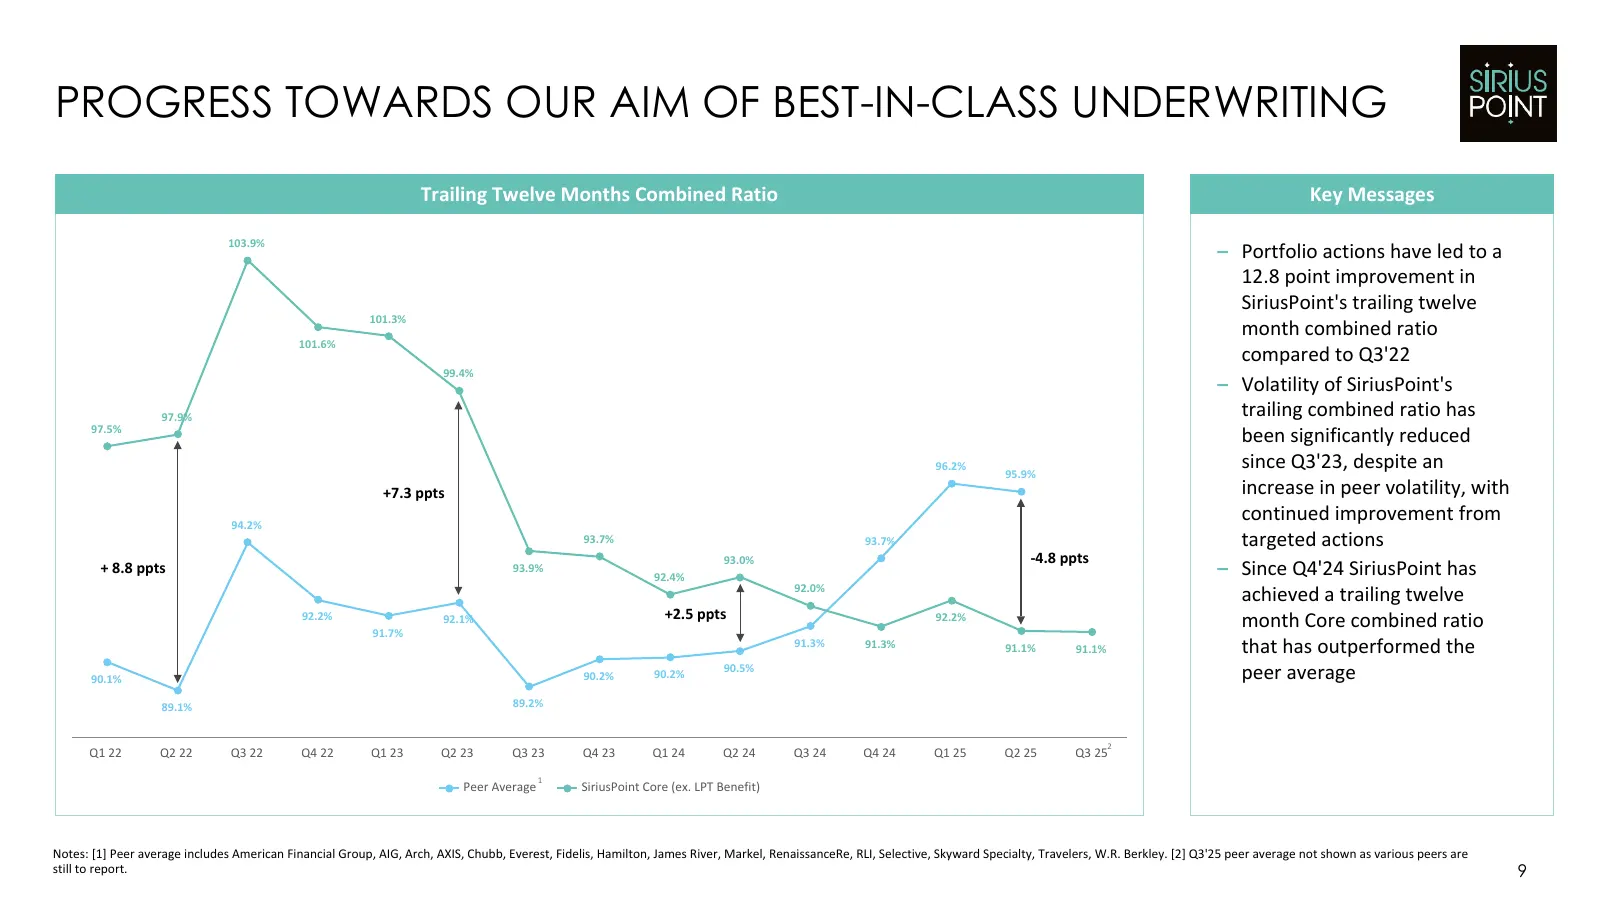
PROGRESS TOWARDS OUR AIM OF BEST-IN-CLASS UNDERWRITING Trailing Twelve Months Combined Ratio Key Messages 103.9% – Portfolio actions have led to a 12.8 point improvement in SiriusPoint's trailing twelve 101.3% month combined ratio 101.6% compared to Q3'22 99.4% – Volatility of SiriusPoint's 97.9% tr
Slide 10: Portfolio Managed to Deliver a Low Volatility Profile
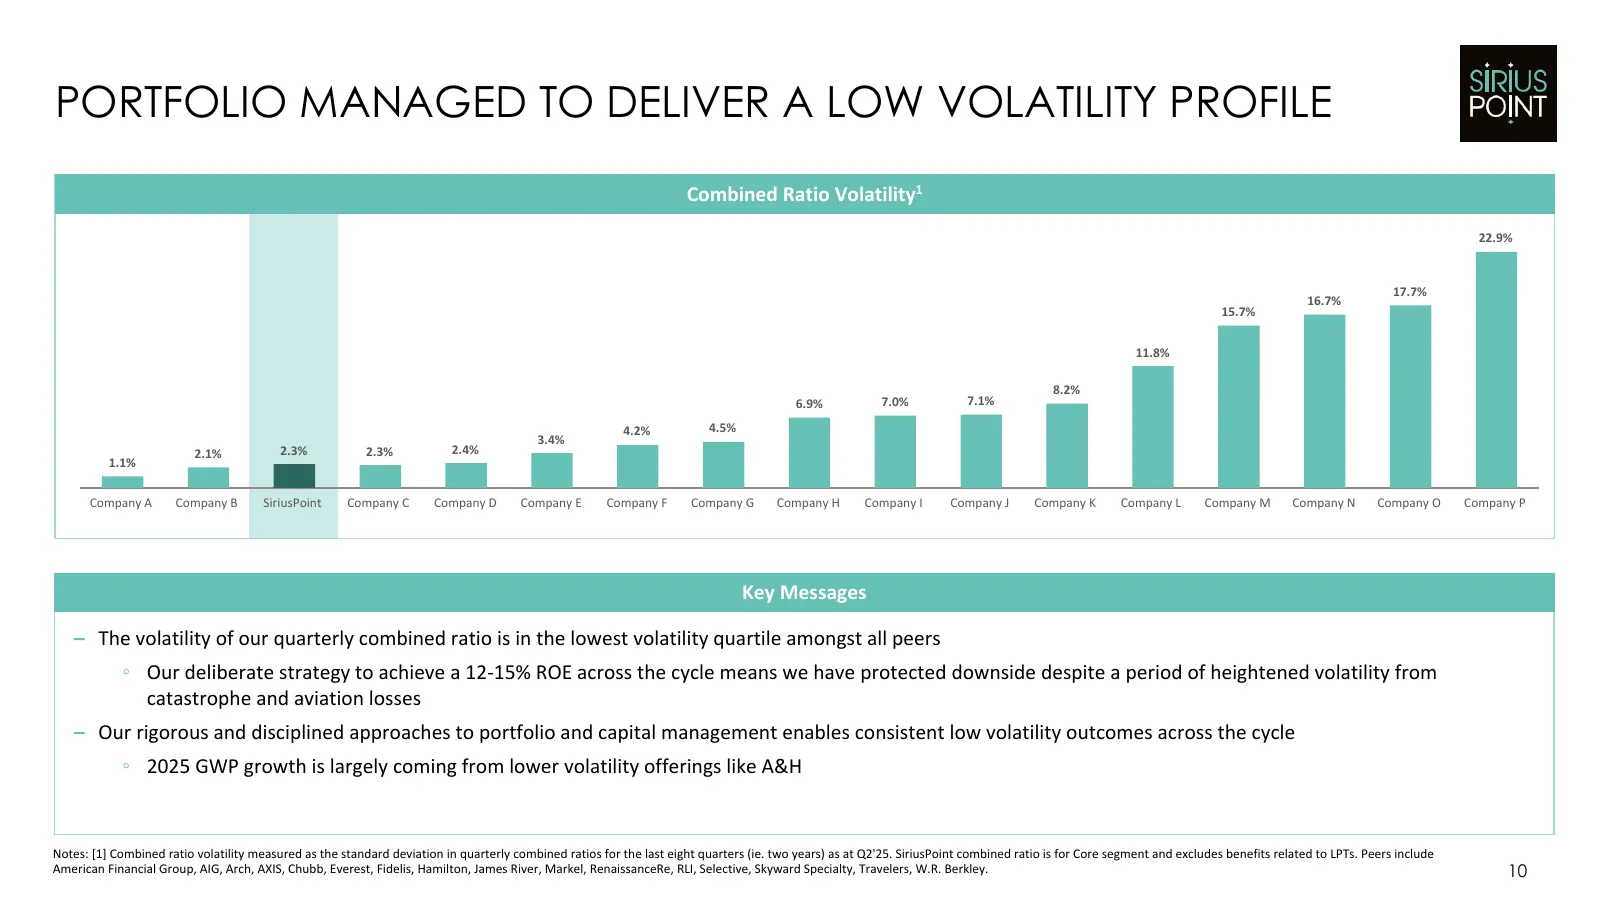
PORTFOLIO MANAGED TO DELIVER A LOW VOLATILITY PROFILE Combined Ratio Volatility1 22.9% 17.7% 16.7% 15.7% 11.8% 8.2% 6.9% 7.0% 7.1% 4.2% 4.5% 3.4% 2.1% 2.3% 2.3% 2.4% 1.1% Company A Company B SiriusPoint Company C Company D Company E Company F Company G Company H Company I Company J Company K Company
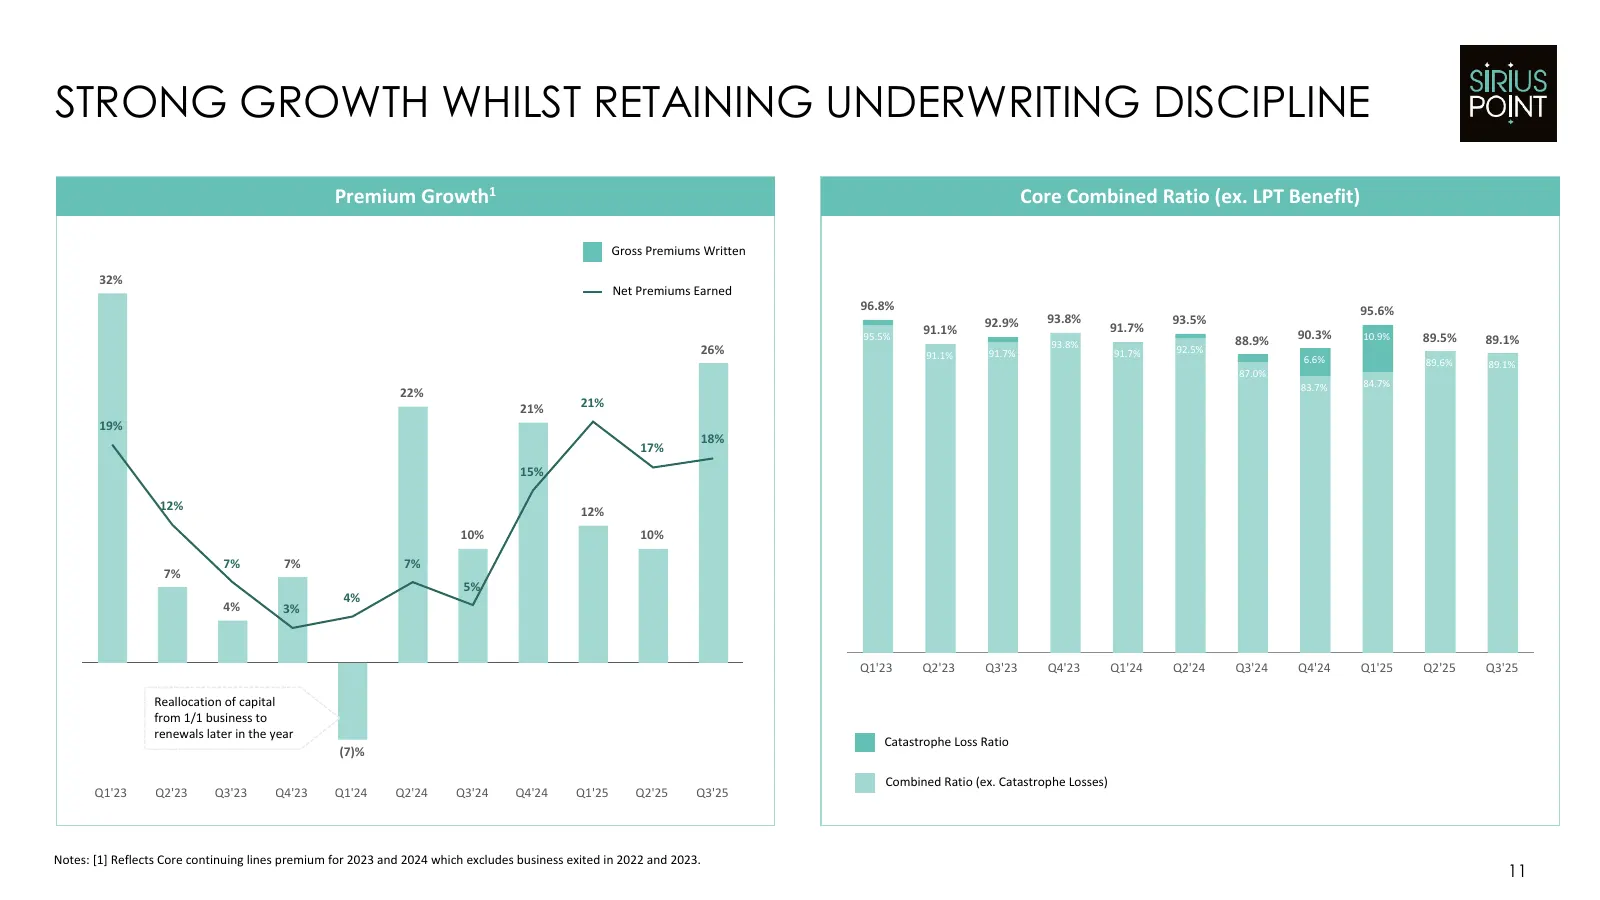
Slide 11: Strong Growth Whilst Retaining Underwriting Discipline
STRONG GROWTH WHILST RETAINING UNDERWRITING DISCIPLINE Premium Growth1 Core Combined Ratio (ex. LPT Benefit) Gross Premiums Written 32% Net Premiums Earned 96.8% 95.6% 92.9% 93.8% 93.5% 91.1% 91.7% 90.3% 95.5% 93.8% 88.9% 10.9% 89.5% 89.1% 26% 91.1% 91.7% 91.7% 92.5% 6.6% 89.6% 89.1% 87.0% 83.7% 84.
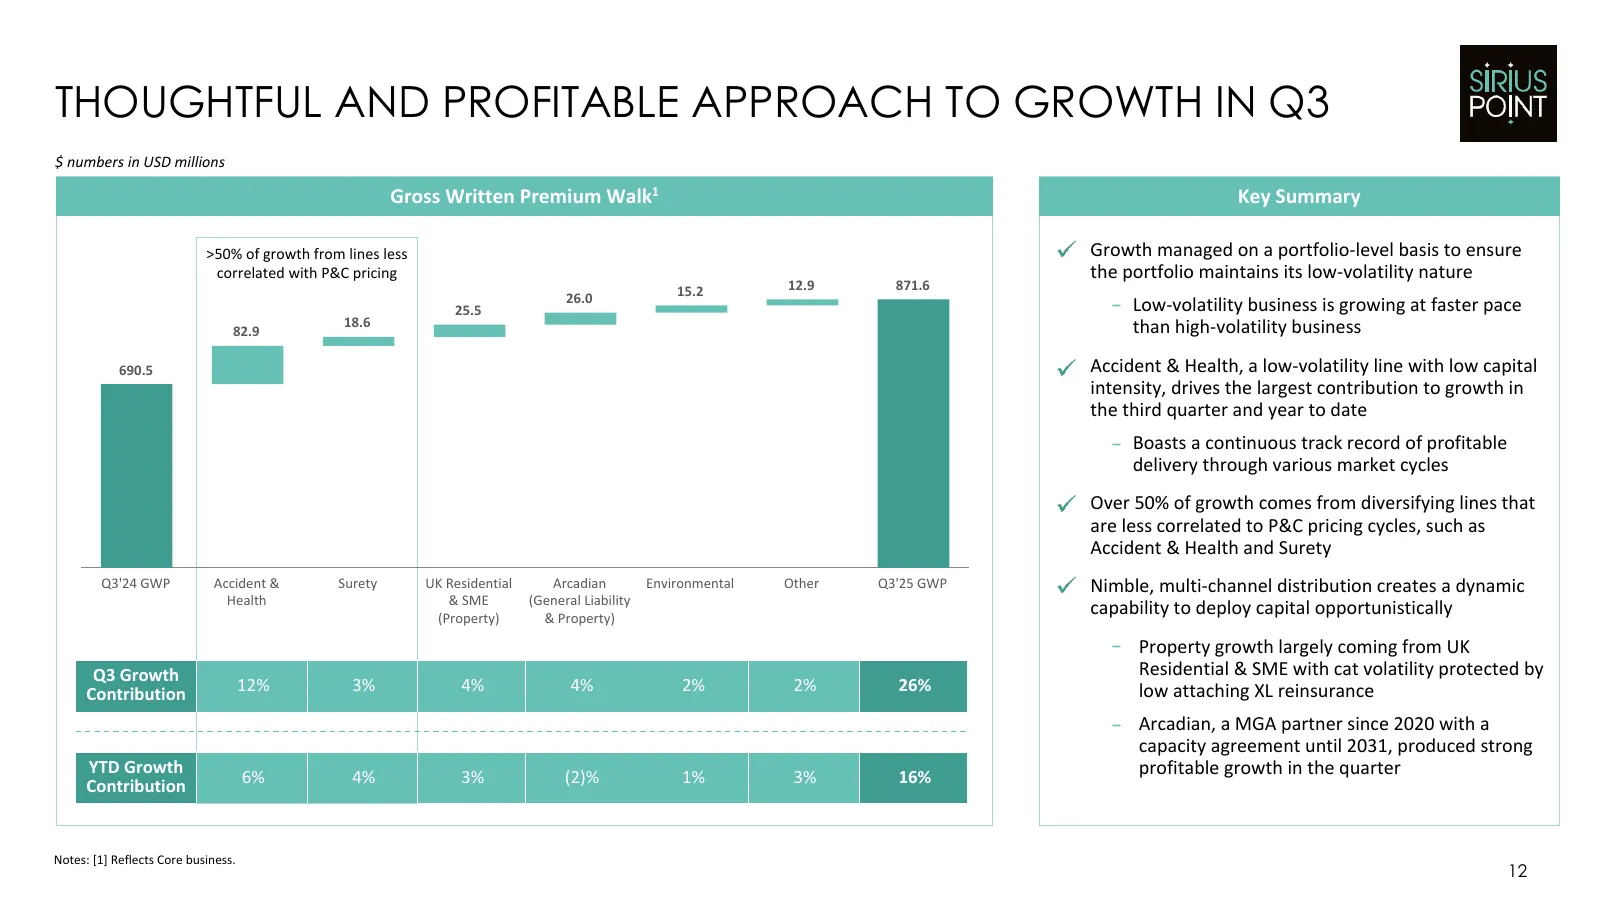
Slide 12: Thoughtful and Profitable Approach to Growth in Q3
THOUGHTFUL AND PROFITABLE APPROACH TO GROWTH IN Q3 $ numbers in USD millions Gross Written Premium Walk1 Key Summary >50% of growth from lines less Growth managed on a portfolio-level basis to ensure correlated with P&C pricing the portfolio maintains its low-volatility nature 15.2 12.9 871.6 26.0 2
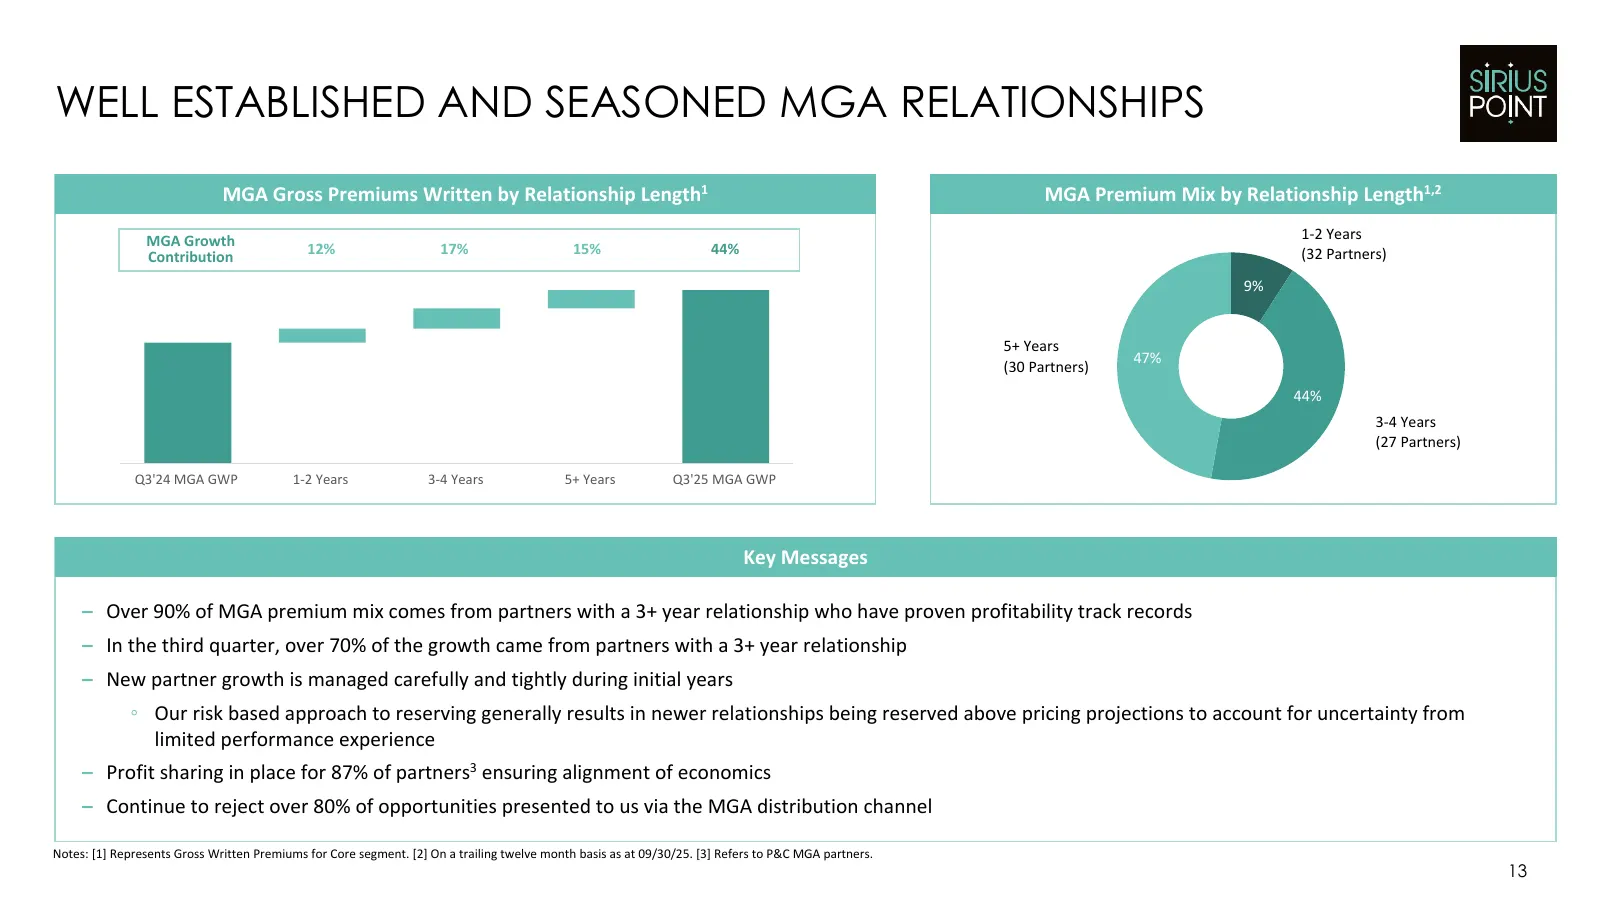
Slide 13: Well Established and Seasoned MGA Relationships
WELL ESTABLISHED AND SEASONED MGA RELATIONSHIPS MGA Gross Premiums Written by Relationship Length1 MGA Premium Mix by Relationship Length1,2 MGA Growth 1-2 Years 12% 17% 15% 44% (32 Partners) Contribution 9% 5+ Years 47% (30 Partners) 44% 3-4 Years (27 Partners) Q3'24 MGA GWP 1-2 Years 3-4 Years 5+
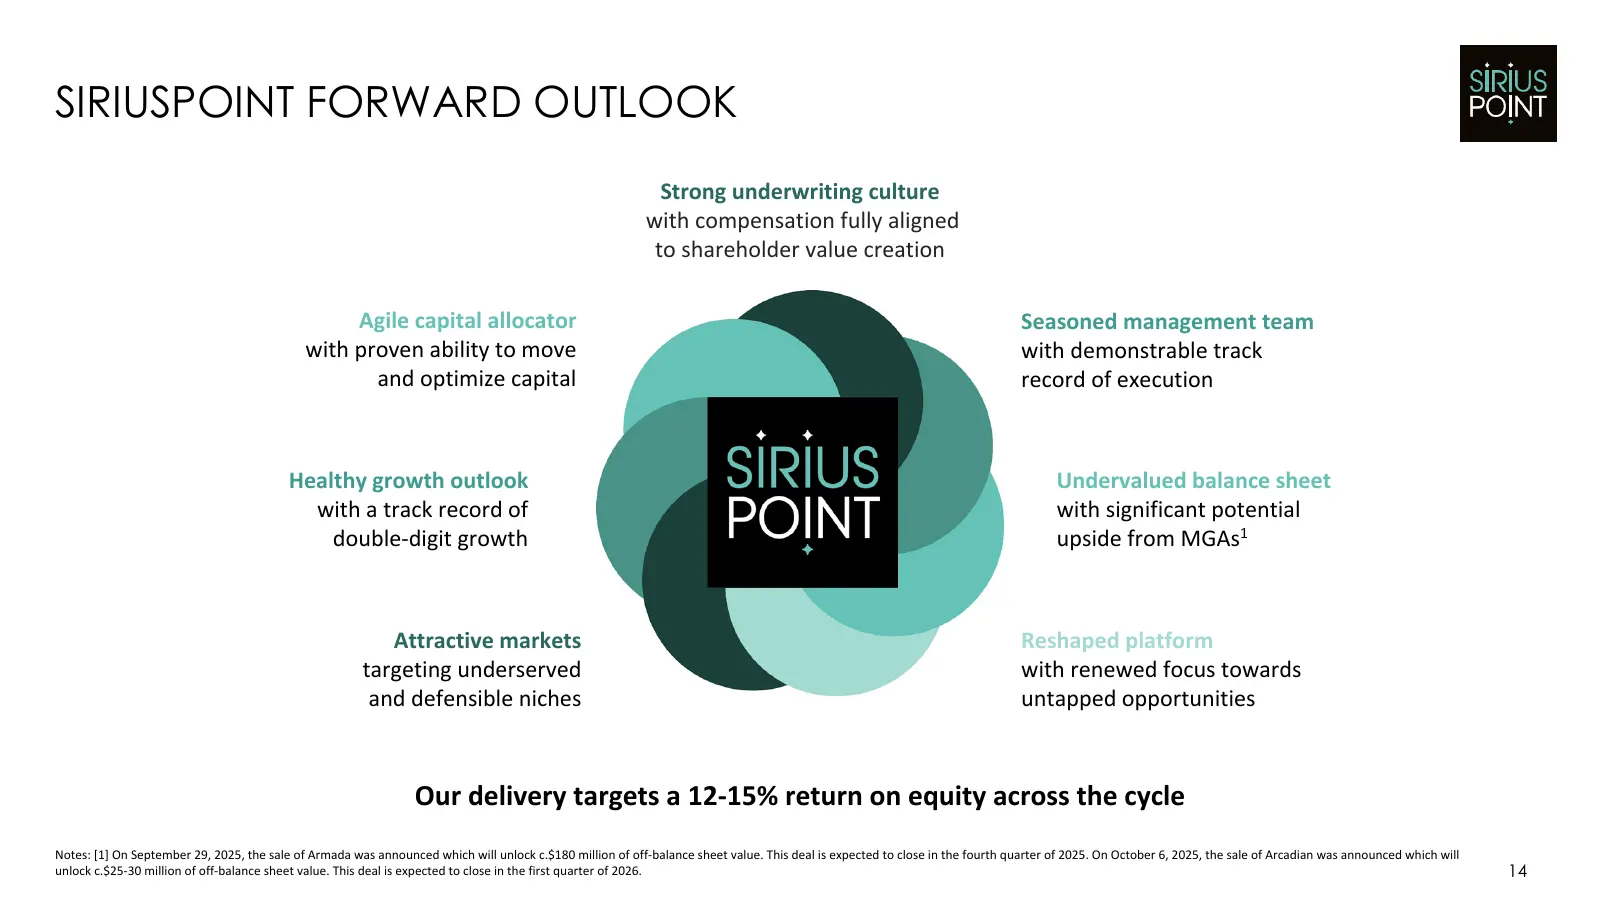
Slide 14: SiriusPoint Forward Outlook
SIRIUSPOINT FORWARD OUTLOOK Strong underwriting culture with compensation fully aligned to shareholder value creation Agile capital allocator Seasoned management team with proven ability to move with demonstrable track and optimize capital record of execution Healthy growth outlook Undervalued balan

Slide 15: Third Quarter and Nine Months Results Update
Third Quarter and Nine Months Results Update
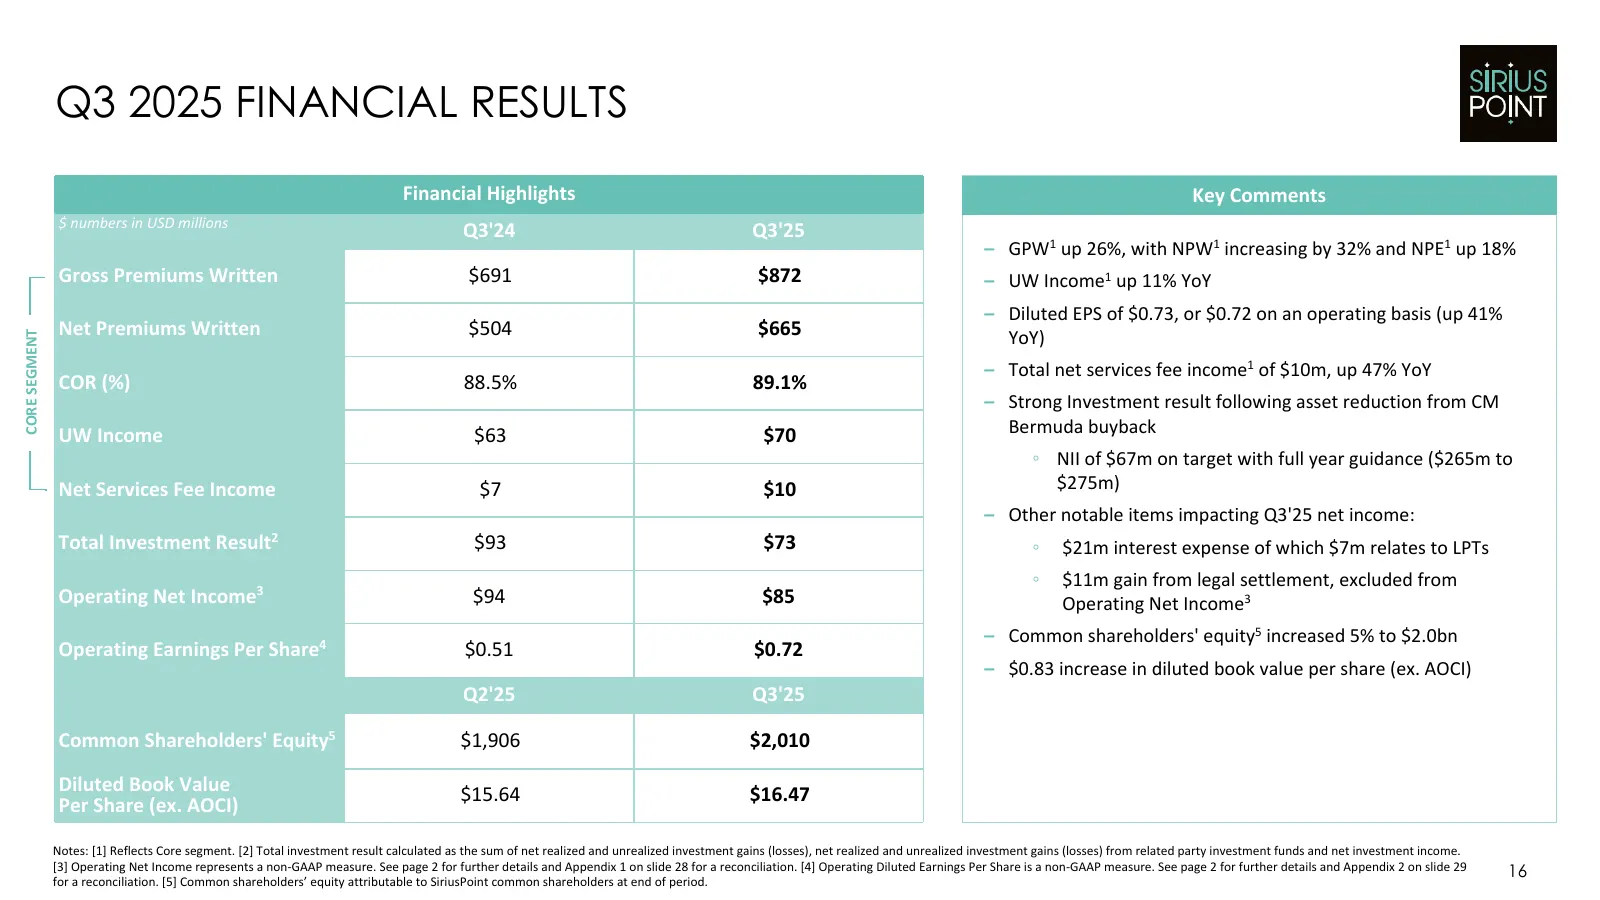
Slide 16: Core Segment: Q3 2025 Financial Results
Q3 2025 FINANCIAL RESULTS Financial Highlights Key Comments $ numbers in USD millions Q3'24 Q3'25 – GPW1 up 26%, with NPW1 increasing by 32% and NPE1 up 18% Gross Premiums Written $691 $872 – UW Income1 up 11% YoY – Diluted EPS of $0.73, or $0.72 on an operating basis (up 41% Net Premiums Written $5
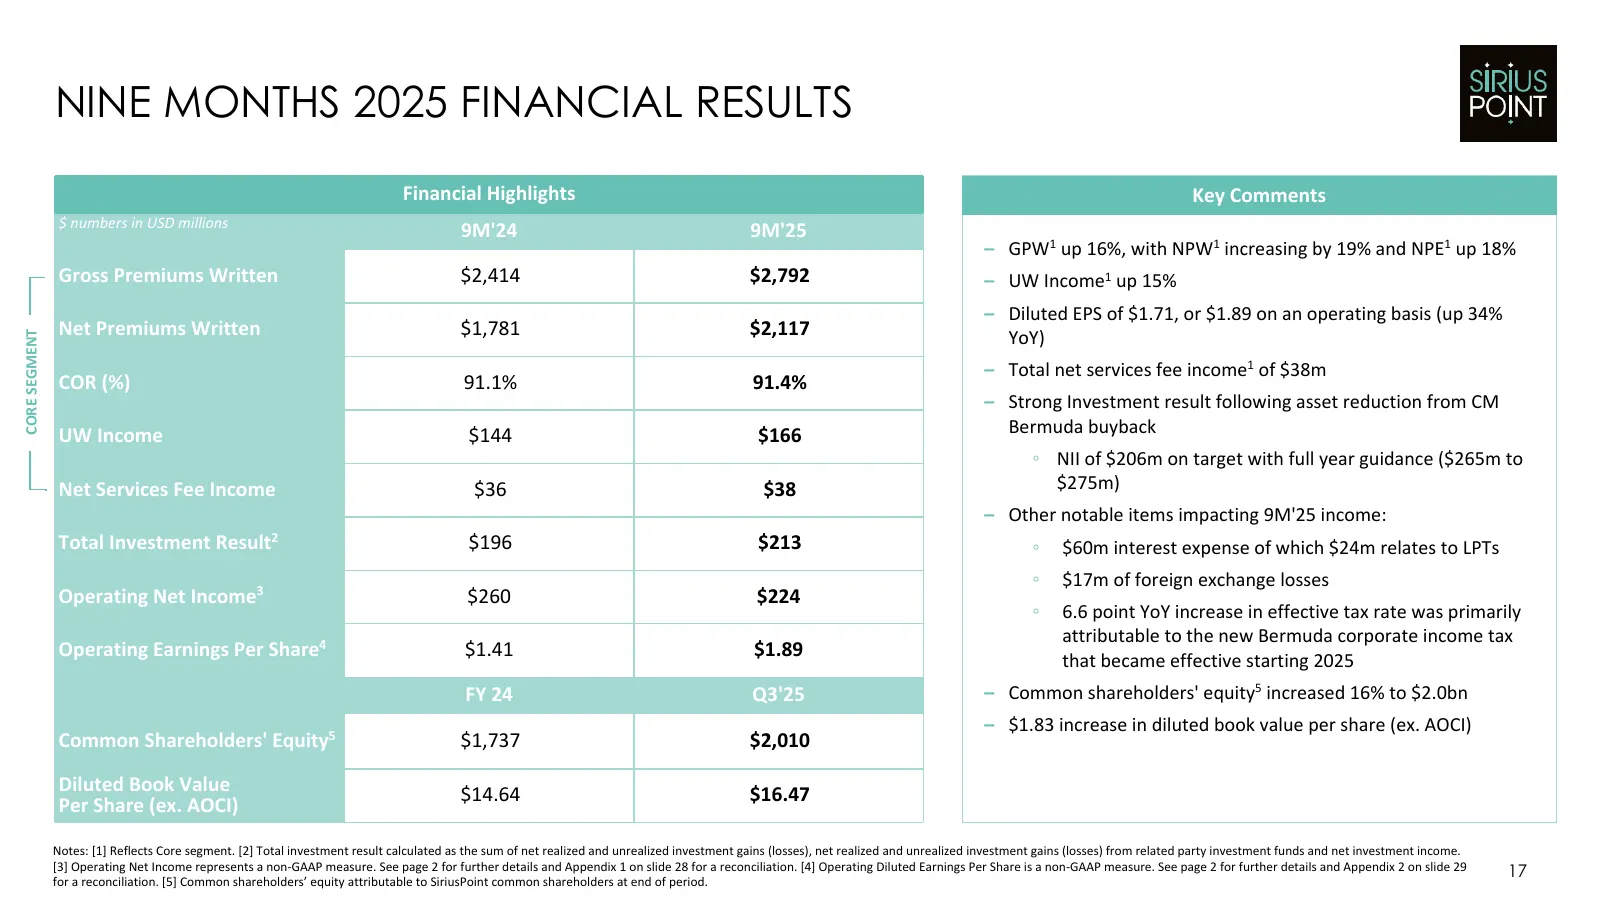
Slide 17: Core Segment: Nine Months 2025 Financial Results
NINE MONTHS 2025 FINANCIAL RESULTS Financial Highlights Key Comments $ numbers in USD millions 9M'24 9M'25 – GPW1 up 16%, with NPW1 increasing by 19% and NPE1 up 18% Gross Premiums Written $2,414 $2,792 – UW Income1 up 15% – Diluted EPS of $1.71, or $1.89 on an operating basis (up 34% Net Premiums W
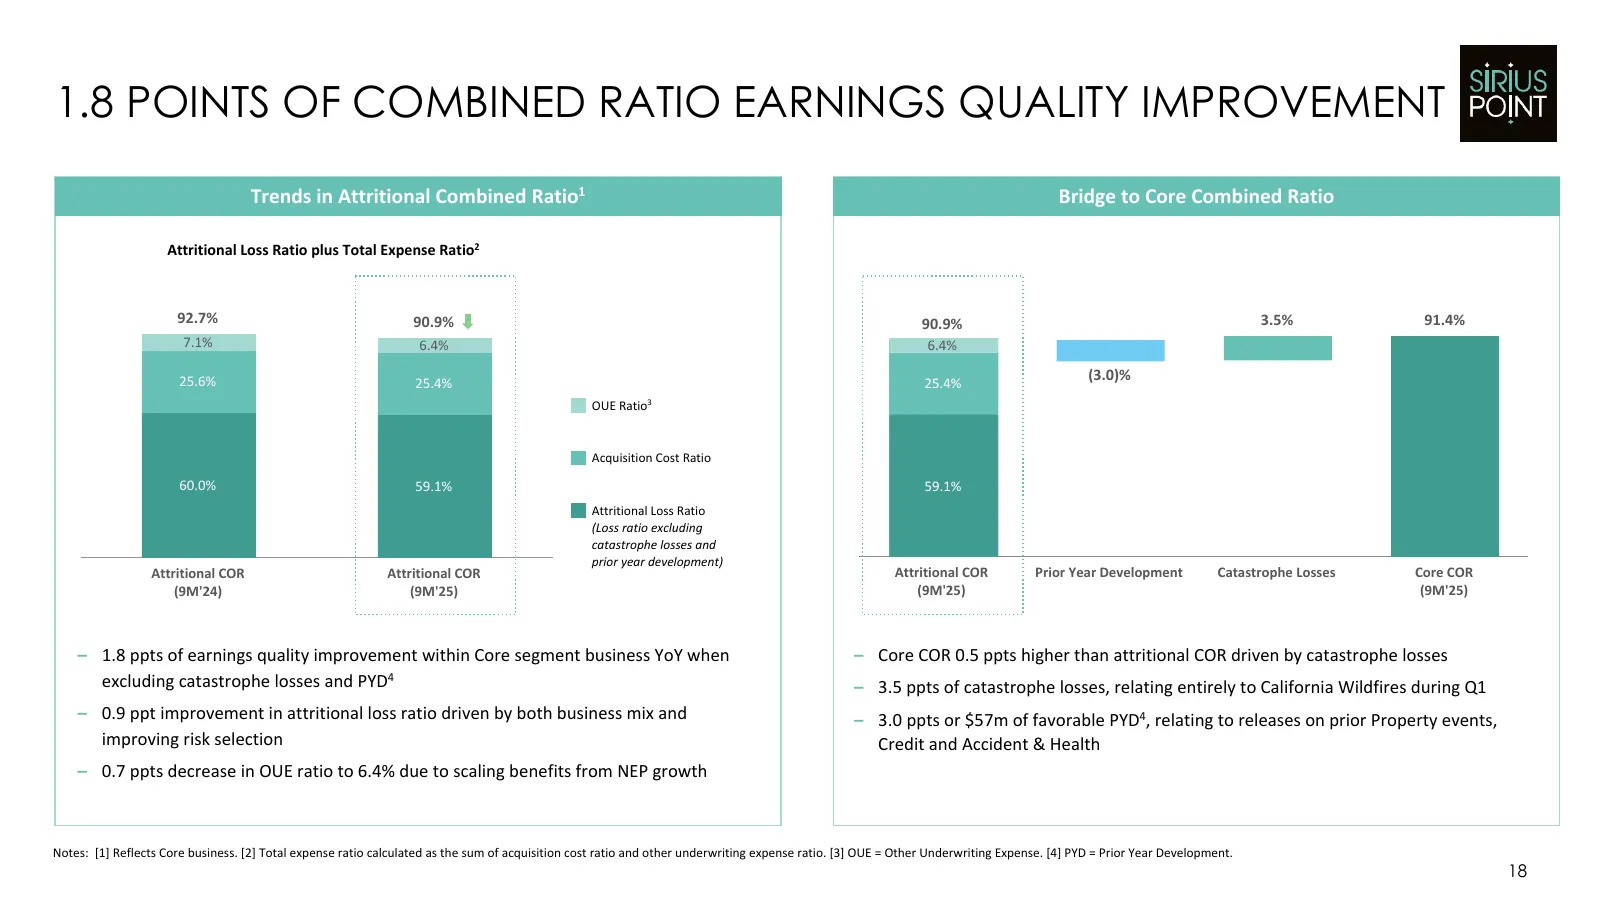
Slide 18: 1.8 Points of Combined Ratio Earnings Quality Improvement
1.8 POINTS OF COMBINED RATIO EARNINGS QUALITY IMPROVEMENT Trends in Attritional Combined Ratio1 Bridge to Core Combined Ratio Attritional Loss Ratio plus Total Expense Ratio2 92.7% 90.9% 90.9% 3.5% 91.4% 7.1% 6.4% 6.4% 25.6% 25.4% (3.0)% 25.4% OUE Ratio3 Acquisition Cost Ratio 60.0% 59.1% 59.1% Attr
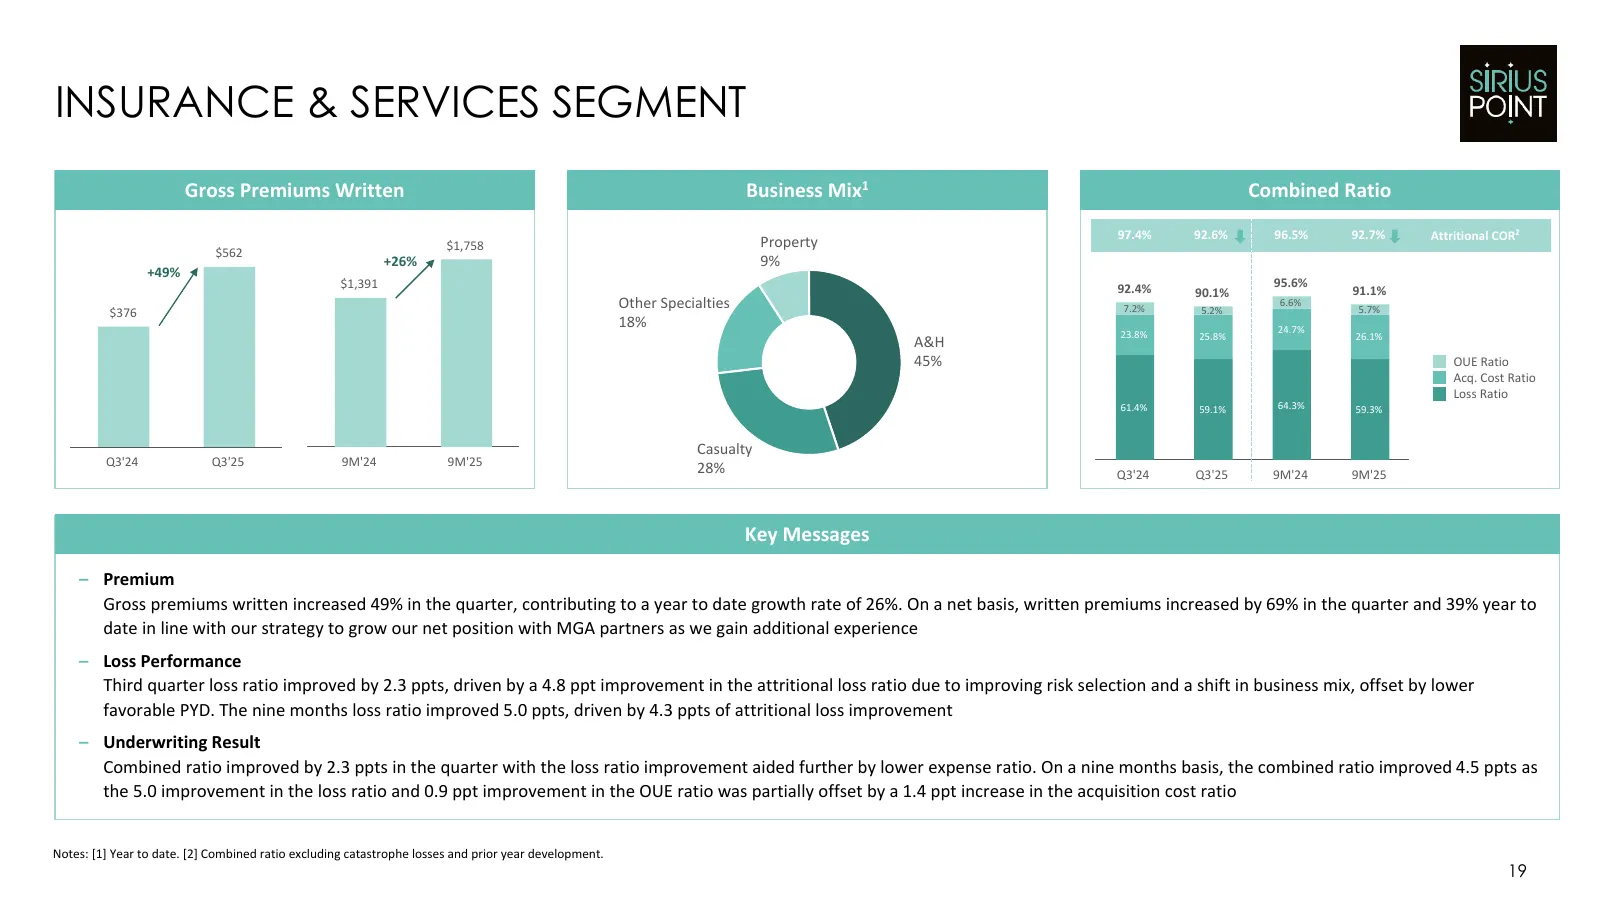
Slide 19: Insurance & Services Segment
INSURANCE & SERVICES SEGMENT Gross Premiums Written Business Mix1 Combined Ratio 97.4% 92.6% 96.5% 92.7% Attritional COR2 $1,758 Property $562 +26% 9% +49% $1,391 92.4% 95.6% 90.1% 91.1% Other Specialties 7.2% 5.2% 6.6% 5.7% $376 18% 24.7% 23.8% 25.8% 26.1% A&H 45% OUE Ratio Acq. Cost Ratio Loss Rat
Slide 20: Reinsurance Segment
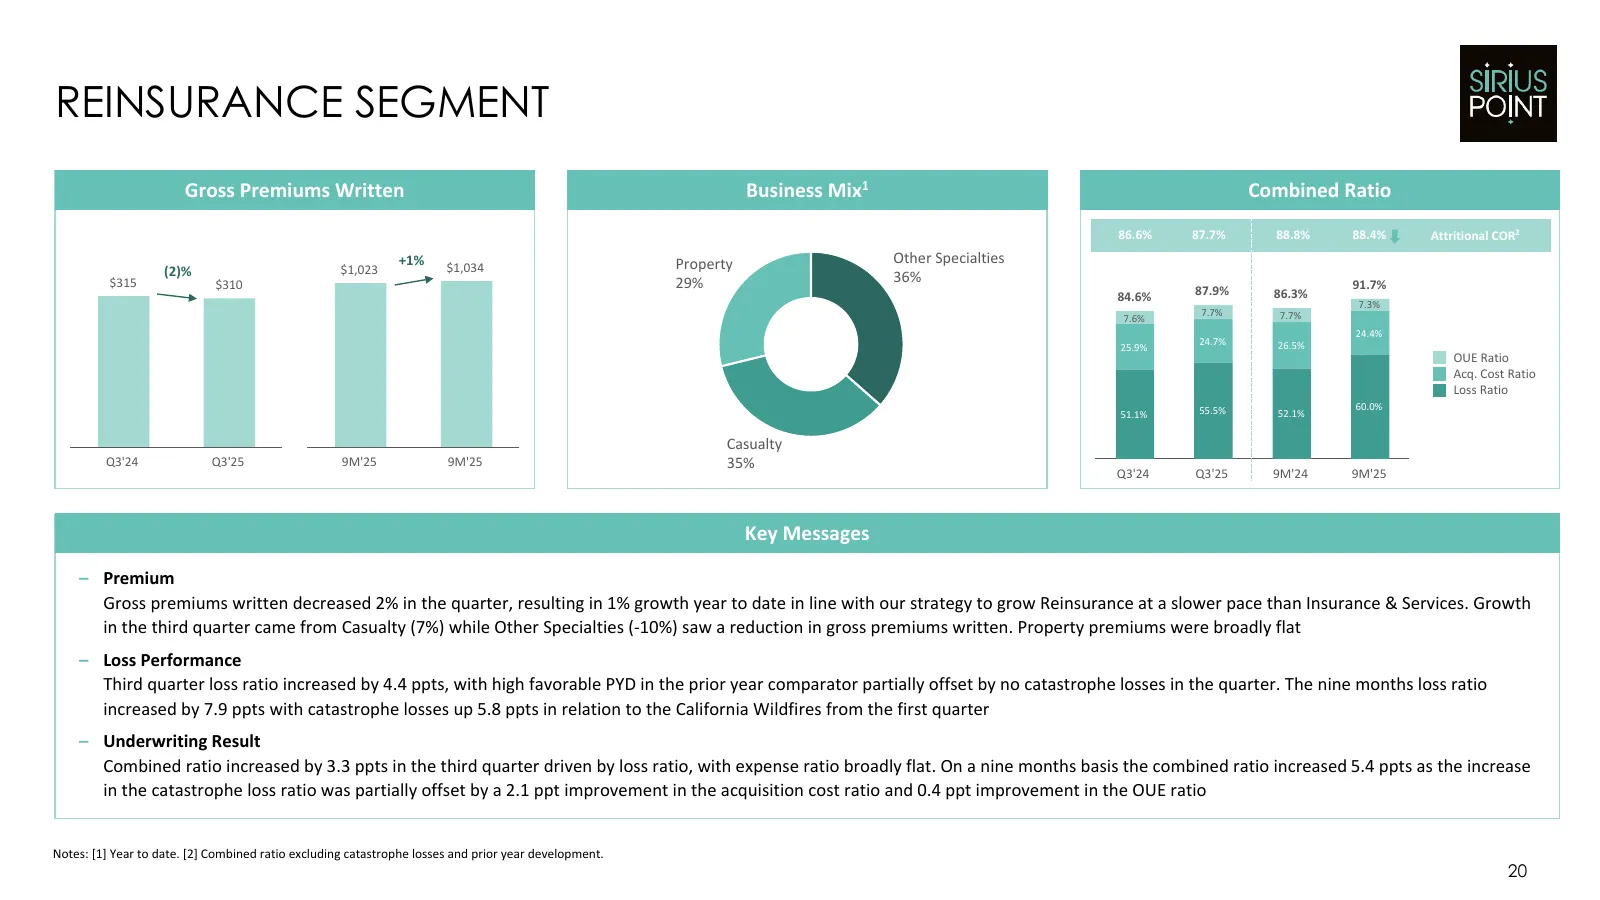
REINSURANCE SEGMENT Gross Premiums Written Business Mix1 Combined Ratio 86.6% 87.7% 88.8% 88.4% Attritional COR2 +1% Property Other Specialties (2)% $1,023 $1,034 $315 $310 29% 36% 91.7% 84.6% 87.9% 86.3% 7.3% 7.7% 7.7% 7.6% 24.4% 24.7% 26.5% 25.9% OUE Ratio Acq. Cost Ratio Loss Ratio 55.5% 60.0% 51
Slide 21: Reduction of Catastrophe Loss Volatility
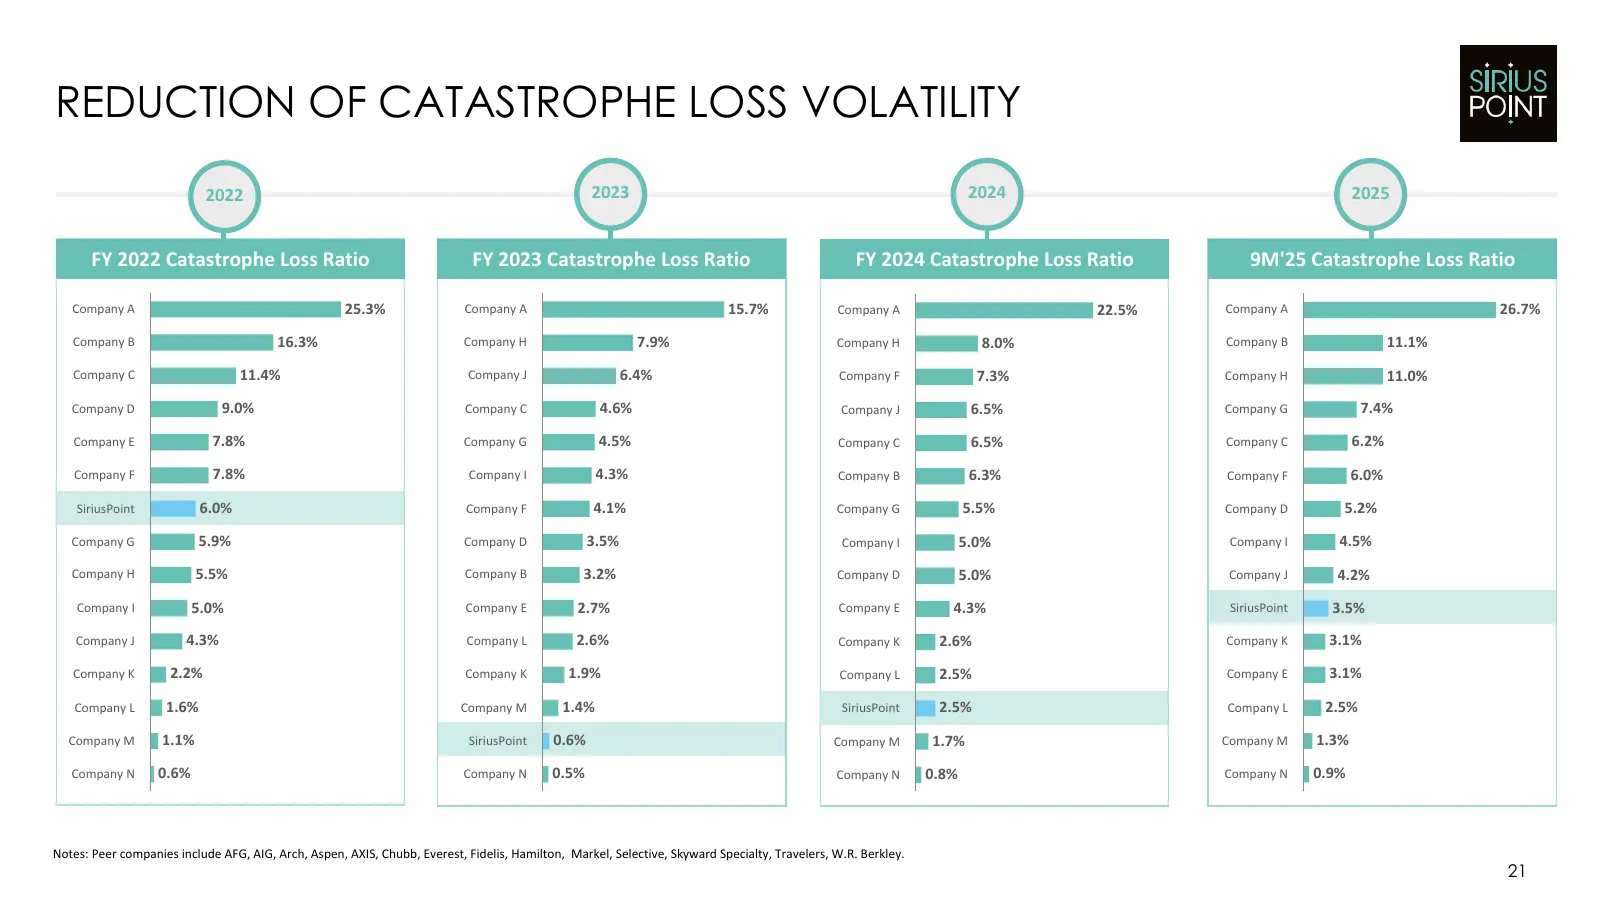
REDUCTION OF CATASTROPHE LOSS VOLATILITY 2022 2023 2024 2025 FY 2022 Catastrophe Loss Ratio FY 2023 Catastrophe Loss Ratio FY 2024 Catastrophe Loss Ratio HY 9M'25 2025Catastrophe CatastropheLoss LossRatio Ratio Company A 25.3% Company A 15.7% Company A 22.5% Company A 26.7% Company B 16.3% Company H
Slide 22: Reserving Prudence Demonstrated by PYD Track Record
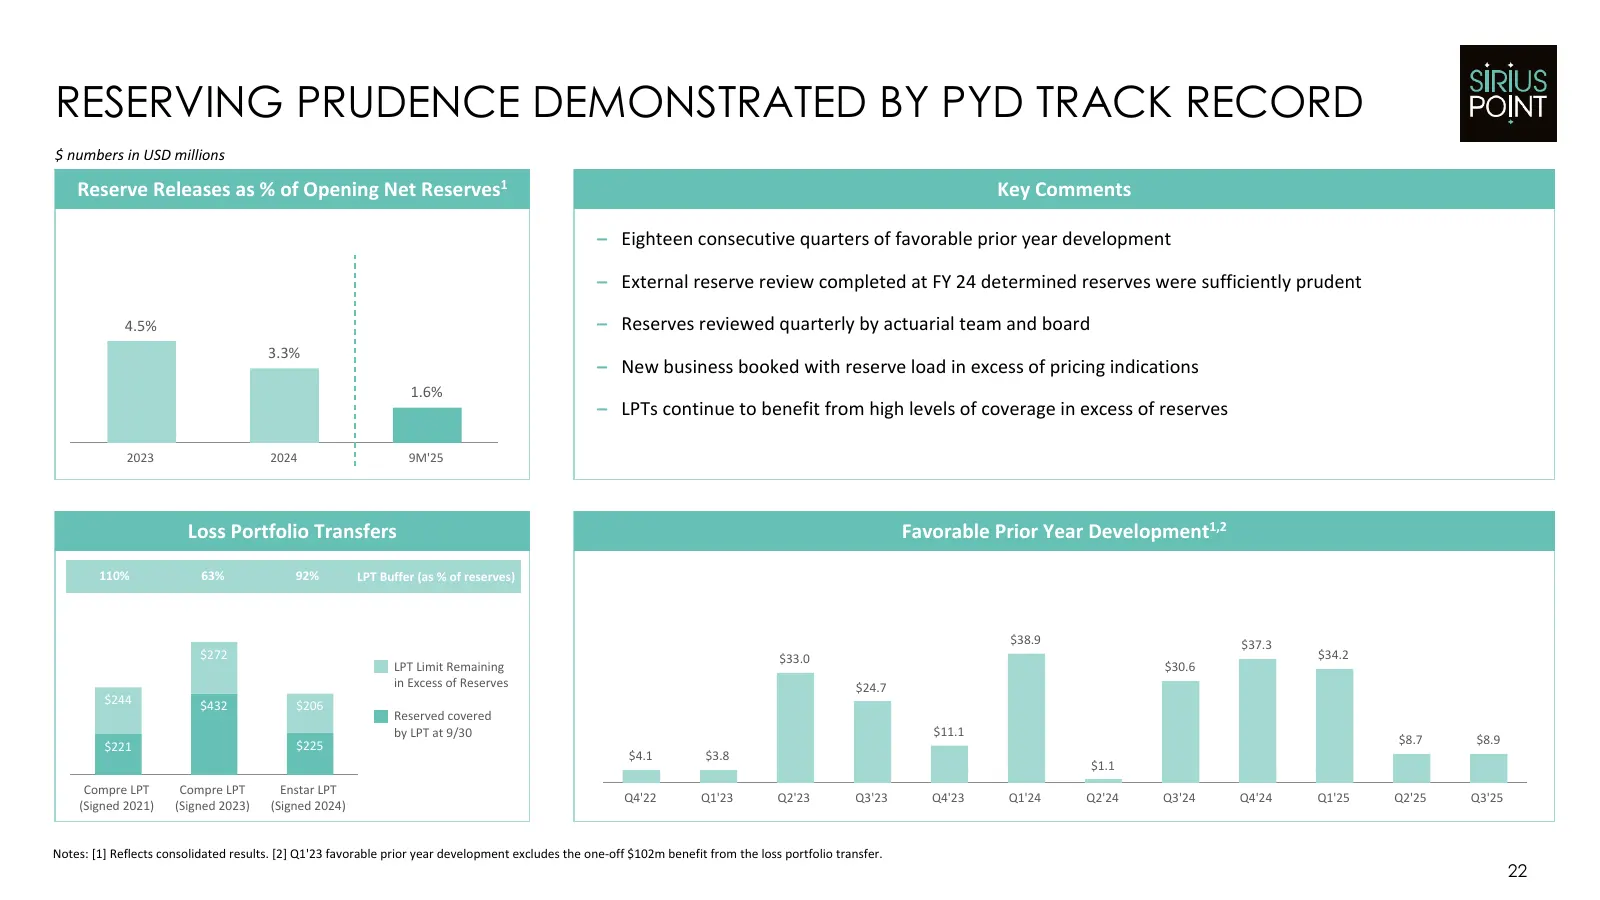
RESERVING PRUDENCE DEMONSTRATED BY PYD TRACK RECORD $ numbers in USD millions Reserve Releases as % of Opening Net Reserves1 Key Comments – Eighteen consecutive quarters of favorable prior year development – External reserve review completed at FY 24 determined reserves were sufficiently prudent 4.5
Slide 23: High Quality Investment Portfolio
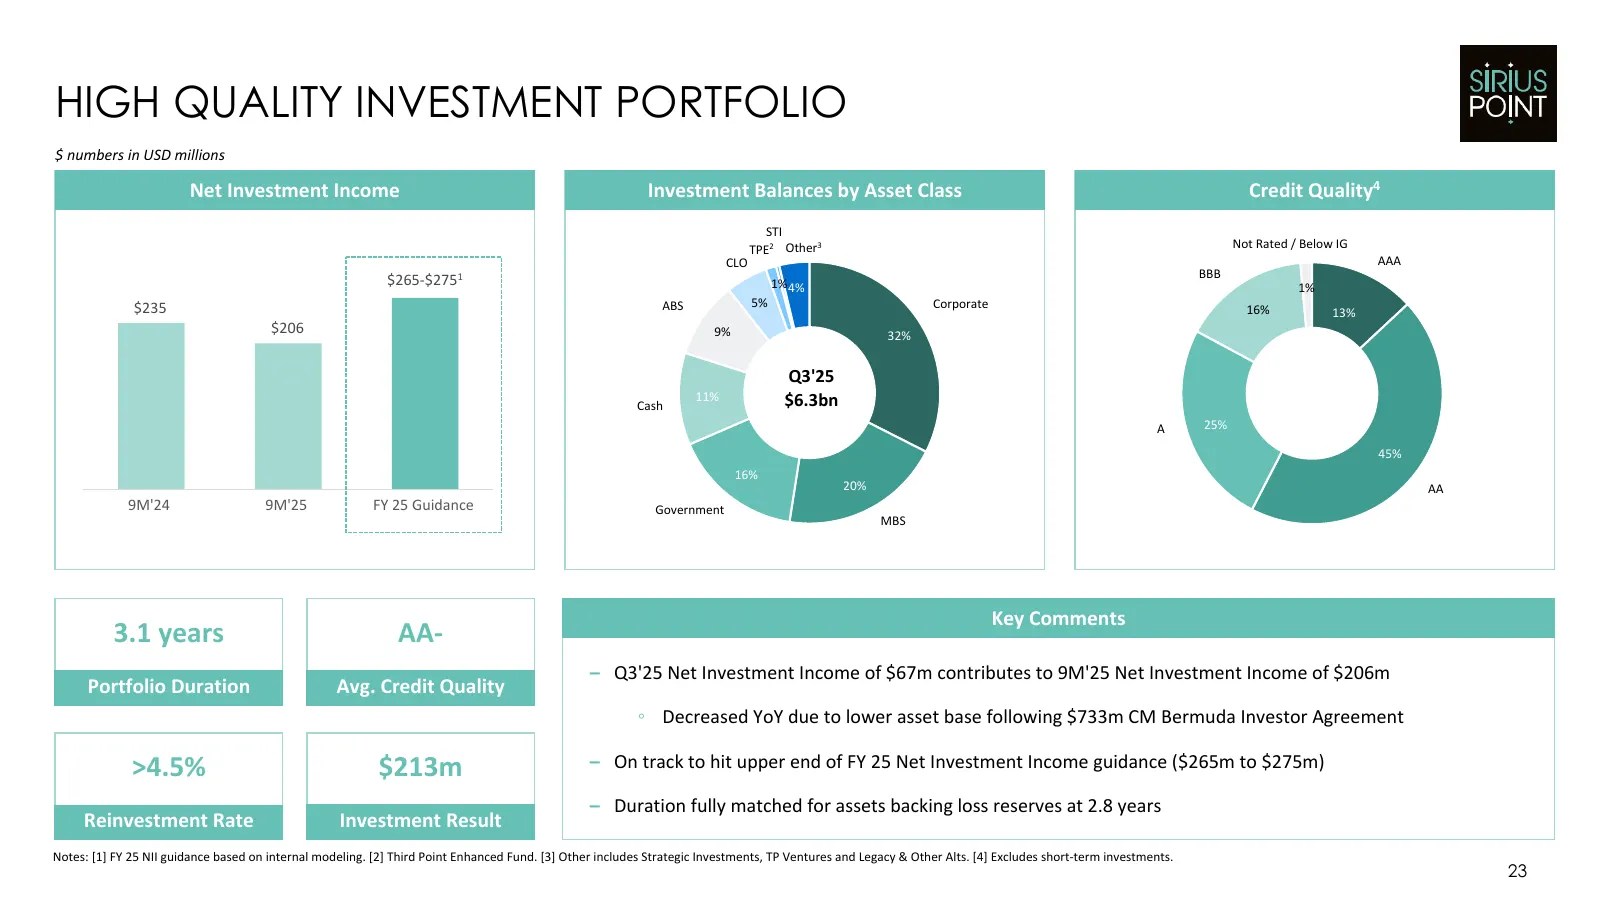
HIGH QUALITY INVESTMENT PORTFOLIO $ numbers in USD millions Net Investment Income Investment Balances by Asset Class Credit Quality4 STI TPE2 Other3 Not Rated / Below IG CLO AAA BBB $265-$275 1 1% 4% 1% $235 ABS 5% Corporate 16% 13% $206 9% 32% Q3'25 Cash 11% $6.3bn A 25% 45% 16% 20% AA 9M'24 9M'25
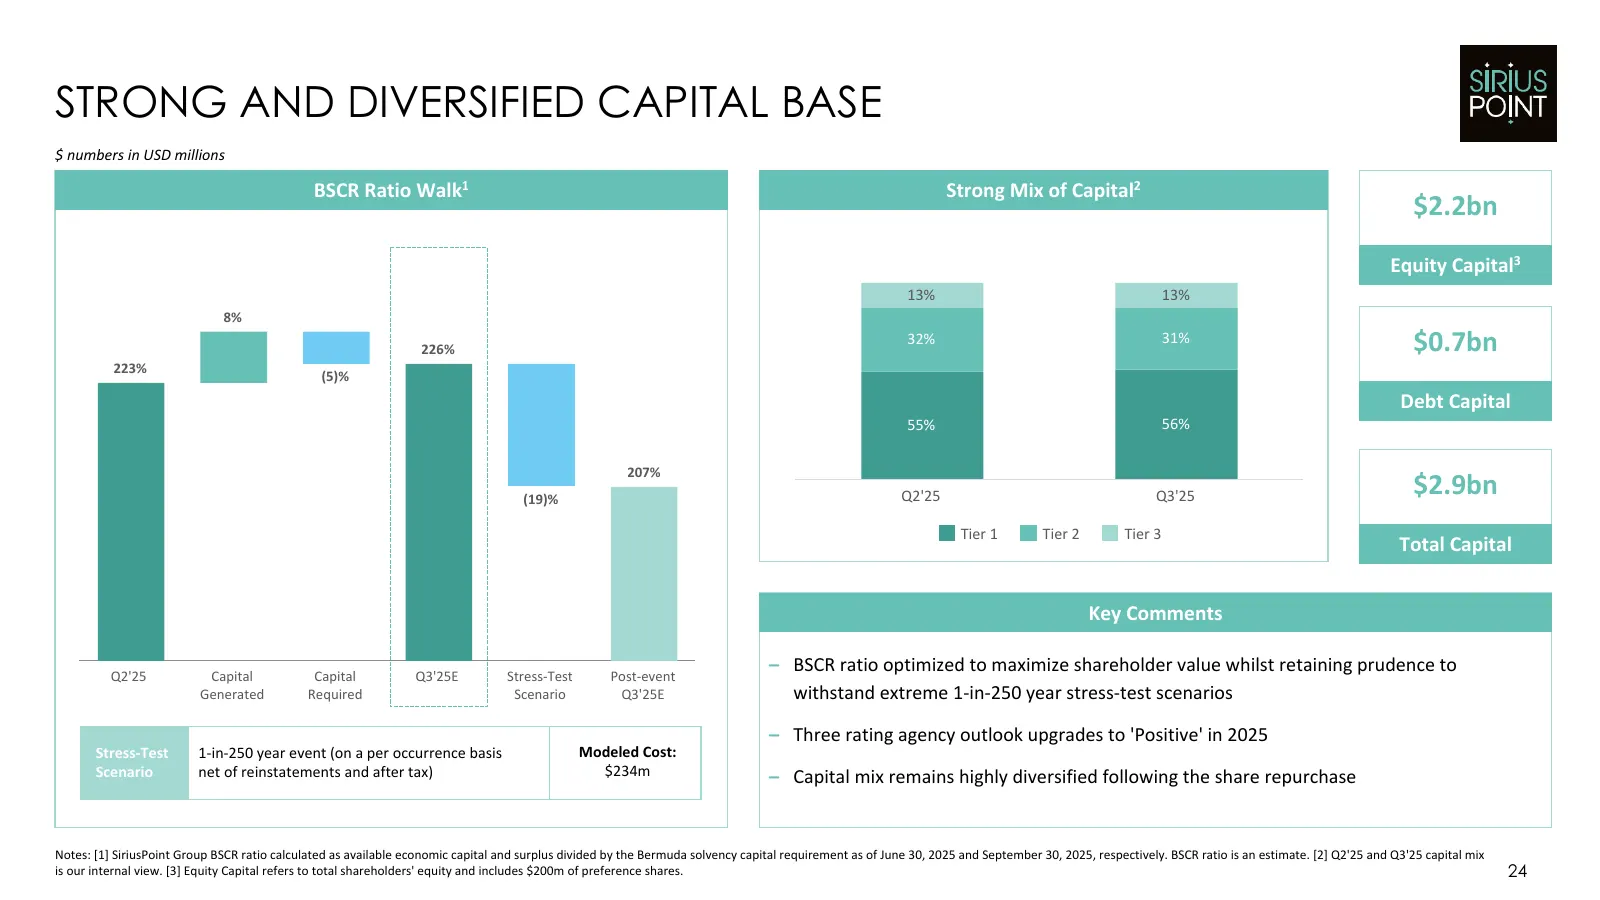
Slide 24: Strong and Diversified Capital Base
STRONG AND DIVERSIFIED CAPITAL BASE $ numbers in USD millions BSCR Ratio Walk1 Strong Mix of Capital2 $2.2bn Equity Capital3 13% 13% 8% 226% 32% 31% $0.7bn 223% (5)% Debt Capital 55% 56% 207% (19)% Q2'25 Q3'25 $2.9bn Tier 1 Tier 2 Tier 3 Total Capital Key Comments Q2'25 Capital Capital Q3'25E Stress
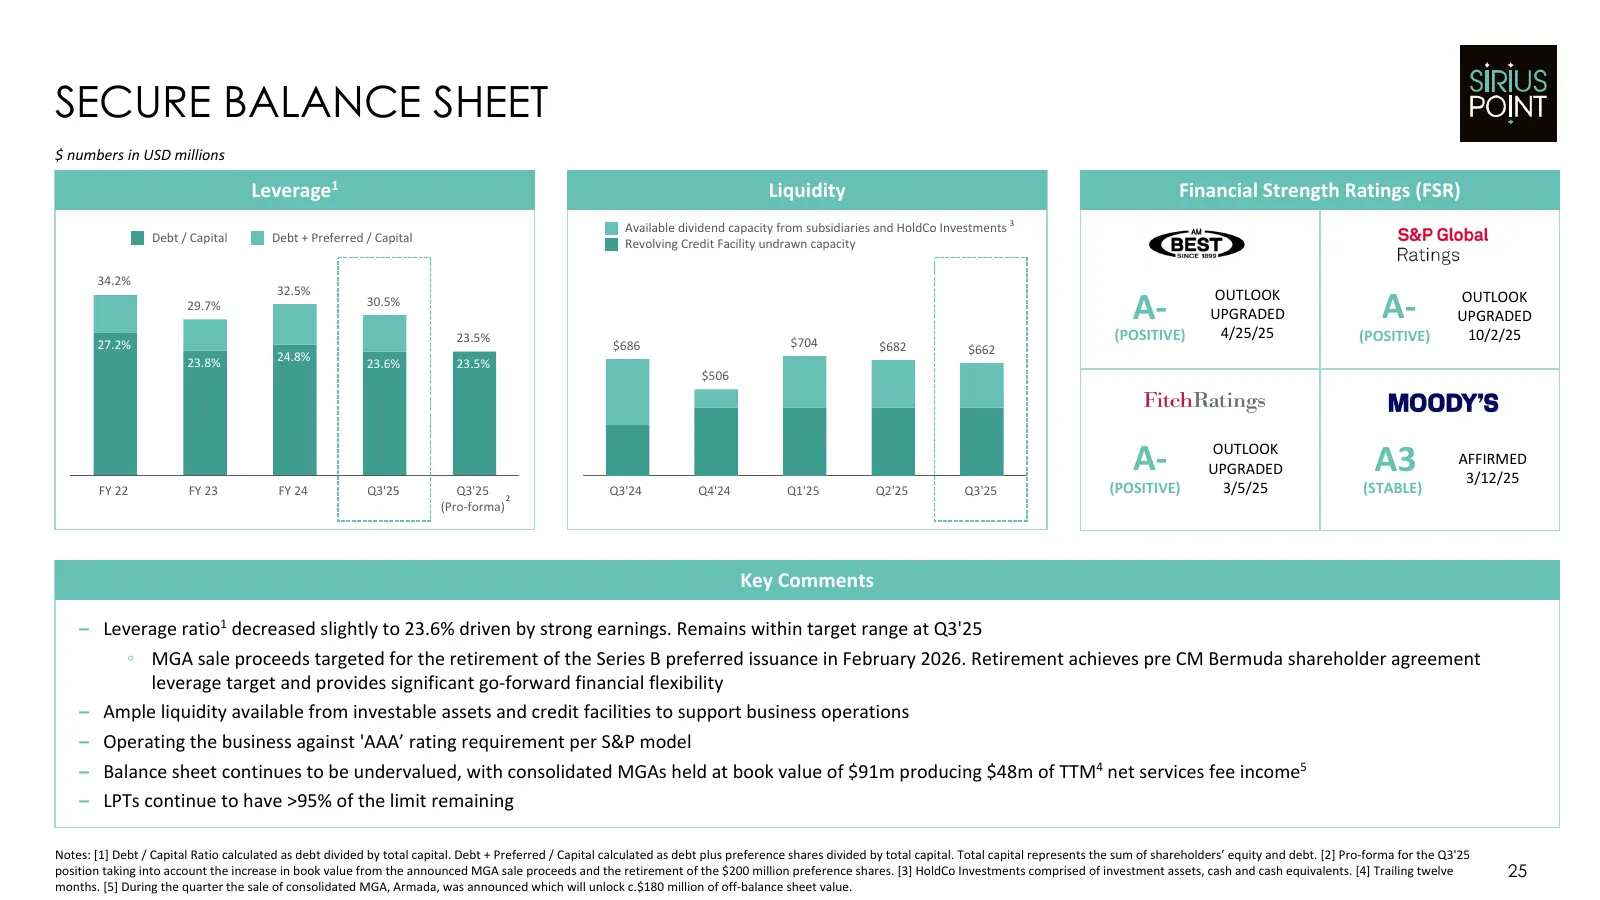
Slide 25: Secure Balance Sheet
SECURE BALANCE SHEET $ numbers in USD millions Leverage1 Liquidity Financial Strength Ratings (FSR) Available dividend capacity from subsidiaries and HoldCo Investments 3 Debt / Capital Debt + Preferred / Capital Revolving Credit Facility undrawn capacity 34.2% 32.5% 29.7% 30.5% A- OUTLOOK UPGRADED

Slide 26: Thank You
Thank You investors.siriuspt.com

Slide 27: Appendix
SiRiUs POINT
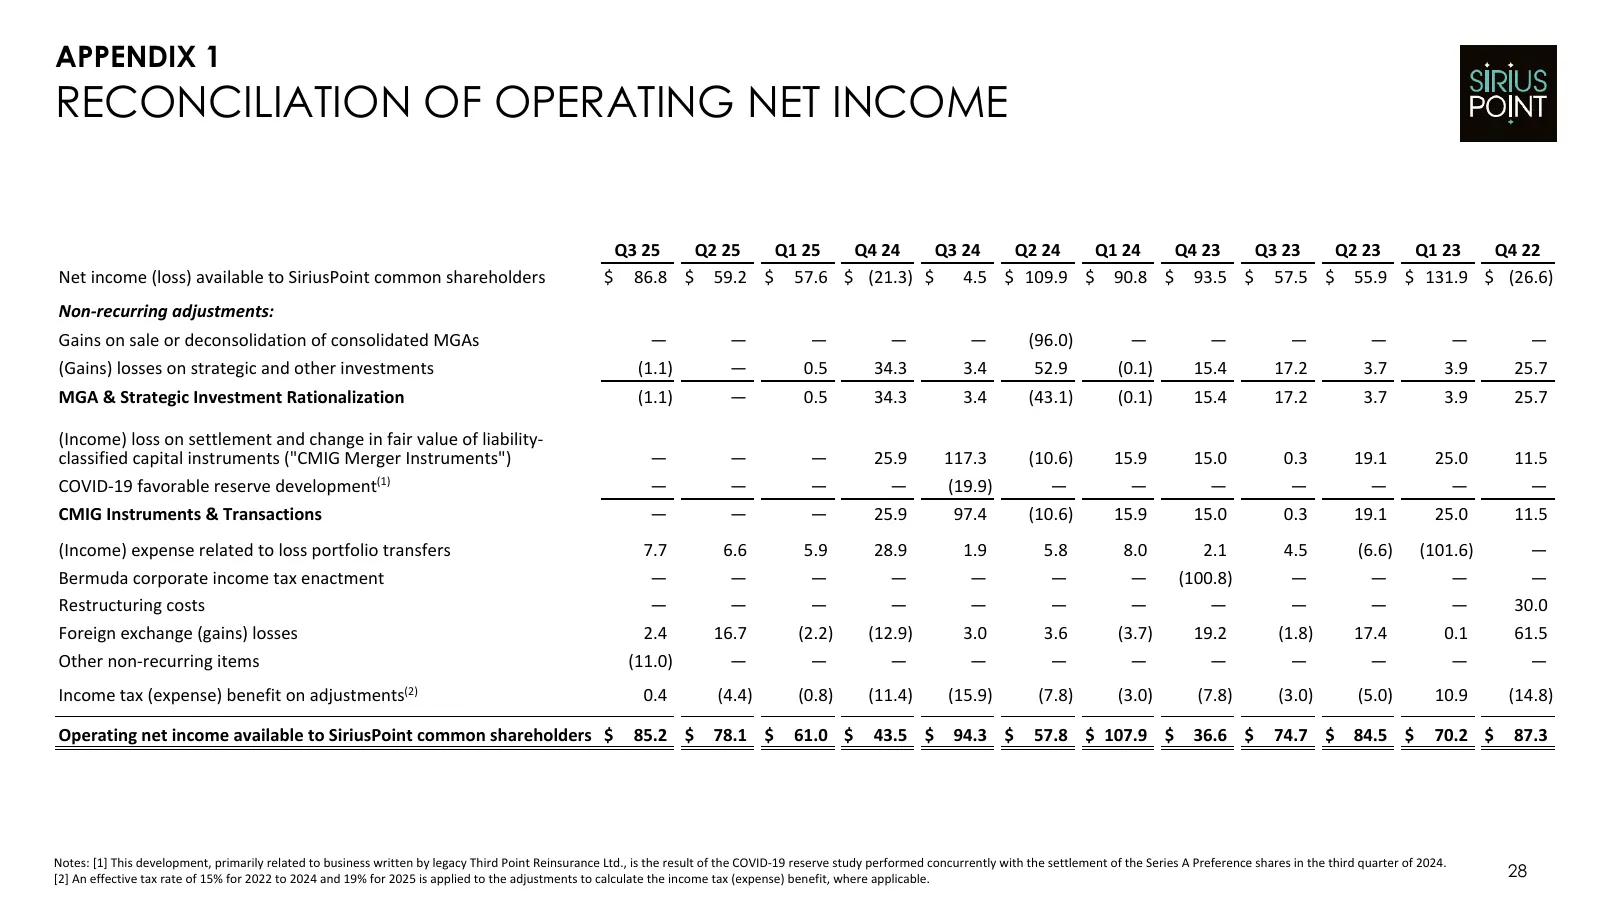
Slide 28: Reconciliation of Operating Net Income
APPENDIX 1 RECONCILIATION OF OPERATING NET INCOME Q3 25 Q2 25 Q1 25 Q4 24 Q3 24 Q2 24 Q1 24 Q4 23 Q3 23 Q2 23 Q1 23 Q4 22 Net income (loss) available to SiriusPoint common shareholders $ 86.8 $ 59.2 $ 57.6 $ (21.3) $ 4.5 $ 109.9 $ 90.8 $ 93.5 $ 57.5 $ 55.9 $ 131.9 $ (26.6) Non-recurring adjustments:
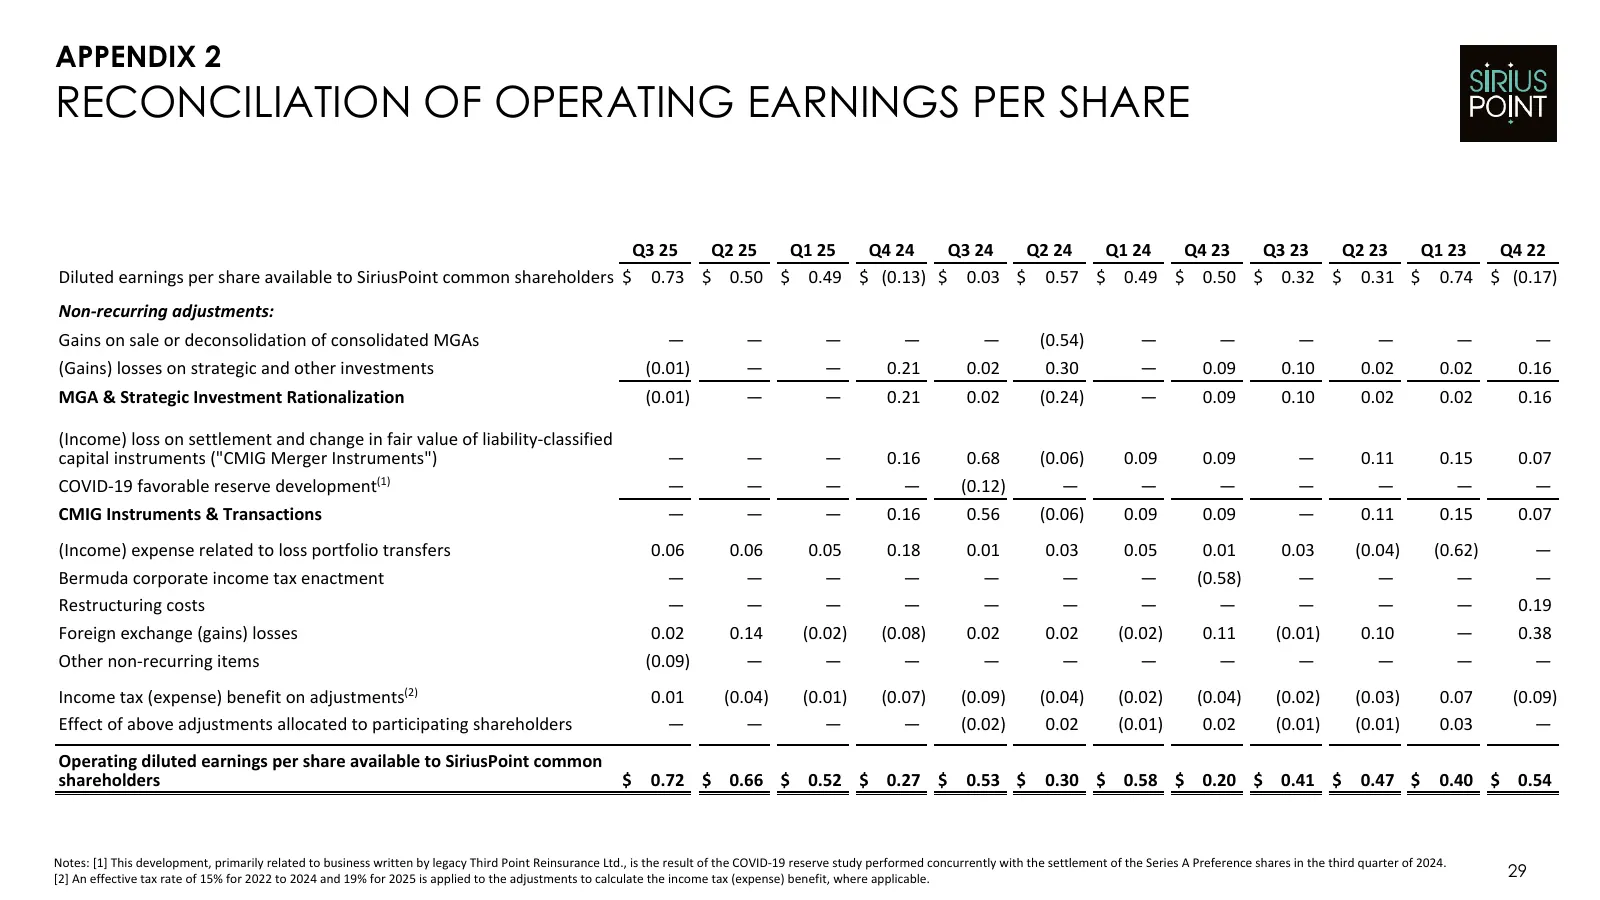
Slide 29: Reconciliation of Operating Earnings Per Share
APPENDIX 2 RECONCILIATION OF OPERATING EARNINGS PER SHARE Q3 25 Q2 25 Q1 25 Q4 24 Q3 24 Q2 24 Q1 24 Q4 23 Q3 23 Q2 23 Q1 23 Q4 22 Diluted earnings per share available to SiriusPoint common shareholders $ 0.73 $ 0.50 $ 0.49 $ (0.13) $ 0.03 $ 0.57 $ 0.49 $ 0.50 $ 0.32 $ 0.31 $ 0.74 $ (0.17) Non-recurr
Slide 30: Reconciliation of Operating Return on Equity
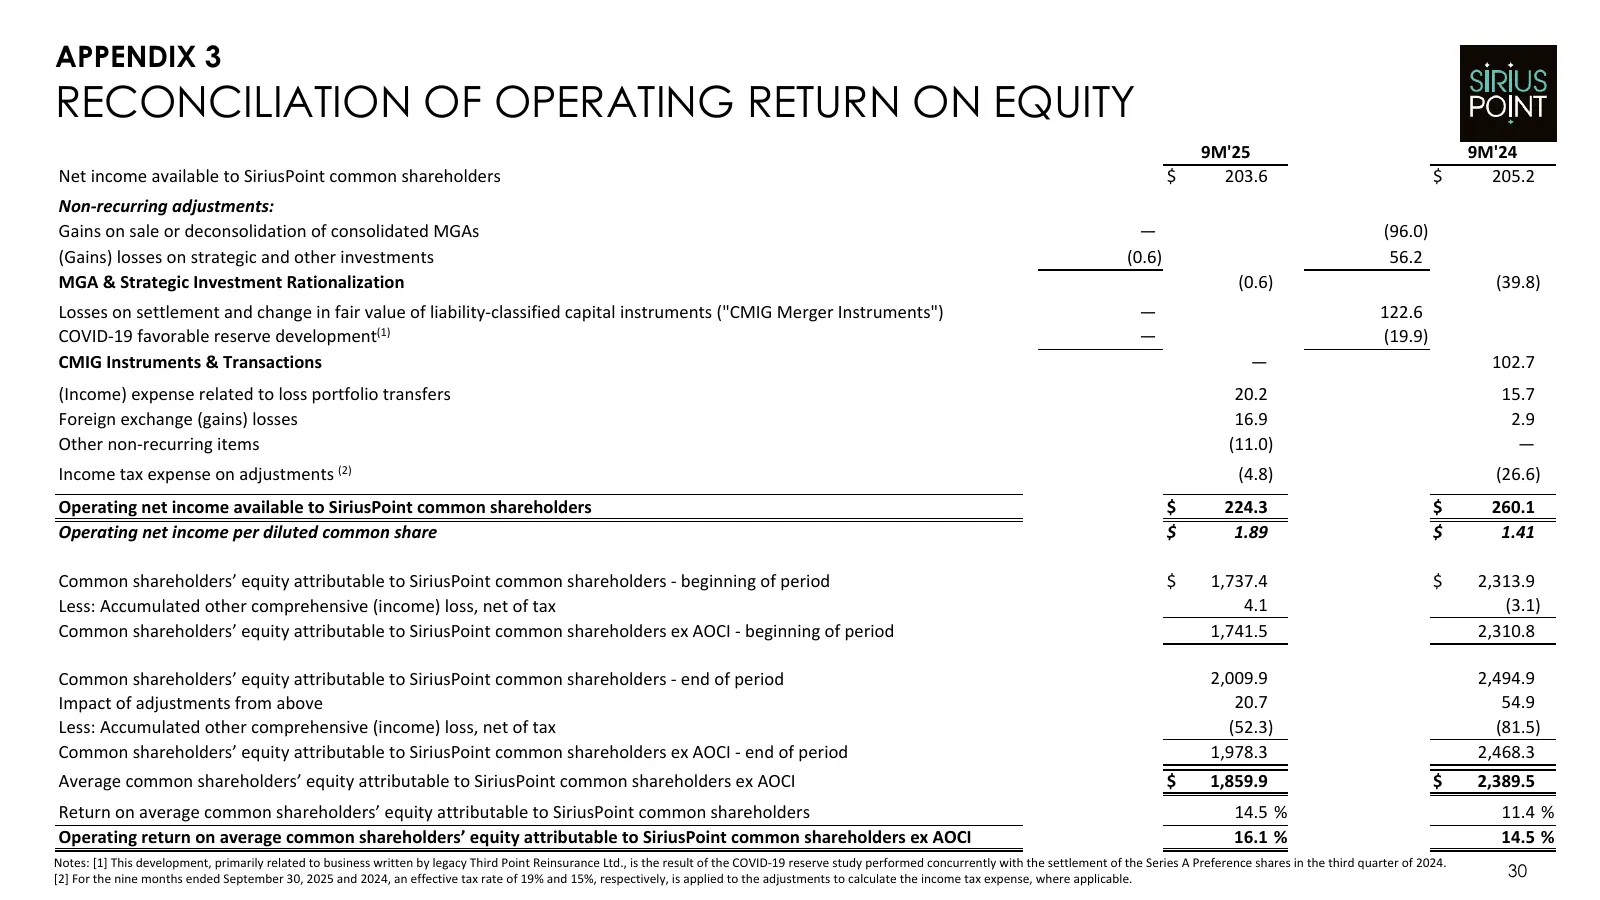
APPENDIX 3 RECONCILIATION OF OPERATING RETURN ON EQUITY 9M'25 9M'24 Net income available to SiriusPoint common shareholders $ 203.6 $ 205.2 Non-recurring adjustments: Gains on sale or deconsolidation of consolidated MGAs — (96.0) (Gains) losses on strategic and other investments (0.6) 56.2 MGA & Str
Slide 31: Strategic MGA Investments
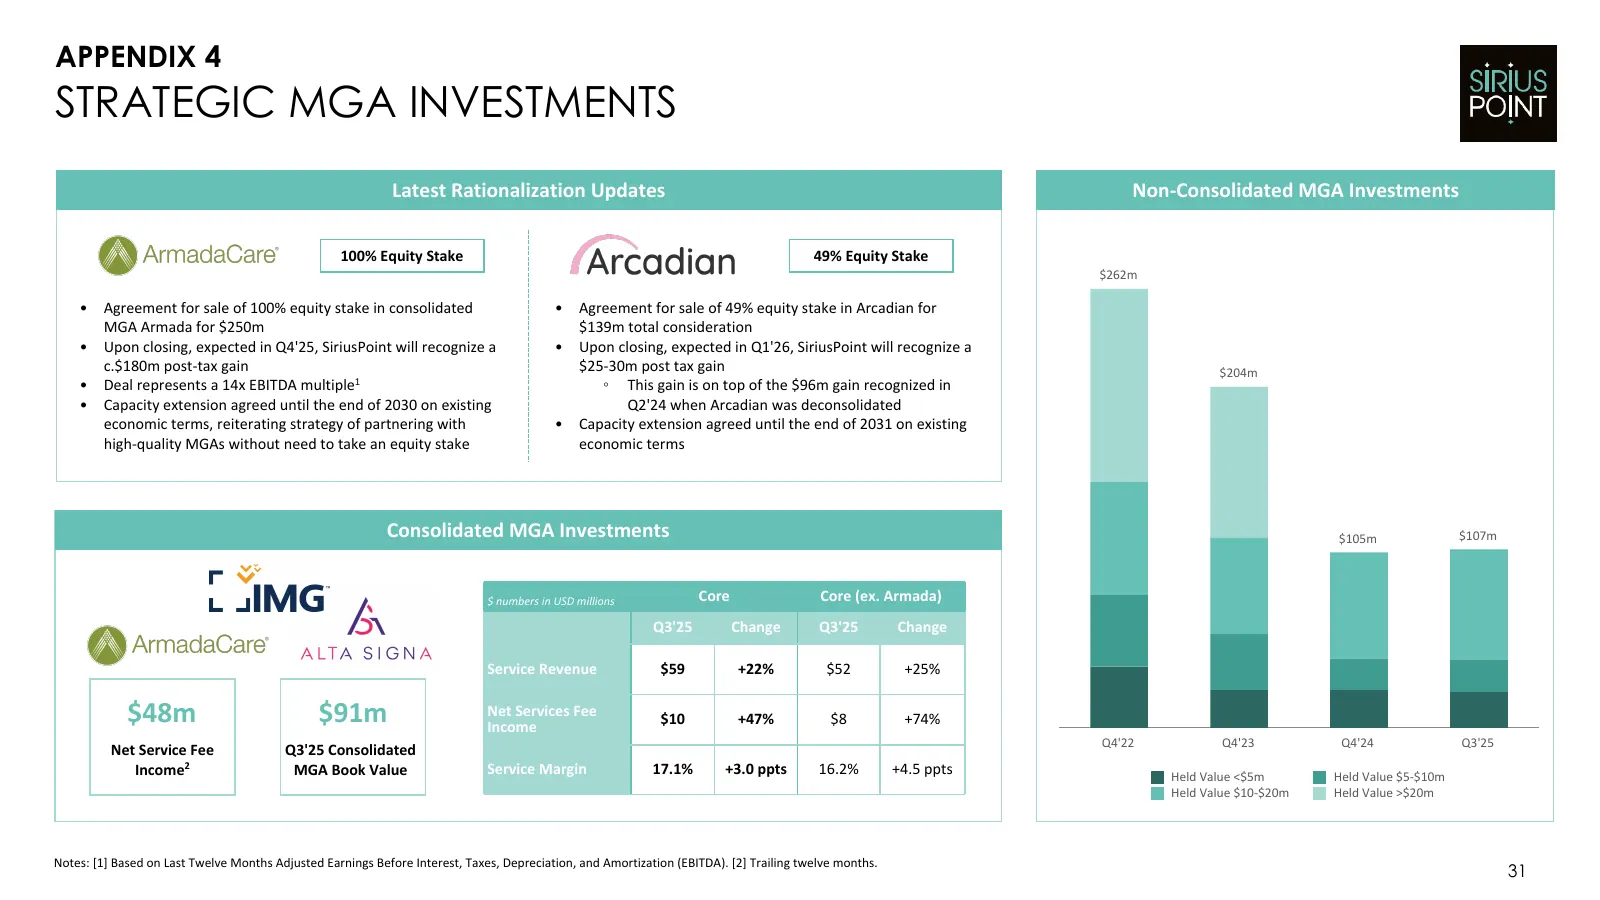
APPENDIX 4 STRATEGIC MGA INVESTMENTS Latest Rationalization Updates Non-Consolidated MGA Investments 100% Equity Stake 49% Equity Stake $262m • Agreement for sale of 100% equity stake in consolidated • Agreement for sale of 49% equity stake in Arcadian for MGA Armada for $250m $139m total considerat
Source: Internet Archive copy of s27.q4cdn.com
More decks from SiriusPoint Ltd.
 Q3 2026 Earnings Presentation37 slides · Nov 6, 2026
 Q2 2026 Earnings Presentation37 slides · Jul 30, 2026
 Q1 2026 Earnings Presentation32 slides · May 8, 2026
 Q4 2025 Earnings Presentation34 slides · Feb 19, 2026
 Q2 2025 Earnings Presentation29 slides · Aug 4, 2025
 Q1 2025 Earnings Presentation26 slides · May 6, 2025