Cvent — Dragoneer Growth Opportunities Corp. II — SPAC Merger (October 2021)
153 slides from Cvent's SPAC merger presentation, Oct 19, 2021
Slide 1: Analyst Day Presentation October 2021
Analyst Day Presentation October 2021
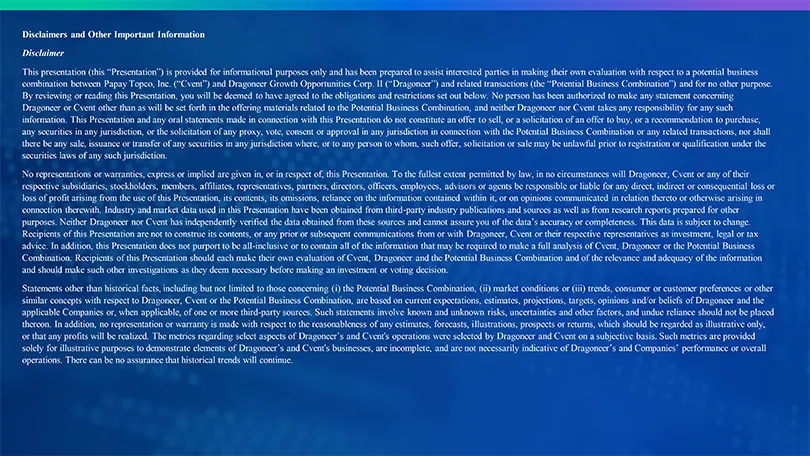
Slide 2: Disclaimers and Other Important Information
Disclaimers and Other Important Information Disclaimer This presentation (this “Presentation”) is provided for informational purposes only and has been prepared to assist interested parties in making their own evaluation with respect to a potential business combination between Papay Topco, Inc. (“Cv
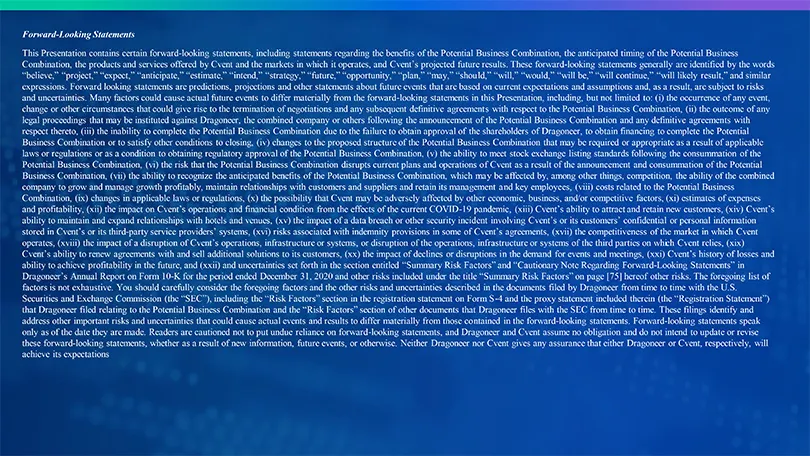
Slide 3: Forward-Looking Statements
Forward-Looking Statements This Presentation contains certain forward-looking statements, including statements regarding the benefits of the Potential Business Combination, the anticipated timing of the Potential Business Combination, the products and services offered by Cvent and the markets in whi
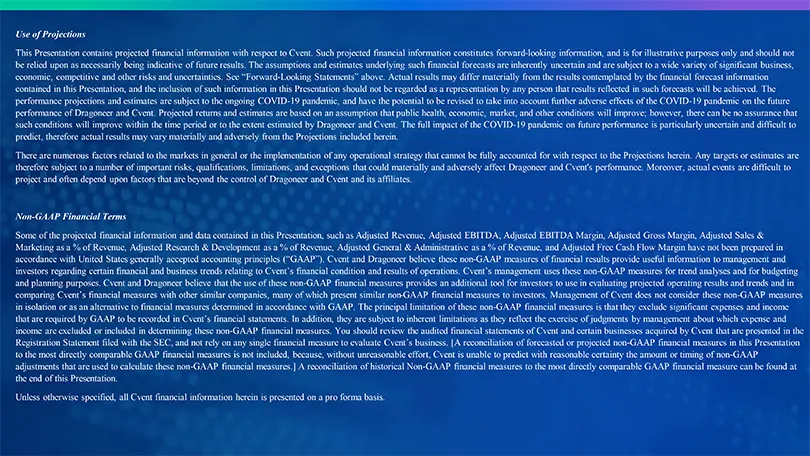
Slide 4: Use of Projections
Use of Projections This Presentation contains projected financial information with respect to Cvent. Such projected financial information constitutes forward-looking information, and is for illustrative purposes only and should not be relied upon as necessarily being indicative of future results. Th
Slide 5: Trademarks
Trademarks This Presentation contains trademarks, service marks, tradenames and copyrights of Cvent, Dragoneer and other companies, which are the property of their respective owners. The use herein does not imply an affiliation with, or endorsement by, the owners of these service marks, trademarks a
Slide 6: Agenda
Agenda 1 Introduction 2 Cvent At A Glance 3 Industry Transforming 4 Massive TAM Expansion 5 How We Win: Platform, Go-To-Market & Culture 6 Finance 7 Q&A 6
Slide 7: Today's Presenters
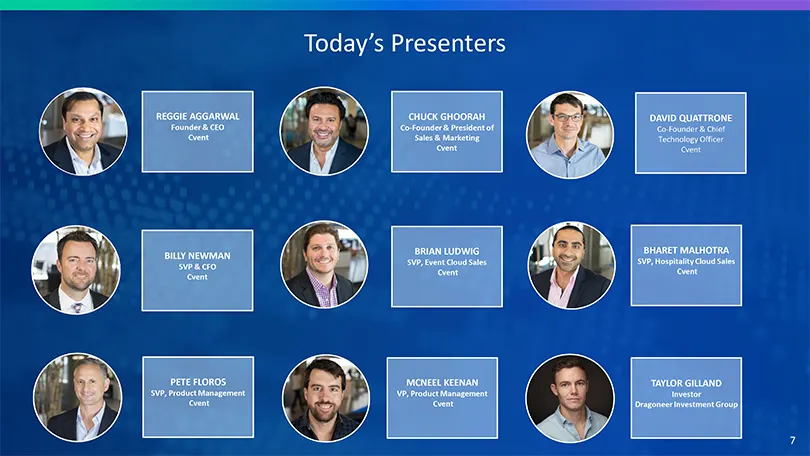
Today’s Presenters REGGIE AGGARWAL Founder & CEO Cvent BILLY NEWMAN SVP & CFO Cvent PETE FLOROS SVP, Product Management Cvent CHUCK GHOORAH Co-Founder & President of Sales & Marketing Cvent BRIAN LUDWIG SVP, Event Cloud Sales Cvent MCNEEL KEENAN VP, Product Management Cvent DAVID QUATTRONE Co-Founde
Slide 8: Rules of Engagement
Rules of Engagement 1 SPAC Disclosure Rules 2 Q3 Earnings Release 3 Short Q&A After Each Section and Q&A at the End 4 Metrics 8
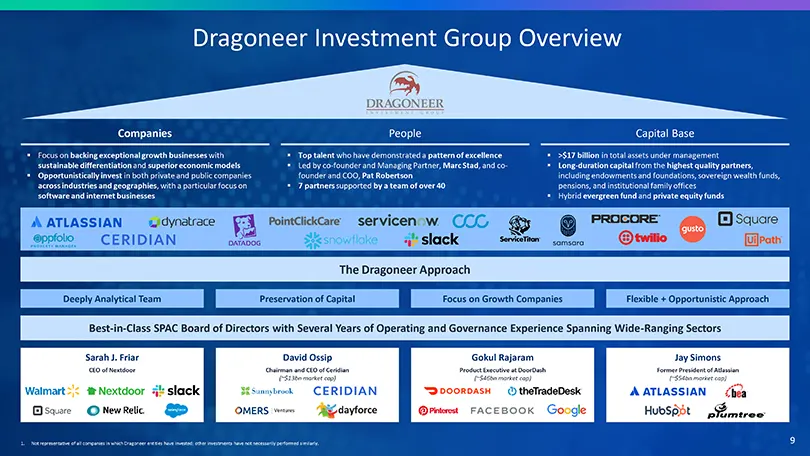
Slide 9: Dragoneer Investment Group Overview
Dragoneer Investment Group Overview Companies Focus on backing exceptional growth businesses with sustainable differentiation and superior economic models Opportunistically invest in both private and public companies across industries and geographies, with a particular focus on software and internet
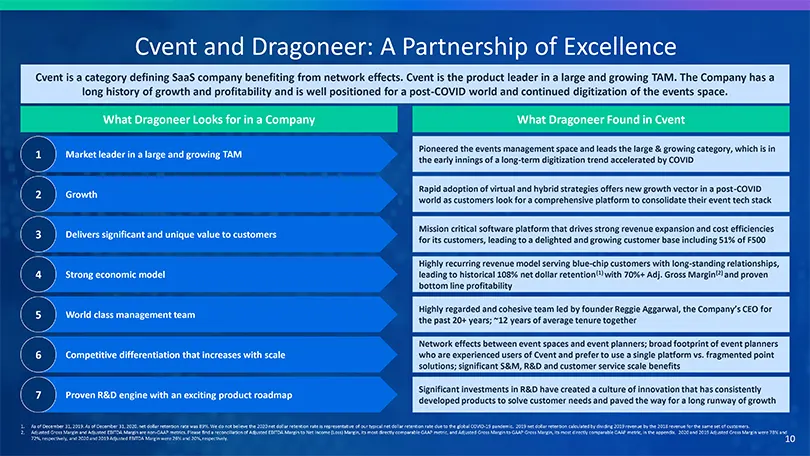
Slide 10: Cvent and Dragoneer: A Partnership of Excellence
Cvent and Dragoneer: A Partnership of Excellence Cvent is a category defining SaaS company benefiting from network effects. Cvent is the product leader in a large and growing TAM. The Company has a long history of growth and profitability and is well positioned for a post-COVID world and continued d
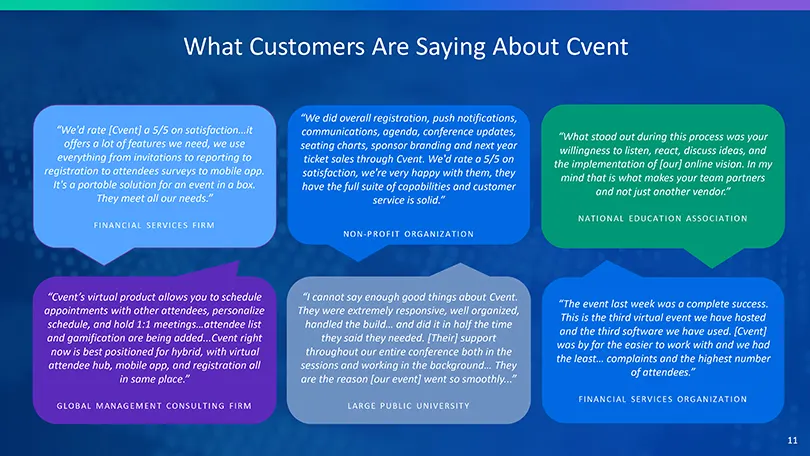
Slide 11: What Customers Are Saying About Cvent
What Customers Are Saying About Cvent “We’d rate [Cvent] a 5/5 on satisfaction…it offers a lot of features we need,we use everything from invitations to reporting to registration to attendeessurveys to mobile app. It’s a portable solution for an event in a box. They meet all our needs.” FINANCIAL SE
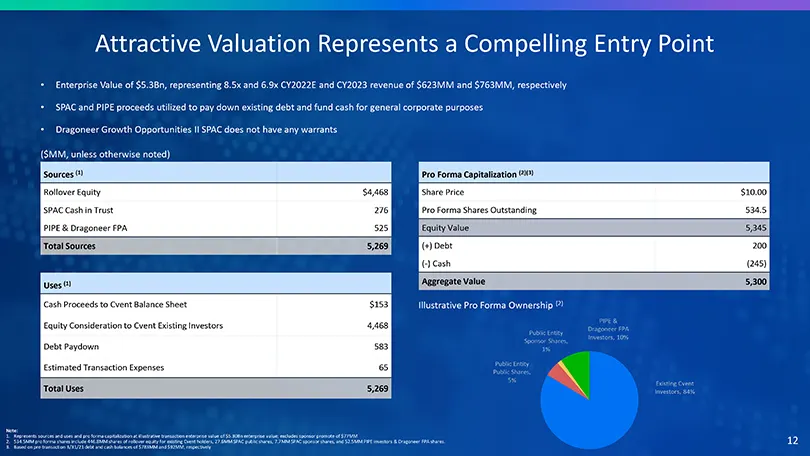
Slide 12: Attractive Valuation Represents a Compelling Entry Point
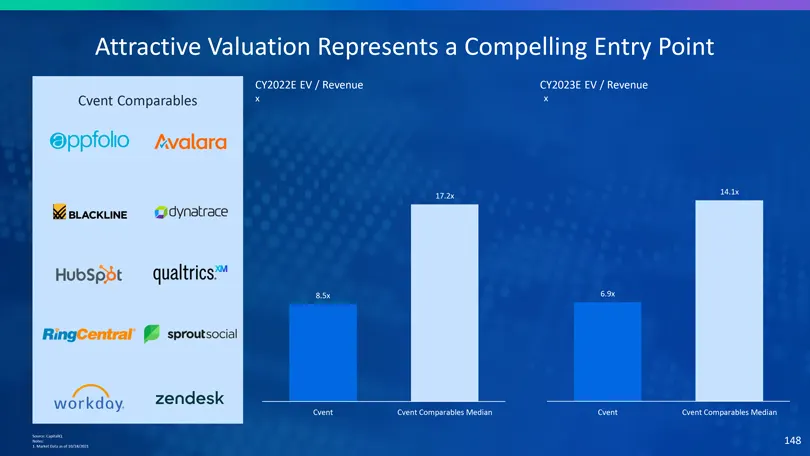
Attractive Valuation Represents a Compelling Entry Point Enterprise Value of $5.3Bn, representing 8.5x and 6.9x CY2022E and CY2023 revenue of $623MM and $763MM, respectively SPAC and PIPE proceeds utilized to pay down existing debt and fund cash for general corporate purposes DragoneerGrowth Opportu
Slide 13: Agenda
Agenda 1 Introduction 2 Cvent At A Glance 3 Industry Transforming 4 Massive TAM Expansion + Growth Strategy 5 How We Win 6 Finance 7 Q&A 13
Slide 14: What Does Cvent Do?
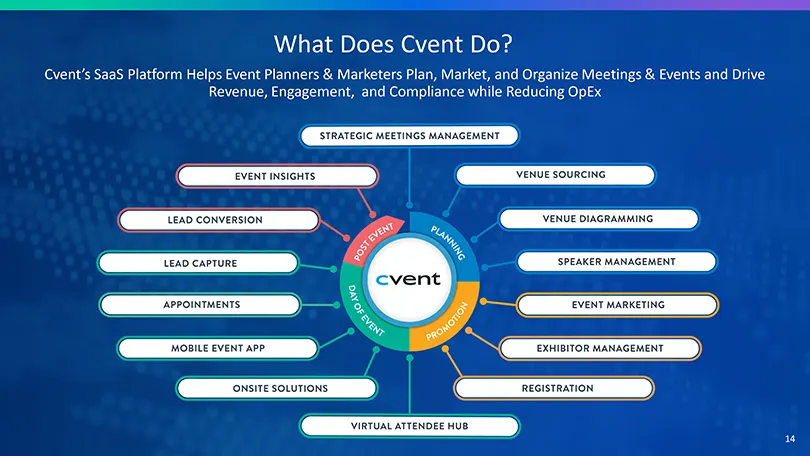
What Does Cvent Do? Cvent’s SaaS Platform Helps Event Planners & Marketers Plan, Market, and Organize Meetings & Events and Drive 14
Slide 15: Going From Public to Private to Public
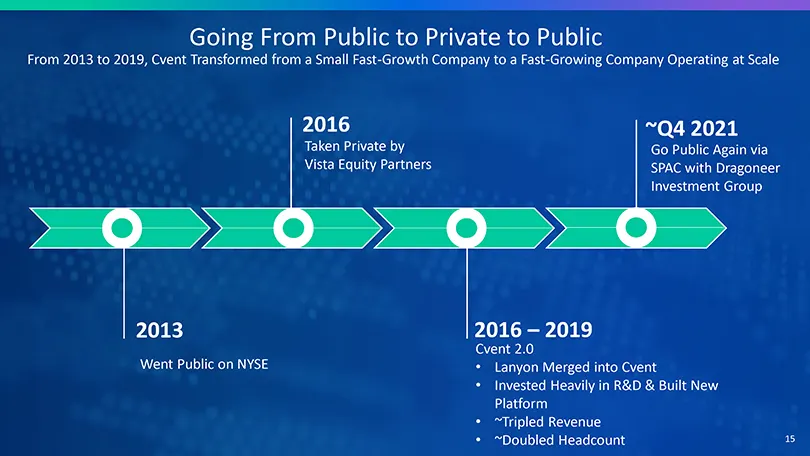
Going From Public to Private to Public From 2013 to 2019, Cvent Transformed from a Small Fast-Growth Company to a Fast-Growing Company Operating at Scale 2016 Taken Private by Vista Equity Partners ~Q4 2021 Go Public Again via SPAC with Dragoneer Investment Group 2013 Went Public on NYSE 2016 – 2019
Slide 16: Platform Expansion While Private with Vista
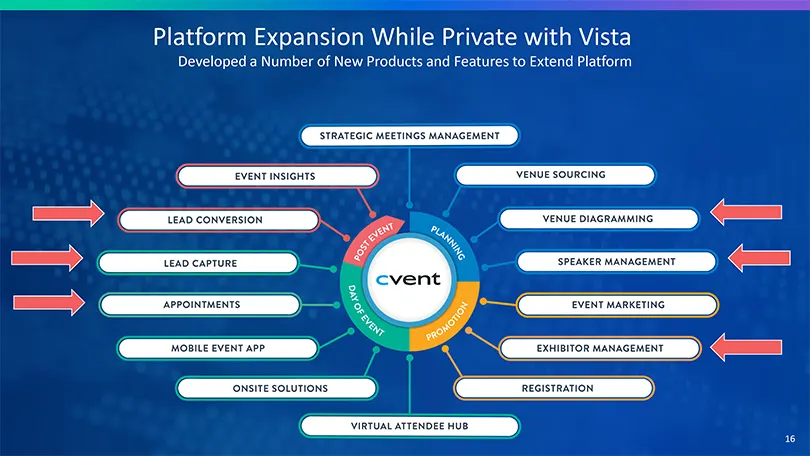
Platform Expansion While Private with Vista Developed a Number ofNew Products and Features to Extend Platform 16
Slide 17: 2016 Public Company vs. Cvent Pre Pandemic
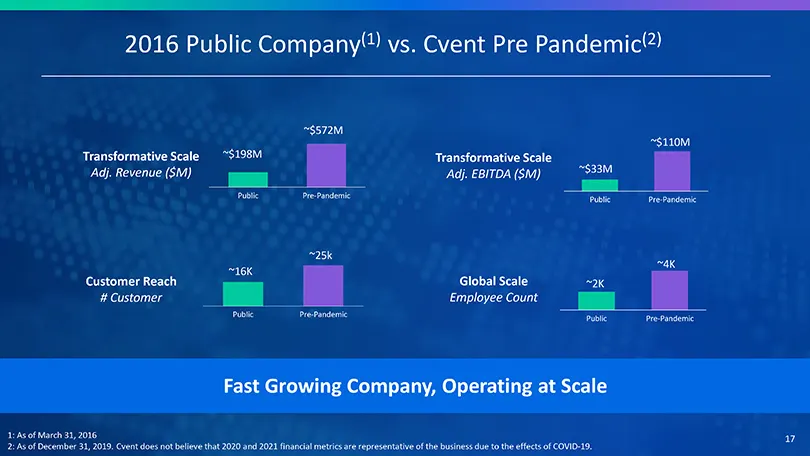
2016 Public Company(1) vs. Cvent Pre Pandemic(2) Transformative Scale Adj. Revenue ($M) [Graphic Appears Here] ~$572M Pre-Pandemic Transformative Scale Adj. EBITDA ($M) ~$33M Public ~$110M Pre-Pandemic Customer Reach # Customer ~16K Public ~25k Pre-Pandemic Global Scale Employee Count ~2K Public ~4K
Slide 18: Questions: Why go public with a SPAC?
QUESTIONS: Why go public? Why go public with a SPAC? 18
Slide 19: Agenda
Agenda 1 Introduction 2 Cvent At A Glance 3 Industry Transforming 4 Massive TAM Expansion 5 How We Win 6 Finance 7 Q&A 19
Slide 20: Cvent at a Glance
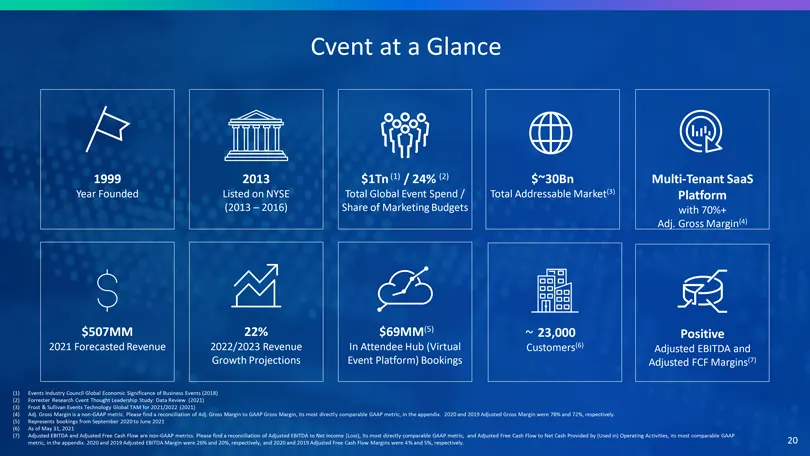
Cvent at a Glance 1999 Year Founded $507MM 2021 Forecasted Revenue 2013 Listed on NYSE (2013 – 2016) 22% 2022/2023 Revenue Growth Projections $1Tn(1) / 24% (2) Total Global Event Spend / Share of Marketing Budgets $69MM(5) In Attendee Hub (Virtual Event Platform) Bookings $~30Bn Total Addressable Ma
Slide 21: Cvent Adjusted Revenue Projections
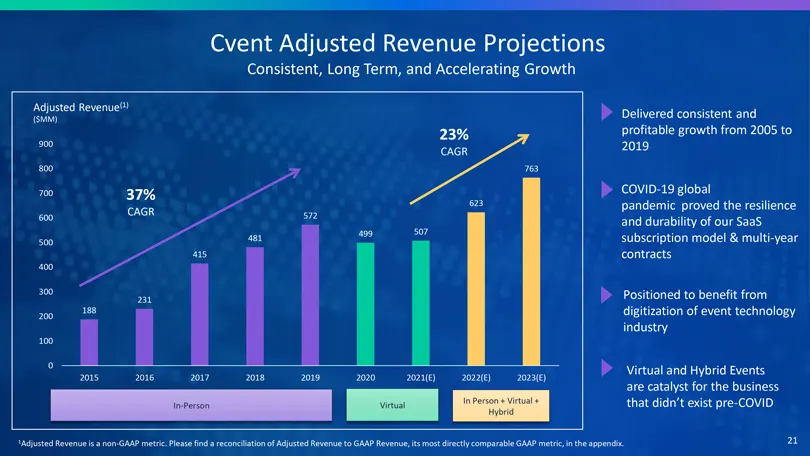
Cvent Adjusted Revenue Projections Consistent, Long Term, and Accelerating Growth Adjusted Revenue(1) ($MM) 900 23% CAGR 800 763 700 37% CAGR 623 600 572 499 507 481 500 415 400 300 231 188 200 100 0 2015 2016 2017 2018 2019 2020 2021(E) 2022(E) 2023(E) In Person + Virtual + In-Person Virtual Hybrid
Slide 22: Investment Thesis
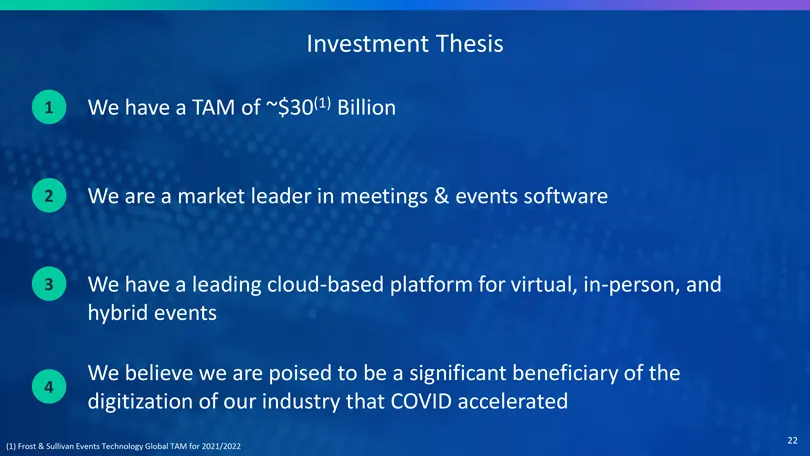
Investment Thesis 1 We have a TAM of ~$30(1) Billion 2 We are a market leader in meetings & events software 3 We have a leading cloud-based platform for virtual, in-person, and hybrid events We believe we are poised to be a significant beneficiary of the 4 digitization of our industry that COVID acc
Slide 23: $1 Trillion Global Spend on Business Meetings & Events
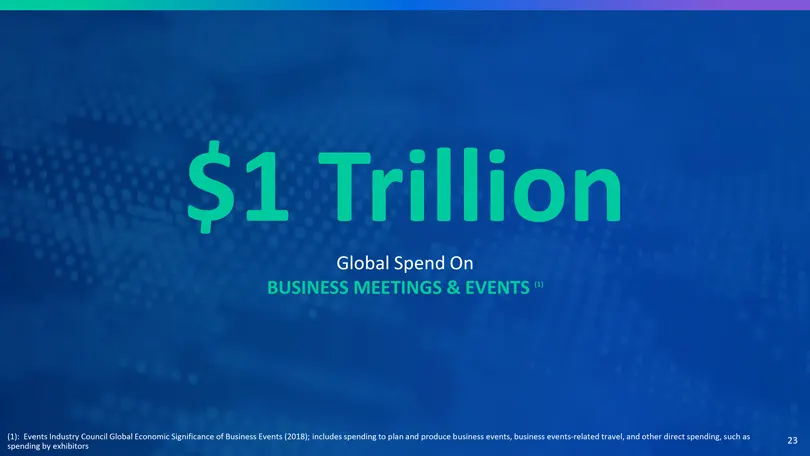
$1 Trillion Global Spend On BUSINESS MEETINGS & EVENTS (1) (1): Events Industry Council Global Economic Significance of Business Events (2018); includes spending to plan and produce business events, business events-related travel, and other direct spending, such as spending by exhibitors 23
Slide 24: Meetings and Events: Foundational to Enterprise Spend
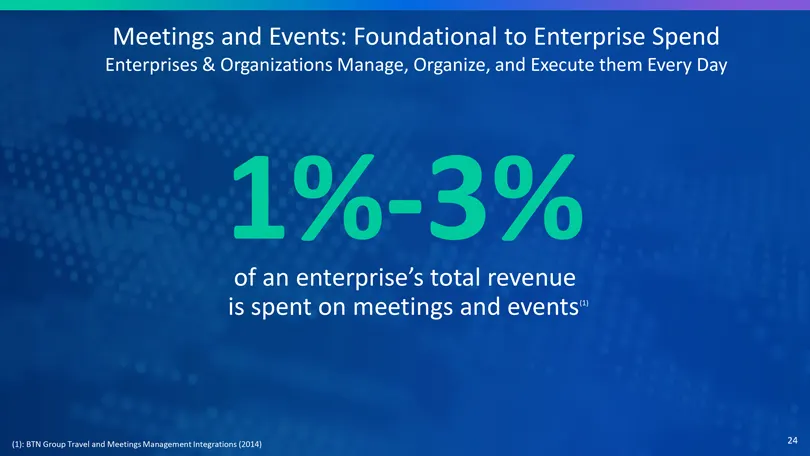
Meetings and Events: Foundational to Enterprise Spend Enterprises & Organizations Manage, Organize, and Execute them Every Day 1%-3% of an enterprise’s total revenue is spent on meetings and events(1) (1): BTN Group Travel and Meetings Management Integrations (2014) 24
Slide 25: How Much Do Corporations Spend on Meetings?
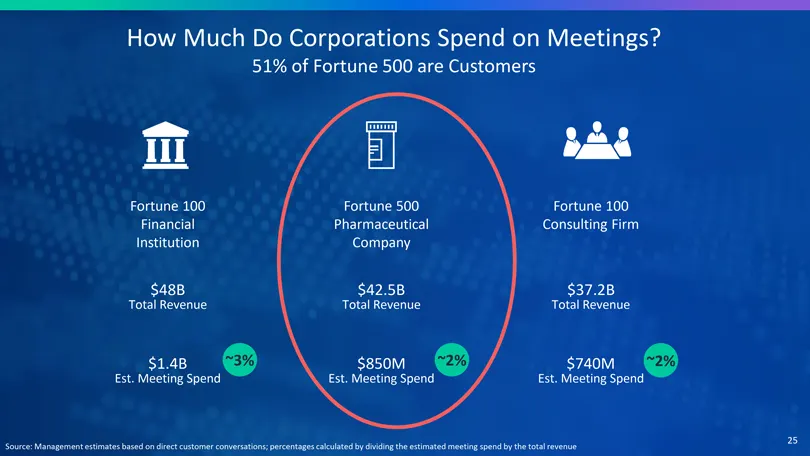
How Much Do Corporations Spend on Meetings? 51% of Fortune 500 are Customers Fortune 100 Financial Institution $48B Total Revenue $1.4B ~3% Est. Meeting Spend Fortune 500 Pharmaceutical Company $42.5B Total Revenue $850M ~2% Est. Meeting Spend Fortune 100 Consulting Firm $37.2B Total Revenue $740M ~
Slide 26: Meetings and Events Drive Customer & Prospect Engagement
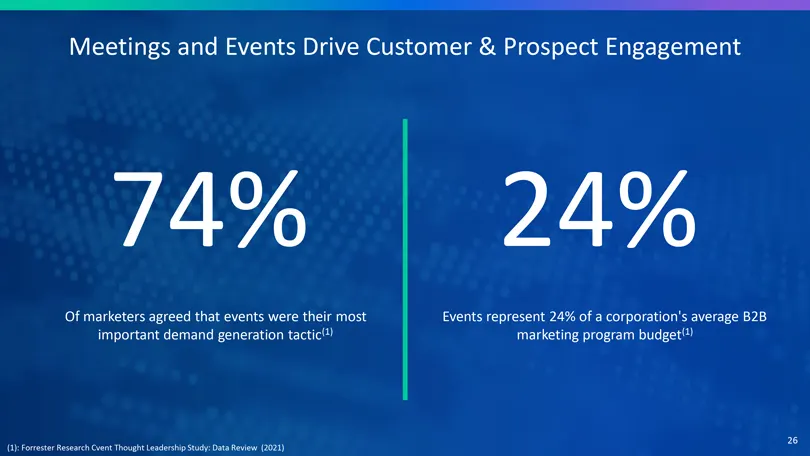
Meetings and Events Drive Customer & Prospect Engagement 74% Of marketers agreed that events were their most important demand generation tactic(1) 24% Events represent 24% of a corporation’s average B2B marketing program budget(1) (1): Forrester Research Cvent Thought Leadership Study: Data Review (
Slide 27: Digitizing the Event Industry: Virtual Attendee Hub
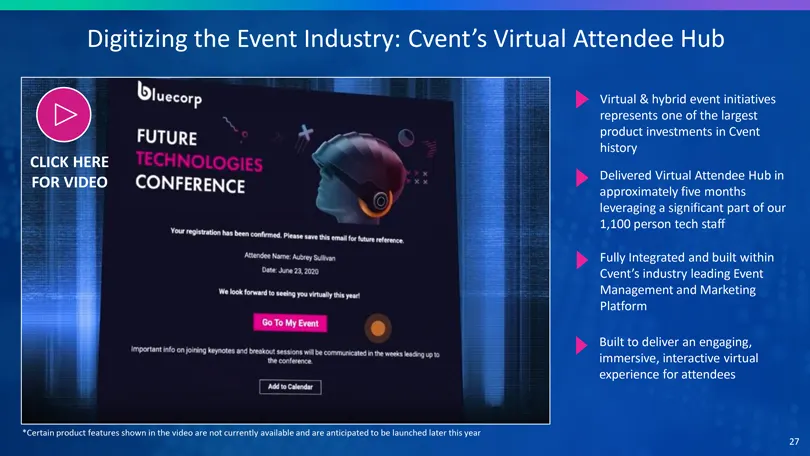
Digitizing the Event Industry: Cvent’s Virtual Attendee Hub Virtual & hybrid event initiatives represents one of the largest product investments in Cvent history Delivered Virtual Attendee Hub in approximately five months leveraging a significant part of our 1,100 persontech staff Fully Integrated a
Slide 28: Virtual-Related Bookings
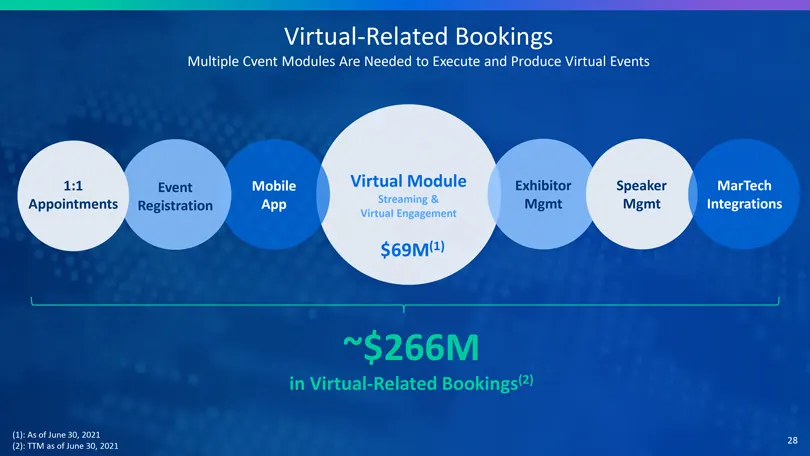
Virtual-Related Bookings Multiple Cvent Modules Are Needed to Execute and Produce Virtual Events 1:1 Event Mobile Virtual Module Exhibitor Speaker MarTech Appointments App Streaming & Mgmt Mgmt Integrations Registration Virtual Engagement $69M(1) ~$266M in Virtual-Related Bookings(2) (1): As of June
Slide 29: New Growth Vector: Virtual & Hybrid Events
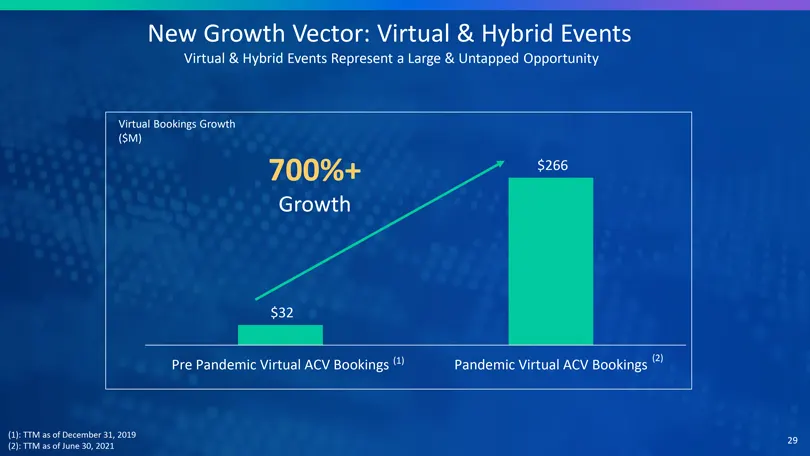
New Growth Vector: Virtual & Hybrid Events Virtual & Hybrid Events Represent a Large & Untapped Opportunity Virtual Bookings Growth ($M) 700%+ Growth $32 Pre Pandemic Virtual ACV Bookings (1) $266 (2) Pandemic Virtual ACV Bookings (1): TTM as of December 31, 2019 (2): TTM as of June 30, 2021 29
Slide 30: Event Delivery Models Have Different Advantages
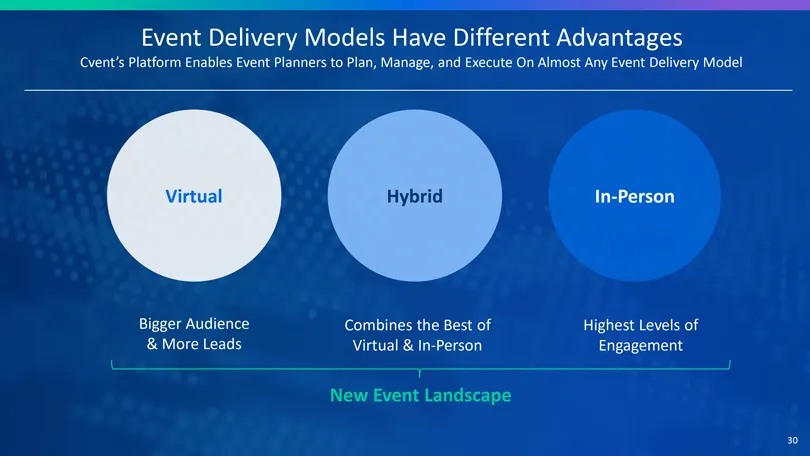
Event Delivery Models Have Different Advantages Cvent’s Platform Enables Event Planners to Plan, Manage, and Execute On Almost Any Event Delivery Model Virtual Hybrid In-Person Bigger Audience & More Leads Combines the Best of Virtual & In-Person Highest Levels of Engagement New Event Landscape 30

Slide 31: Hybrid Solutions Video
Hybrid Solutions Video CLICK HERE FOR VIDEO *Certain product features shown in the video are not currently available and are anticipated to be launched later this year 31
Slide 32: Bigger Transformation Is Around the Corner
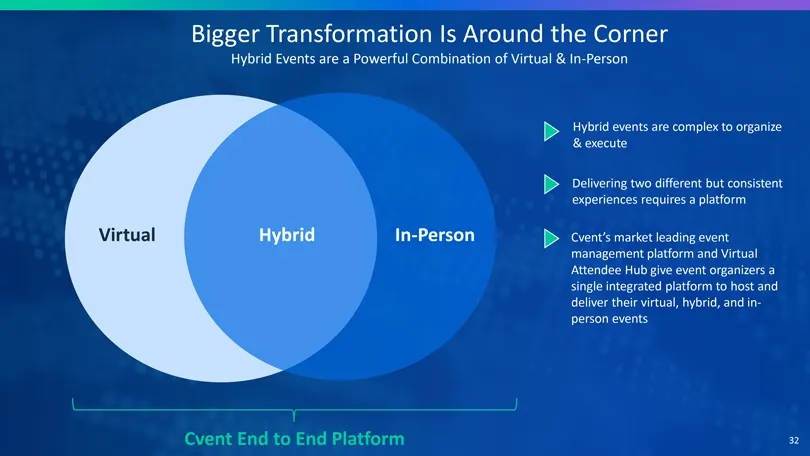
Bigger Transformation Is Around the Corner Hybrid Events are a Powerful Combination of Virtual & In-Person Virtual Hybrid In-Person Hybrid events are complex to organize & execute Delivering two different but consistent experiences requires a platform Cvent’s market leading event management platform
Slide 33: Event Technology Spend By Delivery Model
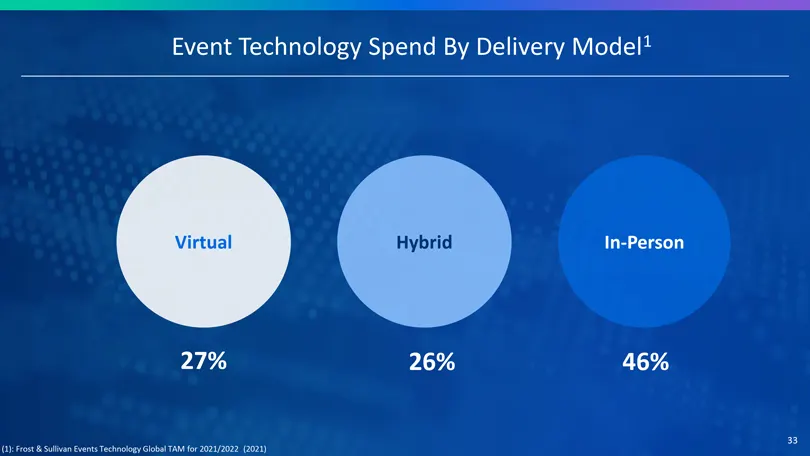
Event Technology Spend By Delivery Model1 Virtual Hybrid In-Person 27% 26% 46% (1): Frost & Sullivan Events Technology Global TAM for 2021/2022 (2021) 33
Slide 34: Agenda
Agenda 1 Introduction 2 Cvent At A Glance 3 Industry Transforming 4 Massive TAM Expansion 5 How We Win: Platform, Go-To-Market & Culture 6 Finance 7 Q&A 34
Slide 35: Virtual and Hybrid Trends
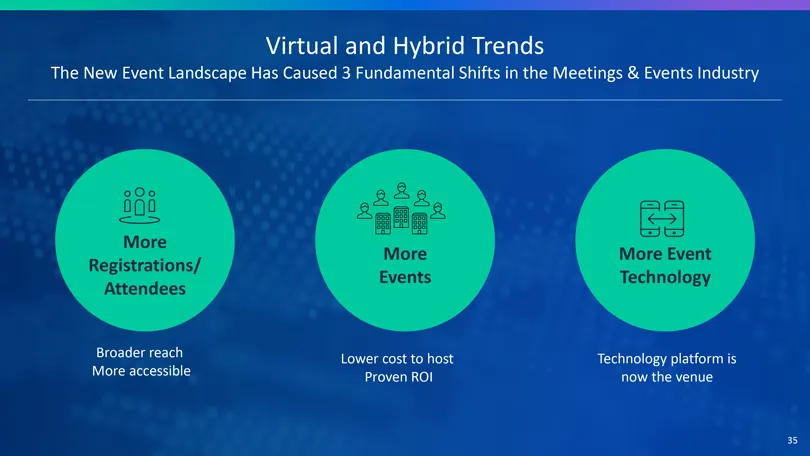
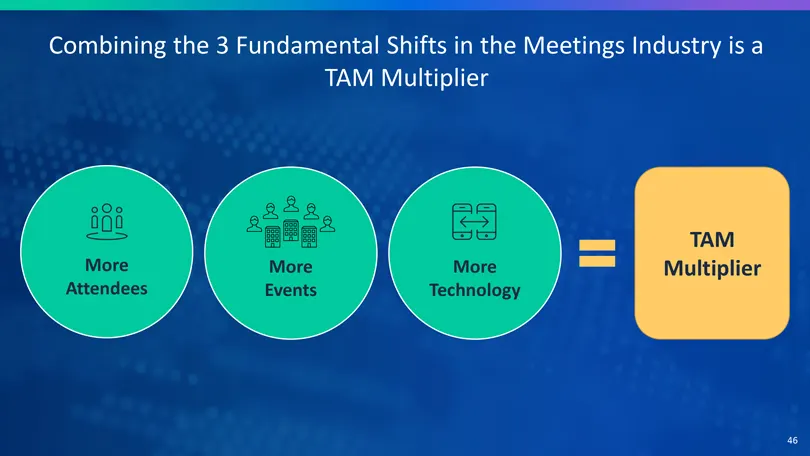
Virtual and Hybrid Trends The New Event Landscape Has Caused 3 Fundamental Shifts in the Meetings & Events Industry More Registrations/ Attendees Broader reach More accessible More Events Lower cost to host Proven ROI More Event Technology Technology platform is now the venue 35
Slide 36: The Digital Transformation of the Event Industry Has Created a Large TAM
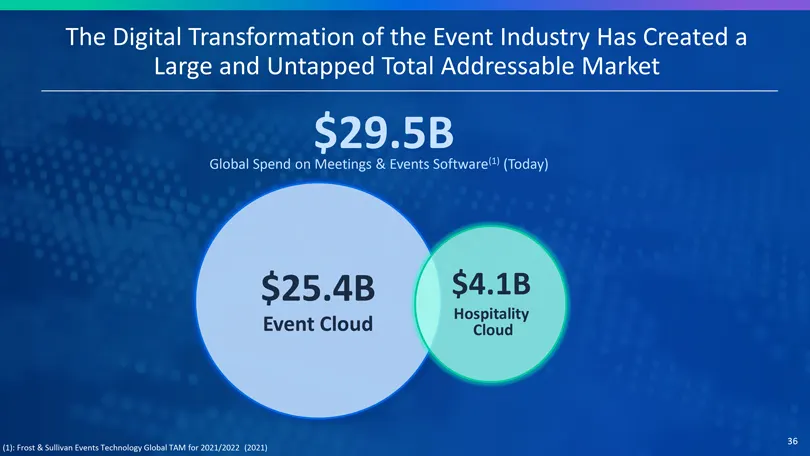
The Digital Transformation of the Event Industry Has Created a Large and Untapped Total Addressable Market $29.5B Global Spend on Meetings & Events Software(1) (Today) $25.4B $4.1B Hospitality Event Cloud Cloud (1): Frost & Sullivan Events Technology Global TAM for 2021/2022 (2021) 36
Slide 37: Event Cloud TAM by Event Delivery Model
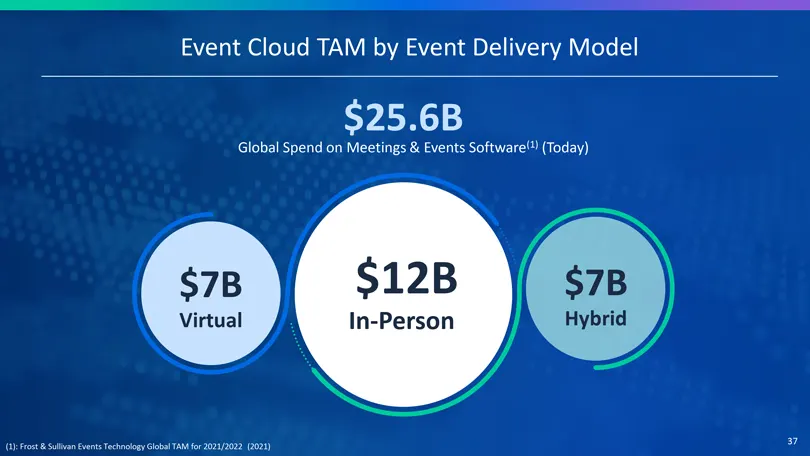
Event Cloud TAM by Event Delivery Model $25.6B Global Spend on Meetings & Events Software(1) (Today) $7B $12B $7B Virtual In-Person Hybrid Total Worldwide (1): Frost & Sullivan Events Technology Global TAM for 2021/2022 (2021) 37
Slide 38: Event Cloud TAM by Geographic Region
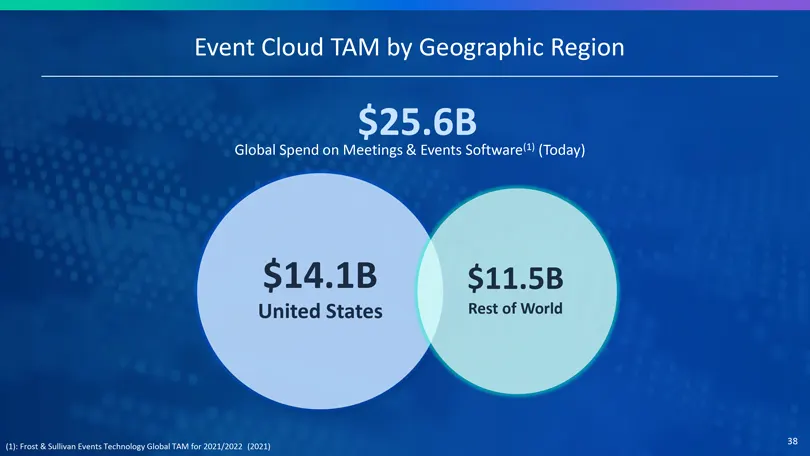
Event Cloud TAM by Geographic Region $25.6B Global Spend on Meetings & Events Software(1) (Today) $14.1B $11.5B United States Rest of World (1): Frost & Sullivan Events Technology Global TAM for 2021/2022 (2021) 38
Slide 39: Event Technology US TAM For 2021/2022
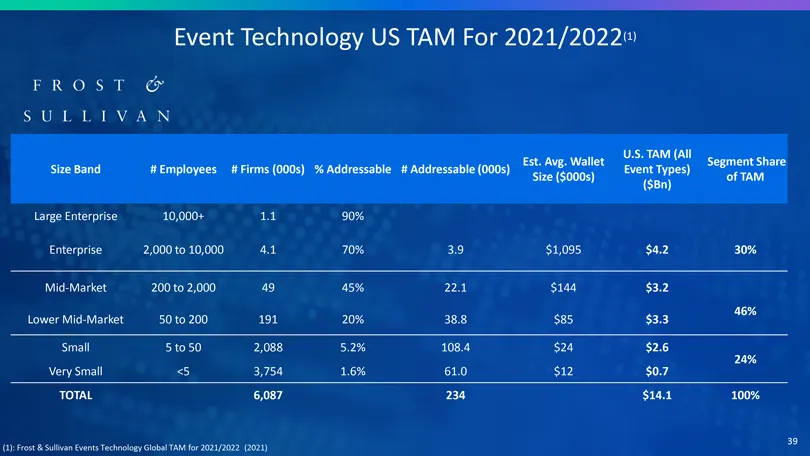
Event Technology US TAM For 2021/2022(1) U.S. TAM (All Est. Avg. Wallet Segment Share Size Band # Employees # Firms (000s) % Addressable # Addressable (000s) Event Types) Size ($000s) of TAM ($Bn) Large Enterprise 10,000+ 1.1 90% Enterprise 2,000 to 10,000 4.1 70% 3.9 $1,095 $4.2 30% Mid-Market 200
Slide 40: Event Technology US TAM For 2021/2022
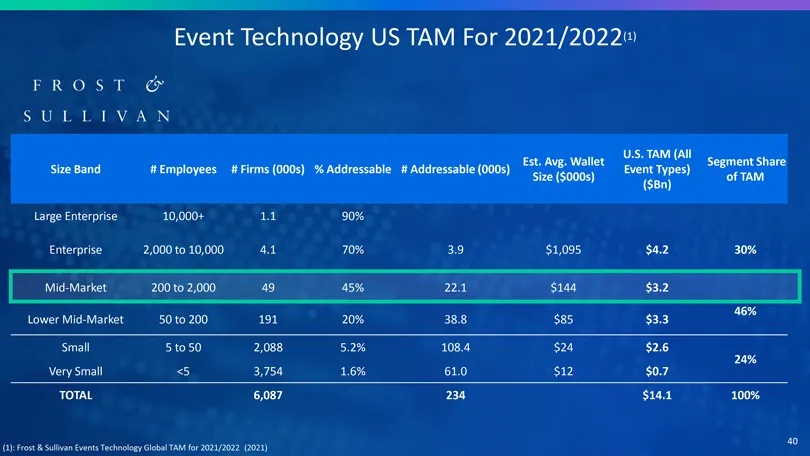
Event Technology US TAM For 2021/2022(1) U.S. TAM (All Est. Avg. Wallet Segment Share Size Band # Employees # Firms (000s) % Addressable # Addressable (000s) Event Types) Size ($000s) of TAM ($Bn) Large Enterprise 10,000+ 1.1 90% Enterprise 2,000 to 10,000 4.1 70% 3.9 $1,095 $4.2 30% 46% Lower Mid-M
Slide 41: Virtual and Hybrid Trends
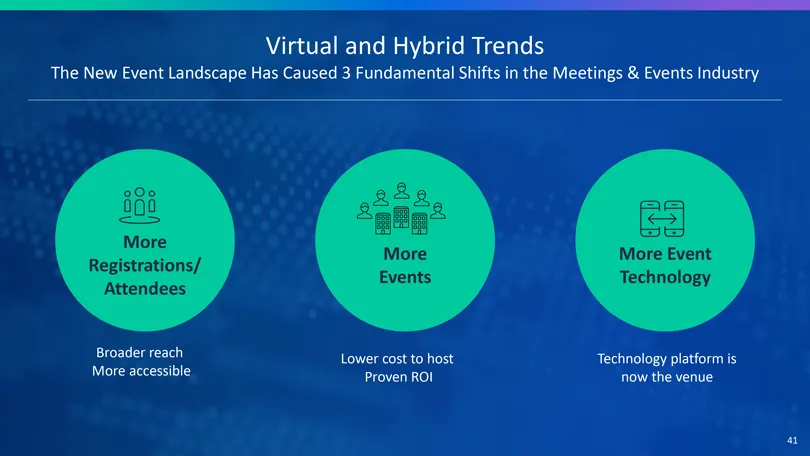
Virtual and Hybrid Trends The New Event Landscape Has Caused 3 Fundamental Shifts in the Meetings & Events Industry ita oat More Registrations/ Attendees Ea More Event Technology Broader reach Lower cost to host Technology platform is More accessible Proven RO! now the venue a
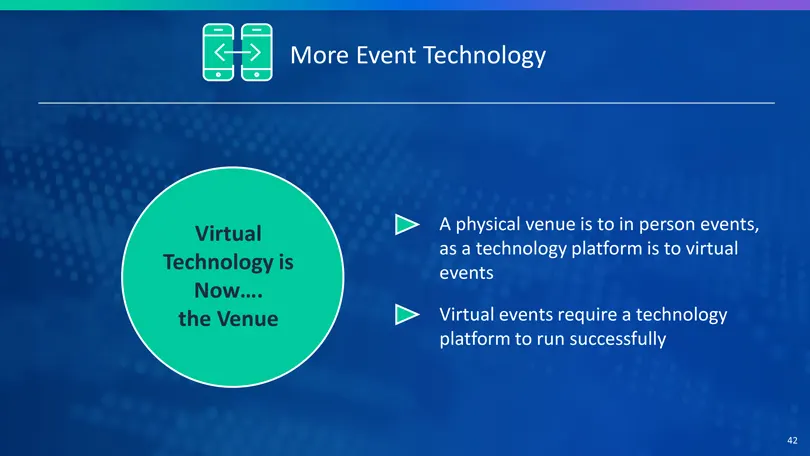
Slide 42: Virtual: Technology Is Now the Venue
Virtual Technology is Now... the Venue > > A physical venue is to in person events, as a technology platform is to virtual events Virtual events require a technology platform to run successfully a
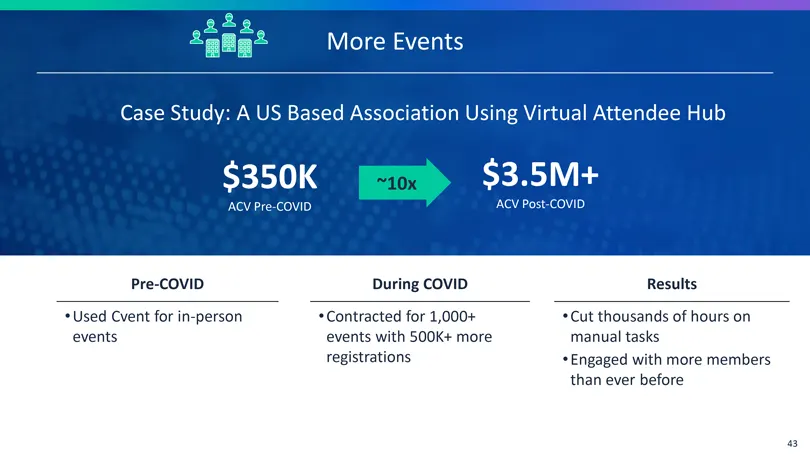
Slide 43: More Events: Case Study of US Association
More Events Case Study: A US Based Association Using Virtual Attendee Hub $350K $3.5M+ ACV Pre-COVID ACV Post-COVID Pre-COVID During COVID Results *Used Cvent for in-person Contracted for 1,000+ Cut thousands of hours on events events with 500K+ more manual tasks registrations + Engaged with more me
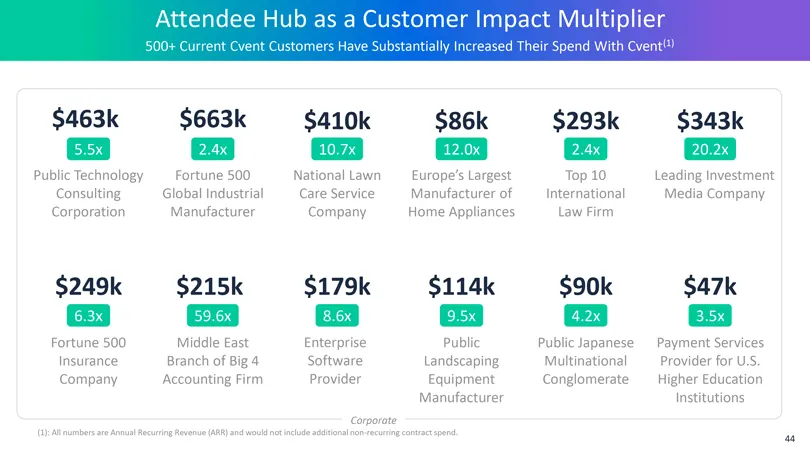
Slide 44: Attendee Hub as a Customer Impact Multiplier
Attendee Hub as a Customer Impact Multiplier 500+ Current Cvent Custor ubstantially Increased Their Spend With Cvent\®) $463k $663k = $410k $86k $293k $343k Public Technology Fortune 500 National Lawn Europe's Largest Top 10 Leading Investment Consulting Global industrial Care Service Manufacturer o
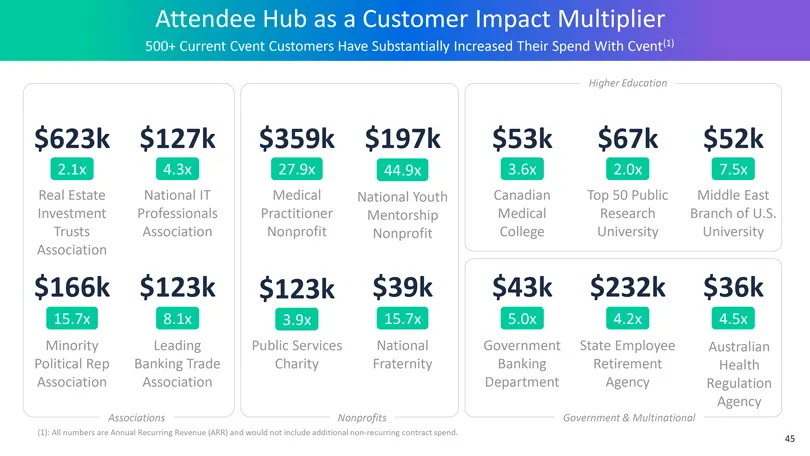
Slide 45: Attendee Hub as a Customer Impact Multiplier
Attendee Hub as a Cust: intially Incr er Impact Mult Their Spend With $623k $127k [2.x] [4.3% $359k $197k a RealEstate National IT Medical National Youth Investment Professionals ‘Practitioner. Mentorship Trusts Association Nonprofit Nonprofit Association $123k $39k $166k $123k 1 Minority Leading Pu
Slide 46: TAM Multiplier
Combining the 3 Fundamental Shifts in the Meetings Industry is a TAM Multiplier TAM Multiplier “6
Slide 47: Hospitality Cloud
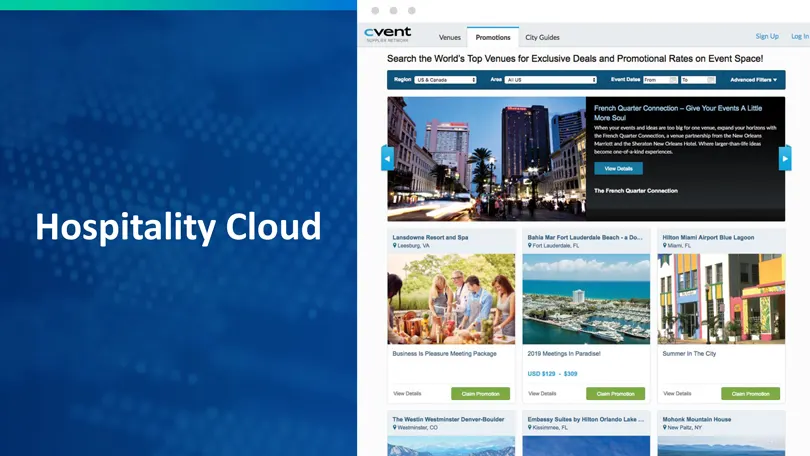
Hospitality Cloud
Slide 48: Cvent Hospitality Cloud is Embedded in the Events Space
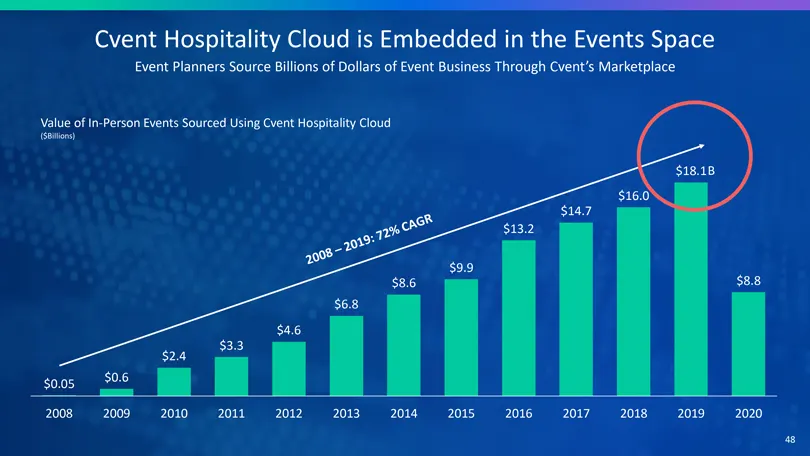
Cvent Hospitality Cloud is Embedded in the Events Space Event Planners Source Billions of Dollars of Event Business Through Cvent’s Marketplace Value of In-Person Events Sourced Using Cvent Hospi (ion $9.9 $8.6 $8.8 $6.8 $4.6 $24 lel | ae | st0s | 2008 ©2009-2010» 2011.-S «2012S 2013'S «2014S «20152
Slide 49: Questions: How has COVID shifted attitudes?
QUESTIONS: How has COVID shifted attitudes and what are the long-term implications for Cvent?
Slide 50: How We Win
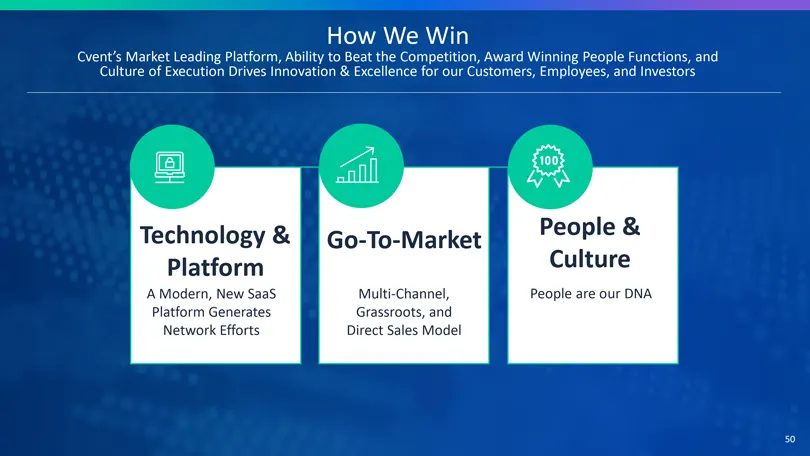
How We Win Cvent’s Market Leading Platform, Ability to Beat the Competition, Award Winning People Functions, and Culture of Execution Drives Innovation & Excellence for our Customers, Employees, and Investors <a People & Culture ole are our DNA Technology & §§ Go-To-Market Platform A Modern, New Saa
Slide 51: A World-Class Technology Department
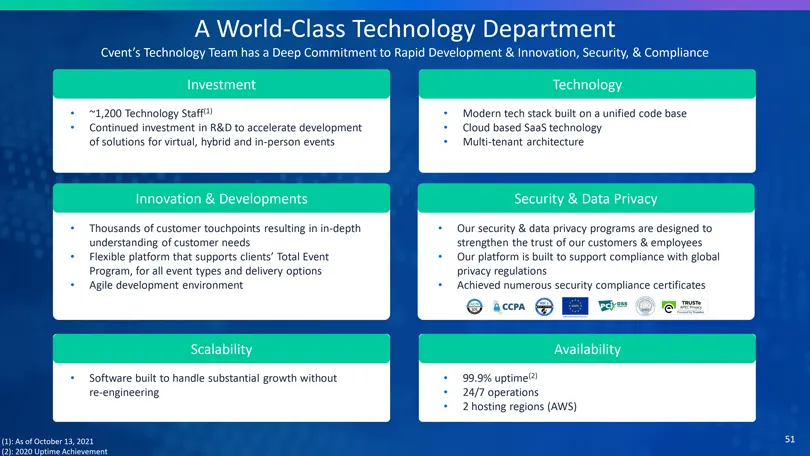
A World-Class Technology Department Cvent’s Technology Team has a Deep Commitment to Rapid Development & Innovation, Security, & Compliance Investment ~1,200 Technology Staff(1) Continued investment in R&D to accelerate development of solutions for virtual, hybrid and in-person events Innovation & D
Slide 52: Cvent Architecture
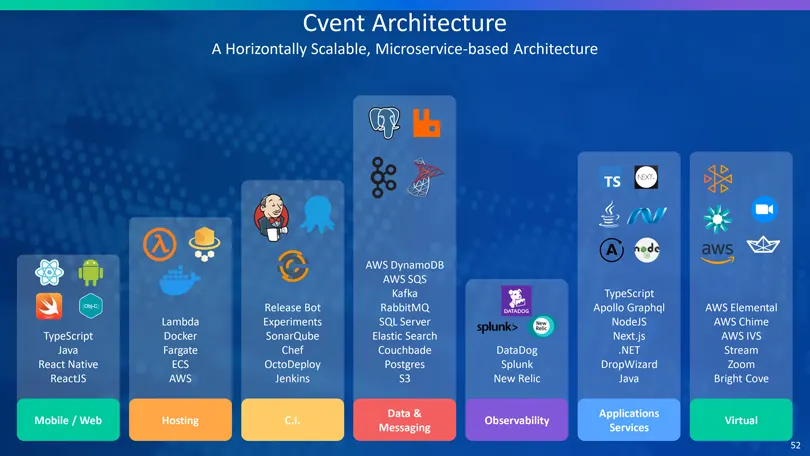
Cvent Architecture A Horizontally Scalable, Microservice-based Architecture TypeScript Java React Native ReactJS Mobile / Web Lambda Docker Fargate ECS AWS Hosting Release Bot Experiments SonarQube Chef OctoDeploy Jenkins C.I. AWS DynamoDB AWS SQS Kafka RabbitMQ SQL Server Elastic Search Couchbade P
Slide 53: New, Modern Platform
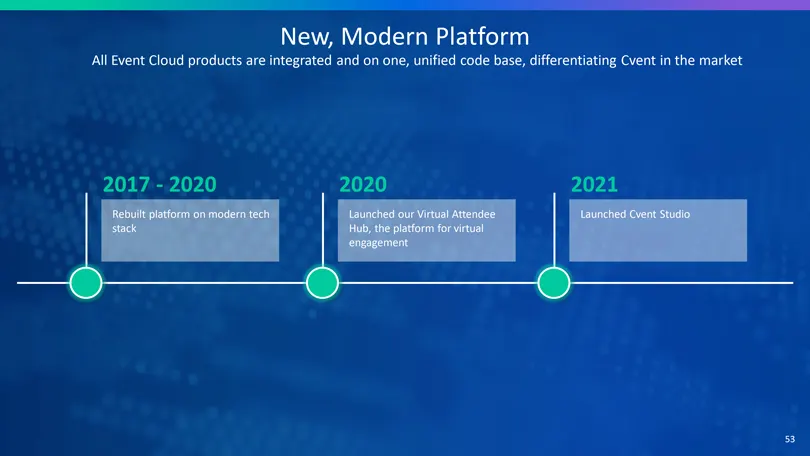
New, Modern Platform All Event Cloud products are integrated and on one, unified code base, differentiating Cvent in the market 2017—2020 Rebuilt platform on modern tech stack 2020 Launched our Virtual Attendee Hub, the platform for virtual engagement 2021 Launched Cvent Studio
Slide 54: Single Source of Truth for Live Engagement
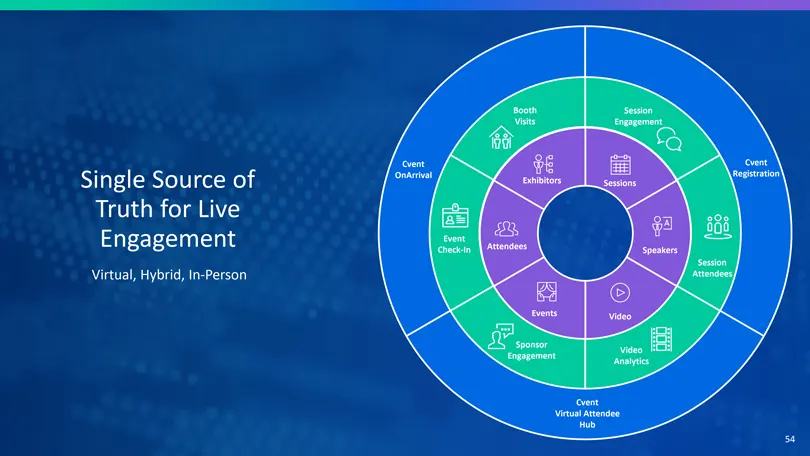
Single Source of Truth for Live Engagement Virtual, Hybrid, In-Person Cvent OnArrival Booth Visits Session Engagement Cvent Registration Session Attendees Video Analytics Sponsor Engagement Event Check-In Exhibitors Sessions Speakers Video Events Attendees Cvent Virtual Attendee Hub
Slide 55: The Cvent Ecosystem
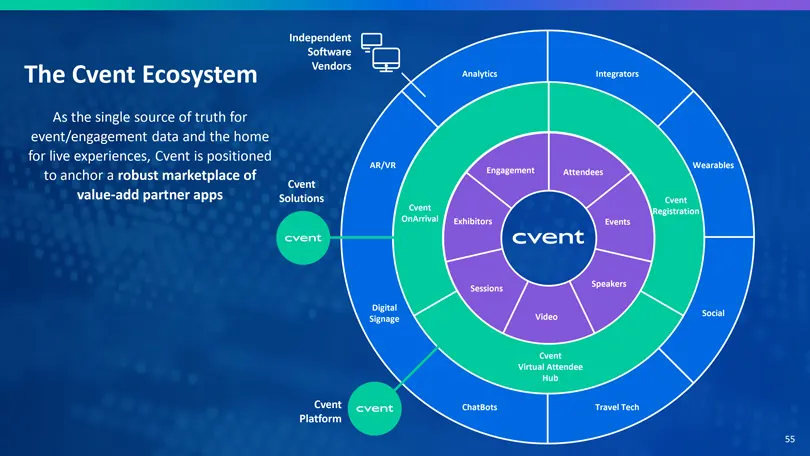
The Cvent Ecosystem As the single source of truth for event/engagement data and the home for live experiences, Cvent is positioned to anchor a robust marketplace of value-add partner apps Independent Software Vendors Cvent Solutions AR/VR Digital Signage Cvent Platform ChatBots Travel Tech Social We
Slide 56: Platform & Technology: EC Platform and Differentiation
Platform & Technology Go-To-Market People & Culture EC Platform and Differentiation
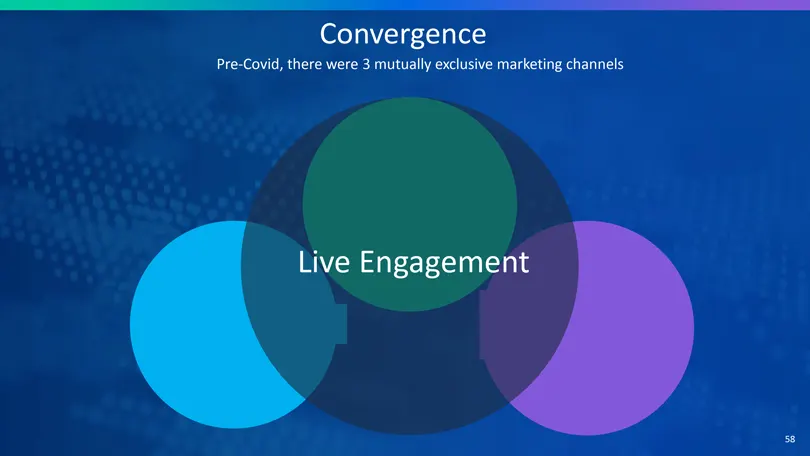
Slide 57: Convergence
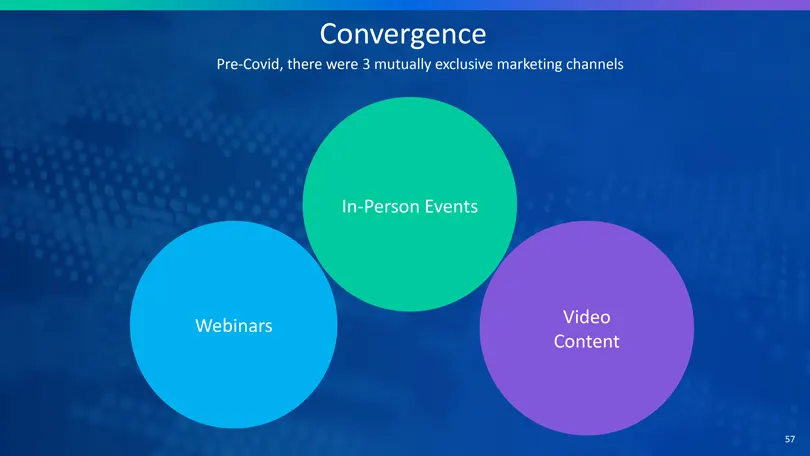
Convergence Pre-Covid, there were 3 mutually exclusive marketing channels In-Person Events Webinars Video Content
Slide 58: Convergence
Convergence Pre-Covid, there were 3 mutually exclusive marketing channels Live Engagement
Slide 59: Deeper Engagement = Accelerated Pipeline
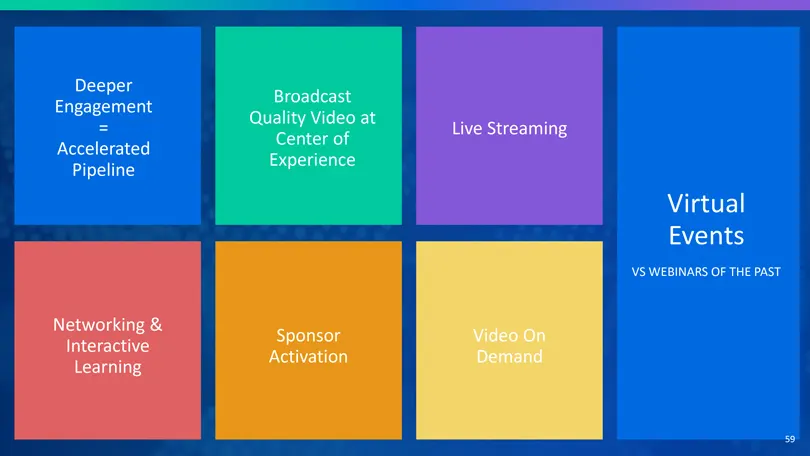
Deeper Engagement = Accelerated Pipeline Broadcast Quality Video at Center of Experience Live Streaming Networking & Interactive Learning Sponsor Activation Video On Demand Virtual Events VS WEBINARS OF THE PAST
Slide 60: Total Event Program (TEP)
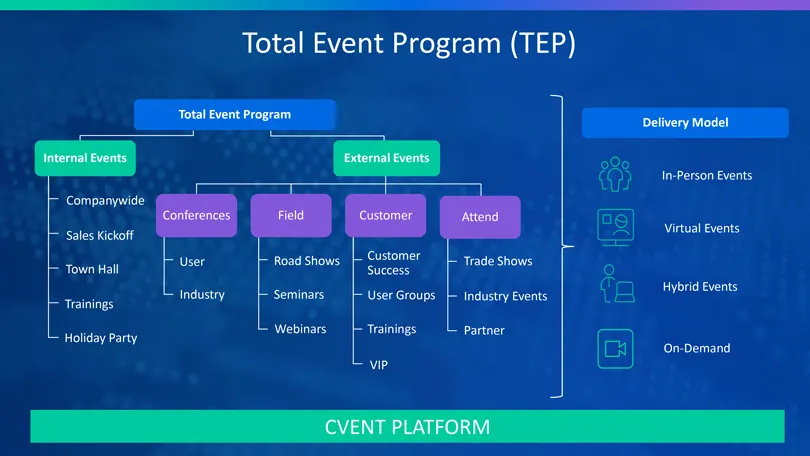
Total Event Program (TEP) Total Event Program Internal Events External Events Companywide Sales Kickoff Town Hall Trainings Holiday Party Conferences User Industry Field Road Shows Seminars Webinars Customer Customer Success User Groups Trainings VIP Attend Trade Shows Industry Events Partner Delive
Slide 61: Platform for Management of Full Event Lifecycle
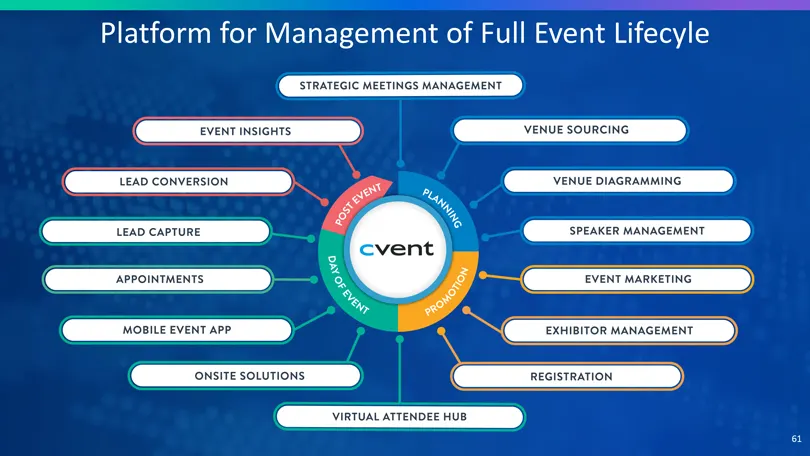
Platform for Management of Full Event Lifecyle
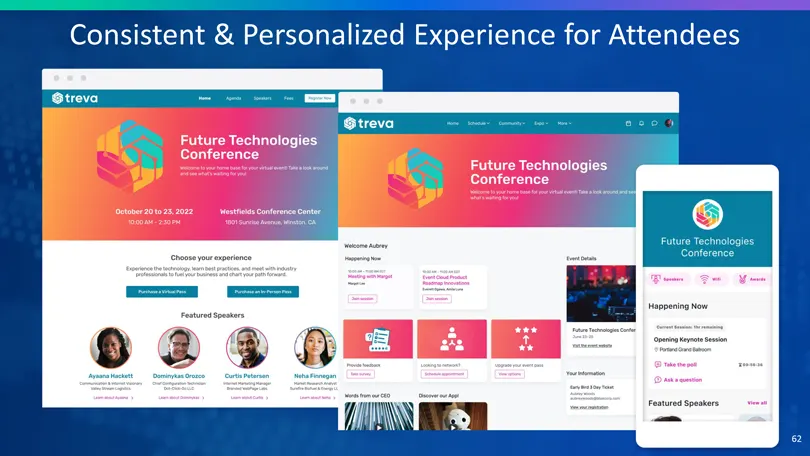
Slide 62: Consistent & Personalized Experience for Attendees
Consistent & Personalized Experience for Attendees
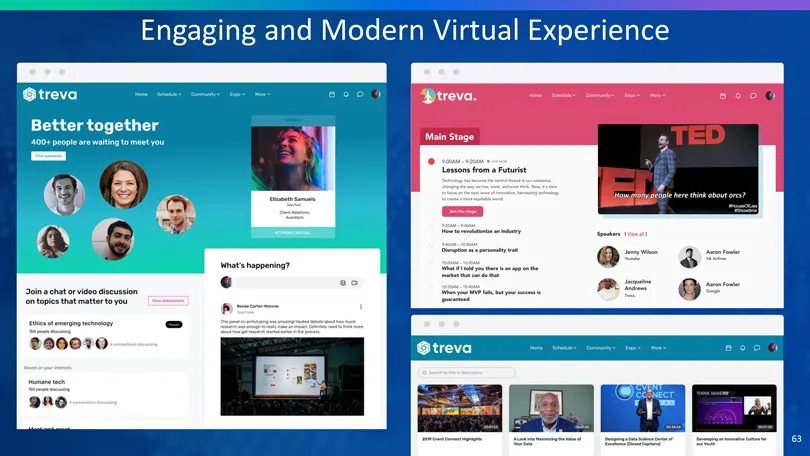
Slide 63: Engaging and Modern Virtual Experience
Engaging and Modern Virtual Experience
Slide 64: Cvent Studio
Cvent Studio A major leap forward in web-based, live stream production
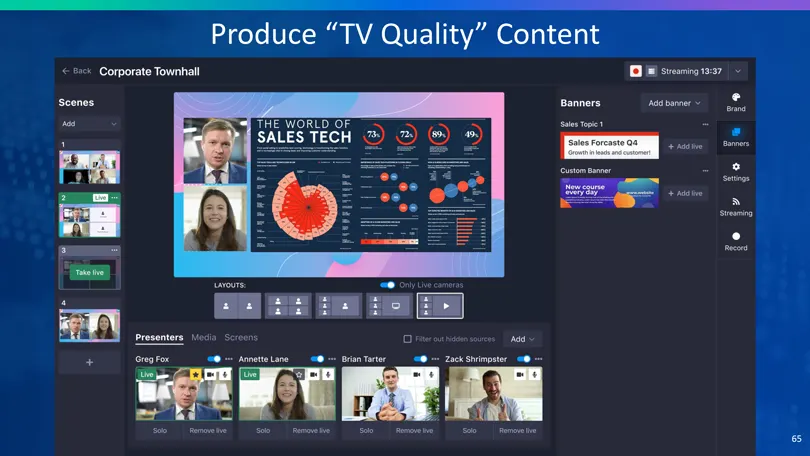
Slide 65: Produce TV Quality Content
Produce “TV Quality” Content
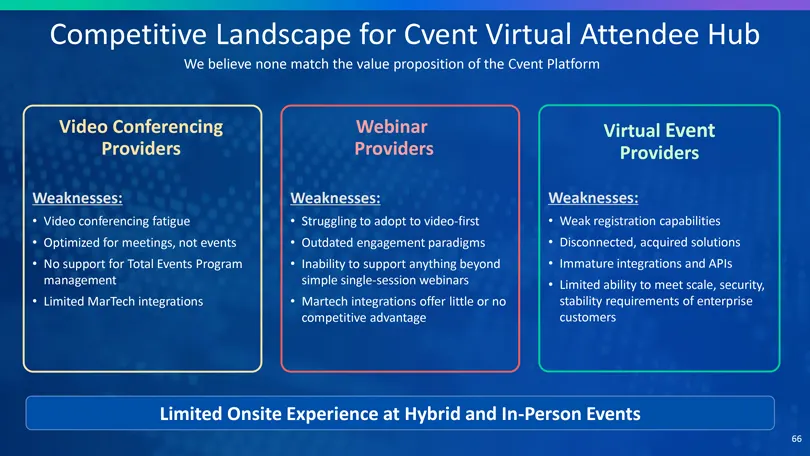
Slide 66: Competitive Landscape for Cvent Virtual Attendee Hub
Competitive Landscape for Cvent Virtual Attendee Hub We believe none match the value proposition of the Cvent Platform Video Conferencing Providers Weaknesses: Video conferencing fatigue Optimized for meetings, not events No support for Total Events Program management Limited MarTech integrations We
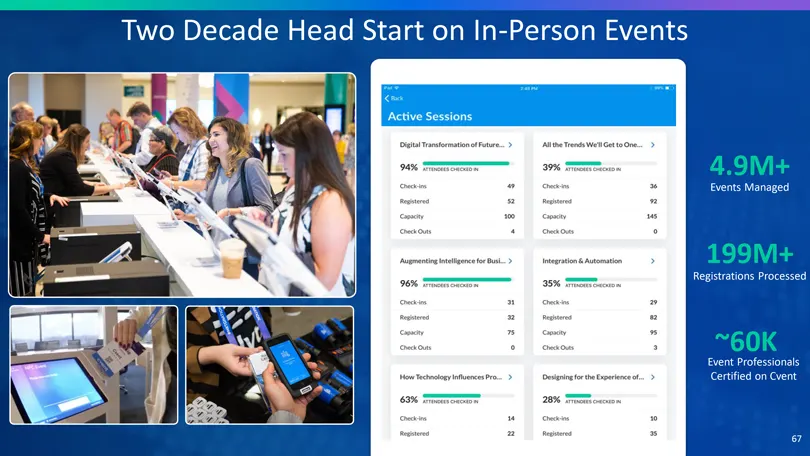
Slide 67: Two Decade Head Start on In-Person Events
Two Decade Head Start on In-Person Events .9M+ ents Managed 199M+ rations Processed ~60K ent Professionals rtified on Cvent
Slide 68: Question: Integrations with CRM and marketing technologies
QUESTION: On the integrations front, what data does Cvent send to or get back from CRM or marketing technologies?
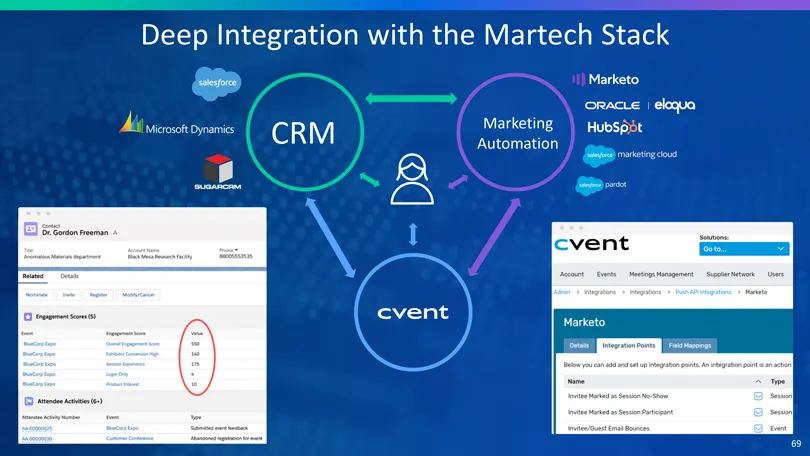
Slide 69: Deep Integration with the Martech Stack
Deep Integration with the Martech Stack
Slide 70: How We Monetize the Event Cloud
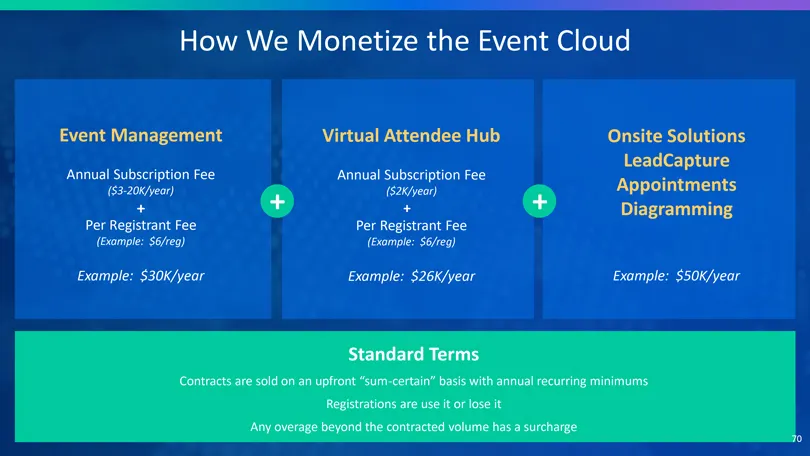
How We Monetize the Event Cloud Event Management Annual Subscription Fee ($3-20K/year) + Per Registrant Fee (Example: $6/reg) Example: $30K/year Virtual Attendee Hub Annual Subscription Fee ($2K/year) + Per Registrant Fee (Example: $6/reg) Example: $26K/year Onsite Solutions LeadCapture Appointments
Slide 71: One Comprehensive Platform vs Event Tech Landscape
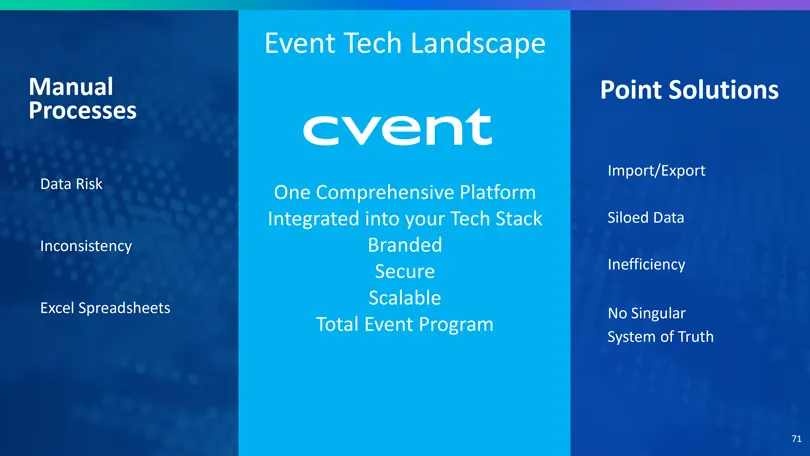
Manual Processes Data Risk Inconsistency Excel Spreadsheets Event Tech Landscape One Comprehensive Platform Integrated into your Tech Stack Branded Secure Scalable Total Event Program Point Solutions Import/Export Siloed Data Inefficiency No Singular System of Truth
Slide 72: Question: Why can't someone else build a similar platform in 6 months?
QUESTION: Why can’t someone else build a similar platform in 6 months?
Slide 73: Future Opportunities
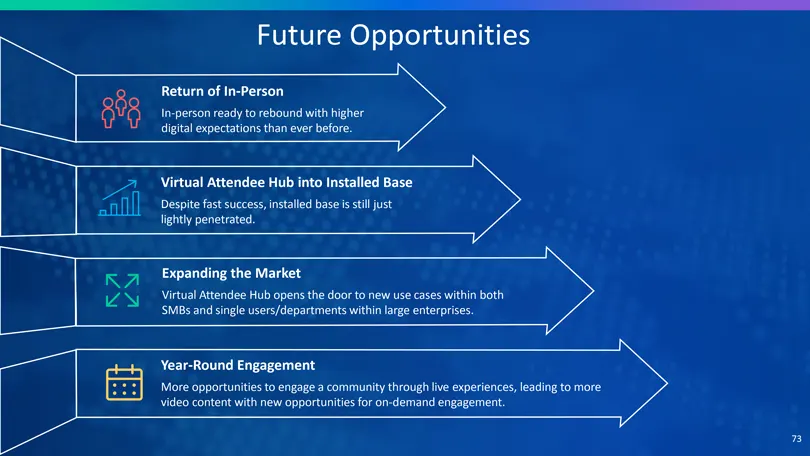
Future Opportunities Return of In-Person In-person ready to rebound with higher digital expectations than ever before. Virtual Attendee Hub into Installed Base Despite fast success, installed base is still just lightly penetrated. Expanding the Market Virtual Attendee Hub opens the door to new use c
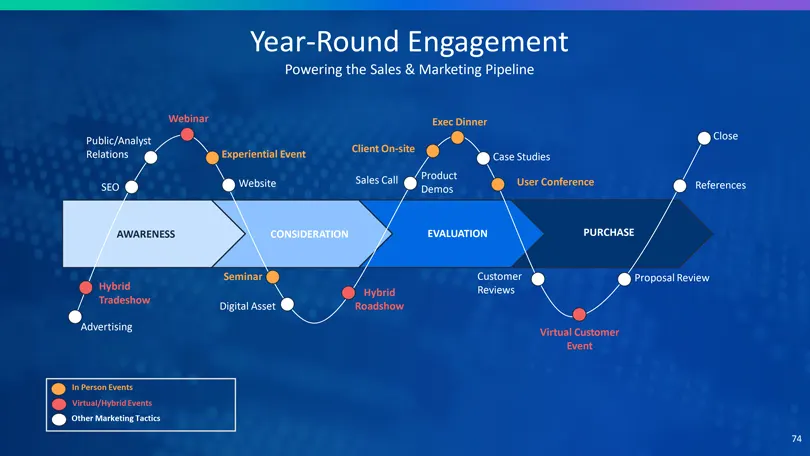
Slide 74: Year-Round Engagement Powering the Sales & Marketing Pipeline
Year-Round Engagement Powering the Sales & Marketing Pipeline Webinar Exec Dinner Close Public/Analyst Client On-site Relations Experiential Event Case Studies Product Website Sales Call User Conference SEO Demos References AWARENESS CONSIDERATION EVALUATION PURCHASE Seminar Customer Proposal Review
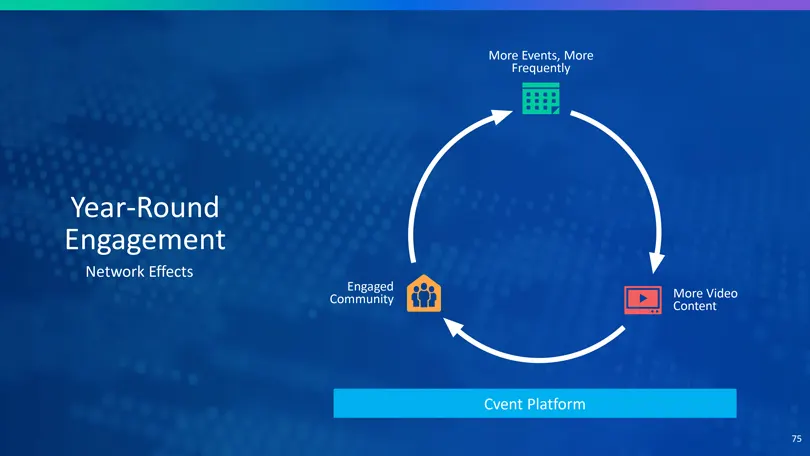
Slide 75: Year-Round Engagement Network Effects
Year-Round Engagement Network Effects More Events, More Frequently Engaged Community More Video Content Cvent Platform
Slide 76: Platform & Technology: HC Platform and Differentiation
Platform & Technology Go-To-Market People & Culture HC Platform and Differentiation
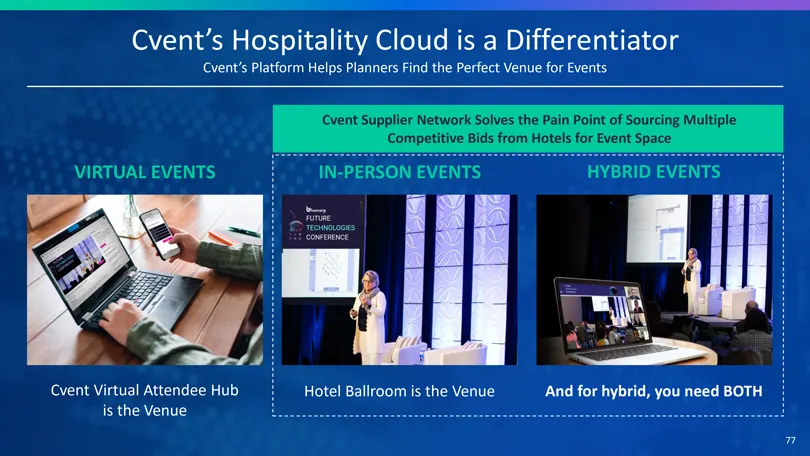
Slide 77: Cvent's Hospitality Cloud is a Differentiator
Cvent’s Hospitality Cloud is a Differentiator Cvent’s Platform Helps Planners Find the Perfect Venue for Events Cvent Supplier Network Solves the Pain Point of Sourcing Multiple Competitive Bids from Hotels for Event Space VIRTUAL EVENTS Cvent Virtual Attendee Hub is the Venue IN-PERSON EVENTS HYBRI
Slide 78: Online Marketing Solutions
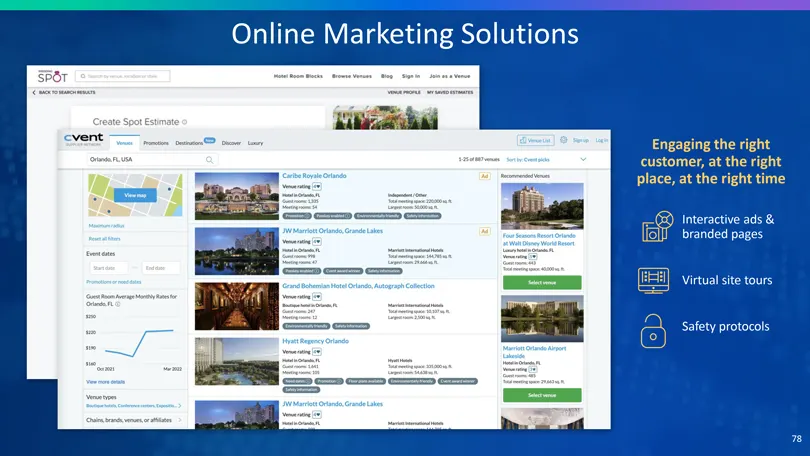
Online Marketing Solutions Engaging the right customer, at the right place, at the right time Interactive ads & branded pages Virtual site tours Safety protocols
Slide 79: Hospitality Cloud Business Has Evolved
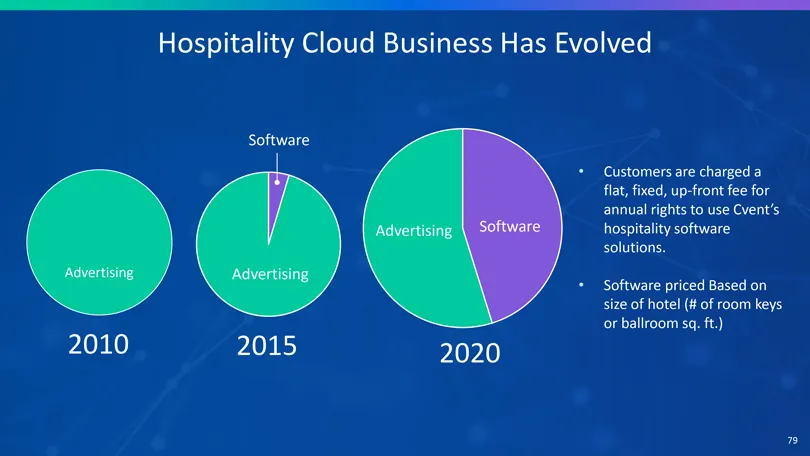
Hospitality Cloud Business Has Evolved Advertising 2010 Software Advertising 2015 Advertising Software 2020 Customers are charged a flat, fixed, up-front fee for annual rights to use Cvent’s hospitality software solutions. Software priced Based on size of hotel (# of room keys or ballroom sq. ft.)
Slide 80: Software Solutions
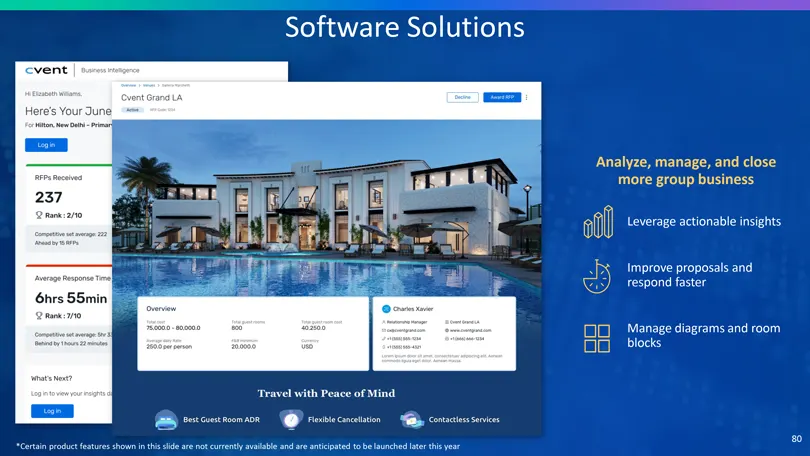
Software Solutions Analyze, manage, and close more group business Leverage actionable insights Improve proposals and respond faster Manage diagrams and room blocks *Certain product features shown in this slide are not currently available and are anticipated to be launched later this year
Slide 81: Software Solutions
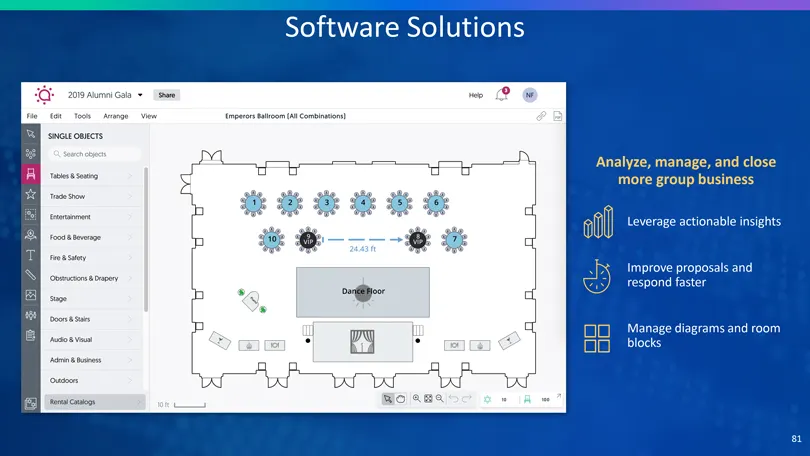
Software Solutions Analyze, manage, and close more group business Leverage actionable insights Improve proposals and respond faster Manage diagrams and room blocks
Slide 82: Breadth and Depth of Suppliers & Users
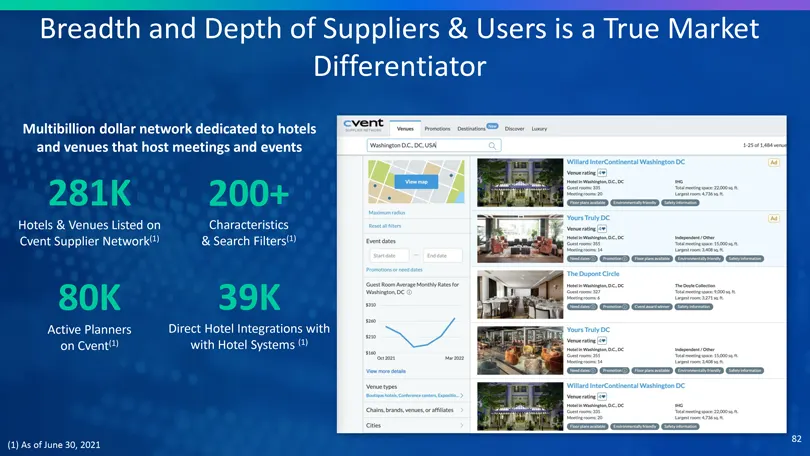
Breadth and Depth of Suppliers & Users is a True Market Differentiator Multibillion dollar network dedicated to hotels and venues that host meetings and events 281K 200+ Hotels & Venues Listed on Characteristics Cvent Supplier Network(1) & Search Filters(1) 80K 39K Active Planners Direct Hotel Integ
Slide 83: Cvent Hospitality Cloud is Embedded in the Events Space
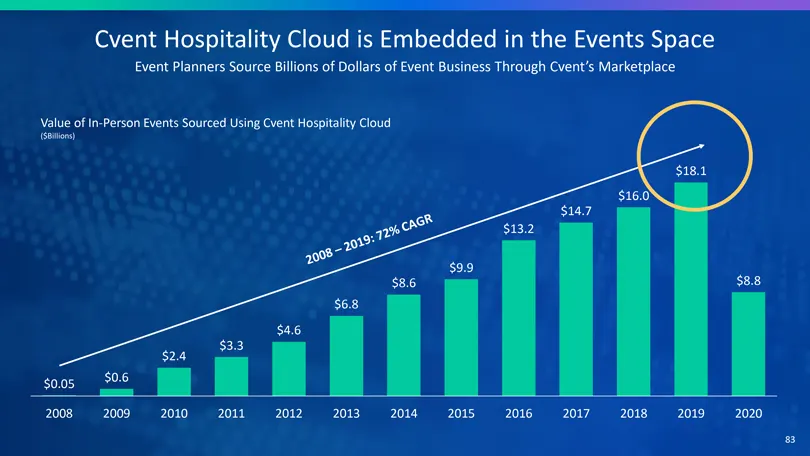
Cvent Hospitality Cloud is Embedded in the Events Space Event Planners Source Billions of Dollars of Event Business Through Cvent’s Marketplace Value of In-Person Events Sourced Using Cvent Hospitality Cloud ($Billions) $18.1 $16.0 $14.7 $13.2 $9.9 $8.6 $8.8 $6.8 $4.6 $3.3 $2.4 $0.6 $0.05 2008 2009
Slide 84: How We Monetize the Hospitality Cloud – Online Marketing Solutions
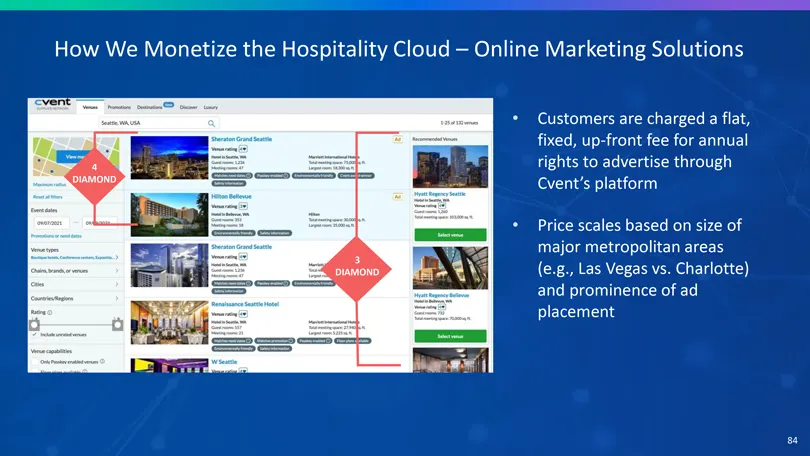
How We Monetize the Hospitality Cloud – Online Marketing Solutions Customers are charged a flat, fixed, up-front fee for annual rights to advertise through Cvent’s platform Price scales based on size of major metropolitan areas (e.g., Las Vegas vs. Charlotte) and prominence of ad placement
Slide 85: How We Monetize the Hospitality Cloud – Software Solutions
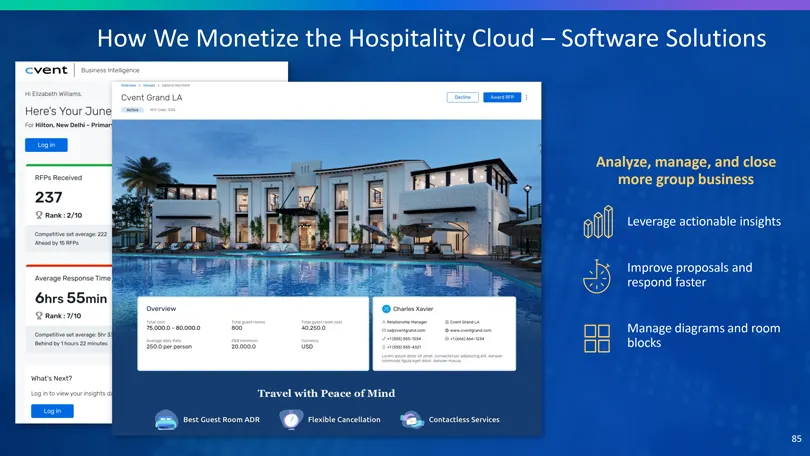
How We Monetize the Hospitality Cloud – Software Solutions Analyze, manage, and close more group business Leverage actionable insights Improve proposals and respond faster Manage diagrams and room blocks
Slide 86: Hospitality Cloud Competition – Online Marketing Solutions
Hospitality Cloud Competition – Online Marketing Solutions Many of the networks we compete against are smaller in RFP Volume and many are more geographically-focused (1) Many competitors do not offer a sourcing network and full event marketing and management platform to the scale of Cvent, so their
Slide 87: Hospitality Cloud Competition – Software Solutions
Hospitality Cloud Competition – Software Solutions We compete against hotels’ home-grown solutions and third-party point solutions (1) Market leaders in room block management, event diagramming and corporate rate solutions, so our solutions benefit from market awareness and ongoing customer input (1
Slide 88: Sustainable Competitive Differentiation
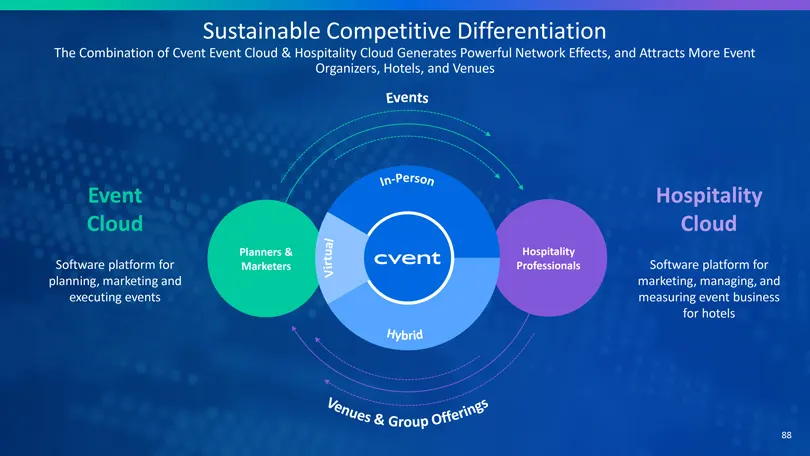
Sustainable Competitive Differentiation The Combination of Cvent Event Cloud & Hospitality Cloud Generates Powerful Network Effects, and Attracts More Event Organizers, Hotels, and Venues Event Cloud Software platform for planning, marketing and executing events Planners & Marketers Hospitality Prof
Slide 89: Questions: Leverage in the hospitality industry
QUESTIONS: Do large event planning providers like Cvent now have more leverage in the hospitality industry that is still strained for business travel and large corporate events given the visibility and scale of the platform? How is this playing out in the market at the moment?
Slide 90: Questions: Which geographies are next?
QUESTIONS: Which geographies are next? What are the challenges?
Slide 91: Go-To-Market Strategy
Platform & Technology Go-To-Market People & Culture GO TO MARKET STRATEGY
Slide 92: Go-To-Market Marketing and Sales Overview
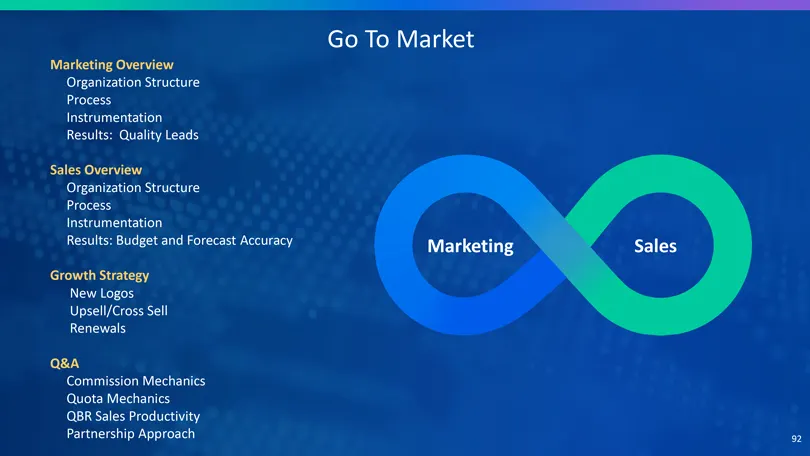
Marketing Overview Organization Structure Process Instrumentation Results: Quality Leads Sales Overview Organization Structure Process Instrumentation Results: Budget and Forecast Accuracy Growth Strategy New Logos Upsell/Cross Sell Renewals Q&A Commission Mechanics Quota Mechanics QBR Sales Product
Slide 93: Growth Strategy
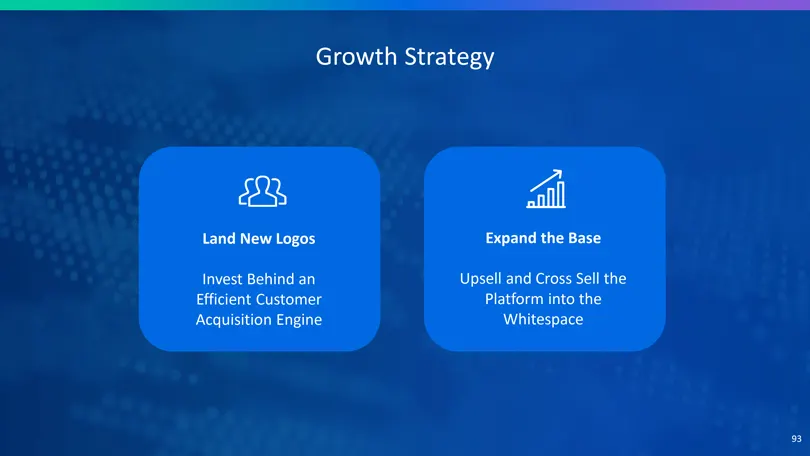
Growth Strategy Land New Logos Invest Behind an Efficient Customer Acquisition Engine Expand the Base Upsell and Cross Sell the Platform into the Whitespace
Slide 94: Marketing Sales Growth Strategy: Marketing
Marketing Sales Growth Strategy Marketing
Slide 95: Marketing Organization Structure
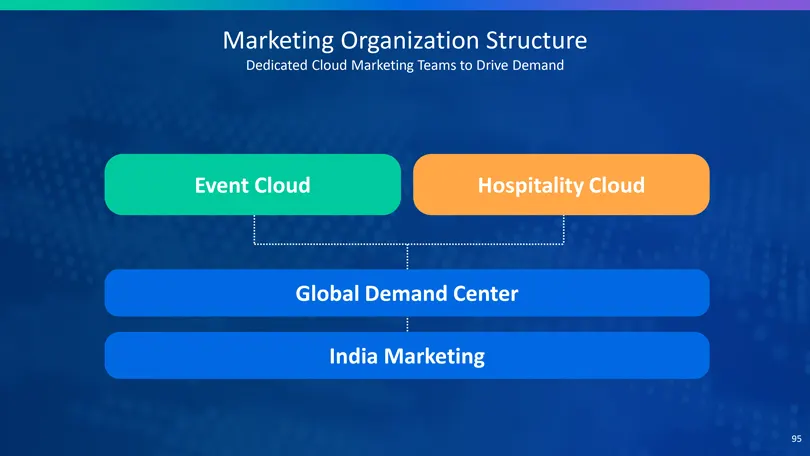
Marketing Organization Structure Dedicated Cloud Marketing Teams to Drive Demand Event Cloud Hospitality Cloud Global Demand Center India Marketing
Slide 96: Marketing Process: Demand Waterfall
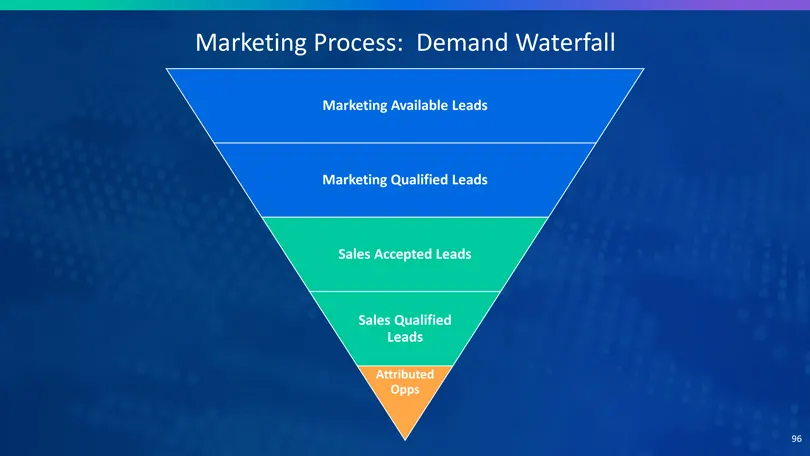
Marketing Process: Demand Waterfall Marketing Available Leads Marketing Qualified Leads Sales Accepted Leads Sales Qualified Leads Attributed Opps
Slide 97: Marketing Instrumentation: Budget vs. Actual
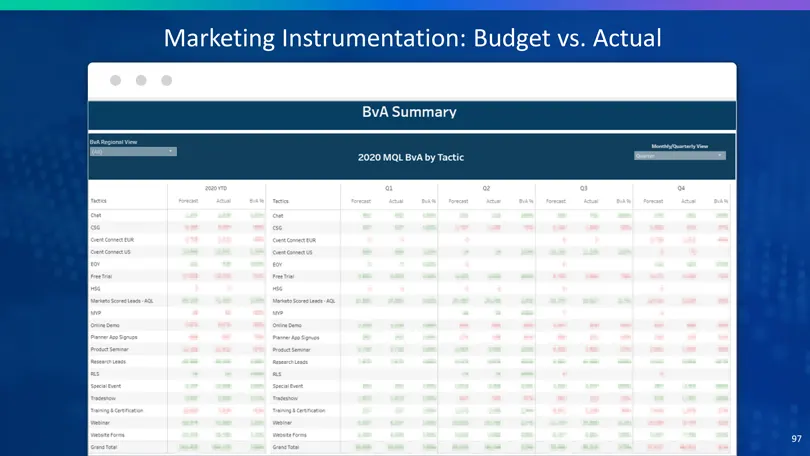
Marketing Instrumentation: Budget vs. Actual
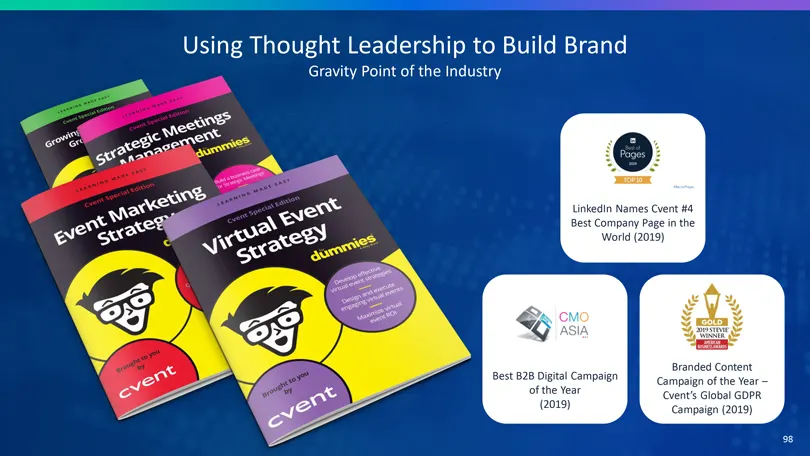
Slide 98: Leadership to Build Brand
Leadership to Build Brand ity Point of the Industry LinkedIn Names Cvent #4 Best Company Page in the World (2019) Best B2B Digital Campaign of the Year (2019) Branded Content Campaign of the Year –Cvent’s Global GDPR Campaign (2019)
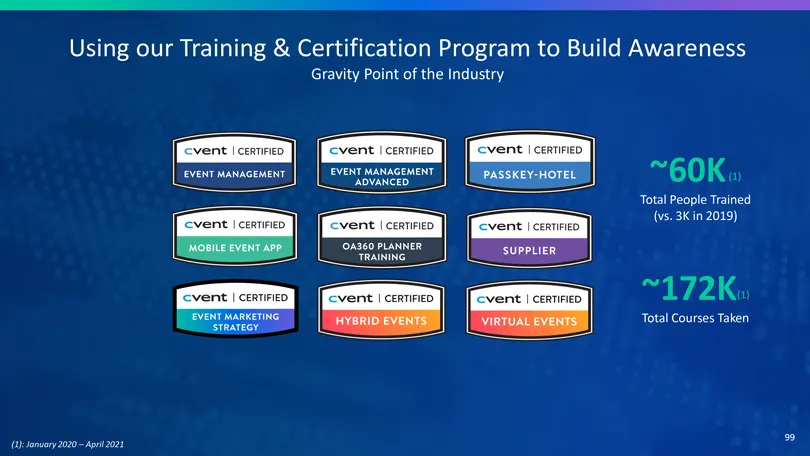
Slide 99: Using our Training & Certification Program to Build Awareness
Using our Training & Certification Program to Build Awareness Gravity Point of the Industry ~60K(1) Total People Trained (vs. 3K in 2019) ~172K(1) Total Courses Taken (1): January 2020 – April 2021
Slide 100: Hundreds of Thousands of Customer Listening Points
Hundreds of Thousands of Customer Listening Points Gravity Point of the Industry ~100K Users (1) (1) July 2019 – September 2021
Slide 101: Marketing
Marketing
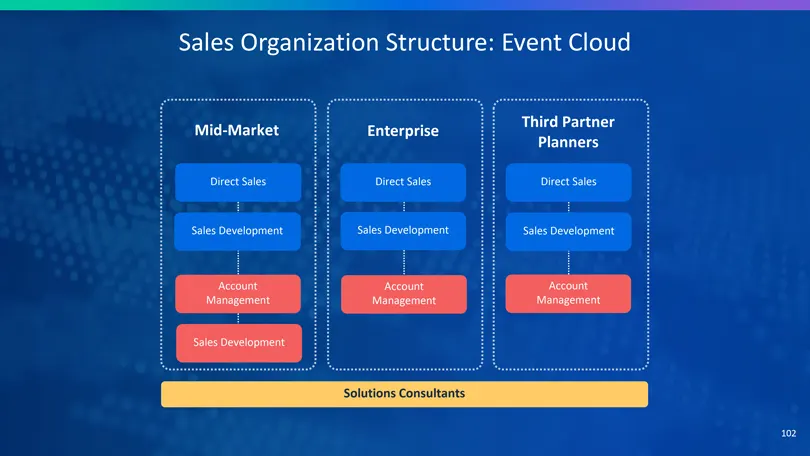
Slide 102: Sales Organization Structure: Event Cloud
Sales Organization Structure: Event Cloud Third Partner Planners Solutions Consultants 102
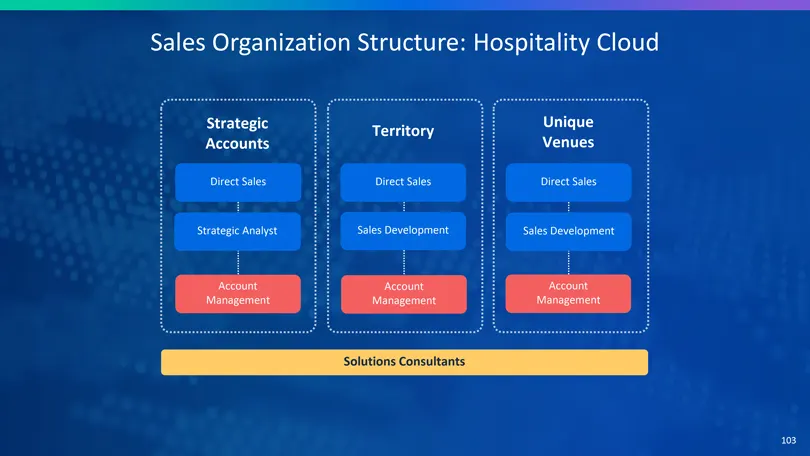
Slide 103: Sales Organization Structure: Hospitality Cloud
Sales Organization Structure: Hospitality Cloud Strategic Unique Territory Accounts Venues Solutions Consultant 103
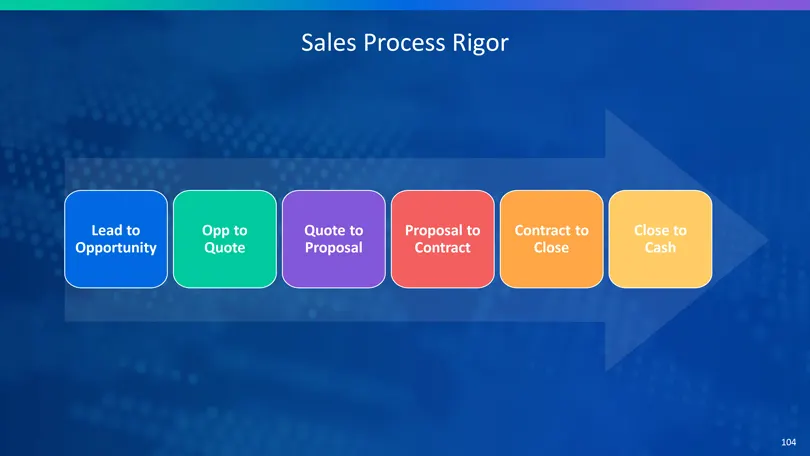
Slide 104: Sales Process Rigor
Sales Process Rigor
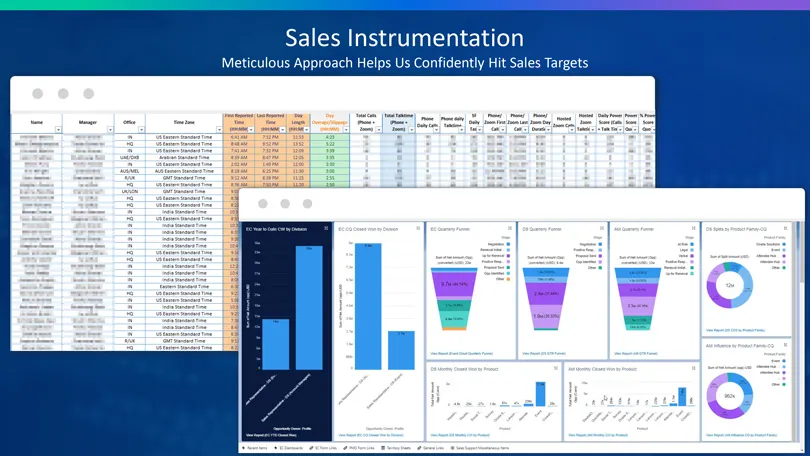
Slide 105: Sales Instrumentation
Sales Instrumentation Meticulous Approach Helps Us Confidently Hit Sales Targets
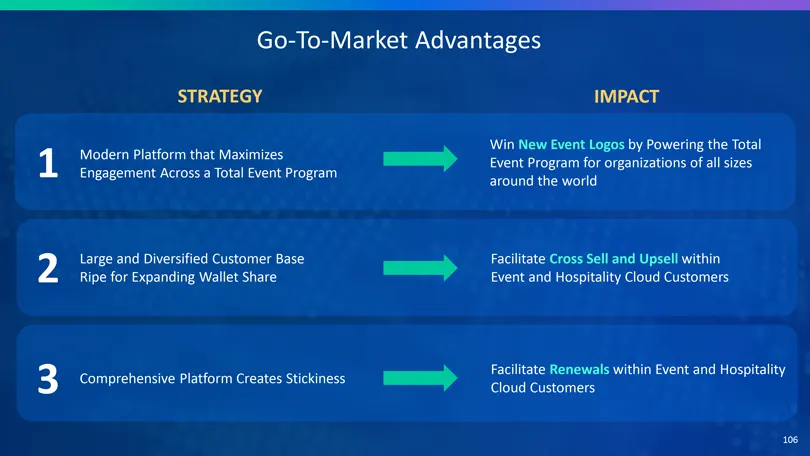
Slide 106: Go-To-Market Advantages
Go-To-Market Advantages STRATEGY 1 Modern Platform that Maximizes Engagement Across a Total Event Program 2 Large and Diversified Customer Base Ripe for Expanding Wallet Share J comprehensive Platform Creates Stickiness J | | IMPACT Win New Event Logos by Powering the Total Event Program for organiz
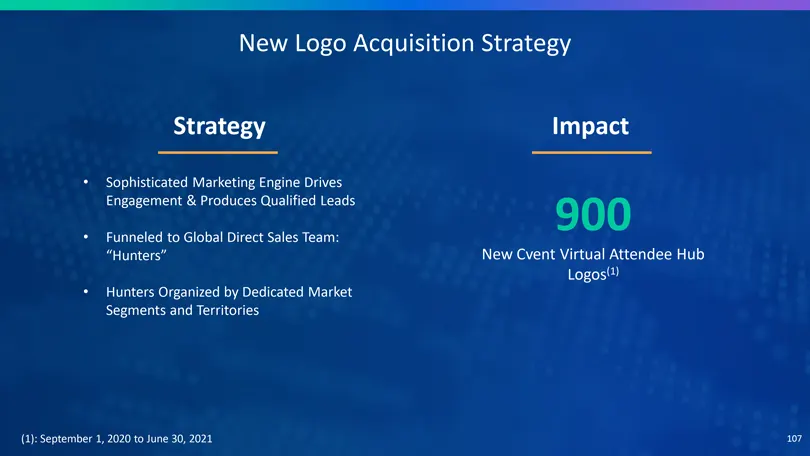
Slide 107: New Logo Acquisition Strategy
New Logo Acquisition Strategy Strategy Impact + Sophisticated Marketing Engine Drives Engagement & Produces Qualified Leads 9 0 (0) * Funneled to Global Direct Sales Team: “Hunters” New Cvent Virtual Attendee Hub Logos?) + Hunters Organized by Dedicated Market Segments and Territories (1): September
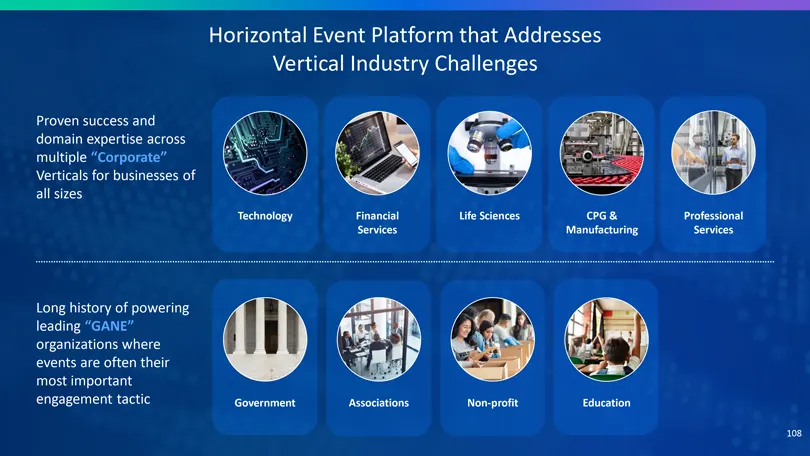
Slide 108: Horizontal Event Platform that Addresses Vertical Industry Challenges
Horizontal Event Platform that Addresses Vertical Industry Challenges Proven success and x domain expertise across \ e multiple “Corporate” ’ Verticals for businesses of i lp all sizes Technology Financial Professional Services Manufacturing Services Long history of powering leading “GANE” organizat
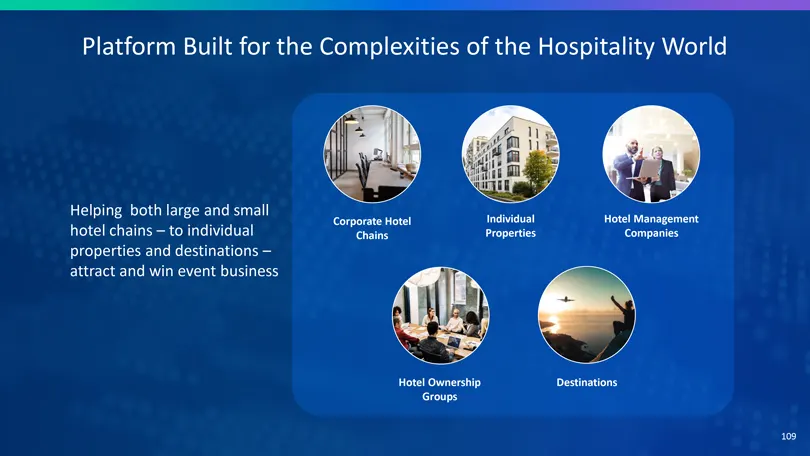
Slide 109: Platform Built for the Complexities of the Hospitality World
Platform Built for the Complexities of the Hospitality World Helping both large and small atte ce ee EEA hotel chains — to individual Gis Properties Companies properties and destinations — attract and win event business Hotel Ownership Destinations Groups 109
Slide 110: Solutions Targeting Multiple Personas
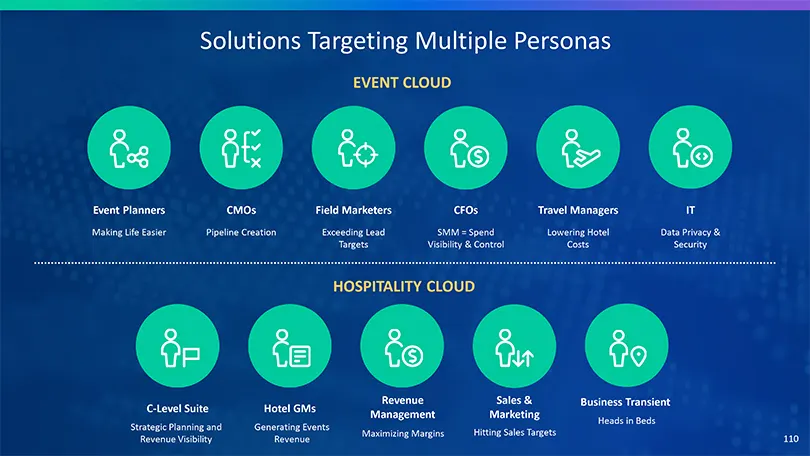
Solutions Targeting Multiple Personas EVENT CLOUD Event Planners. cmos Field Marketers Fos ‘Travel Managers 7 Making Ue Easier Pipeline Creation xceecing Lead SMM = Spend Lowering Hotel Data Privacy & Tete isibilty & Conte Costs Seeutty HOSPITALITY CLOUD. Level Suite Hotel GMs eo Strategie Planning
Slide 111: Large, Diversified, and Global Customer Base
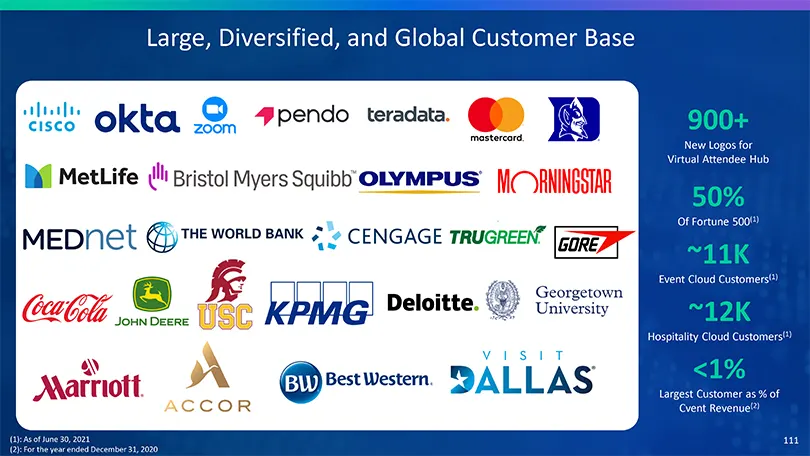
Large, Diversified, and Global Customer Base 900+ New Logos for Virtual Attendee Hub 50% Of Fortune 500(1) ~11K Event Cloud Customers(1) ~12K Hospitality Cloud Customers(1) <1% Largest Customer as % of Cvent Revenue(2) (1): As of June 30, 2021 111 (2): For the year ended December 31, 2020
Slide 112: Upsell and Cross Sell: Driven by Continued Innovation
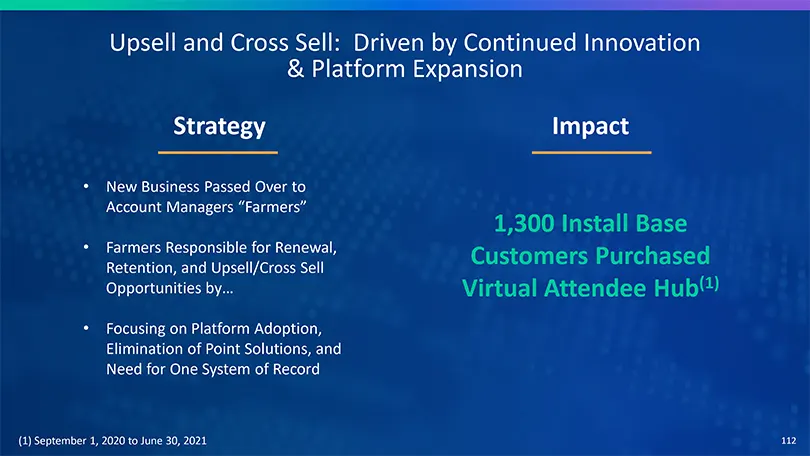
Upsell and Cross Sell: Driven by Continued Innovation & Platform Expansion Strategy Impact New Business Passed Over to Account Managers “Farmers” 1,300 Install Base Farmers Responsible for Renewal, Customers Purchased Retention, and Upsell/Cross Sell Opportunities by… Virtual Attendee Hub(1) Focusin
Slide 113: Case Study: Cross Selling Our Virtual Events Platform
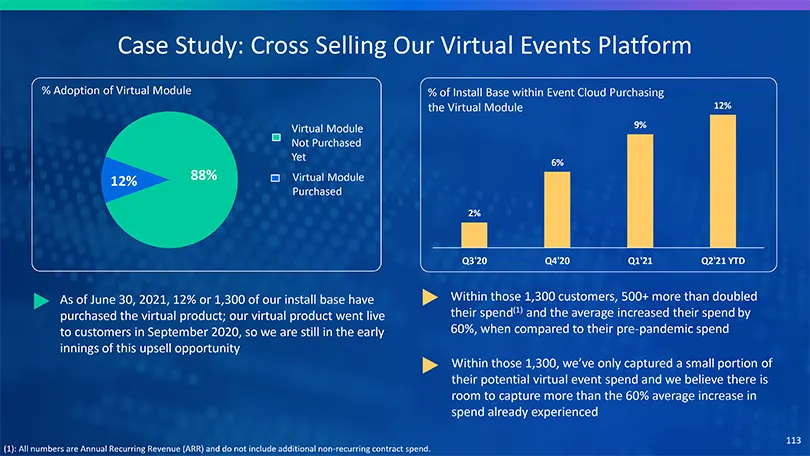
Case Study: Cross Selling Our Virtual Events Platform % Adoption of Virtual Module % of Install Base within Event Cloud Purchasing the Virtual Module 12% Virtual Module 9% Not Purchased Yet 6% 88% Virtual Module 12% Purchased 2% Q3’20 Q4’20 Q1’21 Q2’21 YTD As of June 30, 2021, 12% or 1,300 of our in
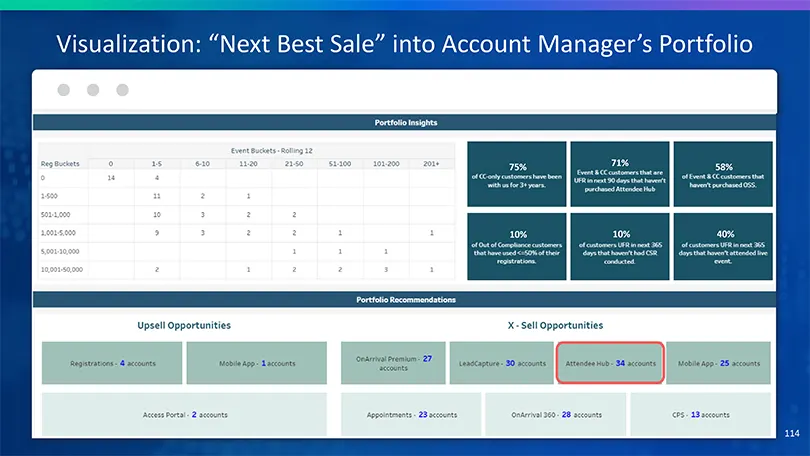
Slide 114: Visualization: Next Best Sale
Visualization: “Next Best Sale” into Account Manager’s Portfolio 71% 75% 58% 10% 10% 40%
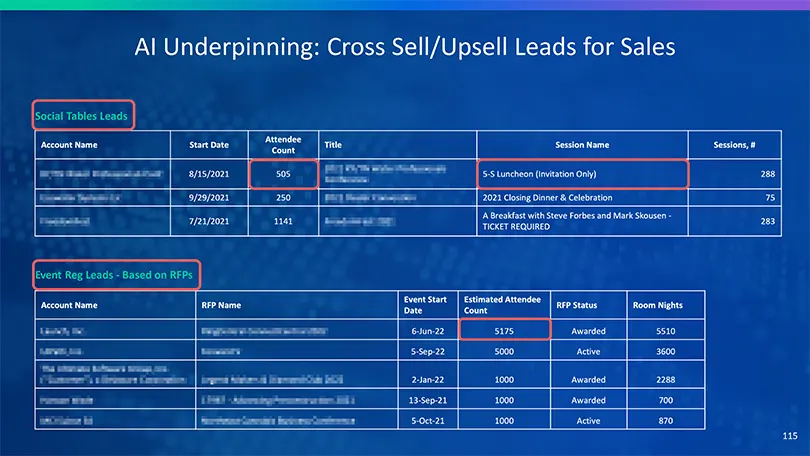
Slide 115: AI Underpinning: Cross Sell/Upsell Leads for Sales
AI Underpinning: Cross Sell/Upsell Leads for Sales Social Tables Leads Event Reg Leads—Based on RFPs
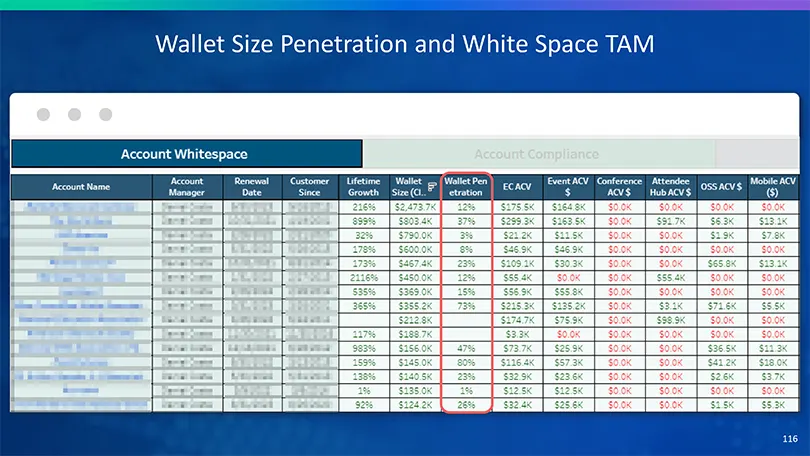
Slide 116: Wallet Size Penetration and White Space TAM
Wallet Size Penetration and White Space TAM
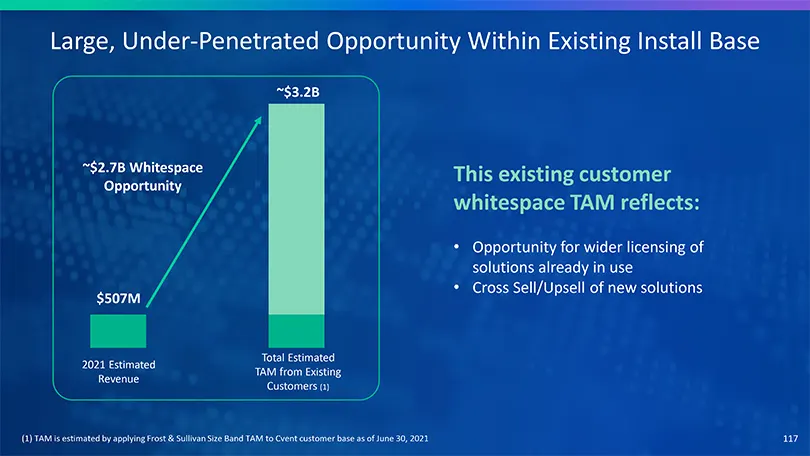
Slide 117: Large, Under-Penetrated Opportunity Within Existing Install Base
Large, Under-Penetrated Opportunity Within Existing Install Base ~$3.2B ~$2.7B Whitespace This existing customer Opportunity whitespace TAM reflects: Opportunity for wider licensing of solutions already in use Cross Sell/Upsell of new solutions $507M Total Estimated 2021 Estimated TAM from Existing
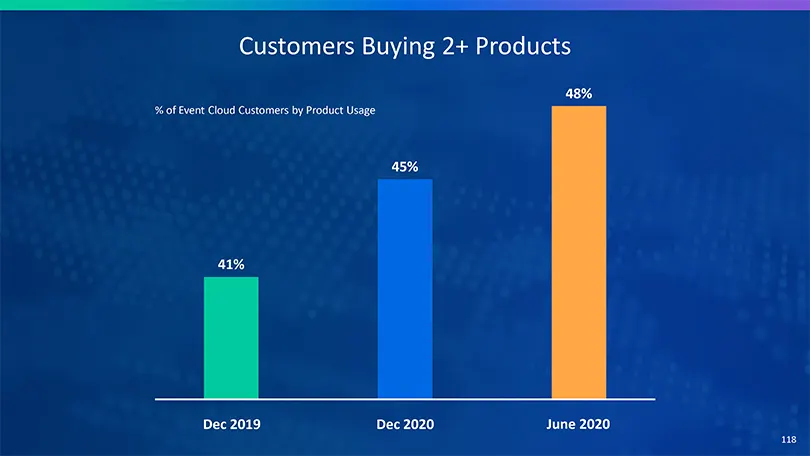
Slide 118: Customers Buying 2+ Products
Customers Buying 2+ Products 48% % of Event Cloud Customers by Product Usage 45% 41% Dec 2019 Dec 2020 June 2020
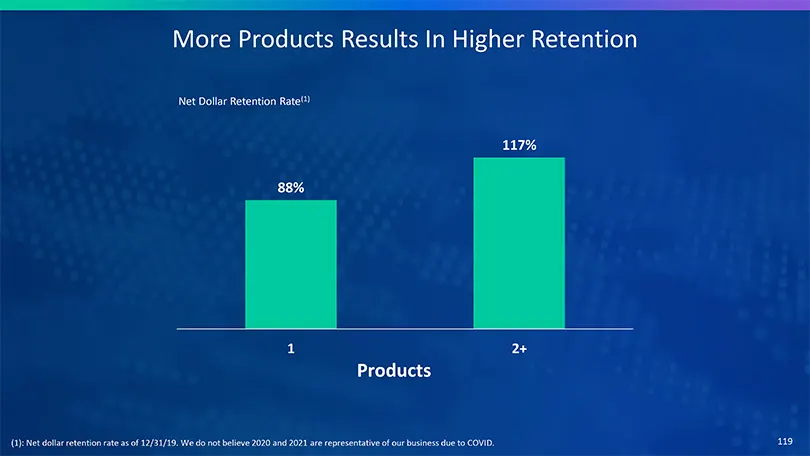
Slide 119: More Products Results In Higher Retention
More Products Results In Higher Retention Net Dollar Retention Rate(1) 117% 88% 1 2+ Products (1): Net dollar retention rate as of 12/31/19. We do not believe 2020 and 2021 are representative of our business due to COVID.
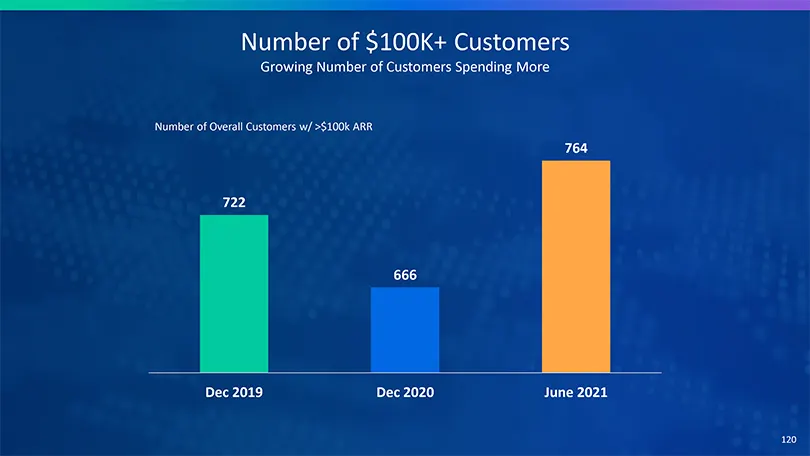
Slide 120: Number of $100K+ Customers Growing
Number of $100K+ Customers Growing Number of Customers Spending More Number of Overall Customers w/ >$100k ARR 764 722 666 Dec 2019 Dec 2020 June 2021
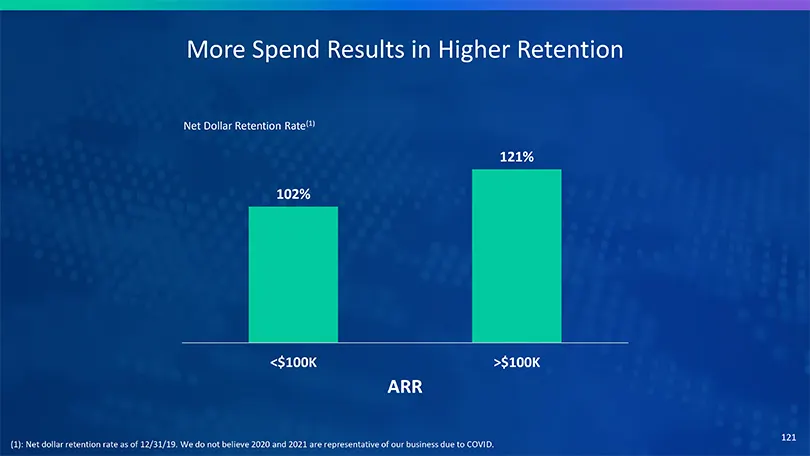
Slide 121: More Spend Results in Higher Retention
More Spend Results in Higher Retention Net Dollar Retention Rate(1) 121% 102% <$100K >$100K ARR (1): Net dollar retention rate as of 12/31/19. We do not believe 2020 and 2021 are representative of our business due to COVID.
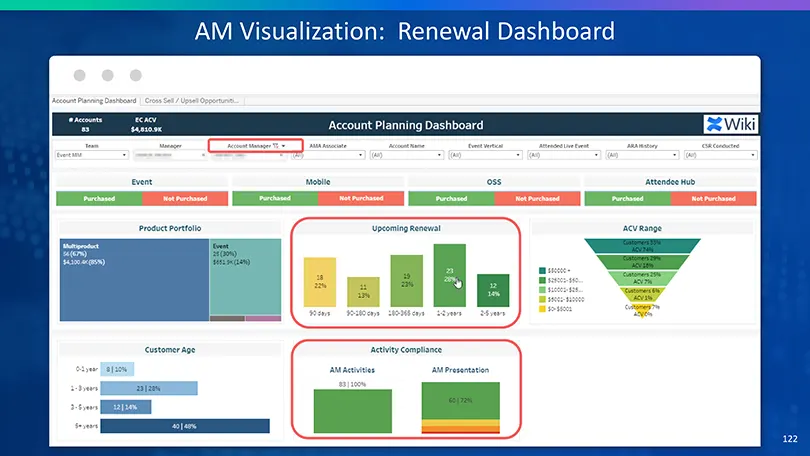
Slide 122: AM Visualization: Renewal Dashboard
AM Visualization: Renewal Dashboard
Slide 123: Questions: How are commission plans structured?
QUESTIONS: How are your commission plans structured? What do they incentivize?
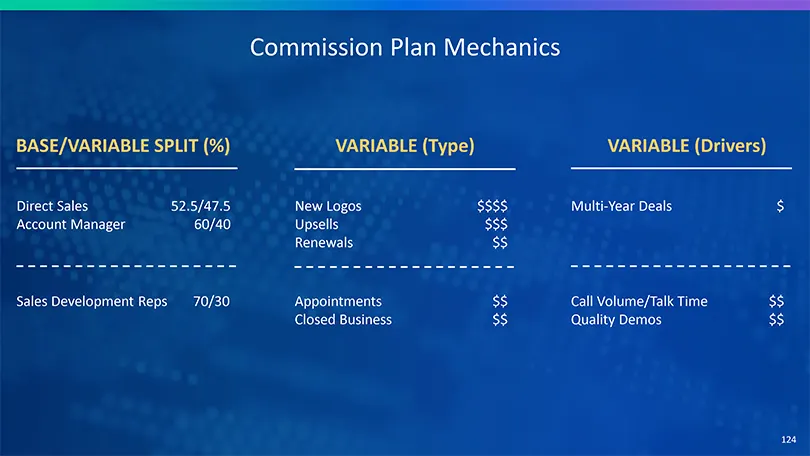
Slide 124: Commission Plan Mechanics
Commission Plan Mechanics BASE/VARIABLE SPLIT (%) VARIABLE (Type) VARIABLE (Drivers) Direct Sales 52.5/47.5 New Logos $$$$ Multi-Year Deals $ Account Manager 60/40 Upsells $$$ Renewals $$ Sales Development Reps 70/30 Appointments $$ Call Volume/Talk Time $$ Closed Business $$ Quality Demos $$
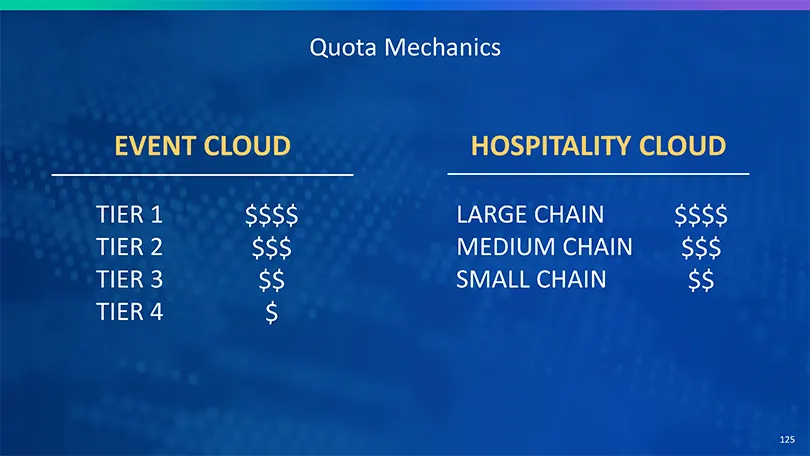
Slide 125: Quota Mechanics
Quota Mechanics EVENT CLOUD HOSPITALITY CLOUD TIER 1 $$$$ LARGE CHAIN $$$$ TIER 2 $$$ MEDIUM CHAIN $$$ TIER 3 $$ SMALL CHAIN $$ TIER 4 $
Slide 126: Questions: How do you think about sales productivity?
QUESTIONS: How do you think about sales productivity?
Slide 127: Quota Bearing Reps Sales Productivity
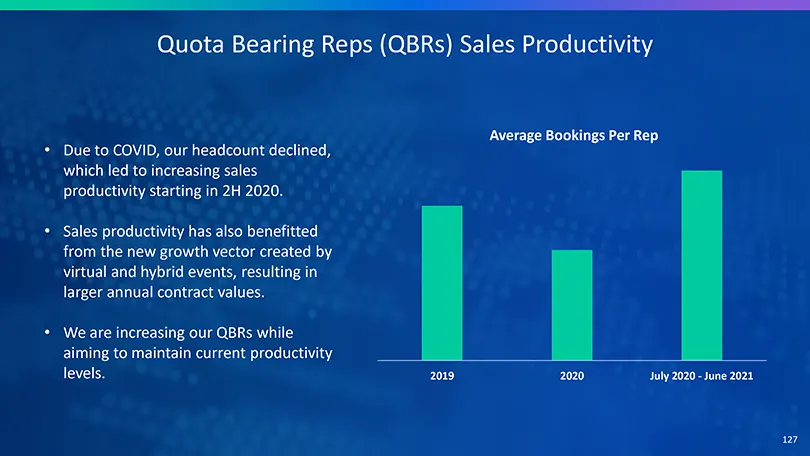
Quota Bearing Reps (QBRs) Sales Productivity Average Bookings Per Rep Due to COVID, our headcount declined, which led to increasing sales productivity starting in 2H 2020. Sales productivity has also benefitted from the new growth vector created by virtual and hybrid events, resulting in larger annu
Slide 128: Questions: What is your partnership strategy?
QUESTIONS: What is your partnership strategy?
Slide 129: Partnerships Extend Our Brand Reach and Influence
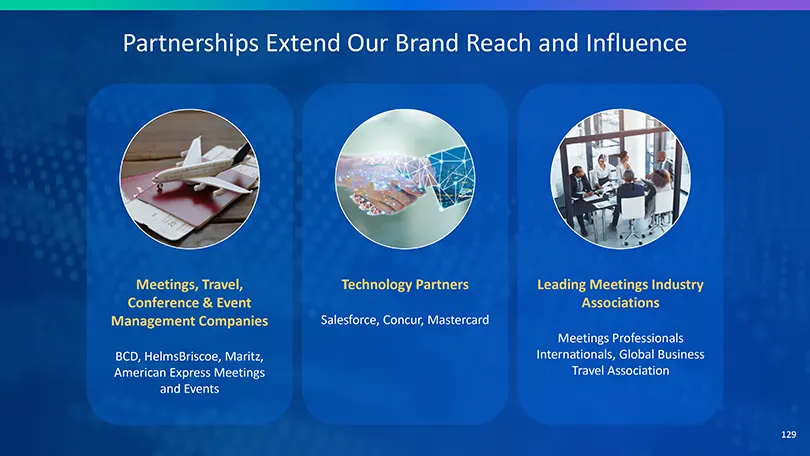
Partnerships Extend Our Brand Reach and Influence Meetings, Travel, Technology Partners Leading Meetings Industry Conference & Event Associations Management Companies Salesforce, Concur, Mastercard Meetings Professionals BCD, HelmsBriscoe, Maritz, Internationals, Global Business American Express Mee
Slide 130: Numerous Growth Vectors Into the Future
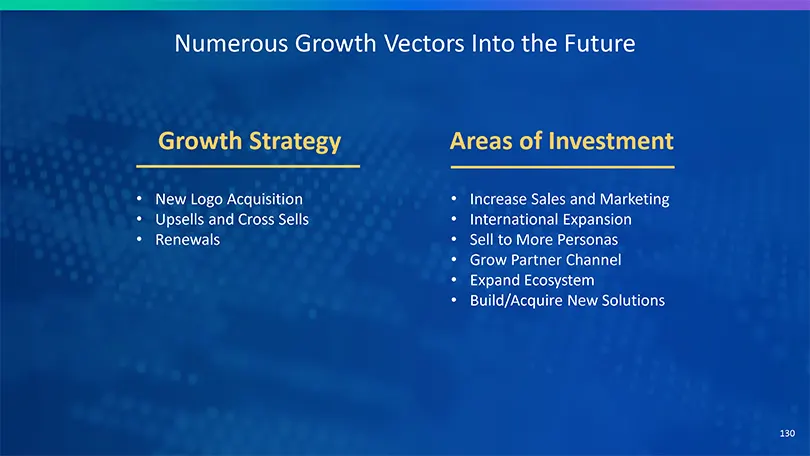
Numerous Growth Vectors Into the Future Growth Strategy Areas of Investment New Logo Acquisition Increase Sales and Marketing Upsells and Cross Sells International Expansion Renewals Sell to More Personas Grow Partner Channel Expand Ecosystem Build/Acquire New Solutions
Slide 131: People & Culture
Platform & Technology Go-To-Market People & Culture PEOPLE & CULTURE
Slide 132: The DNA of Cvent is Our People
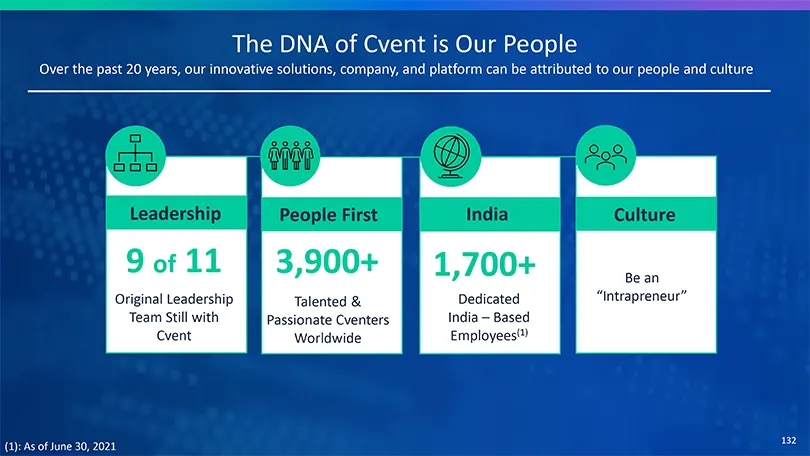
The DNA of Cvent is Our People Over the past 20 years, our innovative solutions, company, and platform can be attributed to our people and culture (1): As of June 30, 2021
Slide 133: Cvent: The Early Years
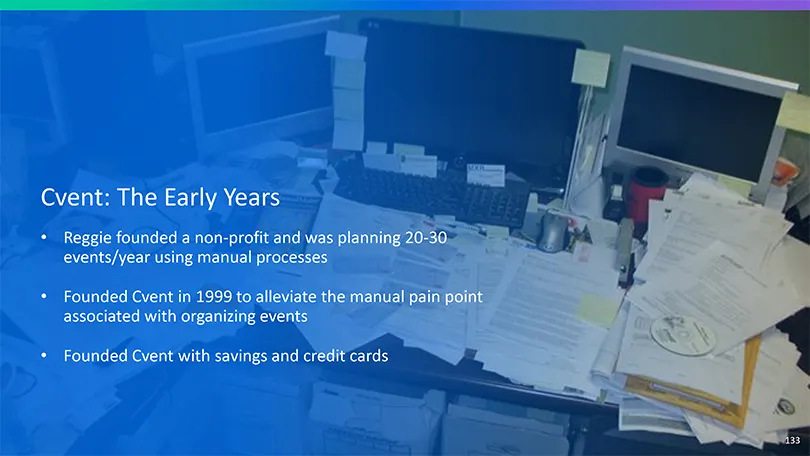
Cvent: The Early Years Reggie founded a non-profit and was planning 20-30 events/year using manual processes Founded Cvent in 1999 to alleviate the manual pain point associated with organizing events Founded Cvent with savings and credit cards
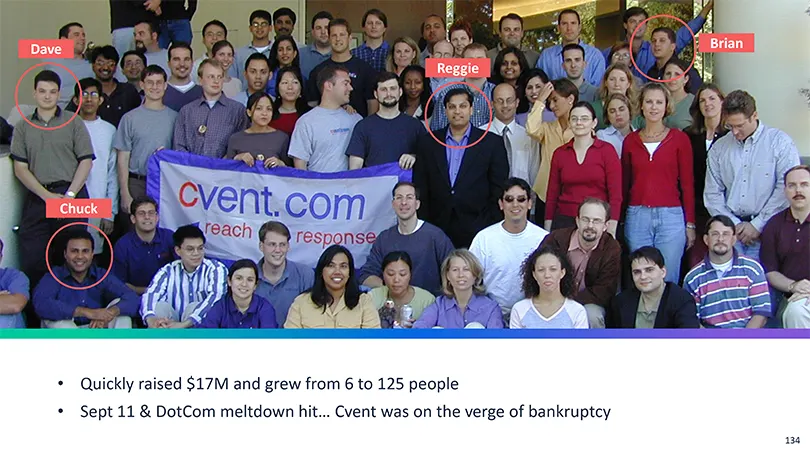
Slide 134: Cvent Early Years: Raised $17M and Near Bankruptcy
Quickly raised $17M and grew from 6 to 125 people Sept 11 & DotCom meltdown hit… Cvent was on the verge of bankruptcy
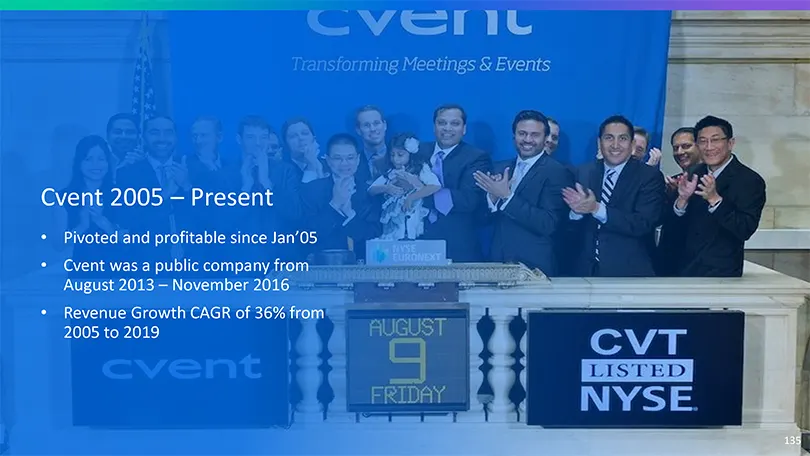
Slide 135: Cvent 2005 – Present
Cvent 2005 – Present Pivoted and profitable since Jan’05 Cvent was a public company from August 2013 – November 2016 Revenue Growth CAGR of 36% from 2005 to 2019
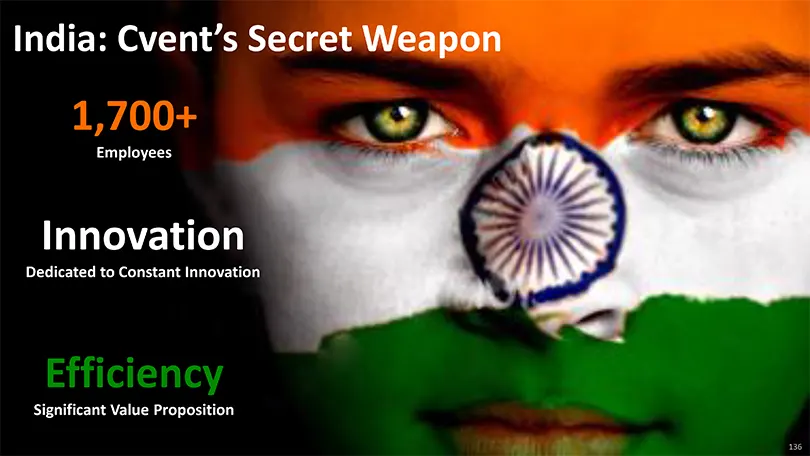
Slide 136: India: Cvent's Secret Weapon
India: Cvent’s Secret Weapon 1,700+ Employees Innovation Dedicated to Constant Innovation Efficiency Significant Value Proposition
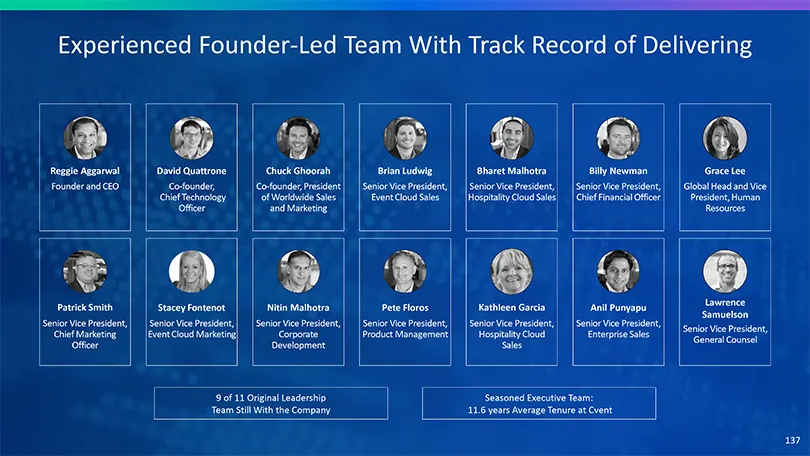
Slide 137: Experienced Founder-Led Team With Track Record of Delivering
Experienced Founder-Led Team With Track Record of Delivering Reggie Aggarwal David Quattrone Chuck Ghoorah Brian Ludwig Bharet Malhotra Billy Newman Grace Lee Founder and CEO Co-founder, Co-founder, President Senior Vice President, Senior Vice President, Senior Vice President, Global Head and Vice C
Slide 138: Agenda
Agenda 1 Introduction 2 Cvent At A Glance 3 Industry Transforming 4 Massive TAM Expansion 5 How We Win: Platform, Go-To-Market & Culture 6 Finance 7 Q&A
Slide 139: Attractive Financial Profile Positions Cvent for Success
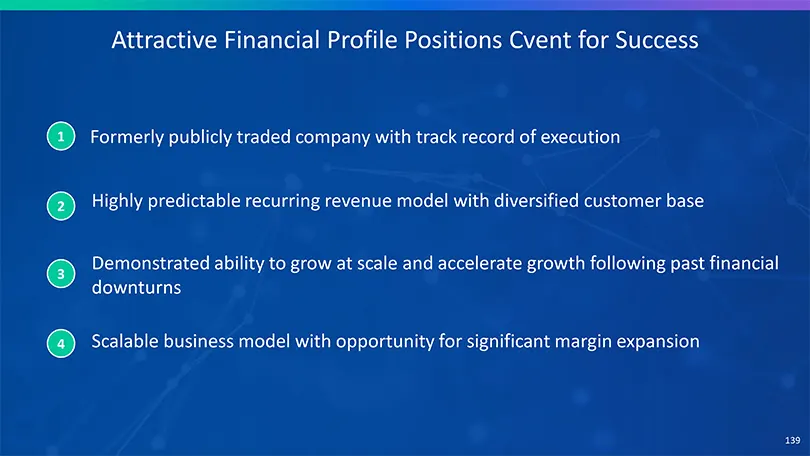
Attractive Financial Profile Positions Cvent for Success 1 Formerly publicly traded company with track record of execution 2 Highly predictable recurring revenue model with diversified customer base Demonstrated ability to grow at scale and accelerate growth following past financial 3 downturns 4 Sc
Slide 140: Highly Predictable Recurring Revenue Model
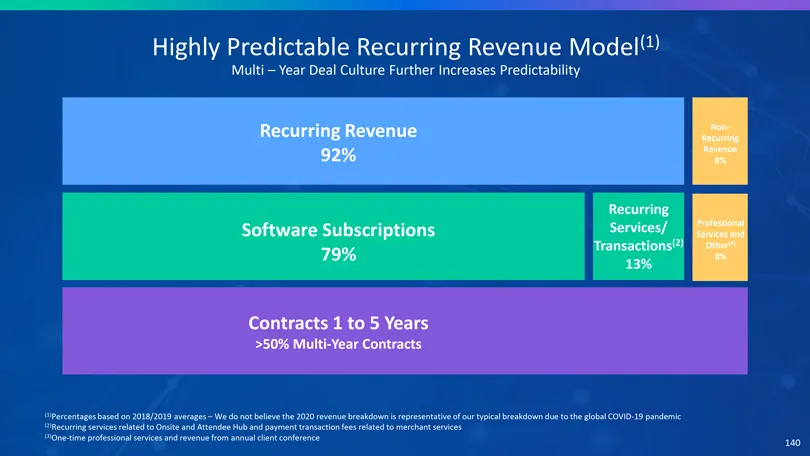
Highly Predictable Recurring Revenue Model(1) Multi – Year Deal Culture Further Increases Predictability Recurring Revenue Non- Recurring 92% Revenue 8% Recurring Software Subscriptions Services/ Professional Services and Transactions(2) Other(3) 79% 8% 13% Contracts 1 to 5 Years >50% Multi-Year Con
Slide 141: 2021 Q3 and Q4 Revenue Forecast
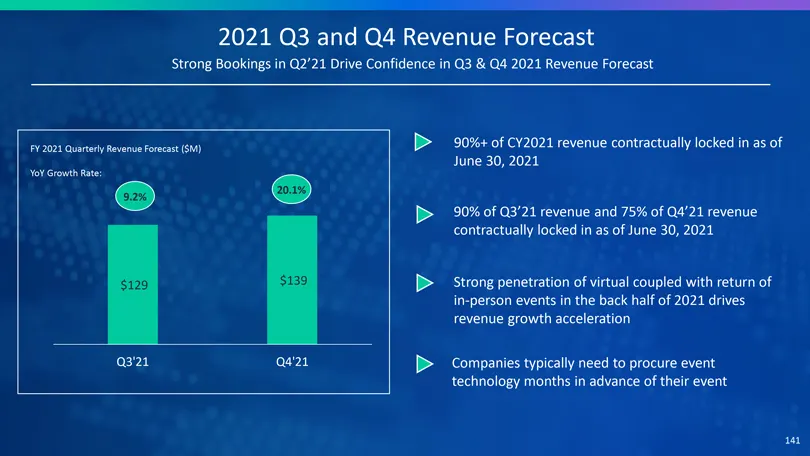
2021 Q3 and Q4 Revenue Forecast Strong Bookings in Q2’21 Drive Confidence in Q3 & Q4 2021 Revenue Forecast 90%+ of CY2021 revenue contractually locked in as of FY 2021 Quarterly Revenue Forecast ($M) June 30, 2021 YoY Growth Rate: 20.1% 9.2% 90% of Q3’21 revenue and 75% of Q4’21 revenue contractuall
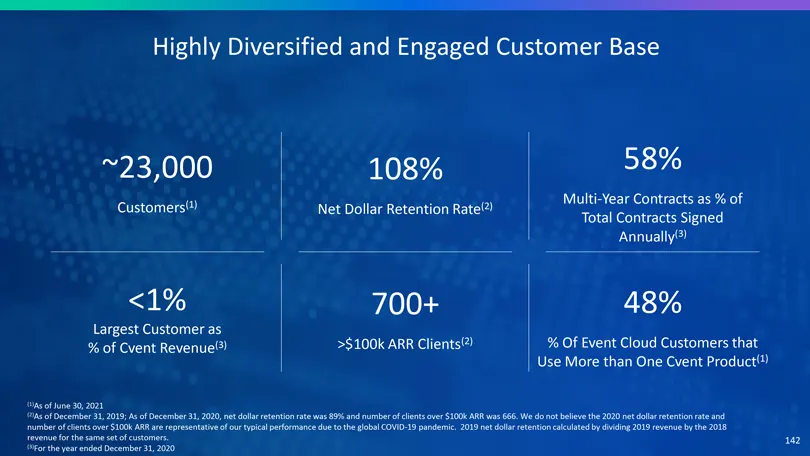
Slide 142: Highly Diversified and Engaged Customer Base
Highly Diversified and Engaged Customer Base ~23,000 108% 58% Multi-Year Contracts as % of Customers(1) Net Dollar Retention Rate(2) Total Contracts Signed Annually(3) <1% 700+ 48% Largest Customer as (3) >$100k ARR Clients(2) % Of Event Cloud Customers that % of Cvent Revenue Use More than One Cven
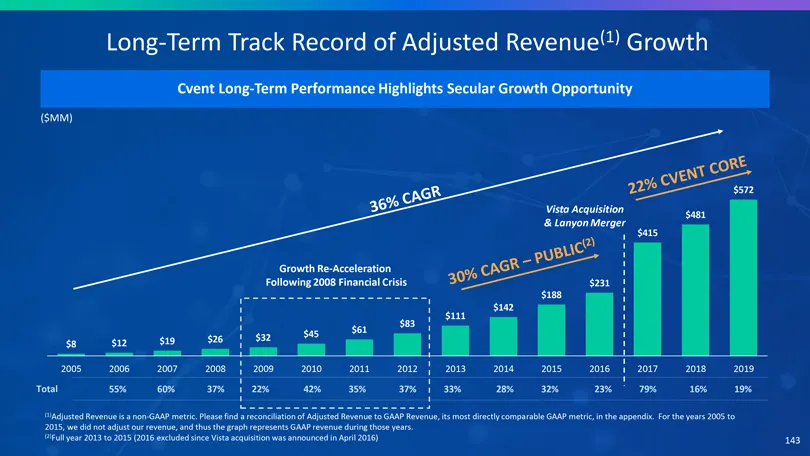
Slide 143: Long-Term Track Record of Adjusted Revenue Growth
Long-Term Track Record of Adjusted Revenue(1) Growth Cvent Long-Term Performance Highlights Secular Growth Opportunity ($MM) $572 Vista Acquisition & Lanyon Merger $481 $415 Growth Re-Acceleration Following 2008 Financial Crisis $231 $188 $142 $83 $111 $61 $32 $45 $19 $26 $8 $12 2005 2006 2007 2008
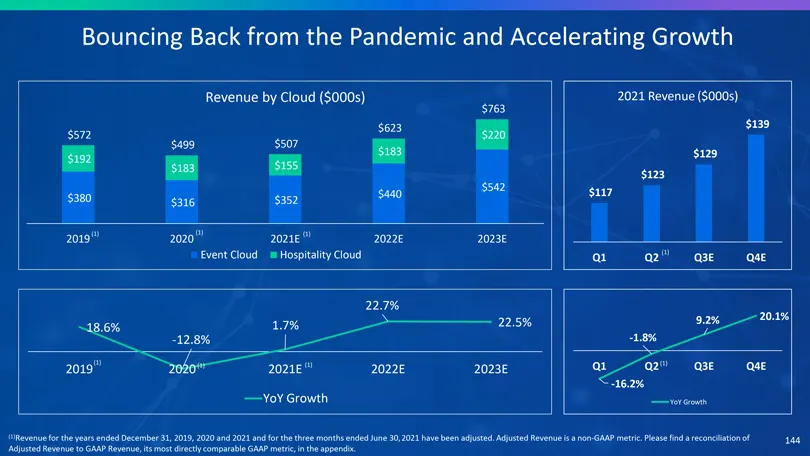
Slide 144: Bouncing Back from the Pandemic and Accelerating Growth
Bouncing Back from the Pandemic and Accelerating Growth Revenue by Cloud ($000s) 2021 Revenue ($000s) $763 $623 $139 $572 $507 $220 $499 $183 $129 $192 $183 $155 $123 $542 $440 $117 $380 $316 $352 (1) (1) (1) 2019 2020 2021E 2022E 2023E Event Cloud Hospitality Cloud (1) Q1 Q2 Q3E Q4E 22.7% 9.2% 20.1
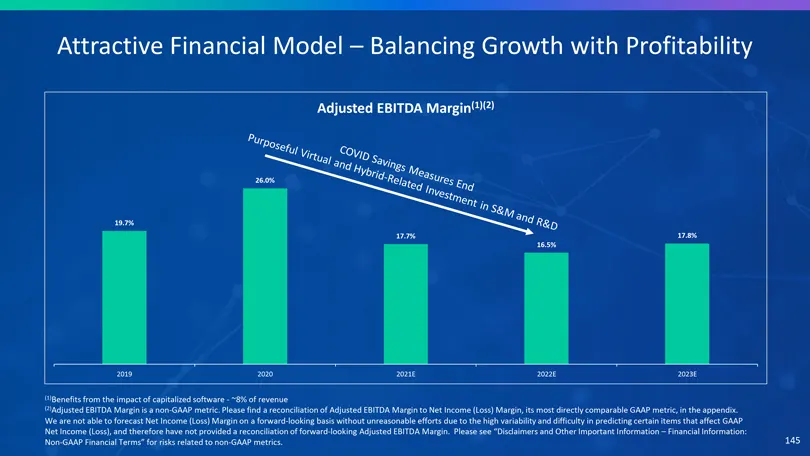
Slide 145: Attractive Financial Model – Balancing Growth with Profitability
Attractive Financial Model – Balancing Growth with Profitability Adjusted EBITDA Margin(1)(2) 26.0% 19.7% 17.7% 17.8% 16.5% 2019 2020 2021E 2022E 2023E (1)Benefits from the impact of capitalized software—~8% of revenue (2)Adjusted EBITDA Margin is a non-GAAP metric. Please find a reconciliation of A
Slide 146: Long-Term Modeling Guidance
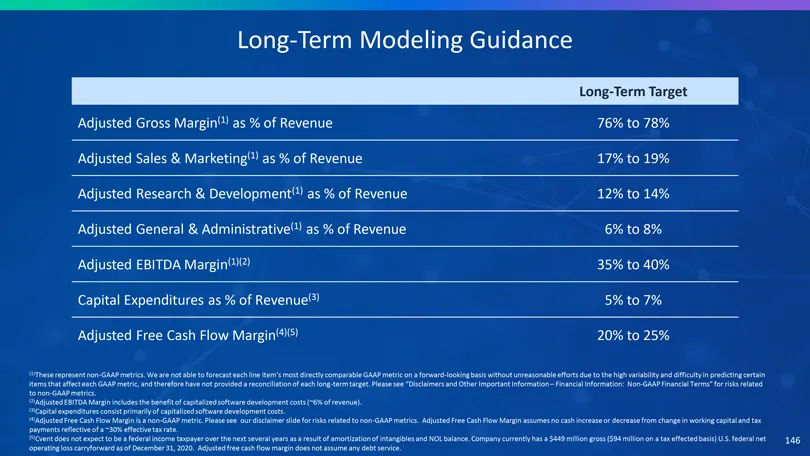
Long-Term Modeling Guidance Long-Term Target Adjusted Gross Margin(1) as % of Revenue 76% to 78% Adjusted Sales & Marketing(1) as % of Revenue 17% to 19% Adjusted Research & Development(1) as % of Revenue 12% to 14% Adjusted General & Administrative(1) as % of Revenue 6% to 8% Adjusted EBITDA Margin
Slide 147: Attractive Valuation: Revenue Growth and Margin vs Comparables
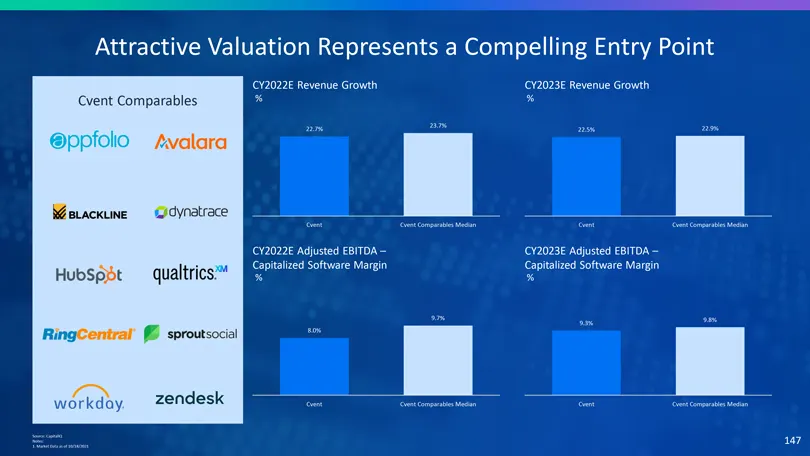
Attractive Valuation Represents a Compelling Entry Point CY2022E Revenue Growth CY2023E Revenue Growth Cvent Comparables % % 23.7% 22.7% 22.5% 22.9% Cvent Cvent Comparables Median Cvent Cvent Comparables Median CY2022E Adjusted EBITDA – CY2023E Adjusted EBITDA –Capitalized Software Margin Capitalize
Slide 148: Attractive Valuation: EV / Revenue
Attractive Valuation Represents a Compelling Entry Point CY2022E EV / Revenue CY2023E EV / Revenue Cvent Comparables x x 14.1x 17.2x 8.5x 6.9x Cvent Cvent Comparables Median Cvent Cvent Comparables Median Source: CapitalIQ Notes: 1. Market Data as of 10/18/2021
Slide 149: Attractive Valuation: EV / Revenue / Growth
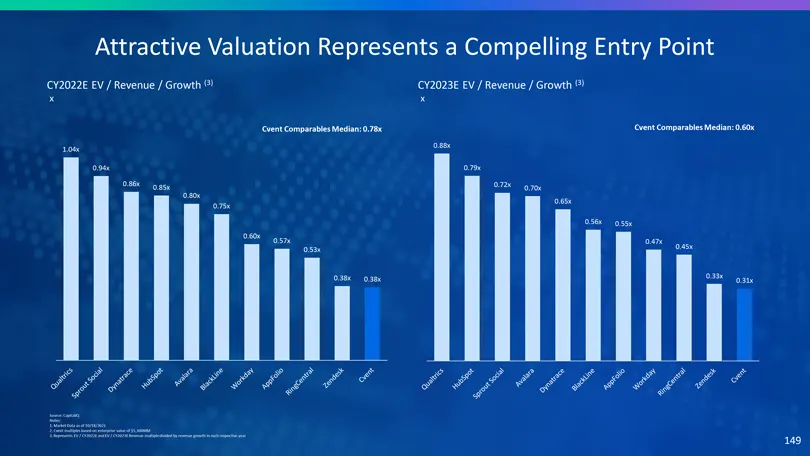
ttractive Valuation Represents a Compelling Entry Point CY2022E EV / Revenue / Growth (3) CY2023E EV / Revenue / Growth (3) x x Cvent Comparables Median: 0.78x Cvent Comparables Median: 0.60x 0.88x 1.04x 0.94x 0.79x 0.86x 0.72x 0.85x 0.70x 0.80x 0.65x 0.75x 0.56x 0.55x 0.60x 0.57x 0.47x 0.45x 0.53x
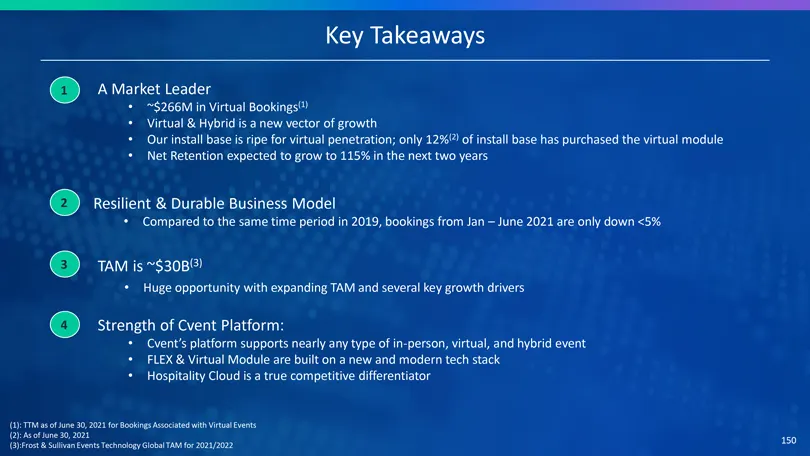
Slide 150: Key Takeaways
Key Takeaways 1 A Market Leader ~$266M in Virtual Bookings(1) Virtual & Hybrid is a new vector of growth Our install base is ripe for virtual penetration; only 12%(2) of install base has purchased the virtual module Net Retention expected to grow to 115% in the next two years 2 Resilient & Durable B
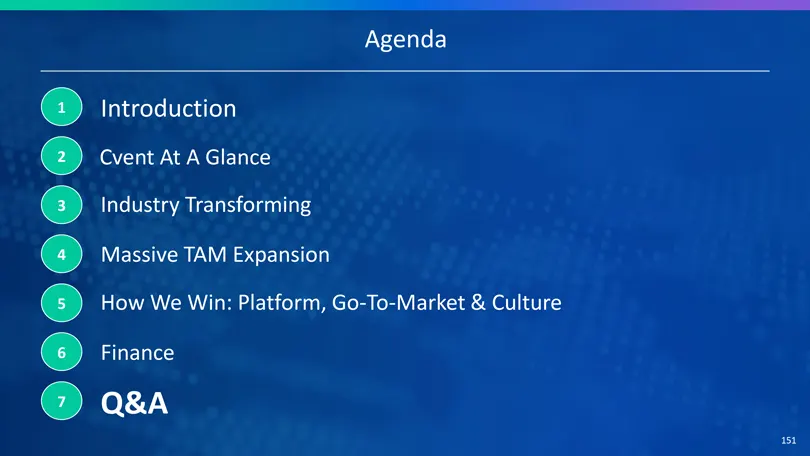
Slide 151: Agenda
Agenda 1 Introduction 2 Cvent At A Glance 3 Industry Transforming 4 Massive TAM Expansion 5 How We Win: Platform, Go-To-Market & Culture 6 Finance 7 Q&A
Slide 152: Questions: What is the M&A strategy moving forward?
QUESTIONS: What is the M&A strategy moving forward?
Slide 153: Questions: How has COVID shifted attitudes?
QUESTIONS: How has COVID shifted attitudes and what are the long-term implications for Cvent?
Source: SEC EDGAR · 425 filed Oct 19, 2021
More decks from Cvent Holding Corp
 Investor Presentation (March 2022)54 slides · Mar 7, 2022
 Dragoneer Growth Opportunities Corp. II — SPAC Merger (December 2021)5 slides · Dec 7, 2021
 Dragoneer Growth Opportunities Corp. II — SPAC Merger (December 2021)82 slides · Dec 3, 2021
 Dragoneer Growth Opportunities Corp. II — SPAC Merger (December 2021)11 slides · Dec 2, 2021
 Dragoneer Growth Opportunities Corp. II — Wells Fargo 5th Annual TMT Summit 202137 slides · Nov 30, 2021
 Dragoneer Growth Opportunities Corp. II — SPAC Merger (November 2021)34 slides · Nov 10, 2021