Cvent — Dragoneer Growth Opportunities Corp. II — SPAC Merger (November 2021)
34 slides from Cvent's SPAC merger presentation, Nov 10, 2021
Slide 1: Business Update November 2021
Business Update November 2021
Slide 2: Disclaimers and Other Important Information
Disclaimers and Other Important Information Disclaimer This presentation (this “Presentation”) is provided for informational purposes only and has been prepared to assist interested parties in making their own evaluation with respect to a potential business combination between Papay Topco, Inc. (“Cv
Slide 3: Forward-Looking Statements
Forward-Looking Statements This Presentation contains certain forward-looking statements, including statements regarding the benefits of the Potential Business Combination, the anticipated timing of the Potential Business Combination, the products and services offered by Cvent and the markets in whi
Slide 4: Use of Projections
Use of Projections This Presentation contains projected financial information with respect to Cvent. Such projected financial information constitutes forward-looking information, and is for illustrative purposes only and should not be relied upon as necessarily being indicative of future results. Th
Slide 5: Trademarks
Trademarks This Presentation contains trademarks, service marks, tradenames and copyrights of Cvent, Dragoneer and other companies, which are the property of their respective owners. The use herein does not imply an affiliation with, or endorsement by, the owners of these service marks, trademarks a
Slide 6: Agenda
Agenda 1 Cvent Refresher 2 Q3’2021 Momentum 3 Q3’2021 Financial Update 4 Transaction Update 5 Q&A 6
Slide 7: Key: In Person Events, Virtual Events, Any Event Delivery Mode
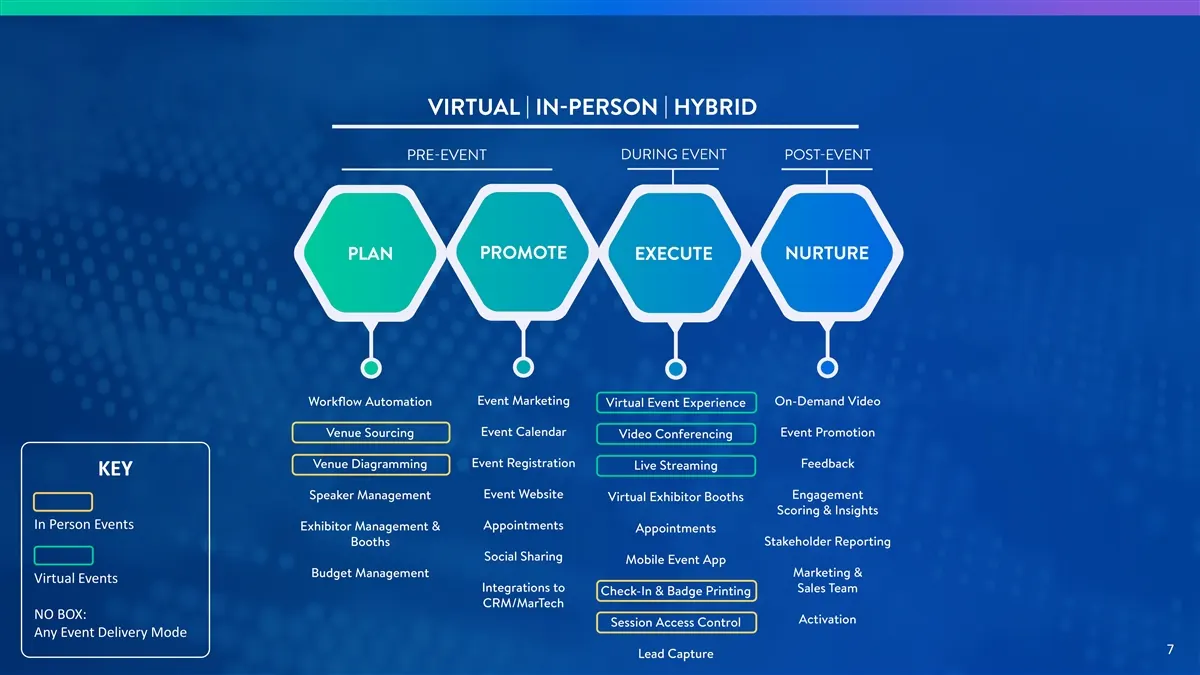
KEY In Person Events Virtual Events NO BOX: Any Event Delivery Mode 7
Slide 8: Q3'2021 State of Meetings & Events Industry
Q3’2021 State of Meetings & Events Industry COVID-19 Hybrid Delta Variant Events 8
Slide 9: Driver #1: New Logos Continuing to See Momentum in Q3'2021
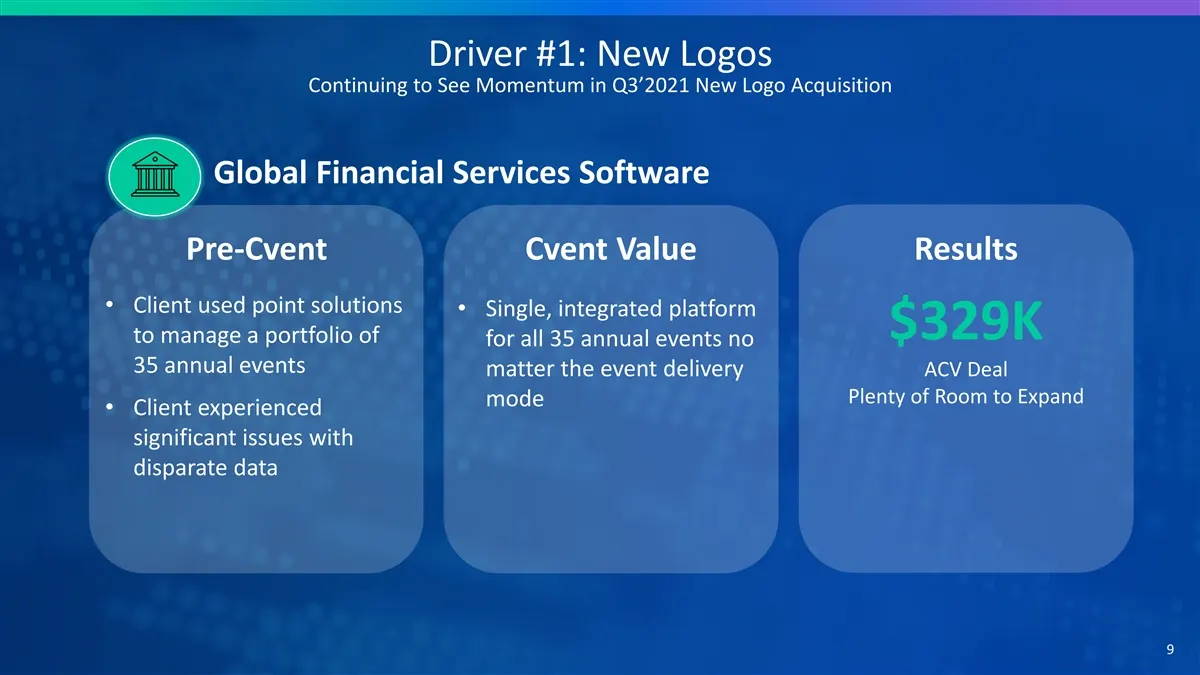
Driver #1: New Logos Continuing to See Momentum in Q3’2021 New Logo Acquisition Global Financial Services Software Pre-Cvent Cvent Value Results • Client used point solutions • Single, integrated platform $329K to manage a portfolio of for all 35 annual events no 35 annual events matter the event de
Slide 10: Driver #1: New Logos Continuing to See Momentum in Q3'2021
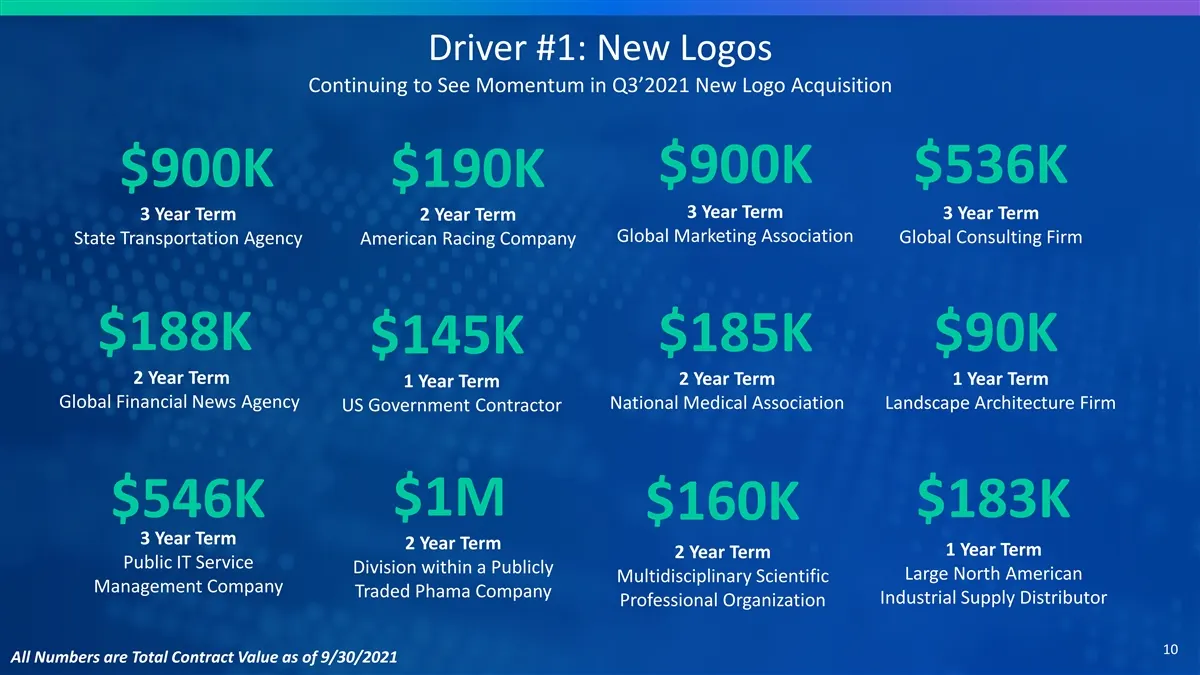
Driver #1: New Logos Continuing to See Momentum in Q3’2021 New Logo Acquisition $900K $536K $900K $190K 3 Year Term 3 Year Term 3 Year Term 2 Year Term Global Marketing Association Global Consulting Firm State Transportation Agency American Racing Company $188K $185K $90K $145K 2 Year Term 2 Year Te
Slide 11: Driver #2: Expansion Logos
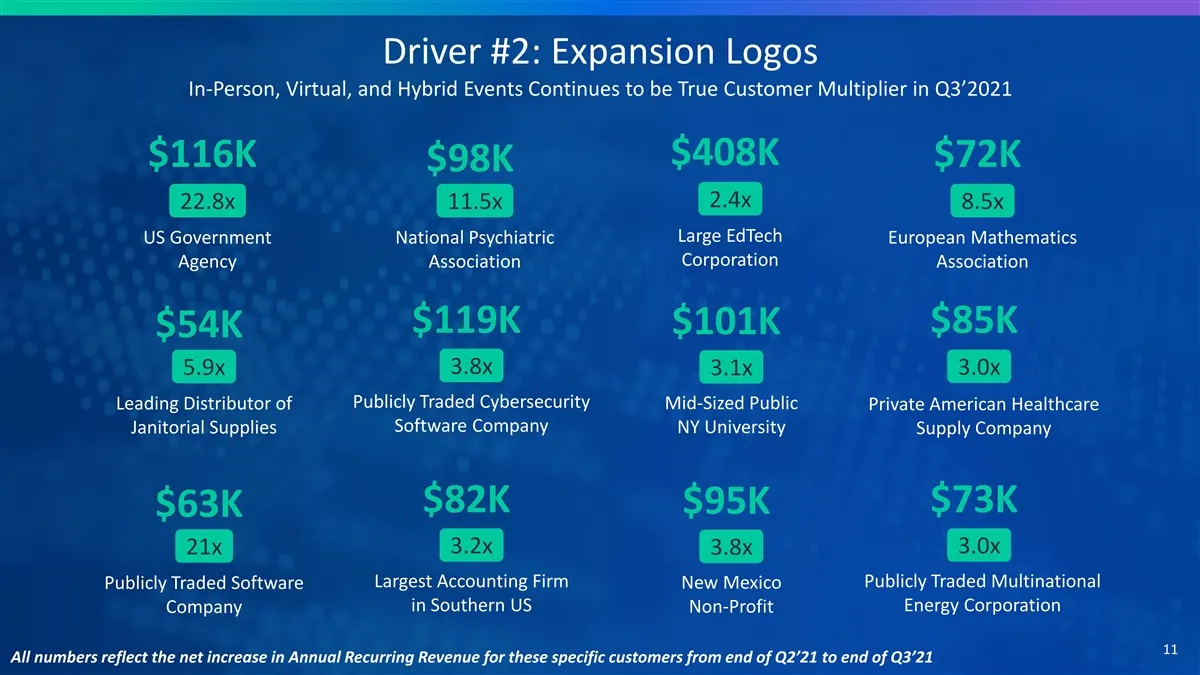
Driver #2: Expansion Logos In-Person, Virtual, and Hybrid Events Continues to be True Customer Multiplier in Q3’2021 $408K $116K $72K $98K 2.4x 22.8x 11.5x 8.5x Large EdTech US Government National Psychiatric European Mathematics Corporation Agency Association Association $119K $85K $101K $54K 3.8x
Slide 12: Driver #2: Large, Under-Penetrated Opportunity Within Existing Install Base
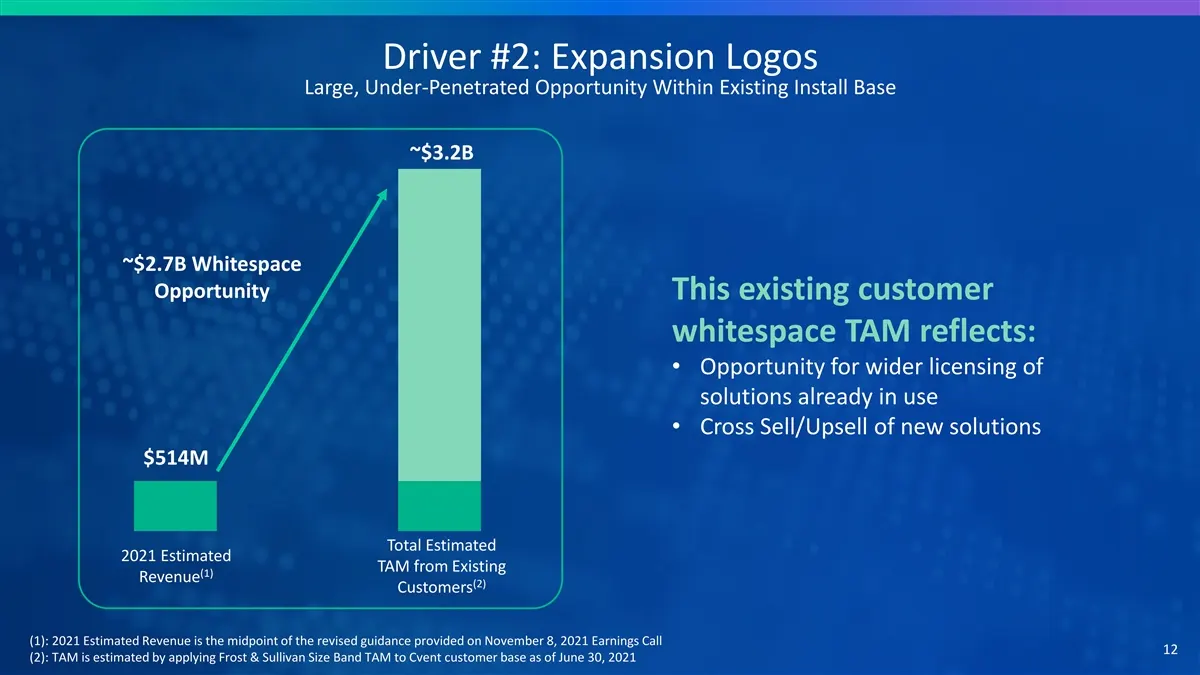
Driver #2: Expansion Logos Large, Under-Penetrated Opportunity Within Existing Install Base ~$3.2B ~$2.7B Whitespace Opportunity This existing customer whitespace TAM reflects: • Opportunity for wider licensing of solutions already in use • Cross Sell/Upsell of new solutions $514M Total Estimated 20
Slide 13: Driver #3: Product Innovation, Cvent Studio
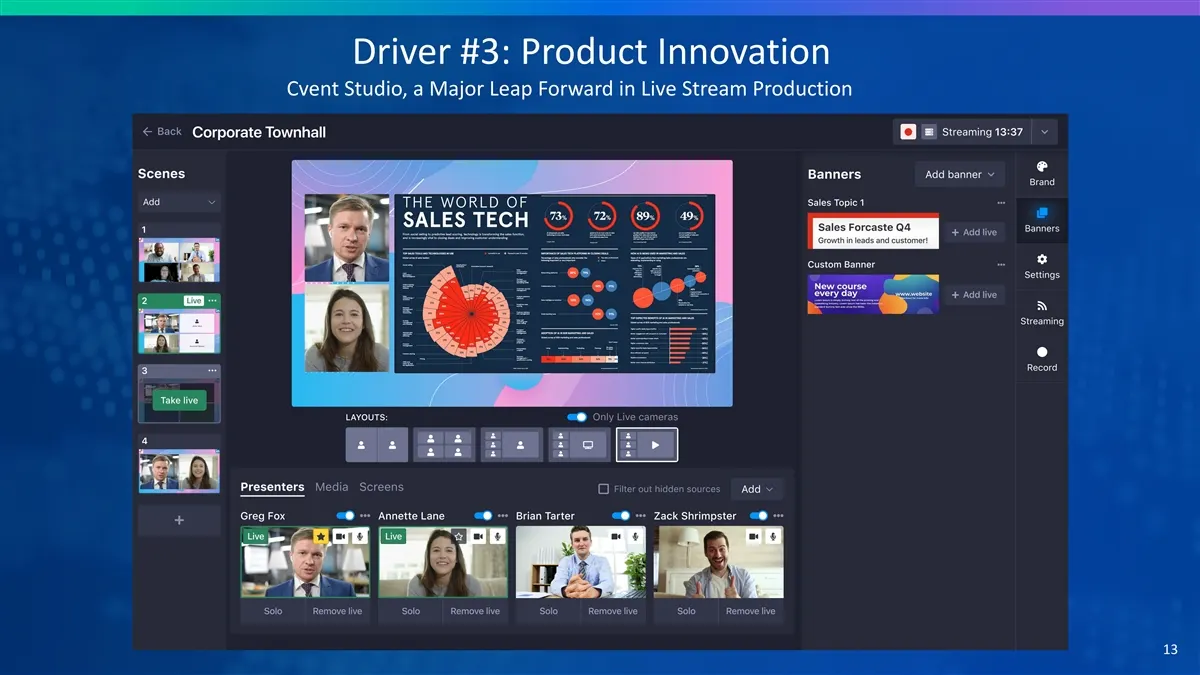
Driver #3: Product Innovation Cvent Studio, a Major Leap Forward in Live Stream Production 13
Slide 14: Q3 Hospitality Cloud Updates
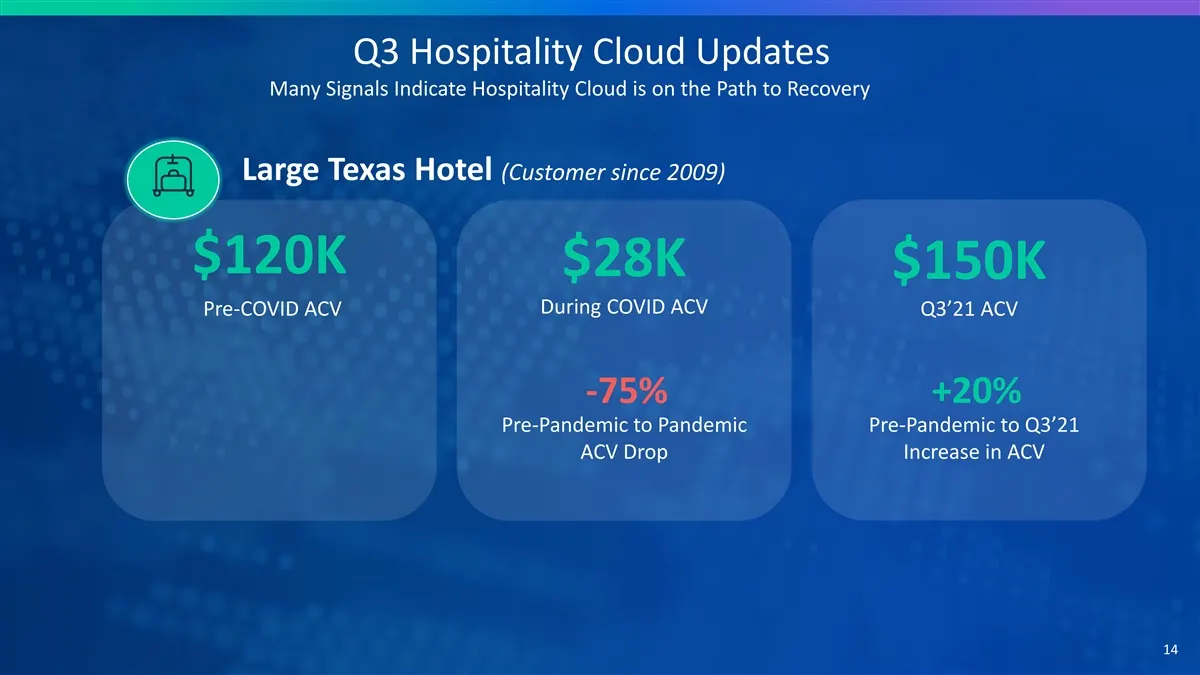
Q3 Hospitality Cloud Updates Many Signals Indicate Hospitality Cloud is on the Path to Recovery Large Texas Hotel (Customer since 2009) $120K $28K $150K During COVID ACV Pre-COVID ACV Q3’21 ACV -75% +20% Pre-Pandemic to Pandemic Pre-Pandemic to Q3’21 ACV Drop Increase in ACV 14
Slide 15: Agenda
Agenda 1 Cvent Refresher 2 Q3’2021 Momentum 3 Q3’2021 Financial Update 4 Transaction Update 5 Q&A 15
Slide 16: Durable Business Model & Profile
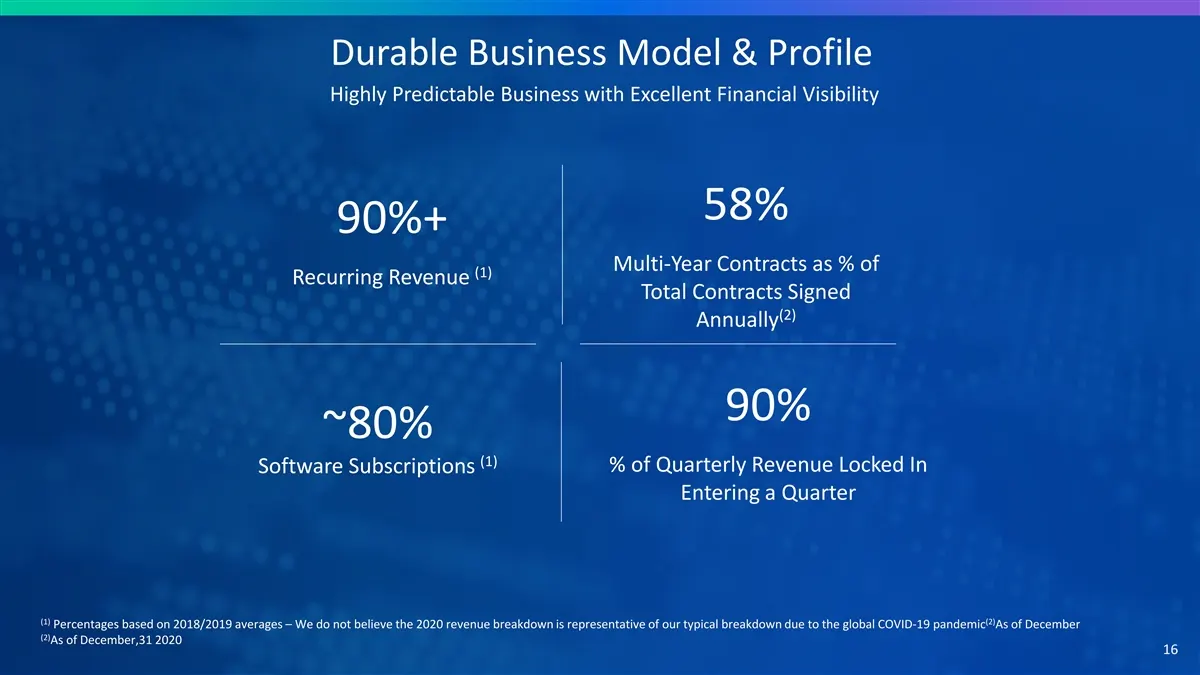
Durable Business Model & Profile Highly Predictable Business with Excellent Financial Visibility 58% 90%+ Multi-Year Contracts as % of (1) Recurring Revenue Total Contracts Signed (2) Annually 90% ~80% (1) % of Quarterly Revenue Locked In Software Subscriptions Entering a Quarter (1) (2) Percentages
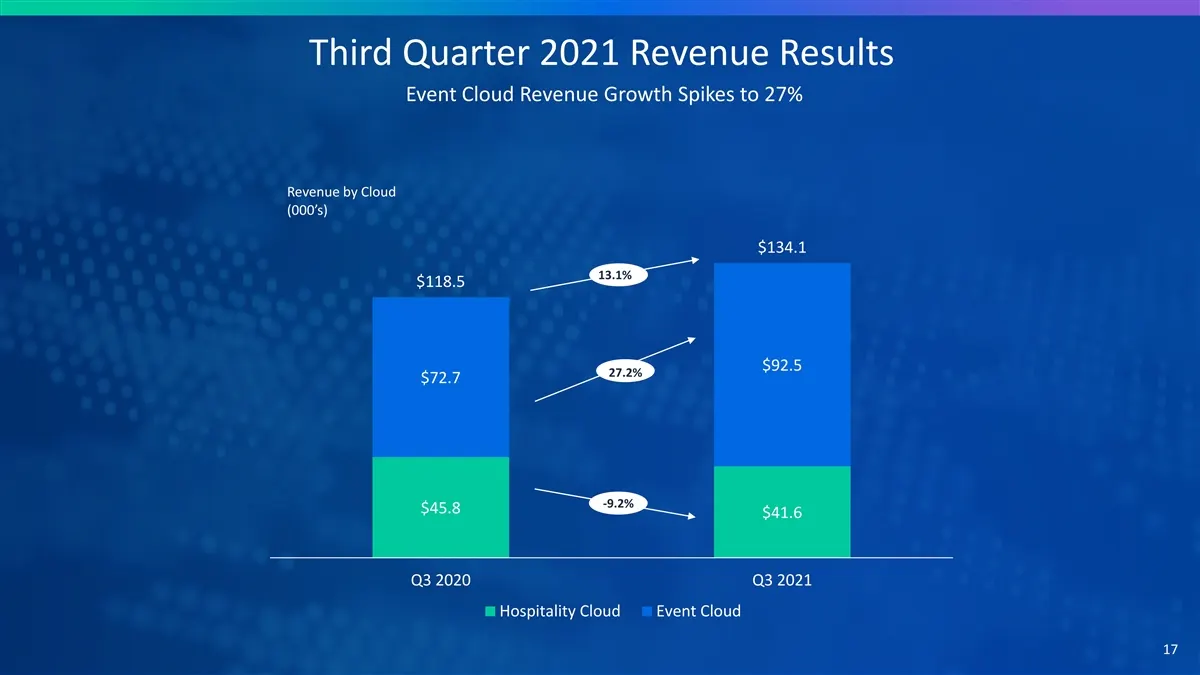
Slide 17: Third Quarter 2021 Revenue Results
Third Quarter 2021 Revenue Results Event Cloud Revenue Growth Spikes to 27% Revenue by Cloud (000’s) $134.1 13.1% $118.5 $92.5 27.2% $72.7 -9.2% $45.8 $41.6 Q3 2020 Q3 2021 Hospitality Cloud Event Cloud 17
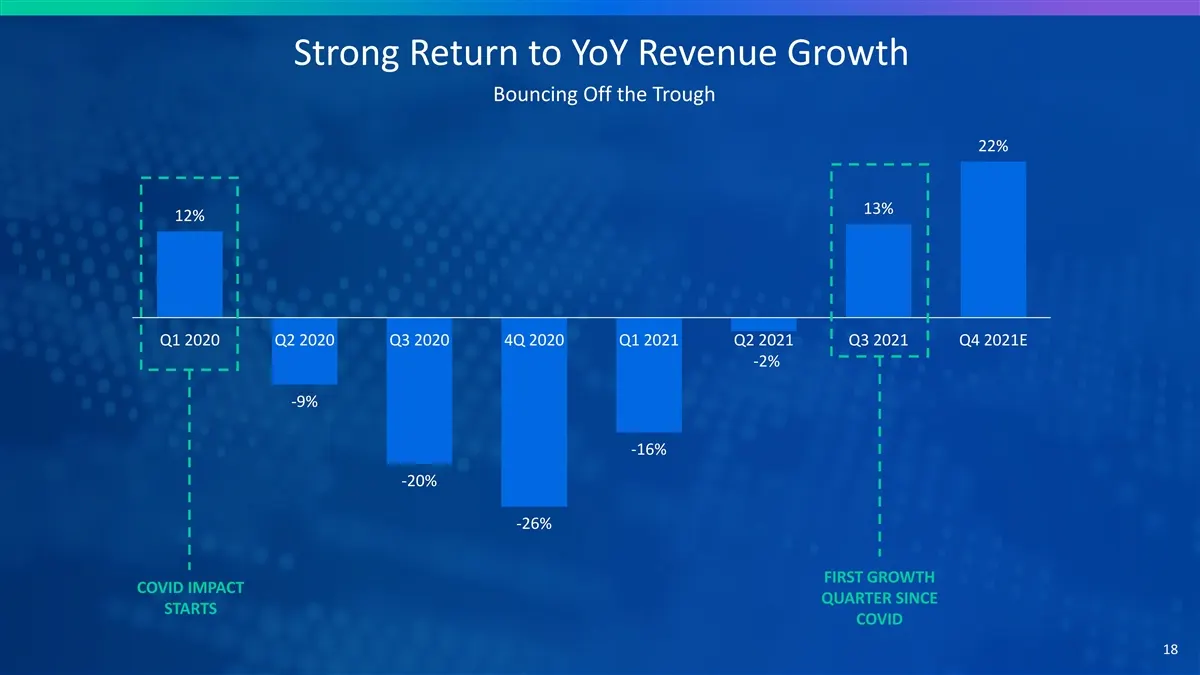
Slide 18: Strong Return to YoY Revenue Growth
Strong Return to YoY Revenue Growth Bouncing Off the Trough 22% 13% 12% Q1 2020 Q2 2020 Q3 2020 4Q 2020 Q1 2021 Q2 2021 Q3 2021 Q4 2021E -2% -9% -16% -20% -26% FIRST GROWTH COVID IMPACT QUARTER SINCE STARTS COVID 18
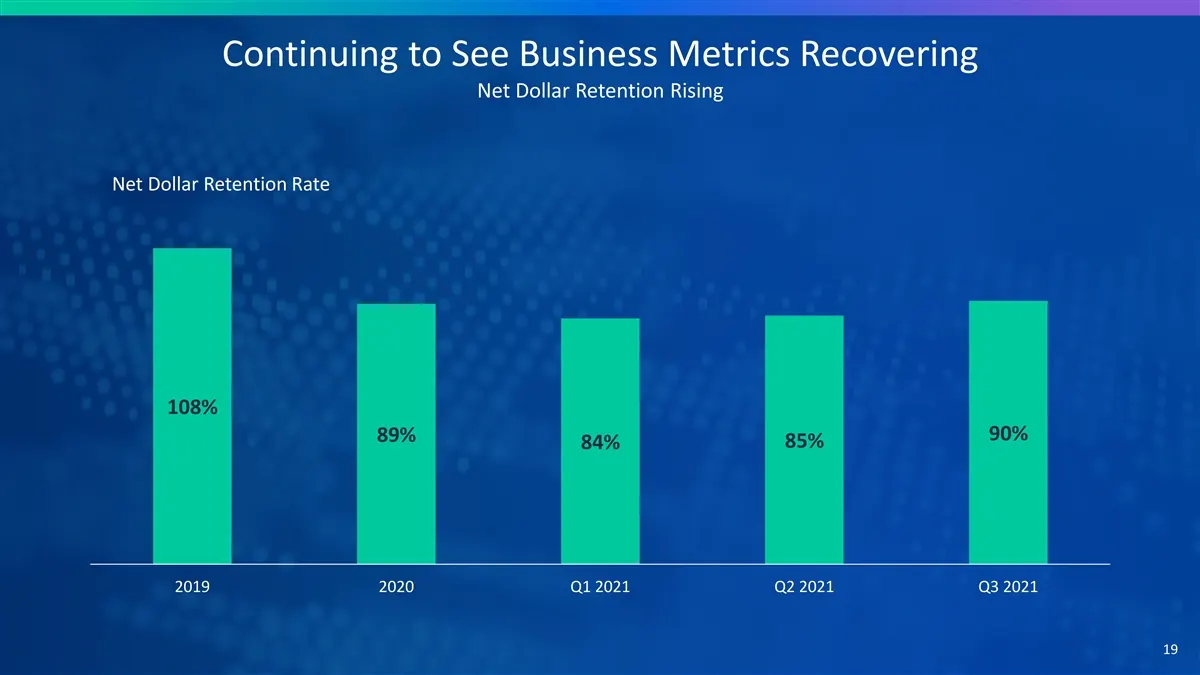
Slide 19: Continuing to See Business Metrics Recovering: Net Dollar Retention
Continuing to See Business Metrics Recovering Net Dollar Retention Rising Net Dollar Retention Rate 108% 90% 89% 85% 84% 2019 2020 Q1 2021 Q2 2021 Q3 2021 19
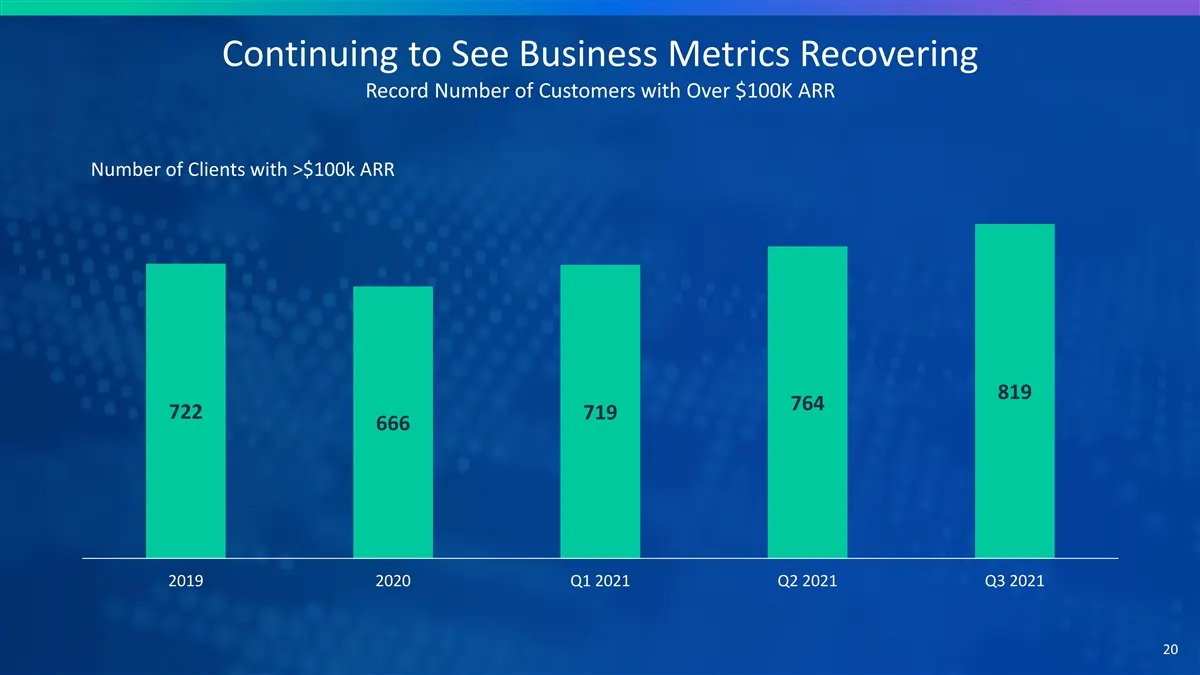
Slide 20: Record Number of Customers with Over $100K ARR
Continuing to See Business Metrics Recovering Record Number of Customers with Over $100K ARR Number of Clients with >$100k ARR 819 764 722 719 666 2019 2020 Q1 2021 Q2 2021 Q3 2021 20
Slide 21: Adjusted EBITDA and Free Cash Flow
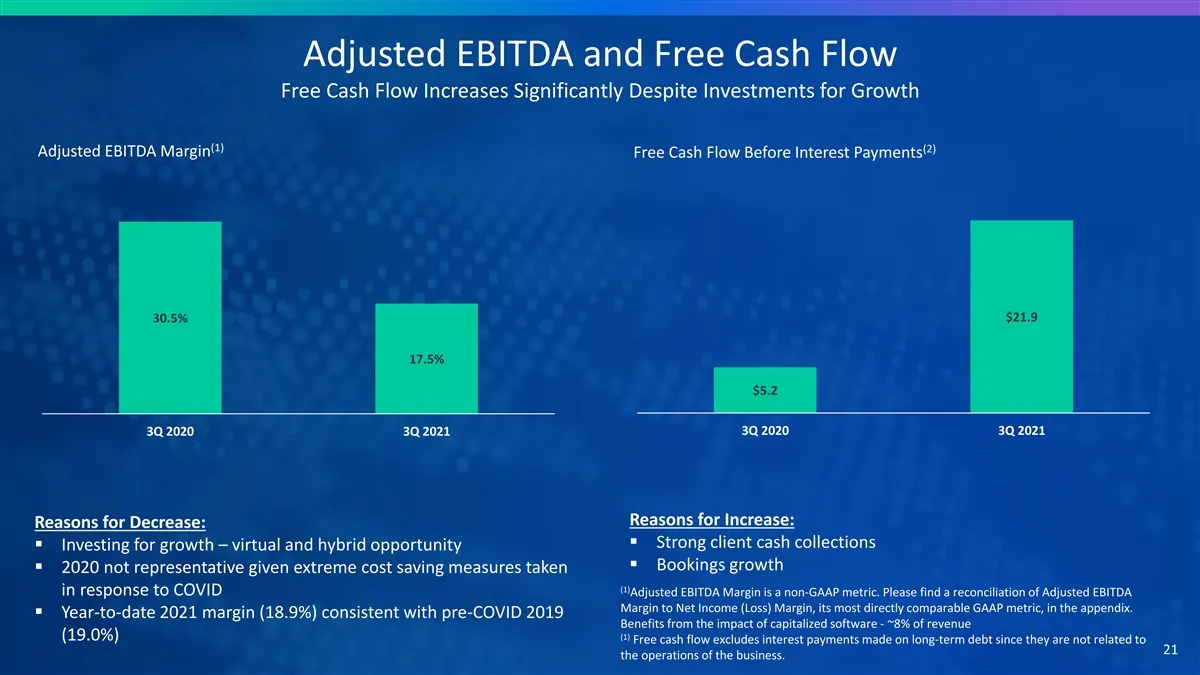
Adjusted EBITDA and Free Cash Flow Free Cash Flow Increases Significantly Despite Investments for Growth (1) (2) Adjusted EBITDA Margin Free Cash Flow Before Interest Payments $21.9 30.5% 17.5% $5.2 3Q 2020 3Q 2021 3Q 2020 3Q 2021 Reasons for Increase: Reasons for Decrease: ▪ Strong client cash coll
Slide 22: Fourth Quarter and Full Year 2021 Guidance
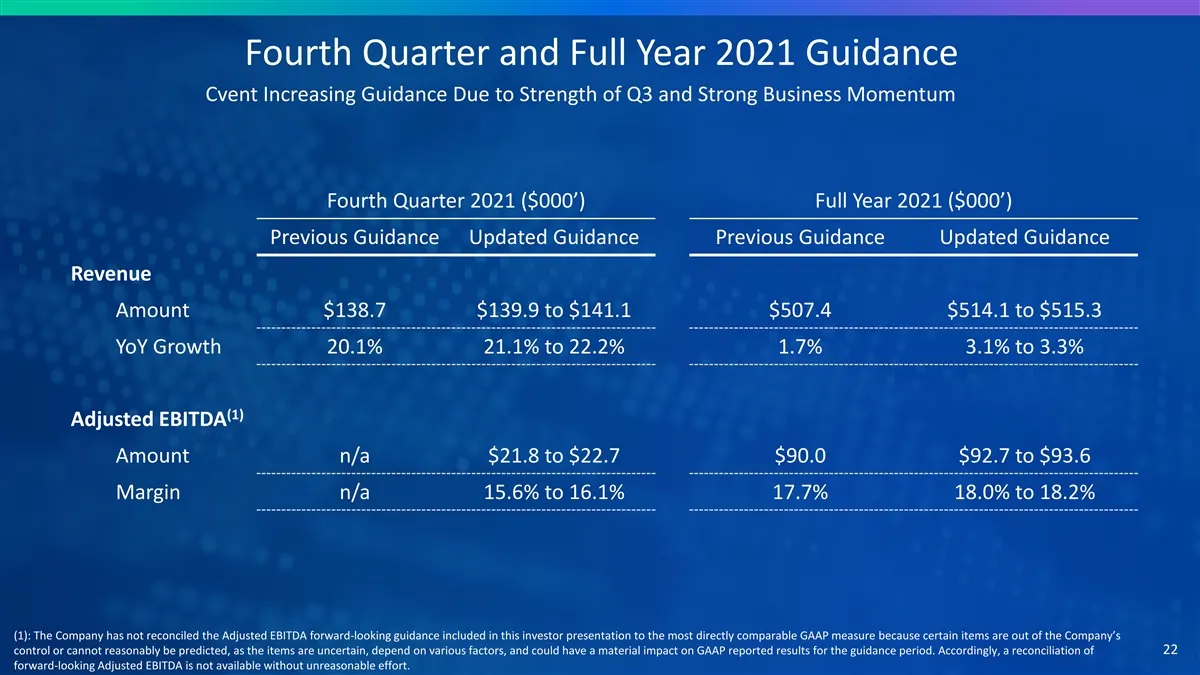
Fourth Quarter and Full Year 2021 Guidance Cvent Increasing Guidance Due to Strength of Q3 and Strong Business Momentum Fourth Quarter 2021 ($000’) Full Year 2021 ($000’) Previous Guidance Updated Guidance Previous Guidance Updated Guidance Revenue Amount $138.7 $139.9 to $141.1 $507.4 $514.1 to $51
Slide 23: Agenda
Agenda 1 Cvent Refresher 2 Q3’2021 Momentum 3 Q3’2021 Financial Update 4 Transaction Update 5 Q&A 23
Slide 24: Attractive Valuation Represents a Compelling Entry Point
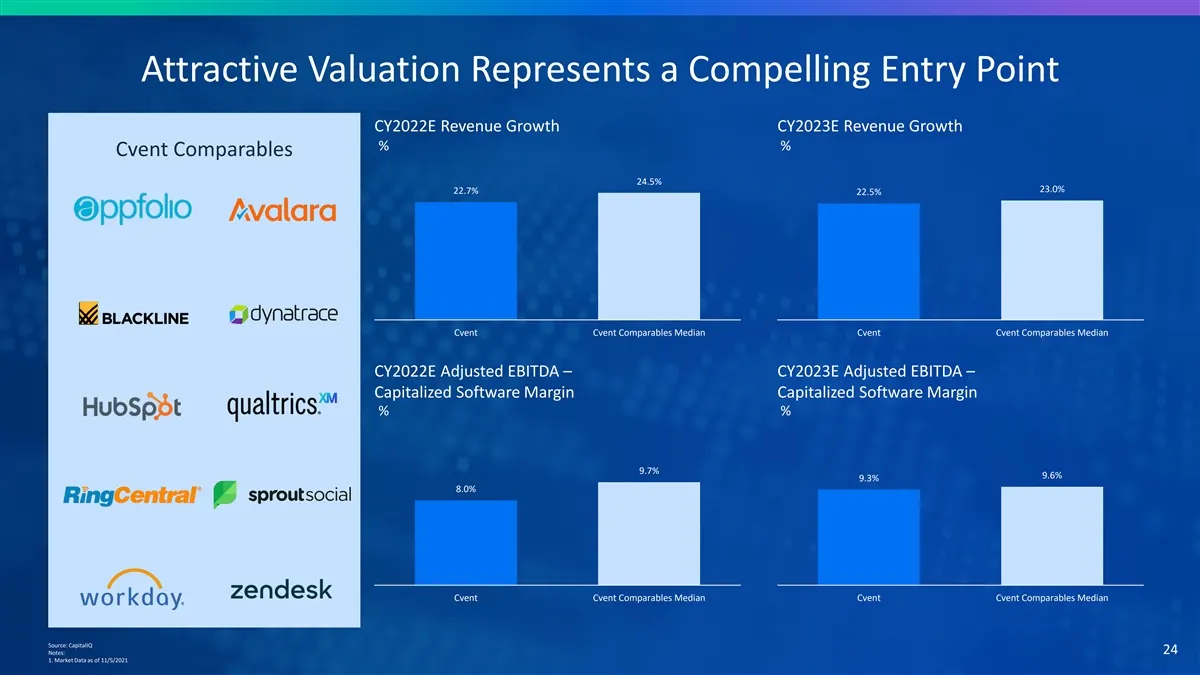
Attractive Valuation Represents a Compelling Entry Point CY2022E Revenue Growth CY2023E Revenue Growth % % Cvent Comparables 24.5% 23.0% 22.7% 22.5% Cvent Cvent Comparables Median Cvent Cvent Comparables Median CY2022E Adjusted EBITDA – CY2023E Adjusted EBITDA – Capitalized Software Margin Capitaliz
Slide 25: Attractive Valuation: EV / Revenue
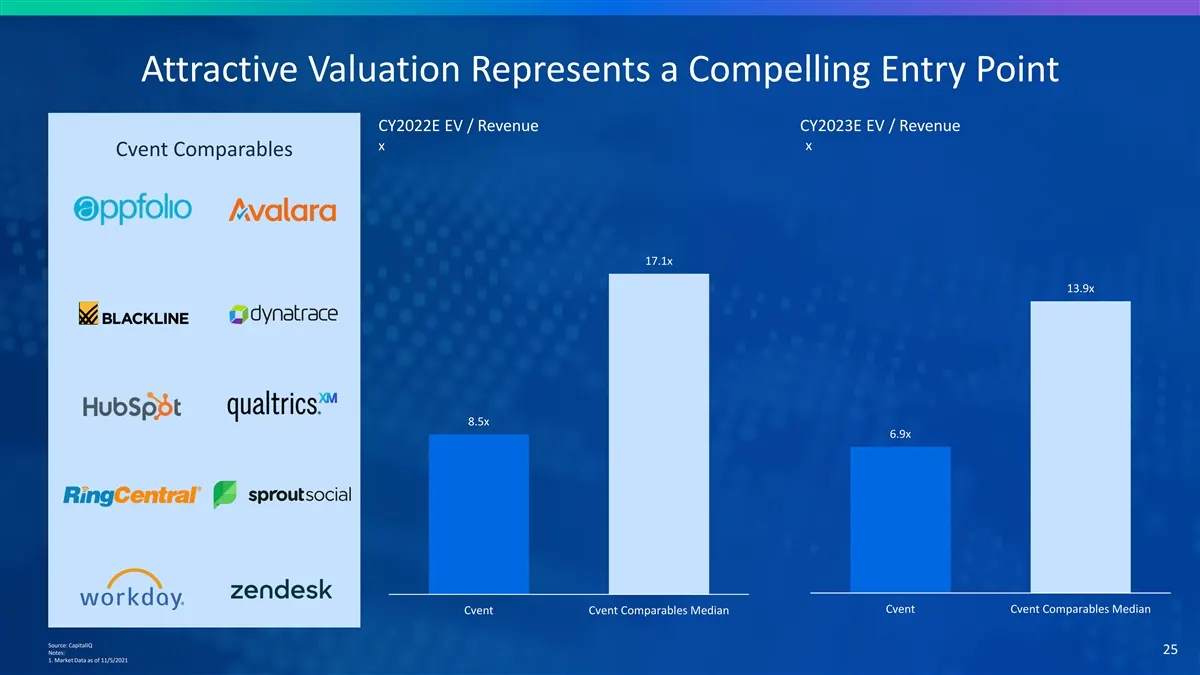
Attractive Valuation Represents a Compelling Entry Point CY2022E EV / Revenue CY2023E EV / Revenue x x Cvent Comparables 17.1x 13.9x 8.5x 6.9x Cvent Cvent Comparables Median Cvent Cvent Comparables Median Source: CapitalIQ 25 Notes: 1. Market Data as of 11/5/2021
Slide 26: Attractive Valuation: EV / Revenue / Growth
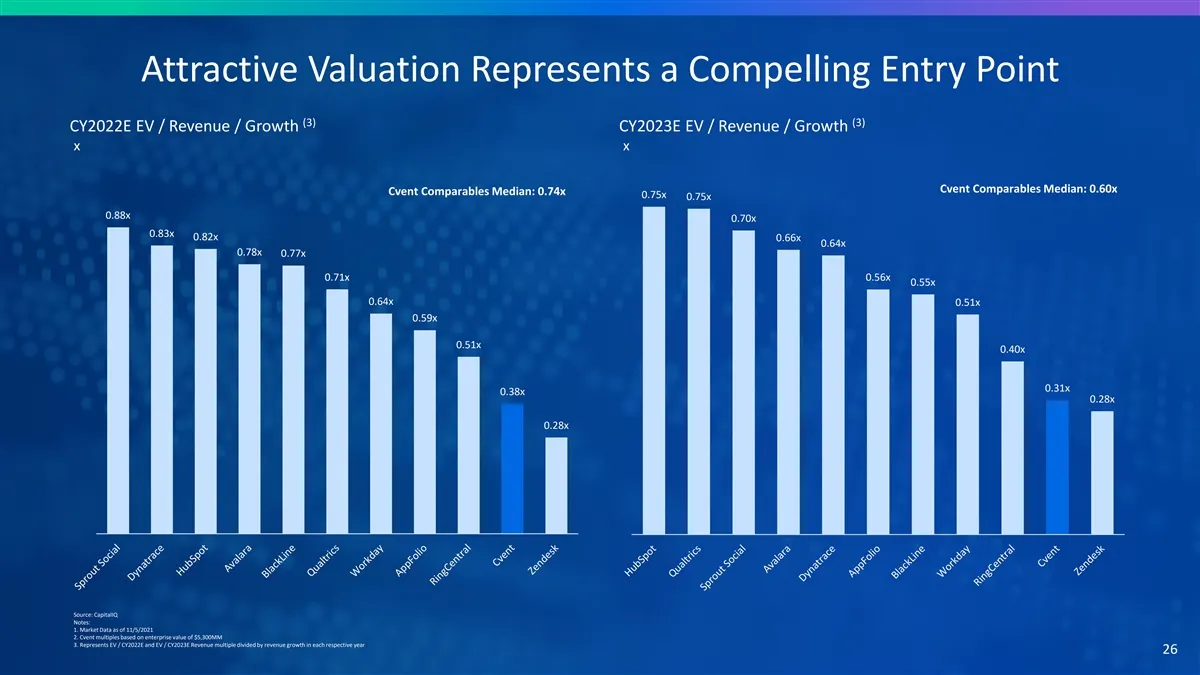
Attractive Valuation Represents a Compelling Entry Point (3) (3) CY2022E EV / Revenue / Growth CY2023E EV / Revenue / Growth x x Cvent Comparables Median: 0.60x Cvent Comparables Median: 0.74x 0.75x 0.75x 0.88x 0.70x 0.83x 0.82x 0.66x 0.64x 0.78x 0.77x 0.71x 0.56x 0.55x 0.64x 0.51x 0.59x 0.51x 0.40x
Slide 27: Appendix
Appendix
Slide 28: Adjusted EBITDA and Adjusted EBITDA Margin Reconciliation
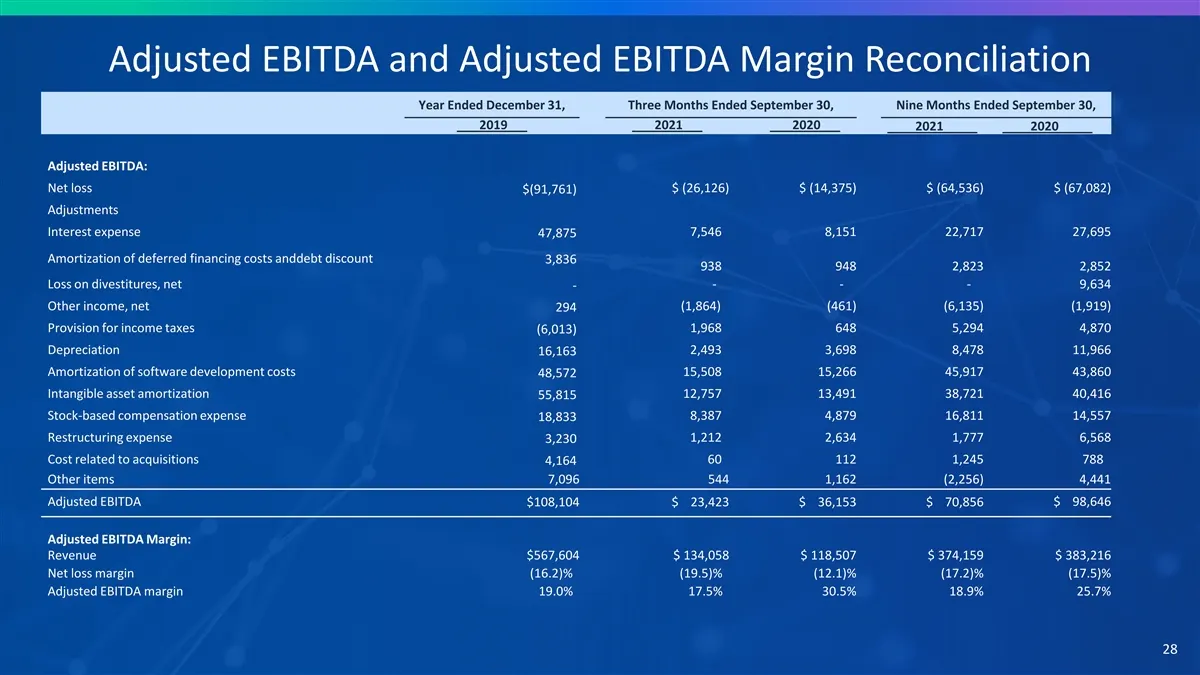
Adjusted EBITDA and Adjusted EBITDA Margin Reconciliation Year Ended December 31, Three Months Ended September 30, Nine Months Ended September 30, 2019 2021 2020 2021 2020 Adjusted EBITDA: Net loss $ (26,126) $ (14,375) $ (64,536) $ (67,082) $(91,761) Adjustments Interest expense 7,546 8,151 22,717
Slide 29: Adjusted Free Cash Flow Reconciliation
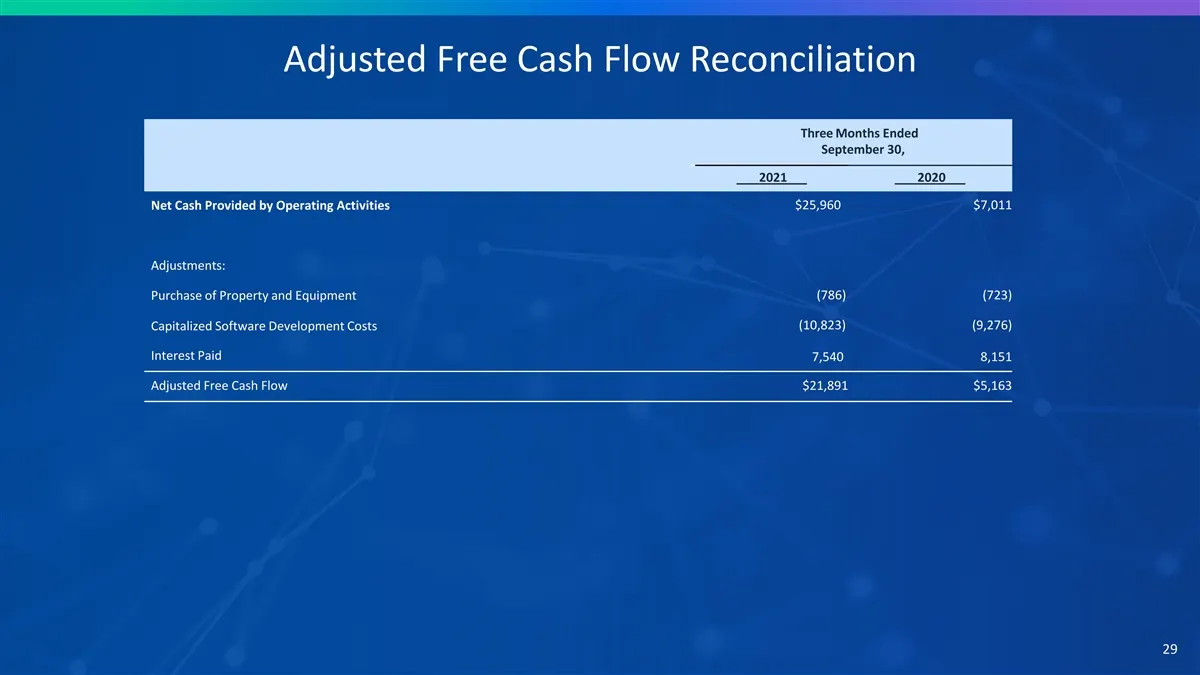
Adjusted Free Cash Flow Reconciliation Three Months Ended September 30, 2021 2020 Net Cash Provided by Operating Activities $25,960 $7,011 Adjustments: Purchase of Property and Equipment (786) (723) Capitalized Software Development Costs (10,823) (9,276) Interest Paid 7,540 8,151 Adjusted Free Cash
Slide 30: Summary Risk Factors
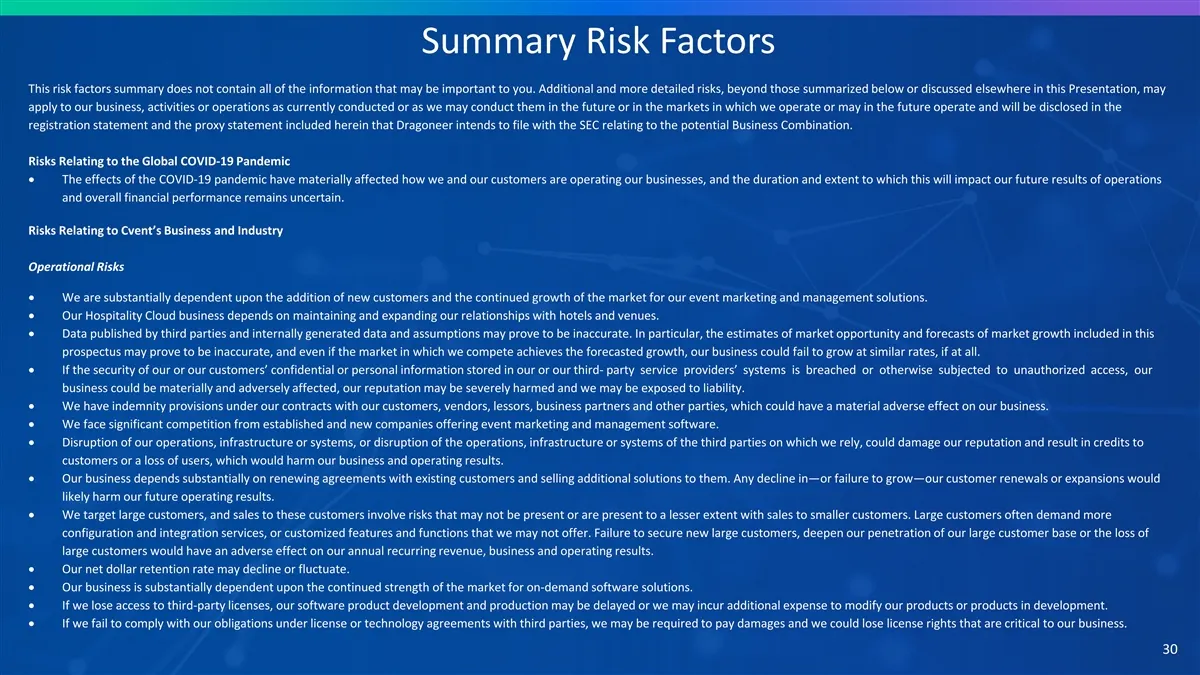
Summary Risk Factors This risk factors summary does not contain all of the information that may be important to you. Additional and more detailed risks, beyond those summarized below or discussed elsewhere in this Presentation, may apply to our business, activities or operations as currently conduct
Slide 31: Summary Risk Factors
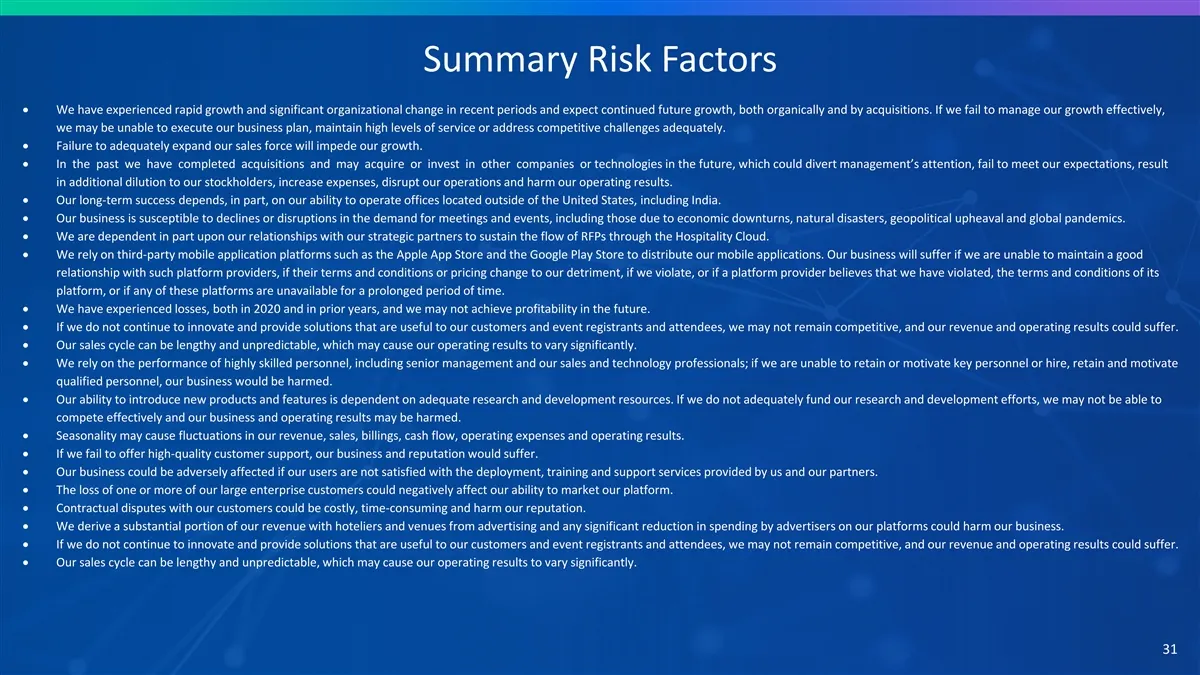
Summary Risk Factors • We have experienced rapid growth and significant organizational change in recent periods and expect continued future growth, both organically and by acquisitions. If we fail to manage our growth effectively, we may be unable to execute our business plan, maintain high levels o
Slide 32: Summary Risk Factors
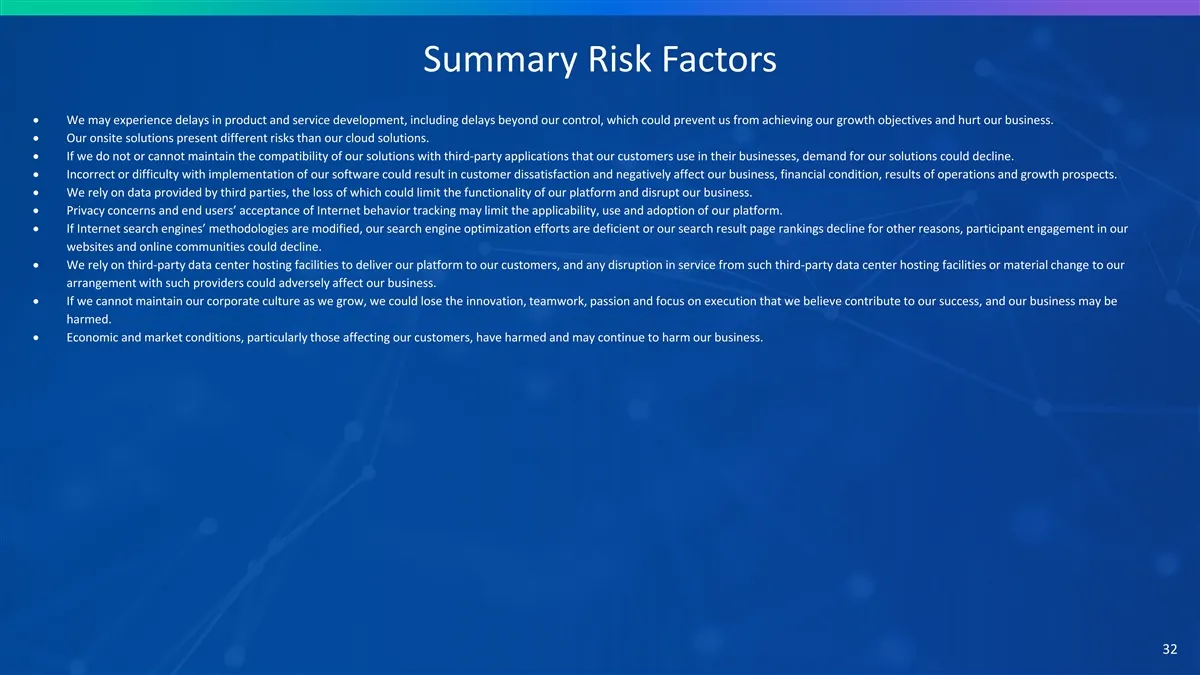
Summary Risk Factors • We may experience delays in product and service development, including delays beyond our control, which could prevent us from achieving our growth objectives and hurt our business. • Our onsite solutions present different risks than our cloud solutions. • If we do not or canno
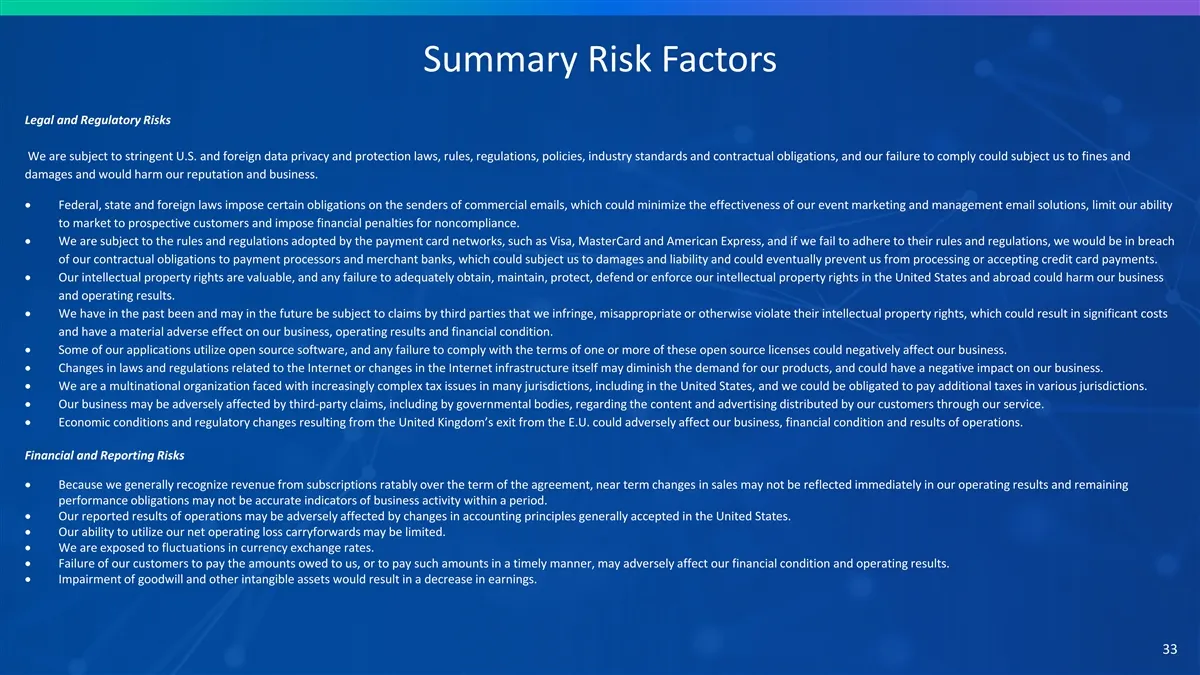
Slide 33: Summary Risk Factors: Legal and Regulatory Risks
Summary Risk Factors Legal and Regulatory Risks We are subject to stringent U.S. and foreign data privacy and protection laws, rules, regulations, policies, industry standards and contractual obligations, and our failure to comply could subject us to fines and damages and would harm our reputation a
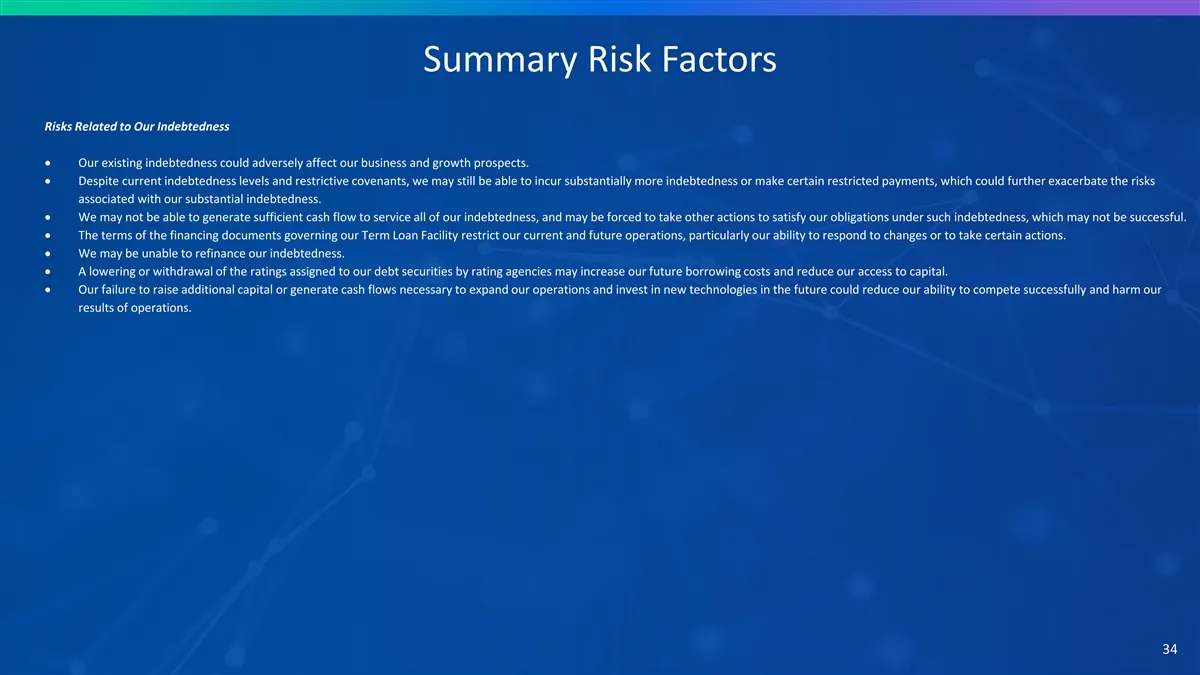
Slide 34: Summary Risk Factors: Risks Related to Our Indebtedness
Summary Risk Factors Risks Related to Our Indebtedness • Our existing indebtedness could adversely affect our business and growth prospects. • Despite current indebtedness levels and restrictive covenants, we may still be able to incur substantially more indebtedness or make certain restricted payme
Source: SEC EDGAR · 425 filed Nov 10, 2021
More decks from Cvent Holding Corp
 Investor Presentation (March 2022)54 slides · Mar 7, 2022
 Dragoneer Growth Opportunities Corp. II — SPAC Merger (December 2021)5 slides · Dec 7, 2021
 Dragoneer Growth Opportunities Corp. II — SPAC Merger (December 2021)82 slides · Dec 3, 2021
 Dragoneer Growth Opportunities Corp. II — SPAC Merger (December 2021)11 slides · Dec 2, 2021
 Dragoneer Growth Opportunities Corp. II — Wells Fargo 5th Annual TMT Summit 202137 slides · Nov 30, 2021
 Dragoneer Growth Opportunities Corp. II — SPAC Merger (November 2021)5 slides · Nov 5, 2021