Great Western Bancorp — Q3 FY2020 Earnings Presentation
38 slides from Great Western Bancorp's earnings presentation, Jul 29, 2020
Slide 1: Quarterly Investor Relations Presentation
Quarterly Investor Relations Presentation At and for the three and nine months ended June 30, 2020
Slide 2: Company Overview and 3QFY20 Financial Highlights
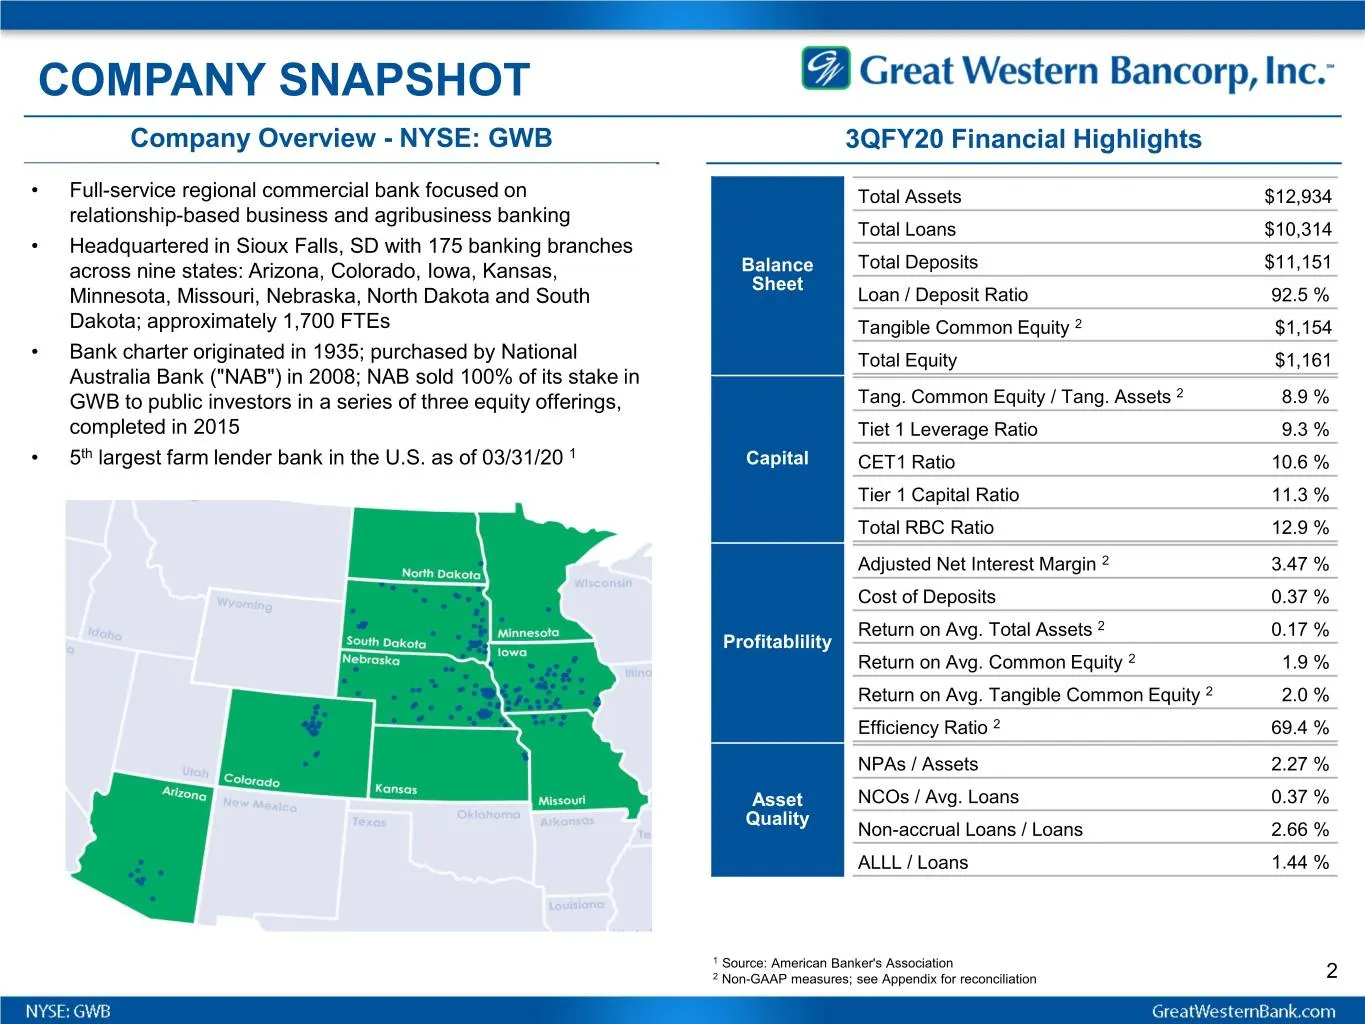
COMPANYFootprint SNAPSHOT Company Overview - NYSE: GWB 3QFY20 Financial Highlights • Full-service regional commercial bank focused on Total Assets $12,934 relationship-based business and agribusiness banking Total Loans $10,314 • Headquartered in Sioux Falls, SD with 175 banking branches across nine
Slide 3: Experienced Management Team
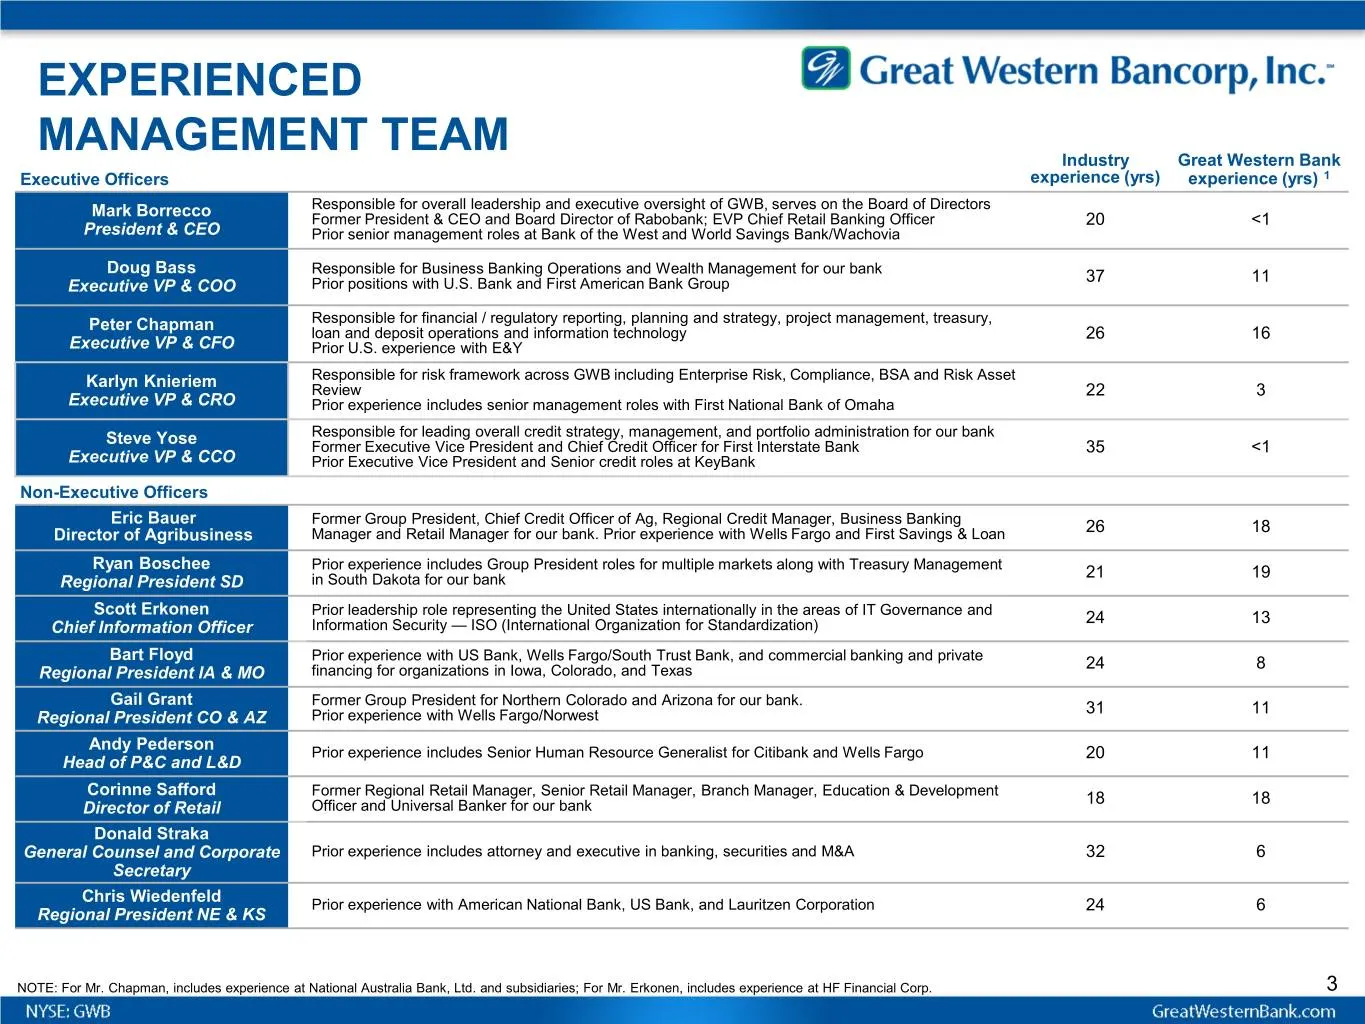
EXPERIENCED MANAGEMENT TEAM x x Industry Great Western Bank Executive Officers experience (yrs) experience (yrs) 1 x Responsible for overall leadership and executive oversight of GWB, serves on the Board of Directors Mark Borrecco Former President & CEO and Board Director of Rabobank; EVP Chief Reta
Slide 4: Key Developments
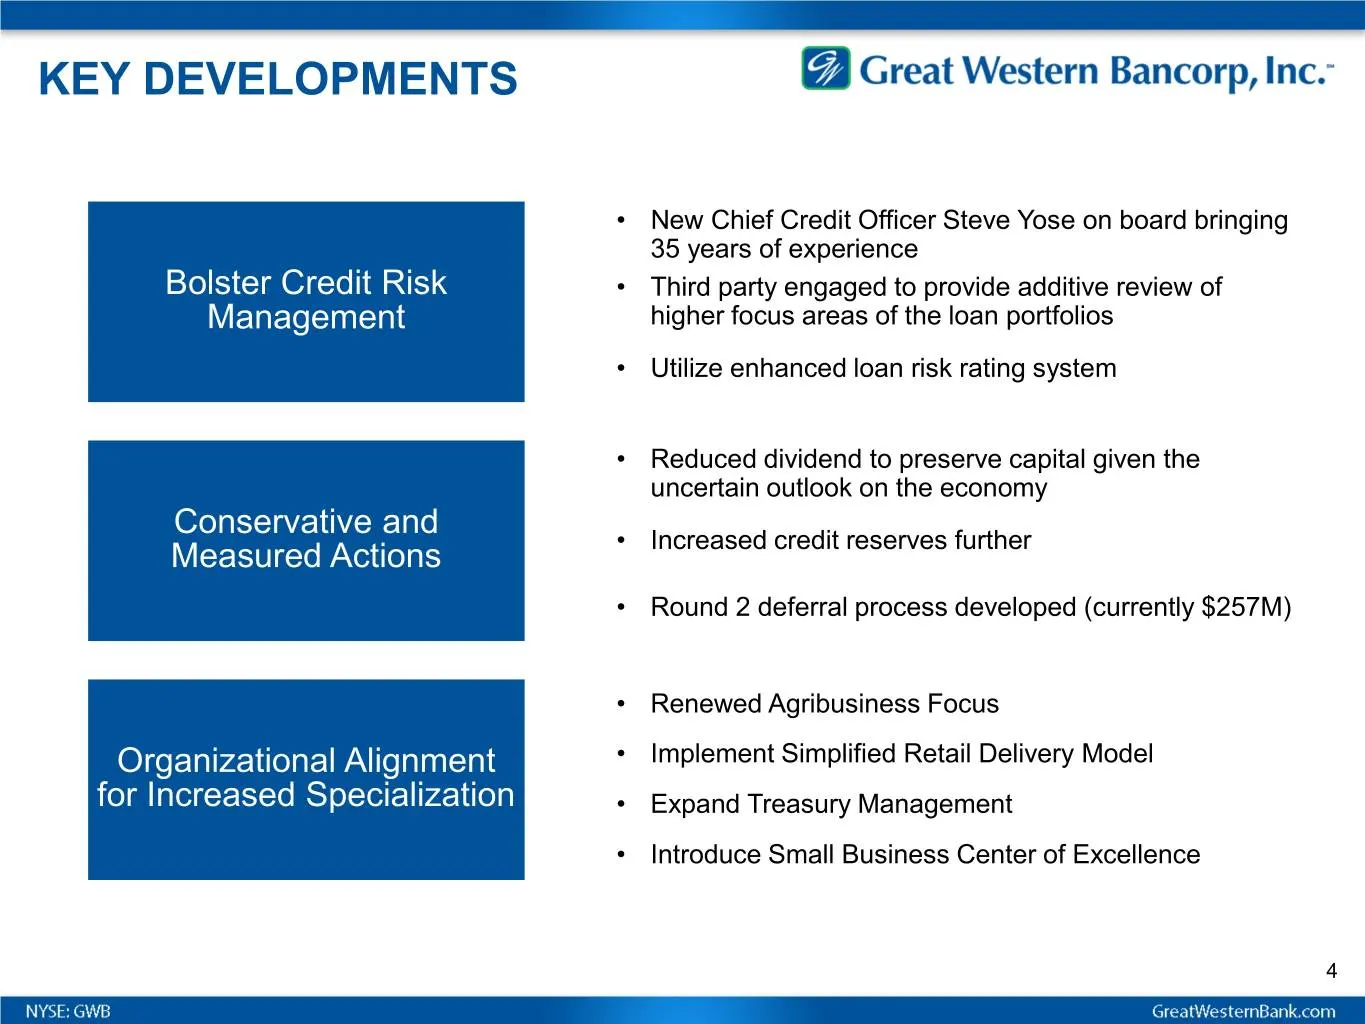
KEY DEVELOPMENTS • New Chief Credit Officer Steve Yose on board bringing 35 years of experience Bolster Credit Risk • Third party engaged to provide additive review of Management higher focus areas of the loan portfolios • Utilize enhanced loan risk rating system • Reduced dividend to preserve capit
Slide 5: COVID-19 Response Update
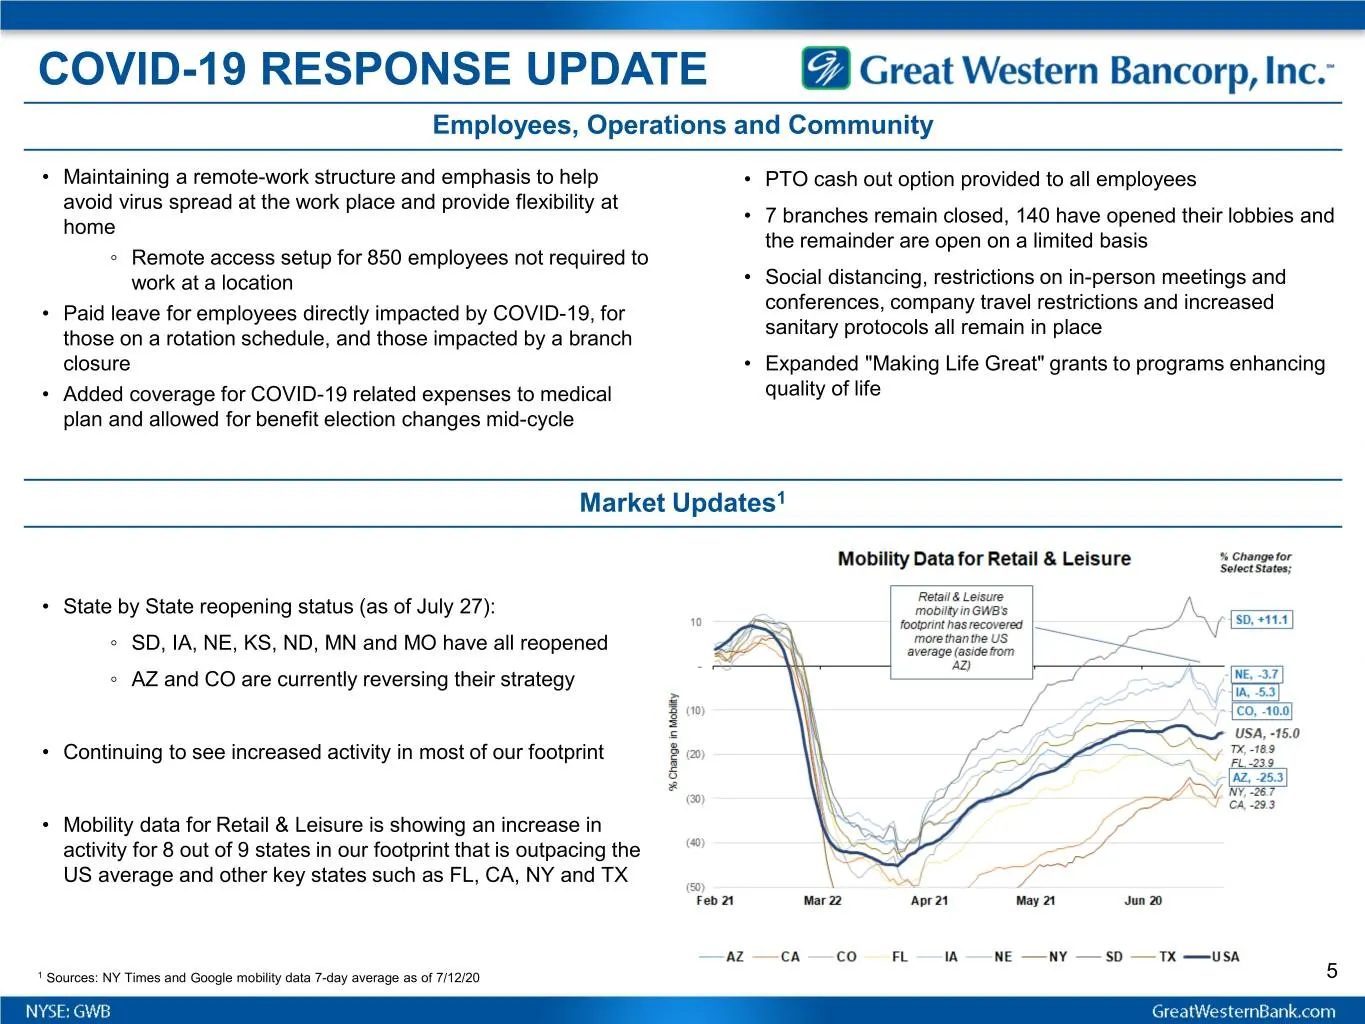
COVID-19 RESPONSE UPDATE Employees, Operations and Community • Maintaining a remote-work structure and emphasis to help • PTO cash out option provided to all employees avoid virus spread at the work place and provide flexibility at • 7 branches remain closed, 140 have opened their lobbies and home t
Slide 6: PPP Loans and Deferrals
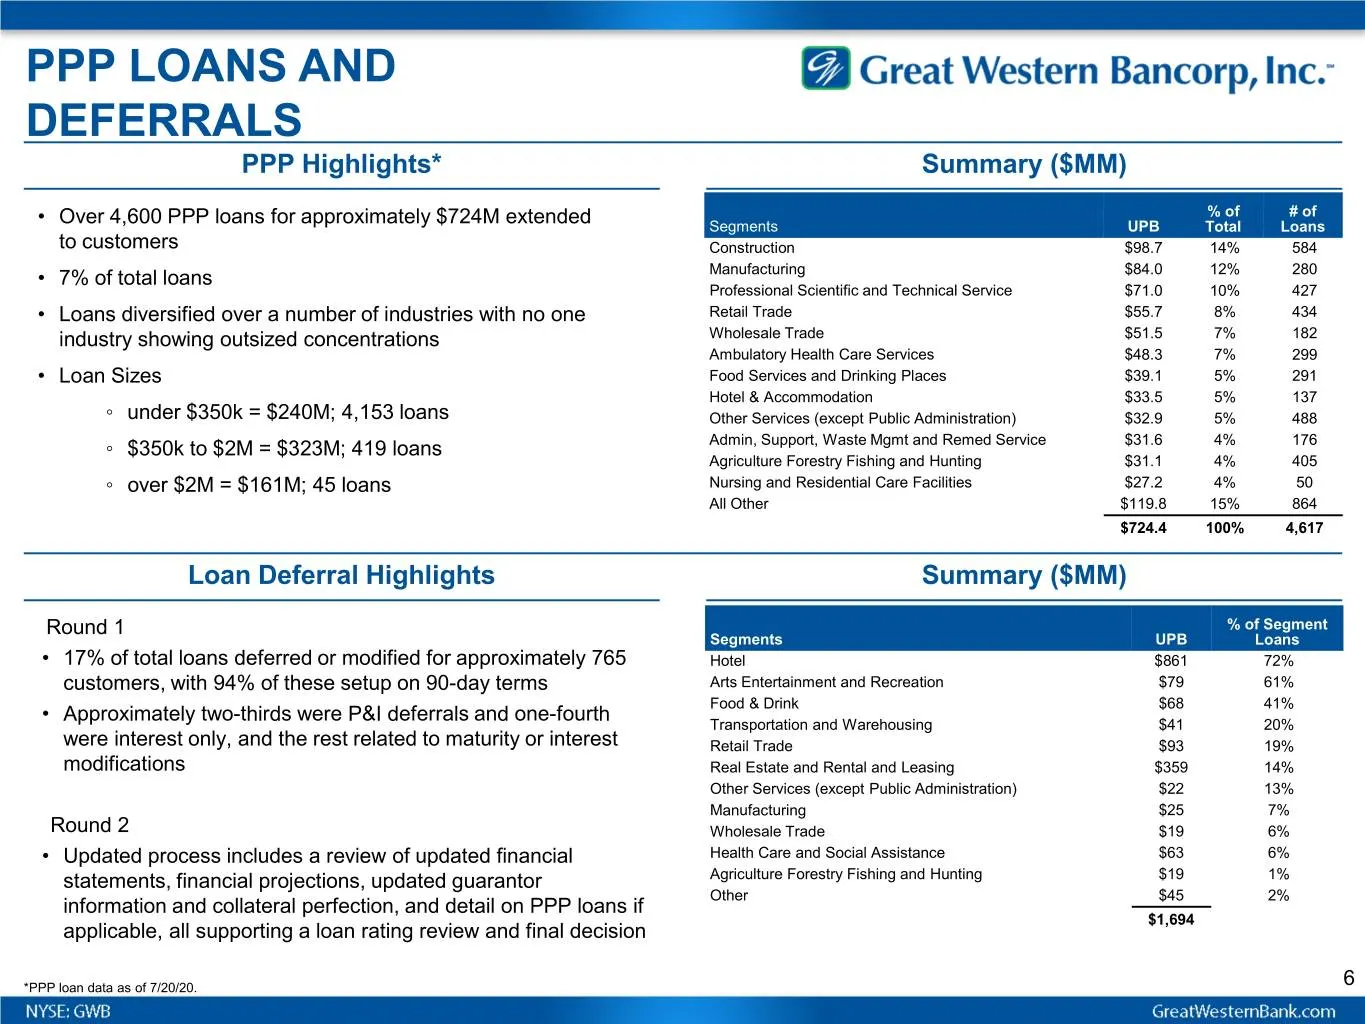
PPP LOANS AND DEFERRALS PPP Highlights* Summary ($MM) % of # of • Over 4,600 PPP loans for approximately $724M extended Segments UPB Total Loans to customers Construction $98.7 14% 584 • 7% of total loans Manufacturing $84.0 12% 280 Professional Scientific and Technical Service $71.0 10% 427 • Loans
Slide 7: Loan Portfolio Composition
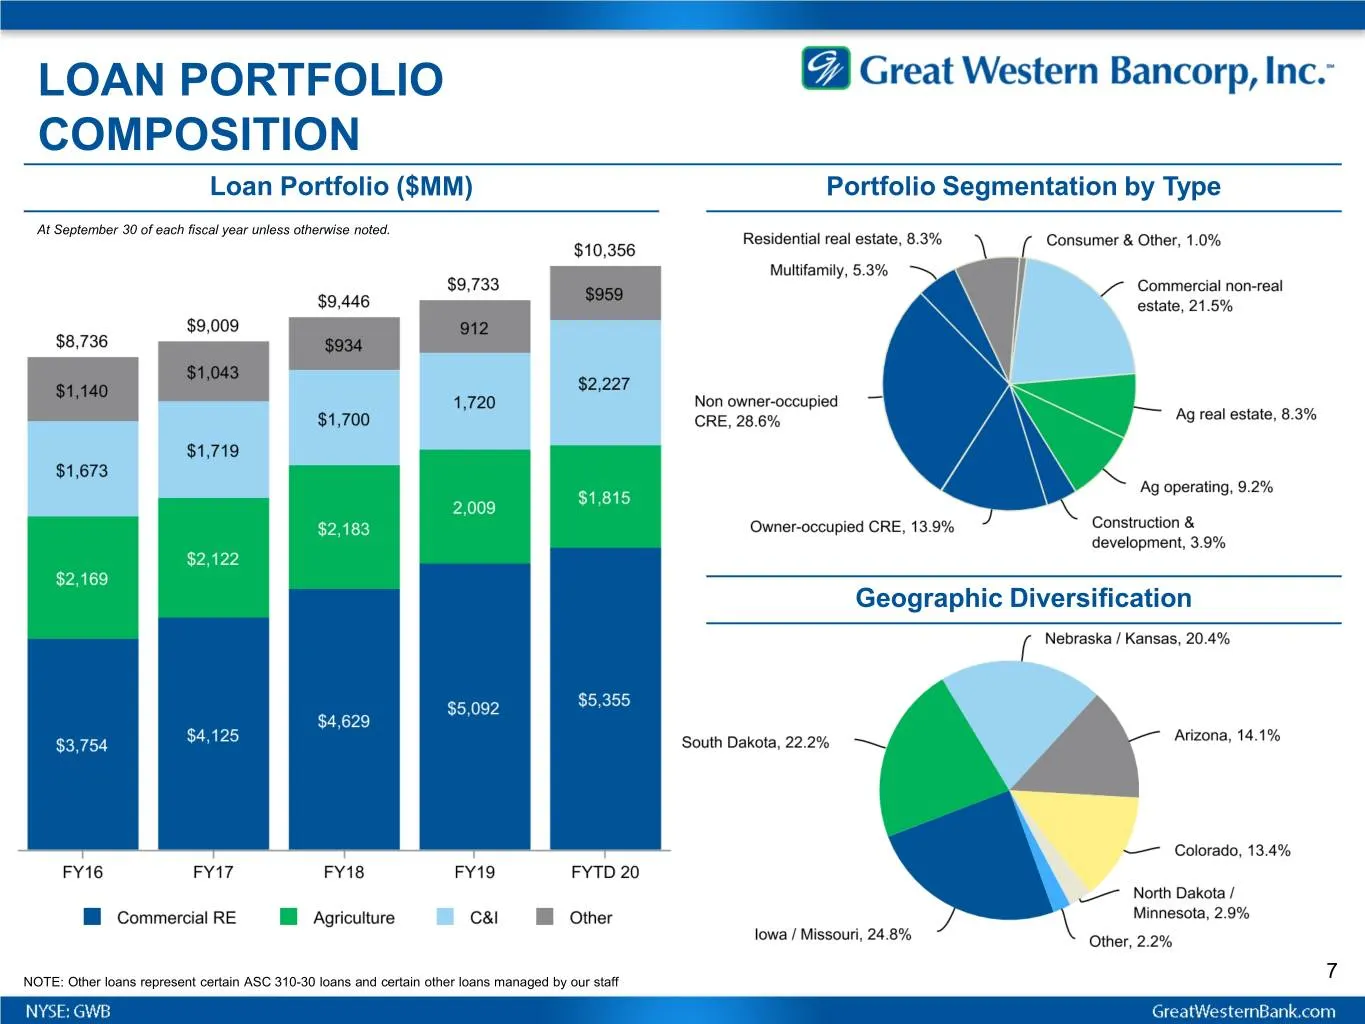
LOAN PORTFOLIO COMPOSITION Loan Portfolio ($MM) Portfolio Segmentation by Type At September 30 of each fiscal year unless otherwise noted. Geographic Diversification NOTE: Other loans represent certain ASC 310-30 loans and certain other loans managed by our staff 7
Slide 8: Commercial Loans
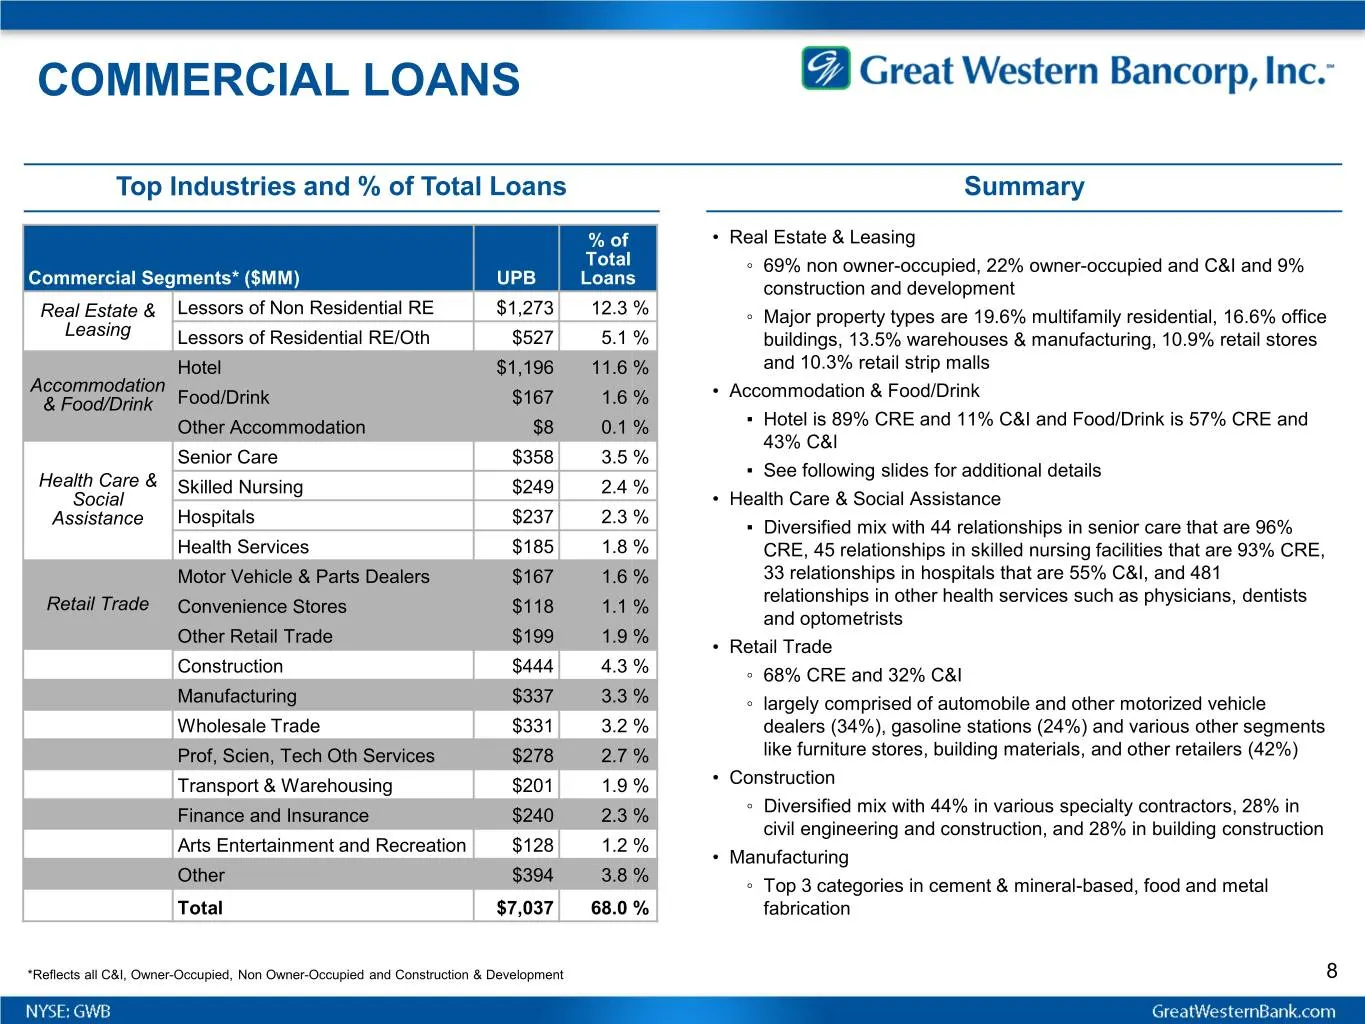
COMMERCIAL LOANS Top Industries and % of Total Loans Summary % of • Real Estate & Leasing Total ◦ 69% non owner-occupied, 22% owner-occupied and C&I and 9% Commercial Segments* ($MM) UPB Loans construction and development Real Estate & Lessors of Non Residential RE $1,273 12.3 % ◦ Major property typ
Slide 9: Key Loan Segments
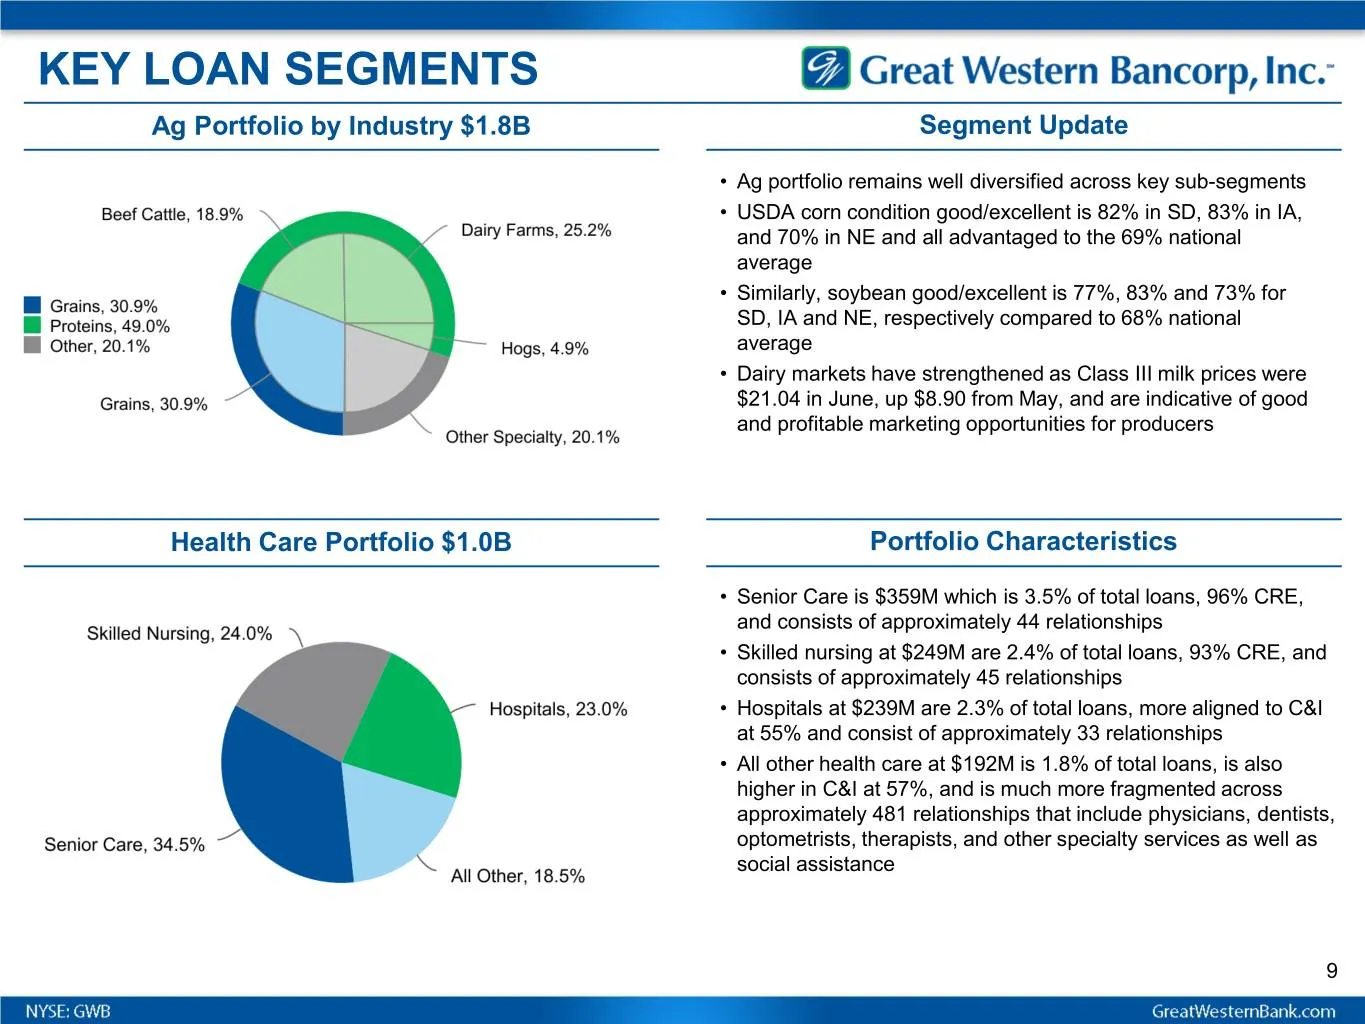
KEY LOAN SEGMENTS Ag Portfolio by Industry $1.8B Segment Update • Ag portfolio remains well diversified across key sub-segments • USDA corn condition good/excellent is 82% in SD, 83% in IA, and 70% in NE and all advantaged to the 69% national average • Similarly, soybean good/excellent is 77%, 83% a
Slide 10: Key Loan Segments (cont'd)
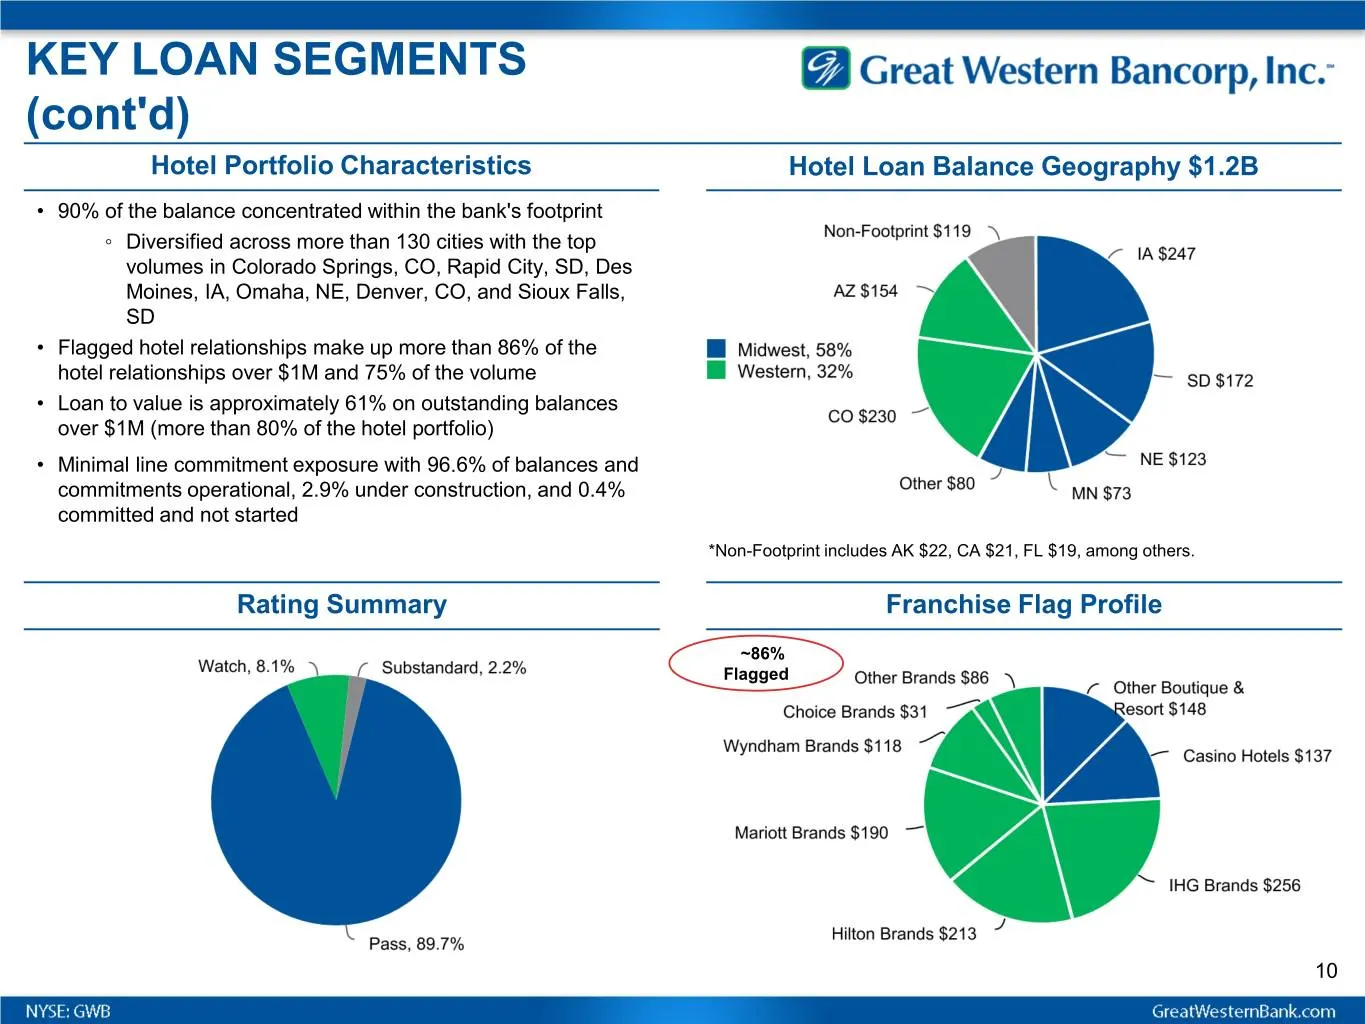
KEY LOAN SEGMENTS (cont'd) Hotel Portfolio Characteristics Hotel Loan Balance Geography $1.2B • 90% of the balance concentrated within the bank's footprint ◦ Diversified across more than 130 cities with the top volumes in Colorado Springs, CO, Rapid City, SD, Des Moines, IA, Omaha, NE, Denver, CO, a
Slide 11: Asset Quality Metrics
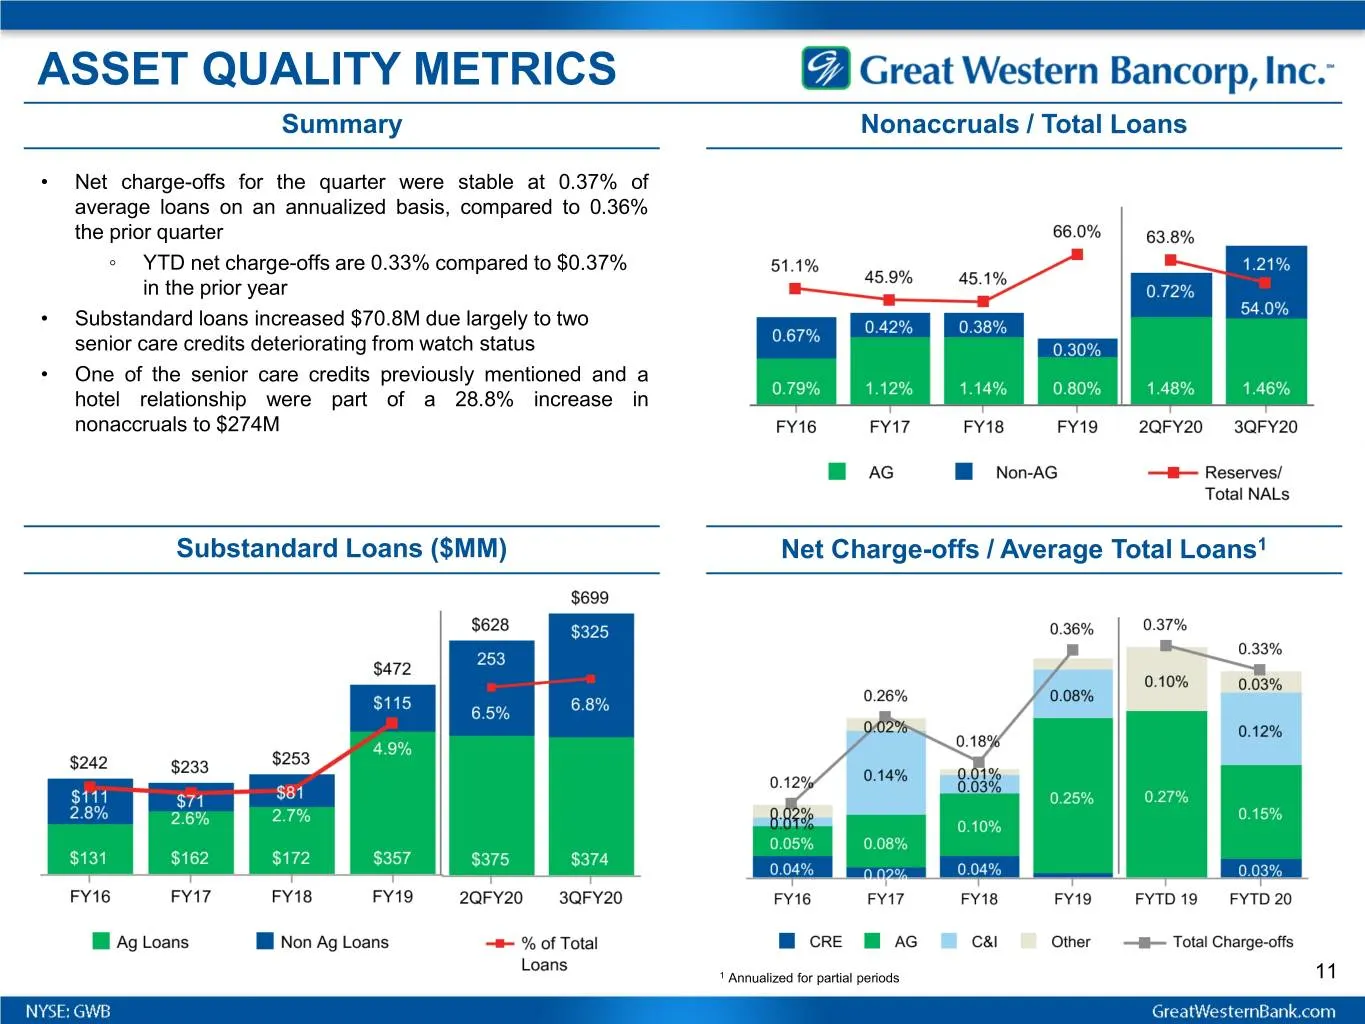
ASSET QUALITY METRICS Summary Nonaccruals / Total Loans • Net charge-offs for the quarter were stable at 0.37% of average loans on an annualized basis, compared to 0.36% the prior quarter ◦ YTD net charge-offs are 0.33% compared to $0.37% in the prior year • Substandard loans increased $70.8M due la
Slide 12: Asset Quality & CECL
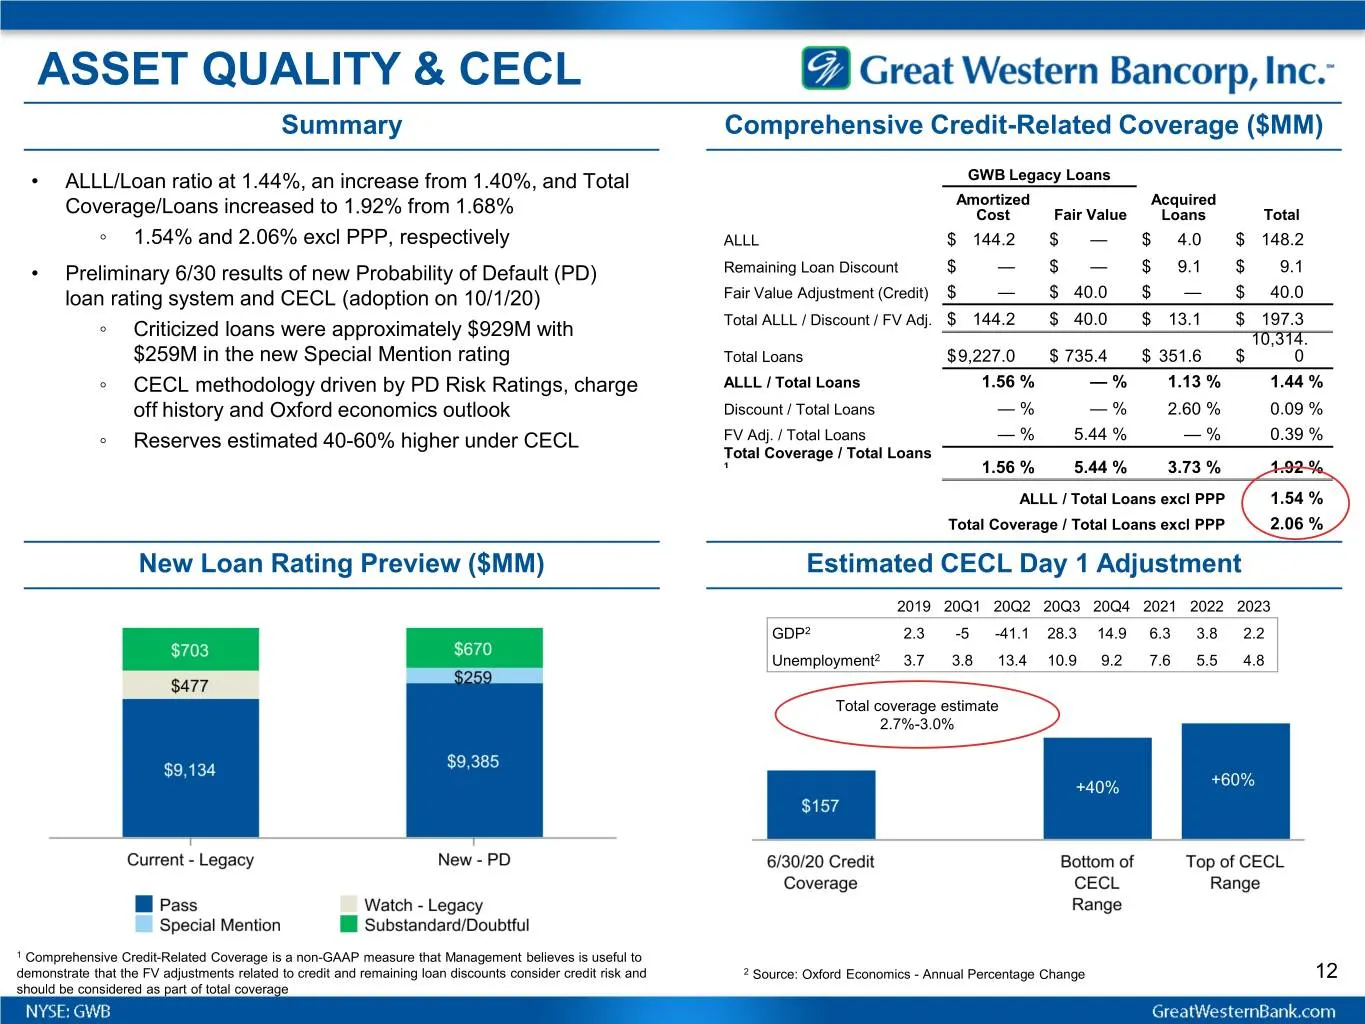
ASSET QUALITY & CECL Summary Comprehensive Credit-Related Coverage ($MM) • ALLL/Loan ratio at 1.44%, an increase from 1.40%, and Total GWB Legacy Loans Amortized Acquired Coverage/Loans increased to 1.92% from 1.68% Cost Fair Value Loans Total ◦ 1.54% and 2.06% excl PPP, respectively ALLL $ 144.2 $
Slide 13: Ag Loan Asset Quality
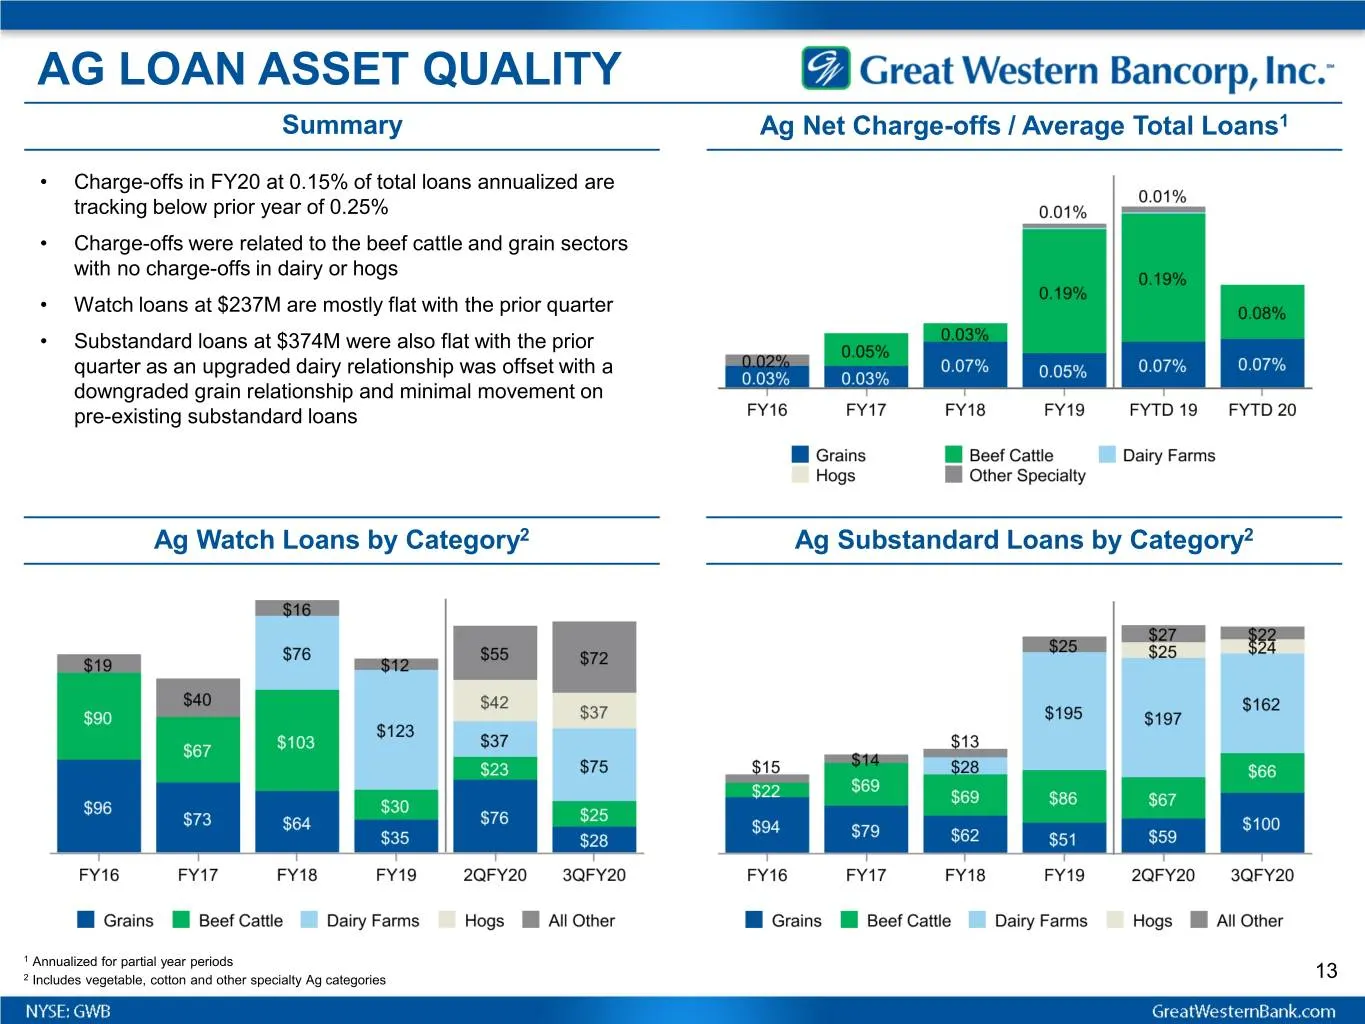
AG LOAN ASSET QUALITY Summary Ag Net Charge-offs / Average Total Loans1 • Charge-offs in FY20 at 0.15% of total loans annualized are tracking below prior year of 0.25% • Charge-offs were related to the beef cattle and grain sectors with no charge-offs in dairy or hogs • Watch loans at $237M are most
Slide 14: Investments & Borrowings
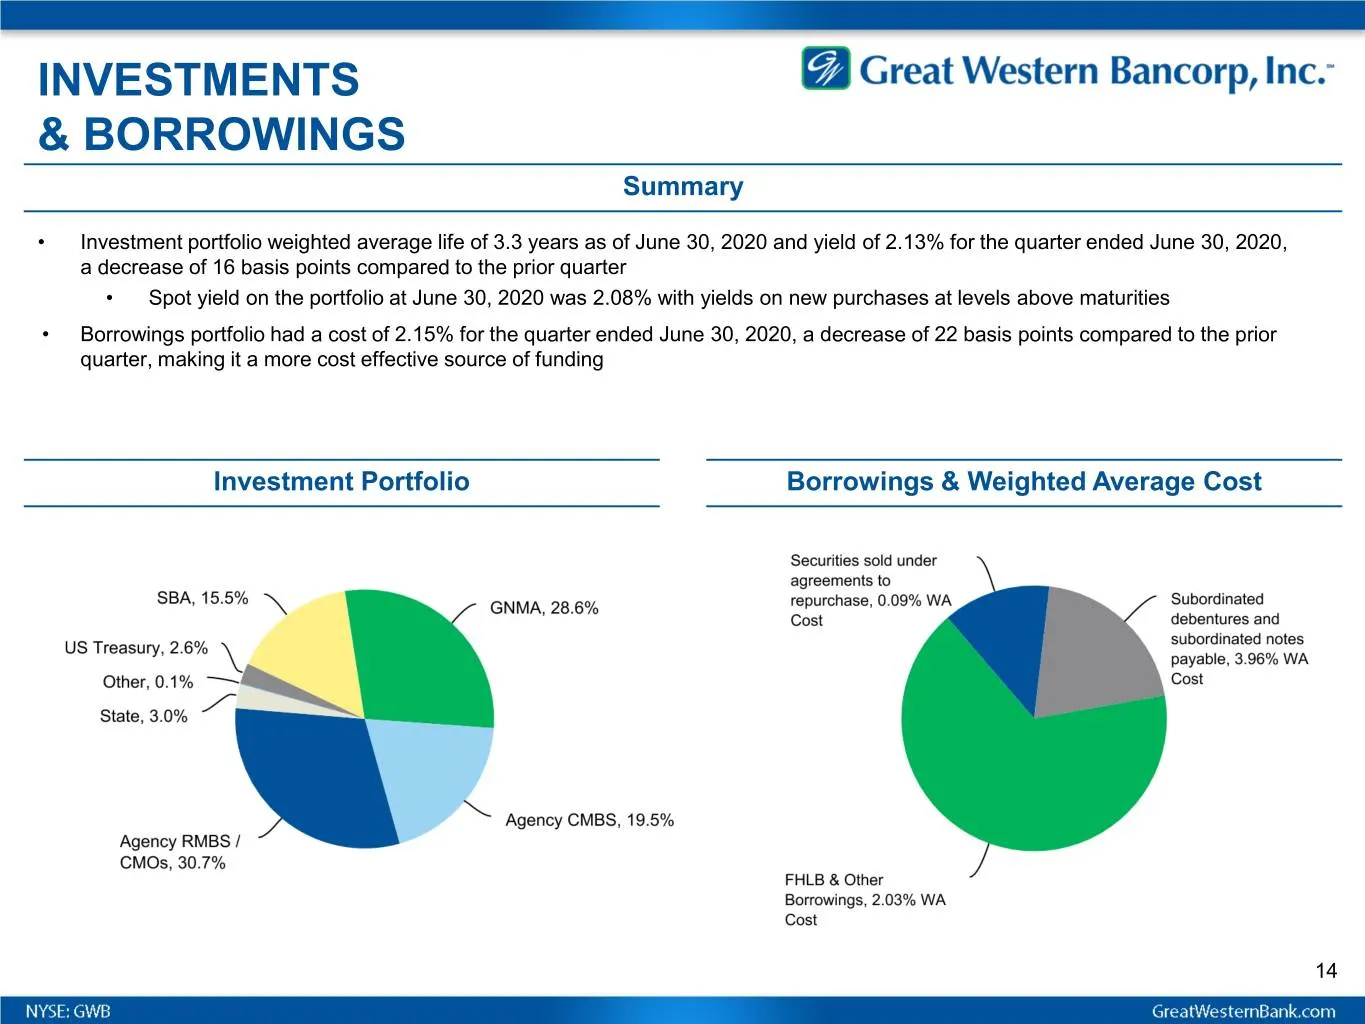
INVESTMENTS & BORROWINGS Summary • Investment portfolio weighted average life of 3.3 years as of June 30, 2020 and yield of 2.13% for the quarter ended June 30, 2020, a decrease of 16 basis points compared to the prior quarter • Spot yield on the portfolio at June 30, 2020 was 2.08% with yields on n
Slide 15: Liquidity Detail
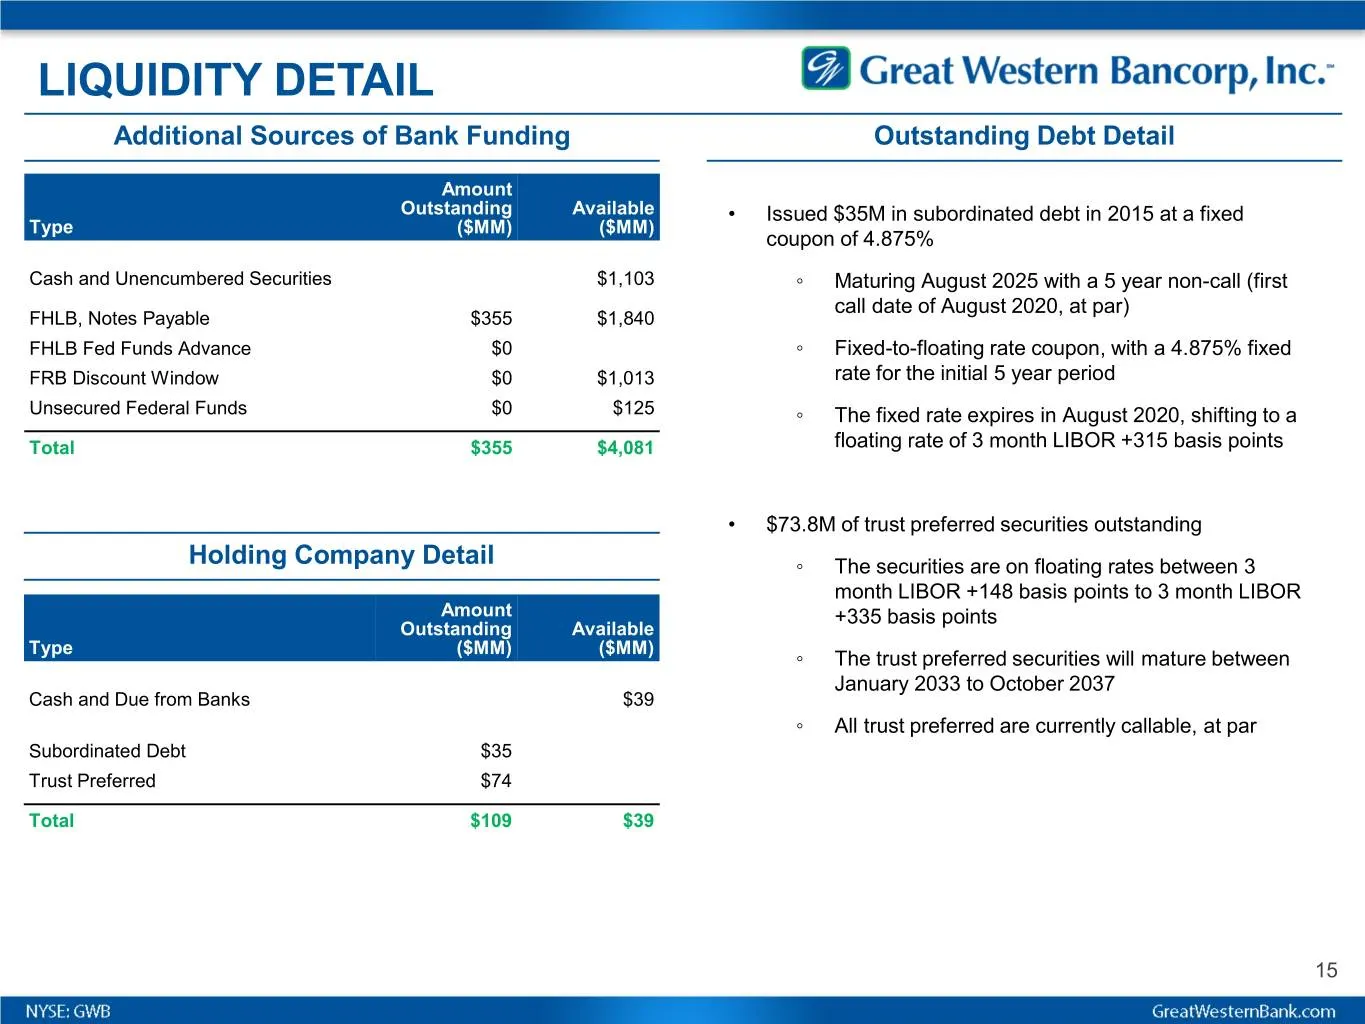
LIQUIDITY DETAIL Additional Sources of Bank Funding Outstanding Debt Detail Amount Outstanding Available • Issued $35M in subordinated debt in 2015 at a fixed Type ($MM) ($MM) coupon of 4.875% Cash and Unencumbered Securities $1,103 ◦ Maturing August 2025 with a 5 year non-call (first call date of A
Slide 16: Deposits
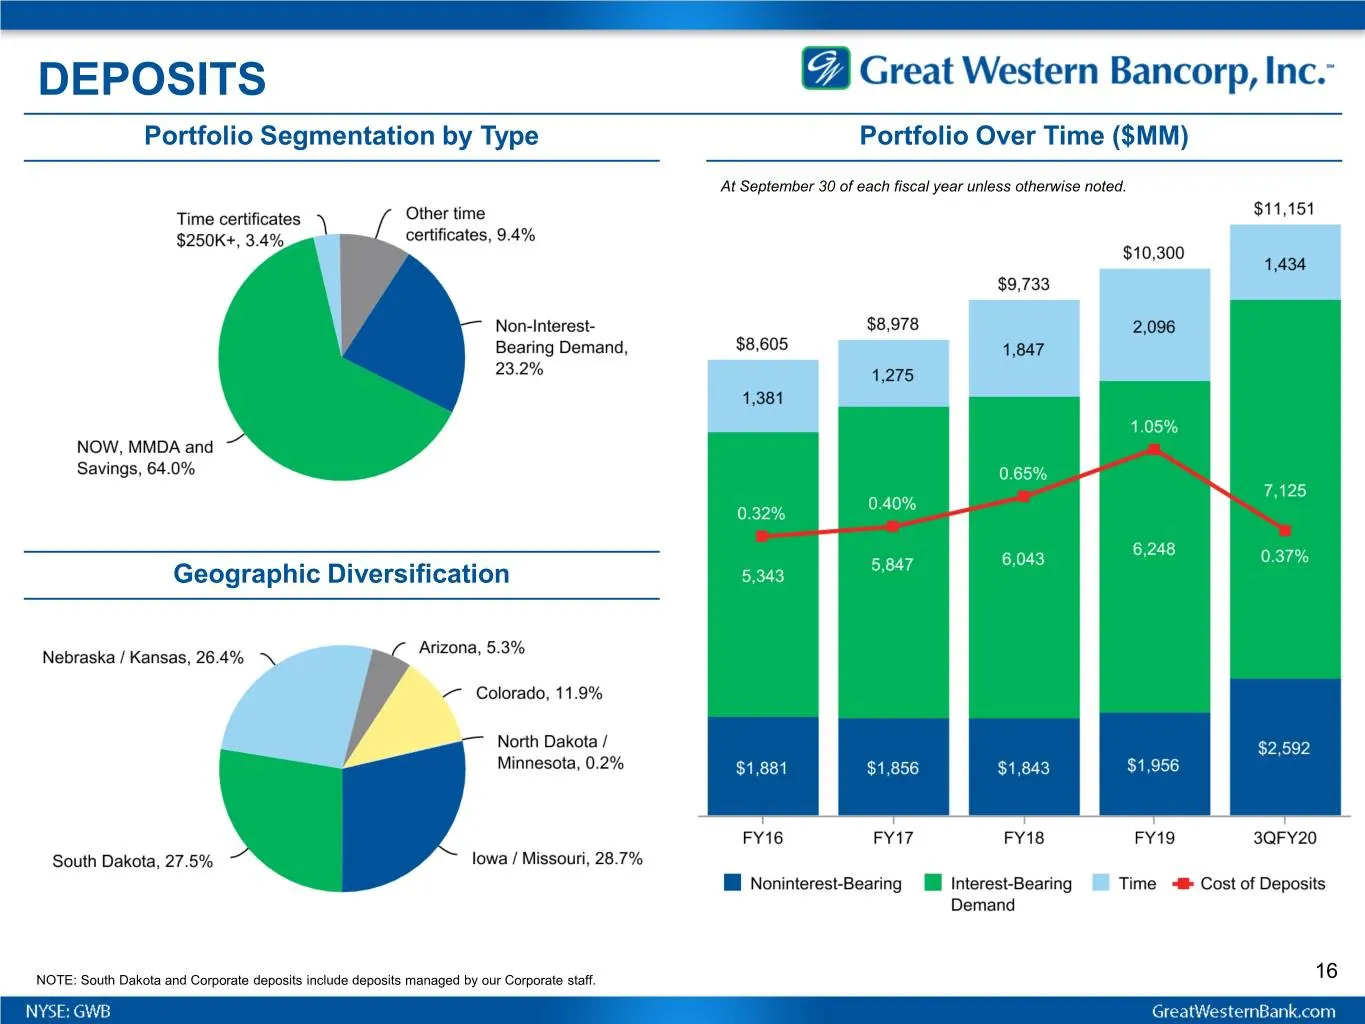
DEPOSITS Portfolio Segmentation by Type Portfolio Over Time ($MM) At September 30 of each fiscal year unless otherwise noted. Geographic Diversification NOTE: South Dakota and Corporate deposits include deposits managed by our Corporate staff. 16
Slide 17: Growth - Metro vs Rural
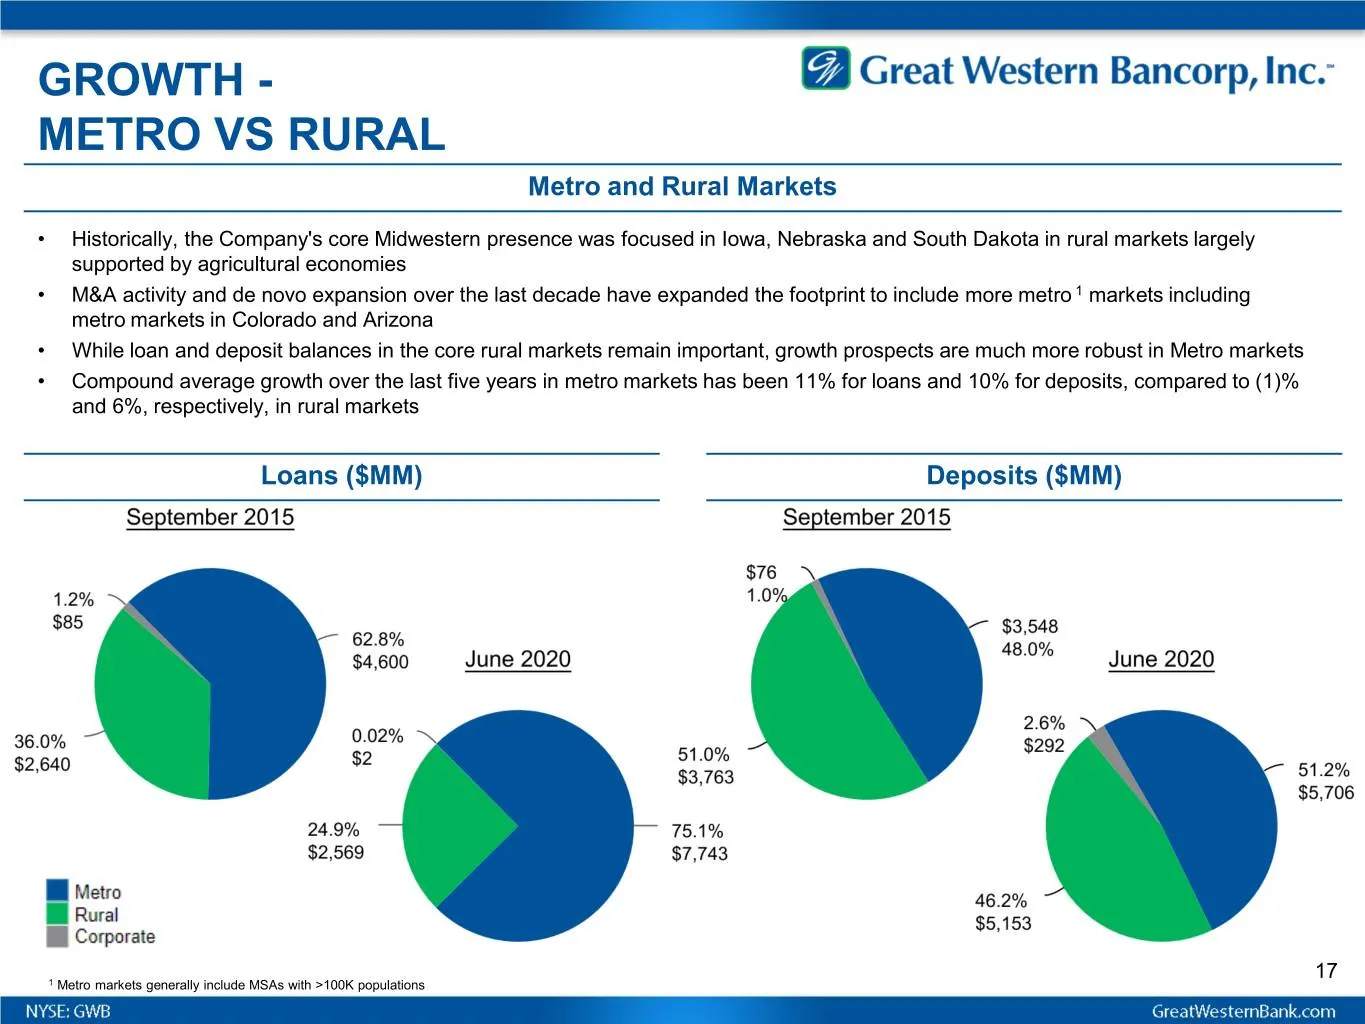
GROWTH - METRO VS RURAL Metro and Rural Markets • Historically, the Company's core Midwestern presence was focused in Iowa, Nebraska and South Dakota in rural markets largely supported by agricultural economies • M&A activity and de novo expansion over the last decade have expanded the footprint to
Slide 18: Capital
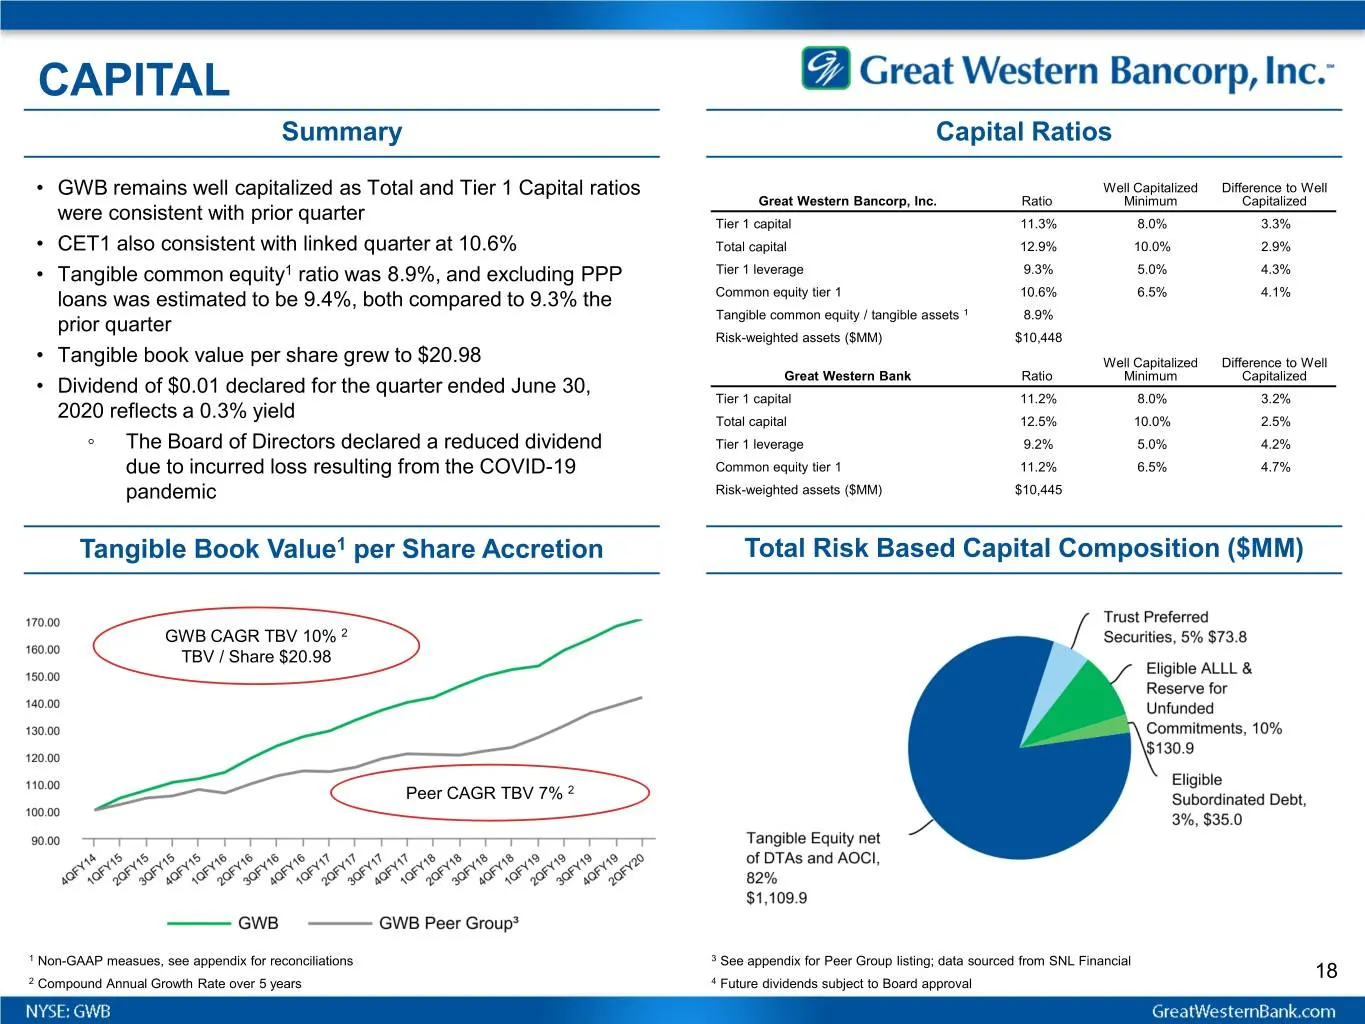
CAPITAL Summary Capital Ratios • GWB remains well capitalized as Total and Tier 1 Capital ratios Well Capitalized Difference to Well Great Western Bancorp, Inc. Ratio Minimum Capitalized were consistent with prior quarter Tier 1 capital 11.3% 8.0% 3.3% • CET1 also consistent with linked quarter at 1
Slide 19: Interest Rate Sensitivity
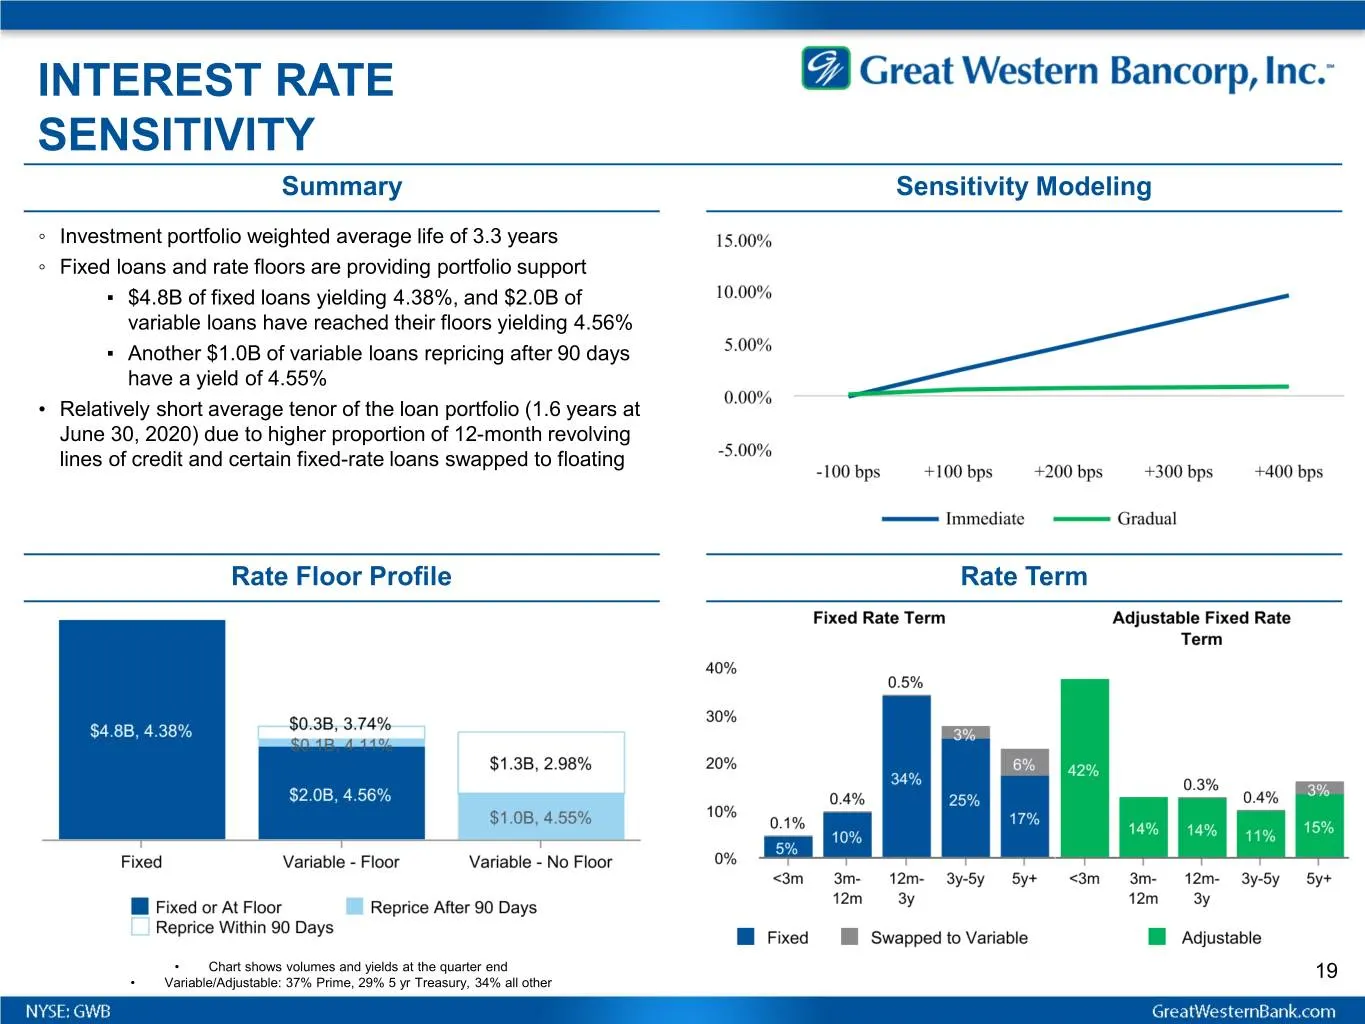
INTEREST RATE SENSITIVITY Summary Sensitivity Modeling ◦ Investment portfolio weighted average life of 3.3 years ◦ Fixed loans and rate floors are providing portfolio support ▪ $4.8B of fixed loans yielding 4.38%, and $2.0B of variable loans have reached their floors yielding 4.56% ▪ Another $1.0B o
Slide 20: Income Statement Summary
Great Western Bancorp, Inc.” Income Statement Summary
Slide 21: Earnings Overview
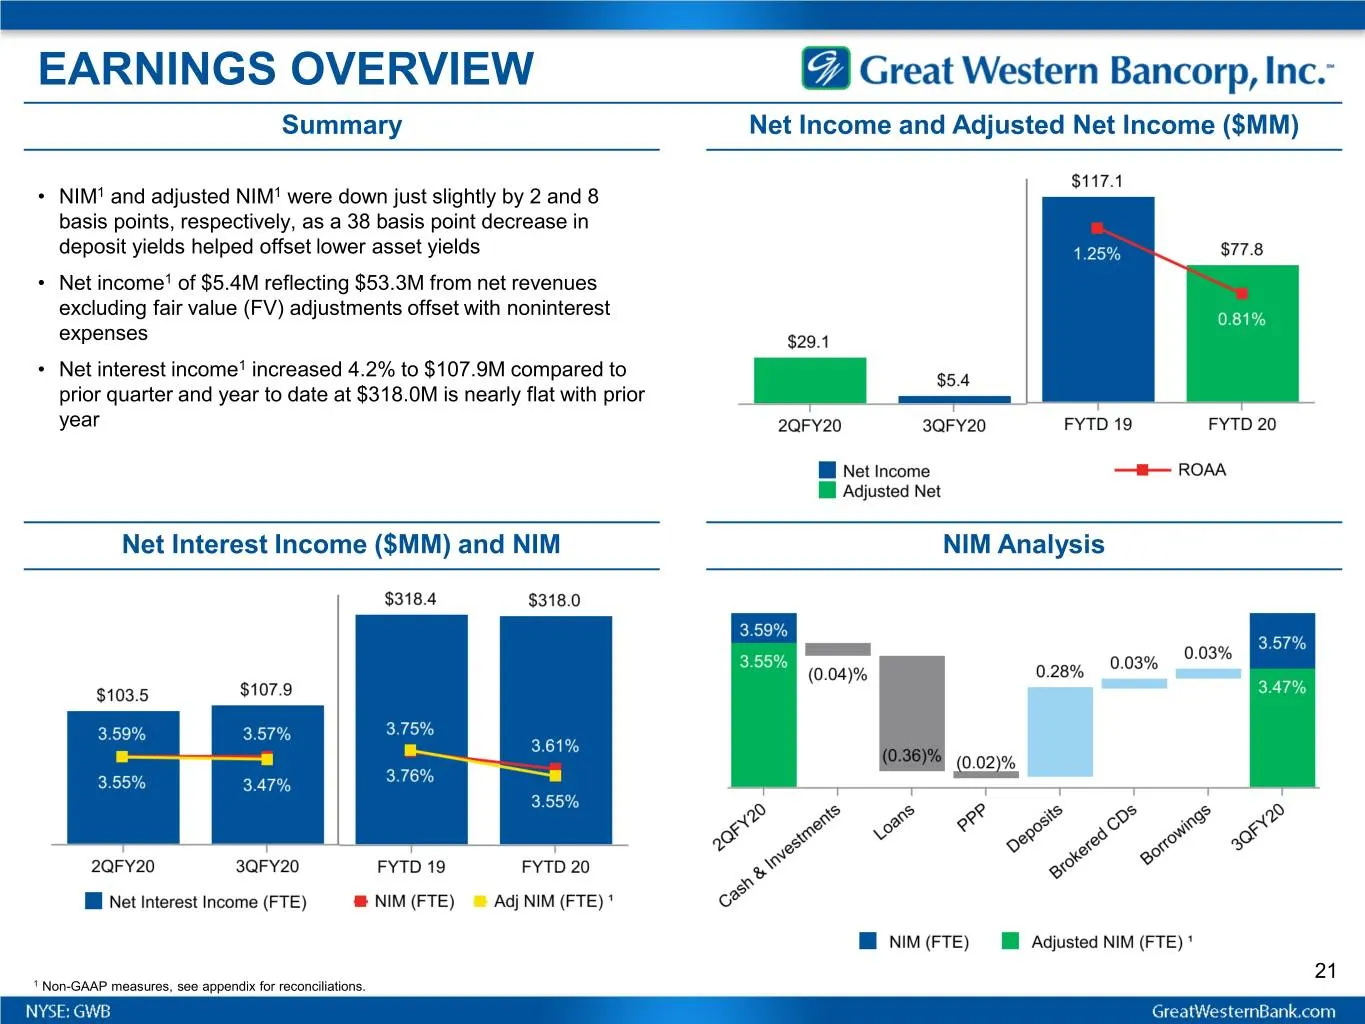
EARNINGS OVERVIEW Summary Net Income and Adjusted Net Income ($MM) • NIM1 and adjusted NIM1 were down just slightly by 2 and 8 basis points, respectively, as a 38 basis point decrease in deposit yields helped offset lower asset yields • Net income1 of $5.4M reflecting $53.3M from net revenues exclud
Slide 22: Earnings Overview (cont'd)
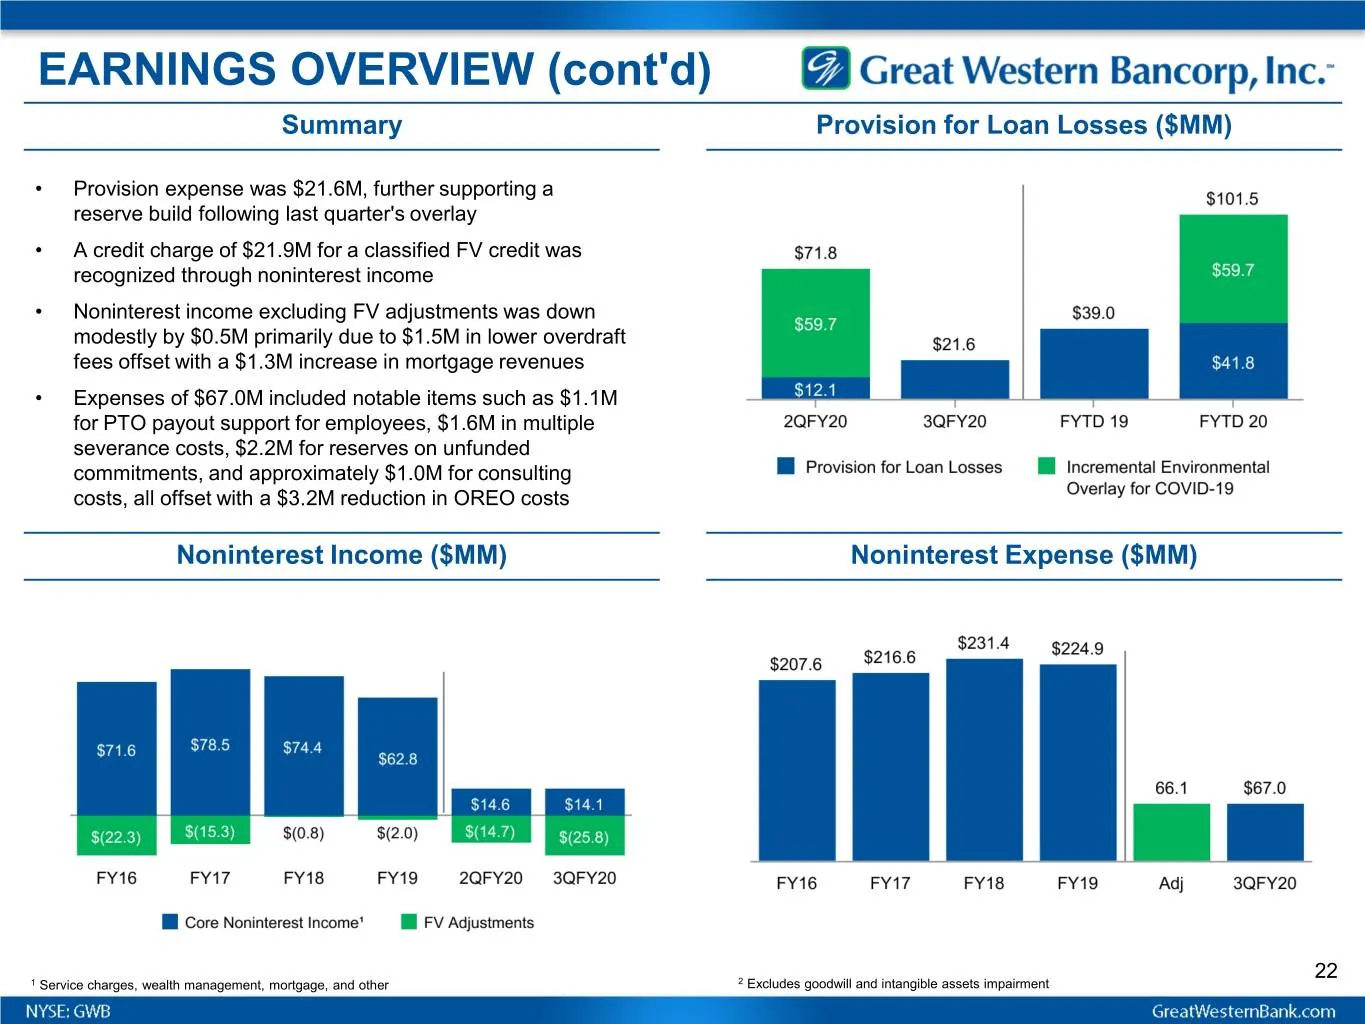
EARNINGS OVERVIEW (cont'd) Summary Provision for Loan Losses ($MM) • Provision expense was $21.6M, further supporting a reserve build following last quarter's overlay • A credit charge of $21.9M for a classified FV credit was recognized through noninterest income • Noninterest income excluding FV ad
Slide 23: Disclosures
DISCLOSURES Forward-Looking Statements: This press release contains forward-looking statements within the meaning of the Private Securities Litigation Reform Act of 1995. Statements about Great Western Bancorp, Inc.’s expectations, beliefs, plans, strategies, predictions, forecasts, objectives, assu
Slide 24: Appendix: Non-GAAP Measures
Appendix 1 Non-GAAP Measures
Slide 25: Selected GAAP & Non-GAAP Results
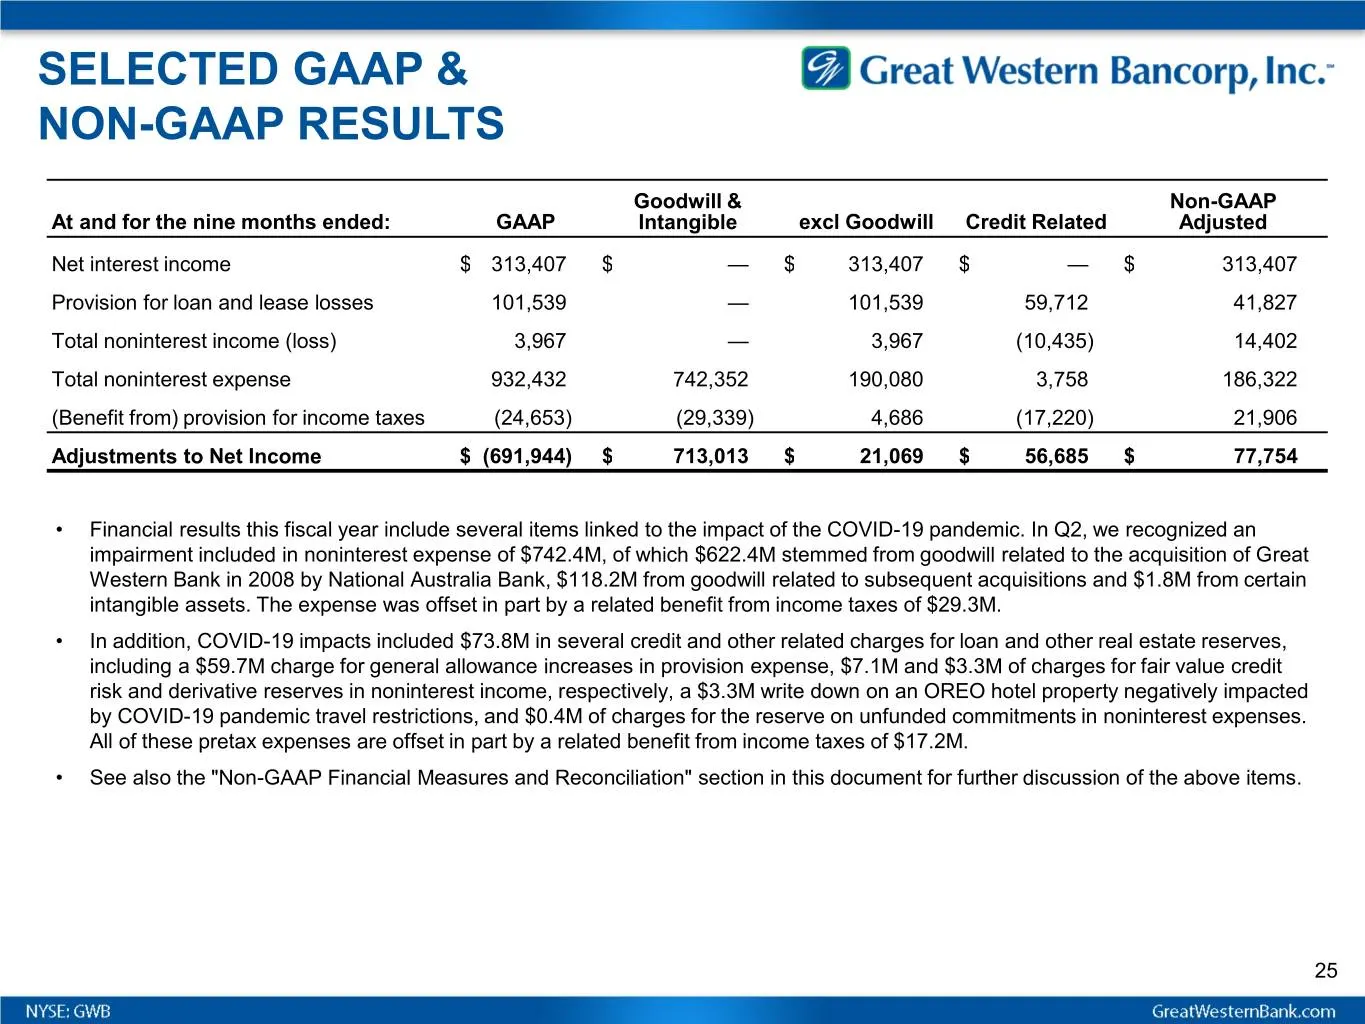
SELECTED GAAP & NON-GAAP RESULTS Goodwill & Non-GAAP At and for the nine months ended: GAAP Intangible excl Goodwill Credit Related Adjusted Net interest income $ 313,407 $ — $ 313,407 $ — $ 313,407 Provision for loan and lease losses 101,539 — 101,539 59,712 41,827 Total noninterest income (loss) 3
Slide 26: Non-GAAP Measures
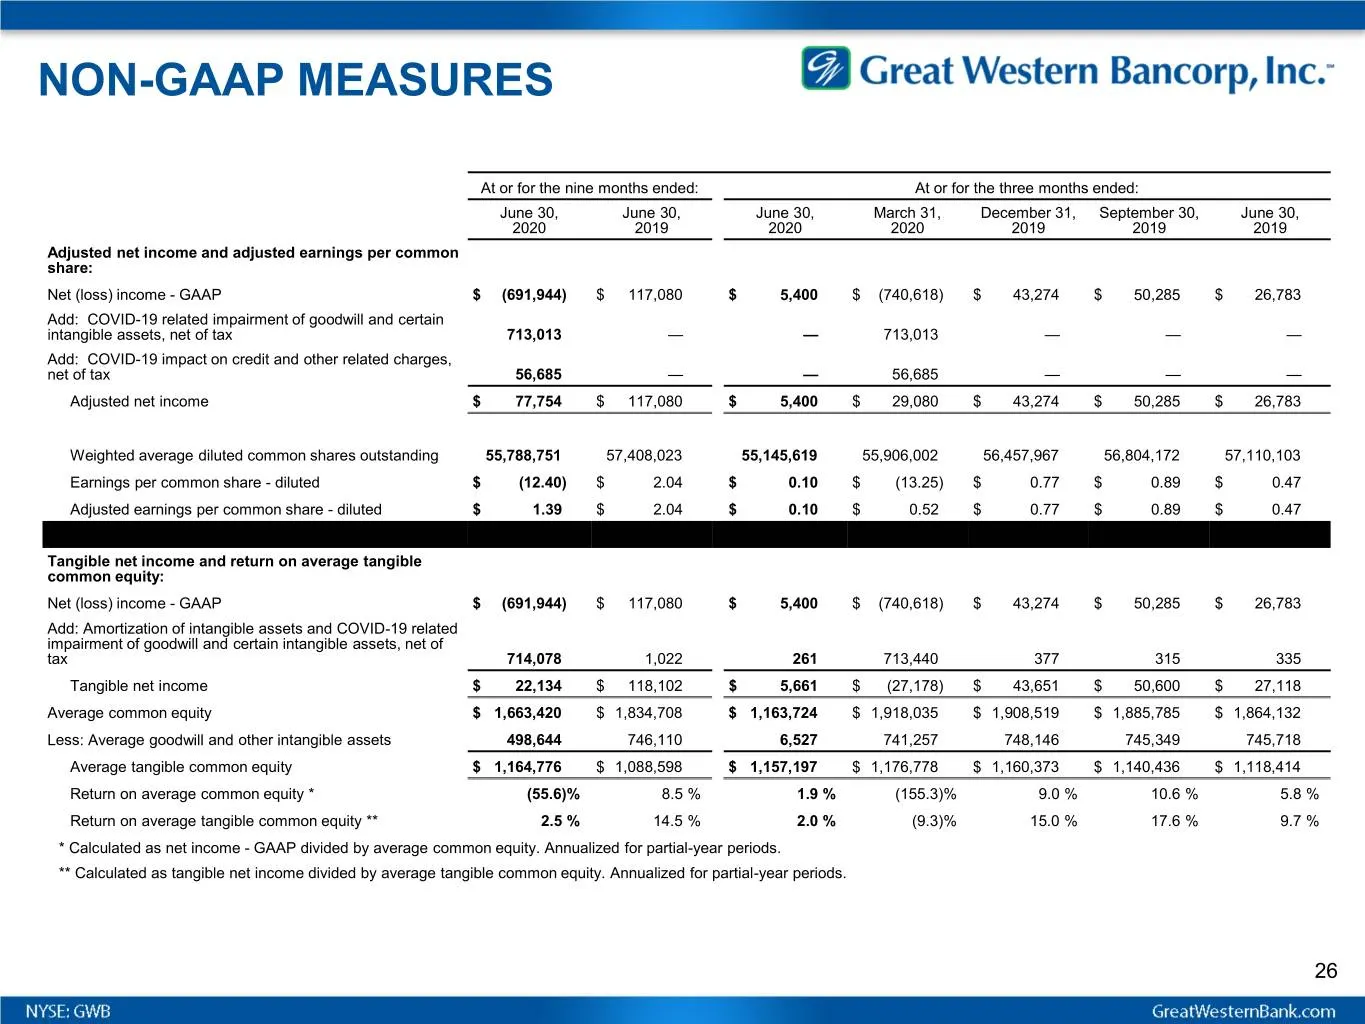
NON-GAAP MEASURES At or for the nine months ended: At or for the three months ended: June 30, June 30, June 30, March 31, December 31, September 30, June 30, 2020 2019 2020 2020 2019 2019 2019 Adjusted net income and adjusted earnings per common share: Net (loss) income - GAAP $ (691,944) $ 117,080
Slide 27: Non-GAAP Measures
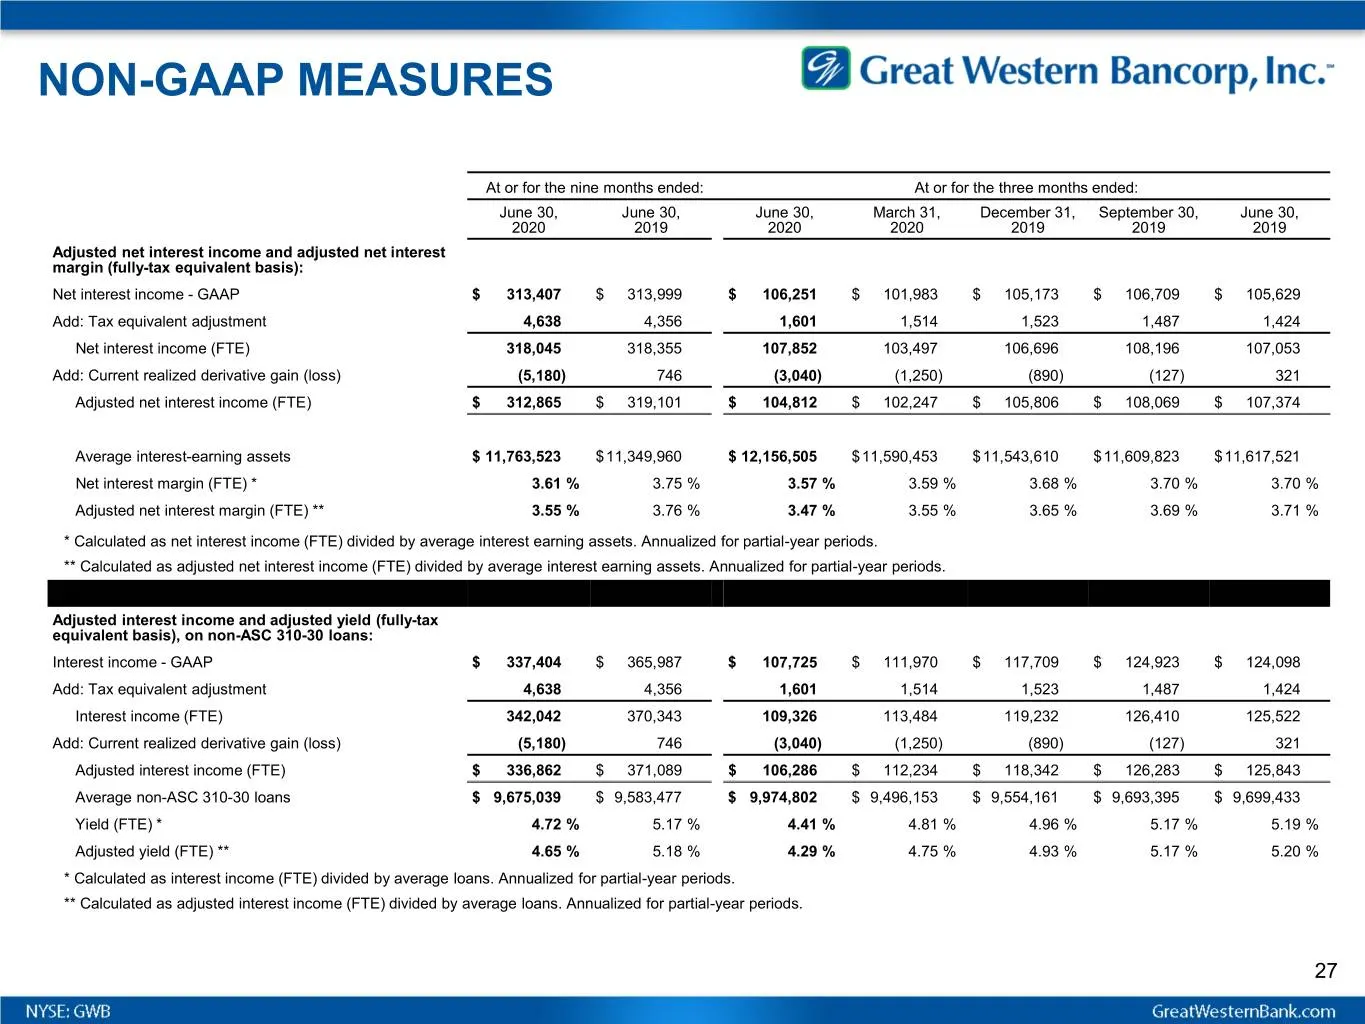
NON-GAAP MEASURES At or for the nine months ended: At or for the three months ended: June 30, June 30, June 30, March 31, December 31, September 30, June 30, 2020 2019 2020 2020 2019 2019 2019 Adjusted net interest income and adjusted net interest margin (fully-tax equivalent basis): Net interest in
Slide 28: Non-GAAP Measures
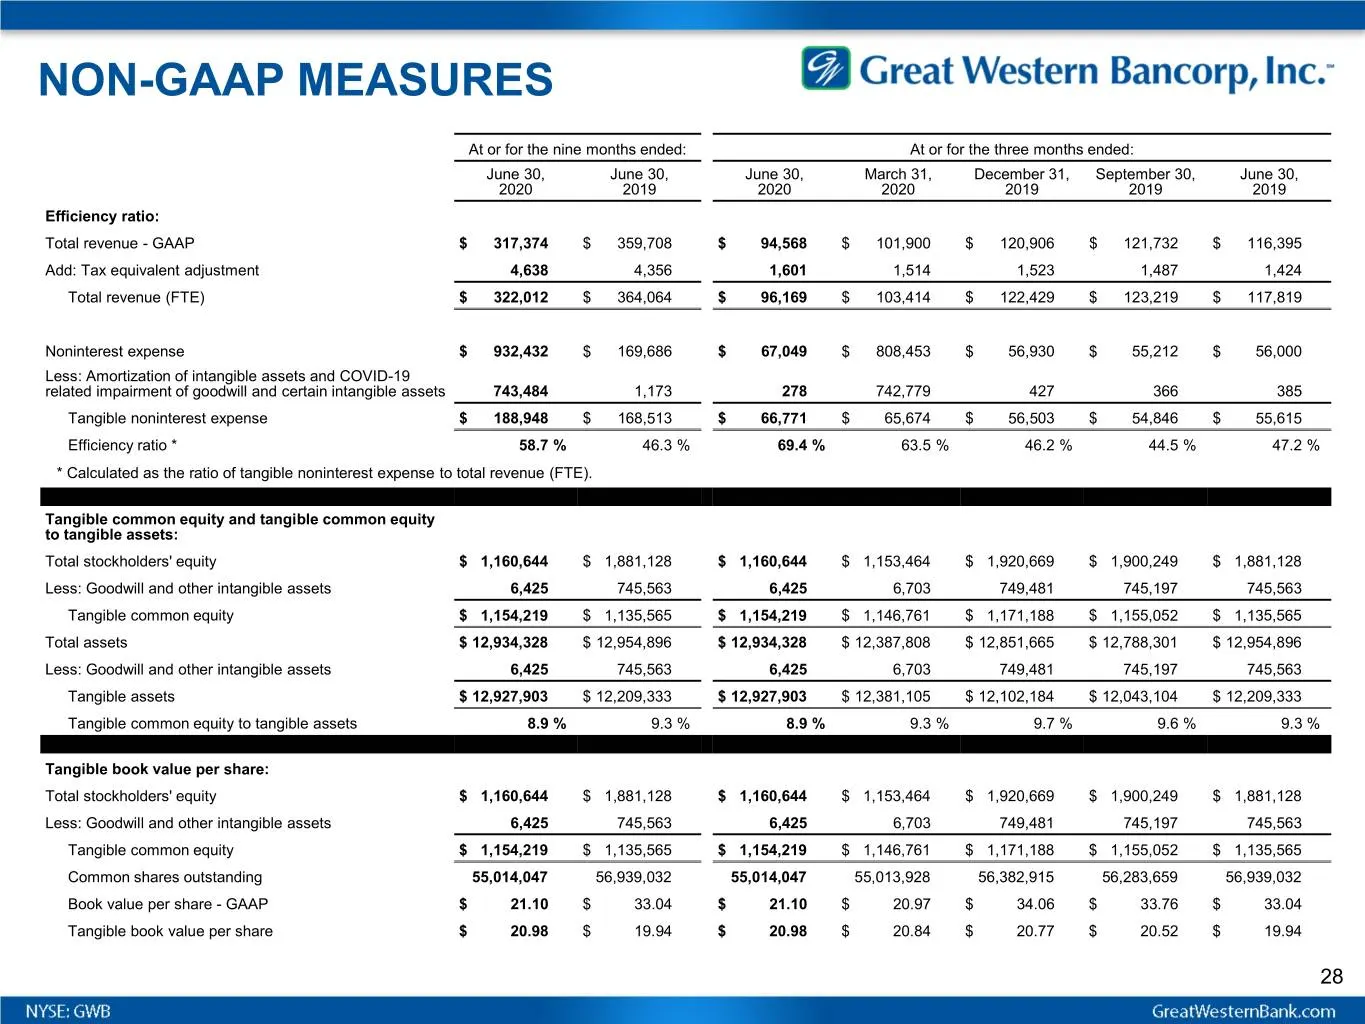
NON-GAAP MEASURES At or for the nine months ended: At or for the three months ended: June 30, June 30, June 30, March 31, December 31, September 30, June 30, 2020 2019 2020 2020 2019 2019 2019 Efficiency ratio: Total revenue - GAAP $ 317,374 $ 359,708 $ 94,568 $ 101,900 $ 120,906 $ 121,732 $ 116,395
Slide 29: Appendix: Supplemental Ag & Hotel Portfolio Characteristics
Appendix 2 Supplemental Ag & Hotel Portfolio Characteristics
Slide 30: Ag Loan Portfolio
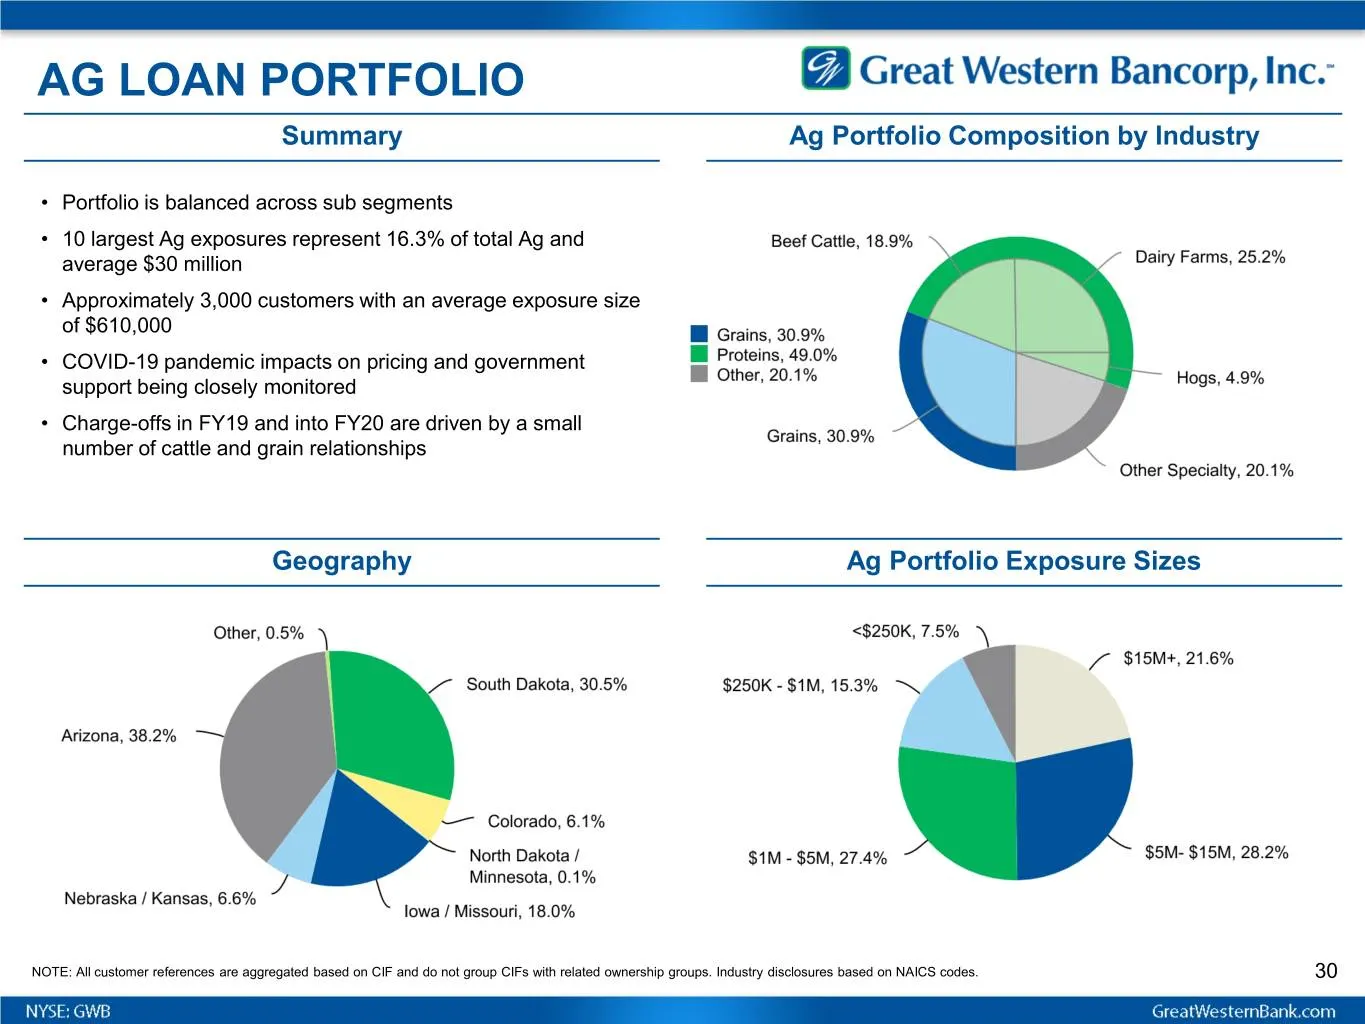
AG LOAN PORTFOLIO Summary Ag Portfolio Composition by Industry • Portfolio is balanced across sub segments • 10 largest Ag exposures represent 16.3% of total Ag and average $30 million • Approximately 3,000 customers with an average exposure size of $610,000 • COVID-19 pandemic impacts on pricing an
Slide 31: More on Hotels
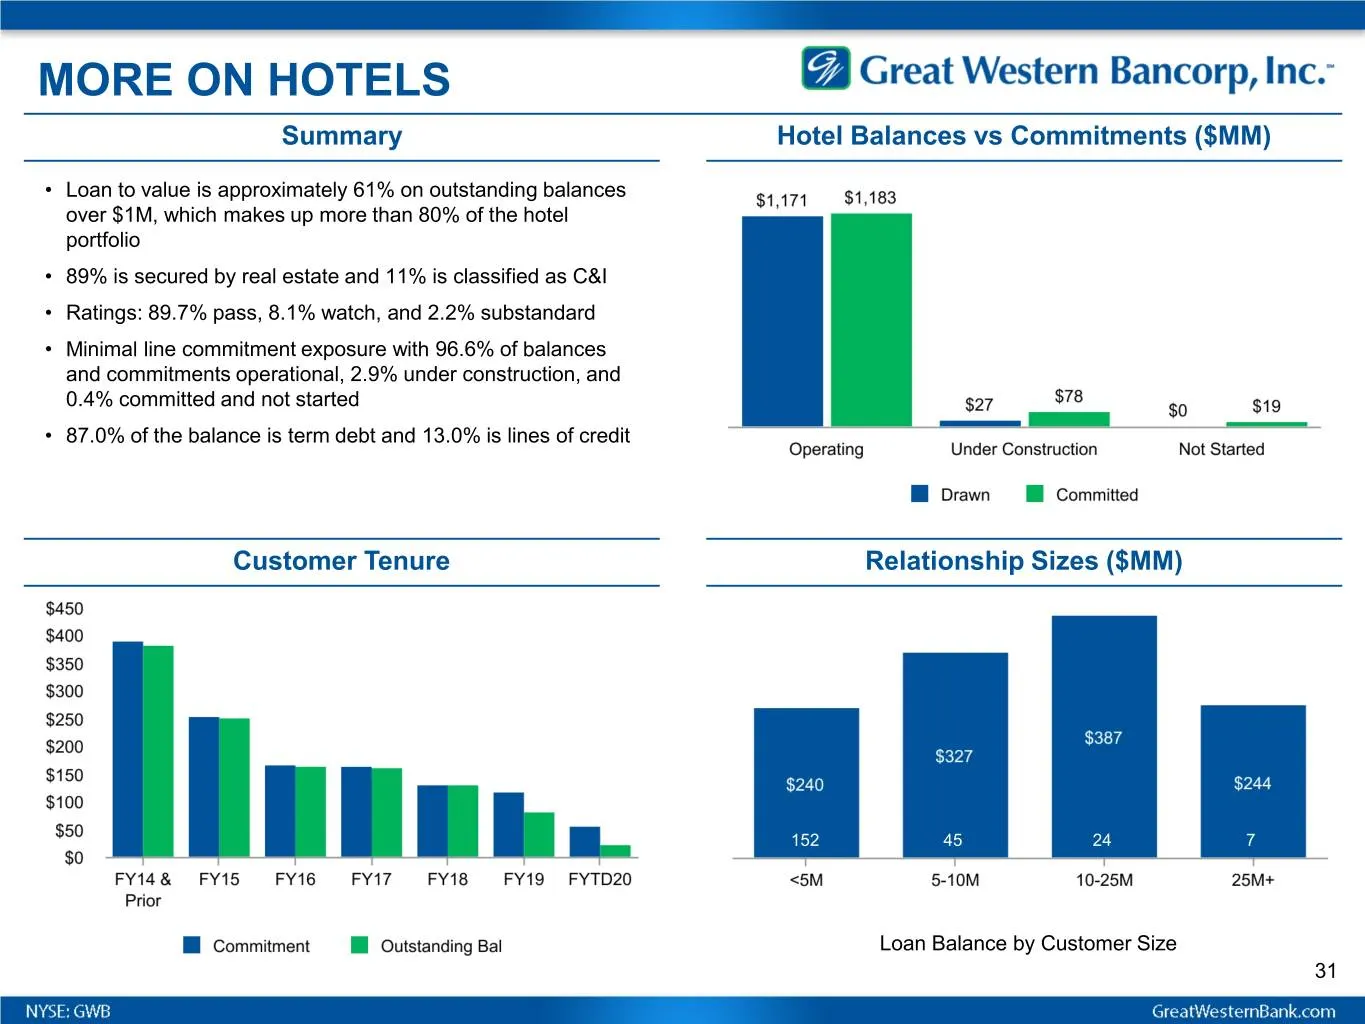
MORE ON HOTELS Summary Hotel Balances vs Commitments ($MM) • Loan to value is approximately 61% on outstanding balances over $1M, which makes up more than 80% of the hotel portfolio • 89% is secured by real estate and 11% is classified as C&I • Ratings: 89.7% pass, 8.1% watch, and 2.2% substandard •
Slide 32: Appendix: Agriculture Lending & Economy
Appendix 3 Agriculture Lending & Economy
Slide 33: Farm Income
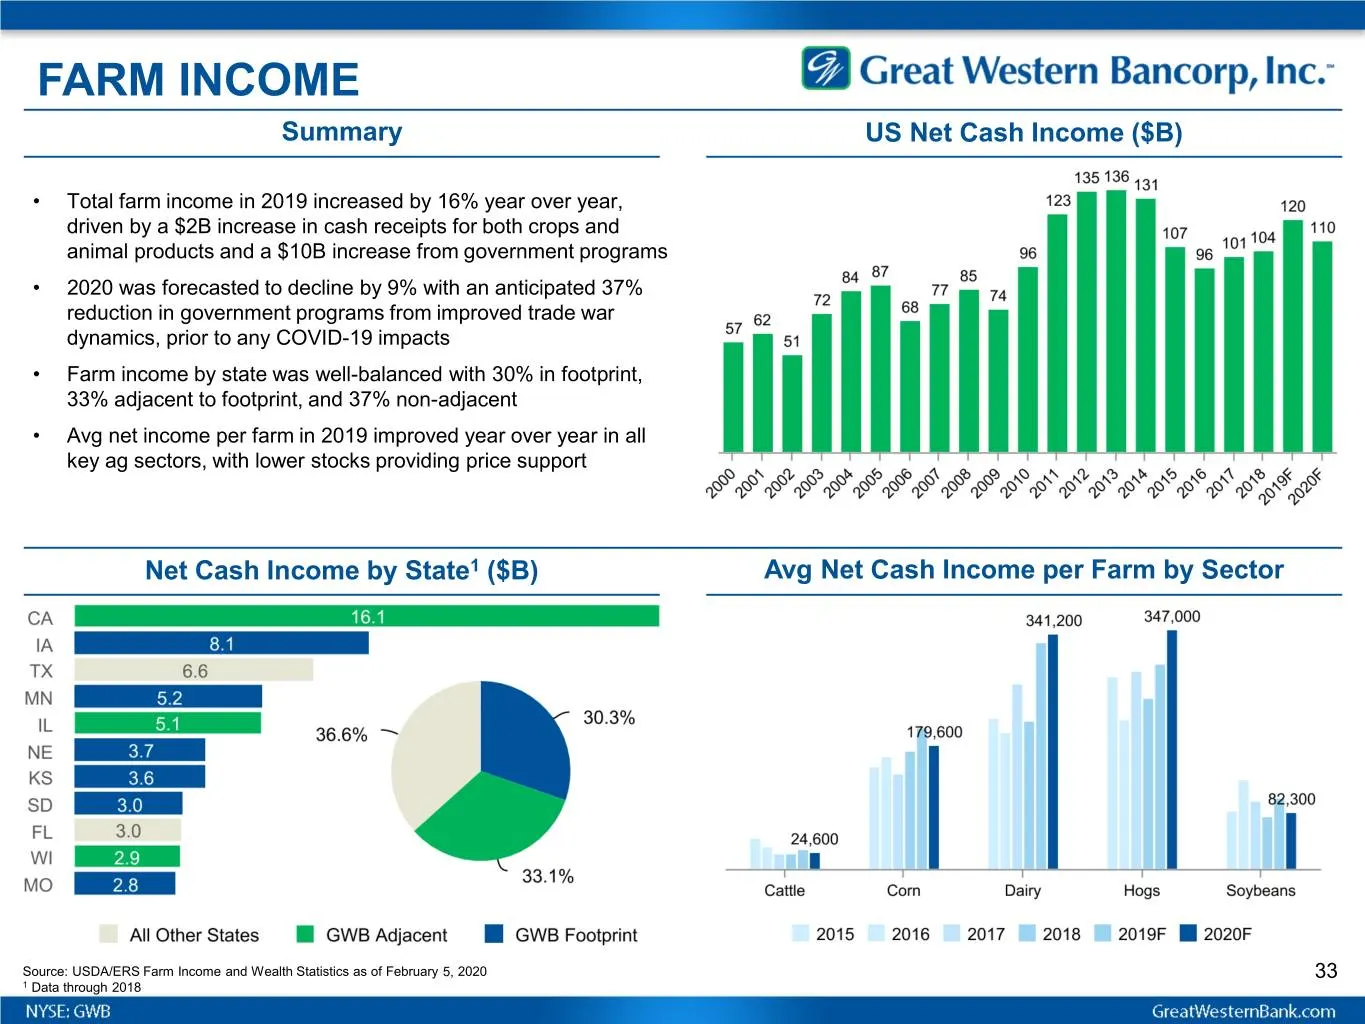
FARM INCOME Summary US Net Cash Income ($B) • Total farm income in 2019 increased by 16% year over year, driven by a $2B increase in cash receipts for both crops and animal products and a $10B increase from government programs • 2020 was forecasted to decline by 9% with an anticipated 37% reduction
Slide 34: Farm Balance Sheets
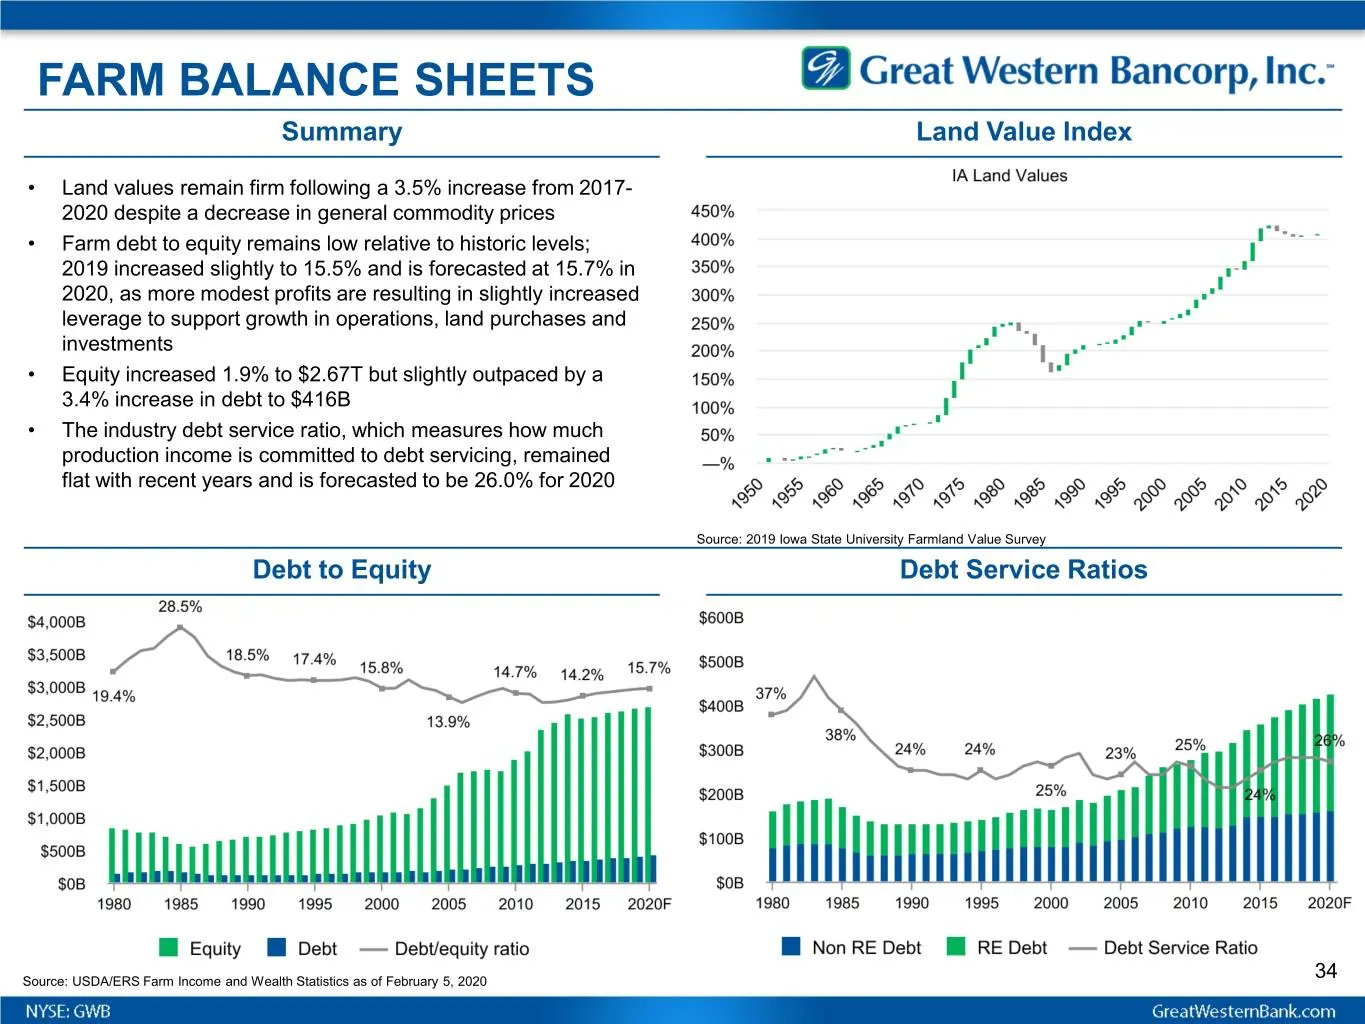
FARM BALANCE SHEETS Summary Land Value Index • Land values remain firm following a 3.5% increase from 2017- 2020 despite a decrease in general commodity prices • Farm debt to equity remains low relative to historic levels; 2019 increased slightly to 15.5% and is forecasted at 15.7% in 2020, as more
Slide 35: Appendix: Peer Group
Great Western Bancorp, Inc.” Appendix 4 Peer Group
Slide 36: Peer Group
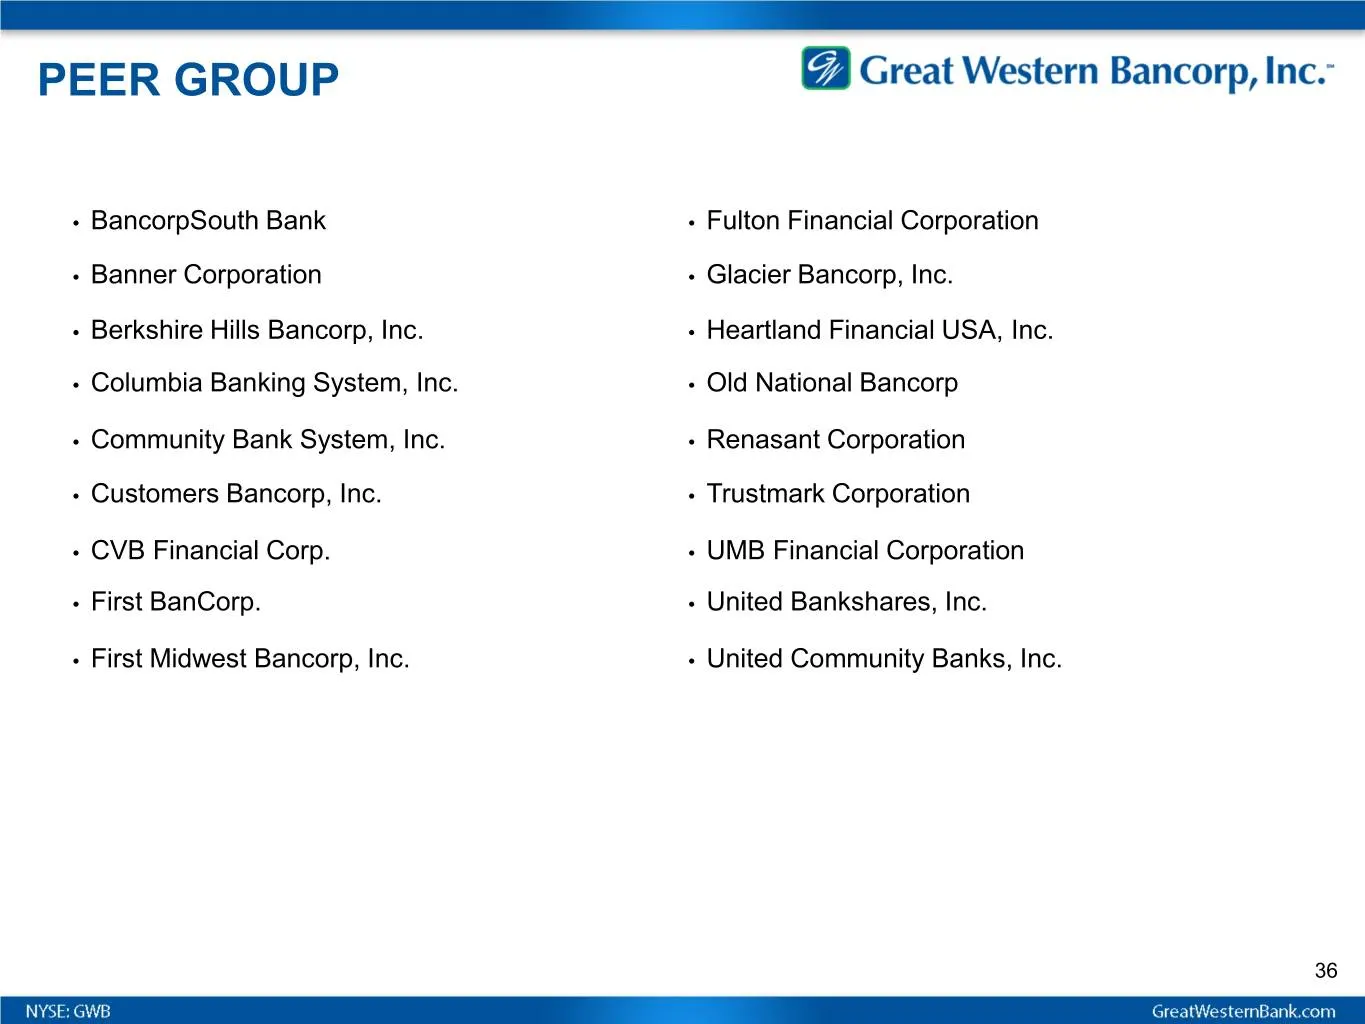
PEER GROUP • BancorpSouth Bank • Fulton Financial Corporation • Banner Corporation • Glacier Bancorp, Inc. • Berkshire Hills Bancorp, Inc. • Heartland Financial USA, Inc. • Columbia Banking System, Inc. • Old National Bancorp • Community Bank System, Inc. • Renasant Corporation • Customers Bancorp,
Slide 37: Appendix: Accounting for Loans at FV and Related Derivatives
Appendix 5 Accounting for Loans at FV and Related Derivatives
Slide 38: Loans at Fair Value & Related Derivatives
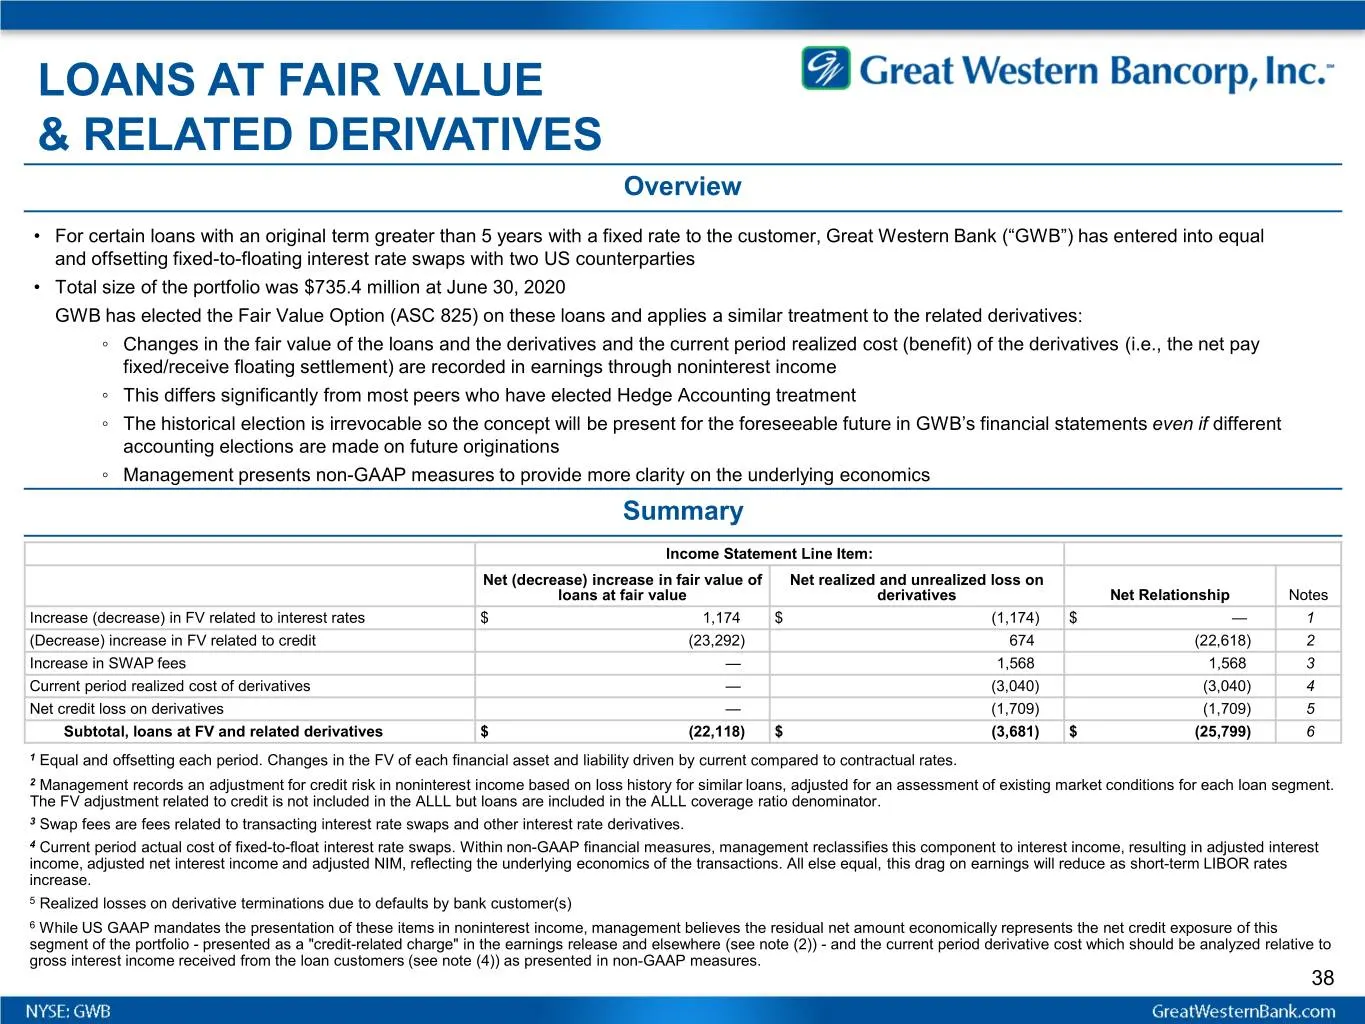
LOANS AT FAIR VALUE & RELATED DERIVATIVES Overview • For certain loans with an original term greater than 5 years with a fixed rate to the customer, Great Western Bank (“GWB”) has entered into equal and offsetting fixed-to-floating interest rate swaps with two US counterparties • Total size of the p
Source: SEC EDGAR · 8-K filed Jul 29, 2020
More decks from Great Western Bancorp Inc
 Q1 FY2022 Earnings Presentation27 slides · Jan 27, 2022
 Merger or Acquisition (October 2021)55 slides · Oct 29, 2021
 Q4 2021 Earnings Presentation28 slides · Oct 26, 2021
 Merger or Acquisition (September 2021)14 slides · Sep 21, 2021
 Merger or Acquisition (September 2021)28 slides · Sep 16, 2021
 Q3 FY2021 Earnings Presentation32 slides · Jul 29, 2021